Article

Tsetse Bloodmeal Analyses Incriminate the Common Warthog Phacochoerus africanus as an Important Cryptic Host of Animal Trypanosomes in Smallholder Cattle Farming Communities in Shimba Hills, Kenya

by
Faith I. Ebhodaghe
1,2,*,
Michael N. Okal
1,
Shewit Kalayou
1,
Armanda D. S. Bastos
2 and
Daniel K. Masiga
1,*
1
International Centre of Insect Physiology and Ecology, Nairobi P.O. Box 30772-00100, Kenya
2
Department of Zoology and Entomology, University of Pretoria, Private Bag X20, Pretoria Hatfield 0083, South Africa
*
Authors to whom correspondence should be addressed.
Submission received: 2 October 2021 / Revised: 26 October 2021 / Accepted: 2 November 2021 / Published: 18 November 2021
(This article belongs to the Special Issue Molecular Epidemiology of Trypanosomes)

Abstract

:
Trypanosomes are endemic and retard cattle health in Shimba Hills, Kenya. Wildlife in the area act as reservoirs of the parasites. However, wild animal species that harbor and expose cattle to tsetse-borne trypanosomes are not well known in Shimba Hills. Using xeno-monitoring surveillance to investigate wild animal reservoirs and sources of trypanosomes in Shimba Hills, we screened 696 trypanosome-infected and uninfected tsetse flies for vertebrate DNA using multiple-gene PCR-High Resolution Melting analysis and amplicon sequencing. Results revealed that tsetse flies fed on 13 mammalian species, preferentially Phacochoerus africanus (warthogs) (17.39%, 95% CI: 14.56–20.21) and Bos taurus (cattle) (11.35%, 95% CI: 8.99–13.71). Some tsetse flies showed positive cases of bloodmeals from multiple hosts (3.45%, 95% CI: 2.09–4.81), including warthog and cattle (0.57%, 95% CI: 0.01–1.14). Importantly, tsetse flies that took bloodmeals from warthog had significant risk of infections with Trypanosoma vivax (5.79%, 95% CI: 1.57–10.00), T. congolense (7.44%, 95% CI: 2.70–12.18), and T. brucei sl (2.48%, 95% CI: −0.33–5.29). These findings implicate warthogs as important reservoirs of tsetse-borne trypanosomes affecting cattle in Shimba Hills and provide valuable epidemiological insights to underpin the parasites targeted management in Nagana vector control programs in the area.

1. Introduction

Wildlife are reservoirs of a plethora of pathogens including parasites that are transmitted from wildlife to humans and livestock through habitat sharing or dissemination by haematophagous arthropod-vectors [1]. In sub-Saharan Africa, the tsetse-transmitted trypanosomes responsible for Nagana cattle disease and human sleeping sickness are examples of arthropod-borne parasites harbored by asymptomatic wildlife hosts [2,3,4,5]. However, most epidemiological studies on trypanosomes in Africa have focused on the tsetse vectors, human and livestock hosts and only rarely on wildlife reservoirs. In the Serengeti National Park (NP) in Tanzania, Kaare et al. [6] identified trypanosomes in different wild animal species, including warthogs which were the only wildlife shown to harbor Trypanosoma brucei rhodesiense the causative agent of acute human sleeping sickness in East Africa. Furthermore, warthogs harbored the widest diversity of animal trypanosomes and were thought to be the source of trypanosomes detected in cattle in the area. These results support suggestions that warthogs are among the wildlife species that contribute to maintaining endemicity and transmission of trypanosome infections in the Luangwa Valley, Zambia [2].
The findings in the Serengeti NP [6] and Luangwa Valley [2] and other wildlife areas in the continent [7,8,9,10] suggest that warthogs may be contributing to trypanosome transmission at the wildlife-livestock interface of the Shimba Hills National Reserve (NR) in Kenya following the wildlife species abundance in the area. Previous epidemiological studies in other wildlife areas in Kenya have identified African buffalo Syncerus caffer, giraffe Giraffa camelopardalis, African savannah elephants Loxodonta africana, and hippopotamus Hippopotamus amphibious as the dominant reservoirs of trypanosomes [8,11]. Muturi et al. [8] and Makhulu et al. [11] adopted an alternative strategy to wildlife examination based on xeno-monitoring to characterize animal reservoirs of trypanosomes. Xeno-monitoring, a strategy which explores knowledge of the blood-feeding behaviour of tsetse flies to track animal reservoirs and sources of trypanosomes, provides otherwise inaccessible data on available fauna in and outside local sylvatic ecologies and is particularly convenient because of the difficulty in sampling wildlife directly. Xeno-monitoring also allows investigators to profile wildlife hosts of trypanosomes in real-time in high throughput analysis and over extensive landscapes including hard-to-reach locations in areas where capturing wildlife is both difficult and risky.
As part of a prior epidemiological survey [12], different animal species were described as providing bloodmeals for tsetse flies in Shimba Hills. But the relative contributions of these animals to trypanosome infections in cattle populations in smallholder farming systems in the wildlife-livestock interface remains poorly understood. Moreover, the epidemiological survey by Channumsin et al. [12] was restricted to just two locations (Buffalo Ridge and Zunguluka) and was conducted over a brief sample collection period (about four weeks) thus limiting full understanding of the range of animal bloodmeal hosts of tsetse flies in the area. A clear understanding of wildlife reservoirs of trypanosomes in Shimba Hills [13] will help identify areas where parasites spill-over from wildlife to livestock is highest and where cattle are at greatest risk to trypanosome infections. This would expedite a rational design and efficient implementation of targeted interventions against the tsetse-vectors, thereby alleviating Nagana’s adverse effects on cattle health and production and smallholder farmer livelihoods in the area.
In this study, we investigated bloodmeal sources of tsetse flies in Shimba Hills. To visualize the feeding behaviours of tsetse flies, we designed a bipartite interaction network used in epidemiological studies [14,15] to illustrate vector-host relationships and an UpSet plot to show frequencies of tsetse bloodmeals on multiple hosts. As tsetse flies have an exclusively haematophagous diet and are exposed to trypanosomes only by feeding on infected animal hosts [3], knowledge of animal species from which the infected vectors obtain nourishment could provide insights into probable sources of infections. We therefore characterized vertebrate DNA in tsetse flies in an attempt to track the animal sources of trypanosomes in samples of the vectors from Shimba Hills using molecular tools to screen the vectors for bloodmeal hosts.

2. Results

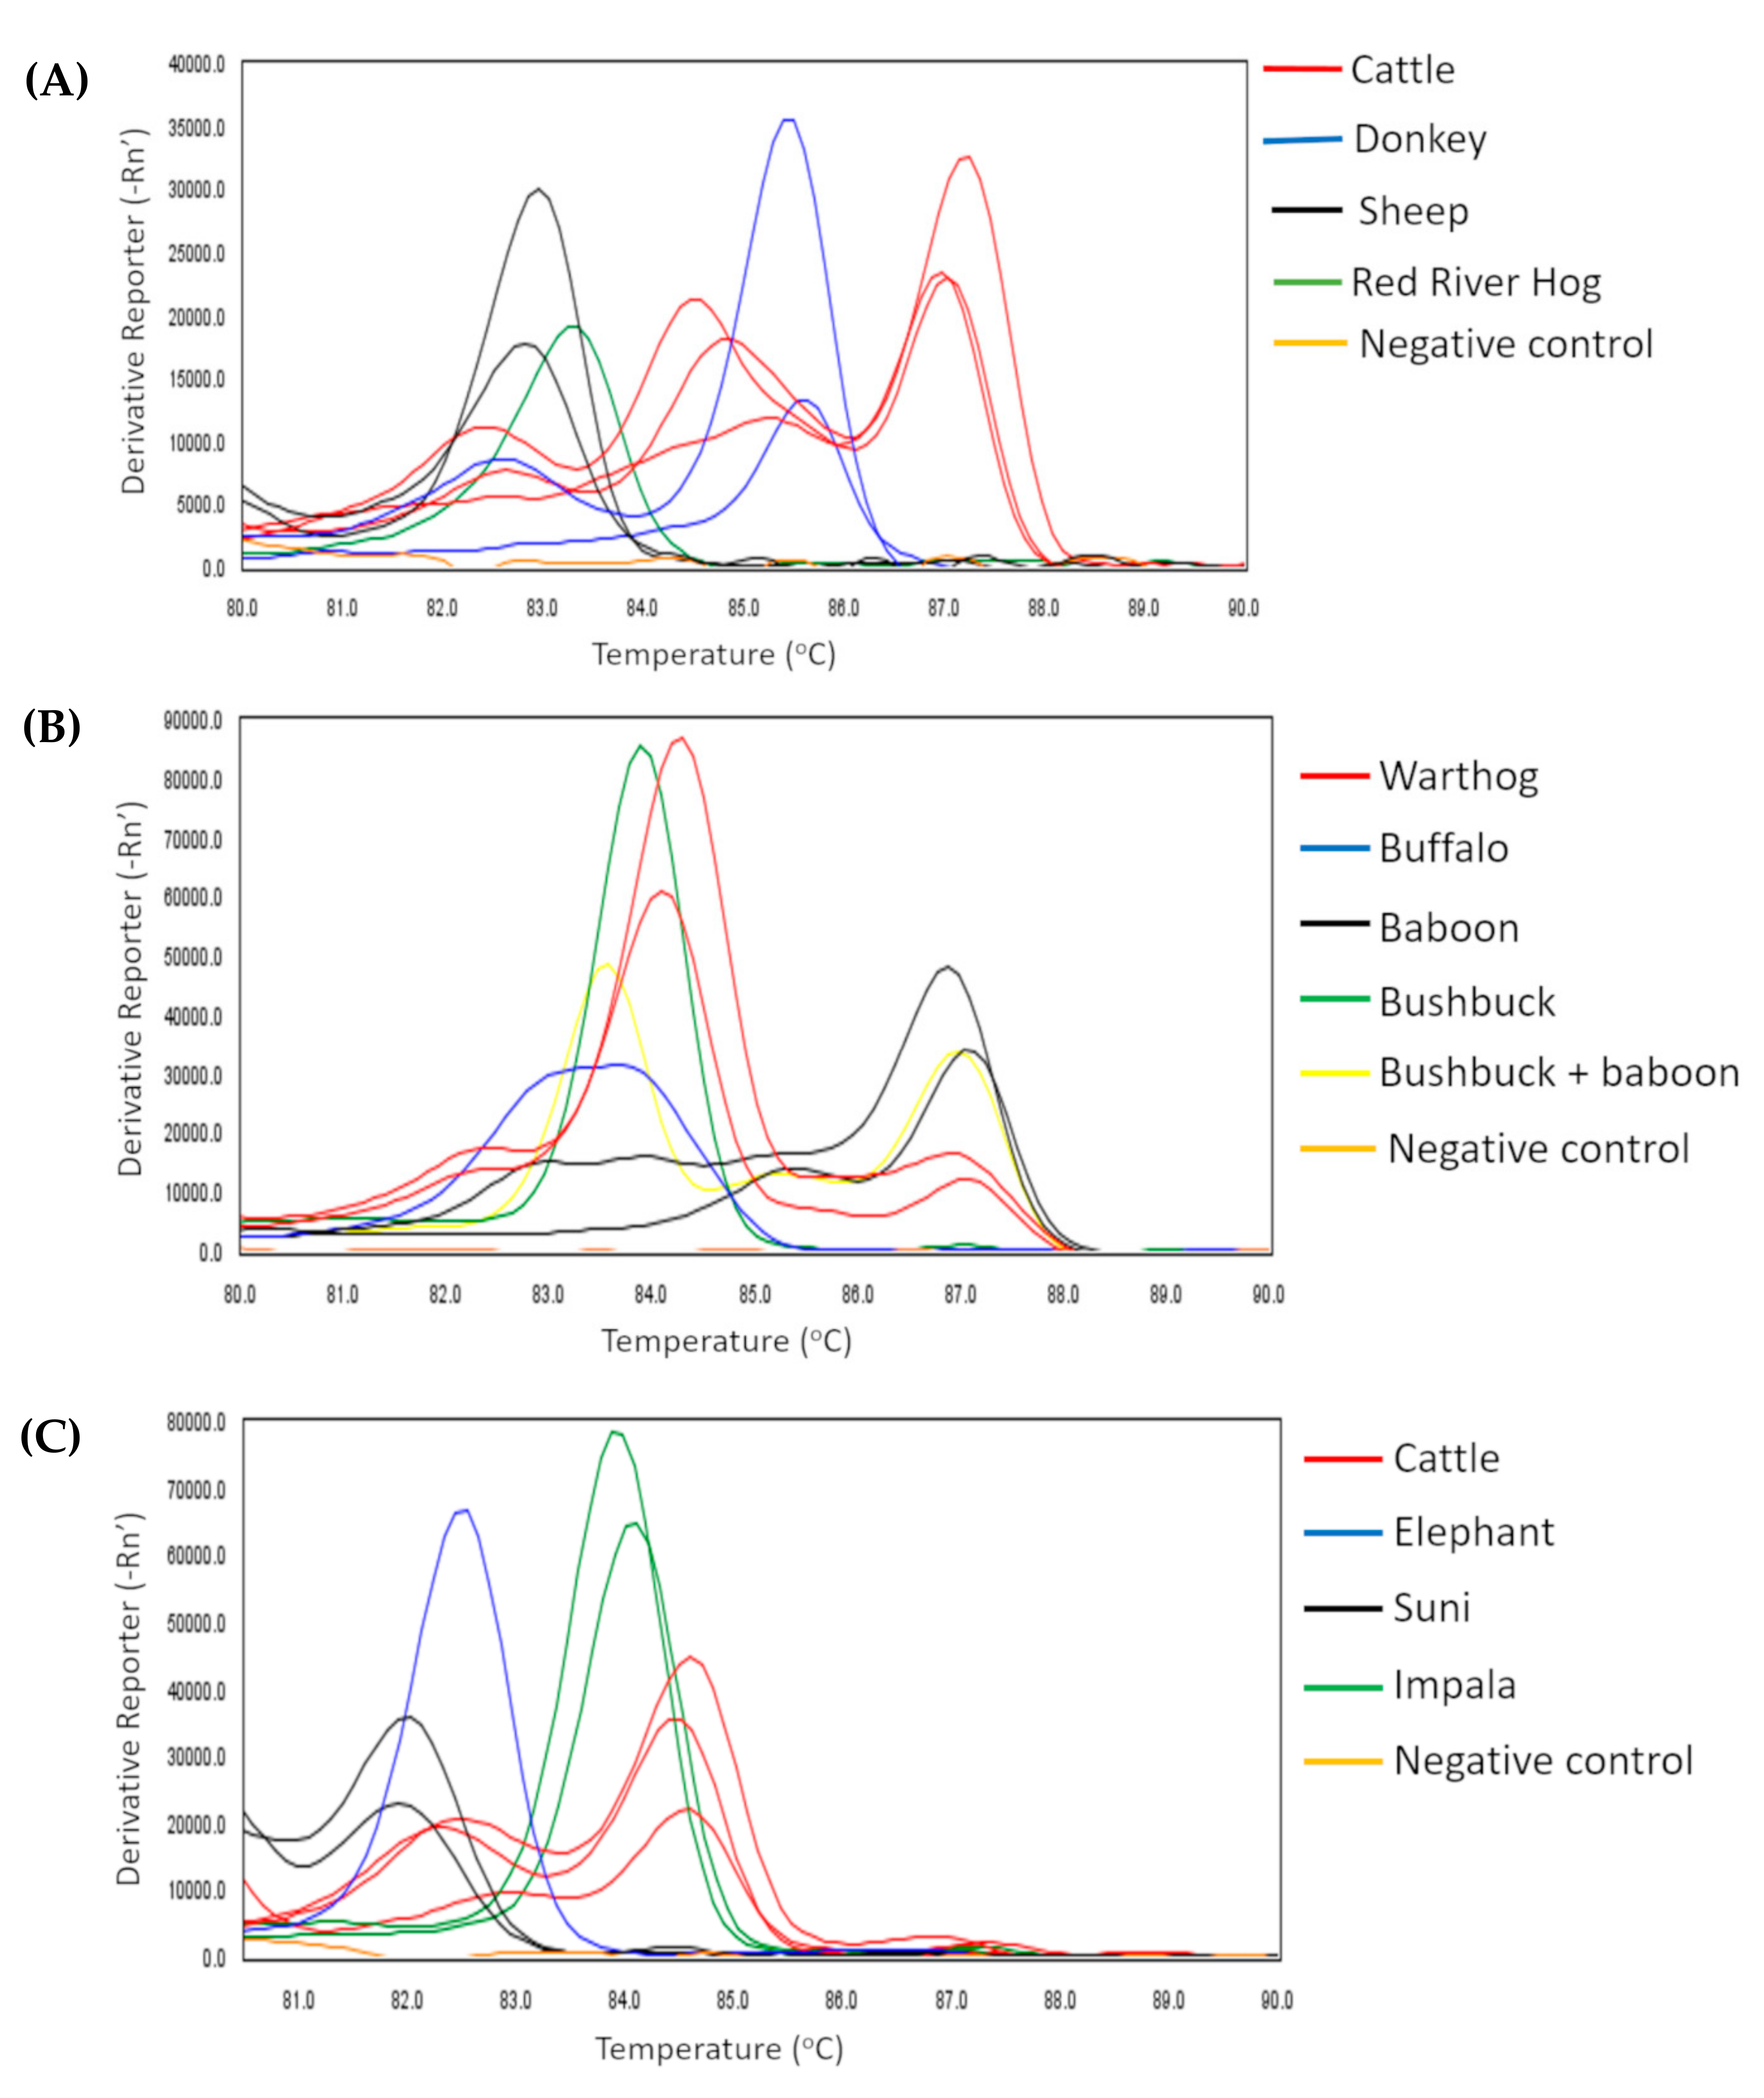
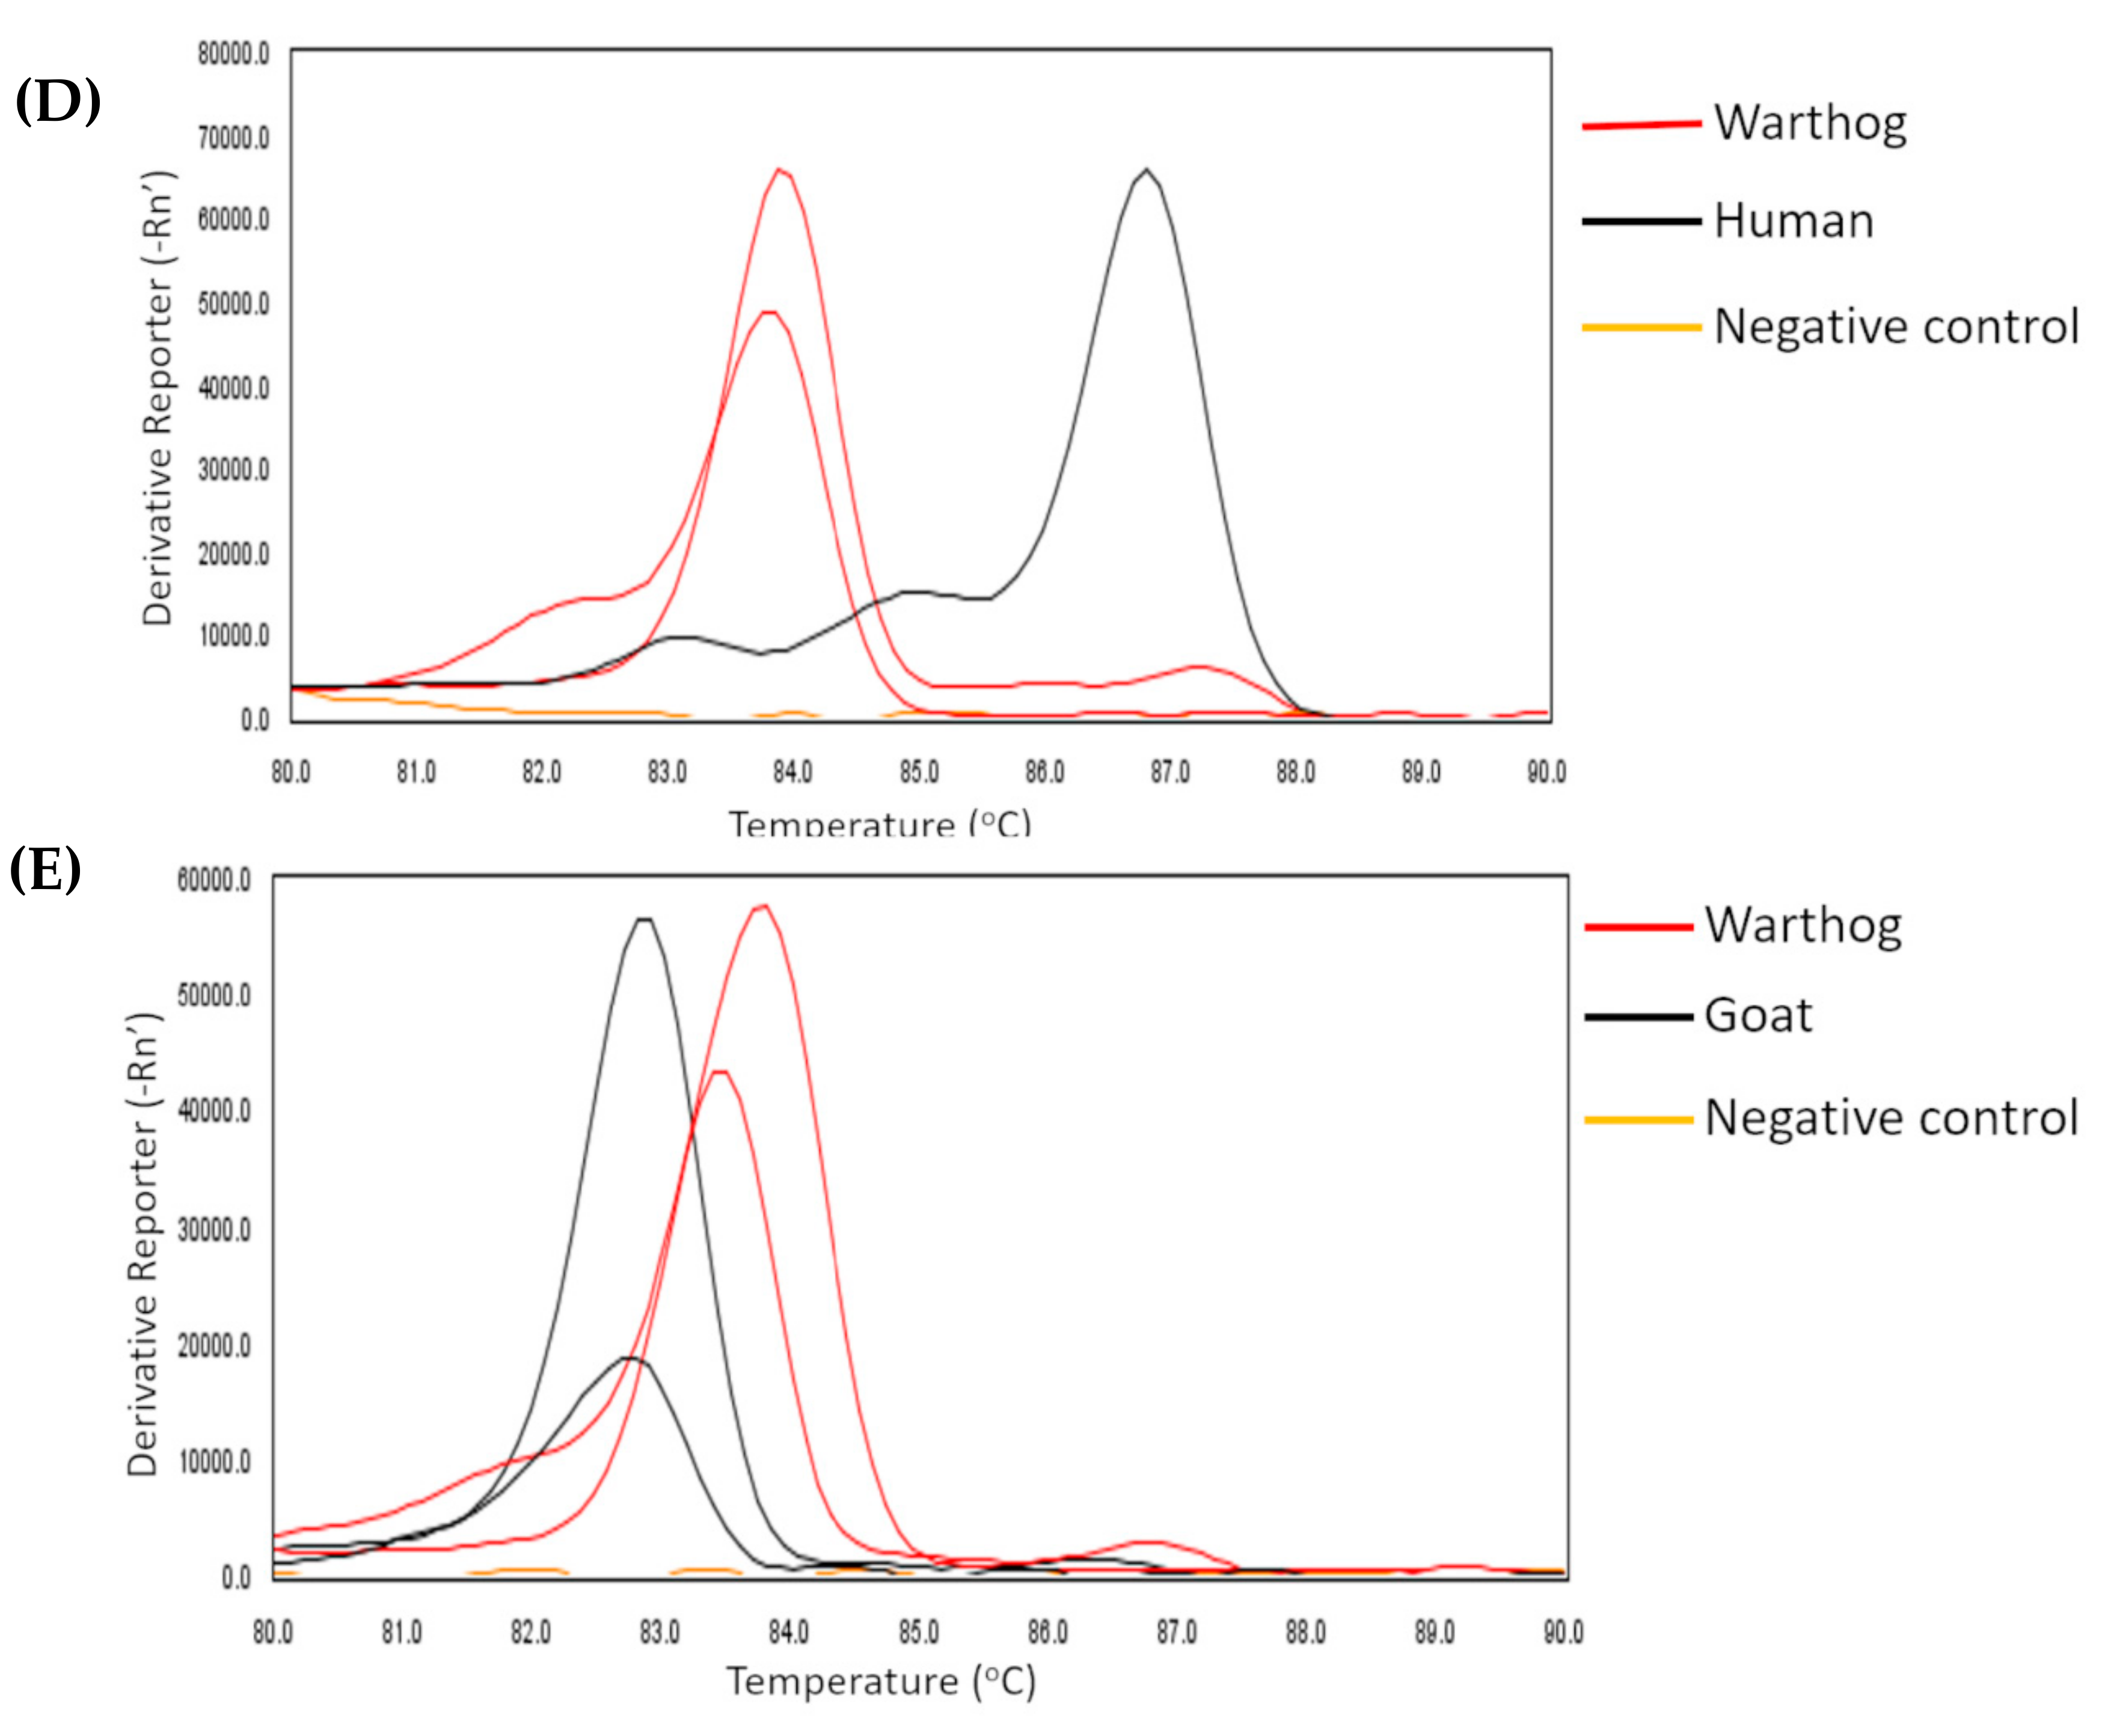
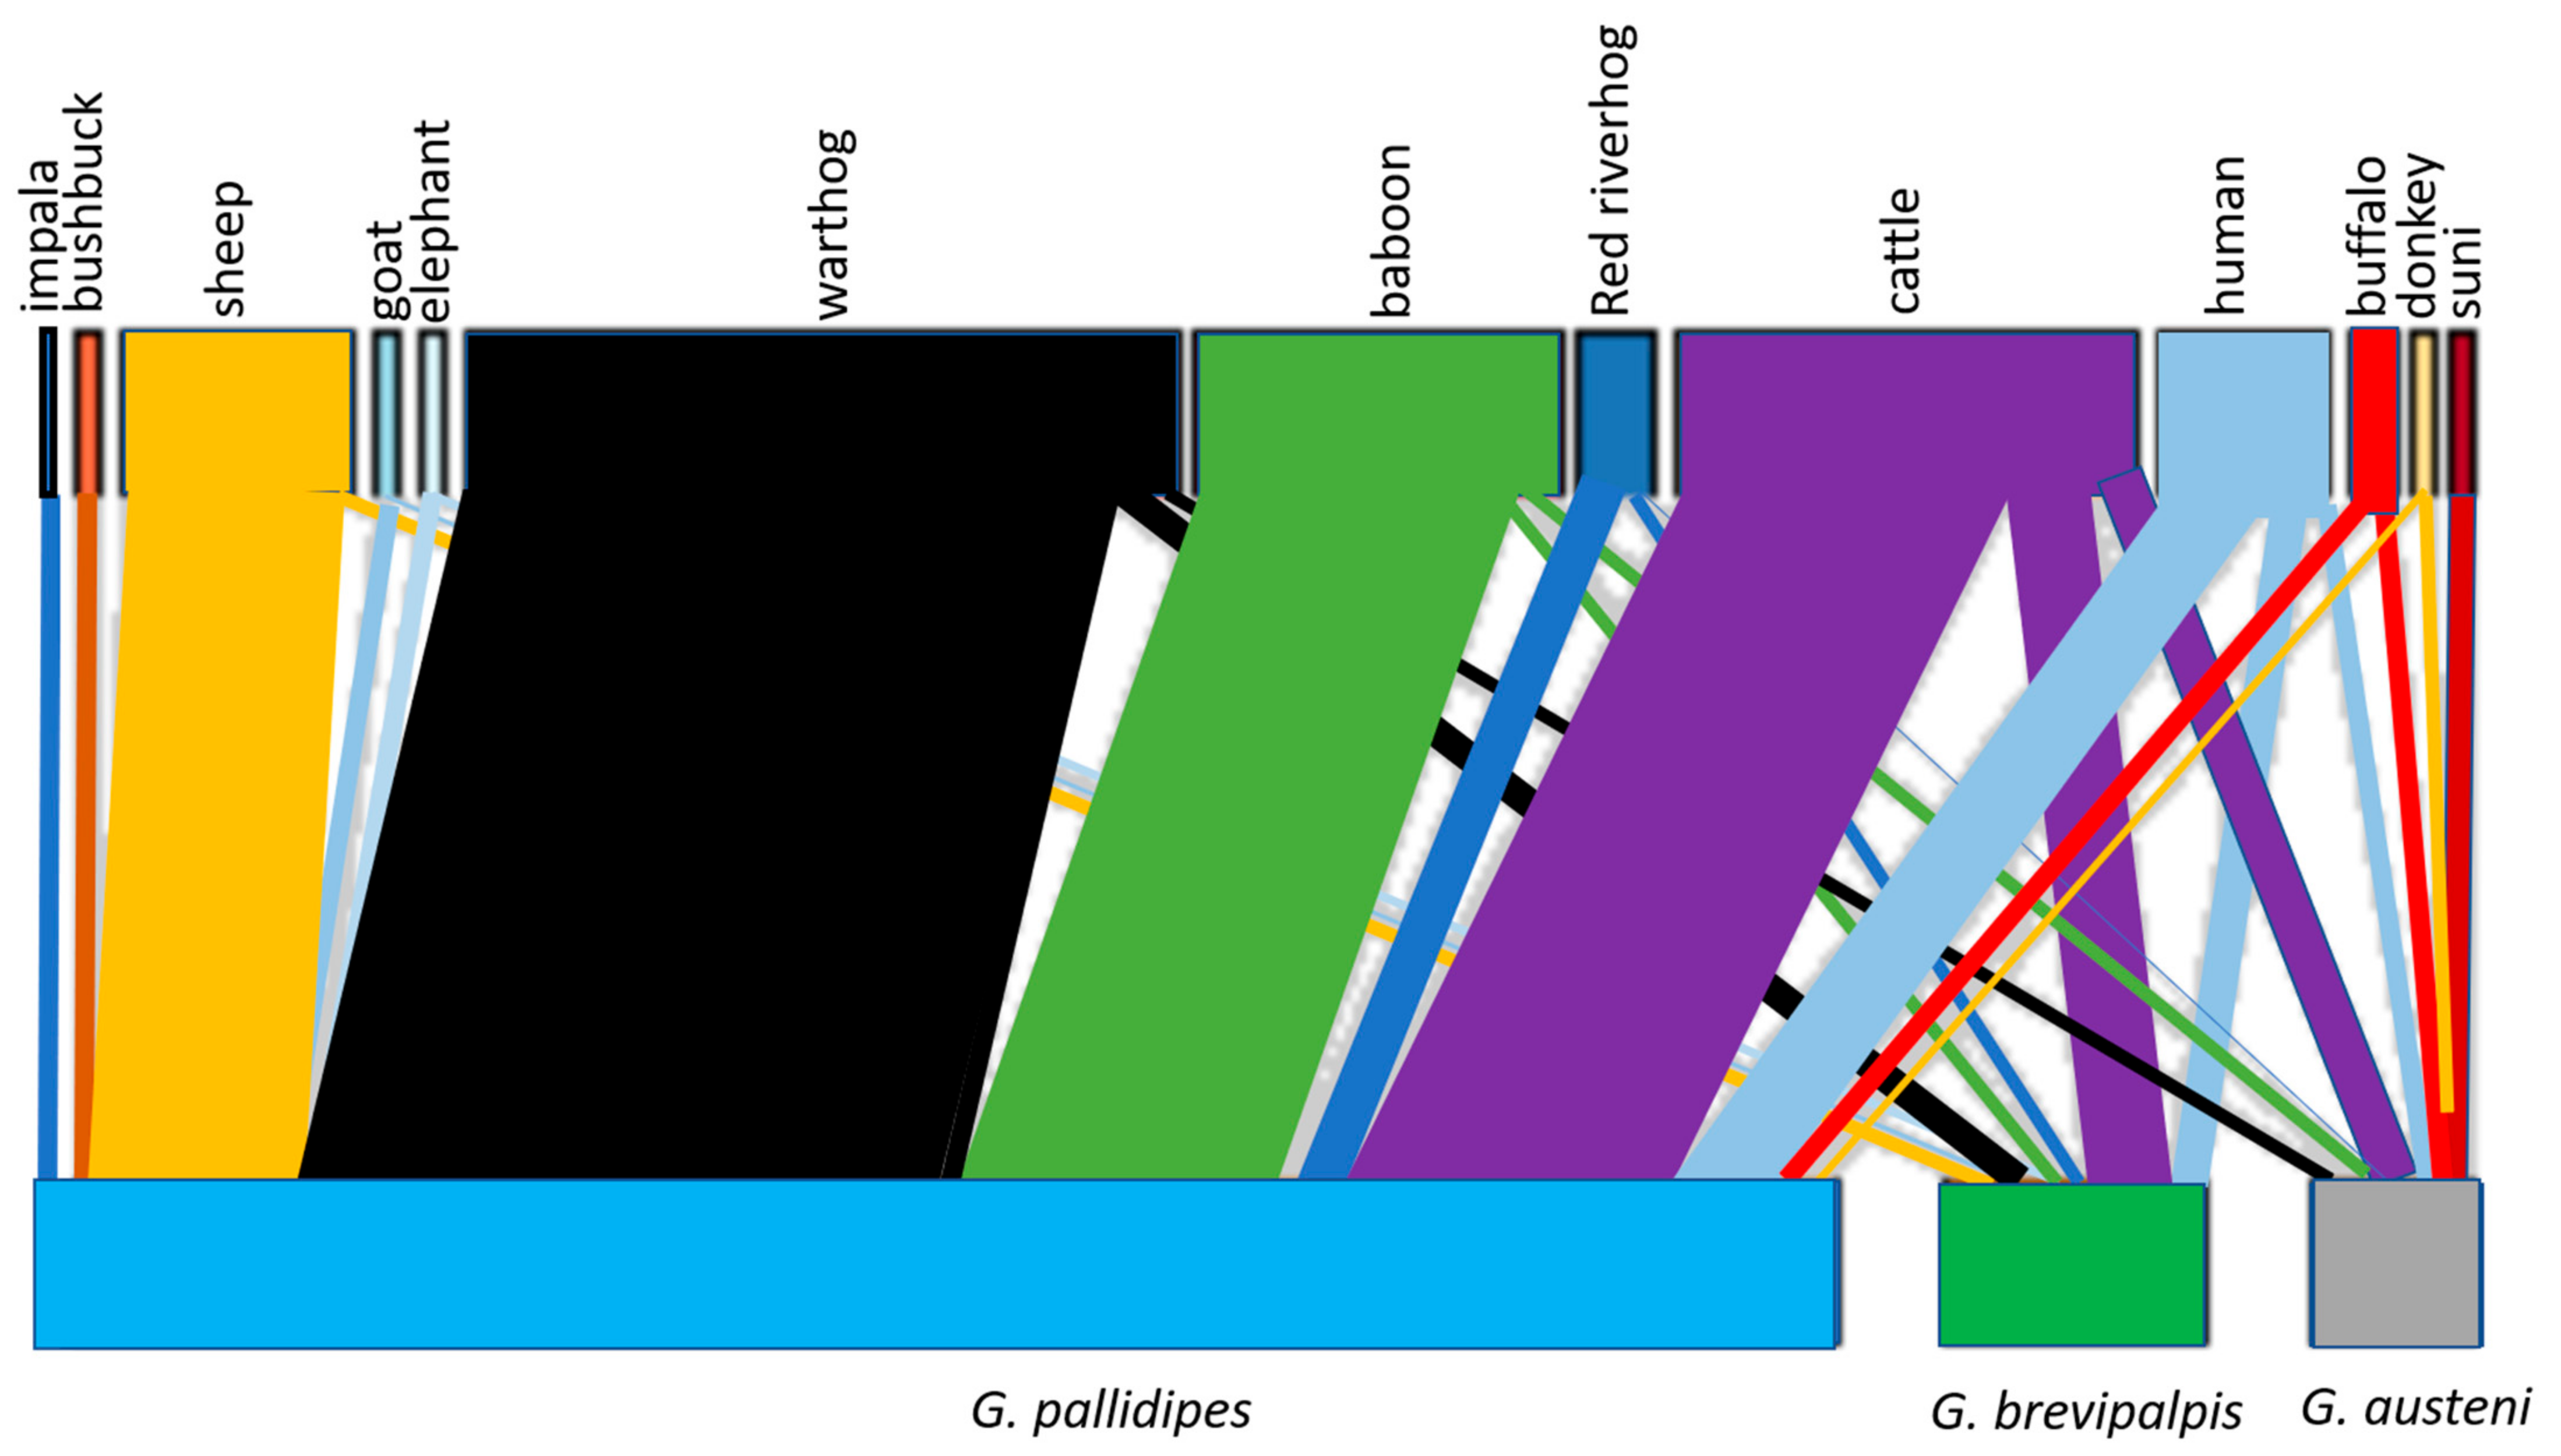
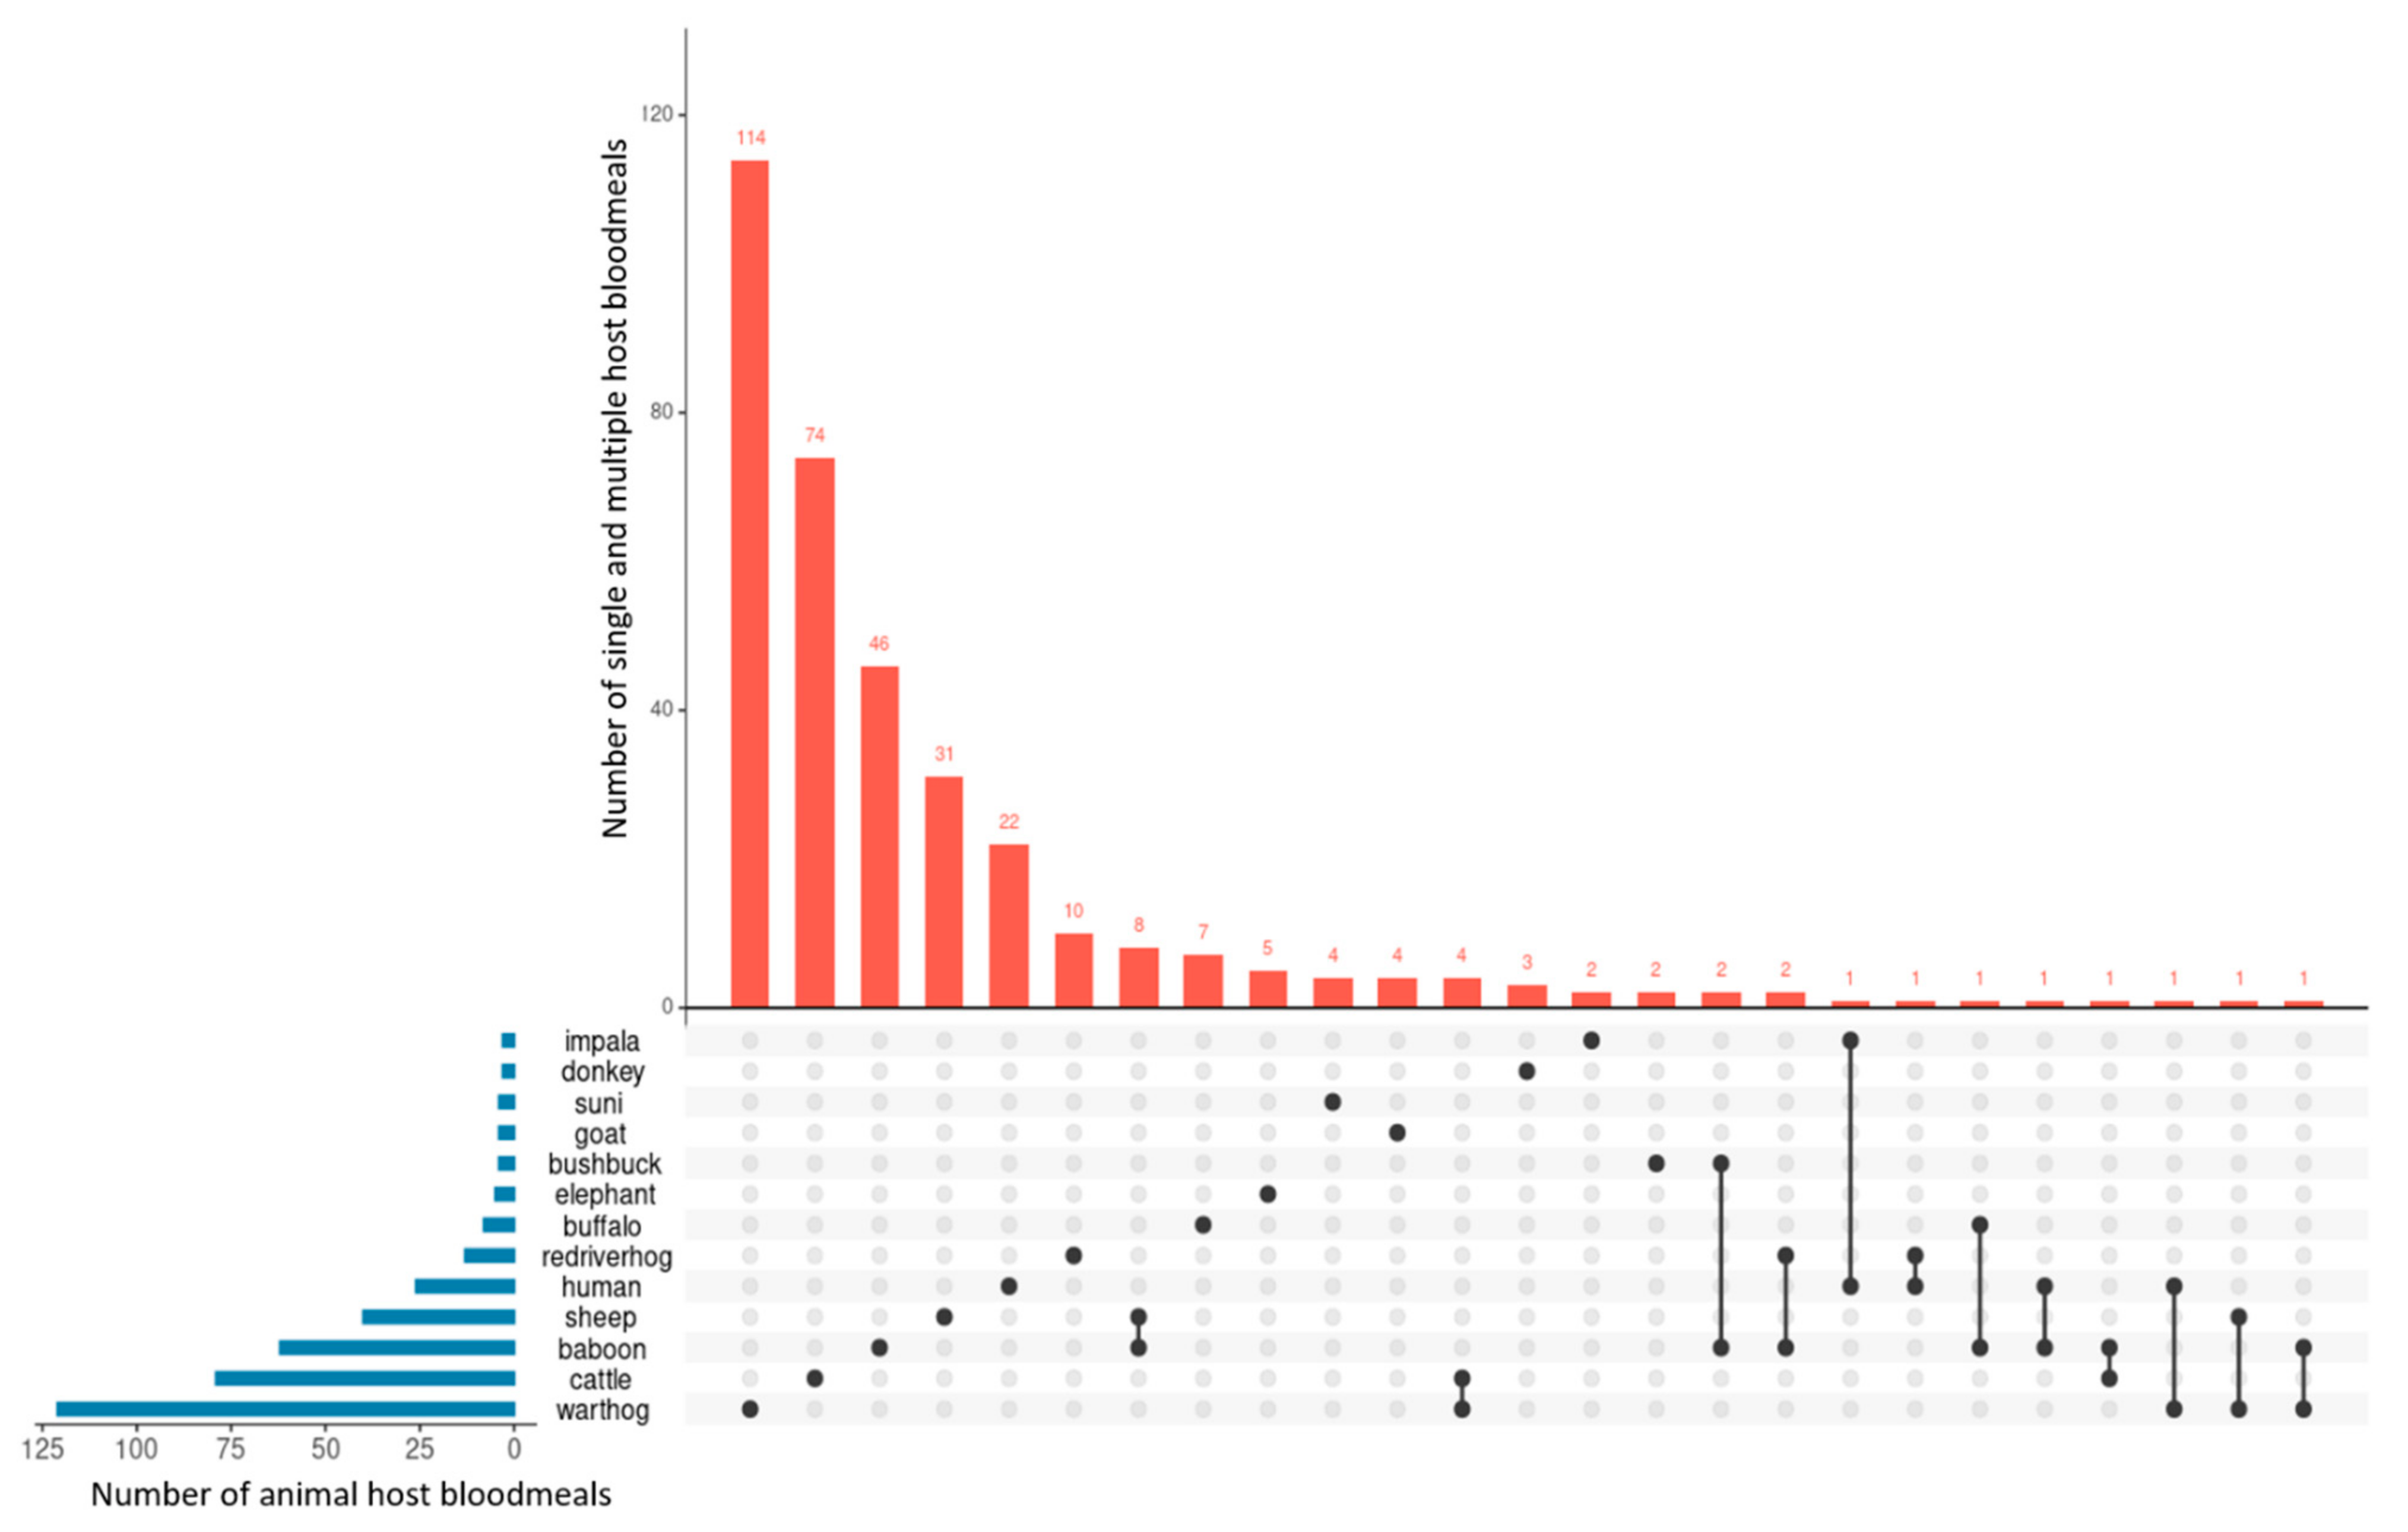
2.1. Animal Bloodmeals in Tsetse Flies

Overall, 50.00% (348/696) (95% CI: 46.28–53.72) of tsetse flies screened for vertebrate DNA harbored animal bloodmeals. The proportion of trapped tsetse flies that had detectable bloodmeals was higher in females [54.80% (251/458) (95% CI: 50.23–59.38)] than males [40.76% (97/238) (95% CI: 34.47–47.04)] [Binomial-Generalized Linear Model (B-GLM]: p < 0.05) and in Glossina pallidipes [53.42% (281/526) (95% CI: 49.15–57.70)] and G. austeni [62.50% (25/40) (95% CI: 46.82–78.18)] than G. brevipalpis [32.31% (42/130) (95% CI: 24.16–40.45)] (B-GLM: p < 0.05) (Table 1). Proportions of bloodmeal-positive tsetse flies were similar between different age groups and collection sites (B-GLM: p > 0.05) (Table 1 and Table 2).
Tsetse flies were positive for bloodmeals of animals from 6 taxonomic families and 13 species (Figure 1, Table 3). These included two suid species Phacochoerus africanus (warthog) and Potamochoerus porcus (red riverhog) and seven bovid species Bos taurus (cattle), Ovis aries (sheep), Syncerus caffer (buffalo), Capra hircus (goat), Tragelaphus scriptus (bushbuck), Neotragus moschatus (suni) and Aepyceros melampus (impala). The other animal bloodmeals identified in tsetse flies were from Papio anubis (baboon) (Cercopithecidae), Loxodonta africana (elephant) (Elephantidae), Equus asinus (donkey) (Equidae) and Homo sapiens (human) (Hominidae).
Table 4 shows the number of tsetse fly species that fed on the different animal hosts. This information is visually depicted in the bipartite interaction network in Figure 2. The top and bottom bars on the bipartite network respectively represent animal hosts of tsetse flies and tsetse fly species that fed on these hosts. The size of a bar reflects the number of blood-fed tsetse flies (if it is a bottom bar) or the number of the vector that took bloodmeal from a mammalian species (if it is a top bar). The lines are used to show interactions between tsetse flies and animal bloodmeal hosts. The size of a line is proportional to the number of tsetse flies that took bloodmeals from the mammalian host to which it is connected to. The thick lines between G. pallidipes and warthog, cattle, baboon and sheep indicate that the tsetse fly species, more than the other fly species, fed intensely on these animals (Table 4).
G. pallidipes being the dominant tsetse flies in Shimba Hills made up 75.57% (526/696) of the total fly individuals screened for vertebrate bloodmeals and thus contributed the highest number of tsetse flies with bloodmeals [80.75% (281/348)]. Over half (59.07%, 166/281) the animal bloodmeals in G. pallidipes were from warthog and cattle with 38.43% (108/281) of the fly species bloodmeals from warthog. The proportions of warthog bloodmeals in tsetse flies were similar between blocks though highest in Mlafyeni (Table S1) and significantly different between Mlafyeni and Pengo (B-GLM: p < 0.05). Furthermore, tsetse flies in Kinangondogo had the highest rate of cattle bloodmeals but proportions of cattle bloodmeals were insignificantly different between cluster-locations (B-GLM: p > 0.05). For all tsetse fly species, B-GLM analyses with pairwise comparisons revealed significantly higher proportion of tsetse flies positive for warthog bloodmeal than other animal bloodmeal (p < 0.001) except cattle bloodmeal (p > 0.05) (Table 5). Tsetse flies were also more likely to feed on suids (p < 0.0001) and bovids (p < 0.0001) than other animal hosts (Table 5).
The UpSet plot in Figure 3 presents the frequency of tsetse bloodmeals on single and double animal species. Warthogs 16.38% (114/696) (95% CI: 13.62–19.14) and cattle 10.63% (74/696) (95% CI: 8.34–12.93) bloodmeals were the most frequently detected in tsetse flies that took bloodmeals from single host species, and baboons plus sheep 1.15% (8/696) (95% CI: 0.36–1.94) and warthogs plus cattle 0.57% (4/696) (95% CI: 0.01–1.14) in the vectors that fed on multiple host species.

2.2. Trypanosome Infections in Blood-Fed Tsetse Flies

Overall, 10.92% (38/348) (95% CI: 7.63–14.21) of blood-fed tsetse flies that harbored trypanosome infections had bloodmeals from 10 of the 13 animal species identified. Trypanosomes were not detected in tsetse flies that had fed on impala, goat, and bushbuck.
Trypanosomes in tsetse flies comprised of the livestock pathogens: T. vivax, T. congolense Kilifi, T. congolense Savannah, T. simiae Tsavo, T. simiae, T. godfreyi and T. brucei sl. Tsetse flies positive for warthog bloodmeals harbored all seven species and subspecies of trypanosomes. Tsetse flies that fed on cattle were positive for all trypanosomes except T. congolense Kilifi and T. brucei sl. For the other tsetse flies that fed on animal species other than warthogs and cattle, trypanosome infections were comprised of either one or two species but not more.
Tsetse flies that fed on warthogs were significantly exposed to T. vivax (Binomial-Generalized Linear Mixed Model [B-GLMM]: p < 0.05), T. congolense (B-GLMM: p < 0.05) and T. brucei sl (B-GLMM: p < 0.05) infection risk (Table 6). We also observed significant risk of trypanosome infection (T. godfreyi) (B-GLMM: p < 0.05) in tsetse flies that took bloodmeals from red riverhog. The only other species of animal bloodmeal outside the Suidae family for which we noted a significant risk of trypanosome infection (T. congolense) was suni (Table 6).

3. Discussion

Tsetse flies in Shimba Hills fed preferentially on suids (19.25%) and bovids (20.40%). Importantly, the vectors took bloodmeals from mostly warthogs (17.39%) and cattle (11.35%) among the 13 animal species whose bloodmeals we detected in samples of tsetse flies. These findings support previous observations of tsetse preference for cattle bloodmeals [16] and preferential selection of warthogs among wild animals in sylvatic ecologies, including areas where warthogs are sparse in relation to other animal species [17,18,19,20]. In Tanganyika, for example, warthogs made up <3.00% of the total population of wild mammals but >75.00% of the bloodmeals of tsetse flies [19].
Our data show that tsetse flies in Shimba Hills feed preferentially on warthog bloodmeals. However, the underlining reasons for this are not well understood. In a previous study, the mosquito Anopheles stephensi preferred to feed on rabbits than guineapigs because the blood from rabbits was of higher nutritional quality and easier to digest [17]. Some experiments confirmed high dietary quality of porcine blood, hence making it the bloodmeal of choice for mass-rearing of tsetse colonies [21]. In one study, it was discovered that warthog skin and urine odours increased catches of tsetse flies [22]. These findings and tsetse disposition for feeding on warthogs in Shimba Hills suggest that further investigation of warthog-based tsetse-attractant semio-chemicals could enhance the toolbox of odour-attractants applied in tsetse surveillance and control in sub-Saharan Africa.
Cattle emit large amounts of tsetse attractant-odours through their urine. This underpins the rationale for urine adoption for tsetse attraction in entomological surveillance and control [23,24,25]. Furthermore, G. pallidipes which in Shimba Hills is the dominant tsetse fly species, have an intrinsic predisposition towards bovids, including cattle [16]. It was therefore not surprising that tsetse flies in Shimba Hills were found to have fed frequently on cattle. A contrary finding by Channumsin et al. [12] in Shimba Hills of absence of cattle bloodmeals in tsetse flies may be the result of sampling bias occasioned by the short sampling time (of less than five weeks) reported in that study.
The frequent detection of trypanosomes in tsetse flies positive for warthog and cattle bloodmeals indicates that trypanosomes may move between the sylvatic and domestic cycles. This may explain why high prevalence of trypanosomes in cattle is common in this area, with reports confirming infections in nearly half of cattle livestock assessed during high transmission season [13]. Based on our observations of high diversity and rate of trypanosomes in tsetse flies positive for warthog bloodmeals, it is likely that warthogs play an important role as cryptic reservoirs and epidemiological drivers of cattle trypanosome parasites responsible for Nagana disease in smallholder farming systems in the wildlife interface of Shimba Hills.
Tourism, cattle herding, and land cultivation at the Shimba Hills Wildlife Reserve boundary are important factors that expose humans to attacks by tsetse flies. However, we could only detect human DNA in a few tsetse flies, possibly because the savannah tsetse fly species endemic in Shimba Hills are generally averse to feeding on humans [26]. The case is different for riverine tsetse flies, for example G. fuscipes fuscipes which feed frequently on humans [16] and in the process transmit T. b. rhodesiense responsible for the human sleeping sickness disease in Kenya and other East African countries except for northwest Uganda [4]. In Kenya, sleeping sickness is presently only endemic to the western region bordering Uganda but absent in the coastal area where Shimba Hills is located [27]; Kenya Tsetse and Trypanosomiasis Eradication Council KENTTEC, 2019 www.kenttec.go.ke, assessed on 3 November 2021).
Some animal species were detected infrequently in tsetse fly bloodmeals, probably because of their sparse presence in Shimba Hills. However, infrequent detections of Suni antelope, goat, and impala in Shimba Hills could be explained by the defensive behaviors of these animals against tsetse flies during attempts by the vectors to feed [3]. For sheep, the body covering by thick-wool makes it difficult for tsetse flies to obtain bloodmeals. Elephants have a non-uniform spatial distribution in Shimba Hills being mainly found in areas around Mlafyeni in proximity to the Mwalunganje Elephant Sanctuary [20]. Aside from Mlafyeni and the nearby Pengo and Kizibe, the only other location where we detected elephant bloodmeals in tsetse was in Kinangondogo. Still, the finding was made in a single G. brevipalpis, which according to Weitz [16] prefers elephants. This may also be due to the preference of G. brevipalpis for forested areas, where elephants in the Shimba Hills National Reserve are frequently found.
Allomonal volatile emissions may explain the absence in tsetse flies of bloodmeals from zebra [28] and waterbuck [13,29], both of which are present in Shimba Hills (Kenya Wildlife Service KWS 2021, www.kws.go.ke/content/shimba-hills-national-reserve, assessed on 3 November 2021). However, skin coloration patterns in zebra are believed to confuse tsetse flies and discourage vector attacks [30,31,32]. Even though we did not detect bloodmeals of zebra, waterbuck, and several other animal species (e.g., giraffe and monitor lizard) previously shown to be fed on by tsetse flies [3], bloodmeal host diversity in tsetse flies was high in Shimba Hills in comparison to reports from some similar ecologies, for example, the Kafue National Park Zambia and Hurungwe Game Reserve Zimbabwe [33]. Large fauna community, extensive spatio-temporal samplings, and adoption of multiple gene-markers to segregate DNA of vertebrates in a high-throughput analysis using the sensitive PCR-HRM technique [34] are important factors which contributed to the wide diversity of tsetse fly bloodmeal hosts in Shimba Hills.
Multiple-host feeding by tsetse flies was presumably the result of certain animals’ anti-feeding behaviours to discourage the vectors from biting attacks. Baboons, like goats and impala, display defensive behaviors against tsetse flies, hence it was not surprising that seven of the twelve sets of multiple hosts involved baboons. Disruption of tsetse-feeding before repletion on a host causes the vectors to switch to other hosts to continue feeding, thus allowing trypanosome-dissemination among and between wildlife and livestock [3,12]. In Shimba Hills, over half the cases of multiple-host feeding involved wildlife and livestock, prominently baboons and sheep, and warthogs and cattle. The finding of warthog and cattle bloodmeals in individual tsetse flies is further evidence that cattle in Shimba Hills are exposed to trypanosomes from warthogs.
Warthog and cattle multiple bloodmeals were detected in G. pallidipes and G. austeni and in male and female tsetse flies. However, G. pallidipes and female tsetse flies have a higher potential for trypanosome transmission in Shimba Hills because they make up >90.00% of the tsetse flies in Shimba Hills, outlive their male counterparts [35,36], and have relatively high rates of displacement which allows them to feed on and distribute infections among a large repertoire of animal species [37]. True to this, the rate of trypanosome infection was higher in older tsetse flies and in female tsetse flies. The wider host range in young flies (data not shown) might just have been because they have a much greater quest for bloodmeals and consequently are more elastic in choice of hosts.
Stationary-baits for tsetse control in Shimba Hills should ideally target G. pallidipes because of the fly species high feeding rate on warthogs and cattle with deployment of the control tools prioritized to areas where warthogs are abundant and co-exist with cattle. It might, however, be more effective to integrate stationary-baits with live-baits (or synthetic tsetse repellent odour-treatment of cattle [13]) since tsetse flies in Shimba Hills also feed abundantly on cattle. The live-bait technique in Shimba Hills would have an added advantage of also controlling for ticks, which in the area transmit a large variety of pathogens [38], including Theileria parva responsible for the East Coast Fever and which in an epidemiological survey was detected in warthogs in the area [39].

4. Materials and Methods

4.1. Ethical Consent
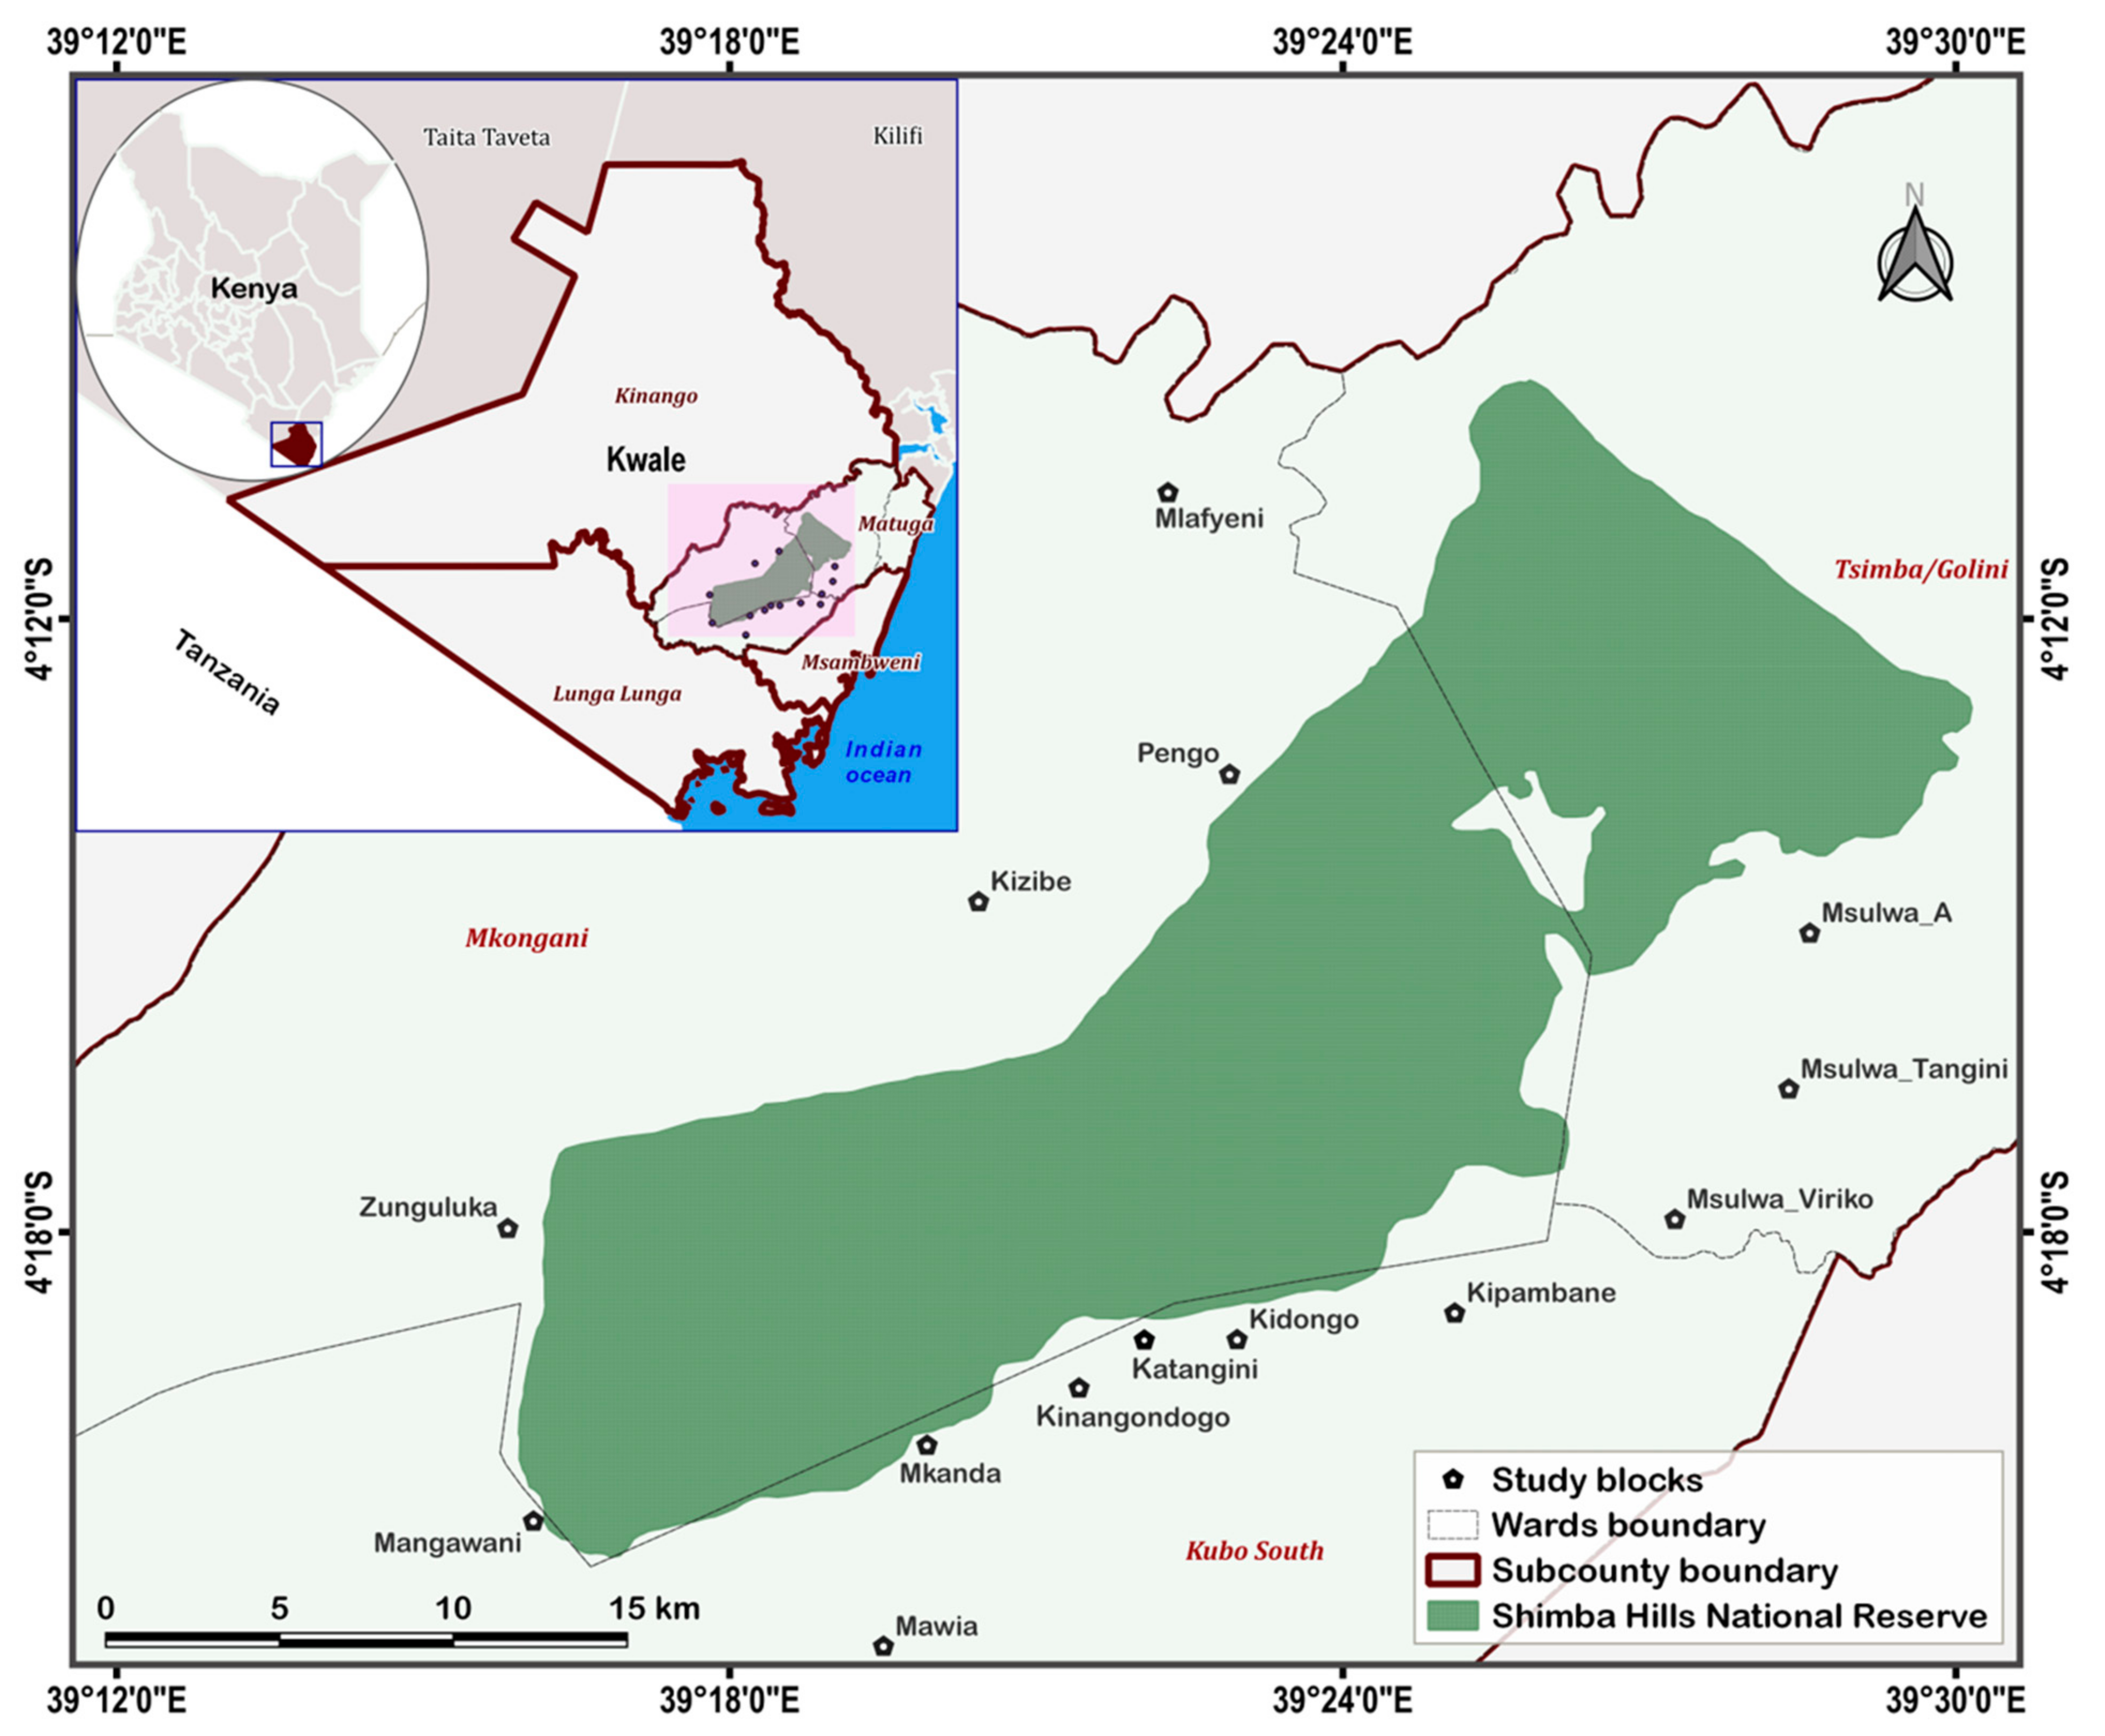
The study received ethical consent from Kenya’s National Commission for Science, Technology and Innovation (License No.: NACOSTI/P/20/7344) and the Pwani University Ethics Review (approval number ERC/EXT/002/2020). The study was conducted according to guidelines stipulated by the International Centre of Insect Physiology and Ecology icipe Kenya. Collections of tsetse flies were done in collaboration with local communities, the Kenya Tsetse and Trypanosomiasis Eradication Council (KENTTEC), and the Kenya Wildlife Service (KWS).

4.2. Study Area

The Shimba Hills NR is located in Kwale County in southeast Kenya (Figure 4). A major wildlife area in East Africa, the Reserve is just ~218 km2 yet hosts Kenya’s highest density of elephants (Loxodonta africana) [40]. Further, it is home to a wide biodiversity and accommodates important vertebrates including threatened and endangered animal species prominently the Roosevelt’s sable antelope Hippotragus niger (Kenya Wildlife Service KWS 2021, www.kws.go.ke, assessed on 3 November 2021). Among animal species domiciled in the area are warthogs (Phacochoerus africanus), bushbuck (Tragelaphus scriptus), and buffalo (Syncerus scaffer). The Shimba Hills area is warm and moist, with average annual temperature and rainfall of ~24 °C and 1150 mm, respectively. The area experiences bimodal rainfall patterns characterized by long rains from March to May, sometimes extending to July, and short rains from October to December. Main economic activities in communities residing at the edge of the reserve are crop and livestock (mainly cattle) production. Vegetation is green year-round hence encouraging intensive cropping activities and discouraging seasonal livestock migration.

4.3. Tsetse Fly Collection and Characterization

Samples of tsetse flies were collected over a 10-month period (November 2018 to September 2019) in the Shimba Hills wildlife-livestock interface. Biconical traps for tsetse collection [41] were baited with cow urine and acetone at respective release rates of 1000 mg/h and 500 mg/h and deployed at a density of 1 trap per km2 within 5 km of the border of the reserve, over an area stretching ~230 km2. Collections of tsetse flies were done bi-monthly throughout the sampling period, across different vegetation landscapes, and in locations at varying proximities to the Shimba Hills NR. Tsetse flies were identified using established taxonomic keys [42], sorted according to sex and species, and subsequently stored in 95% ethanol. Each fly sample was later assessed for age based on the wing fray scoring technique developed by Jackson [43].

4.4. Identification of Vertebrate Bloodmeal Sources in Tsetse Flies

Tsetse flies were sterilized in alcohol, air-dried, and crushed using a Mini-Beadbeater-16 (BioSpec, Bartlesville, OK, USA). This was followed by DNA extraction from crushed fly samples using Genomic DNA extraction kits (Bioloine, London, UK) according to the manufacturer’s instructions for animal tissues. Two vertebrate mitochondrial genes were then targeted in separate Polymerase Chain Reactions (PCRs): the first, the 16S ribosomal RNA gene was amplified with Vert 16S For: 5′-GAGAAGACCCTRTGGARCTT-3′ and Vert 16S Rev: 5′-CGCTGTTATCCCTAGGGTA-3′ primers which target a ~200 bp region [44] and the second, the cytochrome b gene was amplified with the Cyt b For: 5′-CCCCTCAGAATGATATTTGTCCTCA-3′ and Cyt b Rev: 5′-CATCCAACATCTCAGCATGATGAAA-3′ primers that target a ~383 bp region [45]. For each PCR-reaction, we used 0.5 μM of each Forward and Reverse primer (Macrogen, Europe, Amsterdam, The Netherlands) in a 10 μL reaction-volume comprising of 1 μL template DNA and 2 μL of pre-formulated 5X HOT FIREPol® EvaGreen® HRM Mix, (Solis BioDyne, Tartu, Estonia). DNA amplifications were carried out for 16S ribosomal RNA and cytochrome b in a Rotor-Gene Q thermocycler (Qiagen, Hilden, Germany) and QuantStudio 3 Real-Time PCR System thermal cycler (MicroAmp®; Applied Biosystems, Inc., Foster city, CA, USA), respectively with the following thermal cycling conditions: initial denaturation for 15min at 95 °C, followed by 40 cycles of denaturation at 95 °C for 40 s, annealing at 56 °C for 20 s, and extension at 72 °C for 30 s, and a final extension at 72 °C for 5 min. High-Resolution Melting analysis of amplicons followed immediately with gradual melting from 75 °C to 95 °C. Non-template negative controls were included in the experiments to ascertain the success of each run. DNA extracted from cattle, sheep, donkey, giraffe, bushbuck, baboon, impala, hippopotamus, and human were used as positive controls, and tsetse bloodmeal sources were identified by inspecting HRM profile alignments with those of positive controls. Tsetse flies that fed on multiple hosts had HRM curves aligned with more than one positive controls. Melting profiles were analysed in the software Rotor-Gene Q v2.1 and QuantStudioTM Design & Analysis v1.5.1 depending on the machine used for PCR-HRM analysis. Where a profile was different from those of positive control and could not be clearly identified, samples were subjected to CO1 gene amplification [46] and amplicon sequencing. PCR-reactions targeting a ~750 bp region of the CO1 gene were carried out in a 15 μL reaction-volume containing 0.5 μM of each Forward and Reverse primer (Macrogen, Europe) (VF1d For: TCTCAACCAACCACAARGAYATYGG; VR1d Rev: TAGACTTCTGGGTGGCCRAARAAYCA) [46], 2 μL template DNA, 3 μL of 5X HOT FIREPol® Blend Master Mix (Solis BioDyne, Tartu, Estonia) with the following cycling conditions: initial denaturation for 15 min at 95 °C, followed by 40 cycles of denaturation at 95 °C for 20 s, annealing at 57 °C for 30 s, and extension at 72 °C for 60 s, followed by a final extension at 72 °C for 7 min. DNA amplification was ascertained by electrophoresis of PCR-products for 30 min in a 1.5% agarose-gel stained with 5 μg/mL ethidium bromide at 120 V. Unincorporated dNTPs and PCR primers were removed from amplicons using Exo-SAP (USB Corporation, Cleveland, OH, USA). Purified amplicons were then submitted for unidirectional Sanger sequencing at Macrogen in Europe.

4.5. Molecular Identification of Trypanosomes in Tsetse Flies

Detection of trypanosomes was done using the same crushed homogenates used for bloodmeal analysis. Amplification of trypanosome DNA was performed in a 10 μL reaction-volume comprising of 1 μL DNA template, 5 µL DreamTaq Master Mix (2X) (Thermo Scientific, UK), and 0.5 μL at 10 μM of each Forward and Reverse ITS-1 primers (CF: CCGGAAGTTCACCGATATTG, BR: TTGCTGCGTTCTTCAACGAA) [47]. Cycling conditions for DNA amplification were initial denaturation for 1 min at 95 °C, followed by 35 cycles of denaturation at 95 °C for 30 s, annealing at 60 °C for 20 s, and extension at 72 °C, and a final extension at 72 °C for 7 min. PCR-products were visualized following 1.5% agarose-gel electrophoresis against a molecular weight maker (Gene-Ruler 100 bp DNA ladder, Thermo Scientific, Lithuania) and ethidium bromide staining (5 µg/mL). Where trypanosome infections were present, the parasite species were characterized by the following unique band sizes: T. vivax ~250 bp, T. godfreyi ~300 bp, T. simiae Tsavo ~370 bp, T. simiae ~400 bp, Trypanozoon (T. brucei sp.) ~480 bp, T. congolense Kilifi ~620 bp, and T. congolense Savannah/Forest ~700 bp [47]. To confirm trypanosome identity, amplicons were cleaned using Exo-SAP (USB Corporation, Cleveland OH) to remove unincorporated dNTPs and PCR primers and thereafter sent for Sanger sequencing of the ITS1gene [47].

4.6. Data Analyses

Returned vertebrate DNA sequences were inspected for quality based on their chromatograph profiles and edited in BioEdit v7.2.5 [48]. Edited sequences were subjected to BLAST analysis for comparison to nucleotide sequences in the NCBI GeneBank-nr database (https://blast.ncbi.nlm.nih.gov/Blast.cgi, assessed on 3 November 2021) and a homology cut-off of 98.00% to 100.00% identity was used to infer vertebrate species. The process of trypanosome DNA identification is reported in a parallel work.
Difference in proportions of bloodmeal-positive tsetse flies were tested for significance using the Binomial Generalized Linear Model [49]. p-values were significant if <0.05. Where significant differences were present, Tukey’s Post-Hoc test was carried out in the ‘multcomp’ R package [50] for pairwise comparisons. Next, Binomial Generalized Linear Mixed Model (B-GLMM) analyses with ‘trap_ID’ as random factor were implemented in the GlmmTMB R package [51,52] to investigate associations between tsetse fly bloodmeals on animal hosts and the vector risk of exposure to trypanosome infections. Furthermore, we designed a bipartite interaction network in the bipartite R package [53] to visually depict animal blood-feeding behavior of tsetse fly species in Shimba Hills. Finally, we used an UpSet plot to show the number of tsetse flies that fed on particular animal species and the number of tsetse flies containing bloodmeals from one or multiple animal host species.

Supplementary Materials

The following are available online at https://0-www-mdpi-com.brum.beds.ac.uk/article/10.3390/pathogens10111501/s1, Table S1: Data on tsetse fly bloodmeal hosts and trypanosome infections in the different study-blocks in Shimba Hills, Kenya.

Author Contributions

F.I.E., M.N.O., A.D.S.B., D.K.M.: Conceptualization; F.I.E.: Data curation; F.I.E.: Formal analysis; M.N.O., D.K.M.: Funding acquisition; F.I.E., M.N.O., A.D.S.B., D.K.M.: Investigation; F.I.E., A.D.S.B., D.K.M.: Methodology; M.N.O., D.K.M.: Project administration; A.D.S.B., M.N.O., D.K.M.: Supervision; F.I.E.: Writing—original draft; A.D.S.B., S.K., M.N.O., F.I.E.: Writing—review & editing. All authors have read and agreed to the published version of the manuscript.

Funding

F.I.E. was supported by a German Academic Exchange Service (DAAD) in-region postgraduate scholarship and registered for his Ph.D. degree at the University of Pretoria, South Africa. We gratefully acknowledge the financial support for this research by the following organizations and agencies: the BioVision Foundation Switzerland (Grant number: DPA_005/2018-31.03.2020); European Union’s Integrated Biological Control Applied Research Programme—tsetse repellent component (EU-IBCARP tsetse) awarded to icipe (grant number: DCI-FOOD/2014/346-739); This study also received financial support from the German Ministry for Economic Cooperation and Development (BMZ) through the Deutsche Gesellschaft für Internationale Zusammenarbeit (GIZ) ICTDL grant number: 18.7860.2-001.00; UK’s Department for International Development (DFID); Swedish International Development Cooperation Agency (SIDA); the Swiss Agency for Development and Cooperation (SDC); and the Kenyan Government. The views expressed herein do not necessarily reflect the official opinion of the donors.

Institutional Review Board Statement

The study received ethical consent from Kenya’s National Commission for Science, Technology and Innovation (License No.: NACOSTI/P/20/7344) and the Pwani University Ethics Review (approval number ERC/EXT/002/2020). The study was conducted according to guidelines stipulated by the International Centre of Insect Physiology and Ecology icipe Kenya. Collections of tsetse flies were done in collaboration with local communities, the Kenya Tsetse and Trypanosomiasis Eradication Council (KENTTEC), and the Kenya Wildlife Service (KWS).

Informed Consent Statement

Not applicable.

Data Availability Statement

The dataset used and/or analysed during the current study are available from the corresponding author FIE on reasonable request. DNA sequences of vertebrate species generated during the current study are available in the GenBank under accession numbers: MZ816958-MZ816971.

Acknowledgments

We thank Kevin Ogola Kidambasi for assistance in the laboratory analysis of samples and James Kabii for logistic support. Caroline Muya provided administrative support and Benard Malenge drew the map of the study area. The authors acknowledge Community-Owned Resource Persons CORPs in Shimba Hills and David Mbuvi, Peter Muasa, Richard Tumba, Philip Kolei, Oscar Esibi and Careen Kemunto of the icipe’s Animal Health Theme for technical support in field collection of tsetse fly samples. We also gratefully acknowledge the support received from colleagues at the icipe Martin Luscher Emerging Infectious Diseases Laboratory ML-EID and Molecular Biology and Bioinformatics Unit MBBU.

Conflicts of Interest

The authors declare that they have no competing interest. The funders had no role in study design, data collection and analysis, decision to publish, or preparation of the manuscript.

References

  1. Hassell, J.M.; Begon, M.; Ward, M.J.; Fèvre, E.M. Urbanization and disease emergence: Dynamics at the wildlife–livestock–human interface. Trends Ecol. Evol. 2017, 32, 55–67. [Google Scholar] [CrossRef] [Green Version]
  2. Anderson, N.E.; Mubanga, J.; Fevre, E.M.; Picozzi, K.; Eisler, M.C.; Thomas, R.; Welburn, S.C. Characterisation of the wildlife reservoir community for human and animal trypanosomiasis in the Luangwa Valley, Zambia. PLoS Negl. Trop. Dis. 2011, 5, e1211. [Google Scholar] [CrossRef] [Green Version]
  3. Auty, H.; Morrison, L.J.; Torr, S.J.; Lord, J. Transmission dynamics of Rhodesian sleeping sickness at the interface of wildlife and livestock areas. Trends Parasitol. 2016, 32, 608–621. [Google Scholar] [CrossRef] [PubMed]
  4. Büscher, P.; Cecchi, G.; Jamonneau, V.; Priotto, G. Human african trypanosomiasis. Lancet 2017, 390, 2397–2409. [Google Scholar] [CrossRef]
  5. Diall, O.; Cecchi, G.; Wanda, G.; Argilés-Herrero, R.; Vreysen, M.J.; Cattoli, G.; Viljoen, G.J.; Mattioli, R.; Bouyer, J. Developing a progressive control pathway for African animal trypanosomosis. Trends Parasitol. 2017, 33, 499–509. [Google Scholar] [CrossRef] [Green Version]
  6. Kaare, M.T.; Picozzi, K.; Mlengeya, T.; Fèvre, E.M.; Mellau, L.S.; Mtambo, M.M.; Cleaveland, S.; Welburn, S.C. Sleeping sickness—A re-emerging disease in the Serengeti? Travel Med. Infect. Dis. 2007, 5, 117–124. [Google Scholar] [CrossRef]
  7. Claxton, J.R.; Faye, J.A.; Rawlings, P. Trypanosome infections in warthogs (Phacochoerus aethiopicus) in the Gambia. Vet. Parasitol. 1992, 41, 179–187. [Google Scholar] [CrossRef]
  8. Muturi, C.N.; Ouma, J.O.; Malele, I.I.; Ngure, R.M.; Rutto, J.J.; Mithöfer, K.M.; Enyaru, J.; Masiga, D.K. Tracking the feeding patterns of tsetse flies (Glossina genus) by analysis of bloodmeals using mitochondrial cytochromes genes. PLoS ONE 2011, 6, e17284. [Google Scholar] [CrossRef] [PubMed]
  9. Munang’andu, H.M.; Siamudaala, V.; Munyeme, M.; Nalubamba, K.S. A review of ecological factors associated with the epidemiology of wildlife trypanosomiasis in the Luangwa and Zambezi valley ecosystems of Zambia. Interdiscip. Perspect. Infect. Dis. 2012, 2012, 372523. [Google Scholar] [CrossRef]
  10. Squarre, D.; Hayashida, K.; Gaithuma, A.; Chambaro, H.; Kawai, N.; Moonga, L.; Namangala, B.; Sugimoto, C.; Yamagishi, J. Diversity of trypanosomes in wildlife of the Kafue ecosystem, Zambia. Int. J. Parasitol. Parasites Wildl. 2020, 12, 34–41. [Google Scholar] [CrossRef] [PubMed]
  11. Makhulu, E.E.; Villinger, J.; Adunga, V.O.; Jeneby, M.M.; Kimathi, E.M.; Mararo, E.; Oundo, J.W.; Musa, A.A.; Wambua, L. Tsetse blood-meal sources, endosymbionts and trypanosome-associations in the Maasai Mara National Reserve, a wildlife-human-livestock interface. PLoS Negl. Trop. Dis. 2021, 15, e0008267. [Google Scholar] [CrossRef]
  12. Channumsin, M.; Ciosi, M.; Masiga, D.; Auty, H.; Turner, C.M.; Kilbride, E.; Mable, B.K. Blood meal analysis of tsetse flies (Glossina pallidipes: Glossinidae) reveals higher host fidelity on wild compared with domestic hosts. Wellcome Open Res. 2021, 6, 213. [Google Scholar] [CrossRef] [PubMed]
  13. Saini, R.K.; Orindi, B.O.; Mbahin, N.; Andoke, J.A.; Muasa, P.N.; Mbuvi, D.M.; Muya, C.M.; Pickett, J.A.; Borgemeister, C.W. Protecting cows in small holder farms in East Africa from tsetse flies by mimicking the odor profile of a non-host bovid. PLoS Negl. Trop. Dis. 2017, 11, e0005977. [Google Scholar]
  14. Navia-Gine, W.G.; Loaiza, J.R.; Miller, M.J. Mosquito-host interactions during and after an outbreak of equine viral encephalitis in eastern Panama. PLoS ONE 2013, 8, e81788. [Google Scholar] [CrossRef]
  15. Escobar, D.; Ascencio, K.; Ortiz, A.; Palma, A.; Sánchez, A.; Fontecha, G. Blood meal sources of Anopheles spp. in malaria endemic areas of Honduras. Insects 2020, 11, 450. [Google Scholar] [CrossRef] [PubMed]
  16. Weitz, B. The feeding habits of Glossina. Bull. World Health Organ. 1963, 28, 711. [Google Scholar] [PubMed]
  17. Weitz, B.; Glasgow, J.P. The natural hosts of some species of Glossina in East Africa. Trans. R. Soc. Trop. Med. Hyg. 1956, 50, 593–612. [Google Scholar] [CrossRef] [Green Version]
  18. Auty, H.; Cleaveland, S.; Malele, I.; Masoy, J.; Lembo, T.; Bessell, P.; Torr, S.; Picozzi, K.; Welburn, S.C. Quantifying heterogeneity in host-vector contact: Tsetse (Glossina swynnertoni and G. pallidipes) host choice in Serengeti National Park, Tanzania. PLoS ONE 2016, 11, e0161291. [Google Scholar] [CrossRef] [PubMed]
  19. Lamprey, H.F.; Glasgow, J.P.; Lee-Jones, F.; Weitz, B. A simultaneous census of the potential and actual food sources of the tsetse fly Glossina swynnertoni Austen. J. Anim. Ecol. 1962, 31, 151–156. [Google Scholar] [CrossRef]
  20. Ngene, S.M.; Mukeka, J. Aerial Census of Elephants and Other Mammals in Shimba Hills, Mkongani, and Mwaluganje Conservation Areas; Kenya Wildlife Service: Nairobi, Kenya, 2012. [Google Scholar]
  21. De Beer, C.J.; Venter, G.J.; Potgieter, F.T. Developing Quality Control Procedures to Sustain a Supply of High Quality Blood for Mass Rearing Tsetse Flies; IAEA: Vienna, Austria, 2012. [Google Scholar]
  22. Späth, J. Natural host odours as possible attractants for Glossina tachinoides and G. longipalpis (Diptera: Glossinidae). Acta Trop. 1997, 68, 149–158. [Google Scholar] [CrossRef]
  23. Hargrove, J.W.; Vale, G.A. The effect of host odour concentration on catches of tsetse flies (Glossinidae) and other Diptera in the field. Bull. Entomol. Res. 1978, 68, 607–612. [Google Scholar] [CrossRef]
  24. Brightwell, B.; Dransfield, B.; Maudlin, I.; Stevenson, P.; Shaw, A. Reality vs. rhetoric–a survey and evaluation of tsetse control in East Africa. Agric. Hum. Values 2001, 18, 219–233. [Google Scholar] [CrossRef]
  25. Leak, S.G.; Ejigu, D.; Vreysen, M.J. Collection of Entomological Baseline Data for Tsetse Area-Wide Integrated Pest Management Programmes; Food and Agriculture Organization of the United Nations (FAO): Rome, Italy, 2008. [Google Scholar]
  26. Vale, G.A. The responses of tsetse flies (Diptera, Glossinidae) to mobile and stationary baits. Bull. Entomol. Res. 1974, 64, 545–588. [Google Scholar] [CrossRef]
  27. Rutto, J.J.; Karuga, J.W. Temporal and spatial epidemiology of sleeping sickness and use of geographical information system (GIS) in Kenya. J. Vector Borne Dis. 2009, 46, 18. [Google Scholar] [PubMed]
  28. Olaide, O.Y.; Tchouassi, D.P.; Yusuf, A.A.; Pirk, C.W.; Masiga, D.K.; Saini, R.K.; Torto, B. Zebra skin odor repels the savannah tsetse fly, Glossina pallidipes (Diptera: Glossinidae). PLoS Negl. Trop. Dis. 2019, 13, e0007460. [Google Scholar] [CrossRef] [Green Version]
  29. Bett, M.K.; Saini, R.K.; Hassanali, A. Repellency of tsetse-refractory waterbuck (Kobus defassa) body odour to Glossina pallidipes (Diptera: Glossinidae): Assessment of relative contribution of different classes and individual constituents. Acta Trop. 2015, 146, 17–24. [Google Scholar] [CrossRef] [PubMed]
  30. Waage, J.K. How the zebra got its stripes-biting flies as selective agents in the evolution of zebra coloration. J. Entomol. Soc. S. Afr. 1981, 44, 351–358. [Google Scholar]
  31. Gibson, G. Do tsetse flies ‘see’ zebras? A field study of the visual response of tsetse to striped targets. Physiol. Entomol. 1992, 17, 141–147. [Google Scholar] [CrossRef]
  32. Caro, T.; Izzo, A.; Reiner, R.C.; Walker, H.; Stankowich, T. The function of zebra stripes. Nat. Commun. 2014, 5, 3535. [Google Scholar] [CrossRef]
  33. Gaithuma, A.; Yamagishi, J.; Hayashida, K.; Kawai, N.; Namangala, B.; Sugimoto, C. Blood meal sources and bacterial microbiome diversity in wild-caught tsetse flies. Sci. Rep. 2020, 10, 5005. [Google Scholar] [CrossRef] [Green Version]
  34. Ouso, D.O.; Otiende, M.Y.; Jeneby, M.M.; Oundo, J.W.; Bargul, J.L.; Miller, S.E.; Wambua, L.; Villinger, J. Three-gene PCR and high-resolution melting analysis for differentiating vertebrate species mitochondrial DNA for biodiversity research and complementing forensic surveillance. Sci. Rep. 2020, 10, 4741. [Google Scholar] [CrossRef] [PubMed] [Green Version]
  35. Wamwiri, F.N.; Alam, U.; Thande, P.C.; Aksoy, E.; Ngure, R.M.; Aksoy, S.; Ouma, J.O.; Murilla, G.A. Wolbachia, Sodalis and trypanosome co-infections in natural populations of Glossina austeni and Glossina pallidipes. Parasites Vectors 2013, 6, 232. [Google Scholar] [CrossRef] [Green Version]
  36. Kubi, C.; Billiouw, M.; Van den Bossche, P. Age prevalence of trypanosomal infections in female Glossina morsitans morsitans (Diptera: Glossinidae) on the plateau area of eastern Zambia. Onderstepoort J. Vet. Res. 2007, 74, 223–229. [Google Scholar] [CrossRef] [PubMed]
  37. Vale, G.A.; Hargrove, J.W.; Solano, P.; Courtin, F.; Rayaisse, J.B.; Lehane, M.J.; Esterhuizen, J.; Tirados, I.; Torr, S.J. Explaining the host-finding behavior of blood-sucking insects: Computerized simulation of the effects of habitat geometry on tsetse fly movement. PLoS Negl. Trop. Dis. 2014, 8, e2901. [Google Scholar] [CrossRef] [PubMed]
  38. Mwamuye, M.M.; Kariuki, E.; Omondi, D.; Kabii, J.; Odongo, D.; Masiga, D.; Villinger, J. Novel Rickettsia and emergent tick-borne pathogens: A molecular survey of ticks and tick-borne pathogens in Shimba Hills National Reserve, Kenya. Ticks tick-borne Dis. 2017, 8, 208–218. [Google Scholar] [CrossRef] [PubMed]
  39. Jagero, G.O. Molecular Evidence of Arthropod-Borne Pathogens in Wildlife and Livestock in Shimba Hills National Reserve (SHNR), Kwale County, Kenya. Master’s Dissertation, The University of Edinburgh, Edinburgh, UK, 2015. [Google Scholar]
  40. Knickerbocker, T.J.; Waithaka, J. People and elephants in the Shimba Hills, Kenya. Conserv. Biol. Ser.-Camb. 2005, 9, 224. [Google Scholar]
  41. Challier, A.; Laveissiere, C. A new trap for catching Glossina: Description and field trials. Cah. ORSTOM Ser. Entomol. Med et Parasitol. 1973, 11, 251–262. [Google Scholar]
  42. Pollock, J.N. Training Manual for Tsetse Control Personnel; Food and Agriculture Organization of the United Nations: Rome, Italy, 1982. [Google Scholar]
  43. Jackson, C.H. An artificially isolated generation of tsetse flies (Diptera). Bull. Entomol. Res. 1946, 37, 291–299. [Google Scholar] [CrossRef] [PubMed]
  44. Omondi, D.; Masiga, D.K.; Ajamma, Y.U.; Fielding, B.C.; Njoroge, L.; Villinger, J. Unraveling host-vector-arbovirus interactions by two-gene high resolution melting mosquito bloodmeal analysis in a Kenyan wildlife-livestock interface. PLoS ONE 2015, 10, e0134375. [Google Scholar] [CrossRef] [Green Version]
  45. Boakye, D.A.; Tang, J.; Truc, P.; Merriweather, A.; Unnasch, T.R. Identification of bloodmeals in haematophagous Diptera by cytochrome B heteroduplex analysis. Med. Vet. Entomol. 1999, 13, 282–287. [Google Scholar] [CrossRef] [PubMed] [Green Version]
  46. Ivanova, N.V.; Zemlak, T.S.; Hanner, R.H.; Hebert, P.D. Universal primer cocktails for fish DNA barcoding. Mol. Ecol. Notes 2007, 7, 544–548. [Google Scholar] [CrossRef]
  47. Njiru, Z.K.; Constantine, C.C.; Guya, S.; Crowther, J.; Kiragu, J.M.; Thompson, R.C.; Dávila, A.M. The use of ITS1 rDNA PCR in detecting pathogenic African trypanosomes. Parasitol. Res. 2005, 95, 186–192. [Google Scholar] [CrossRef] [PubMed]
  48. Hall, T.A. BioEdit: A user-friendly biological sequence alignment editor and analysis program for Windows 95/98/NT. Nucleic Acids Symp. Ser. 1999, 41, 95–98. [Google Scholar]
  49. Dunn, P.K.; Smyth, G.K. Models for Proportions: Binomial GLMs. In Generalized Linear Models with Examples in R; Springer: New York, NY, USA, 2018; pp. 333–369. [Google Scholar]
  50. Hothorn, T.; Bretz, F.; Westfall, P.; Heiberger, R.M.; Schuetzenmeister, A.; Scheibe, S.; Hothorn, M.T. Package ‘multcomp’. In Simultaneous Inference in General Parametric Models; Project for Statistical Computing: Vienna, Austria, 2016. [Google Scholar]
  51. Brooks, M.E.; Kristensen, K.; Van Benthem, K.J.; Magnusson, A.; Berg, C.W.; Nielsen, A.; Skaug, H.J.; Machler, M.; Bolker, B.M. glmmTMB balances speed and flexibility among packages for zero-inflated generalized linear mixed modeling. R J. 2017, 9, 378–400. [Google Scholar] [CrossRef] [Green Version]
  52. Team RC. R: A Language and Environment for Statistical Computing; Vienna, Austria. 2013. Available online: https://www.R-project.org/ (accessed on 3 November 2021).
  53. Dormann, C.F.; Gruber, B.; Fründ, J. Introducing the bipartite package: Analysing ecological networks. Interaction 2008, 8, 8–11. [Google Scholar]
Figure 1. (AE) High-Resolution Melt profiles of vertebrate bloodmeals in tsetse flies. Profiles are distinguished using different colours to denote different vertebrate bloodmeal hosts. The identity of a vertebrate bloodmeal is shown on the right side of each graph.
Pathogens 10 01501 g001aPathogens 10 01501 g001b
Figure 2. A bipartite network showing interactions between tsetse flies and animal bloodmeal hosts in Shimba Hills, Kenya.
Pathogens 10 01501 g002
Figure 3. UpSet plot showing the frequency of tsetse bloodmeals on single and double animal species in Shimba Hills, Kenya.
Pathogens 10 01501 g003
Figure 4. Map of study locations in Shimba Hills in Kwale county, Kenya.
Pathogens 10 01501 g004
Table 1. Percentage of tsetse with bloodmeals in Shimba Hills according to intrinsic traits and collection sites.
Number of Tsetse Flies Screened% Feeding Rate95% CI
Fly sex ‡
Female45854.80 a50.23–59.38
Male23840.76 b34.47–47.04
Fly species ‡
G. austeni4062.50 b46.82–78.18
G. brevipalpis13032.31 a24.16–40.45
G. pallidipes52653.42 b49.15–57.70
Fly age †
Juvenile18651.61 a44.36–58.86
Old15555.48 a47.57–63.40
Young35546.76 a41.55–51.98
Landscape †
Cultivated field14447.92 a39.66–56.17
Forest5550.91 a37.27–64.55
Fruit-Orchard11053.64 a44.17–63.10
Grassland16150.93 a43.13–58.74
Peridomicilliary1154.55 a19.46–89.63
Shrubs21548.37 a41.64–55.11
Distance from the SHNR †
<1000 m61450.65 a46.69–54.62
1000 to 1999 m6144.26 a31.44–57.09
>2000 m2147.62 a24.32–70.91
‡ Significant (p < 0.05); † Insignificant (p > 0.05); Letters in superscript have been used to indicate presence or absence of significant differences in pairwise comparisons between the numbers of tsetse flies positive for animal bloodmeals. Significantly different pairs are denoted using different letters while insignificantly different pairs are indicated using same letters.
Table 2. Percentage of tsetse with bloodmeals in Shimba Hills according to cluster-location.
Number of Tsetse Flies Screened% Feeding Rate95% CI
Cluster †
Katangini2544.00 a23.09–64.91
Kidongo1250.00 a16.82–83.18
Kinangondogo1747.06 a20.61–73.51
Kipambane1553.33 a24.74–81.93
Kizibe13447.76 a39.19–56.33
Mangawani3652.78 a35.65–69.91
Mawia3644.44 a27.39–61.50
Mkanda812.50 a−17.06–42.06
Mlafyeni16055.00 a47.21–62.79
Msulwa A2766.67 a47.66–85.67
Msulwa Tangini2100.00 a100.00–100.00
Msulwa Viriko633.33 a−20.86–87.53
Pengo19646.43 a39.38–53.47
Zunguluka2263.64 a41.81–85.47
† Insignificant (p > 0.05). Letters in superscript are all same and indicate absence of significant differences in the number of tsetse flies positive for animal bloodmeals between pairs of cluster-locations.
Table 3. Identification of nucleic acid sequences of vertebrate bloodmeals detected in tsetse flies from Shimba Hills.
Sample ID
(GenBank Accession No.)
BlockLatitudeLongitudeFly
Species
Fly SexSequence Length (bp)Closest Match on GenBank (Location)Aimal Host SpeciesSequence Identity (%)
GP370 (MZ816958)Mlafyeni−4.1745339.39222G. pallidipesF667DQ409327 (Africa)Phacochoerus africanus99.55
GP536 (MZ816959)Mlafyeni−4.2060639.40222G. pallidipesF595MN124266 (Kenya)Phacochoerus africanus100.00
GP411 (MZ816967)Pengo−4.2074239.37234G. pallidipesM607MN124266 (Kenya)Potamochoerus porcus99.34
GB412 (MZ816968)Pengo−4.2507639.36938G. brevipalpisF607MN124266 (Kenya)Potamochoerus porcus99.01
GP425 (MZ816969)Pengo−4.2507639.36938G. pallidipesF607MN124266 (Kenya)Potamochoerus porcus99.38
GB762 (MZ816966)Pengo−4.2278239.37926G. brevipalpisF607MN124266 (Kenya)Potamochoerus porcus99.34
GP362 (MZ816960)Mlafyeni−4.2508539.36904G. pallidipesF652MN124245 (Kenya)Bos taurus99.85
GP89 (MZ816962)Mangawani−4.358439.27996G. pallidipesF652MT576844 (China)Bos taurus100.00
GP888 (MZ816961)Mangawani−4.358439.27996G. pallidipesF652MT576844 (China)Bos taurus100.00
GB349 (MZ816970)kinangondogo−4.3365339.34352G. brevipalpisF396MN124271 (Kenya)Loxodonta africana98.99
GA379 (MZ816964)katangini−4.3340239.35677G. austeniF638JN645581 (Gabon)Neotragus moschatus99.84
GB545 (MZ816965)Kizibe−4.2781239.31002G. brevipalpisF538MF437212 (UAE)Homo sapiens100.00
GP665 (MZ816963)Pengo−4.2801339.35485G. pallidipesF662MN124246 (Kenya)Capra hircus100.00
GP344 (MZ816971)Katangini−4.3176639.36762G. pallidipesF470MN124256 (Kenya)Syncerus caffer98.94
Fly sex: M: Male; F: Female.
Table 4. Rate of tsetse bloodmeals on animal species according to tsetse fly species.
G. austeni (n = 40) †G. brevipalpis (n = 130) †G. pallidipes (n = 526) ‡
No%95% CINo%95% CINo%95% CI
Baboon410 a0.28–19.7243.08 a0.07–6.095410.27 c7.66–12.87
Buffalo25 a−2.06–12.0600NA61.14 a0.23–2.05
Bushbuck00NA00NA40.76 a0.02–1.51
Cattle717.5 a5.19–21.811410.77 a5.37–16.175811.03 c8.34–13.71
Donkey12.5 a−2.56–7.5600NA20.38 a−0.15–0.91
Elephant00NA32.31 a−0.31–4.9220.38 a−0.15–0.91
Goat00NA10.77 a−0.75–2.2930.57 a−0.08–1.22
Human37.5 a−1.03–16.0364.62 a0.96–8.27173.23 ab1.72–4.75
Impala00NA00NA30.57 a−0.08–1.22
Red Riverhog12.5 a−2.56–7.5643.08 a0.07–6.0981.52 a0.47–2.57
Sheep00NA56.65 a0.50–7.20356.65 bc4.52–8.79
Suni410 a0.28–19.7200NA00NA
Warthog615 a3.43–26.5775.38 a1.45–9.3210820.53 d17.07–23.10
NA: Not Available. ‡ Significant (p < 0.05); † Insignificant (p > 0.05). Letters in superscript have been used to indicate presence or absence of significant difference in pairwise comparisons between animal hosts regarding the numbers of tsetse flies that fed on them. Significantly different pairs are denoted using different letters while insignificantly different pairs are indicated using same letters.
Table 5. Rate of tsetse bloodmeals on animal hosts according to animal family and species.
Host FamilyNo. of Tsetse FliesFeeding Rate (%)95% CI
Bovidae 14220.40 a17.40–23.40
Suidae 13419.25 a16.32–22.19
Cercopithecidae628.91 b6.79–11.03
Hominidae263.74 c2.32–5.15
Elephantidae50.72 d0.09–1.35
Equidae30.43 d−0.06–0.92
Host Species
Warthog 12117.39 f14.56–20.21
Cattle7911.35 ef8.99–13.71
Baboon628.91 de6.79–11.03
Sheep405.75 cd4.01–7.48
Human263.74 bc2.32–5.15
Red River Hog131.87 ab0.86–2.88
Buffalo81.15 ab0.36–1.94
Elephant50.72 a0.09–1.35
Bushbuck40.57 a0.01–1.14
Goat40.57 a0.01–1.14
Suni40.57 a0.01–1.14
Donkey30.43 a−0.06–0.92
Impala30.43 a−0.06–0.92
Letters in superscript have been used to indicate presence or absence of significant difference in pairwise comparisons between animal hosts in the numbers of tsetse flies that fed on them. Significantly different pairs are denoted using different letters while insignificantly different pairs are indicated using same letters.
Table 6. Risk of trypanosome infection in tsetse flies that obtained bloodmeals from different animal species.
Bloodmeal-Positive Tsetse FliesT. vivaxT. simiae TsavoT. simiae
% (95% CI)p-Value% (95% CI)p-Value% (95% CI)p-Value
Bovidae1422.82 (0.06–5.57)0.7461.41 (−0.55–3.37)0.8440.70 (−0.69–2.10)0.982
Suidae 1345.22 (1.41–9.04)0.0271.49 (−0.59–3.57)0.4791.49 (−0.59–3.57)0.259
Cercopithecidae621.61 (−1.61–4.84)0.6601.61 (−1.61–4.84)0.886NA-
Hominidae263.85 (−4.08–11.77)0.6403.85 (−4.08–11.77)0.093NA-
Elephantidae5NA-NA-NA-
Equidae3NA-NA-NA-
Warthog 1215.79 (1.57–10.00)0.0140.83 (−0.81–2.46)0.8651.65 (−0.65–3.96)0.205
Cattle791.27 (−1.25–3.79)0.4822.53 (−1.01–6.07)0.3131.27 (−1.25–3.79)0.548
Baboon621.61 (−1.61–4.84)0.6601.61 (−1.61–4.84)0.886NA-
Sheep405.00 (−2.06–12.06)0.294NA-NA-
Human263.85 (−4.08–11.77)0.6403.85 (−4.08–11.77)0.093NA-
Red River Hog13NA-7.69 (−9.07–9.07)0.084NA-
Buffalo812.50 (−17.06–42.06)0.103NA-NA-
Elephant5NA-NA-NA-
Bushbuck4NA-NA-NA-
Goat4NA-NA-NA-
Suni4NA-NA-NA-
Donkey3NA-NA-NA-
Impala3NA-NA-NA-
Bloodmeal-Positive Tsetse FliesT. godfreyiT. congolense⁋T. brucei sl
% (95% CI)p- Value% (95% CI)p- Value% (95% CI)p- Value
Bovidae1420.70 (−0.69–2.10)0.6894.93 (−1.33–8.53)0.345NA-
Suidae 1341.49 (−0.59–3.57)0.5356.72 (−2.42–11.01)0.0602.24 (−0.30–4.78)0.043
Cercopithecidae62NA-NA-NA-
Hominidae26NA-NA-NA-
Elephantidae5NA-NA-NA-
Equidae3NA-NA-NA-
Warthog 1210.83 (−0.81–2.46)0.8287.44 (2.70–12.18)0.0332.48 (−0.33–5.29)0.031
Cattle791.27 (−1.25–3.79)0.8063.80 (−0.51–8.11)0.994NA-
Baboon62NA-NA-NA-
Sheep40NA-2.50 (−2.56–7.56)0.785NA-
Human26NA-NA-NA-
Red River Hog 137.69 (−9.07–9.07)0.046NA-NA-
Buffalo8NA-NA-NA-
Elephant5NA-NA-NA-
Bushbuck4NA-NA-NA-
Goat4NA-NA-NA-
Suni 4NA-75.00 (4.56–154.56)0.0004NA-
Donkey3NA-NA-NA-
Impala3NA-NA-NA-
T. congolense comprising of both the Kilifi and the Savannah strains. ‡ Significant (p < 0.05). NA: Small sample size, or too few number or absence of infection cases.
Publisher’s Note: MDPI stays neutral with regard to jurisdictional claims in published maps and institutional affiliations.

