
Strategies and Patterns of Codon Bias in Molluscum Contagiosum Virus

 ,
,
Abstract
:1. Introduction
2. Results
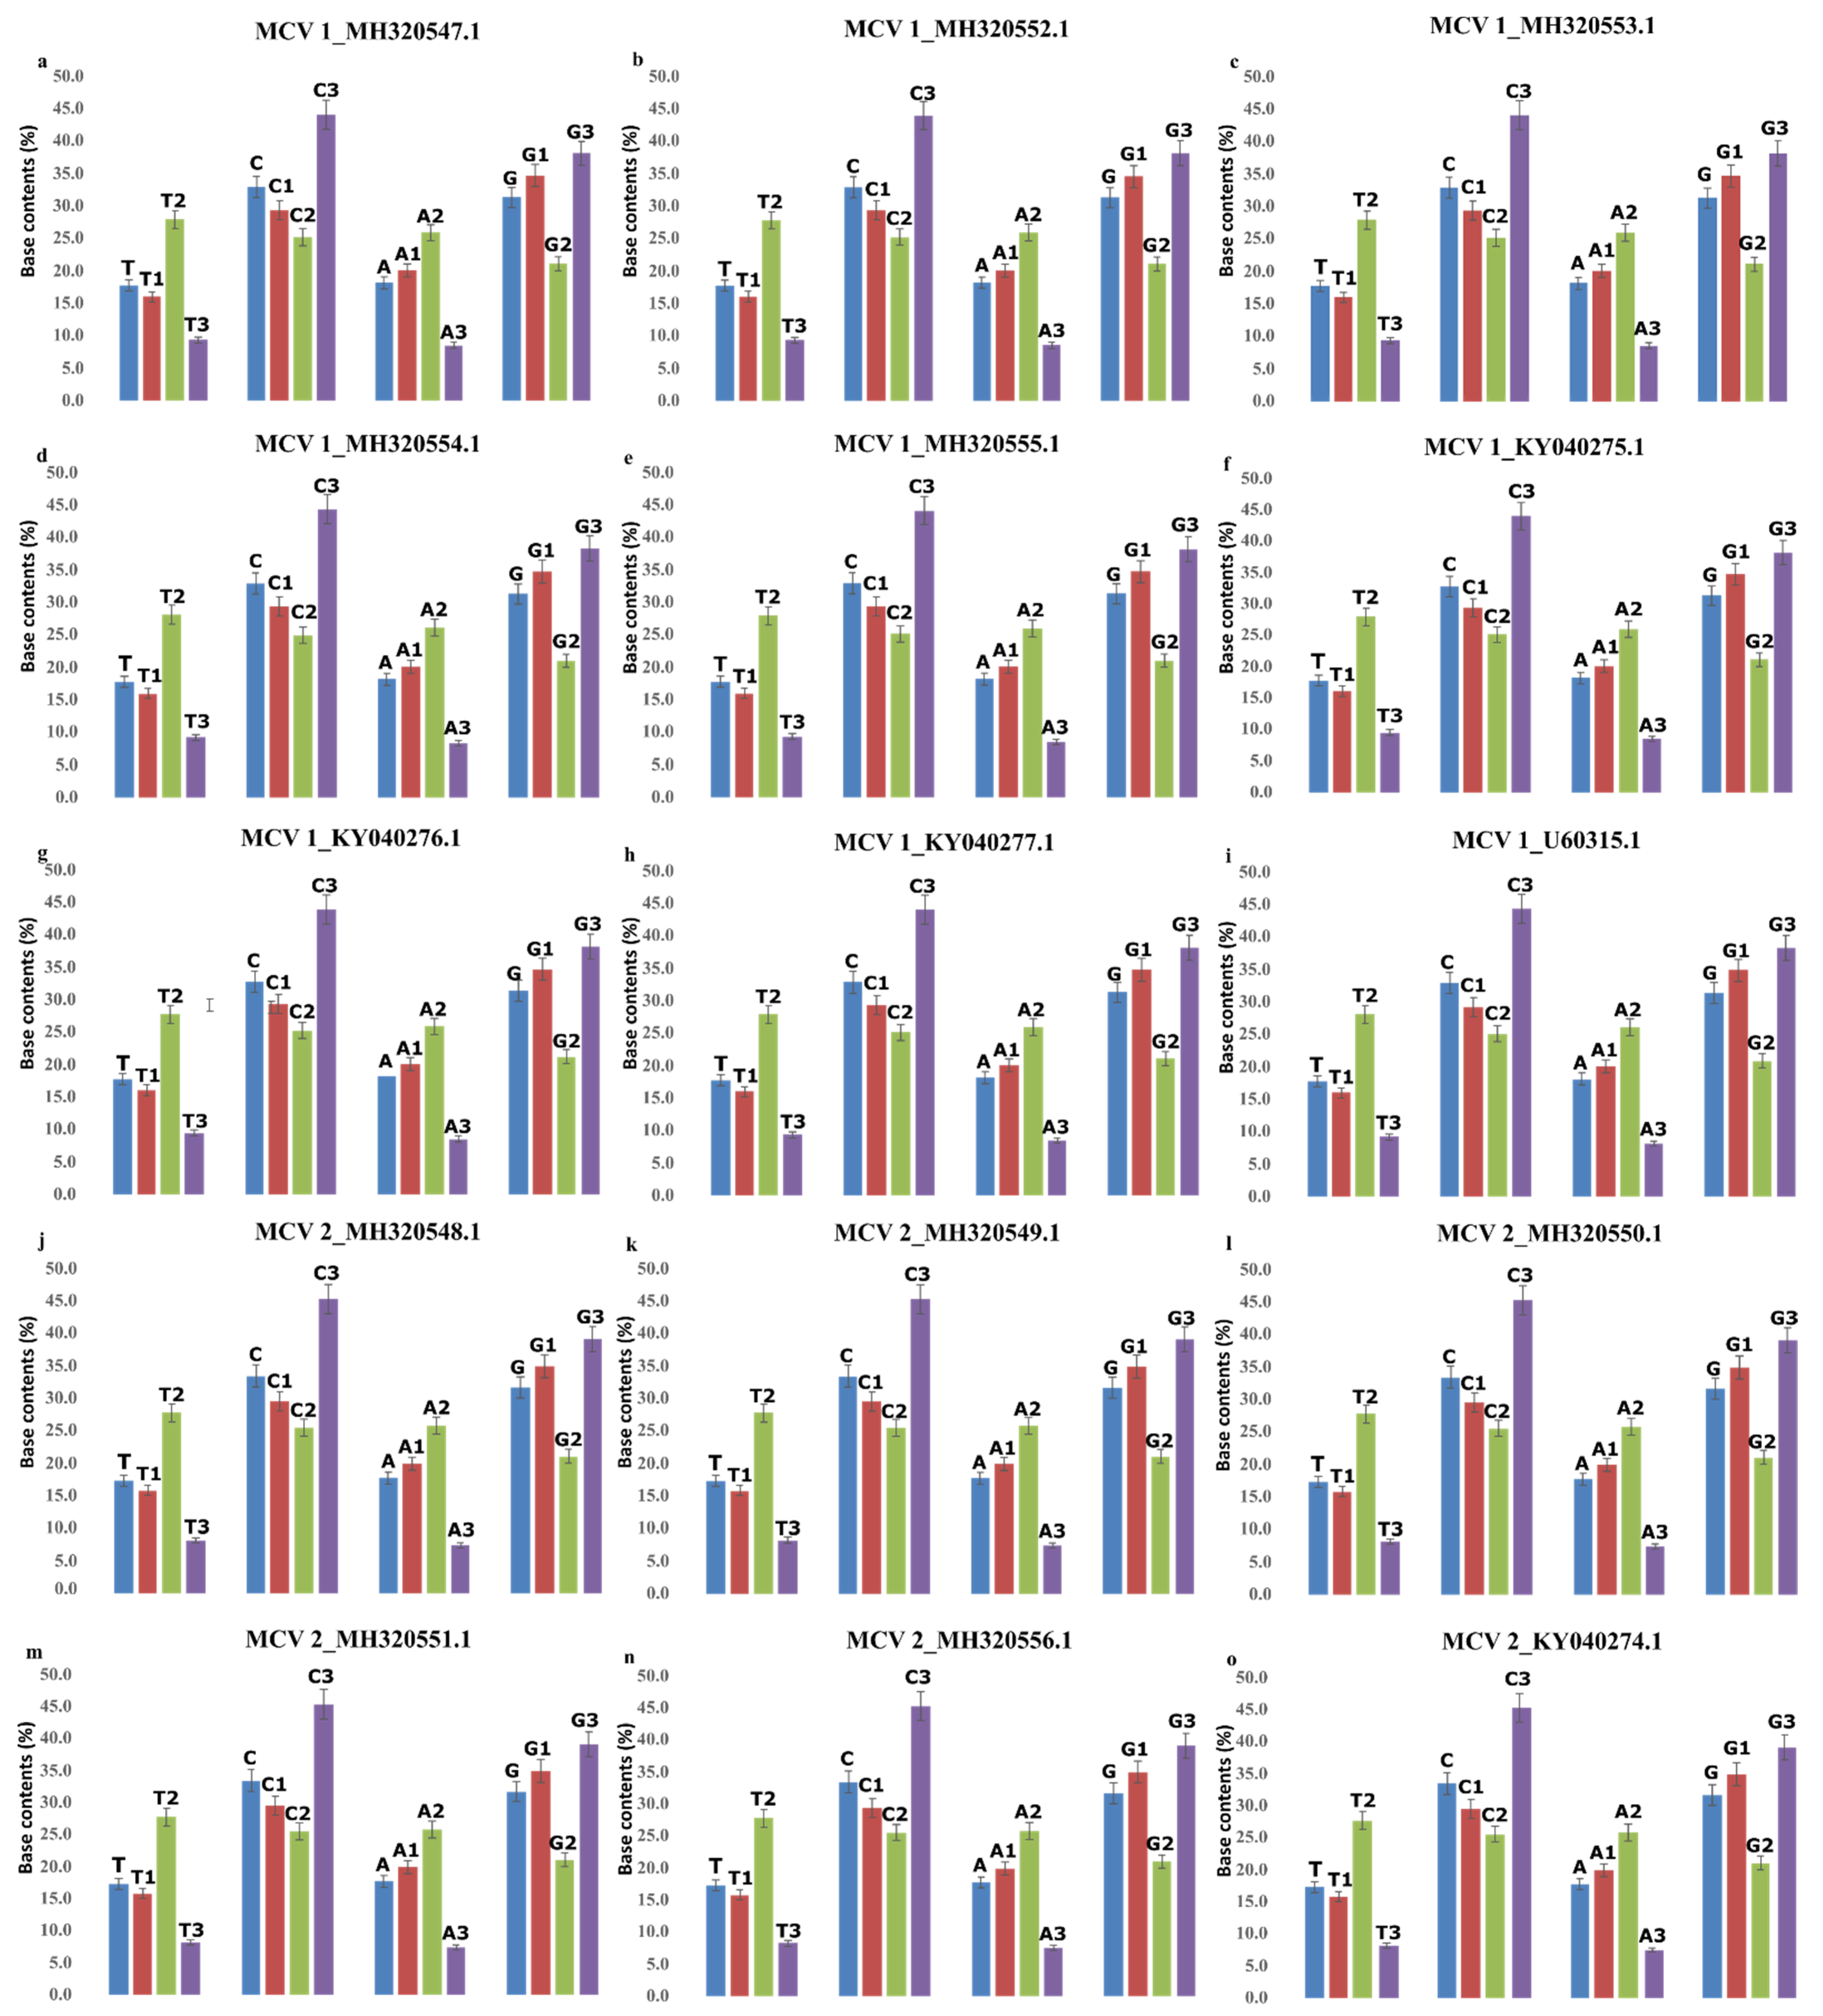
2.1. Effect of Base Compositional Constraints on SCUB
2.2. Relative Magnitude of Selection versus Mutation
2.3. Over-Represented and Under-Represented Codons
2.4. Major Factors Influencing SCUB
3. Discussion
4. Conclusions
5. Materials and Methods
5.1. Data Retrieval
5.2. Relative Synonymous Codon Usage
5.3. Dinucleotide Analysis
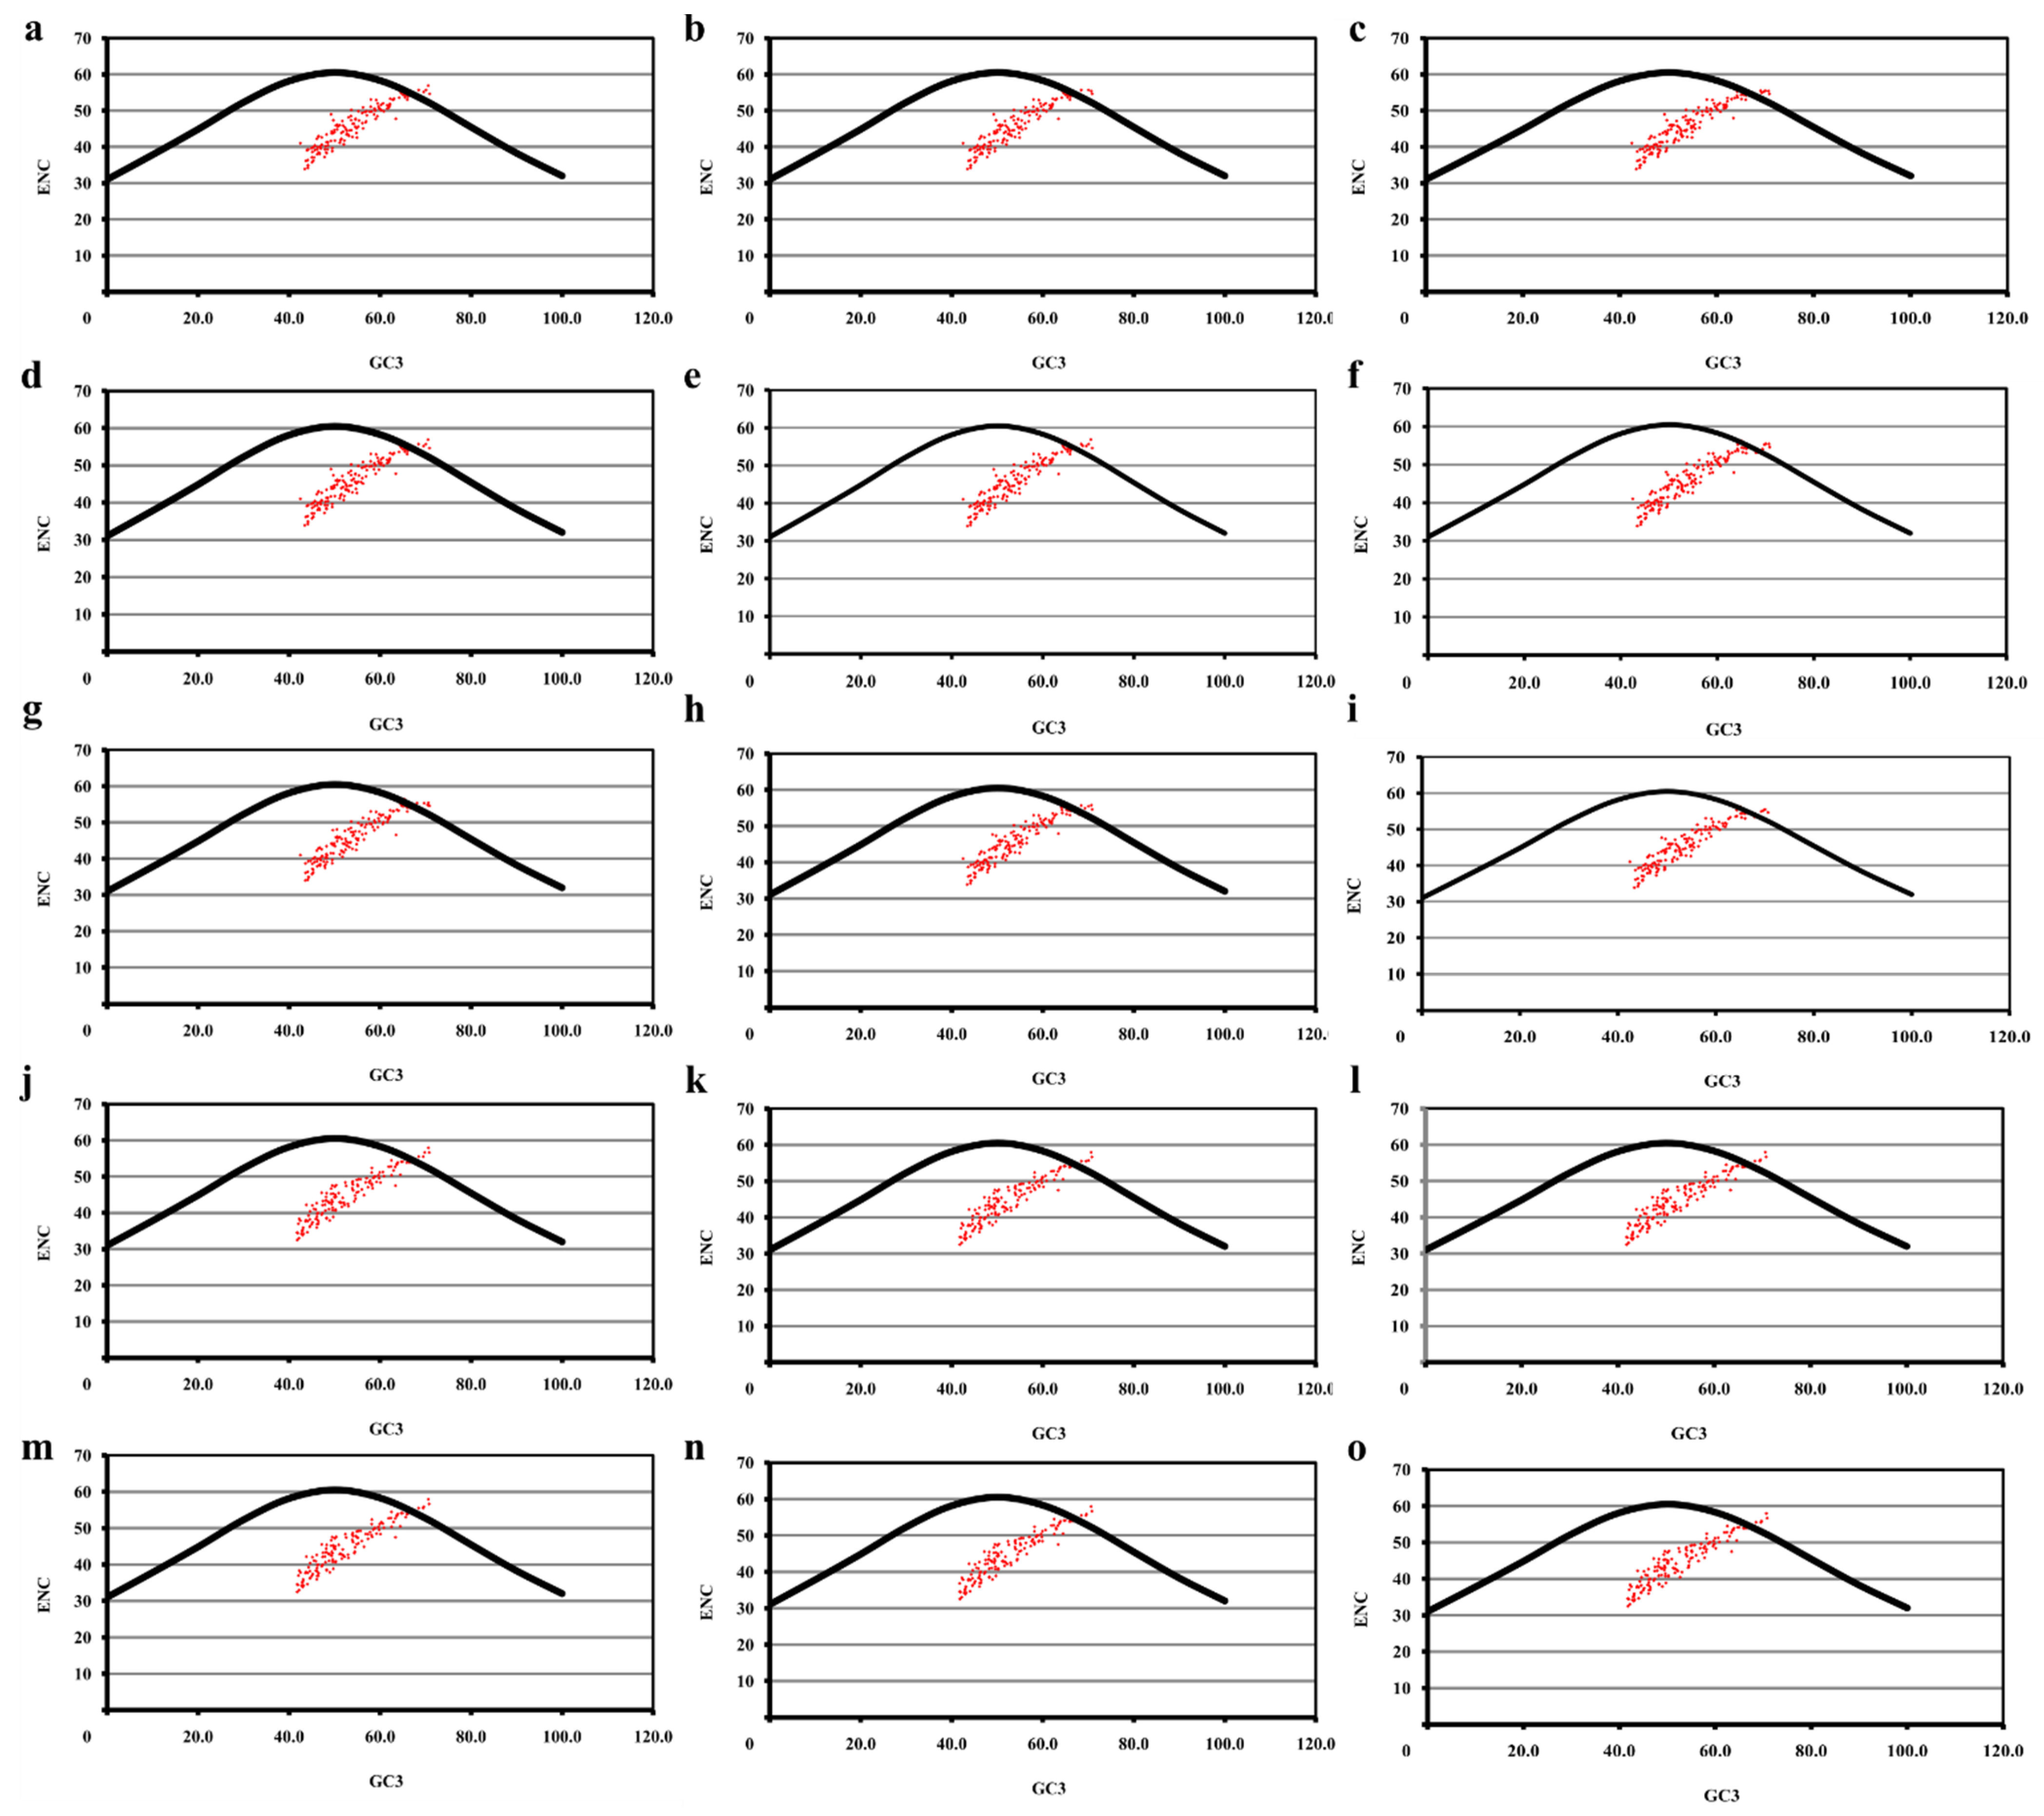
5.4. ENC vs. GC3 Plot
5.5. Neutrality Plot
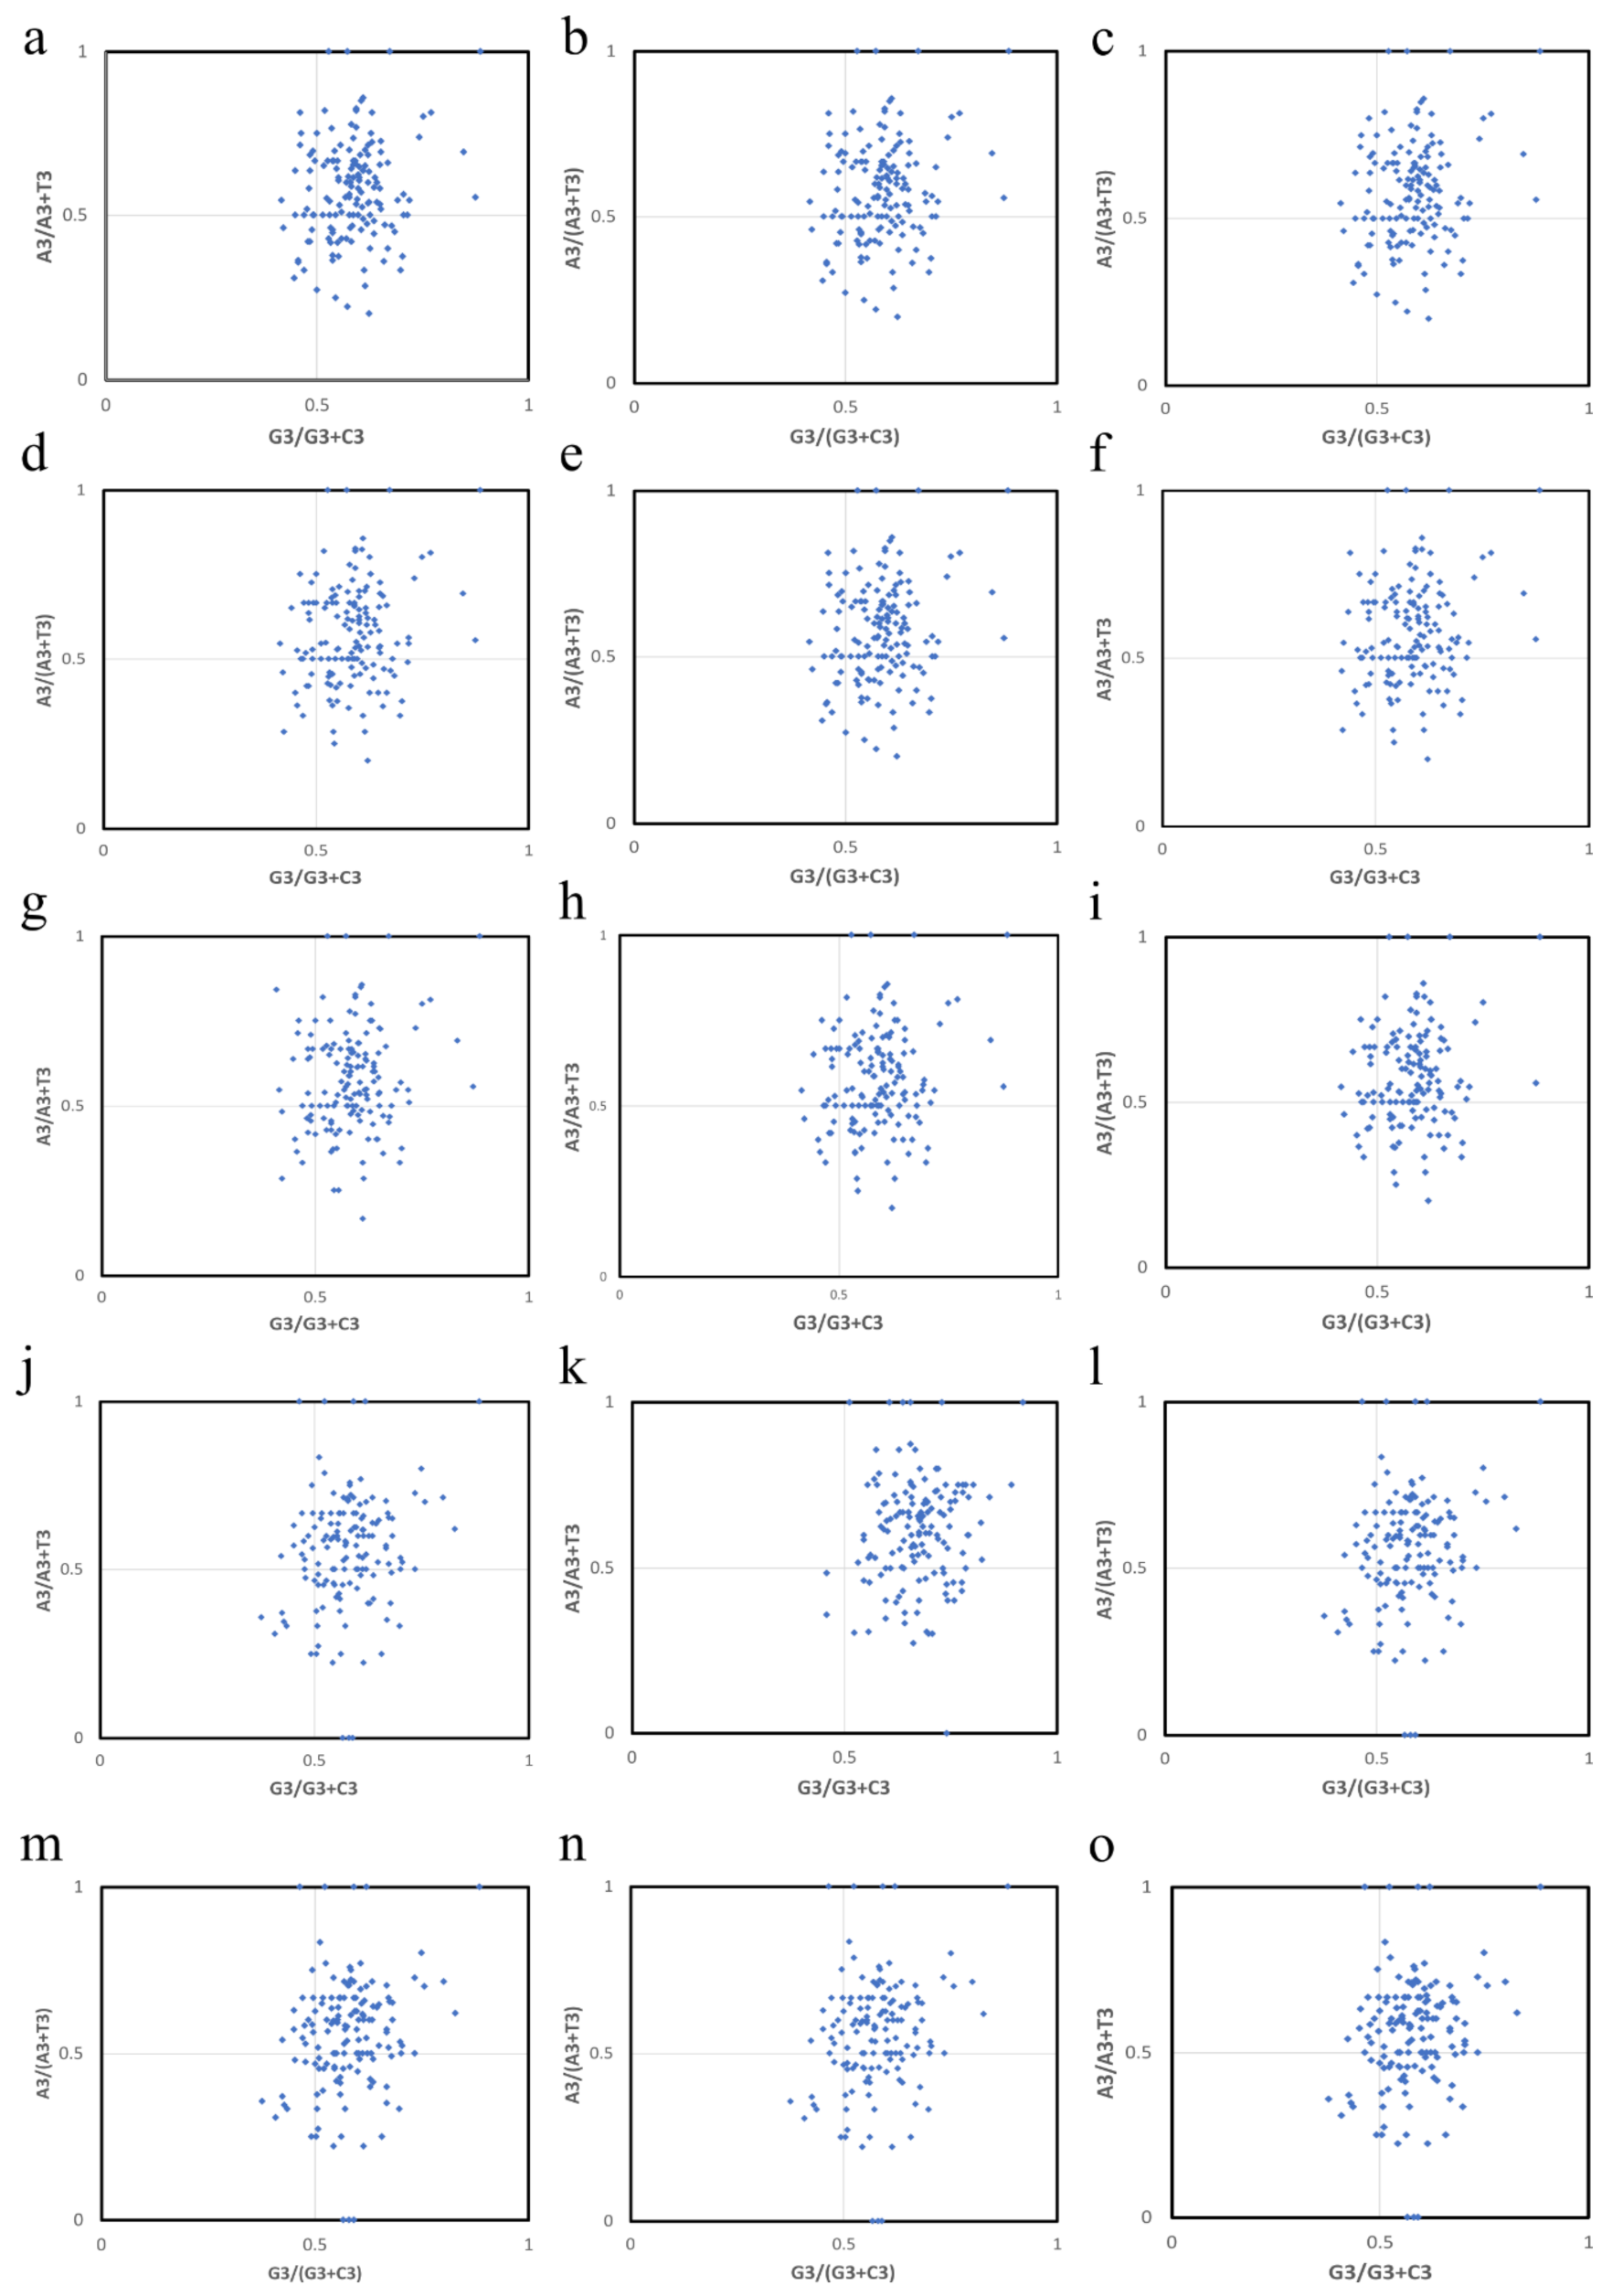
5.6. Parity Rule 2 Plot
5.7. Correspondence Analysis
5.8. Cluster Analysis
5.9. Statistical Analysis and the Softwares Used
Supplementary Materials
Author Contributions
Funding
Institutional Review Board Statement
Informed Consent Statement
Data Availability Statement
Acknowledgments
Conflicts of Interest
References
- Hershberg, R.; Petrov, D.A. Selection on codon bias. Annu. Rev. Genet. 2008, 42, 287–299. [Google Scholar] [CrossRef] [PubMed] [Green Version]
- Plotkin, J.B.; Kudla, G. Synonymous but not the same: The causes and consequences of codon bias. Nat. Rev. Genet. 2011, 12, 32–42. [Google Scholar] [CrossRef] [PubMed] [Green Version]
- Supek, F. The Code of Silence: Widespread Associations between Synonymous Codon Biases and Gene Function. J. Mol. Evol. 2016, 82, 65–73. [Google Scholar] [CrossRef] [Green Version]
- Grantham, R.; Gautier, C.; Gouy, M.; Mercier, R.; Pave, A. Codon catalog usage and the genome hypothesis. Nucleic Acids Res. 1980, 8, 197. [Google Scholar] [CrossRef]
- LaBella, A.L.; Opulente, D.A.; Steenwyk, J.L.; Hittinger, C.T.; Rokas, A. Variation and selection on codon usage bias across an entire subphylum. PLoS Genet. 2019, 15, e1008304. [Google Scholar] [CrossRef] [Green Version]
- Karumathil, S.; Raveendran, N.T.; Ganesh, D.; Kumar Ns, S.; Nair, R.R.; Dirisala, V.R. Evolution of Synonymous Codon Usage Bias in West African and Central African Strains of Monkeypox Virus. Evol. Bioinform. Online 2018, 14, 1176934318761368. [Google Scholar] [CrossRef] [Green Version]
- Novoa, E.M.; Ribas de Pouplana, L. Speeding with control: Codon usage, tRNAs, and ribosomes. Trends Genet. 2012, 28, 574–581. [Google Scholar] [CrossRef]
- Shabalina, S.A.; Spiridonov, N.A.; Kashina, A. Sounds of silence: Synonymous nucleotides as a key to biological regulation and complexity. Nucleic Acids Res. 2013, 41, 2073–2094. [Google Scholar] [CrossRef] [Green Version]
- Kumar, N.; Bera, B.C.; Greenbaum, B.D.; Bhatia, S.; Sood, R.; Selvaraj, P.; Anand, T.; Tripathi, B.N.; Virmani, N. Revelation of Influencing Factors in Overall Codon Usage Bias of Equine Influenza Viruses. PLoS ONE 2016, 11, e0154376. [Google Scholar] [CrossRef] [PubMed] [Green Version]
- Novoa, E.M.; Jungreis, I.; Jaillon, O.; Kellis, M. Elucidation of Codon Usage Signatures across the Domains of Life. Mol. Biol. Evol. 2019, 36, 2328–2339. [Google Scholar] [CrossRef] [PubMed] [Green Version]
- Hu, J.; Zhao, X.; Zhang, Z.; Yu, J. Compositional dynamics of guanine and cytosine content in prokaryotic genomes. Res. Microbiol. 2007, 158, 363–370. [Google Scholar] [CrossRef]
- Palidwor, G.A.; Perkins, T.J.; Xia, X. A general model of codon bias due to GC mutational bias. PLoS ONE 2010, 5, e13431. [Google Scholar] [CrossRef] [PubMed]
- Gajbhiye, S.; Patra, P.K.; Yadav, M.K. New insights into the factors affecting synonymous codon usage in human infecting Plasmodium species. Acta Trop. 2017, 176, 29–33. [Google Scholar] [CrossRef]
- Liu, X.Y.; Li, Y.; Ji, K.K.; Zhu, J.; Ling, P.; Zhou, T.; Fan, L.Y.; Xie, S.Q. Genome-wide codon usage pattern analysis reveals the correlation between codon usage bias and gene expression in Cuscuta australis. Genomics 2020, 112, 2695–2702. [Google Scholar] [CrossRef]
- Im, E.H.; Choi, S.S. Synonymous Codon Usage Controls Various Molecular Aspects. Genomics Inform. 2017, 15, 123–127. [Google Scholar] [CrossRef] [PubMed] [Green Version]
- Komar, A.A. The Yin and Yang of codon usage. Hum. Mol. Genet. 2016, 25, R77–R85. [Google Scholar] [CrossRef] [PubMed]
- Boel, G.; Letso, R.; Neely, H.; Price, W.N.; Wong, K.H.; Su, M.; Luff, J.; Valecha, M.; Everett, J.K.; Acton, T.B.; et al. Codon influence on protein expression in E. coli correlates with mRNA levels. Nature 2016, 529, 358–363. [Google Scholar] [CrossRef] [Green Version]
- Hanson, G.; Coller, J. Codon optimality, bias and usage in translation and mRNA decay. Nat. Rev. Mol. Cell Biol. 2018, 19, 20–30. [Google Scholar] [CrossRef]
- Komar, A.A. Synonymous Codon Usage-a Guide for Co-Translational Protein Folding in the Cell. Mol. Biol. 2019, 53, 777–790. [Google Scholar] [CrossRef]
- Komar, A.A. Silent SNPs: Impact on gene function and phenotype. Pharmacogenomics 2007, 8, 1075–1080. [Google Scholar] [CrossRef]
- Behura, S.K.; Severson, D.W. Comparative analysis of codon usage bias and codon context patterns between dipteran and hymenopteran sequenced genomes. PLoS ONE 2012, 7, e43111. [Google Scholar] [CrossRef] [Green Version]
- Marais, G.; Mouchiroud, D.; Duret, L. Does recombination improve selection on codon usage? Lessons from nematode and fly complete genomes. Proc. Natl. Acad. Sci. USA 2001, 98, 5688–5692. [Google Scholar] [CrossRef] [Green Version]
- Duret, L.; Mouchiroud, D. Expression pattern and, surprisingly, gene length shape codon usage in Caenorhabditis, Drosophila, and Arabidopsis. Proc. Natl. Acad. Sci. USA 1999, 96, 4482–4487. [Google Scholar] [CrossRef] [Green Version]
- Eyre-Walker, A. Synonymous codon bias is related to gene length in Escherichia coli: Selection for translational accuracy? Mol. Biol. Evol. 1996, 13, 864–872. [Google Scholar] [CrossRef] [PubMed] [Green Version]
- Dittmar, K.A.; Goodenbour, J.M.; Pan, T. Tissue-specific differences in human transfer RNA expression. PLoS Genet. 2006, 2, e221. [Google Scholar] [CrossRef] [PubMed]
- Goodarzi, H.; Torabi, N.; Najafabadi, H.S.; Archetti, M. Amino acid and codon usage profiles: Adaptive changes in the frequency of amino acids and codons. Gene 2008, 407, 30–41. [Google Scholar] [CrossRef] [PubMed]
- Sharp, P.M.; Tuohy, T.M.; Mosurski, K.R. Codon usage in yeast: Cluster analysis clearly differentiates highly and lowly expressed genes. Nucleic Acids Res. 1986, 14, 5125–5143. [Google Scholar] [CrossRef] [PubMed]
- Chen, S.L.; Lee, W.; Hottes, A.K.; Shapiro, L.; McAdams, H.H. Codon usage between genomes is constrained by genome-wide mutational processes. Proc. Natl. Acad. Sci. USA 2004, 101, 3480–3485. [Google Scholar] [CrossRef] [PubMed] [Green Version]
- Sharp, P.M.; Emery, L.R.; Zeng, K. Forces that influence the evolution of codon bias. Philos. Trans. R. Soc. B Biol. Sci. 2010, 365, 1203–1212. [Google Scholar] [CrossRef] [PubMed] [Green Version]
- Lassalle, F.; Perian, S.; Bataillon, T.; Nesme, X.; Duret, L.; Daubin, V. GC-Content evolution in bacterial genomes: The biased gene conversion hypothesis expands. PLoS Genet. 2015, 11, e1004941. [Google Scholar] [CrossRef] [Green Version]
- Long, H.; Sung, W.; Kucukyildirim, S.; Williams, E.; Miller, S.F.; Guo, W.; Patterson, C.; Gregory, C.; Strauss, C.; Stone, C.; et al. Evolutionary determinants of genome-wide nucleotide composition. Nat. Ecol. Evol. 2018, 2, 237–240. [Google Scholar] [CrossRef] [PubMed]
- Barbhuiya, P.A.; Uddin, A.; Chakraborty, S. Compositional properties and codon usage of TP73 gene family. Gene 2019, 683, 159–168. [Google Scholar] [CrossRef]
- Jenkins, G.M.; Holmes, E.C. The extent of codon usage bias in human RNA viruses and its evolutionary origin. Virus Res. 2003, 92, 1–7. [Google Scholar] [CrossRef]
- Bachtrog, D. Reduced selection for codon usage bias in Drosophila miranda. J. Mol. Evol. 2007, 64, 586–590. [Google Scholar] [CrossRef] [PubMed]
- Novembre, J.A. Accounting for background nucleotide composition when measuring codon usage bias. Mol. Biol. Evol. 2002, 19, 1390–1394. [Google Scholar] [CrossRef] [PubMed] [Green Version]
- Rahman, S.; Kosakovsky Pond, S.L.; Webb, A.; Hey, J. Weak selection on synonymous codons substantially inflates dN/dS estimates in bacteria. Proc. Natl. Acad. Sci. USA 2021, 118, e2023575118. [Google Scholar] [CrossRef]
- Ohta, T.; Gillespie, J.H. Development of Neutral and Nearly Neutral Theories. Theor. Popul. Biol. 1996, 49, 128–142. [Google Scholar] [CrossRef] [Green Version]
- Kreitman, M.; Antezana, M. The Population and Evolutionary Genetis of Codon Bias; Camridge University Press: Cambridge, UK, 2000. [Google Scholar]
- Villarreal, L.P. Are viruses alive? Sci. Am. 2004, 291, 100–105. [Google Scholar] [CrossRef]
- Rouse, B.T.; Sehrawat, S. Immunity and immunopathology to viruses: What decides the outcome? Nat. Rev. Immunol. 2010, 10, 514–526. [Google Scholar] [CrossRef]
- Bahir, I.; Fromer, M.; Prat, Y.; Linial, M. Viral adaptation to host: A proteome-based analysis of codon usage and amino acid preferences. Mol. Syst. Biol. 2009, 5, 311. [Google Scholar] [CrossRef]
- Khandia, R.; Singhal, S.; Kumar, U.; Ansari, A.; Tiwari, R.; Dhama, K.; Das, J.; Munjal, A.; Singh, R.K. Analysis of Nipah Virus Codon Usage and Adaptation to Hosts. Front. Microbiol. 2019, 10, 886. [Google Scholar] [CrossRef] [PubMed] [Green Version]
- Chen, Z.; Boon, S.S.; Wang, M.H.; Chan, R.W.Y.; Chan, P.K.S. Genomic and evolutionary comparison between SARS-CoV-2 and other human coronaviruses. J. Virol. Methods 2021, 289, 114032. [Google Scholar] [CrossRef] [PubMed]
- Chakraborty, S.; Deb, B.; Barbhuiya, P.A.; Uddin, A. Analysis of codon usage patterns and influencing factors in Nipah virus. Virus Res. 2019, 263, 129–138. [Google Scholar] [CrossRef]
- Senkevich, T.G.; Bugert, J.J.; Sisler, J.R.; Koonin, E.V.; Darai, G.; Moss, B. Genome sequence of a human tumorigenic poxvirus: Prediction of specific host response-evasion genes. Science 1996, 273, 813–816. [Google Scholar] [CrossRef] [PubMed]
- Edwards, S.; Boffa, M.J.; Janier, M.; Calzavara-Pinton, P.; Rovati, C.; Salavastru, C.M.; Rongioletti, F.; Wollenberg, A.; Butacu, A.I.; Skerlev, M.; et al. 2020 European guideline on the management of genital molluscum contagiosum. J. Eur. Acad. Dermatol. Venereol. 2021, 35, 17–26. [Google Scholar] [CrossRef] [PubMed]
- Meza-Romero, R.; Navarrete-Dechent, C.; Downey, C. Molluscum contagiosum: An update and review of new perspectives in etiology, diagnosis, and treatment. Clin. Cosmet. Investig. Dermatol. 2019, 12, 373–381. [Google Scholar] [CrossRef] [PubMed] [Green Version]
- Bateman, T. A Practical Synopsis of Cutaneous Diseases; Longman Hurst Rees Orme & Brown: London, UK, 1814. [Google Scholar]
- Juliusberg, M. Zue kenntnis des virus des Molluscum contagiosum. Dtsch. Med. Wochenschr. 1905, 31, 1598–1599. [Google Scholar] [CrossRef] [Green Version]
- Tyring, S.K. Molluscum contagiosum: The importance of early diagnosis and treatment. Am. J. Obstet. Gynecol. 2003, 189 (Suppl. 3), S12–S16. [Google Scholar] [CrossRef]
- Basdag, H.; Rainer, B.M.; Cohen, B.A. Molluscum contagiosum: To treat or not to treat? Experience with 170 children in an outpatient clinic setting in the northeastern United States. Pediatr. Dermatol. 2015, 32, 353–357. [Google Scholar] [CrossRef]
- Robinson, G.; Townsend, S.; Jahnke, M.N. Molluscum contagiosum: Review and update on clinical presentation, diagnosis, risk, prevention and treatment. Curr. Dermatol. Rep. 2020, 9, 83–92. [Google Scholar] [CrossRef]
- Badri, T.; Gandhi, G.R. Molluscum contagiosum. Dermatol. Online J. 2003, 9. [Google Scholar] [CrossRef]
- Bugert, J.J. Molluscum Contagiosum Virus; Elsevier-Academic Press: London/Oxford, UK, 2008. [Google Scholar]
- Senkevich, T.G.; Koonin, E.V.; Bugert, J.J.; Darai, G.; Moss, B. The genome of molluscum contagiosum virus: Analysis and comparison with other poxviruses. Virology 1997, 233, 19–42. [Google Scholar] [CrossRef] [PubMed] [Green Version]
- Barett, J.W.; McFadden, G. Origin and Evolution of Poxviruses; Domingo, E., Parrish, C.R., Holland, J.J., Eds.; Academic Press (Elsevier): London, UK, 2008. [Google Scholar]
- Shisler, J.L. Immune evasion strategies of molluscum contagiosum virus. Adv. Virus Res. 2015, 92, 201–252. [Google Scholar] [PubMed]
- Porter, C.D.; Blake, N.W.; Cream, J.J.; Archard, L.C. Molluscum Contagiosum Virus; Springer: Dordrecht, The Netherlands, 1992. [Google Scholar]
- Liu, Q.; Xue, Q. Comparative studies on codon usage pattern of chloroplasts and their host nuclear genes in four plant species. J. Genet. 2005, 84, 55–62. [Google Scholar] [CrossRef]
- Butt, A.M.; Nasrullah, I.; Qamar, R.; Tong, Y. Evolution of codon usage in Zika virus genomes is host and vector specific. Emerg. Microbes Infect. 2016, 5, 1–14. [Google Scholar] [CrossRef] [PubMed] [Green Version]
- Chakraborty, S.; Yengkhom, S.; Uddin, A. Analysis of codon usage bias of chloroplast genes in Oryza species : Codon usage of chloroplast genes in Oryza species. Planta 2020, 252, 67. [Google Scholar] [CrossRef]
- Simon, D.; Cristina, J.; Musto, H. Nucleotide Composition and Codon Usage across Viruses and Their Respective Hosts. Front. Microbiol. 2021, 12, 646300. [Google Scholar] [CrossRef]
- Ata, G.; Wang, H.; Bai, H.; Yao, X.; Tao, S. Edging on Mutational Bias, Induced Natural Selection From Host and Natural Reservoirs Predominates Codon Usage Evolution in Hantaan Virus. Front. Microbiol. 2021, 12, 699788. [Google Scholar] [CrossRef] [PubMed]
- Chaney, J.L.; Clark, P.L. Roles for Synonymous Codon Usage in Protein Biogenesis. Annu. Rev. Biophys. 2015, 44, 143–166. [Google Scholar] [CrossRef]
- Dutta, R.; Buragohain, L.; Borah, P. Analysis of codon usage of severe acute respiratory syndrome corona virus 2 (SARS-CoV-2) and its adaptability in dog. Virus Res. 2020, 288, 198113. [Google Scholar] [CrossRef]
- Karumathil, S.; Dirisala, V.R.; Srinadh, U.; Nikhil, V.; Kumar, N.S.; Nair, R.R. Evolution of Synonymous Codon Usage in the Mitogenomes of Certain Species of Bilaterian Lineage with Special Reference to Chaetognatha. Bioinform. Biol. Insights 2016, 10, 167–184. [Google Scholar] [CrossRef] [PubMed] [Green Version]
- Liu, Y.S.; Zhou, J.H.; Chen, H.T.; Ma, L.N.; Pejsak, Z.; Ding, Y.Z.; Zhang, J. The characteristics of the synonymous codon usage in enterovirus 71 virus and the effects of host on the virus in codon usage pattern. Infect. Genet. Evol. 2011, 11, 1168–1173. [Google Scholar] [CrossRef] [PubMed]
- Comeron, J.M.; Aguade, M. An evaluation of measures of synonymous codon usage bias. J. Mol. Evol. 1998, 47, 268–274. [Google Scholar] [CrossRef] [PubMed]
- Kim, H.; Cho, M.; Son, H.S. Comparative analysis of codon usage patterns in Rift Valley fever virus. Genet. Mol. Biol. 2020, 43, e20190240. [Google Scholar] [CrossRef] [PubMed]
- Roychoudhury, S.; Mukherjee, D. A detailed comparative analysis on the overall codon usage pattern in herpesviruses. Virus Res. 2010, 148, 31–43. [Google Scholar] [CrossRef]
- Wright, F. The ’effective number of codons’ used in a gene. Gene 1990, 87, 23–29. [Google Scholar] [CrossRef]
- Zhang, L.P.; Cai, Y.Y.; Yu, D.N.; Storey, K.B.; Zhang, J.Y. Gene characteristics of the complete mitochondrial genomes of Paratoxodera polyacantha and Toxodera hauseri (Mantodea: Toxoderidae). PeerJ 2018, 6, e4595. [Google Scholar] [CrossRef] [PubMed] [Green Version]
- Shackelton, L.A.; Parrish, C.R.; Holmes, E.C. Evolutionary basis of codon usage and nucleotide composition bias in vertebrate DNA viruses. J. Mol. Evol. 2006, 62, 551–563. [Google Scholar] [CrossRef]
- Breslauer, K.J.; Frank, R.; Blocker, H.; Marky, L.A. Predicting DNA duplex stability from the base sequence. Proc. Natl. Acad. Sci. USA 1986, 83, 3746–3750. [Google Scholar] [CrossRef] [Green Version]
- Beutler, E.; Gelbart, T.; Han, J.H.; Koziol, J.A.; Beutler, B. Evolution of the genome and the genetic code: Selection at the dinucleotide level by methylation and polyribonucleotide cleavage. Proc. Natl. Acad. Sci. USA 1989, 86, 192–196. [Google Scholar] [CrossRef] [Green Version]
- Kunec, D.; Osterrieder, N. Codon Pair Bias Is a Direct Consequence of Dinucleotide Bias. Cell Rep. 2016, 14, 55–67. [Google Scholar] [CrossRef] [PubMed] [Green Version]
- Akashi, H. Synonymous codon usage in Drosophila melanogaster: Natural selection and translational accuracy. Genetics 1994, 136, 927–935. [Google Scholar] [CrossRef] [PubMed]
- Ikemura, T. Codon usage and tRNA content in unicellular and multicellular organisms. Mol. Biol. Evol. 1985, 2, 13–34. [Google Scholar] [PubMed]
- Carlini, D.B.; Stephan, W. In vivo introduction of unpreferred synonymous codons into the Drosophila Adh gene results in reduced levels of ADH protein. Genetics 2003, 163, 239–243. [Google Scholar] [CrossRef]
- Robinson, M.; Lilley, R.; Little, S.; Emtage, J.S.; Yarranton, G.; Stephens, P.; Millican, A.; Eaton, M.; Humphreys, G. Codon usage can affect efficiency of translation of genes in Escherichia coli. Nucleic Acids Res. 1984, 12, 6663–6671. [Google Scholar] [CrossRef] [Green Version]
- Sanchez, G.; Bosch, A.; Gomez-Mariano, G.; Domingo, E.; Pinto, R.M. Evidence for quasispecies distributions in the human hepatitis A virus genome. Virology 2003, 315, 34–42. [Google Scholar] [CrossRef] [Green Version]
- Vetsigian, K.; Goldenfeld, N. Genome rhetoric and the emergence of compositional bias. Proc. Natl. Acad. Sci. USA 2009, 106, 215–220. [Google Scholar] [CrossRef] [PubMed] [Green Version]
- Vicario, S.; Moriyama, E.N.; Powell, J.R. Codon usage in twelve species of Drosophila. BMC Evol. Biol. 2007, 7, 226. [Google Scholar] [CrossRef] [Green Version]
- Pinto, R.M.; Aragones, L.; Costafreda, M.I.; Ribes, E.; Bosch, A. Codon usage and replicative strategies of hepatitis A virus. Virus Res. 2007, 127, 158–163. [Google Scholar] [CrossRef]
- Kazazian, H.H., Jr. Mobile elements: Drivers of genome evolution. Science 2004, 303, 1626–1632. [Google Scholar] [CrossRef] [Green Version]
- Edgar, R.C. MUSCLE: Multiple sequence alignment with high accuracy and high throughput. Nucleic Acids Res. 2004, 32, 1792–1797. [Google Scholar] [CrossRef] [PubMed] [Green Version]
- Kumar, S.; Stecher, G.; Li, M.; Knyaz, C.; Tamura, K. MEGA X: Molecular Evolutionary Genetics Analysis across Computing Platforms. Mol. Biol. Evol. 2018, 35, 1547–1549. [Google Scholar] [CrossRef]
- Gupta, S.K.; Bhattacharyya, T.K.; Ghosh, T.C. Synonymous codon usage in Lactococcus lactis: Mutational bias versus translational selection. J. Biomol. Struct. Dyn. 2004, 21, 527–536. [Google Scholar] [CrossRef] [PubMed]
- Nair, R.R.; Nandhini, M.B.; Sethuraman, T.; Doss, G. Mutational pressure dictates synonymous codon usage in freshwater unicellular alpha-cyanobacterial descendant Paulinella chromatophora and beta-cyanobacterium Synechococcus elongatus PCC6301. Springerplus 2013, 2, 492. [Google Scholar] [CrossRef] [Green Version]
- Sueoka, N. Directional mutation pressure and neutral molecular evolution. Proc. Natl. Acad. Sci. USA 1988, 85, 2653–2657. [Google Scholar] [CrossRef] [Green Version]
- Sueoka, N. Intrastrand parity rules of DNA base composition and usage biases of synonymous codons. J. Mol. Evol. 1995, 40, 318–325. [Google Scholar] [CrossRef] [PubMed]
- Yu, X.; Liu, J.; Li, H.; Liu, B.; Zhao, B.; Ning, Z. Comprehensive analysis of synonymous codon usage patterns and influencing factors of porcine epidemic diarrhea virus. Arch. Virol. 2021, 166, 157–165. [Google Scholar] [CrossRef] [PubMed]
- Chen, Y.; Shi, Y.; Deng, H.; Gu, T.; Xu, J.; Ou, J.; Jiang, Z.; Jiao, Y.; Zou, T.; Wang, C. Characterization of the porcine epidemic diarrhea virus codon usage bias. Infect. Genet. Evol. 2014, 28, 95–100. [Google Scholar] [CrossRef] [PubMed]
- Sueoka, N. Translation-coupled violation of Parity Rule 2 in human genes is not the cause of heterogeneity of the DNA G+C content of third codon position. Gene 1999, 238, 53–58. [Google Scholar] [CrossRef]
- Greencare, M.J. Theory and Applications of Correspondence Analysis; Academic Press: London, UK, 1984. [Google Scholar]
- Perriere, G.; Thioulouse, J. Use and misuse of correspondence analysis in codon usage studies. Nucleic Acids Res. 2002, 30, 4548–4555. [Google Scholar] [CrossRef] [PubMed] [Green Version]
- Sablok, G.; Nayak, K.C.; Vazquez, F.; Tatarinova, T.V. Synonymous codon usage, GC(3), and evolutionary patterns across plastomes of three pooid model species: Emerging grass genome models for monocots. Mol. Biotechnol. 2011, 49, 116–128. [Google Scholar] [CrossRef] [PubMed]
- Xia, X. DAMBE7: New and Improved Tools for Data Analysis in Molecular Biology and Evolution. Mol. Biol. Evol. 2018, 35, 1550–1552. [Google Scholar] [CrossRef] [PubMed] [Green Version]
- Hammer, Q.; Harper, D.A.T.; Ryan, P.D. PAST: Palaeontological statistics software package for education and data analysis. Palaeontol. Electron. 2001, 4, 1–9. [Google Scholar]


| Strains | Nucleotides | A3 | T3 | G3 | C3 | GC3 |
|---|---|---|---|---|---|---|
| MH320547.1 (MCV 1) | A | 0.1604 | 0.0926 | −0.3491 * | −0.0331 | −0.1356 |
| T | 0.2537 * | 0.5157 * | −0.3821 * | −0.3033 * | −0.3885 * | |
| G | −0.1000 | −0.1767 * | 0.5699 * | −0.1169 | 0.1308 | |
| C | −0.4028 * | −0.5017 * | 0.2485 * | 0.4974 * | 0.4751 * | |
| GC | −0.2550 * | −0.3593 * | 0.4949 * | 0.1779 * | 0.3117 * | |
| MH320552.1 (MCV 1) | A | 0.1736 * | 0.1081 | −0.3694 * | −0.0368 | −0.1476 |
| T | 0.2449 * | 0.5064 * | −0.3947 * | −0.2822 * | −0.3801 * | |
| G | −0.0990 | −0.1780 * | 0.5822 * | −0.1244 | 0.1295 | |
| C | −0.3965 * | −0.4999 * | 0.2527 * | 0.4807 * | 0.4699 * | |
| GC | −0.2488 * | −0.3543 * | 0.5070 * | 0.1592 | 0.3046 * | |
| MH320553.1 (MCV 1) | A | 0.1660 * | 0.0940 | −0.3628 * | −0.0289 | −0.1384 |
| T | 0.2566 * | 0.5195 * | −0.4011 * | −0.2958 * | −0.3921 * | |
| G | −0.0988 | −0.1794 * | 0.5730 * | −0.1207 | 0.1305 | |
| C | −0.4042 * | −0.5021 * | 0.2691 * | 0.4865 * | 0.4762 * | |
| GC | −0.2566 * | −0.3609 * | 0.5122 * | 0.1693 * | 0.3126 * | |
| MH320554.1 (MCV 1) | A | 0.1552 | 0.1029 | −0.3594 * | −0.0252 | −0.1297 |
| T | 0.2714 * | 0.5201 * | −0.4094 * | −0.2966 * | −0.4028 * | |
| G | −0.1032 | −0.1827 * | 0.5837 * | −0.1227 | 0.1313 | |
| C | −0.4048 * | −0.5195 * | 0.2492 * | 0.4985 * | 0.4814 * | |
| GC | −0.2527 * | −0.3673 * | 0.5103 * | 0.1658 * | 0.3101 * | |
| MH320555.1 (MCV 1) | A | 0.1658 * | 0.0921 | −0.3558 * | −0.0271 | −0.1348 |
| T | 0.2545 * | 0.5172 * | −0.4041 * | −0.2928 * | −0.3910 * | |
| G | −0.1031 | −0.1827 * | 0.5755 * | −0.1164 | 0.1346 | |
| C | −0.4064 * | −0.5042 * | 0.2694 * | 0.4876 * | 0.4768 * | |
| GC | −0.2606 * | −0.3633 * | 0.5153 * | 0.1710 * | 0.3154 * | |
| KY040275.1 (MCV 1) | A | 0.1703 * | 0.0996 | −0.3683 * | −0.0318 | −0.1419 |
| T | 0.2555 * | 0.5285 * | −0.3915 * | −0.3024 * | −0.3953 * | |
| G | −0.0968 | −0.1763 * | 0.5635 * | −0.1171 | 0.1277 | |
| C | −0.4203 * | −0.5211 * | 0.2786 * | 0.5014 * | 0.4943 * | |
| GC | −0.2657 * | −0.3724 * | 0.5131 * | 0.1813 * | 0.3237 * | |
| KY040276.1 (MCV 1) | A | 0.1727 * | 0.1026 | −0.3726 * | −0.0357 | −0.1441 |
| T | 0.2622 * | 0.5162 * | −0.4032 * | −0.2969 * | −0.3981 * | |
| G | −0.0939 | −0.1687 * | 0.5673 * | −0.1213 | 0.1242 | |
| C | −0.4041 * | −0.5081 * | 0.2739 * | 0.4861 * | 0.4778 * | |
| GC | −0.2613 * | −0.3638 * | 0.5191 * | 0.1736 * | 0.3182 * | |
| KY040277.1 (MCV 1) | A | 0.1473 | 0.0913 | −0.3624 * | −0.0117 | −0.1184 |
| T | 0.3011 * | 0.5498 * | −0.4200 * | −0.3347 * | −0.4341 * | |
| G | −0.0797 | −0.1580 | 0.5582 * | −0.1386 | 0.1068 | |
| C | −0.4010 * | −0.5109 * | 0.2610 * | 0.4856 * | 0.4740 * | |
| GC | −0.2469 * | −0.3594 * | 0.5061 * | 0.1603 | 0.3026 * | |
| U60315.1 (MCV 1) | A | 0.0936 | 0.0630 | −0.3678 * | 0.0505 | −0.0686 |
| T | 0.3099 * | 0.5491 * | −0.4489 * | −0.3349 * | −0.4462 * | |
| G | −0.0664 | −0.1345 | 0.5817 * | −0.1701 * | 0.0932 | |
| C | −0.3953 * | −0.5171 * | 0.2658 * | 0.4852 * | 0.4757 * | |
| GC | −0.2314 * | −0.3414 * | 0.5288 * | 0.1344 | 0.2914 * | |
| MH320548.1 (MCV 2) | A | 0.0950 | 0.0608 | −0.3298 * | 0.0060 | −0.0775 |
| T | 0.2825 * | 0.5001 * | −0.4136 * | −0.3005 * | −0.4072 * | |
| G | −0.0615 | −0.1576 | 0.5516 * | −0.1242 | 0.1174 | |
| C | −0.3580 * | −0.3924 * | 0.2072 * | 0.4224 * | 0.3836 * | |
| GC | −0.2178 * | −0.3177 * | 0.4759 * | 0.1525 | 0.2764 * | |
| MH320549.1(MCV 2) | A | 0.0920 | 0.0603 | −0.3328 * | 0.0078 | −0.0744 |
| T | 0.2815 * | 0.5072 * | −0.4193 * | −0.3040 * | −0.4110 * | |
| G | −0.0603 | −0.1627 | 0.5520 * | −0.1178 | 0.1191 | |
| C | −0.3547 * | −0.3926 * | 0.2128 * | 0.4191 * | 0.3820 * | |
| GC | −0.2167 * | −0.3251 * | 0.4814 * | 0.1577 | 0.2798 * | |
| MH320550.1 (MCV 2) | A | 0.0934 | 0.0611 | −0.3329 * | 0.0102 | −0.0761 |
| T | 0.2799 * | 0.4978 * | −0.4169 * | −0.2942 * | −0.4036 * | |
| G | −0.0574 | −0.1538 | 0.5518 * | −0.1305 | 0.1125 | |
| C | −0.3524 * | −0.3901 * | 0.2057 * | 0.4170 * | 0.3794 * | |
| GC | −0.2150 * | −0.3160 * | 0.4778 * | 0.1465 | 0.2729 * | |
| MH320551.1 (MCV 2) | A | 0.0935 | 0.0595 | −0.3317 * | 0.0101 | −0.0759 |
| T | 0.2820 * | 0.4971 * | −0.4043 * | −0.3042 * | −0.4064 * | |
| G | −0.0535 | −0.1489 | 0.5435 * | −0.1279 | 0.1099 | |
| C | −0.3564 * | −0.3900 * | 0.2058 * | 0.4182 * | 0.3818 * | |
| GC | −0.2132 * | −0.3162 * | 0.4715 * | 0.1535 | 0.2757 * | |
| MH320556.1 (MCV 2) | A | 0.0966 | 0.0807 | −0.3305 * | 0.0061 | −0.0773 |
| T | 0.2825 * | 0.5075 * | −0.4165 * | −0.3041 * | −0.4089 * | |
| G | −0.0578 | −0.1764 * | 0.5481 * | −0.1235 | 0.1143 | |
| C | −0.3574 * | −0.3973 * | 0.2066 * | 0.4209 * | 0.3822 * | |
| GC | −0.2183 * | −0.3417 * | 0.4778 * | 0.1552 | 0.2778 * | |
| KY040274.1 (MCV 2) | A | 0.0978 | 0.0639 | −0.3291 * | 0.0016 | −0.0809 |
| T | 0.2813 * | 0.5002 * | −0.4067 * | −0.3019 * | −0.4054 * | |
| G | −0.0595 | −0.1554 | 0.5480 * | −0.1264 | 0.1148 | |
| C | −0.3520 * | −0.3928 * | 0.1966 * | 0.4247 * | 0.3810 * | |
| GC | −0.2186 * | −0.3223 * | 0.4705 * | 0.1569 | 0.2785 * |
| Subtype | Accession ID | Genes |
|---|---|---|
| MCV 1 | MH320547.1 | 150R, 133L, 054L, 148R, 132L, 152R |
| MCV 1 | MH320552.1 | 133L, 054L, 148R, 132L, 152R |
| MCV 1 | MH320553.1 | 150R, 133L, 054L, 148R, 132L, 152R |
| MCV 1 | MH320554.1 | 133L, 148R, 152R, 156R, 055R |
| MCV 1 | MH320555.1 | 150R, 133L, 054L, 148R, 132L, 152R, 156R |
| MCV 1 | KY040275.1 | 133L, 055R, 152.1R, 148R, 132L |
| MCV 1 | KY040276.1 | 133L, 152.1R, 148R,132L,054L |
| MCV 1 | KY040277.1 | 133L, 152.1R, 148R, 132L, 054L |
| MCV 1 | U60315.1 | 133L, 055R, 148R, 132L |
| MCV 2 | MH320548.1 | 152.1R, 148R, 151L, 012L, 010R |
| MCV 2 | MH320549.1 | 151L, 010R, 148R,145.1R, 152.1R, 012L |
| MCV 2 | MH320550.1 | 151L, 010R, 148R, 152.1R, 012L |
| MCV 2 | MH320551.1 | 151L, 010R, 148R, 152.1R, 012L |
| MCV 2 | MH320556.1 | 151L, 010R, 148R, 152.1R, 012L |
| MCV 2 | KY040274.1 | 151L, 010R, 148R, 152.1R, 012L |
| Codon | AA | 1 | 2 | 3 | 4 | 5 | 6 | 7 | 8 | 9 | 10 | 11 | 12 | 13 | 14 | 15 |
|---|---|---|---|---|---|---|---|---|---|---|---|---|---|---|---|---|
| GCT | A | 0.322 | 0.317 | 0.322 | 0.314 | 0.327 | 0.313 | 0.315 | 0.314 | 0.311 | 0.287 | 0.287 | 0.286 | 0.287 | 0.284 | 0.282 |
| GCG | A | 2.052 | 2.080 | 2.058 | 2.076 | 2.060 | 2.067 | 2.075 | 2.072 | 2.079 | 2.160 | 2.161 | 2.161 | 2.157 | 2.158 | 2.167 |
| GCC | A | 1.098 | 1.085 | 1.093 | 1.112 | 1.093 | 1.098 | 1.086 | 1.094 | 1.105 | 1.128 | 1.128 | 1.126 | 1.131 | 1.131 | 1.125 |
| GCA | A | 0.528 | 0.519 | 0.528 | 0.498 | 0.520 | 0.521 | 0.524 | 0.520 | 0.505 | 0.425 | 0.425 | 0.427 | 0.425 | 0.427 | 0.425 |
| TGT | C | 0.377 | 0.372 | 0.372 | 0.353 | 0.357 | 0.379 | 0.386 | 0.376 | 0.365 | 0.330 | 0.328 | 0.329 | 0.330 | 0.325 | 0.329 |
| TGC | C | 1.623 | 1.628 | 1.628 | 1.647 | 1.643 | 1.621 | 1.614 | 1.624 | 1.635 | 1.670 | 1.672 | 1.671 | 1.670 | 1.675 | 1.671 |
| GAT | D | 0.244 | 0.242 | 0.244 | 0.241 | 0.246 | 0.241 | 0.250 | 0.240 | 0.236 | 0.220 | 0.219 | 0.219 | 0.219 | 0.216 | 0.218 |
| GAC | D | 1.756 | 1.758 | 1.756 | 1.759 | 1.754 | 1.759 | 1.750 | 1.760 | 1.764 | 1.780 | 1.781 | 1.781 | 1.781 | 1.784 | 1.782 |
| GAG | E | 1.601 | 1.601 | 1.602 | 1.609 | 1.601 | 1.606 | 1.604 | 1.607 | 1.615 | 1.637 | 1.637 | 1.637 | 1.639 | 1.633 | 1.637 |
| GAA | E | 0.399 | 0.399 | 0.398 | 0.391 | 0.399 | 0.394 | 0.396 | 0.393 | 0.385 | 0.363 | 0.363 | 0.363 | 0.361 | 0.367 | 0.363 |
| TTT | F | 0.458 | 0.458 | 0.454 | 0.448 | 0.447 | 0.468 | 0.465 | 0.466 | 0.456 | 0.382 | 0.383 | 0.382 | 0.383 | 0.385 | 0.382 |
| TTC | F | 1.542 | 1.542 | 1.546 | 1.552 | 1.553 | 1.532 | 1.535 | 1.534 | 1.544 | 1.618 | 1.617 | 1.618 | 1.617 | 1.615 | 1.618 |
| GGT | G | 0.298 | 0.302 | 0.299 | 0.289 | 0.291 | 0.307 | 0.308 | 0.307 | 0.304 | 0.271 | 0.271 | 0.271 | 0.271 | 0.272 | 0.272 |
| GGG | G | 0.914 | 0.913 | 0.921 | 0.915 | 0.914 | 0.917 | 0.911 | 0.929 | 0.906 | 0.835 | 0.833 | 0.835 | 0.833 | 0.832 | 0.837 |
| GGC | G | 2.243 | 2.246 | 2.240 | 2.259 | 2.246 | 2.231 | 2.234 | 2.233 | 2.247 | 2.366 | 2.366 | 2.366 | 2.369 | 2.369 | 2.363 |
| GGA | G | 0.545 | 0.539 | 0.540 | 0.537 | 0.549 | 0.545 | 0.547 | 0.532 | 0.543 | 0.527 | 0.529 | 0.527 | 0.527 | 0.527 | 0.529 |
| CAC | H | 1.722 | 1.724 | 1.722 | 1.718 | 1.718 | 1.718 | 1.724 | 1.721 | 1.720 | 1.774 | 1.774 | 1.770 | 1.774 | 1.773 | 1.774 |
| CAT | H | 0.278 | 0.276 | 0.278 | 0.282 | 0.282 | 0.282 | 0.276 | 0.279 | 0.280 | 0.226 | 0.226 | 0.230 | 0.226 | 0.227 | 0.226 |
| ATT | I | 0.561 | 0.563 | 0.563 | 0.556 | 0.557 | 0.561 | 0.565 | 0.564 | 0.563 | 0.426 | 0.425 | 0.426 | 0.426 | 0.440 | 0.426 |
| ATA | I | 0.156 | 0.160 | 0.158 | 0.160 | 0.158 | 0.162 | 0.155 | 0.154 | 0.147 | 0.151 | 0.152 | 0.151 | 0.151 | 0.155 | 0.151 |
| ATC | I | 2.283 | 2.277 | 2.280 | 2.284 | 2.285 | 2.276 | 2.280 | 2.282 | 2.290 | 2.424 | 2.423 | 2.424 | 2.424 | 2.404 | 2.424 |
| AAA | K | 0.336 | 0.338 | 0.330 | 0.309 | 0.327 | 0.323 | 0.325 | 0.321 | 0.309 | 0.265 | 0.263 | 0.264 | 0.264 | 0.265 | 0.262 |
| AAG | K | 1.664 | 1.662 | 1.670 | 1.691 | 1.673 | 1.677 | 1.675 | 1.679 | 1.691 | 1.735 | 1.737 | 1.736 | 1.736 | 1.735 | 1.738 |
| CTA | L | 0.298 | 0.294 | 0.297 | 0.282 | 0.295 | 0.293 | 0.302 | 0.296 | 0.285 | 0.232 | 0.232 | 0.233 | 0.233 | 0.235 | 0.232 |
| CTC | L | 1.175 | 1.173 | 1.175 | 1.173 | 1.177 | 1.176 | 1.167 | 1.176 | 1.177 | 1.208 | 1.203 | 1.208 | 1.203 | 1.206 | 1.210 |
| CTG | L | 2.193 | 2.204 | 2.195 | 2.219 | 2.199 | 2.197 | 2.194 | 2.198 | 2.217 | 2.285 | 2.287 | 2.284 | 2.291 | 2.282 | 2.284 |
| CTT | L | 0.334 | 0.329 | 0.333 | 0.327 | 0.329 | 0.335 | 0.337 | 0.330 | 0.321 | 0.275 | 0.277 | 0.274 | 0.273 | 0.277 | 0.275 |
| TTA | L | 0.265 | 0.272 | 0.265 | 0.268 | 0.265 | 0.265 | 0.267 | 0.261 | 0.269 | 0.301 | 0.301 | 0.301 | 0.302 | 0.302 | 0.301 |
| TTG | L | 1.735 | 1.728 | 1.735 | 1.732 | 1.735 | 1.735 | 1.733 | 1.739 | 1.731 | 1.699 | 1.699 | 1.699 | 1.698 | 1.698 | 1.699 |
| AAC | N | 1.740 | 1.739 | 1.738 | 1.740 | 1.736 | 1.742 | 1.734 | 1.744 | 1.749 | 1.775 | 1.774 | 1.775 | 1.775 | 1.781 | 1.775 |
| AAT | N | 0.260 | 0.261 | 0.262 | 0.260 | 0.264 | 0.258 | 0.266 | 0.256 | 0.251 | 0.225 | 0.226 | 0.225 | 0.225 | 0.219 | 0.225 |
| CCA | P | 0.379 | 0.384 | 0.378 | 0.365 | 0.370 | 0.387 | 0.377 | 0.388 | 0.375 | 0.331 | 0.332 | 0.329 | 0.331 | 0.339 | 0.328 |
| CCC | P | 1.525 | 1.530 | 1.534 | 1.545 | 1.530 | 1.525 | 1.518 | 1.528 | 1.541 | 1.591 | 1.595 | 1.595 | 1.592 | 1.597 | 1.605 |
| CCT | P | 0.482 | 0.485 | 0.483 | 0.489 | 0.487 | 0.496 | 0.483 | 0.484 | 0.487 | 0.456 | 0.453 | 0.457 | 0.450 | 0.465 | 0.456 |
| CCG | P | 1.614 | 1.601 | 1.604 | 1.602 | 1.612 | 1.593 | 1.622 | 1.601 | 1.596 | 1.622 | 1.621 | 1.620 | 1.627 | 1.599 | 1.611 |
| CAA | Q | 0.435 | 0.439 | 0.437 | 0.429 | 0.432 | 0.438 | 0.434 | 0.439 | 0.422 | 0.390 | 0.393 | 0.391 | 0.390 | 0.393 | 0.389 |
| CAG | Q | 1.565 | 1.561 | 1.563 | 1.571 | 1.568 | 1.562 | 1.566 | 1.561 | 1.578 | 1.610 | 1.607 | 1.609 | 1.610 | 1.607 | 1.611 |
| AGA | R | 0.725 | 0.709 | 0.723 | 0.694 | 0.729 | 0.707 | 0.718 | 0.726 | 0.699 | 0.759 | 0.757 | 0.761 | 0.763 | 0.742 | 0.742 |
| AGG | R | 1.275 | 1.291 | 1.277 | 1.306 | 1.271 | 1.293 | 1.282 | 1.274 | 1.301 | 1.241 | 1.243 | 1.239 | 1.237 | 1.258 | 1.258 |
| CGA | R | 0.261 | 0.272 | 0.265 | 0.255 | 0.267 | 0.267 | 0.261 | 0.265 | 0.250 | 0.244 | 0.243 | 0.244 | 0.242 | 0.244 | 0.252 |
| CGC | R | 2.837 | 2.825 | 2.834 | 2.868 | 2.841 | 2.826 | 2.831 | 2.830 | 2.877 | 2.889 | 2.892 | 2.887 | 2.895 | 2.879 | 2.882 |
| CGG | R | 0.543 | 0.537 | 0.543 | 0.531 | 0.537 | 0.537 | 0.551 | 0.534 | 0.532 | 0.547 | 0.545 | 0.550 | 0.543 | 0.547 | 0.546 |
| CGT | R | 0.359 | 0.366 | 0.358 | 0.346 | 0.354 | 0.371 | 0.357 | 0.371 | 0.340 | 0.320 | 0.320 | 0.320 | 0.320 | 0.330 | 0.319 |
| AGC | S | 1.670 | 1.660 | 1.671 | 1.670 | 1.670 | 1.669 | 1.674 | 1.667 | 1.679 | 1.721 | 1.722 | 1.721 | 1.721 | 1.707 | 1.721 |
| AGT | S | 0.330 | 0.340 | 0.329 | 0.330 | 0.330 | 0.331 | 0.326 | 0.333 | 0.321 | 0.279 | 0.278 | 0.279 | 0.279 | 0.293 | 0.279 |
| TCA | S | 0.220 | 0.230 | 0.220 | 0.230 | 0.220 | 0.236 | 0.228 | 0.228 | 0.217 | 0.188 | 0.190 | 0.188 | 0.189 | 0.201 | 0.187 |
| TCC | S | 1.489 | 1.462 | 1.487 | 1.493 | 1.487 | 1.486 | 1.490 | 1.484 | 1.510 | 1.534 | 1.536 | 1.532 | 1.533 | 1.526 | 1.542 |
| TCG | S | 1.752 | 1.758 | 1.750 | 1.753 | 1.750 | 1.751 | 1.747 | 1.755 | 1.743 | 1.798 | 1.794 | 1.800 | 1.797 | 1.794 | 1.789 |
| TCT | S | 0.539 | 0.550 | 0.543 | 0.525 | 0.544 | 0.528 | 0.535 | 0.533 | 0.530 | 0.480 | 0.480 | 0.480 | 0.481 | 0.479 | 0.481 |
| ACC | T | 1.161 | 1.157 | 1.163 | 1.167 | 1.162 | 1.156 | 1.148 | 1.157 | 1.186 | 1.221 | 1.218 | 1.225 | 1.213 | 1.217 | 1.221 |
| ACA | T | 0.519 | 0.523 | 0.516 | 0.512 | 0.509 | 0.534 | 0.533 | 0.529 | 0.494 | 0.425 | 0.425 | 0.422 | 0.426 | 0.440 | 0.437 |
| ACG | T | 1.902 | 1.907 | 1.905 | 1.911 | 1.909 | 1.900 | 1.897 | 1.900 | 1.919 | 1.955 | 1.957 | 1.957 | 1.962 | 1.948 | 1.948 |
| ACT | T | 0.418 | 0.413 | 0.416 | 0.410 | 0.420 | 0.410 | 0.421 | 0.413 | 0.401 | 0.399 | 0.400 | 0.396 | 0.400 | 0.395 | 0.395 |
| GTT | V | 0.293 | 0.290 | 0.291 | 0.280 | 0.286 | 0.301 | 0.312 | 0.293 | 0.278 | 0.259 | 0.263 | 0.258 | 0.259 | 0.259 | 0.258 |
| GTG | V | 2.328 | 2.339 | 2.329 | 2.336 | 2.328 | 2.335 | 2.332 | 2.339 | 2.345 | 2.453 | 2.453 | 2.451 | 2.456 | 2.462 | 2.455 |
| GTC | V | 1.066 | 1.061 | 1.065 | 1.070 | 1.070 | 1.056 | 1.042 | 1.053 | 1.070 | 1.049 | 1.046 | 1.049 | 1.051 | 1.047 | 1.046 |
| GTA | V | 0.313 | 0.310 | 0.314 | 0.314 | 0.316 | 0.307 | 0.314 | 0.315 | 0.307 | 0.240 | 0.239 | 0.242 | 0.234 | 0.232 | 0.241 |
| TAC | Y | 1.777 | 1.778 | 1.777 | 1.773 | 1.777 | 1.773 | 1.774 | 1.774 | 1.775 | 1.786 | 1.788 | 1.786 | 1.786 | 1.789 | 1.788 |
| TAT | Y | 0.223 | 0.222 | 0.223 | 0.227 | 0.223 | 0.227 | 0.226 | 0.226 | 0.225 | 0.214 | 0.212 | 0.214 | 0.214 | 0.211 | 0.212 |
| Codons | AA | 1 | 2 | 3 | 4 | 5 | 6 | 7 | 8 | 9 | 10 | 11 | 12 | 13 | 14 | 15 | |||||||||||||||
|---|---|---|---|---|---|---|---|---|---|---|---|---|---|---|---|---|---|---|---|---|---|---|---|---|---|---|---|---|---|---|---|
| + | − | + | − | + | − | + | − | + | − | + | − | + | − | + | − | + | − | + | − | + | − | + | − | + | − | + | − | + | − | ||
| GCT | A | 0.333 | 0.313 | 0.326 | 0.309 | 0.334 | 0.310 | 0.343 | 0.288 | 0.346 | 0.310 | 0.327 | 0.301 | 0.330 | 0.302 | 0.326 | 0.304 | 0.325 | 0.299 | 0.303 | 0.274 | 0.304 | 0.274 | 0.303 | 0.273 | 0.304 | 0.274 | 0.299 | 0.273 | 0.301 | 0.267 |
| GCG | A | 2.026 | 2.075 | 2.051 | 2.104 | 2.012 | 2.098 | 2.031 | 2.116 | 2.014 | 2.100 | 2.036 | 2.095 | 2.056 | 2.091 | 2.047 | 2.093 | 2.047 | 2.107 | 2.159 | 2.161 | 2.157 | 2.164 | 2.157 | 2.164 | 2.150 | 2.162 | 2.149 | 2.165 | 2.170 | 2.165 |
| GCC | A | 1.086 | 1.107 | 1.070 | 1.097 | 1.082 | 1.102 | 1.085 | 1.137 | 1.082 | 1.103 | 1.082 | 1.113 | 1.066 | 1.104 | 1.078 | 1.107 | 1.093 | 1.116 | 1.075 | 1.170 | 1.075 | 1.168 | 1.075 | 1.165 | 1.080 | 1.170 | 1.082 | 1.168 | 1.067 | 1.171 |
| GCA | A | 0.555 | 0.505 | 0.552 | 0.490 | 0.572 | 0.489 | 0.540 | 0.460 | 0.558 | 0.487 | 0.555 | 0.492 | 0.548 | 0.503 | 0.549 | 0.496 | 0.536 | 0.478 | 0.463 | 0.396 | 0.464 | 0.394 | 0.465 | 0.398 | 0.465 | 0.394 | 0.470 | 0.394 | 0.461 | 0.397 |
| TGT | C | 0.358 | 0.395 | 0.397 | 0.347 | 0.396 | 0.348 | 0.370 | 0.335 | 0.366 | 0.349 | 0.387 | 0.372 | 0.392 | 0.381 | 0.380 | 0.371 | 0.388 | 0.343 | 0.365 | 0.298 | 0.361 | 0.298 | 0.364 | 0.298 | 0.366 | 0.298 | 0.355 | 0.298 | 0.364 | 0.298 |
| TGC | C | 1.642 | 1.605 | 1.603 | 1.653 | 1.604 | 1.652 | 1.630 | 1.665 | 1.634 | 1.651 | 1.613 | 1.628 | 1.608 | 1.619 | 1.620 | 1.629 | 1.612 | 1.657 | 1.635 | 1.702 | 1.639 | 1.702 | 1.636 | 1.702 | 1.634 | 1.702 | 1.645 | 1.702 | 1.636 | 1.702 |
| GAT | D | 0.261 | 0.228 | 0.257 | 0.229 | 0.261 | 0.229 | 0.260 | 0.225 | 0.264 | 0.229 | 0.257 | 0.227 | 0.274 | 0.229 | 0.253 | 0.228 | 0.247 | 0.227 | 0.262 | 0.183 | 0.261 | 0.182 | 0.262 | 0.182 | 0.263 | 0.181 | 0.257 | 0.181 | 0.257 | 0.183 |
| GAC | D | 1.739 | 1.772 | 1.743 | 1.771 | 1.739 | 1.771 | 1.740 | 1.775 | 1.736 | 1.771 | 1.743 | 1.773 | 1.726 | 1.771 | 1.747 | 1.772 | 1.753 | 1.774 | 1.738 | 1.817 | 1.739 | 1.818 | 1.738 | 1.818 | 1.737 | 1.819 | 1.743 | 1.819 | 1.743 | 1.817 |
| GAG | E | 1.596 | 1.606 | 1.593 | 1.609 | 1.594 | 1.609 | 1.601 | 1.618 | 1.593 | 1.609 | 1.600 | 1.613 | 1.599 | 1.608 | 1.600 | 1.613 | 1.612 | 1.618 | 1.623 | 1.649 | 1.623 | 1.650 | 1.623 | 1.650 | 1.623 | 1.653 | 1.618 | 1.645 | 1.623 | 1.649 |
| GAA | E | 0.404 | 0.394 | 0.407 | 0.391 | 0.406 | 0.391 | 0.399 | 0.382 | 0.407 | 0.391 | 0.400 | 0.387 | 0.401 | 0.392 | 0.400 | 0.387 | 0.388 | 0.382 | 0.377 | 0.351 | 0.377 | 0.350 | 0.377 | 0.350 | 0.377 | 0.347 | 0.382 | 0.355 | 0.377 | 0.351 |
| TTT | F | 0.450 | 0.464 | 0.484 | 0.435 | 0.475 | 0.435 | 0.468 | 0.431 | 0.460 | 0.435 | 0.484 | 0.454 | 0.477 | 0.455 | 0.475 | 0.458 | 0.480 | 0.434 | 0.378 | 0.386 | 0.379 | 0.386 | 0.378 | 0.386 | 0.380 | 0.386 | 0.387 | 0.384 | 0.378 | 0.386 |
| TTC | F | 1.550 | 1.536 | 1.516 | 1.565 | 1.525 | 1.565 | 1.532 | 1.569 | 1.540 | 1.565 | 1.516 | 1.546 | 1.523 | 1.545 | 1.525 | 1.542 | 1.520 | 1.566 | 1.622 | 1.614 | 1.621 | 1.614 | 1.622 | 1.614 | 1.620 | 1.614 | 1.613 | 1.616 | 1.622 | 1.614 |
| GGT | G | 0.299 | 0.298 | 0.318 | 0.284 | 0.313 | 0.284 | 0.300 | 0.276 | 0.297 | 0.284 | 0.315 | 0.298 | 0.316 | 0.299 | 0.317 | 0.296 | 0.319 | 0.288 | 0.302 | 0.240 | 0.302 | 0.241 | 0.302 | 0.240 | 0.302 | 0.240 | 0.302 | 0.243 | 0.302 | 0.241 |
| GGG | G | 0.930 | 0.897 | 0.933 | 0.892 | 0.946 | 0.892 | 0.929 | 0.898 | 0.934 | 0.892 | 0.923 | 0.910 | 0.917 | 0.905 | 0.948 | 0.909 | 0.929 | 0.880 | 0.850 | 0.821 | 0.849 | 0.817 | 0.850 | 0.821 | 0.850 | 0.816 | 0.844 | 0.820 | 0.850 | 0.824 |
| GGC | G | 2.212 | 2.275 | 2.201 | 2.295 | 2.191 | 2.295 | 2.219 | 2.304 | 2.202 | 2.295 | 2.194 | 2.273 | 2.201 | 2.270 | 2.194 | 2.274 | 2.199 | 2.300 | 2.301 | 2.432 | 2.299 | 2.433 | 2.301 | 2.432 | 2.301 | 2.438 | 2.306 | 2.430 | 2.301 | 2.425 |
| GGA | G | 0.559 | 0.530 | 0.548 | 0.529 | 0.550 | 0.529 | 0.552 | 0.521 | 0.568 | 0.529 | 0.567 | 0.520 | 0.566 | 0.526 | 0.542 | 0.521 | 0.553 | 0.532 | 0.548 | 0.507 | 0.550 | 0.509 | 0.548 | 0.507 | 0.548 | 0.506 | 0.547 | 0.507 | 0.548 | 0.509 |
| CAC | H | 1.697 | 1.745 | 1.701 | 1.746 | 1.698 | 1.746 | 1.682 | 1.752 | 1.689 | 1.746 | 1.695 | 1.740 | 1.705 | 1.741 | 1.697 | 1.743 | 1.697 | 1.741 | 1.752 | 1.793 | 1.752 | 1.793 | 1.752 | 1.786 | 1.752 | 1.793 | 1.749 | 1.793 | 1.752 | 1.793 |
| CAT | H | 0.303 | 0.255 | 0.299 | 0.254 | 0.302 | 0.254 | 0.318 | 0.248 | 0.311 | 0.254 | 0.305 | 0.260 | 0.295 | 0.259 | 0.303 | 0.257 | 0.303 | 0.259 | 0.248 | 0.207 | 0.248 | 0.207 | 0.248 | 0.214 | 0.248 | 0.207 | 0.251 | 0.207 | 0.248 | 0.207 |
| ATT | I | 0.534 | 0.588 | 0.545 | 0.581 | 0.540 | 0.584 | 0.534 | 0.578 | 0.533 | 0.581 | 0.543 | 0.579 | 0.542 | 0.587 | 0.549 | 0.578 | 0.546 | 0.579 | 0.350 | 0.495 | 0.349 | 0.495 | 0.350 | 0.495 | 0.350 | 0.495 | 0.381 | 0.495 | 0.350 | 0.495 |
| ATA | I | 0.138 | 0.173 | 0.143 | 0.177 | 0.138 | 0.177 | 0.138 | 0.181 | 0.138 | 0.177 | 0.141 | 0.182 | 0.138 | 0.172 | 0.138 | 0.169 | 0.114 | 0.179 | 0.138 | 0.163 | 0.141 | 0.163 | 0.138 | 0.163 | 0.138 | 0.163 | 0.148 | 0.163 | 0.138 | 0.163 |
| ATC | I | 2.328 | 2.239 | 2.312 | 2.243 | 2.322 | 2.239 | 2.328 | 2.241 | 2.329 | 2.243 | 2.315 | 2.239 | 2.320 | 2.241 | 2.313 | 2.253 | 2.340 | 2.243 | 2.512 | 2.342 | 2.510 | 2.342 | 2.512 | 2.342 | 2.512 | 2.342 | 2.472 | 2.342 | 2.512 | 2.342 |
| AAA | K | 0.345 | 0.328 | 0.369 | 0.304 | 0.355 | 0.304 | 0.333 | 0.282 | 0.348 | 0.304 | 0.343 | 0.302 | 0.340 | 0.309 | 0.338 | 0.303 | 0.327 | 0.290 | 0.260 | 0.270 | 0.261 | 0.265 | 0.261 | 0.267 | 0.261 | 0.267 | 0.263 | 0.267 | 0.257 | 0.267 |
| AAG | K | 1.655 | 1.672 | 1.631 | 1.696 | 1.645 | 1.696 | 1.667 | 1.718 | 1.652 | 1.696 | 1.657 | 1.698 | 1.660 | 1.691 | 1.662 | 1.697 | 1.673 | 1.710 | 1.740 | 1.730 | 1.739 | 1.735 | 1.739 | 1.733 | 1.739 | 1.733 | 1.737 | 1.733 | 1.743 | 1.733 |
| CTA | L | 0.295 | 0.301 | 0.295 | 0.293 | 0.301 | 0.293 | 0.288 | 0.276 | 0.297 | 0.293 | 0.298 | 0.288 | 0.306 | 0.298 | 0.296 | 0.296 | 0.292 | 0.279 | 0.231 | 0.233 | 0.231 | 0.233 | 0.233 | 0.233 | 0.232 | 0.234 | 0.237 | 0.233 | 0.231 | 0.232 |
| CTC | L | 1.167 | 1.181 | 1.158 | 1.185 | 1.164 | 1.185 | 1.162 | 1.182 | 1.168 | 1.185 | 1.163 | 1.186 | 1.155 | 1.178 | 1.167 | 1.184 | 1.160 | 1.192 | 1.196 | 1.217 | 1.188 | 1.216 | 1.200 | 1.216 | 1.188 | 1.215 | 1.191 | 1.218 | 1.200 | 1.218 |
| CTG | L | 2.171 | 2.212 | 2.180 | 2.225 | 2.159 | 2.225 | 2.180 | 2.253 | 2.169 | 2.225 | 2.161 | 2.227 | 2.168 | 2.216 | 2.170 | 2.221 | 2.189 | 2.241 | 2.272 | 2.296 | 2.275 | 2.297 | 2.268 | 2.298 | 2.279 | 2.300 | 2.266 | 2.295 | 2.270 | 2.296 |
| CTT | L | 0.367 | 0.306 | 0.366 | 0.296 | 0.376 | 0.296 | 0.370 | 0.289 | 0.367 | 0.296 | 0.377 | 0.299 | 0.371 | 0.308 | 0.367 | 0.299 | 0.359 | 0.288 | 0.300 | 0.254 | 0.306 | 0.254 | 0.300 | 0.254 | 0.301 | 0.251 | 0.305 | 0.254 | 0.300 | 0.254 |
| TTA | L | 0.262 | 0.268 | 0.273 | 0.270 | 0.260 | 0.270 | 0.258 | 0.279 | 0.259 | 0.270 | 0.250 | 0.280 | 0.267 | 0.267 | 0.247 | 0.275 | 0.244 | 0.295 | 0.259 | 0.347 | 0.259 | 0.347 | 0.259 | 0.347 | 0.259 | 0.348 | 0.261 | 0.347 | 0.259 | 0.347 |
| TTG | L | 1.738 | 1.732 | 1.727 | 1.730 | 1.740 | 1.730 | 1.742 | 1.721 | 1.741 | 1.730 | 1.750 | 1.720 | 1.733 | 1.733 | 1.753 | 1.725 | 1.756 | 1.705 | 1.741 | 1.653 | 1.741 | 1.653 | 1.741 | 1.653 | 1.741 | 1.652 | 1.739 | 1.653 | 1.741 | 1.653 |
| AAC | N | 1.762 | 1.722 | 1.767 | 1.714 | 1.766 | 1.714 | 1.757 | 1.725 | 1.760 | 1.714 | 1.762 | 1.725 | 1.750 | 1.721 | 1.763 | 1.727 | 1.774 | 1.727 | 1.791 | 1.761 | 1.788 | 1.761 | 1.791 | 1.761 | 1.791 | 1.761 | 1.804 | 1.761 | 1.791 | 1.761 |
| AAT | N | 0.238 | 0.278 | 0.233 | 0.286 | 0.234 | 0.286 | 0.243 | 0.275 | 0.240 | 0.286 | 0.238 | 0.275 | 0.250 | 0.279 | 0.237 | 0.273 | 0.226 | 0.273 | 0.209 | 0.239 | 0.212 | 0.239 | 0.209 | 0.239 | 0.209 | 0.239 | 0.196 | 0.239 | 0.209 | 0.239 |
| CCA | P | 0.353 | 0.402 | 0.380 | 0.387 | 0.367 | 0.389 | 0.356 | 0.374 | 0.350 | 0.390 | 0.373 | 0.400 | 0.353 | 0.401 | 0.372 | 0.402 | 0.369 | 0.381 | 0.312 | 0.349 | 0.315 | 0.347 | 0.309 | 0.346 | 0.312 | 0.349 | 0.329 | 0.348 | 0.305 | 0.350 |
| CCC | P | 1.426 | 1.617 | 1.401 | 1.655 | 1.415 | 1.650 | 1.426 | 1.664 | 1.418 | 1.638 | 1.425 | 1.621 | 1.419 | 1.612 | 1.429 | 1.622 | 1.433 | 1.644 | 1.498 | 1.677 | 1.494 | 1.687 | 1.496 | 1.686 | 1.492 | 1.684 | 1.501 | 1.684 | 1.530 | 1.675 |
| CCT | P | 0.535 | 0.433 | 0.542 | 0.430 | 0.537 | 0.431 | 0.550 | 0.427 | 0.544 | 0.433 | 0.545 | 0.448 | 0.536 | 0.432 | 0.534 | 0.437 | 0.536 | 0.441 | 0.510 | 0.406 | 0.506 | 0.404 | 0.515 | 0.403 | 0.498 | 0.405 | 0.531 | 0.404 | 0.508 | 0.406 |
| CCG | P | 1.686 | 1.547 | 1.677 | 1.528 | 1.681 | 1.530 | 1.668 | 1.535 | 1.688 | 1.539 | 1.658 | 1.531 | 1.692 | 1.555 | 1.665 | 1.540 | 1.662 | 1.533 | 1.679 | 1.568 | 1.685 | 1.561 | 1.680 | 1.565 | 1.697 | 1.562 | 1.639 | 1.563 | 1.657 | 1.569 |
| CAA | Q | 0.496 | 0.383 | 0.513 | 0.375 | 0.501 | 0.379 | 0.503 | 0.361 | 0.497 | 0.375 | 0.503 | 0.381 | 0.492 | 0.385 | 0.505 | 0.382 | 0.494 | 0.359 | 0.441 | 0.346 | 0.447 | 0.347 | 0.444 | 0.345 | 0.441 | 0.347 | 0.448 | 0.346 | 0.441 | 0.345 |
| CAG | Q | 1.504 | 1.617 | 1.487 | 1.625 | 1.499 | 1.621 | 1.497 | 1.639 | 1.503 | 1.625 | 1.497 | 1.619 | 1.508 | 1.615 | 1.495 | 1.618 | 1.506 | 1.641 | 1.559 | 1.654 | 1.553 | 1.653 | 1.556 | 1.655 | 1.559 | 1.653 | 1.552 | 1.654 | 1.559 | 1.655 |
| AGA | R | 0.701 | 0.751 | 0.686 | 0.740 | 0.711 | 0.740 | 0.711 | 0.671 | 0.720 | 0.740 | 0.711 | 0.701 | 0.690 | 0.751 | 0.718 | 0.736 | 0.734 | 0.653 | 0.830 | 0.681 | 0.827 | 0.681 | 0.834 | 0.681 | 0.834 | 0.685 | 0.800 | 0.681 | 0.794 | 0.681 |
| AGG | R | 1.299 | 1.249 | 1.314 | 1.260 | 1.289 | 1.260 | 1.289 | 1.329 | 1.280 | 1.260 | 1.289 | 1.299 | 1.310 | 1.249 | 1.282 | 1.264 | 1.266 | 1.347 | 1.170 | 1.319 | 1.173 | 1.319 | 1.166 | 1.319 | 1.166 | 1.315 | 1.200 | 1.319 | 1.206 | 1.319 |
| CGA | R | 0.287 | 0.236 | 0.308 | 0.234 | 0.294 | 0.234 | 0.287 | 0.222 | 0.299 | 0.234 | 0.292 | 0.242 | 0.282 | 0.240 | 0.285 | 0.245 | 0.278 | 0.223 | 0.256 | 0.233 | 0.254 | 0.233 | 0.253 | 0.234 | 0.255 | 0.230 | 0.256 | 0.233 | 0.271 | 0.235 |
| CGC | R | 2.746 | 2.925 | 2.694 | 2.961 | 2.711 | 2.961 | 2.742 | 2.999 | 2.724 | 2.961 | 2.716 | 2.934 | 2.743 | 2.918 | 2.734 | 2.926 | 2.759 | 2.995 | 2.818 | 2.956 | 2.823 | 2.956 | 2.818 | 2.952 | 2.825 | 2.959 | 2.798 | 2.956 | 2.805 | 2.956 |
| CGG | R | 0.581 | 0.505 | 0.580 | 0.493 | 0.591 | 0.493 | 0.577 | 0.484 | 0.581 | 0.493 | 0.578 | 0.496 | 0.585 | 0.517 | 0.573 | 0.496 | 0.574 | 0.489 | 0.574 | 0.521 | 0.570 | 0.521 | 0.577 | 0.524 | 0.565 | 0.522 | 0.575 | 0.521 | 0.574 | 0.519 |
| CGT | R | 0.386 | 0.333 | 0.419 | 0.312 | 0.403 | 0.312 | 0.395 | 0.296 | 0.396 | 0.312 | 0.413 | 0.328 | 0.389 | 0.325 | 0.409 | 0.333 | 0.389 | 0.292 | 0.352 | 0.290 | 0.353 | 0.290 | 0.352 | 0.290 | 0.354 | 0.289 | 0.372 | 0.290 | 0.350 | 0.290 |
| AGC | S | 1.629 | 1.707 | 1.604 | 1.712 | 1.625 | 1.712 | 1.610 | 1.726 | 1.623 | 1.712 | 1.617 | 1.716 | 1.637 | 1.708 | 1.618 | 1.712 | 1.631 | 1.722 | 1.683 | 1.754 | 1.685 | 1.754 | 1.683 | 1.754 | 1.683 | 1.754 | 1.651 | 1.756 | 1.683 | 1.754 |
| AGT | S | 0.371 | 0.293 | 0.396 | 0.288 | 0.375 | 0.288 | 0.390 | 0.274 | 0.377 | 0.288 | 0.383 | 0.284 | 0.363 | 0.292 | 0.382 | 0.288 | 0.369 | 0.278 | 0.317 | 0.246 | 0.315 | 0.246 | 0.317 | 0.246 | 0.317 | 0.246 | 0.349 | 0.244 | 0.317 | 0.246 |
| TCA | S | 0.280 | 0.167 | 0.298 | 0.166 | 0.277 | 0.166 | 0.292 | 0.167 | 0.278 | 0.167 | 0.296 | 0.180 | 0.287 | 0.173 | 0.291 | 0.169 | 0.258 | 0.179 | 0.198 | 0.180 | 0.202 | 0.180 | 0.198 | 0.180 | 0.198 | 0.180 | 0.224 | 0.180 | 0.195 | 0.180 |
| TCC | S | 1.443 | 1.530 | 1.385 | 1.535 | 1.440 | 1.531 | 1.448 | 1.537 | 1.437 | 1.533 | 1.439 | 1.530 | 1.461 | 1.517 | 1.432 | 1.533 | 1.471 | 1.546 | 1.510 | 1.555 | 1.513 | 1.557 | 1.506 | 1.555 | 1.507 | 1.556 | 1.489 | 1.559 | 1.530 | 1.553 |
| TCG | S | 1.764 | 1.742 | 1.778 | 1.739 | 1.757 | 1.743 | 1.748 | 1.757 | 1.759 | 1.741 | 1.762 | 1.740 | 1.749 | 1.745 | 1.767 | 1.743 | 1.750 | 1.737 | 1.817 | 1.780 | 1.811 | 1.779 | 1.821 | 1.780 | 1.819 | 1.778 | 1.810 | 1.780 | 1.800 | 1.779 |
| TCT | S | 0.514 | 0.561 | 0.540 | 0.560 | 0.526 | 0.560 | 0.511 | 0.538 | 0.527 | 0.560 | 0.504 | 0.550 | 0.503 | 0.565 | 0.510 | 0.555 | 0.521 | 0.538 | 0.475 | 0.485 | 0.475 | 0.484 | 0.475 | 0.485 | 0.476 | 0.485 | 0.477 | 0.481 | 0.474 | 0.488 |
| ACC | T | 1.177 | 1.146 | 1.171 | 1.142 | 1.181 | 1.143 | 1.181 | 1.152 | 1.178 | 1.145 | 1.173 | 1.139 | 1.161 | 1.136 | 1.170 | 1.144 | 1.216 | 1.156 | 1.283 | 1.159 | 1.277 | 1.159 | 1.290 | 1.159 | 1.268 | 1.159 | 1.274 | 1.160 | 1.280 | 1.160 |
| ACA | T | 0.499 | 0.539 | 0.524 | 0.521 | 0.511 | 0.522 | 0.514 | 0.511 | 0.496 | 0.523 | 0.534 | 0.533 | 0.538 | 0.528 | 0.526 | 0.533 | 0.486 | 0.502 | 0.456 | 0.394 | 0.455 | 0.394 | 0.449 | 0.394 | 0.457 | 0.394 | 0.485 | 0.395 | 0.478 | 0.395 |
| ACG | T | 1.876 | 1.927 | 1.867 | 1.949 | 1.866 | 1.946 | 1.869 | 1.955 | 1.877 | 1.943 | 1.858 | 1.945 | 1.857 | 1.938 | 1.870 | 1.931 | 1.879 | 1.960 | 1.867 | 2.044 | 1.870 | 2.044 | 1.872 | 2.044 | 1.879 | 2.044 | 1.854 | 2.042 | 1.855 | 2.042 |
| ACT | T | 0.448 | 0.388 | 0.437 | 0.389 | 0.442 | 0.389 | 0.435 | 0.383 | 0.449 | 0.390 | 0.435 | 0.384 | 0.444 | 0.398 | 0.434 | 0.392 | 0.419 | 0.382 | 0.394 | 0.403 | 0.398 | 0.403 | 0.389 | 0.403 | 0.396 | 0.403 | 0.387 | 0.404 | 0.386 | 0.404 |
| GTT | V | 0.319 | 0.270 | 0.336 | 0.248 | 0.337 | 0.248 | 0.330 | 0.234 | 0.326 | 0.248 | 0.343 | 0.263 | 0.353 | 0.275 | 0.322 | 0.266 | 0.318 | 0.242 | 0.274 | 0.245 | 0.281 | 0.247 | 0.274 | 0.245 | 0.275 | 0.245 | 0.275 | 0.245 | 0.272 | 0.245 |
| GTG | V | 2.262 | 2.386 | 2.273 | 2.399 | 2.254 | 2.399 | 2.250 | 2.414 | 2.251 | 2.399 | 2.263 | 2.401 | 2.268 | 2.390 | 2.274 | 2.398 | 2.275 | 2.410 | 2.400 | 2.498 | 2.402 | 2.497 | 2.397 | 2.498 | 2.407 | 2.499 | 2.421 | 2.497 | 2.406 | 2.498 |
| GTC | V | 1.099 | 1.036 | 1.085 | 1.039 | 1.094 | 1.039 | 1.094 | 1.048 | 1.105 | 1.039 | 1.082 | 1.034 | 1.059 | 1.027 | 1.077 | 1.031 | 1.096 | 1.046 | 1.064 | 1.036 | 1.060 | 1.034 | 1.064 | 1.036 | 1.068 | 1.035 | 1.058 | 1.037 | 1.058 | 1.036 |
| GTA | V | 0.319 | 0.308 | 0.307 | 0.314 | 0.315 | 0.314 | 0.326 | 0.304 | 0.318 | 0.314 | 0.313 | 0.303 | 0.320 | 0.308 | 0.326 | 0.305 | 0.312 | 0.302 | 0.261 | 0.221 | 0.257 | 0.222 | 0.265 | 0.221 | 0.249 | 0.221 | 0.245 | 0.221 | 0.264 | 0.221 |
| TAC | Y | 1.784 | 1.771 | 1.786 | 1.771 | 1.784 | 1.771 | 1.777 | 1.770 | 1.784 | 1.771 | 1.773 | 1.773 | 1.774 | 1.773 | 1.776 | 1.773 | 1.777 | 1.773 | 1.772 | 1.799 | 1.774 | 1.799 | 1.772 | 1.799 | 1.772 | 1.799 | 1.777 | 1.799 | 1.774 | 1.799 |
| TAT | Y | 0.216 | 0.229 | 0.214 | 0.229 | 0.216 | 0.229 | 0.223 | 0.230 | 0.216 | 0.229 | 0.227 | 0.227 | 0.226 | 0.227 | 0.224 | 0.227 | 0.223 | 0.227 | 0.229 | 0.201 | 0.226 | 0.201 | 0.229 | 0.201 | 0.229 | 0.201 | 0.223 | 0.201 | 0.226 | 0.201 |
| Amino Acids | Most Favored Codons in MCV | tRNA Isotypes in Human Cells (Khandia et al., 2019; http://gtrnadb.ucsc.edu/Hsapi19/Hsapi19-gene-list.html Accessed on 30 August 2021) |
|---|---|---|
| Ala (A) | GCG | AGC (22), GGC (0), CGC (4), UGC (8) |
| Gly (G) | GGC | ACC (0), GCC (14), CCC (5), UCC (9) |
| Pro (P) | CCG | AGG (9), GGG (0), CGG (4), UGG (7) |
| Thr (T) | ACG | AGU (9), GGU (0), CGU (5), UGU (6) |
| Val (V) | GTG | AAC (9), GAC (0), CAC (11), UAC (5) |
| Ser (S) | TCG | AGA (9), GGA (0), CGA (4), UGA (4), ACU (0), GCU (8) |
| Arg (R) | CGC | ACG (7), GCG (0), CCG (4), UCG (6), CCU (5), UCU (6) |
| Leu (L) | CTG | AAG (9), GAG (0), CAG (9), UAG (3), CAA (6), UAA (4) |
| Phe (F) | TTC | AAA (0), GAA (10) |
| Asn (N) | AAC | AUU (0), GUU (20) |
| Lys (K) | AAG | CUU (15), UUU (12) |
| Asp (D) | GAC | AUC (0), GUC (13) |
| Glu (E) | GAG | CUC (8), UUC (7) |
| His (H) | CAC | AUG (0), GUG (10) |
| Gln (Q) | CAG | CUG (13), UUG (6) |
| Ile (I) | ATC | AAU (14), GAU(3), UAU (5) |
| Tyr (Y) | TAC | AUA (0), GUA (13) |
| Cys (C) | TGC | ACA (0), GCA (29) |
| Strains | Axes | A-3 | T-3 | G-3 | C-3 | GC3 | ENC | CAI | Length |
|---|---|---|---|---|---|---|---|---|---|
| MH320547.1 (MCV 1) | Axis 1 | −0.9314 * | −0.9093 * | 0.5958 * | 0.8538 * | 0.9682 * | −0.8997 * | −0.7619 * | 0.2394 * |
| Axis 2 | −0.1276 | −0.1968 * | −0.0768 | 0.2652 * | 0.1566 | −0.1527 | −0.2341 * | −0.0137 | |
| Axis 3 | 0.2276 * | 0.1862 * | −0.1975 * | −0.1666 * | −0.2225 * | 0.2063 * | 0.1416 | 0.0672 | |
| Axis 4 | 0.1543 | 0.1586 * | 0.0408 | −0.2251 * | −0.1753 * | 0.1385 | 0.1452 | −0.0662 | |
| Axis 5 | 0.1707 * | 0.2419 * | −0.2423 * | −0.1012 | −0.2181 * | 0.2414 * | 0.0552 | 0.0088 | |
| Axis 6 | 0.0092 | 0.0419 | −0.0401 | −0.0358 | −0.0239 | −0.0288 | −0.0372 | 0.0576 | |
| Axis 7 | 0.0388 | 0.1246 | −0.2989 * | 0.0667 | −0.0828 | 0.1339 | 0.0133 | −0.0680 | |
| MH320552.1 (MCV 1) | Axis 1 | −0.9296 * | −0.9131 * | 0.5715 * | 0.8528 * | 0.9685 * | −0.8969 * | −0.7561 * | 0.2290 * |
| Axis 2 | −0.0582 | −0.1120 | −0.2011 * | 0.2259 * | 0.0773 | −0.0440 | −0.1913 * | −0.0248 | |
| Axis 3 | 0.2503 * | 0.2010 * | −0.2073 * | −0.1907 * | −0.2427 * | 0.2229 * | 0.1696 * | 0.0472 | |
| Axis 4 | 0.1702 * | 0.1900 * | −0.0512 | −0.1833 * | −0.2019 * | 0.1852 * | 0.0919 | −0.0865 | |
| Axis 5 | −0.0481 | −0.0445 | 0.0607 | 0.0271 | 0.0563 | −0.1229 | −0.0647 | 0.0993 | |
| Axis 6 | −0.0760 | −0.0954 | 0.0129 | 0.1074 | 0.0881 | −0.0526 | 0.0225 | −0.0956 | |
| Axis 7 | 0.0645 | 0.1880 * | −0.3423 * | 0.0410 | −0.1214 | 0.1816 * | 0.0113 | −0.0512 | |
| MH320553.1 (MCV 1) | Axis 1 | −0.9314 * | −0.9092 * | 0.5860 * | 0.8530 * | 0.9684 * | −0.8987 * | −0.7569 * | 0.2377 * |
| Axis 2 | −0.1374 | −0.2091 * | −0.0810 | 0.2798 * | 0.1681 * | −0.1635 * | −0.2513 * | −0.0121 | |
| Axis 3 | 0.2229 * | 0.1794 * | −0.1786 * | −0.1648 * | −0.2231 * | 0.1883 * | 0.1021 | 0.0820 | |
| Axis 4 | 0.0473 | 0.0345 | −0.1852 * | 0.0531 | −0.0338 | 0.0594 | 0.0062 | 0.0163 | |
| Axis 5 | 0.1509 | 0.1896 * | −0.2074 * | −0.0759 | −0.1868 * | 0.2458 * | 0.0652 | −0.0697 | |
| Axis 6 | 0.0448 | 0.1114 | −0.0344 | −0.0810 | −0.0795 | 0.0565 | −0.0434 | 0.0625 | |
| Axis 7 | 0.0228 | 0.1476 | −0.2944 * | 0.0644 | −0.0800 | 0.1398 | 0.0087 | −0.0453 | |
| MH320554.1 (MCV 1) | Axis 1 | −0.9285 * | −0.9185 * | 0.5821 * | 0.8487 * | 0.9683 * | −0.8994 * | −0.7633 * | 0.2513 * |
| Axis 2 | −0.2313 * | −0.2993 * | 0.1430 | 0.2486 * | 0.2722 * | −0.2667 * | −0.2705 * | 0.0119 | |
| Axis 3 | 0.1055 | 0.0996 | −0.3217 * | 0.0477 | −0.1125 | 0.1453 | −0.0523 | 0.0022 | |
| Axis 4 | −0.1650 * | −0.2137 * | −0.0513 | 0.2648 * | 0.2126 * | −0.1830 * | −0.1922 * | 0.0952 | |
| Axis 5 | 0.0285 | 0.0882 | −0.1460 | 0.0326 | −0.0673 | 0.1308 | −0.0189 | −0.0775 | |
| Axis 6 | 0.0493 | 0.1502 | −0.0524 | −0.1025 | −0.0990 | 0.0765 | 0.0059 | 0.0302 | |
| Axis 7 | −0.0235 | 0.0783 | −0.3056 * | 0.1282 | −0.0291 | 0.0843 | −0.0048 | −0.0619 | |
| MH320555.1 (MCV 1) | Axis 1 | −0.9320 * | −0.9107 * | 0.5884 * | 0.8516 * | 0.9689 * | −0.9011 * | −0.7589 * | 0.2581 * |
| Axis 2 | 0.1935 * | 0.2929 * | −0.0121 | −0.3093 * | −0.2397 * | 0.2445 * | 0.3075 * | −0.0083 | |
| Axis 3 | 0.1567 | 0.1426 | −0.2940 * | −0.0207 | −0.1627 * | 0.1764 * | 0.0133 | 0.0084 | |
| Axis 4 | 0.1847 * | 0.1993 * | −0.0439 | −0.2218 * | −0.2120 * | 0.1867 * | 0.1742 * | −0.0830 | |
| Axis 5 | 0.0811 | 0.1479 | −0.1421 | −0.0446 | −0.1286 | 0.1767 * | 0.0234 | −0.0533 | |
| Axis 6 | 0.0340 | 0.1023 | −0.0170 | −0.0832 | −0.0697 | 0.0371 | −0.0294 | 0.0307 | |
| Axis 7 | −0.0222 | 0.1013 | −0.2641 * | 0.0971 | −0.0341 | 0.0998 | −0.0015 | −0.0451 | |
| KY040275.1 (MCV 1) | Axis 1 | −0.9310 * | −0.9133 * | 0.5876 * | 0.8513 * | 0.9698 * | −0.8994 * | −0.7607 * | 0.2169 * |
| Axis 2 | 0.0317 | 0.0060 | −0.2354 * | 0.1171 | −0.0303 | 0.0457 | −0.1273 | 0.0209 | |
| Axis 3 | −0.1911 * | −0.2807 * | 0.0609 | 0.2568 * | 0.2453 * | −0.2270 * | −0.2383 * | −0.0807 | |
| Axis 4 | 0.0758 | −0.0583 | −0.1103 | 0.0286 | −0.0067 | 0.0096 | 0.0535 | 0.0363 | |
| Axis 5 | −0.0768 | −0.0901 | 0.1390 | 0.0204 | 0.0921 | −0.1580 | −0.0281 | 0.0996 | |
| Axis 6 | 0.0462 | 0.0847 | −0.0199 | −0.0918 | −0.0694 | 0.0478 | −0.0289 | 0.0245 | |
| Axis 7 | 0.0103 | 0.1729 * | −0.3222 * | 0.0810 | −0.0794 | 0.1612 * | 0.0315 | −0.1102 | |
| KY040276.1 (MCV 1) | Axis 1 | −0.9345 * | −0.9155 * | 0.5907 * | 0.8551 * | 0.9693 * | −0.9001 * | −0.7566 * | 0.2211 * |
| Axis 2 | −0.0008 | −0.0363 | −0.1378 | 0.1180 | 0.0113 | −0.0220 | −0.1447 | 0.0127 | |
| Axis 3 | 0.2975 * | 0.2979 * | −0.1643 * | −0.3068 * | −0.3122 * | 0.2993 * | 0.2681 * | 0.0147 | |
| Axis 4 | −0.0164 | −0.0577 | −0.1468 | 0.1270 | 0.0460 | 0.0045 | −0.0663 | 0.0127 | |
| Axis 5 | 0.1076 | 0.1202 | −0.1726 * | −0.0239 | −0.1286 | 0.1864 * | −0.0352 | −0.0871 | |
| Axis 6 | 0.0328 | 0.0730 | −0.0057 | −0.0718 | −0.0568 | 0.0310 | −0.0431 | 0.0414 | |
| Axis 7 | 0.0411 | 0.1270 | −0.3367 * | 0.0731 | −0.0925 | 0.1367 | −0.0089 | −0.0656 | |
| KY040277.1 (MCV 1) | Axis 1 | −0.9324 * | −0.9153 * | 0.5772 * | 0.8514 * | 0.9679 * | −0.8985 * | −0.7705 * | 0.1989 * |
| Axis 2 | 0.2372 * | 0.3087 * | −0.0301 | −0.3321 * | −0.2764 * | 0.2624 * | 0.3060 * | −0.0167 | |
| Axis 3 | 0.2291 * | 0.2053 * | −0.2563 * | −0.1183 | −0.2355 * | 0.2432 * | 0.0676 | 0.0602 | |
| Axis 4 | −0.0482 | −0.0728 | −0.1454 | 0.1664 * | 0.0724 | −0.0210 | −0.0980 | 0.0464 | |
| Axis 5 | 0.0649 | 0.1125 | −0.1634 * | 0.0045 | −0.1047 | 0.1831 * | −0.0211 | −0.1143 | |
| Axis 6 | 0.0512 | 0.1469 | −0.0823 | −0.0757 | −0.0979 | 0.1033 | −0.0157 | −6.94 × 10⁻⁵ | |
| Axis 7 | 0.0142 | 0.1340 | −0.2789 * | 0.0603 | −0.0793 | 0.1333 | 0.0073 | −0.1334 | |
| U60315.1 (MCV 1) | Axis 1 | −0.9261 * | −0.9181 * | 0.5844 * | 0.8321 * | 0.9643 * | −0.8935 * | −0.7533 * | 0.1458 |
| Axis 2 | −0.0746 | −0.0615 | −0.2056 * | 0.2064 * | 0.0685 | −0.0559 | −0.1630 * | 0.1041 | |
| Axis 3 | −0.2048 * | −0.2285 * | −0.0010 | 0.2678 * | 0.2313 * | −0.1733 * | −0.2219 * | −0.0541 | |
| Axis 4 | −0.0054 | −0.1029 | −0.0276 | 0.0963 | 0.0609 | −0.0562 | 0.0090 | 0.0370 | |
| Axis 5 | 0.1431 | 0.2410 * | −0.3398 * | −0.0012 | −0.2028 * | 0.2655 * | 0.1321 | −0.0781 | |
| Axis 6 | 0.0828 | 0.1614 | −0.2440 * | −0.0049 | −0.1209 | 0.1391 | −0.0608 | −0.0230 | |
| Axis 7 | 0.1146 | 0.0702 | 0.1049 | −0.1428 | −0.1003 | 0.0450 | 0.0366 | 0.2033 * | |
| MH320548.1 (MCV 2) | Axis 1 | −0.9255 * | −0.9464 * | 0.6122 * | 0.8414 * | 0.9765 * | −0.9038 * | −0.8090 * | 0.2244 * |
| Axis 2 | 0.1193 | 0.2168 * | −0.2818 * | −0.0169 | −0.1809 * | 0.1442 | 0.0864 | 0.0660 | |
| Axis 3 | 0.1119 | 0.1541 | −0.1354 | −0.0890 | −0.1588 | 0.1422 | 0.0865 | −0.0322 | |
| Axis 4 | −0.0111 | 0.0530 | 0.0861 | −0.0368 | −0.0211 | 0.0270 | 0.0267 | −0.1704 * | |
| Axis 5 | −0.1085 | 0.0357 | −0.1608 * | 0.1043 | 0.0357 | −0.0009 | −0.2263 * | 0.0848 | |
| Axis 6 | −0.0136 | −0.0315 | 0.1342 | −0.0709 | 0.0246 | −0.0517 | 0.1175 | −5.83 × 10⁻⁵ | |
| Axis 7 | 0.2027 * | −0.0331 | 0.1212 | −0.1616 * | −0.0892 | −0.0472 | 0.0115 | 0.1864 * | |
| MH320549.1 (MCV 2) | Axis 1 | −0.9254 * | −0.9457 * | 0.6181 * | 0.8417 * | 0.9773 * | −0.9064 * | −0.8064 * | 0.2252 * |
| Axis 2 | 0.0780 | 0.1758 * | −0.2696 * | 0.0225 | −0.1410 | 0.1143 | 0.0502 | 0.0888 | |
| Axis 3 | 0.1014 | 0.1374 | −0.0956 | −0.0980 | −0.1449 | 0.1293 | 0.0803 | −0.0154 | |
| Axis 4 | −0.0275 | 0.0441 | 0.0868 | −0.0156 | −0.0069 | 0.0161 | 0.0191 | −0.1741 * | |
| Axis 5 | −0.1107 | 0.0429 | −0.2004 * | 0.1168 | 0.0298 | 0.0085 | −0.2278 * | 0.0885 | |
| Axis 6 | −0.0753 | −0.0278 | 0.0578 | 9.65 × 10⁻⁵ | 0.0508 | −0.0420 | 0.0967 | −0.0216 | |
| Axis 7 | 0.1652 * | −0.0669 | 0.1527 | −0.1395 | −0.0514 | −0.0840 | 0.0057 | 0.1888 * | |
| MH320550.1 (MCV 2) | Axis 1 | −0.9262 * | −0.9463 * | 0.6108 * | 0.8417 * | 0.9766 * | −0.9037 * | −0.8086 * | 0.2227 * |
| Axis 2 | 0.1232 | 0.2178 * | −0.2932 * | −0.0124 | −0.1837 * | 0.1440 | 0.0917 | 0.0689 | |
| Axis 3 | 0.1158 | 0.1589 | −0.1283 | −0.0959 | −0.1629 * | 0.1449 | 0.0844 | −0.0283 | |
| Axis 4 | −0.0147 | 0.0558 | 0.07813 | −0.0346 | −0.0210 | 0.0279 | 0.0201 | −0.1706 * | |
| Axis 5 | −0.1078 | 0.0340 | −0.1625 * | 0.1090 | 0.0385 | −0.0034 | −0.2270 * | 0.0940 | |
| Axis 6 | −0.0098 | −0.0249 | 0.1383 | −0.0755 | 0.0208 | −0.0455 | 0.1331 | −0.0101 | |
| Axis 7 | 0.1915 * | −0.0446 | 0.1326 | −0.1551 | −0.0781 | −0.0600 | 0.0168 | 0.1912 * | |
| MH320551.1 (MCV 2) | Axis 1 | −0.9253 * | −0.9469 * | 0.6113 * | 0.8426 * | 0.9772 * | −0.9075 * | −0.8111 * | 0.2307 * |
| Axis 2 | 0.1145 | 0.2244 * | −0.2886 * | −0.0218 | −0.1832 * | 0.1572 | 0.0894 | 0.0562 | |
| Axis 3 | 0.1262 | 0.1555 | −0.1430 | −0.0939 | −0.1691 * | 0.1547 | 0.1029 | −0.0444 | |
| Axis 4 | −0.0002 | 0.0742 | 0.0669 | −0.0450 | −0.0382 | 0.0401 | 0.0234 | −0.1674 * | |
| Axis 5 | −0.1008 | 0.0384 | −0.1703 * | 0.0989 | 0.0275 | 0.0132 | −0.2299 * | 0.0811 | |
| Axis 6 | 0.0429 | −0.0549 | 0.1081 | −0.0839 | 0.0027 | −0.0693 | 0.0759 | 0.0733 | |
| Axis 7 | 0.2219 * | 0.0099 | 0.0299 | −0.1462 | −0.1171 | 0.0020 | −0.0063 | 0.1292 | |
| MH320556.1 (MCV 2) | Axis 1 | −0.9261 * | −0.9449 * | 0.6129 * | 0.8431 * | 0.9770 * | −0.9057 * | −0.8084 * | 0.2248 * |
| Axis 2 | 0.1206 | 0.2180 * | −0.2917 * | −0.0128 | −0.1797 * | 0.1452 | 0.0832 | 0.0690 | |
| Axis 3 | 0.1146 | 0.1617 * | −0.1333 | −0.0925 | −0.1612 * | 0.1475 | 0.0849 | −0.0366 | |
| Axis 4 | −0.0062 | 0.05624 | 0.0752 | −0.0377 | −0.0275 | 0.0334 | 0.0343 | −0.1755 * | |
| Axis 5 | −0.1016 | 0.0416 | −0.1704 * | 0.1021 | 0.0303 | 0.0087 | −0.2214 * | 0.0875 | |
| Axis 6 | −0.0106 | −0.0361 | 0.1142 | −0.0661 | 0.0228 | −0.0469 | 0.1061 | −0.0031 | |
| Axis 7 | 0.2275 * | −0.0160 | 0.0886 | −0.1673 * | −0.1144 | −0.0287 | 0.0205 | 0.1858 * | |
| KY040274.1 (MCV 2) | Axis 1 | −0.9256 * | −0.9458 * | 0.6106 * | 0.8409 * | 0.9766 * | −0.9020 * | −0.8044 * | 0.2229 * |
| Axis 2 | 0.1273 | 0.2160 * | −0.2898 * | −0.0149 | −0.1848 * | 0.1428 | 0.0814 | 0.0686 | |
| Axis 3 | 0.1108 | 0.1575 | −0.1311 | −0.0933 | −0.1606 * | 0.1428 | 0.0868 | −0.0289 | |
| Axis 4 | −0.0124 | 0.0560 | 0.0755 | −0.0324 | −0.0228 | 0.0278 | 0.0192 | −0.1690 | |
| Axis 5 | −0.0870 | 0.0306 | −0.1563 | 0.0920 | 0.0285 | −0.0047 | −0.2359 * | 0.1069 | |
| Axis 6 | −0.0298 | −0.0158 | 0.1230 | −0.0591 | 0.0272 | −0.0349 | 0.1317 | −0.0227 | |
| Axis 7 | 0.1767 * | −0.0647 | 0.1402 | −0.1392 | −0.0601 | −0.0821 | 0.0191 | 0.1894 * |
| Subtype | Accession ID | Country of Isolation | Total Number of CDS | Selected CDS | Genome Size |
|---|---|---|---|---|---|
| MCV 1 | MH320547.1 | Slovenia | 178 | 148 | 187,826 bp |
| MCV 1 | MH320552.1 | Slovenia | 176 | 147 | 187,884 bp |
| MCV 1 | MH320553.1 | Slovenia | 178 | 148 | 187,558 bp |
| MCV 1 | MH320554.1 | Slovenia | 177 | 147 | 196,781 bp |
| MCV 1 | MH320555.1 | Slovenia | 177 | 148 | 189,292 bp |
| MCV 1 | KY040275.1 | Spain | 181 | 144 | 188,253 bp |
| MCV 1 | KY040276.1 | Spain | 179 | 148 | 189,098 bp |
| MCV 1 | KY040277.1 | Spain | 179 | 146 | 188,458 bp |
| MCV 1 | U60315.1 | Not specified | 163 | 140 | 190,289 bp |
| MCV 2 | MH320548.1 | Slovenia | 170 | 144 | 190,319 bp |
| MCV 2 | MH320549.1 | Slovenia | 170 | 144 | 193,271 bp |
| MCV 2 | MH320550.1 | Slovenia | 170 | 144 | 196,206 bp |
| MCV 2 | MH320551.1 | Slovenia | 170 | 144 | 192,156 bp |
| MCV 2 | MH320556.1 | Slovenia | 170 | 144 | 189,257 bp |
| MCV 2 | KY040274.1 | Spain | 170 | 144 | 192,183 bp |
Publisher’s Note: MDPI stays neutral with regard to jurisdictional claims in published maps and institutional affiliations. |
© 2021 by the authors. Licensee MDPI, Basel, Switzerland. This article is an open access article distributed under the terms and conditions of the Creative Commons Attribution (CC BY) license (https://creativecommons.org/licenses/by/4.0/).
Share and Cite
Nair, R.R.; Mohan, M.; Rudramurthy, G.R.; Vivekanandam, R.; Satheshkumar, P.S. Strategies and Patterns of Codon Bias in Molluscum Contagiosum Virus. Pathogens 2021, 10, 1649. https://0-doi-org.brum.beds.ac.uk/10.3390/pathogens10121649
Nair RR, Mohan M, Rudramurthy GR, Vivekanandam R, Satheshkumar PS. Strategies and Patterns of Codon Bias in Molluscum Contagiosum Virus. Pathogens. 2021; 10(12):1649. https://0-doi-org.brum.beds.ac.uk/10.3390/pathogens10121649
Chicago/Turabian StyleNair, Rahul Raveendran, Manikandan Mohan, Gudepalya R. Rudramurthy, Reethu Vivekanandam, and Panayampalli S. Satheshkumar. 2021. "Strategies and Patterns of Codon Bias in Molluscum Contagiosum Virus" Pathogens 10, no. 12: 1649. https://0-doi-org.brum.beds.ac.uk/10.3390/pathogens10121649