
Virus-Derived Chemokine Modulating Protein Pre-Treatment Blocks Chemokine–Glycosaminoglycan Interactions and Significantly Reduces Transplant Immune Damage

 , ,
, ,  ,
,  , ,
, ,
Abstract
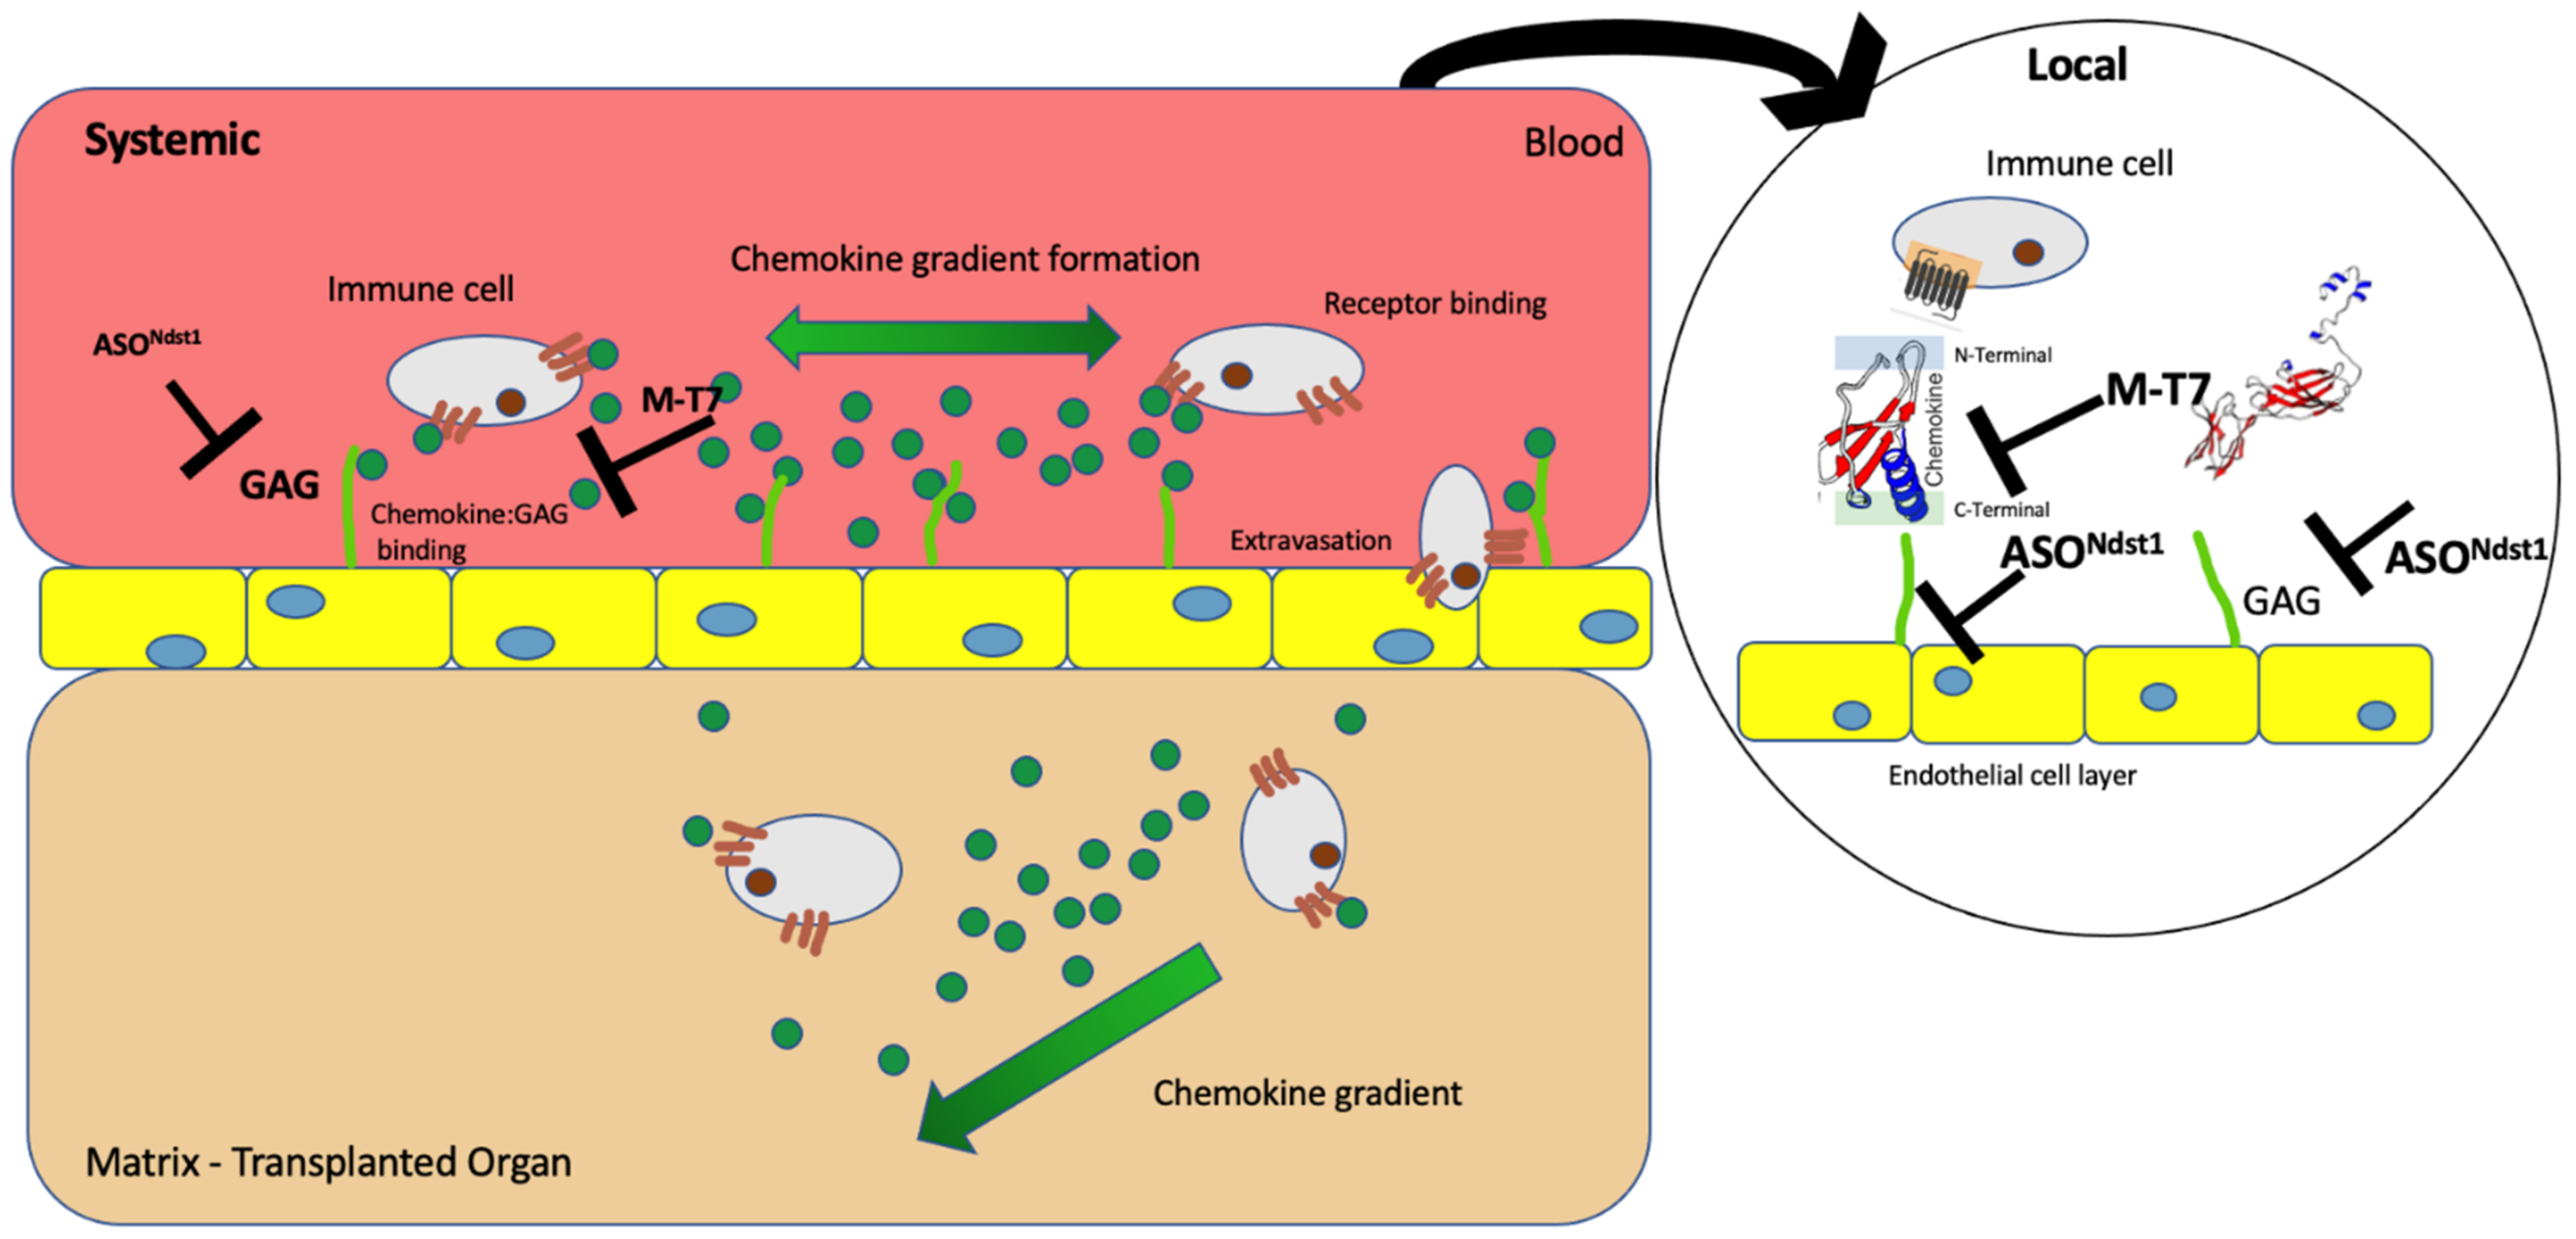
:1. Introduction
2. Results
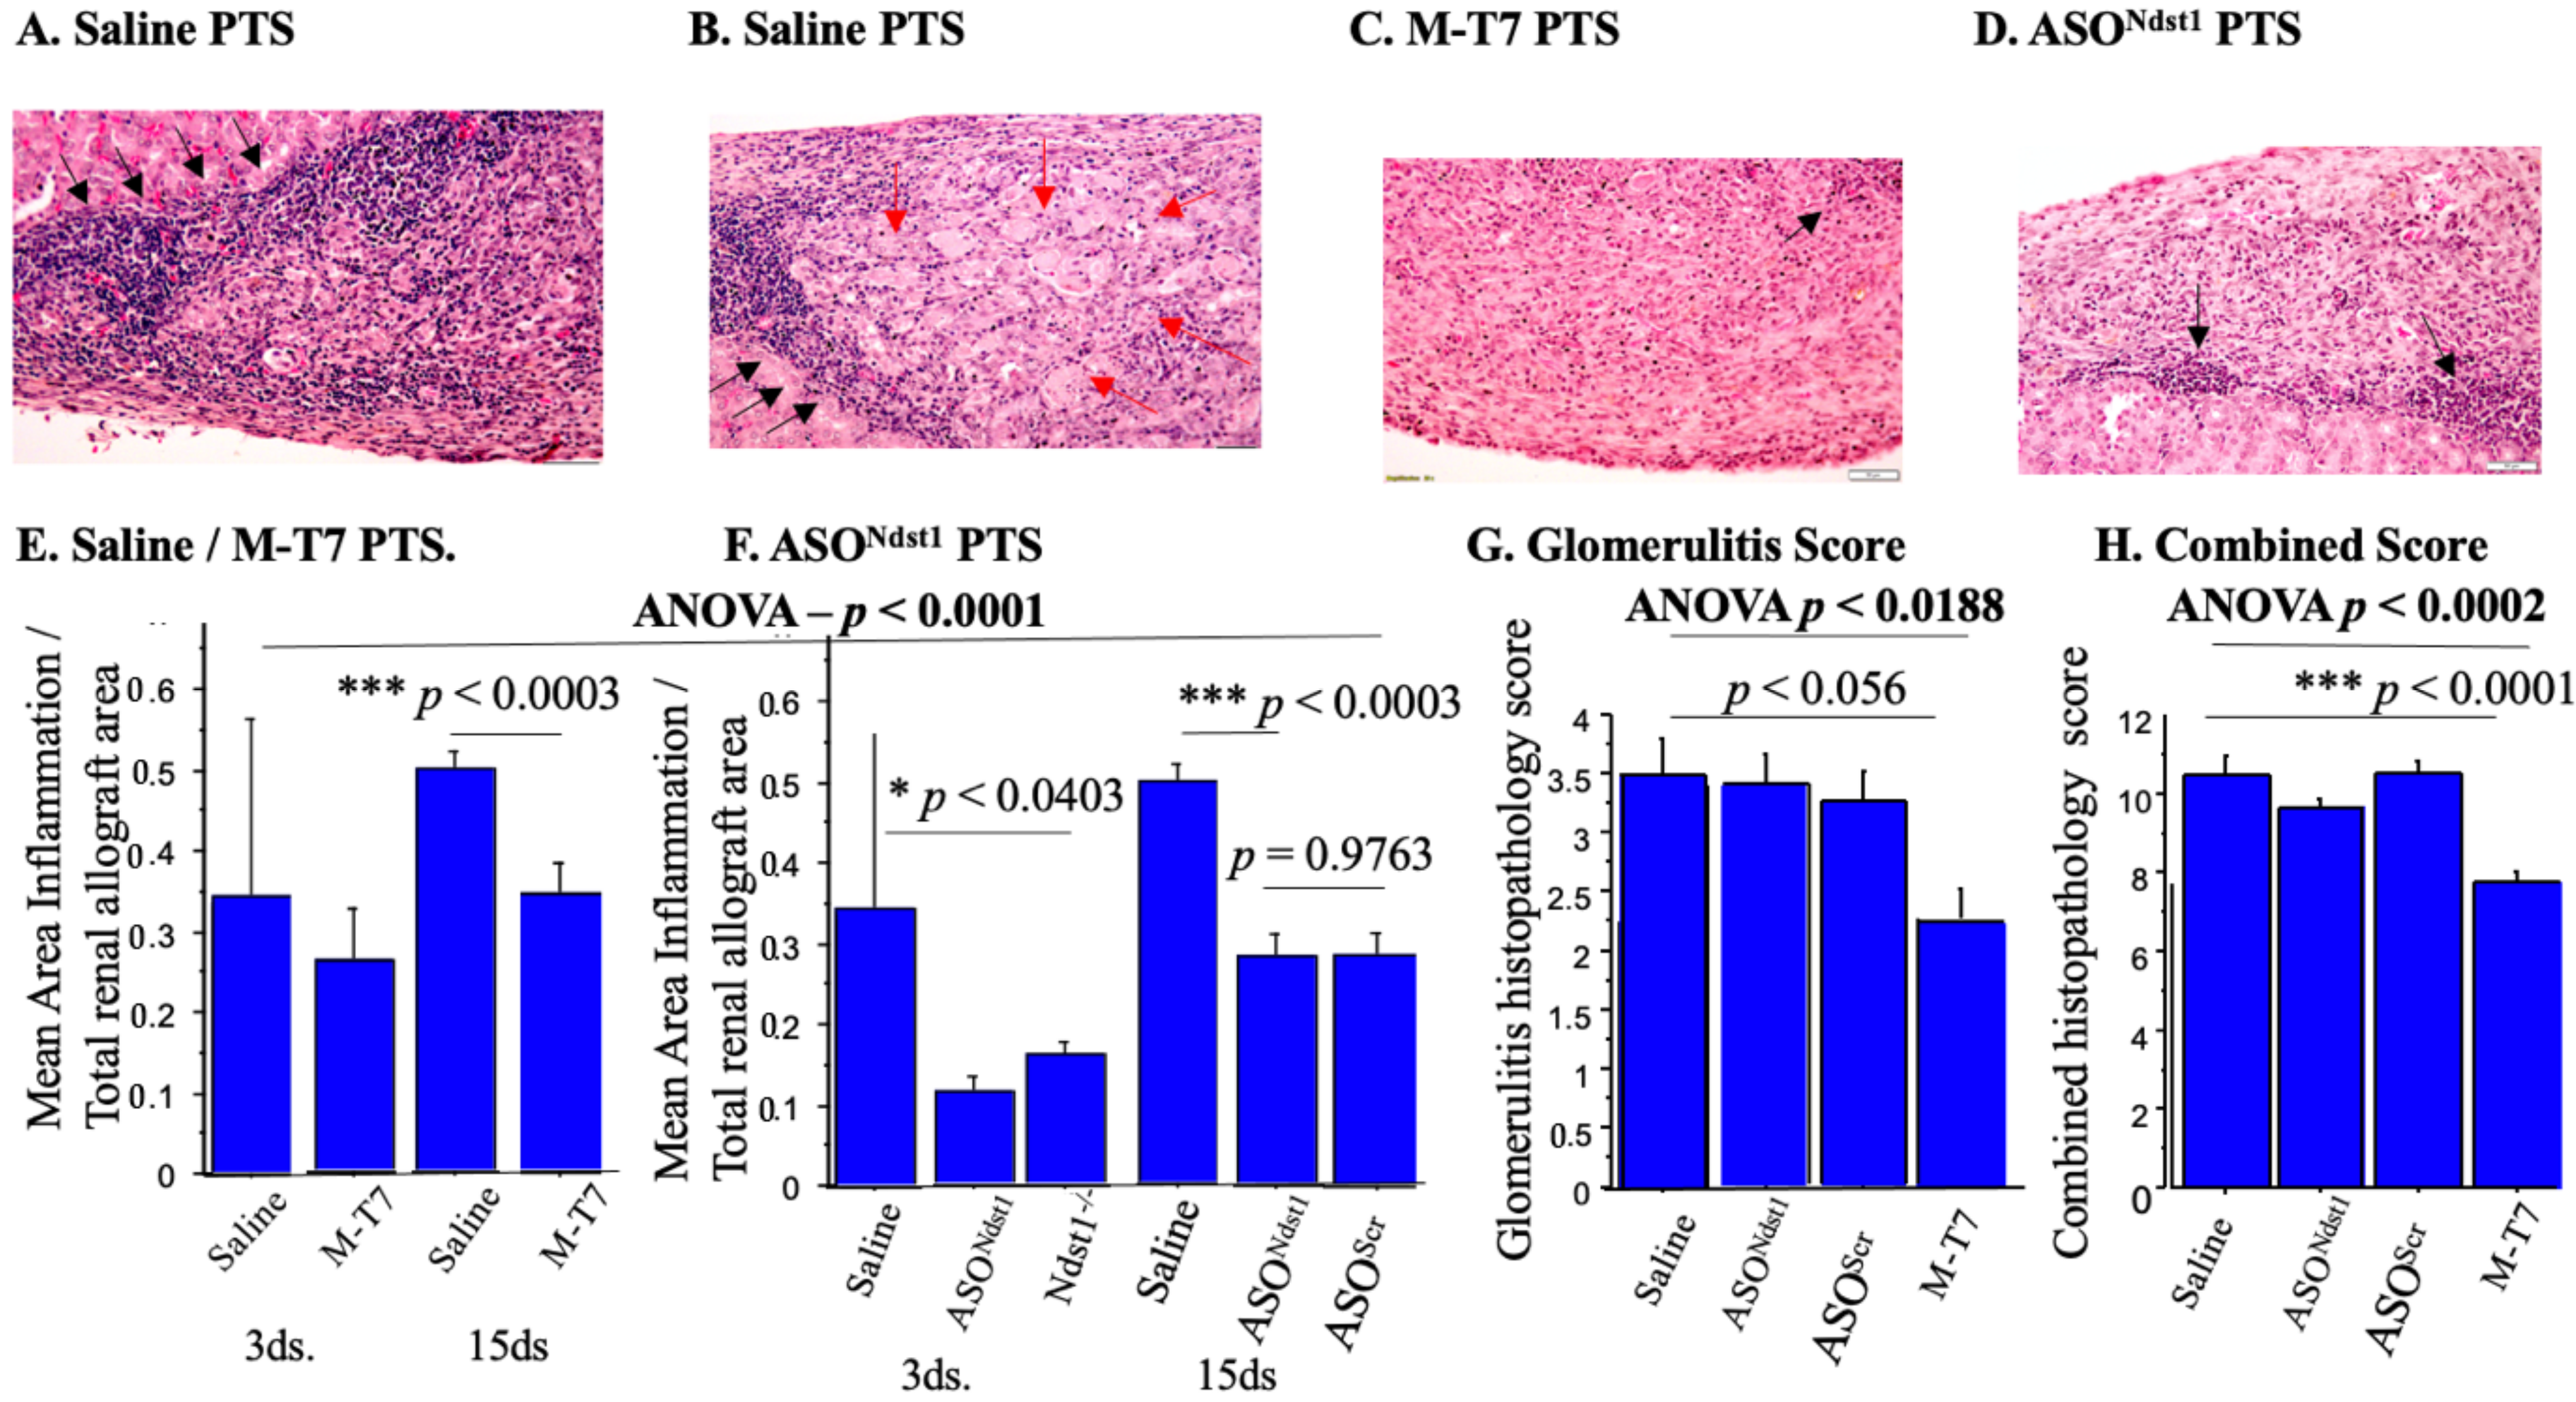
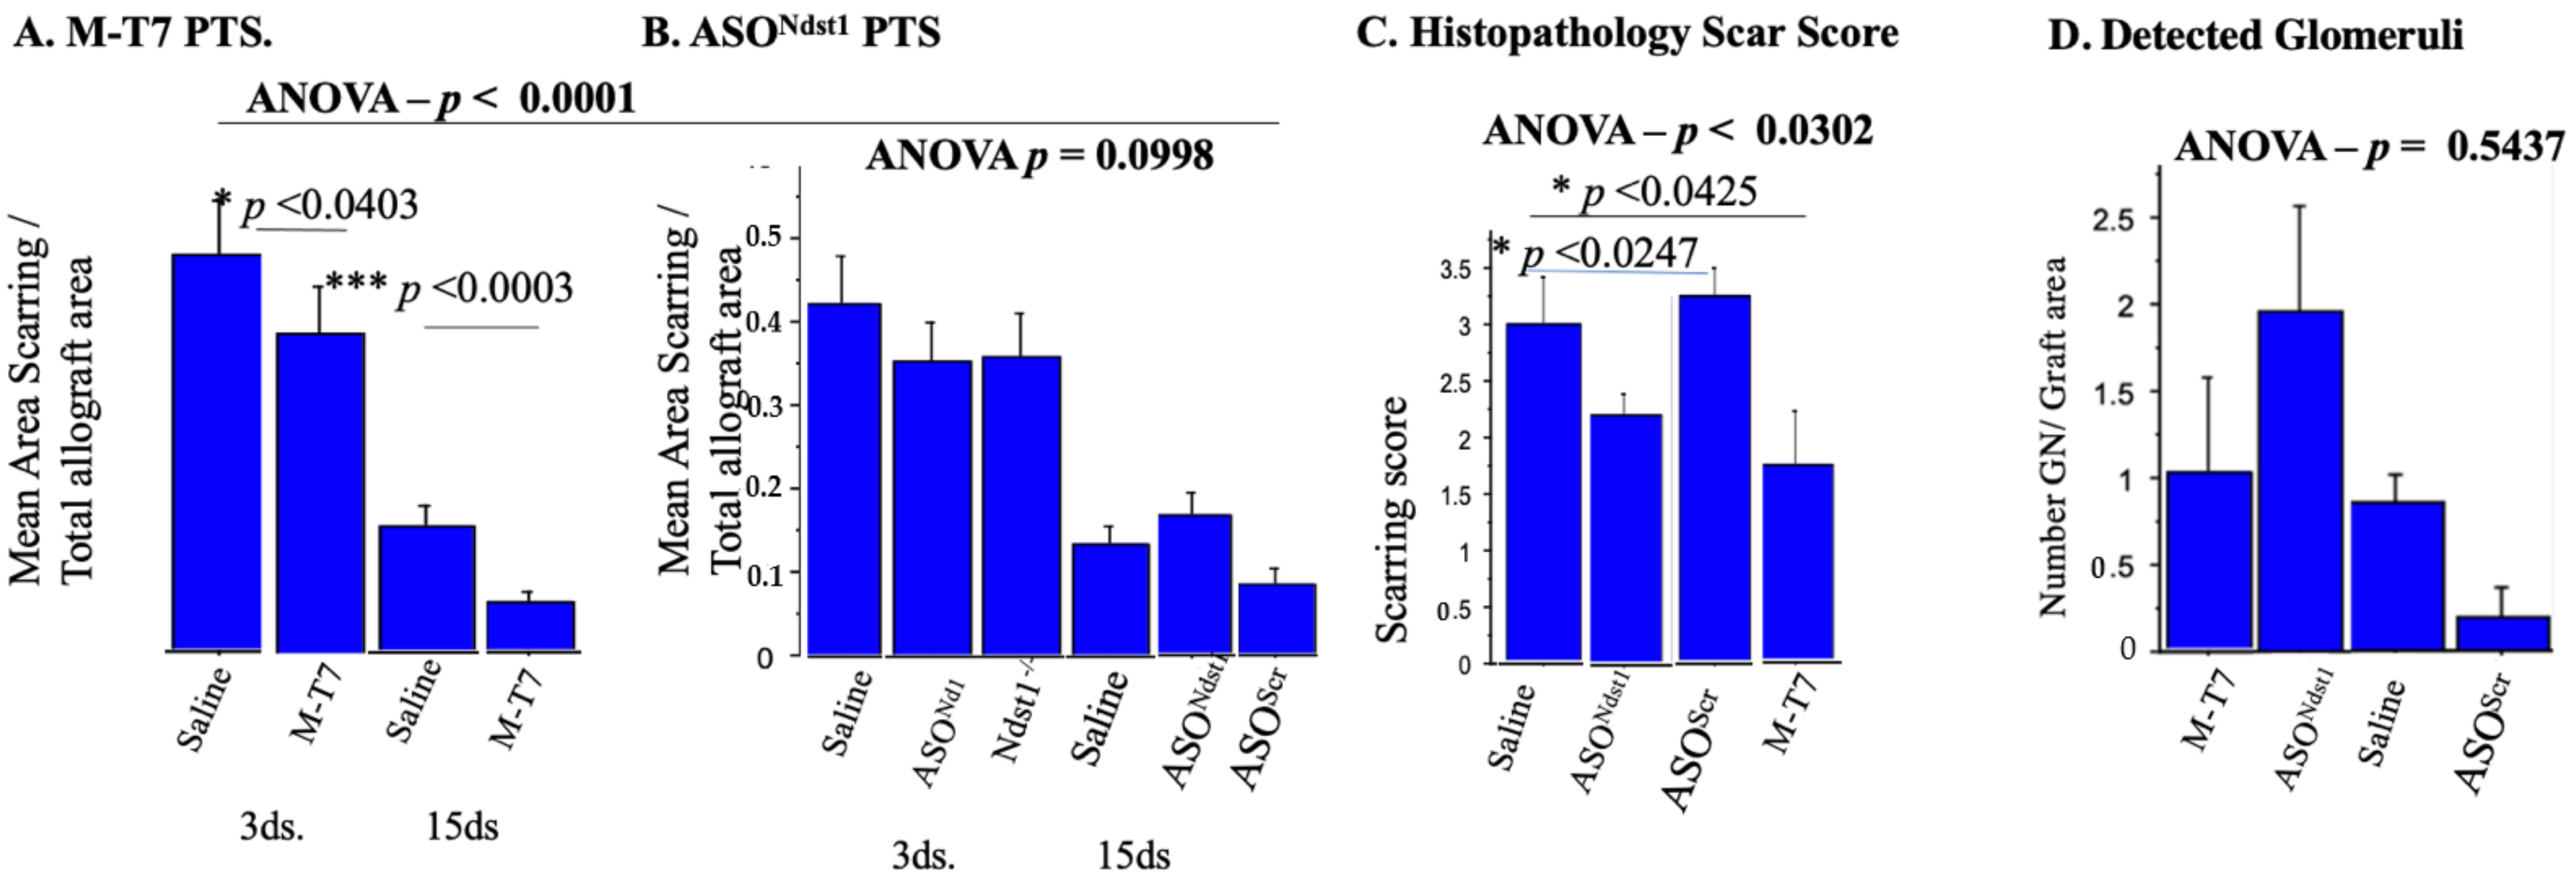
2.1. Soaking Pre-Treatment (PTS) of Subcapsular Renal Allografts with M-T7 Significantly Reduced Inflammation at 15 Days Follow Up
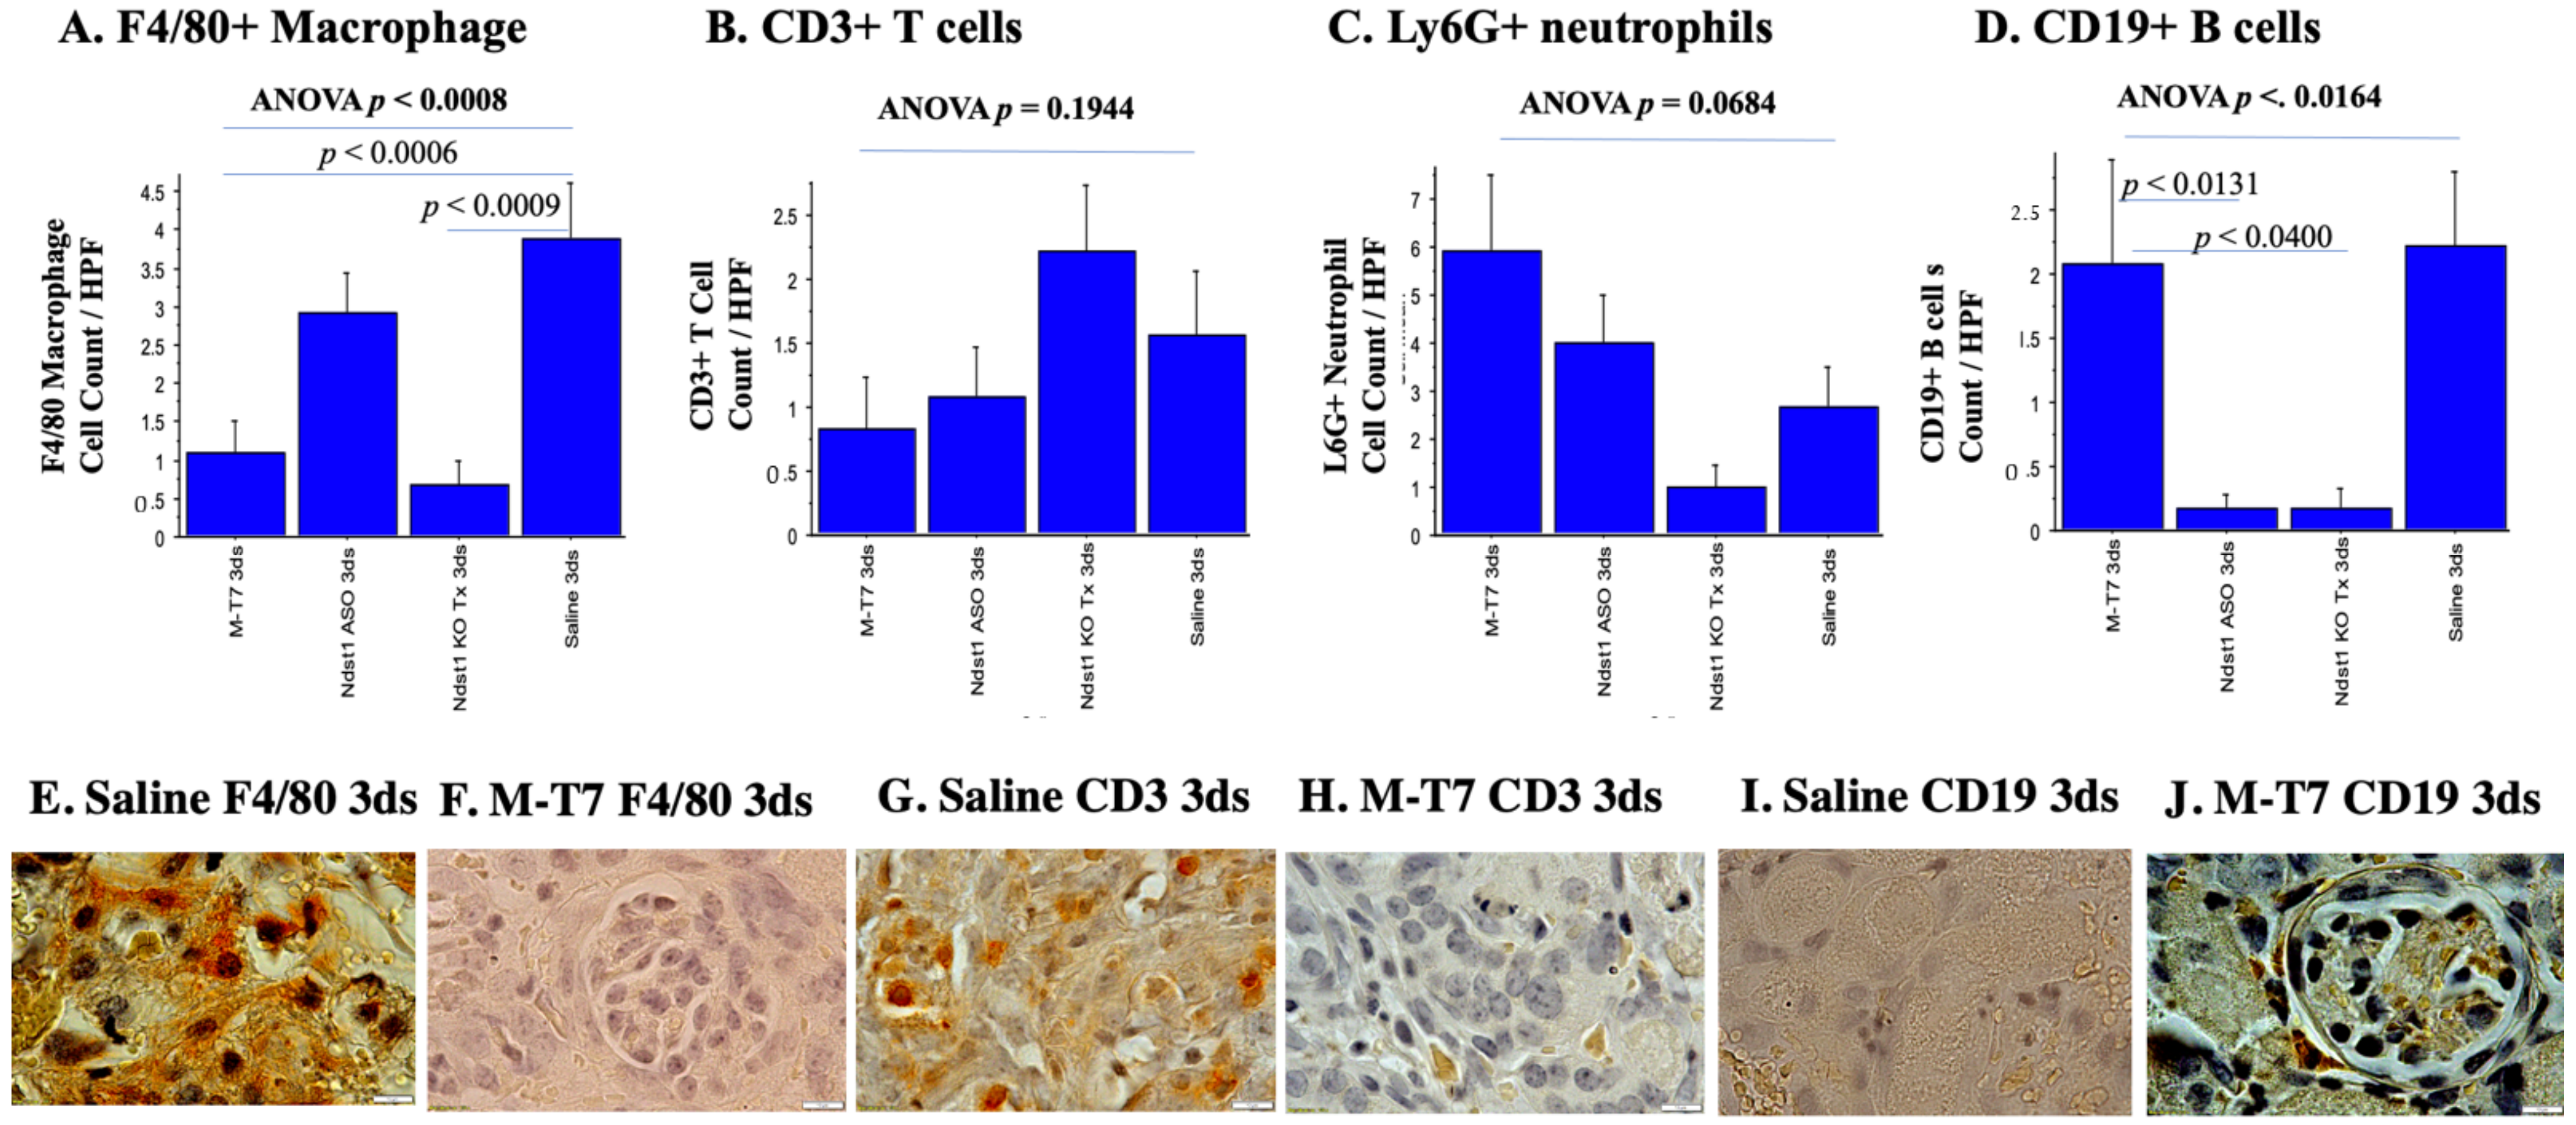
2.2. Immunohistochemical Analyses of Immune Cell Invasion
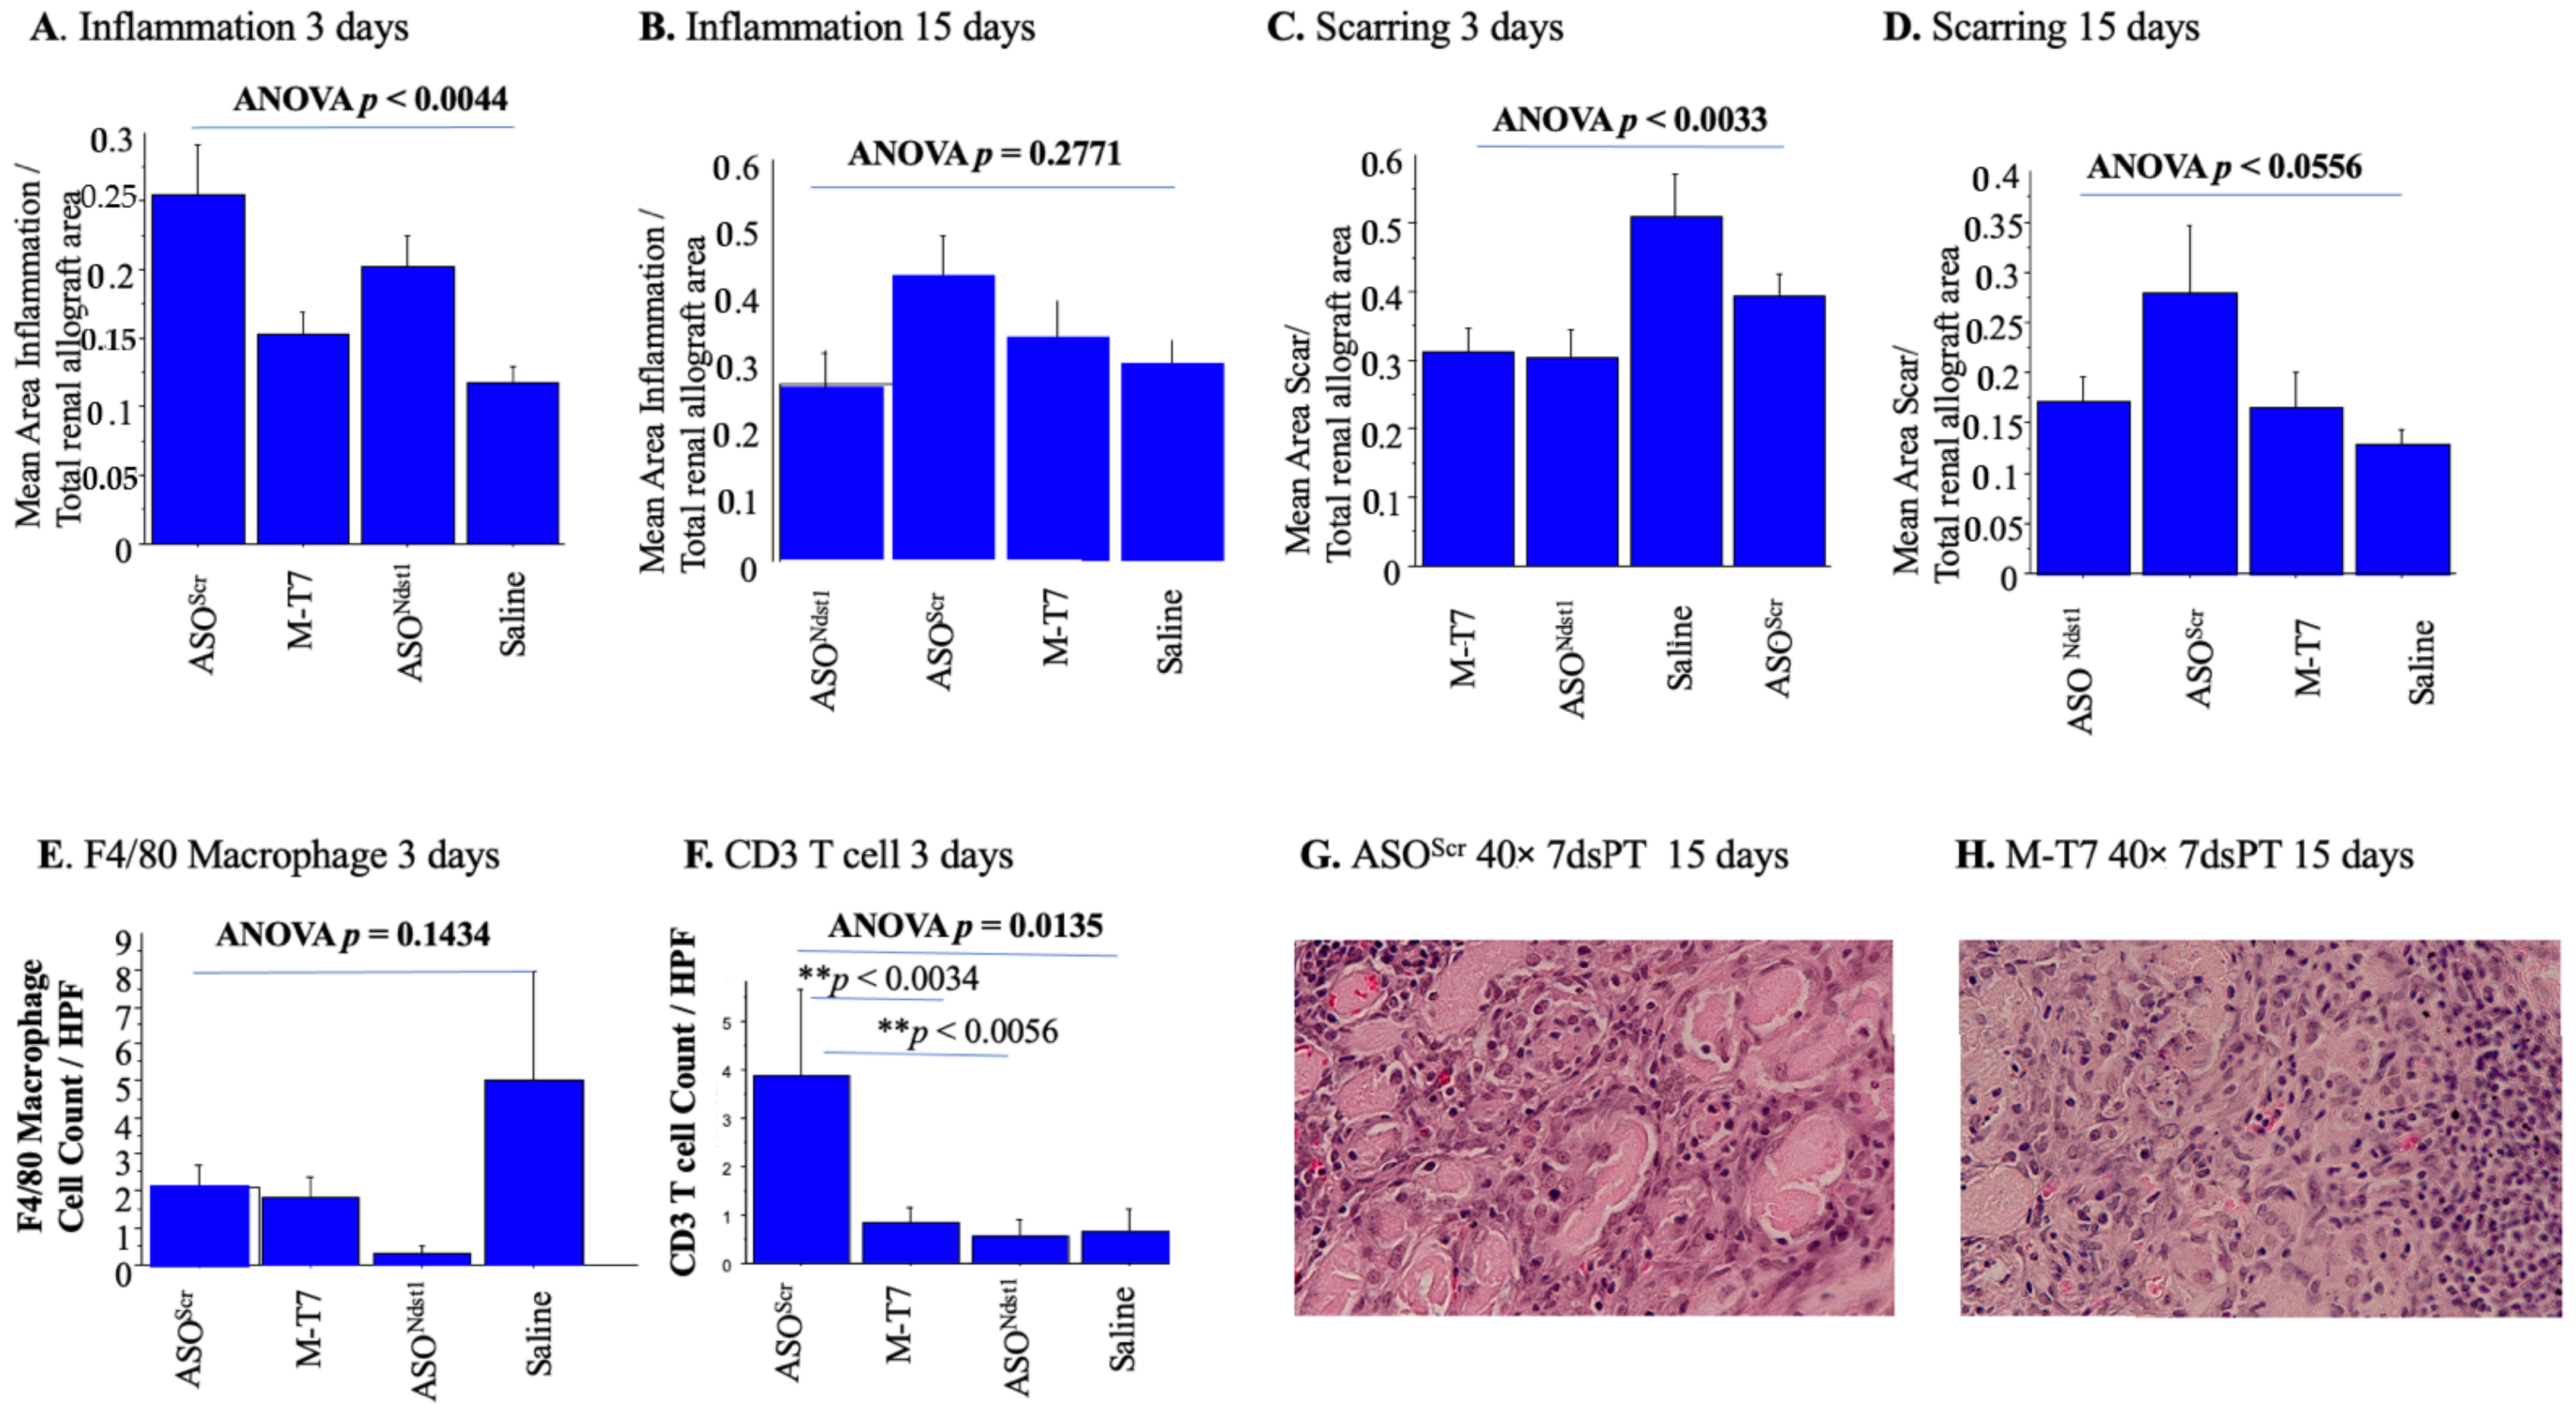
2.3. Seven Day Pretreatment (7dsPT) with M-T7 or ASONdst1 Did Not Reduce Inflammation, but Did Reduce Scarring
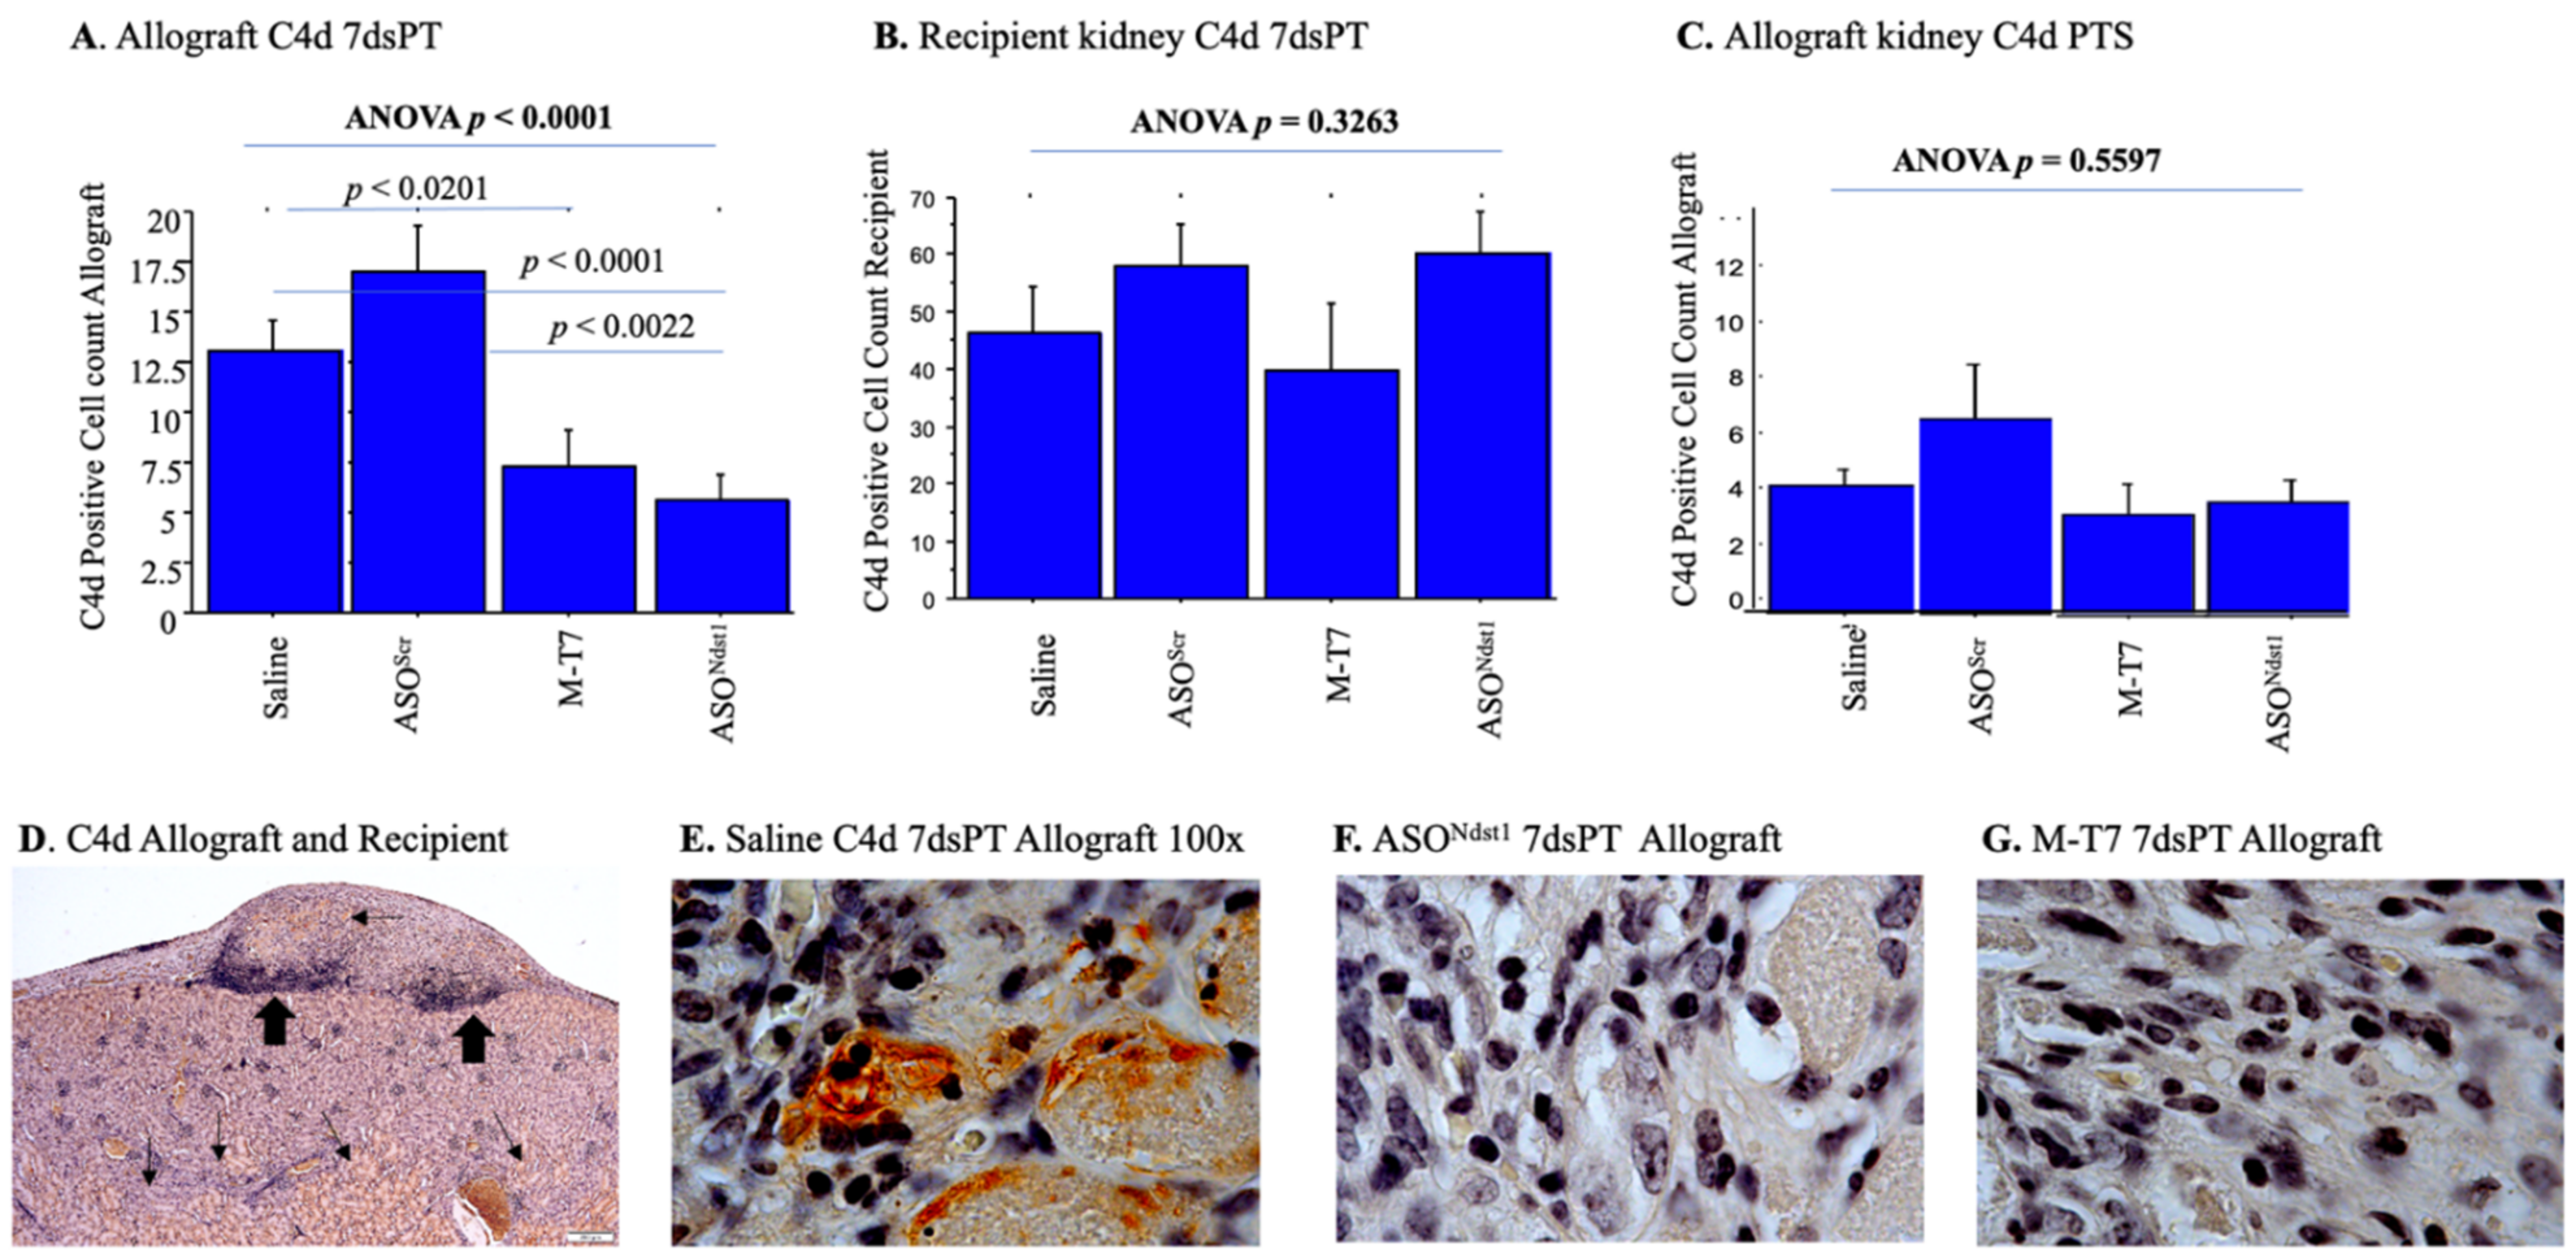
2.4. C4d Positive Staining Is Increased in Both the Subcapsular Allografts as Well as the Recipient Kidney
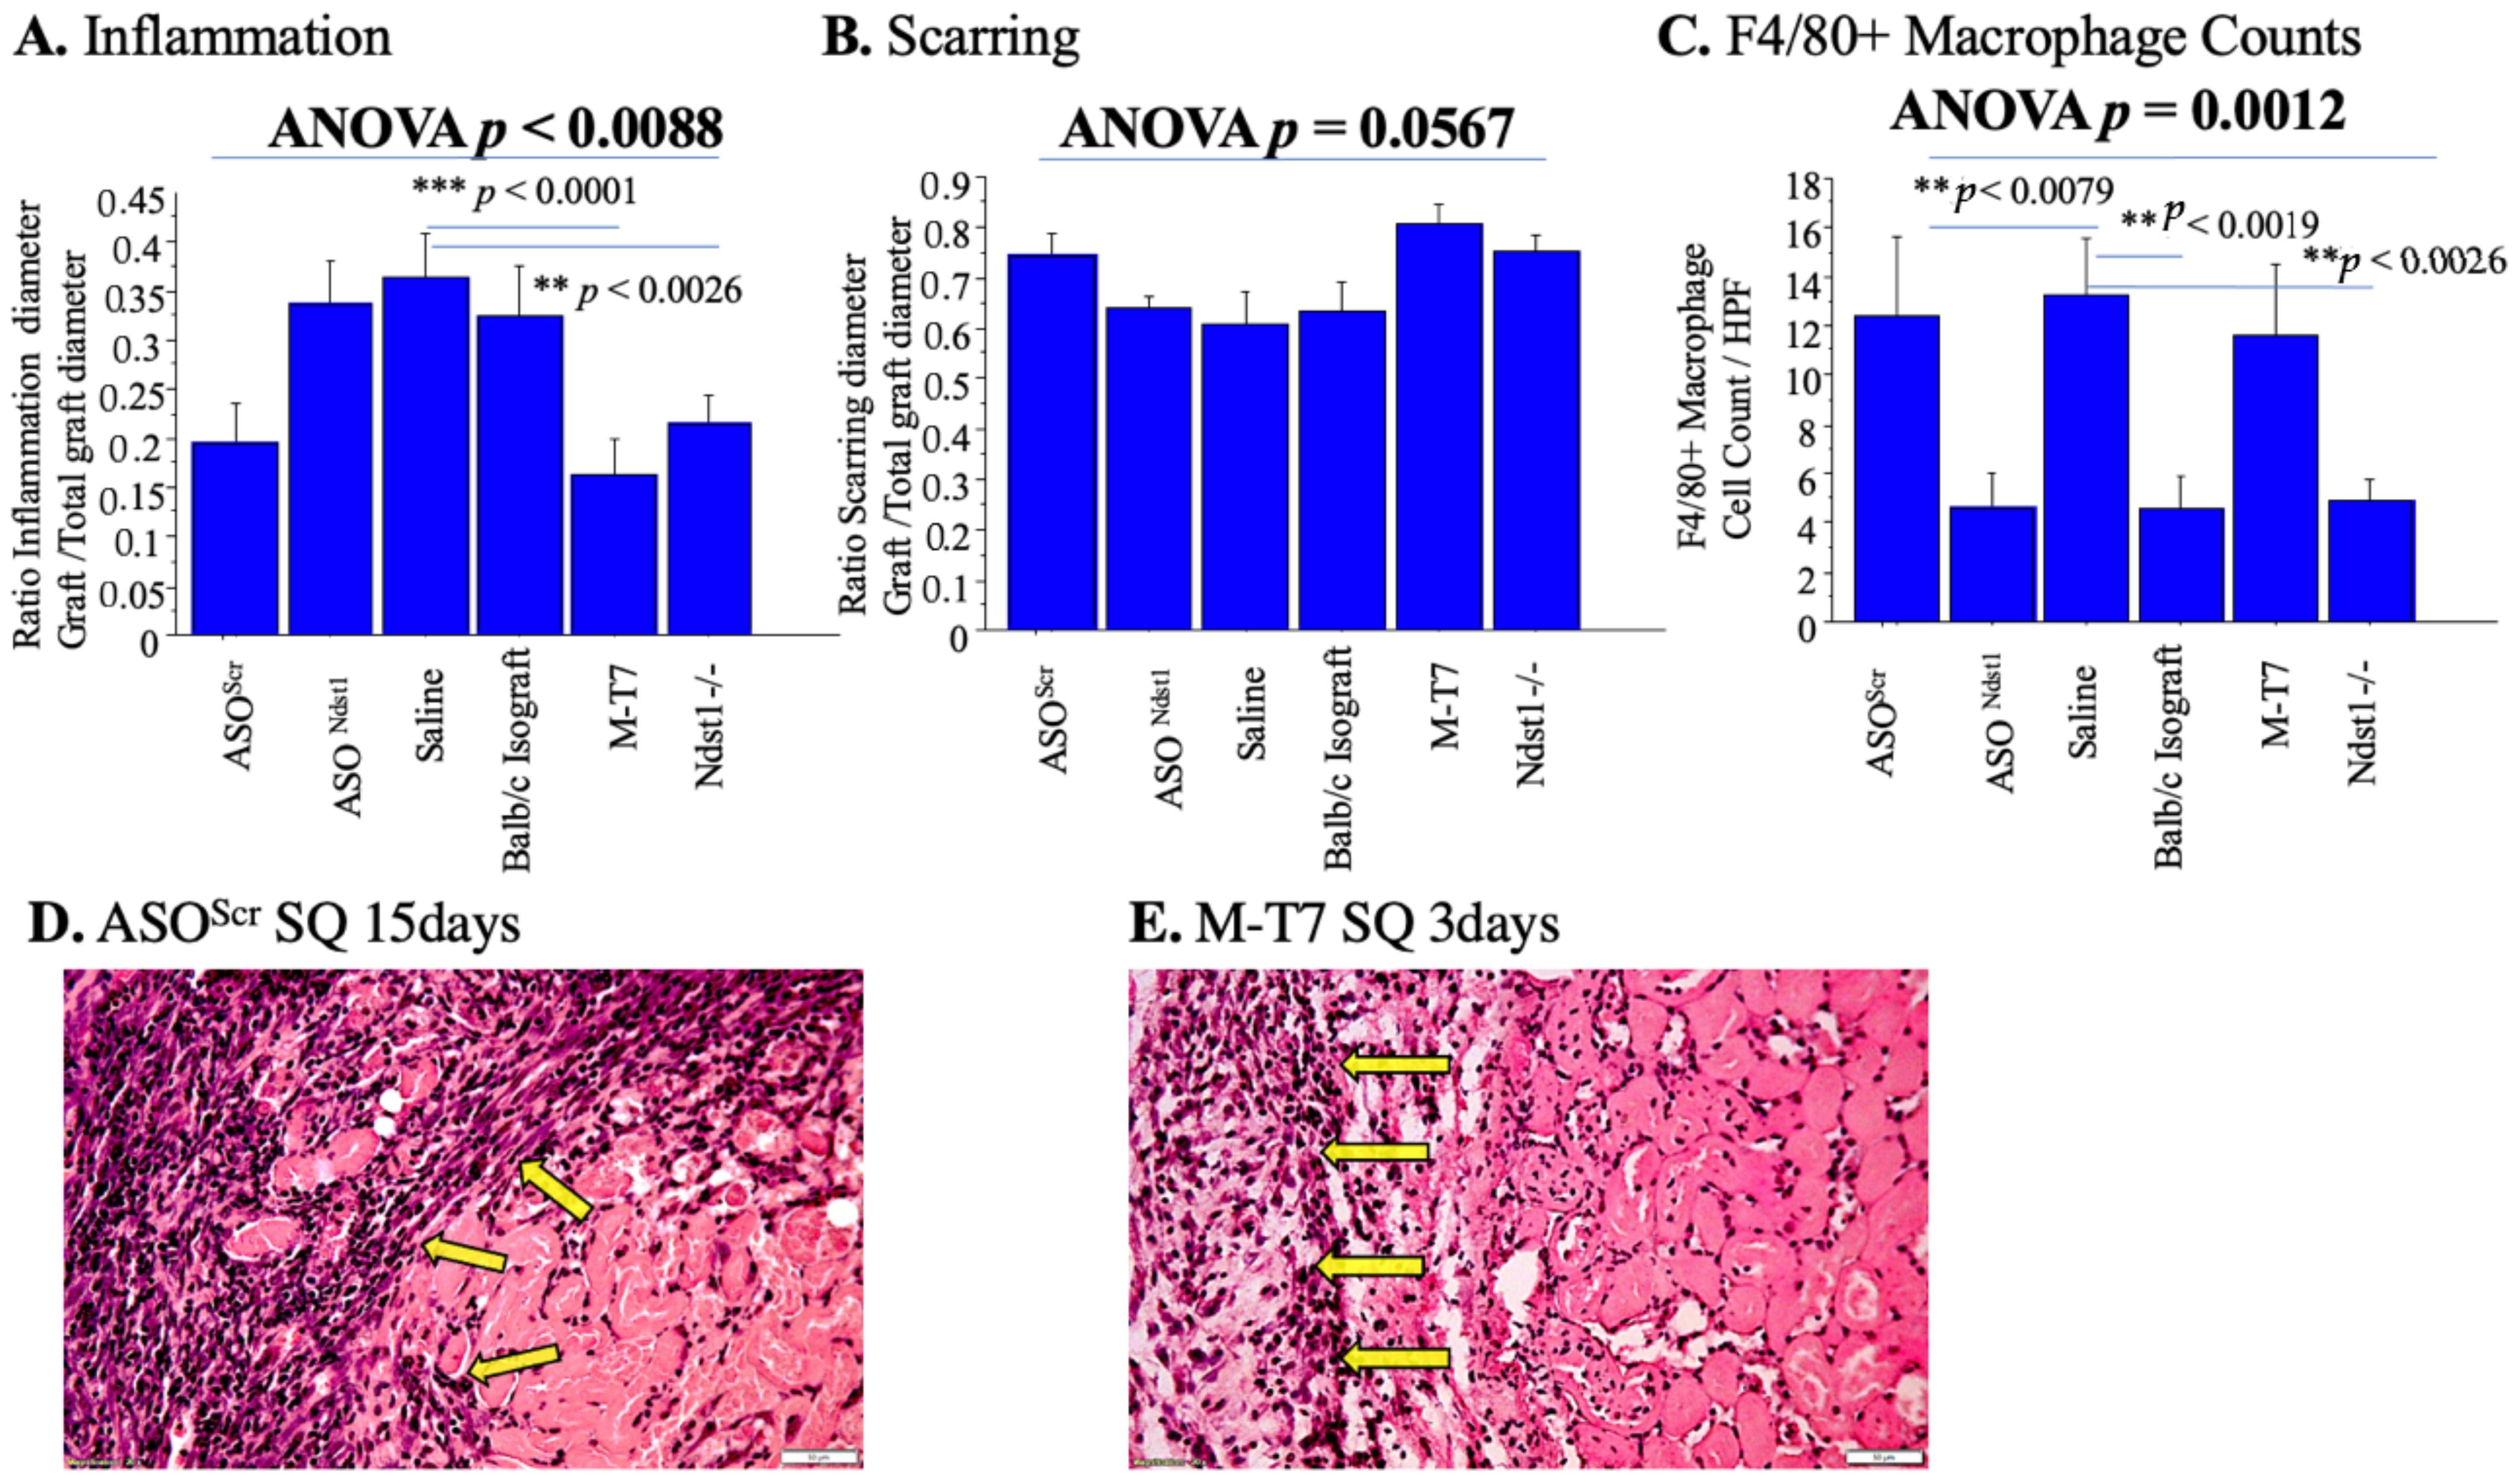
2.5. Subcutaneous Renal Allograft Transplant Demonstrated a Significant Reduction in Inflammation and Scarring with M-T7 PTS
3. Discussion
4. Methods
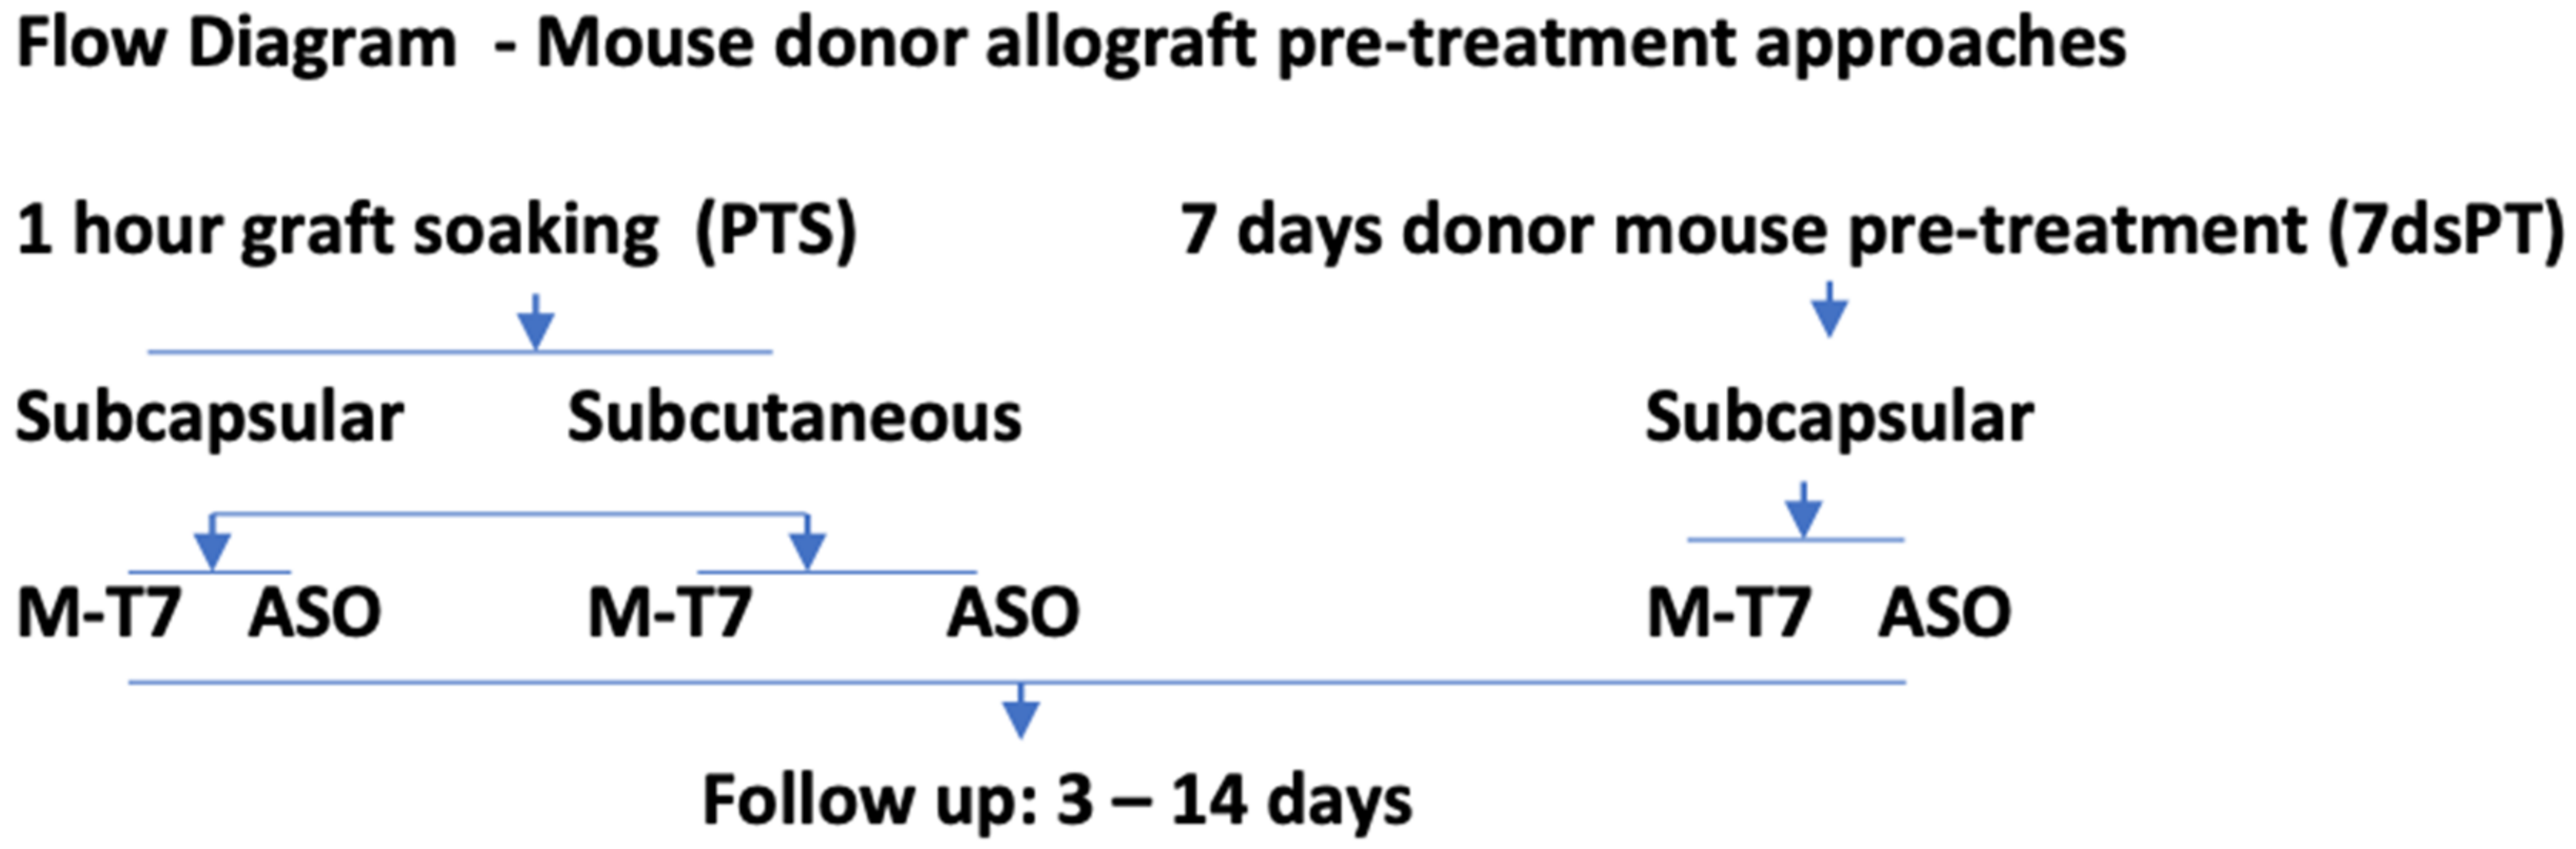
4.1. Pretreatment of Allografts: Pretreatment Soaking (PTS) of Renal Allografts and 7 Days Pretreatment of Renal Allograft Donors (7dsPT)
4.2. Subcapsular Renal Allograft Transplant
4.3. Subcutaneous Renal Allograft Transplant
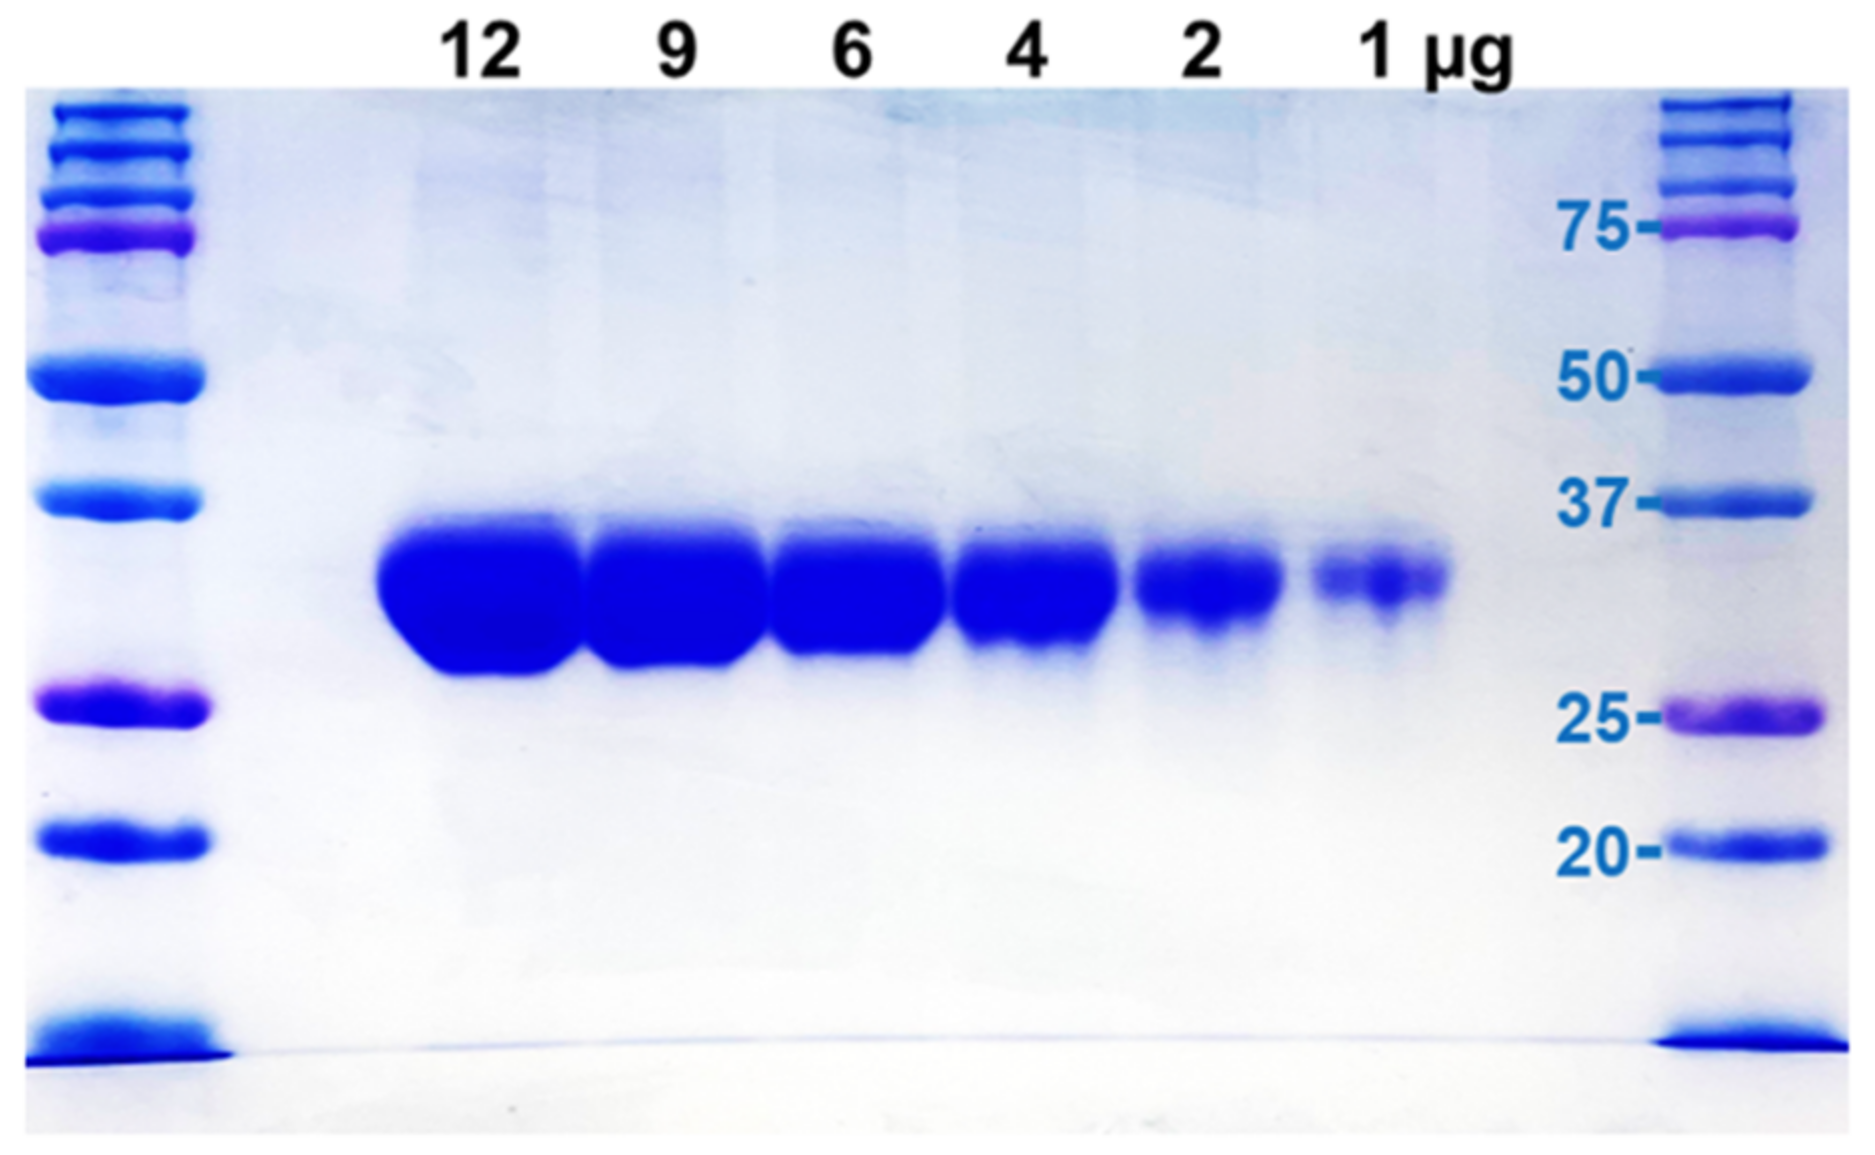
4.4. M-T7 Expression and Purification
4.5. Antisense to N Deacetylase Sulfotransferase-1 (Ndst1) ASONdst1 Construct Design
4.6. Histopathology and Immunohistochemistry
4.7. Statistical Analysis
Author Contributions
Funding
Institutional Review Board Statement
Informed Consent Statement
Data Availability Statement
Conflicts of Interest
References
- Bello, A.K.; Levin, A.; Tonelli, M.; Okpechi, I.G.; Feehally, J.; Harris, D.; Jindal, K.; Salako, B.L.; Rateb, A.; Osman, M.A.; et al. Assessment of Global Kidney Health Care Status. JAMA 2017, 317, 1864–1881. [Google Scholar] [CrossRef] [PubMed]
- Knoll, G. Trends in Kidney Transplantation over the Past Decade. Drugs 2008, 68, 3–10. [Google Scholar] [CrossRef] [PubMed]
- Van der Hoeven, J.A.B.; Molema, G.; Ter Horst, G.J.; Freund, R.L.; Wiersema, J.; van Schilfgaarde, R.; Leuvenink, H.G.D.; Ploeg, R.J. Relationship between duration of brain death and hemodynamic (in) stability on progressive dysfunction and increased immunologic activation of donor kidneys. Kidney Int. 2003, 64, 1874–1882. [Google Scholar] [CrossRef] [Green Version]
- Takada, M.; Nadeau, K.C.; Hancock, W.W.; Mackenzie, H.S.; Shaw, G.D.; Waaga, A.M.; Chandraker, A.; Sayegh, M.H.; Tilney, N.L. Effects of explosive brain death on cytokine activation of peripheral organs in the rat. Transplantation 1998, 65, 1533–1542. [Google Scholar] [CrossRef] [PubMed]
- Barker, C.E.; Ali, S.; O’Boyle, G.; Kirby, J.A. Transplantation and inflammation: Implications for the modification of chemokine function. Immunology 2014, 143, 138–145. [Google Scholar] [CrossRef]
- Segerer, S.; Cui, Y.; Eitner, F.; Goodpaster, T.; Hudkins, K.L.; Mack, M.; Cartron, J.; Colin, Y.; Schlondorff, D.; Alpers, C.E. Expression of Chemokines and Chemokine Receptors During Human Renal Transplant Rejection. Am. J. Kidney Dis. 2001, 37, 518–531. [Google Scholar] [CrossRef]
- Liu, L.; Lalani, A.; Dai, E.; Seet, B.; Macauley, C.; Singh, R.; Fan, L.; McFadden, G.; Lucas, A. The Viral anti-inflammatory chemokine-binding protein M-T7 reduces intimal hyperplasia after vascular injury. J. Clin. Investig. 2000, 105, 1613–1621. [Google Scholar] [CrossRef] [Green Version]
- Dai, E.; Liu, L.Y.; Wang, H.; McIvor, D.; Sun, Y.M.; Macaulay, C.; King, E.; Munuswamy-Ramanujam, G.; Bartee, M.Y.; Williams, J.; et al. Inhibition of Chemokine-Glycosaminoglycan Interaction in Donor Tissue Reduces Mouse Allograft Vasculopathy and Transplant Rejection. PLoS ONE 2010, 5, e10510. [Google Scholar] [CrossRef]
- Chen, H.; Ambadapadi, S.; Wakefield, D.; Bartee, M.; Yaron, J.R.; Zhang, L.; Archer-Hartmann, S.A.; Azadi, P.; Burgin, M.; Borges, C.; et al. Selective Deletion of Heparan Sulfotransferase Enzyme, Ndst1, in Donor Endothelial and Myeloid Precursor Cells Significantly Decreases Acute Allograft Rejection. Sci. Rep. 2018, 8, 13433. [Google Scholar] [CrossRef]
- Yaron, J.R.; Zhang, L.; Guo, Q.; Burgin, M.; Schutz, L.N.; Awo, E.; Wise, L.; Krause, K.L.; Ildefonso, C.J.; Kwiecien, J.M.; et al. Deriving Immune Modulating Drugs from Viruses—A New Class of Biologics. J. Clin. Med. 2020, 9, 972. [Google Scholar] [CrossRef] [Green Version]
- Benko, M.; Lenhartová, S.; Kempová, V.; Betáková, T.; Kúdelová, M. Chemokine- binding proteins encoded by herpesviruses. Acta Virol. 2020, 64, 233–244. [Google Scholar] [CrossRef] [PubMed]
- Sun, Y.; Feng, J.; Shi, J.; Lu, X.; Xie, A.; Chen, Y.; Dong, N. Gene transfer of the S24F regulated on activation normal T-cell expressed and secreted-chemokine ligand 5 variant attenuates cardiac allograft rejection. Transplantation 2014, 97, 1233–1239. [Google Scholar] [CrossRef] [PubMed]
- Dehmel, S.; Wang, S.; Schmidt, C.; Kiss, E.; Loewe, R.P.; Chilla, S.; Schlöndorff, D.; Gröne, H.; Luckow, B. Chemokine receptor Ccr5 deficiency induces alternative macrophage activation and improves long-term renal allograft outcome. Eur. J. Immunol. 2010, 40, 267–278. [Google Scholar] [CrossRef]
- Bédard, E.L.R.; Kim, P.; Jiang, J.; Parry, N.; Liu, L.; Wang, H.; Garcia, B.; Li, X.; McFadden, G.; Lucas, A.R.; et al. Chemokine-binding viral protein M-T7 prevents chronic rejection in rat renal allografts. Transplantation 2003, 76, 249–252. [Google Scholar] [CrossRef] [PubMed]
- Duni, A.; Liakopoulos, V.; Koutlas, V.; Pappas, C.; Mitsis, M.; Dounousi, E. The Endothelial Glycocalyx as a Target of Ischemia and Reperfusion Injury in Kidney Transplantation-Where Have We Gone So Far? Int. J. Mol. Sci. 2021, 22, 2157. [Google Scholar] [CrossRef]
- Stuhlmeier, K.M.; Tarn, C.; Bach, F.H. The effect of 5,8,11,14-eicosatetraynoic acid on endothelial cell gene expression. Eur. J. Pharmacol. 1997, 325, 209–219. [Google Scholar] [CrossRef]
- Platt, J.L.; Wrenshall, L.E.; Johnson, G.B.; Cascalho, M. Heparan Sulfate Proteoglycan Metabolism and the Fate of Grafted Tissues. Adv. Exp. Med. Biol. 2015, 865, 123–140. [Google Scholar] [CrossRef] [Green Version]
- Marshall, P.L.; Nagy, N.; Kaber, G.; Barlow, G.L.; Ramesh, A.; Xie, B.J.; Linde, M.H.; Haddock, N.L.; Lester, C.A.; Tran, Q.; et al. Hyaluronan synthesis inhibition impairs antigen presentation and delays transplantation rejection. Matrix. Biol. 2021, 96, 69–86. [Google Scholar] [CrossRef]
- Barbas, A.S.; Lin, L.; McRae, M.; MacDonald, A.L.; Truong, T.; Yang, Y.; Brennan, T.V. Heparan sulfate is a plasma biomarker of acute cellular allograft rejection. PLoS ONE 2018, 13, e0200877. [Google Scholar] [CrossRef] [Green Version]
- Mueller, F.B.; Yang, H.; Lubetzky, M.; Verma, A.; Lee, J.R.; Darshana MDadhania, D.M.; Xiang, J.Z.; Salvatore, S.P.; Seshan, S.V.; Sharma, V.K.; et al. Landscape of innate immune system transcriptome and acute T cell–mediated rejection of human kidney allografts. JCI Insight 2019, 4, e128014. [Google Scholar] [CrossRef]
- Crijns, H.; Vanheule, V.; Proost, P. Targeting Chemokine-Glycosaminoglycan interactions to inhibit inflammation. Front. Immunol. 2020, 11, 483. [Google Scholar] [CrossRef] [PubMed]
- Lo, D.J.; Weaver, T.A.; Kleiner, D.E.; Mannon, R.B.; Jacobson, L.M.; Becker, B.N.S.; Swanson, J.; Hale, D.A.; Kirk, A.D. Chemokines and their receptors in human renal allotransplantation. Transplantation 2011, 91, 70–77. [Google Scholar] [CrossRef] [PubMed] [Green Version]
- Claeys, E.; Vermeire, K. Immunosuppressive drugs in organ transplantation to prevent allograft rejection: Mode of action and side effects. J. Immunol. Sci. 2019, 3, 14–21. [Google Scholar] [CrossRef]
- Schnuelle, P.; Schmitt, W.H.; Weiss, C.; Habicht, A.; Renders, L.; Zeier, M.; Drüschler, F.; Heller, K.; Pisarski, P.; Banas, B.; et al. Effects of dopamine donor pretreatment on graft survival after kidney transplantation: A Randomized trial. Clin. J. Am. Soc. Nephrol. 2017, 12, 493–501. [Google Scholar] [CrossRef] [PubMed] [Green Version]
- Zhao, H.; Zhang, Y.; Song, G.; Zhao, W.; Bai, X.; Zhang, J.; Zhao, X. The significance for chronic rejection of cardiac allograft of regulated upon activation normal T-cell cytokine and its CCR5 receptor. Transplant. Proc. 2013, 45, 635–638. [Google Scholar] [CrossRef]
- Vettel, C.; Hottenrott, M.C.; Spindler, R.; Benck, U.; Schnuelle, P.; Tsagogiorgas, C.; Krämer, B.K.; Hoeger, S.; El-Armouche, A.; Wieland, T.; et al. Dopamine and lipophilic derivates protect cardiomyocytes against cold preservation injury. J. Pharmacol. Exp. Ther. 2014, 348, 77–85. [Google Scholar] [CrossRef] [Green Version]
- Li, J.; Xia, J.; Zhang, K.; Xu, L. Suppression of acute and chronic cardiac allograft rejection in mice by inhibition of chemokine receptor 5 in combination with cyclosporine A. J. Surg. Res. 2009, 157, 81–90. [Google Scholar] [CrossRef]
- Nykänen, A.I.; Holmström, E.J.; Tuuminen, R.; Krebs, R.; Dhaygude, K.; Kankainen, M.; Jokinen, J.J.; Lommi, J.; Helanterä, I.; Räisänen-Sokolowski, A.; et al. Donor simvastatin treatment in heart transplantation. Circulation 2019, 140, 627–640. [Google Scholar] [CrossRef] [Green Version]
- Tatapudi, V.S.; Montgomery, R.A. Pharmacologic complement inhibition in clinical transplantation. Curr. Transplant. Rep. 2017, 4, 91–100. [Google Scholar] [CrossRef] [PubMed] [Green Version]
- Fu, C.; Shi, L.; Huang, X.; Feng, H.; Tan, X.; Chen, S.; Zhu, L.; Sun, Q.; Chen, G. Atrase B, a novel metalloprotease with anti-complement and anti-coagulant activity, significantly delays discordant cardiac xenograft rejection. Xenotransplantation 2020, 27, e12616. [Google Scholar] [CrossRef]
- Lei, B.; Sleiman, M.M.; Cheng, Q.; Tu, Z.; Zhu, P.; Goddard, M.; Martins, P.N.; Langerude, L.; Nadig, S.; Tomlinson, S.; et al. In Situ Pre-Treatment of vascularized composite allografts with a targeted complement inhibitor protects against brain death and ischemia reperfusion induced injuries. Front. Immunol. 2021, 12, 630581. [Google Scholar] [CrossRef] [PubMed]
- Brüggenwirth, I.M.A.; Martins, P.N. RNA interference therapeutics in organ transplantation: The dawn of a new era. Am. J. Transplant. 2020, 20, 931–941. [Google Scholar] [CrossRef] [PubMed]
- Cui, J.; Qin, L.; Zhang, J.; Abrahimi, P.; Li, H.; Li, G.; Tietjen, G.T.; Tellides, G.; Pober, J.S.; Saltzman, W.M. Ex vivo pretreatment of human vessels with siRNA nanoparticles provides protein silencing in endothelial cells. Nat. Commun. 2017, 8, 191. [Google Scholar] [CrossRef] [PubMed]
- Liu, G.; He, X.; Lu, N.; Qiu, Y.; Wang, H. Attenuation of allograft rejection by intragraft inhibition of class II transcativator in high responder rat liver transplantation. Microsurgery 2015, 35, 52–59. [Google Scholar] [CrossRef]
- Lalani, A.S.; Graham, K.; Mossman, K.; Rajarathnam, K.; Clark-Lewis, I.; Kelvin, D.; McFadden, G. The purified myxoma virus gamma interferon receptor homolog M-T7 interacts with the heparin-binding domains of chemokines. J. Virol. 1997, 71, 4356–4363. [Google Scholar] [CrossRef] [Green Version]
- Bartee, M.Y.; Chen, H.; Dai, E.; Liu, L.Y.; Davids, J.A.; Lucas, A. Defining the anti-inflammatory activity of a potent myxomaviral chemokine modulating protein, MT7, through site directed mutagenesis. Cytokine 2014, 65, 79–87. [Google Scholar] [CrossRef]
- Crescioli, C. Chemokines and transplant Outcome. Clin. Biochem. 2016, 49, 355–362. [Google Scholar] [CrossRef]
- Tatsumi, K.; Okano, T. Hepatocyte Transplantation: Cell Sheet Technology for Liver Cell Transplantation. Curr. Transpl. Rep. 2017, 4, 184–192. [Google Scholar] [CrossRef] [Green Version]
- Hertz, M.; Jessurun, J.; King, M.; Savik, S.; Murray, J. Reproduction of the Obliterative Bronchiolitis Lesion after Heterotopic Transplantation of Mouse Airways. Am. J. Pathol. 1993, 142, 1945–1951. [Google Scholar]
- Ohashi, K.; Yokoyama, T.; Yamato, M.; Kuge, H.; Kanehiro, H.; Amanuma, T.; Iwata, H.; Yang, J.; Okano, T.; Okano, T.; et al. Engineering functional two-and three-dimensional liver systems in vivo using hepatic tissue sheets. Nat. Med. 2007, 13, 880–885. [Google Scholar] [CrossRef]
- Shimizu, T.; Sekine, H.; Yang, J.; Isoi, Y.; Yamato, M.; Kikuchi, A.; Kobayashi, E.; Okano, T. Polysurgery of cell sheet grafts overcomes diffusion limits to produce thick, vascularized myocardial tissues. FASEB J. 2006, 20, 708–710. [Google Scholar] [CrossRef] [PubMed]
- Turner, J.; Becker, M.; Mittrucker, H.; Panzer, U. Tissue Resident Lymphocytes in the Kidney. J. Am. Soc. Nephrol. 2018, 29, 389–399. [Google Scholar] [CrossRef] [PubMed]
- Hori, J.; Joyce, N.; Streilein, J.W. Epithelium-Deficient Corneal Allografts Display Immune Privilege beneath the Kidney Capsule. Investig. Ophtalmol. Vis. Sci. 2000, 41, 443–452. [Google Scholar]
- Miyabe, Y.; Sekiya, S.; Sugiura, N.; Oka, M.; Karasawa, K.; Moriyama, T.; Nitta, K.; Shimizu, T. Renal Subcapsular transplantation of hepatocyte growth factor-producing mesothelial cell sheets improves ischemia-reperfusion injury. Am. J. Physiol. Renal. Physiol. 2019, 317, F229–F239. [Google Scholar] [CrossRef] [PubMed]
- Berg, C.; Ritsma, L.; Avramut, M.; Wiersma, L.; Berg, B.; Leuning, D.G.; Lievers, E.; Koning, M.; Vanslambrouck, J.M.; Koster, A.J.; et al. Renal Subcapsular Transplantation of PSC-Derived Kidney Organoids Induces Neo-vasculogenesis and Significant Glomerular and Tubular Maturation In vivo. Stem Cell Rep. 2018, 10, 751–765. [Google Scholar] [CrossRef] [PubMed] [Green Version]
- Burgin, M.; Yaron, J.R.; Zhang, L.; Guo, Q.; Daggett, J.; Kilbourne, J.; Lowe, K.M.; Lucas, A.R. Kidney Subcapsular Allograft Transplants as a Model to Test Virus-Derived Chemokine Modulating Proteins as Therapeutics. Methods Mol. Biol. 2021, 2225, 257–273. [Google Scholar] [CrossRef] [PubMed]


| Renal Allograft Pretreatment-PTS and 7dsPT | Transplant Donor Mouse–Recipient Mouse | Treatment | Days Follow Up | Number of Transplant Procedures |
|---|---|---|---|---|
| PTS Subcapsular transplant Pre-treatment Soak-1 h | C57BL/6-BALB/c | Saline | 3 days | 4 |
| Ndst1−/− C57Bl/6-BALB/c | Saline | 4 | ||
| C57BL/6-BALB/c | M-T7 | 4 | ||
| C57BL/6-BALB/c | ASONdst1 | 4 | ||
| C57BL/6-BALB/c | ASOScr | 4 | ||
| PTS Subcapsular transplant Pre-treatment Soak-1 h | C57BL/6-BALB/c | Saline | 15 days | 10 |
| Ndst1−/− C57Bl/6-BALB/c | Saline | 4 | ||
| C57BL/6-BALB/c | M-T7 | 5 | ||
| C57BL/6-BALB/c | ASONdst1 | 7 | ||
| C57BL/6-BALB/c | ASOScr | 4 | ||
| 7dsPT Subcapsular transplant-Pre-treatment donor-7 days | C57BL/6-BALB/c | Saline | 3 days | 6 |
| C57BL/6-BALB/c | M-T7 | 6 | ||
| C57BL/6-BALB/c | ASONdst1 | 6 | ||
| C57BL/6-BALB/c | ASOScr | 6 | ||
| 7dsPT Subcapsular transplant-7days Pre-treatment donor-7 days | C57BL/6-BALB/c | Saline | 15 days | 6 |
| C57BL/6-BALB/c | M-T7 | 6 | ||
| C57BL/6-BALB/c | ASONdst1 | 6 | ||
| C57BL/6-BALB/c | ASOScr | 6 | ||
| PTS Subcutaneous transplant Pre-treatment Soak-1 h | C57BL/6-BALB/c | Saline | 3 days | 6 |
| Ndst1−/− C57Bl/6-BALB/c | Saline | 6 | ||
| C57BL/6-BALB/c | M-T7 | 3 | ||
| C57BL/6-BALB/c | ASONdst1 | 6 | ||
| C57BL/6-BALB/c | ASOScr | 6 | ||
| BALB/c-BALB/c | Saline | 5 | ||
| PTS Subcutaneous transplant Pre-treatment Soak-1 h | C57BL/6-BALB/c | Saline | 15 days | 2 |
| Ndst1−/− C57Bl/6-BALB/c | Saline | 6 | ||
| C57BL/6-BALB/c | M-T7 | 4 | ||
| C57BL/6-BALB/c | ASONdst1 | 8 | ||
| C57BL/6-BALB/c | ASOScr | 4 | ||
| BALB/c-BALB/c | Saline | 6 |
Publisher’s Note: MDPI stays neutral with regard to jurisdictional claims in published maps and institutional affiliations. |
© 2022 by the authors. Licensee MDPI, Basel, Switzerland. This article is an open access article distributed under the terms and conditions of the Creative Commons Attribution (CC BY) license (https://creativecommons.org/licenses/by/4.0/).
Share and Cite
Zanetti, I.R.; Burgin, M.; Zhang, L.; Yeh, S.T.; Ambadapadi, S.; Kilbourne, J.; Yaron, J.R.; Lowe, K.M.; Daggett-Vondras, J.; Fonseca, D.; et al. Virus-Derived Chemokine Modulating Protein Pre-Treatment Blocks Chemokine–Glycosaminoglycan Interactions and Significantly Reduces Transplant Immune Damage. Pathogens 2022, 11, 588. https://0-doi-org.brum.beds.ac.uk/10.3390/pathogens11050588
Zanetti IR, Burgin M, Zhang L, Yeh ST, Ambadapadi S, Kilbourne J, Yaron JR, Lowe KM, Daggett-Vondras J, Fonseca D, et al. Virus-Derived Chemokine Modulating Protein Pre-Treatment Blocks Chemokine–Glycosaminoglycan Interactions and Significantly Reduces Transplant Immune Damage. Pathogens. 2022; 11(5):588. https://0-doi-org.brum.beds.ac.uk/10.3390/pathogens11050588
Chicago/Turabian StyleZanetti, Isabela R., Michelle Burgin, Liqiang Zhang, Steve T. Yeh, Sriram Ambadapadi, Jacquelyn Kilbourne, Jordan R. Yaron, Kenneth M. Lowe, Juliane Daggett-Vondras, David Fonseca, and et al. 2022. "Virus-Derived Chemokine Modulating Protein Pre-Treatment Blocks Chemokine–Glycosaminoglycan Interactions and Significantly Reduces Transplant Immune Damage" Pathogens 11, no. 5: 588. https://0-doi-org.brum.beds.ac.uk/10.3390/pathogens11050588