Article

Legionella Diversity and Spatiotemporal Variation in the Occurrence of Opportunistic Pathogens within a Large Building Water System

1
Homeland Security and Materials Management Division, Center for Environmental Solutions & Emergency Response (CESER), Office of Research and Development (ORD), US Environmental Protection Agency (USEPA), Cincinnati, OH 45268, USA
2
Pegasus Technical Services, Inc c/o US EPA, Cincinnati, OH 45268, USA
3
Water Infrastructure Division, Center for Environmental Solutions & Emergency Response (CESER), US Environmental Protection Agency (USEPA), Office of Research and Development (ORD), Cincinnati, OH 45268, USA
*
Author to whom correspondence should be addressed.
Submission received: 8 June 2020 / Revised: 6 July 2020 / Accepted: 7 July 2020 / Published: 13 July 2020
(This article belongs to the Special Issue Legionella Contamination in Water Environment)

Abstract

:
Understanding Legionella survival mechanisms within building water systems (BWSs) is challenging due to varying engineering, operational, and water quality characteristics unique to each system. This study aimed to evaluate Legionella, mycobacteria, and free-living amoebae occurrence within a BWS over 18–28 months at six locations differing in plumbing material and potable water age, quality, and usage. A total of 114 bulk water and 57 biofilm samples were analyzed. Legionella culturability fluctuated seasonally with most culture-positive samples being collected during the winter compared to the spring, summer, and fall months. Positive and negative correlations between Legionella and L. pneumophila occurrence and other physiochemical and microbial water quality parameters varied between location and sample types. Whole genome sequencing of 19 presumptive Legionella isolates, from four locations across three time points, identified nine isolates as L. pneumophila serogroup (sg) 1 sequence-type (ST) 1; three as L. pneumophila sg5 ST1950 and ST2037; six as L. feeleii; and one as Ochrobactrum. Results showed the presence of a diverse Legionella population with consistent and sporadic occurrence at four and two locations, respectively. Viewed collectively with similar studies, this information will enable a better understanding of the engineering, operational, and water quality parameters supporting Legionella growth within BWSs.

1. Introduction

Various Legionella species, such as L. anisa, L. feeleii, L. longbeachae, L. pneumophila, and L. micdadei, can cause legionellosis, which are bacterial infections resulting in either a mild flu-like illness (Pontiac Fever) or a potentially fatal form of pneumonia (Legionnaires’ Disease (LD)) [1]. These infections are primarily caused by the inhalation of Legionella-contaminated aerosols generated from engineered water systems [2,3]. Of the 74 drinking water-associated outbreaks reported in the US between 2011 and 2014, Legionella was responsible for 61% of those outbreaks causing 17% (241/1437) of the illness cases, 88% (200/226) of hospitalizations, and 100% of the outbreak deaths (27/27) [4,5]. Legionella presence in the building water systems (BWSs) was cited as the main deficiency leading to those outbreaks underscoring the need to control and prevent Legionella growth within these BWSs.
Over the past 40 years, Legionella occurrence in drinking water distribution systems (DWDSs) has been well-studied since the first speculation that exposure to aerosols, derived from contaminated water chillers, caused the deadly 1976 American Legion convention outbreak in Philadelphia [6]. Legionella has been shown to occur at low levels in drinking water treatment plants and distribution systems and at higher levels in both cold and hot water within BWSs [7,8,9]. Legionella occurrence has been documented in both antiquated (> 100 years old) and newly constructed buildings [10,11]. Moreover, numerous studies have reported stable colonization of, and continuing infections caused by, L. pneumophila within BWSs over a ≥ 15 year period, despite repeated cycles of shock chlorination, superheating and thermal inactivation, and flushing [12,13,14,15,16].
Legionella occurrence in diverse environments and conditions (e.g., in sea-, fresh-, rain-, and treated water; in soil; at temperatures between 4 and 60 °C and a pH range of 2.7–8.3) [1] suggests the presence of heterogeneous survival mechanisms acquired through effective evolutionary processes. Indeed, L. pneumophila is genetically well-equipped due to their (1) high recombination rate and DNA exchange among strains and different Legionella species [17] and (2) large repertoire of effector proteins allowing exploitation of conserved cellular pathways in various eukaryotic hosts [18,19].
Due to their stringent nutrient requirements, it is hypothesized that Legionella growth within DWDSs is largely dependent on their parasitization of drinking water-associated eukaryotic hosts, specifically free-living amoebae (FLA). FLA, such as Acanthamoeba spp. and Vermamoeba vermiformis, are problematic in drinking waters systems as they can cause diseases like keratitis and can also amplify other human pathogens such as L. pneumophila and mycobacteria, including Mycobacterium intracellulare [20,21]. M. intracellulare, a member of the non-tuberculous mycobacteria (NTM) group, is a significant cause of pulmonary NTM infections [22] and has been isolated in higher frequencies and concentrations in both bulk water and biofilms from drinking water distribution systems compared to Mycobacterium avium [23].
Numerous studies have demonstrated extracellular growth of L. pneumophila in drinking water. Specifically, four different types of non-Legionella drinking water bacteria [24,25]; heat-inactivated cooling tower biofilms, Escherichia coli, and Pseudomonas putida [26]; extracellular cyanobacterial components [27]; and filtered sterilized drinking water [28] were capable of supporting L. pneumophila growth, with the latter also supporting their colonization and growth within biofilms for prolonged periods. Collectively, Legionella associations with, and dependencies on, other microbes can explain their vast environmental distribution, ability to survive in DWDSs, and human pathogenicity, especially in engineered environments where confined, close proximity to humans have increased disease risk from this pathogen.
Thus, current approaches to Legionella exposure prevention, e.g., through environmental monitoring [29] and/or implementation of building water management plans [30,31], require a thorough understanding of their persistence and transmission mechanisms in premise plumbing systems. In this study, to better understand BWS conditions supporting Legionella survival, microbial water quality parameters, such as the occurrence of Legionella spp., L. pneumophila, and M. intracellulare; and the FLA hosts, Acanthamoeba spp. and Vermamoeba vermiformis, and heterotrophic plate count levels, were monitored, along with chemical water quality, engineering, and operational parameters. Determining how various physical, chemical, and microbial BWS characteristics influence Legionella occurrence may elucidate ways to minimize and eliminate their growth within these systems.

2. Results

2.1. Description of Sampling Locations and Water Quality Characteristics

First draw and second draw (post-flushing) cold bulk water samples and biofilm swab samples were collected every three months (fall, F; winter, W; spring, Sp; and summer, Su) at six locations within a large commercial building (Table 1 and Section 4.1). This building water system (BWS) contained a variety of plumbing materials, varying water flow/rates, and usage patterns at each of the sampled locations (Table 1) with previous detection of Legionella in the cold water (data not shown). This building was also chosen because it contains both office and production facilities where large volumes of water are used in the latter portions (e.g., for production processes and cooling) and smaller volumes in the office spaces for employees. Three locations had polyvinyl chloride (PVC) schedule 80 valves that supplied monochloramine-treated water (PVC-MA) or chlorine-treated water with and without passage through the building’s chiller/refrigeration system (PVC-R and PVC-FC, respectively); and the other three sampling locations supplied chlorine-treated water from a cast brass spigot (Spigot), a chrome-plated, forged brass faucet (Faucet), and a drinking water fountain with a stainless steel and ethylene propylene diene bubbler head (Fountain) (Figure S1, Table 1).
The water usage ranged from 5 L to 1.4 million L per season with an average of 278,030 L ± a standard deviation (SD) of 598,785 L per season for each sampling location. The PVC-R location is a high water usage site due to the presence of multiple online and remote water quality sensors that require constant water flow; thus, when this site is excluded, the water usage of the other five locations had an average of 35,194 ± 76,876 L per season. The pipe material from the outlet to the supply feed were either all copper (Spigot, Faucet, and Fountain), all PVC (PVC-MA), a mixture of both (PVC-FC), or a mixture of fiberglass ductile iron and PVC reinforced plastic tubing (PVC-R).
In this study, a total of 114 bulk water and 57 biofilm samples were collected across the six locations. Bulk water samples were analyzed for pH, turbidity, temperature, and free and total chlorine (Table 2). There were no statistical differences between the pH of the first and second draw samples for each location and sampling time points, but there were differences in pH between the PVC-MA samples and the other five locations (P < 0.001). There were no statistical differences between the turbidity of all water samples at each location most likely due to the large range in Nephelometric Turbidity Units (NTUs) observed for each sample (Table 2, Figure S2).
Temperatures between first and second draw samples within each location and time point were also not significant, except for Spigot-first draw versus Spigot-second draw samples (P < 0.05). Free and total chlorine levels for first and second draw samples between, and within, each location were not significant, except for Faucet-first draw versus Faucet-second draw and PVC-R-first vs Faucet-first draw samples (P < 0.01, Table 2, Figure S3). There were no statistical differences between monochloramine and total chlorine levels in the bulk water from location PVC-MA (P > 0.05). There were statistical differences between the heterotrophic plate count (HPC) levels of the first vs second draw samples at only the PVC-R, Spigot, and Faucet locations (P < 0.01, Table 2). For biofilm samples, the average HPC level observed at the Faucet location was the highest compared to other locations but was statistically different only from the PVC-R biofilm samples (P < 0.01, Table 2).

2.2. Legionella Culture Results

Bulk water and biofilm samples were processed and enumerated for Legionella colony forming units (CFU) as described in Section 4.2 and Section 4.4. No culturable Legionella was detected in samples from the PVC-MA, Spigot, or Fountain location; from the second draw and biofilm samples from PVC-R; and biofilm samples from PVC-FC. However, culturable Legionella was detected at various time points for the first and second draw samples from PVC-FC; all sample types from the Faucet; and only the W2018 first draw sample from PVC-R, which contained Legionella non-pneumophila bacteria as confirmed by colony lysate PCR and latex agglutination (Table 3).
For the PVC-FC bulk water samples, Legionella non-pneumophila colonies were detected in both the first and second draw samples during W2018 (4.5 and 2.6 log10 CFU 100 mL−1, respectively) and W2019 (2.1 and 2.6 log10 CFU 100 mL−1, respectively) and only the second draw (3.0 log10 CFU 100 mL−1) during F2018 via colony confirmation PCR (Table 3). The F2018 isolate was identified as L. feeleii via indirect immunofluorescent antibody assay as described in Section 4.4. L. pneumophila and non-pneumophila colonies were detected in the first and second draw samples (3.8 and 2.8 log10 CFU 100 mL−1, respectively) at this location during Su2018 via colony confirmation PCR. The L. pneumophila PCR-positive Su2018 colonies either gave an inconclusive latex agglutination result or were identified as belonging to serogroup (sg) 2–14. Three Su2018 isolates (one from the first draw and two from the second draw samples), one F2018 isolate (from the second draw sample), and four W2019 isolates (two from the first and two from the second draw samples) were processed for whole genome sequencing. One of the two Su2018 second draw isolates was identified as L. pneumophila sg5 via indirect immunofluorescent antibody assay.
Throughout the study period, only one second draw (W2019) and one biofilm (F2016) sample, at the Faucet location had culturable Legionella bacteria at concentrations of 2.1 log10 CFU 100 mL−1 and 1.9 log10 CFU cm−2, respectively (Table 3). The Faucet second draw sample was confirmed as L. pneumophila sg1, and the biofilm sample contained a mixture of L. pneumophila sg1 and 2–14 colonies as confirmed by PCR and latex agglutination. Fifty percent of the Faucet first draw samples were Legionella culture positive: Sp2017, F2017, W2018, Su2018, and W2019 with an average ± SD concentration of 2.0 ± 0.8 log10 CFU 100 mL−1 (Table 3). Legionella identified within these Faucet first draw samples were diverse with only L. pneumophila sg1 being identified in the Su2018 and W2019 samples; only L. pneumophila sg2–14 in the Sp2017 sample; a mixture of L. pneumophila sg1 and 2–14 in the W2018 sample; and Legionella non-pneumophila identified in the F2017 sample. Five isolates obtained from the Su2018 and one from the W2019 Faucet first draw samples were processed for whole genome sequencing.
For only the Su2018, F2018, and W2019 time points, L. pneumophila most probable number (MPN) in bulk water and biofilm samples were enumerated using Legiolert® as described in Section 4.4. All samples at each location had no detectable L. pneumophila MPN except for the Faucet first draw (Su2018 1.8 log10 MPN 100 mL−1; W2019 3.8 log10 MPN 100 mL−1) and second draw (Su2018 1.4 log10 MPN 100 mL−1; W2019 2.5 log10 MPN 100 mL−1) samples. Four wells from the first draw and three wells from the second draw Legiolert® tray, read as L. pneumophila positive, were sampled and pure colonies were obtained as described in Section 4.4. Isolates were Legionella and L. pneumophila PCR-positive but gave an inconclusive latex agglutination result. One of the W2019 Faucet second draw Legiolert® isolates was processed for whole genome sequencing and identified as sg5 via indirect immunofluorescent antibody assay.

2.3. Detection of Water-based Pathogens and Free-living Amoebae (FLA) via Quantitative PCR Analyses

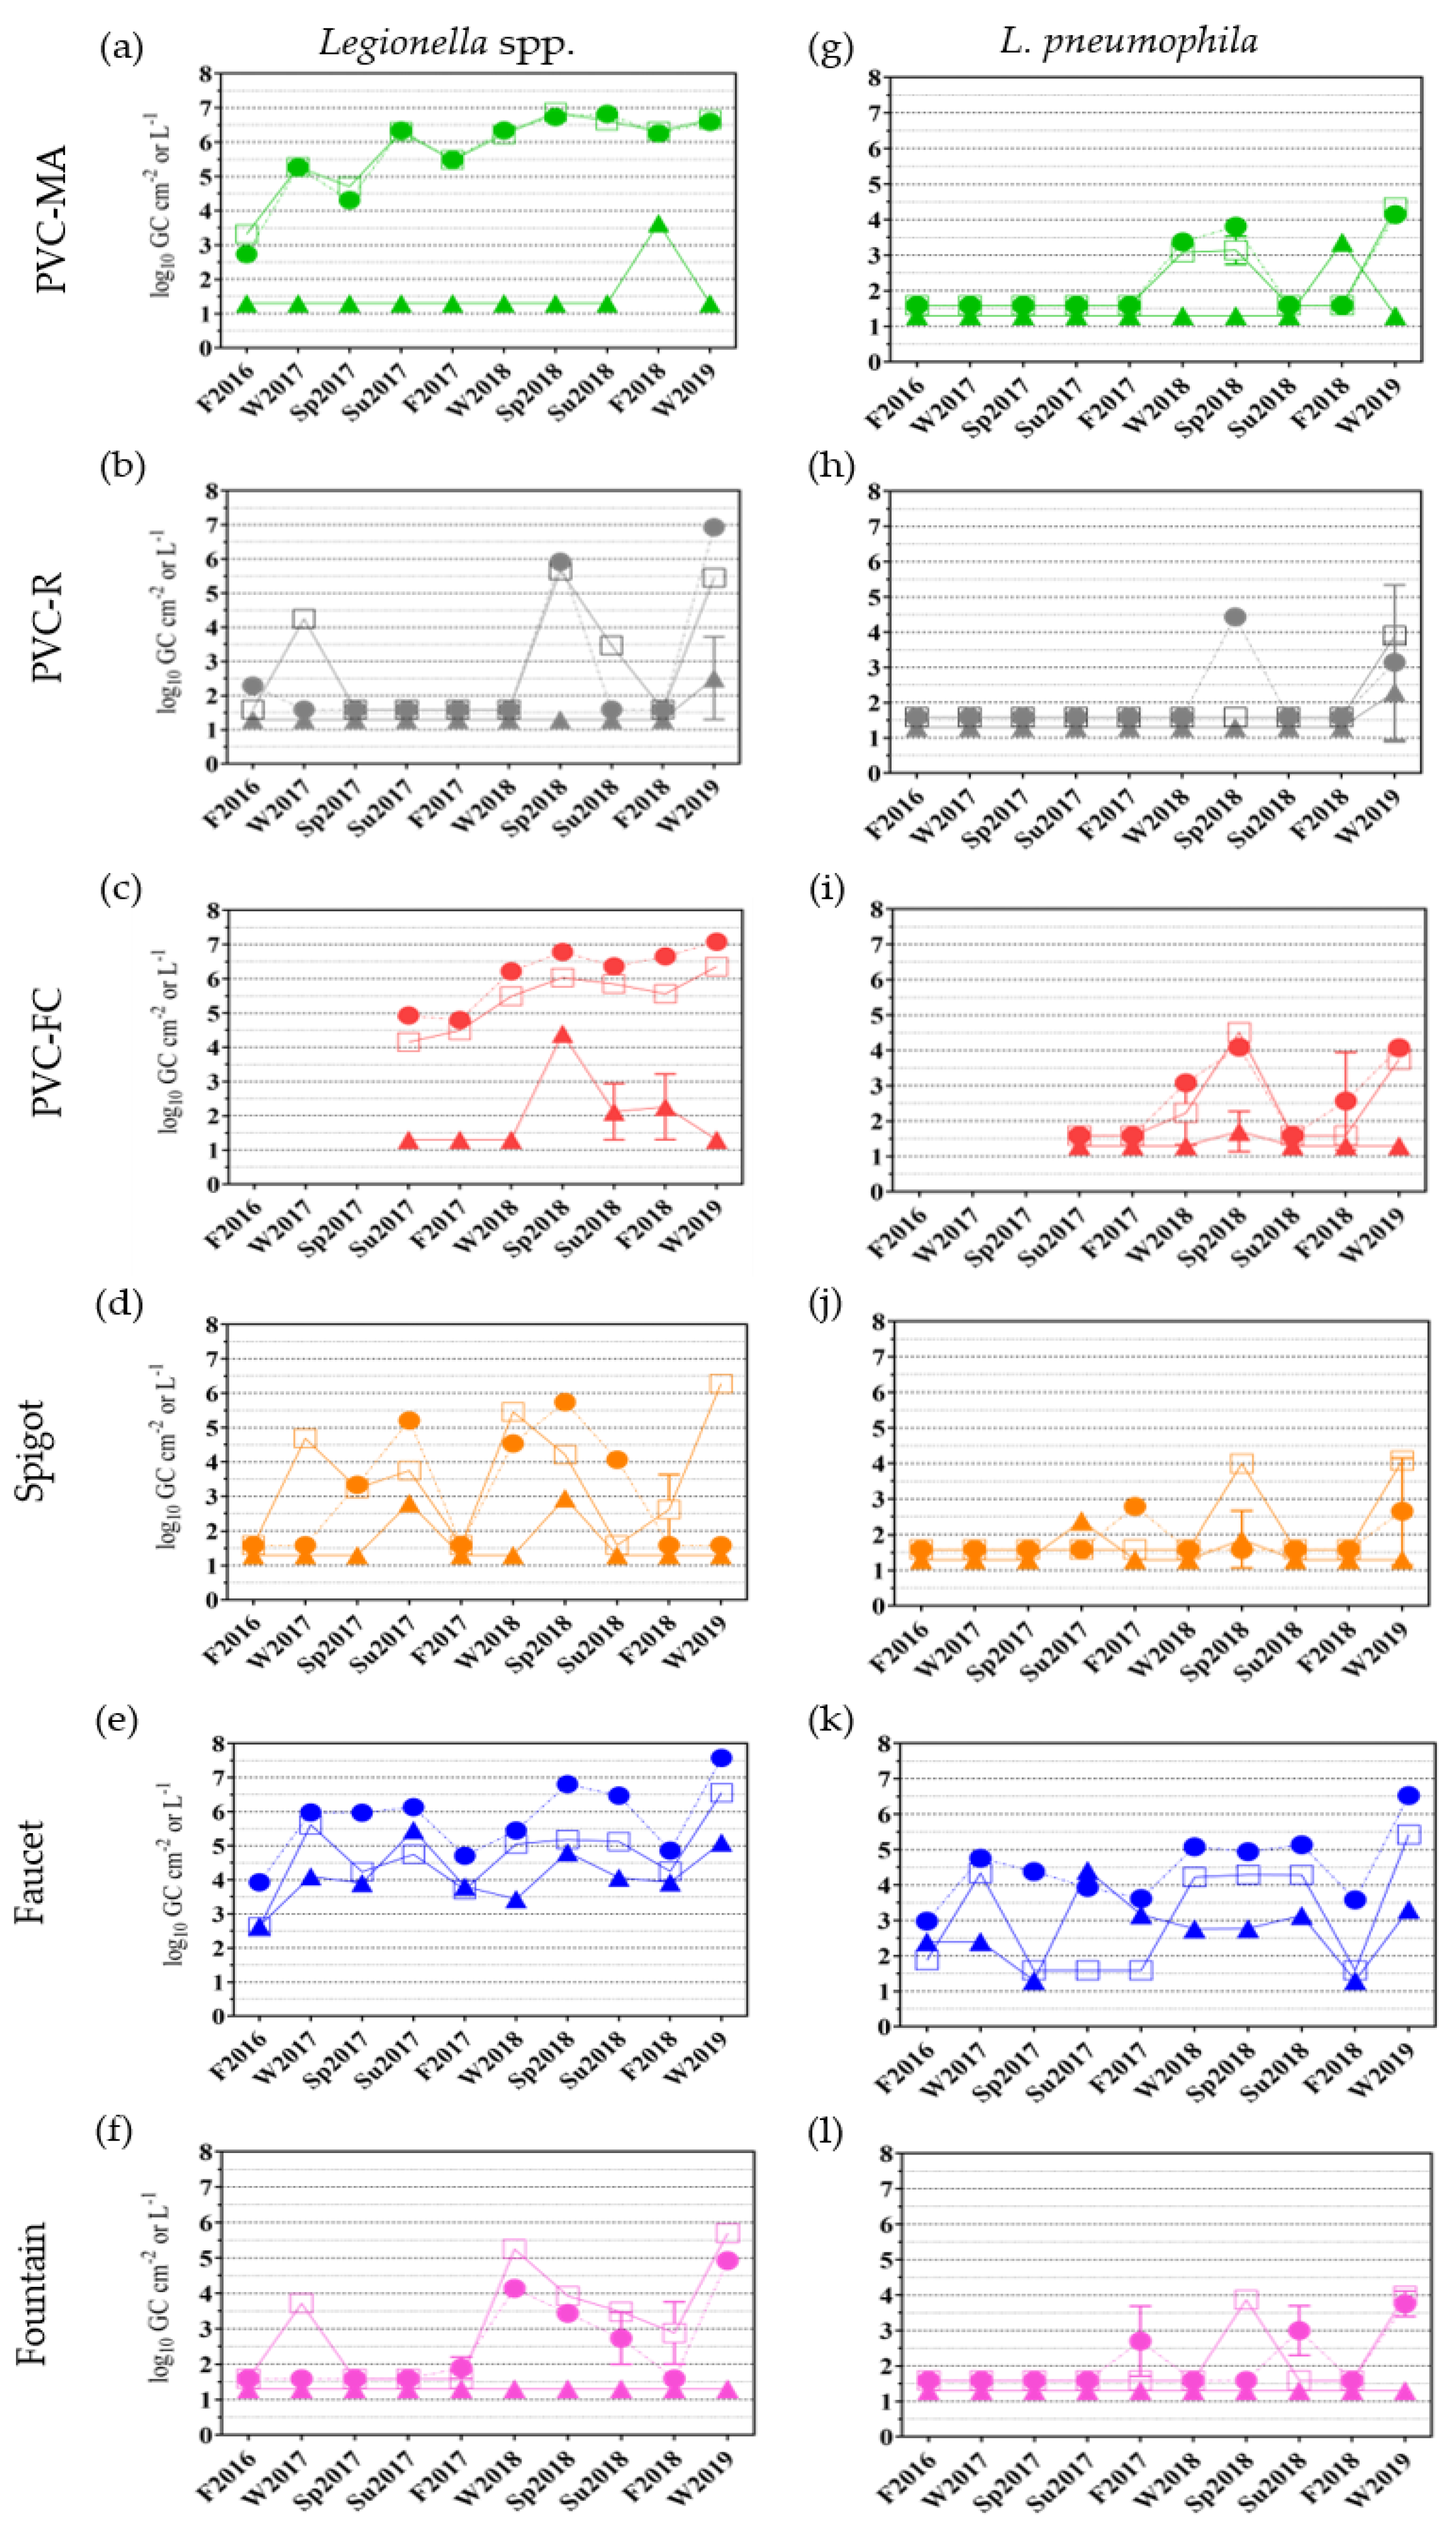
2.3.1. Legionella spp. and L. pneumophila Occurrence

In addition to culture methods, bulk water and biofilm samples were also analyzed for the presence of Legionella spp. and L. pneumophila via qPCR as described in Section 4.6. In agreement with the specificity and sensitivity of the Legionella genus and L. pneumophila species-specific qPCR assays used in this study, the total Legionella levels detected in the bulk water and biofilm samples were higher than the L. pneumophila levels observed in the corresponding samples (Figure 1a–f and g–l). The presence of Legionella and L. pneumophila was detected at all sampling locations and sample types and within each location, detection generally occurred more frequently, and at higher levels, in the bulk water compared to the biofilm samples (Figure 1, first draw, circles, and second draw, squares, compared to biofilm, triangles).
Legionella was detected in all bulk water samples at locations PVC-MA, PVC-FC, and Faucet (Figure 1a, c, and e). In contrast, only 30% (3/10 first draw; 3/10 second draw) of PVC-MA, 50% (4/7 first draw; 3/7 second draw) of PVC-FC, and 80% (10/10 first draw; 6/10 second draw) of Faucet samples were L. pneumophila positive (Figure 1g, i, and k). Legionella was detected sporadically in the bulk water samples at locations PVC-R (35%, 3/10 first draw; 4/10 second draw), Spigot (60%, 5/10 first draw; 7/10 second draw), and Fountain (55%, 5/10 first draw; 6/10 second draw) (Figure 1b, d, and f). L. pneumophila was detected in 15% (2/10 first draw; 1/10 second draw) of the PVC-R, in 20% (2/10 first draw; 2/10 second draw) of the Spigot, and in 25% (3/10 first draw; 2/10 second draw) of the Fountain bulk water samples (Figure 1h, j, l).
Biofilm samples from all locations had sporadic detection of Legionella and L. pneumophila except for the Faucet and Fountain locations (Figure 1, triangles). At the Faucet location, both were detected in all biofilm samples except for the Sp2017 and F2018 time points for L. pneumophila (Figure 1e and f, blue triangles). At the Fountain location, there was no detectable Legionella or L. pneumophila at all time points (Figure 1f and l, pink triangles). Additionally, for the biofilm samples, Legionella was detected in only one PVC-MA (F2018) and PVC-R (W2019); three PVC-FC (Sp2018, Su2018, and F2018); and two Spigot (Su2017 and Sp2018) biofilm samples (Figure 1a–d, triangles). Similarly, L. pneumophila was detected in one PVC-MA (F2018), PVC-R (W2019) and only one of the three Legionella positive PVC-FC (Sp2018) samples; and two Spigot (Su2017 and Sp2018) biofilm samples (Figure 1g–j, triangles).

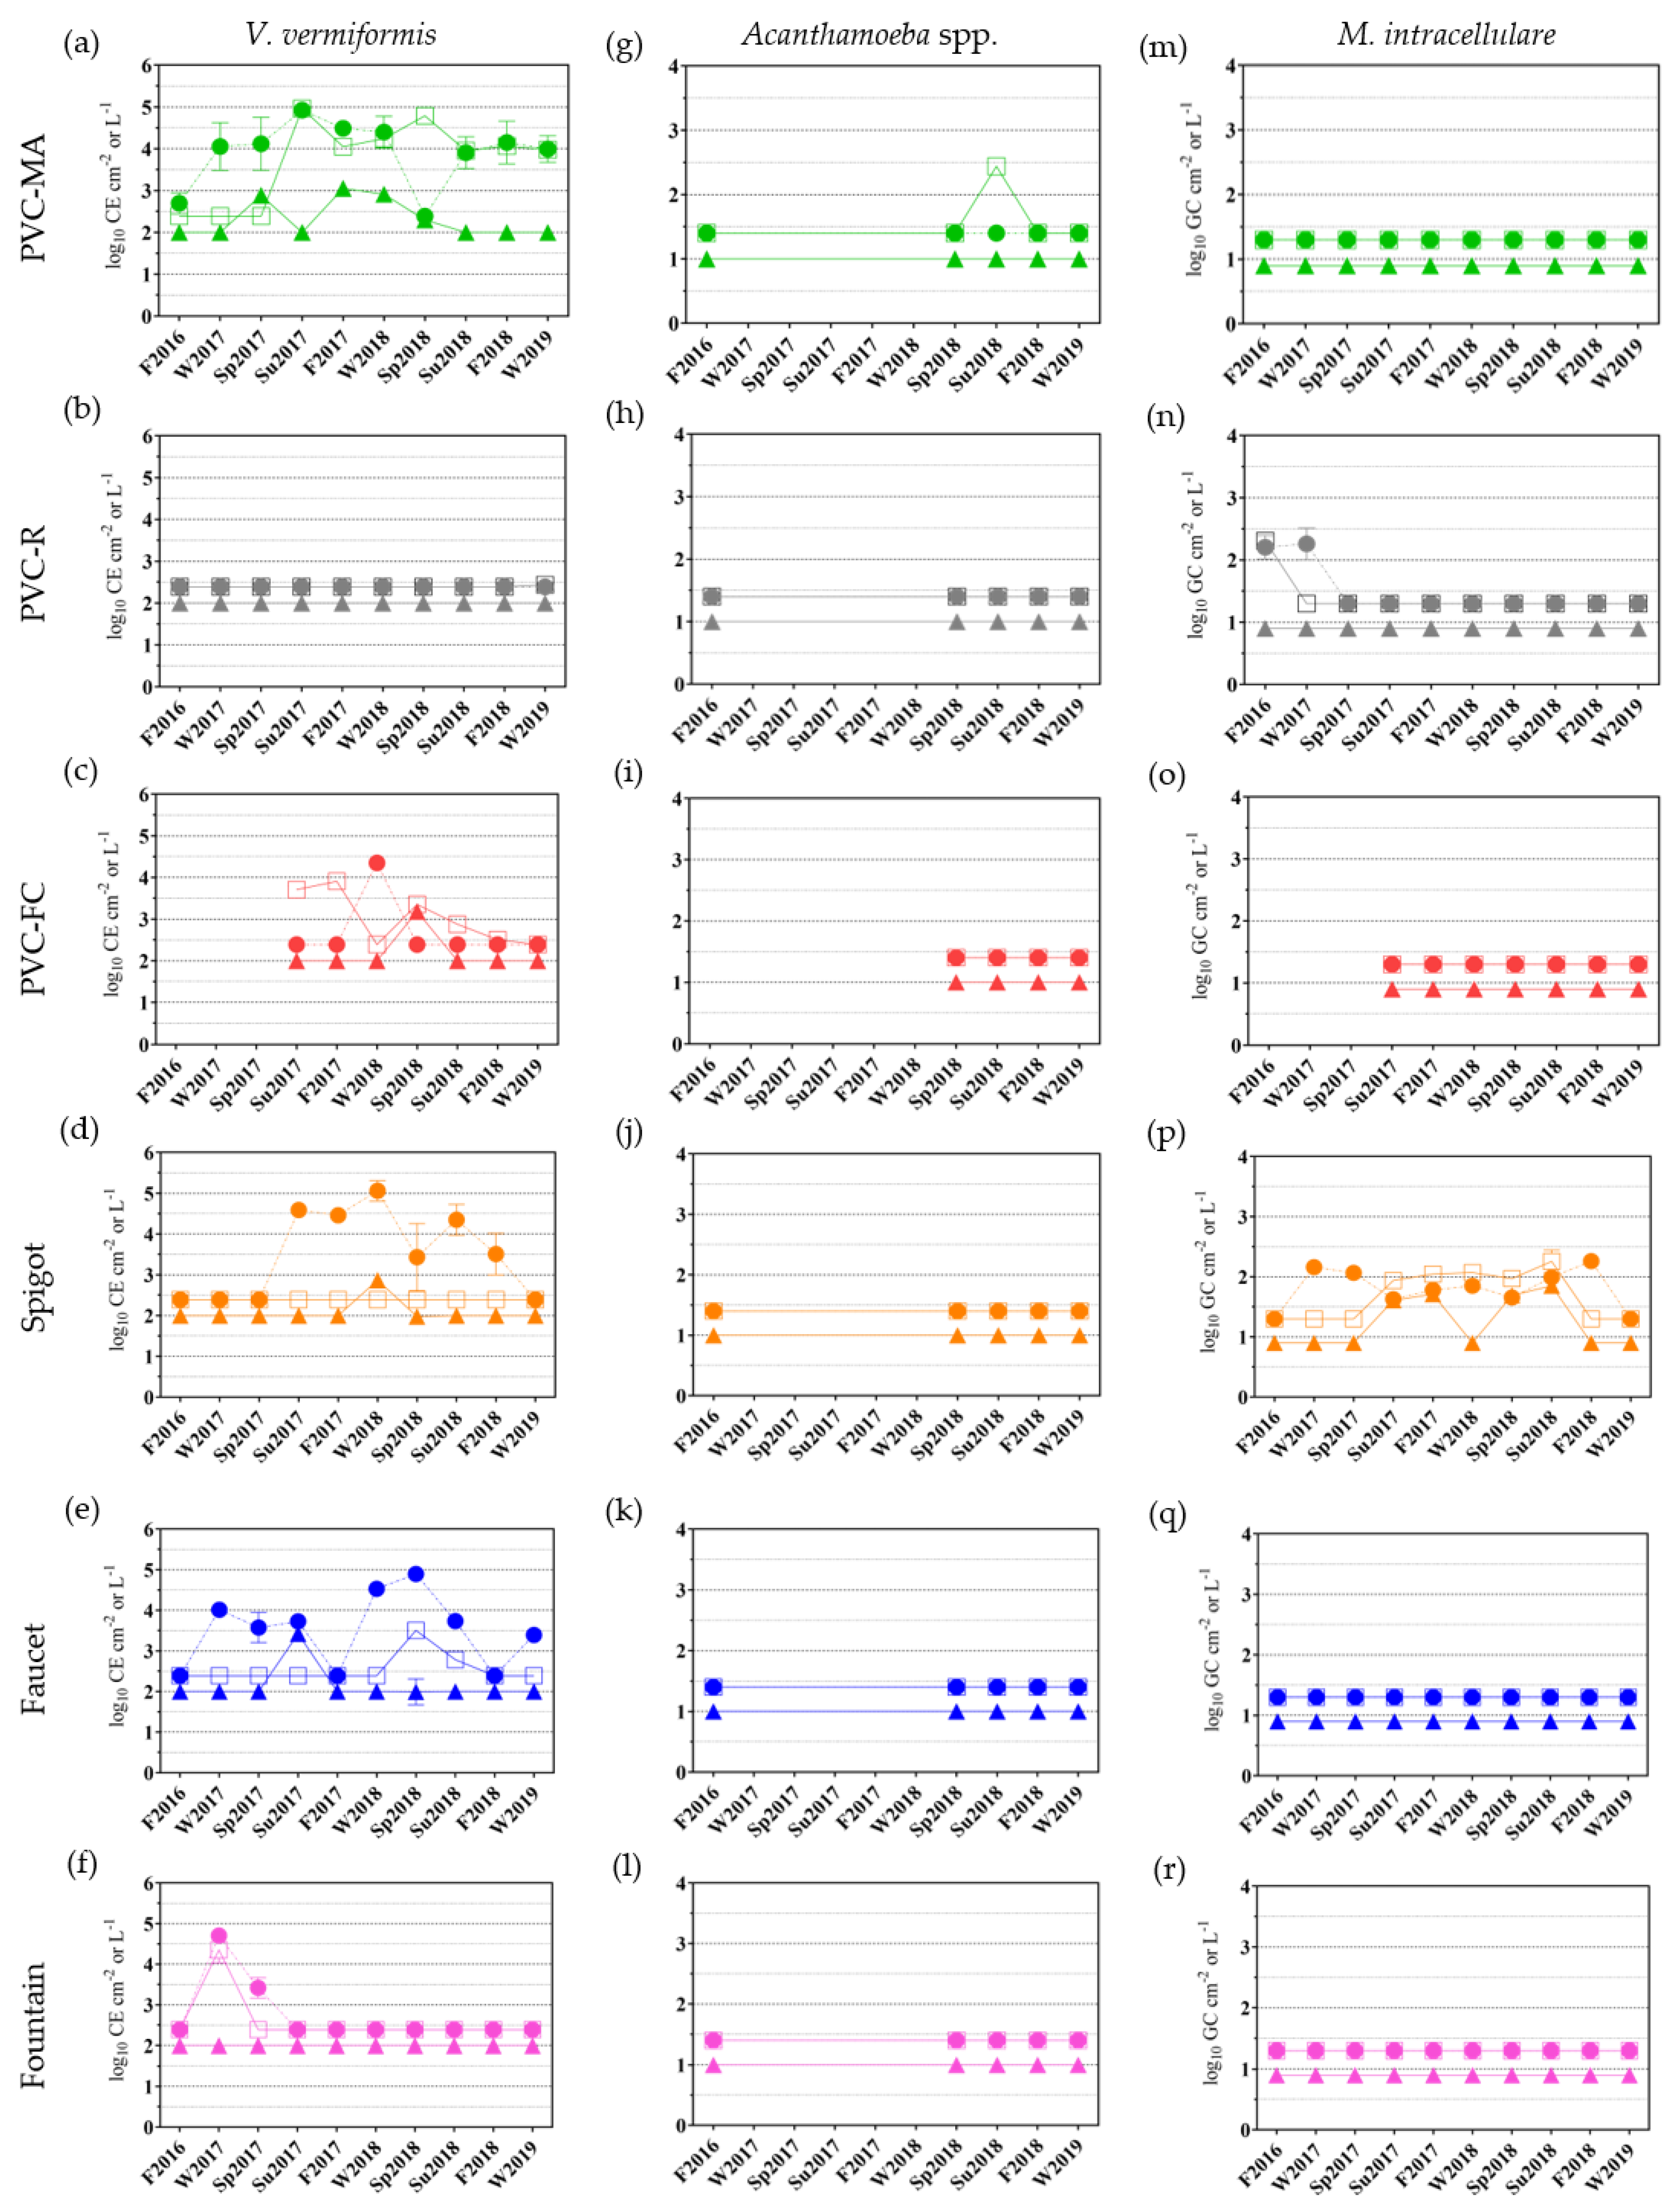
2.3.2. Free-living Amoebae and Mycobacterium intracellulare Occurrence

To determine if Legionella occurrence correlated with the presence of their eukaryotic hosts and another water-based human opportunistic pathogen, bulk water and biofilm samples at each location were analyzed for two different free-living amoebae, Vermamoeba vermiformis and Acanthamoeba spp., and Mycobacterium intracellulare (Figure 2). V. vermiformis was detected in the bulk water and biofilm samples at various time points for locations PVC-MA, PVC-FC, Spigot, and Faucet; in only the bulk water and not biofilms for the Fountain location; and was not detected in any samples from location PVC-R (Figure 2a–f). For Acanthamoeba spp., only five time points were analyzed for each location (F2016, Sp2018 to W2019), except for PVC-FC where only four were analyzed (Sp2018 to W2019) (Figure 2g–l). Notably, only the second draw sample at location PVC-MA had detectable Acanthamoeba spp. (Figure 2g, green square mean ± SD of 2.4 ± 0.0 log10 CE L−1).
At location PVC-MA, V. vermiformis was detected in 80% of the bulk water samples (9/10 first draw; 7/10 second draw) and 40% of the biofilm samples (4/10). V. vermiformis was detected in 43% of the bulk water samples at the PVC-FC (1/7 first draw; 5/7 second draw); 30% at the Spigot (6/10 first draw; 0/10 second draw); and 45% at the Faucet (7/10 first draw; 2/10 second draw) locations (Figure 2c–e). Only one biofilm sample was positive for V. vermiformis at the PVC-FC (Sp2018), Spigot (W2018), and Faucet (Su2017) locations (Figure 2c–e). For the Fountain location, V. vermiformis was detected in 15% (2/10 first draw; 1/10 second draw) of the bulk water samples (Figure 2f). All samples were negative for M. intracellulare at locations PVC-MA, PVC-FC, Faucet, and Fountain (Figure 2m, o, e–f). At location PVC-R, only 15% (2/10 first draw; 1/10 second draw) of water samples were positive (Figure 2n). M. intracellulare was more frequently detected in the Spigot bulk water (65%, 8/10 first draw; 5/10 second draw) and biofilm (40%, 4/10) samples.

2.4. Additional Sampling Sites

During the W2019 time point, 1 L of first draw samples were collected at two additional locations within the large BWS: an outlet off of the incoming main water line located in the boiler room (BWS Supply Line) and a recirculating pipe loop (PVC-Loop) previously described [32]. The bulk water sample from the BWS Supply Line had a turbidity of 0.34 NTU; 0.00/0.05 mg L−1 free/total chlorine; pH of 8.53; temperature of 39.5 °C; and HPC levels of 1.6 log10 CFU 100 mL−1. For the PVC-Loop, the bulk water sample had a turbidity of 0.21 NTU; 0.01/0.01 mg L−1 free/total chlorine; pH of 8.31; temperature of 20.6 °C; and HPC levels of 4.7 log10 CFU 100 mL−1.
The BWS Supply Line contained 3.0 log10 CFU and MPN 100 mL−1 of L. pneumophila sg1 and 2–14 as confirmed by colony lysate PCR and latex agglutination. Two colonies were Legionella and L. pneumophila PCR positive, identified as sg1, and processed for whole genome sequencing. The BWS Supply Line sample was negative for Acanthamoeba spp. and M. intracellulare but contained 3.9 log10 CE 100 mL−1 of V. vermiformis, 7.3 log10 GC 100 mL−1 of Legionella spp., and 6.9 log10 GC 100 mL−1 of L. pneumophila. The PVC-Loop bulk water sample was negative for V. vermiformis and M. intracellulare but contained 3.0 log10 CE 100 mL−1 of Acanthamoeba spp., 7.4 log10 GC 100 mL−1 of Legionella spp., and 7.3 log10 GC 100 mL−1 of L. pneumophila.
The PVC-Loop had a high level of non-Legionella background that negatively impacted the enumeration of presumptive Legionella colonies. Although Legionella CFU could not be determined, 3.4 log10 MPN 100 mL−1 of L. pneumophila was detected using Legiolert®. Four wells of the PVC-Loop Legiolert® tray, read as L. pneumophila positive following manufacturer’s protocols, were sampled, and pure colonies were obtained as described in Section 4.4. Legiolert® isolates were analyzed by PCR and latex agglutination. One of the four Legiolert® isolates was Legionella and L. pneumophila PCR negative and processed for whole genome sequencing. Three of the four Legiolert® isolates were Legionella and L. pneumophila PCR positive with 2/3 giving an inconclusive agglutination result and 1/3 identified as sg5. This PCR positive, L. pneumophila sg5 isolate was processed for whole genome sequencing.

2.5. Statistical Correlations between Water Quality Characteristics

Correlation analysis was performed, as described in Section 4.8, to determine if there were negative or positive associations between the observed water quality characteristics within each sampling location. As expected, there was a strong positive correlation between free and total chlorine in both the first and second draw bulk water samples at all locations supplied with chlorinated water, (r = 0.7–1.0, P < 0.05). For the other pairwise comparisons within each location, only the statistically significant (P < 0.05) correlations between water quality characteristics are shown in Figure 3.
Legionella and/or L. pneumophila occurrence was negatively correlated with disinfectant residual at three of the six sampling locations. Legionella spp. was negatively correlated with NH2Cl (r = −0.8) and TCl (r = −0.9) in the first draw, but only with TCl in the second draw samples (r = −0.9), at the PVC-MA location. At the PVC-FC location, Legionella spp. and L. pneumophila were negatively correlated with TCl and free chlorine (FCl), respectively, only in the second draw samples (r = −0.8, P < 0.05). Similarly, L. pneumophila was negatively correlated to both FCl and TCl in the Spigot second draw samples (r = −0.7). Notably, for the Faucet location that had consistent levels of Legionella spp. and L. pneumophila (Figure 1e and k), as well as culturable Legionella (Table 3), no statistical correlations were made between Legionella and disinfectant residual (Figure 3, Faucet). Moreover, occurrence of V. vermiformis was also negatively associated with FCl and TC (r = −0.8) at only the Faucet location.
At all sampling locations except for PVC-MA, Legionella spp. was positively correlated with L. pneumophila in the first draw, second draw, and biofilm samples depending on the location (Fountain, r = 0.6; PVC-R, PVC-FC, and Faucet, r = 0.8; and Spigot, r = 1.0). Additionally, at the Faucet location, culturable Legionella was positively correlated with L. pneumophila detection in the first draw water samples (r = 0.7). For L. pneumophila and V. vermiformis, a positive correlation was found at locations PVC-FC (biofilm, r = 1.0) and Faucet (first draw, r = 0.6). Both positive and negative correlations between HPCs and chlorine residuals were observed at three of the six locations. There were positive correlations between HPC and FCl in the first draw (PVC-FC, r = 0.9) and second draw (PVC-R, r = 0.7) samples and negative correlations between HPC and both FCl and TCl in the first draw samples at the Faucet location (r = −0.7). At the Faucet location, HPCs were negatively correlated with pH (r = −0.7) in the first draw samples. HPCs were also negatively associated with culturable Legionella in the PVC-FC second draw samples (r = −0.8), but positively associated with L. pneumophila molecular detection in the Faucet second draw samples (r = 0.7). Only a positive correlation was found between HPCs and V. vermiformis detection in the first draw samples at two locations, PVC-MA (r = 0.8) and Faucet (r = 0.7).
There were strong correlations between Legionella detection and various physiochemical water quality parameters. Legionella spp. was negatively correlated to temperature at only one location (Spigot, second draw, r = −0.7). Turbidity (NTU) was positively correlated with L. pneumophila detection in the Faucet second draw samples (r = 0.8); however, both positive and negative correlations were observed between NTU and Legionella spp. detection at two separate locations PVC-MA (first draw, r = 0.8) and Spigot (first draw, r = −0.7), respectively. Only a negative correlation was found between NTU and V. vermiformis detection in the first draw samples at two locations, Spigot (r = −0.8) and Fountain (r = −0.7).
Correlations between the physiochemical water quality parameters included a positive association between temperature and both NH2Cl and FCl at the PVC-MA (first draw, r = 0.7) and between temperature and FCl at the Spigot (second draw, r = 0.7) locations, respectively. There was a negative correlation between NTU and pH in the second draw samples at the PVC-MA (r = −0.6) and PVC-FC (r = −0.9) locations; and negative correlation between NTU and NH2Cl (r = −0.9) and TCl (−1.0) in the first draw samples at the PVC-MA location.

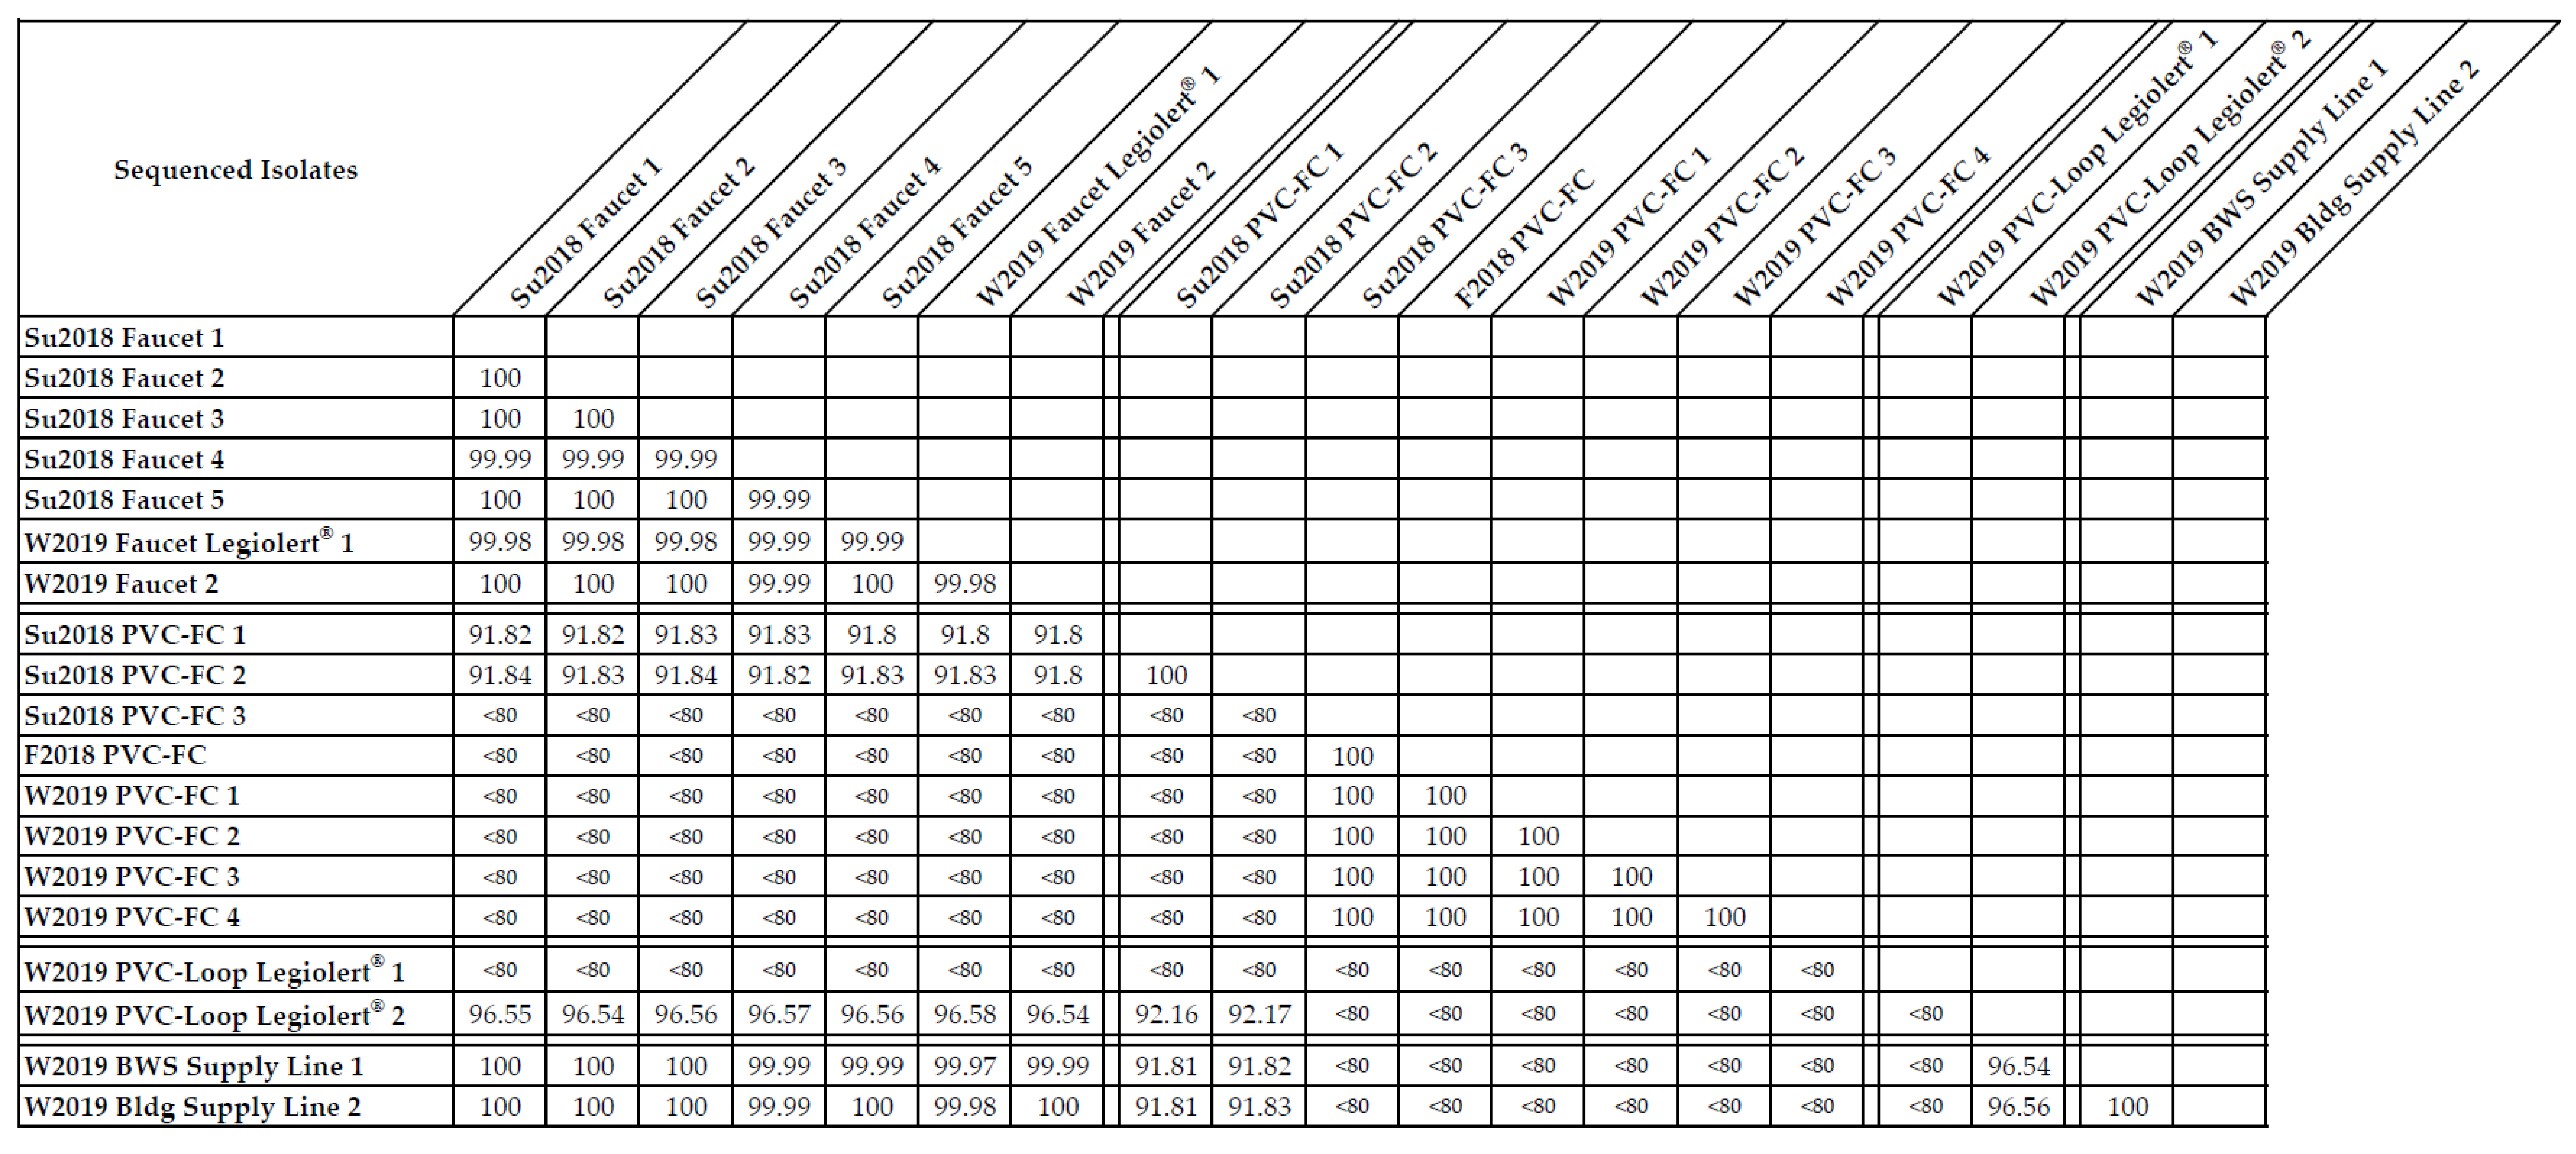
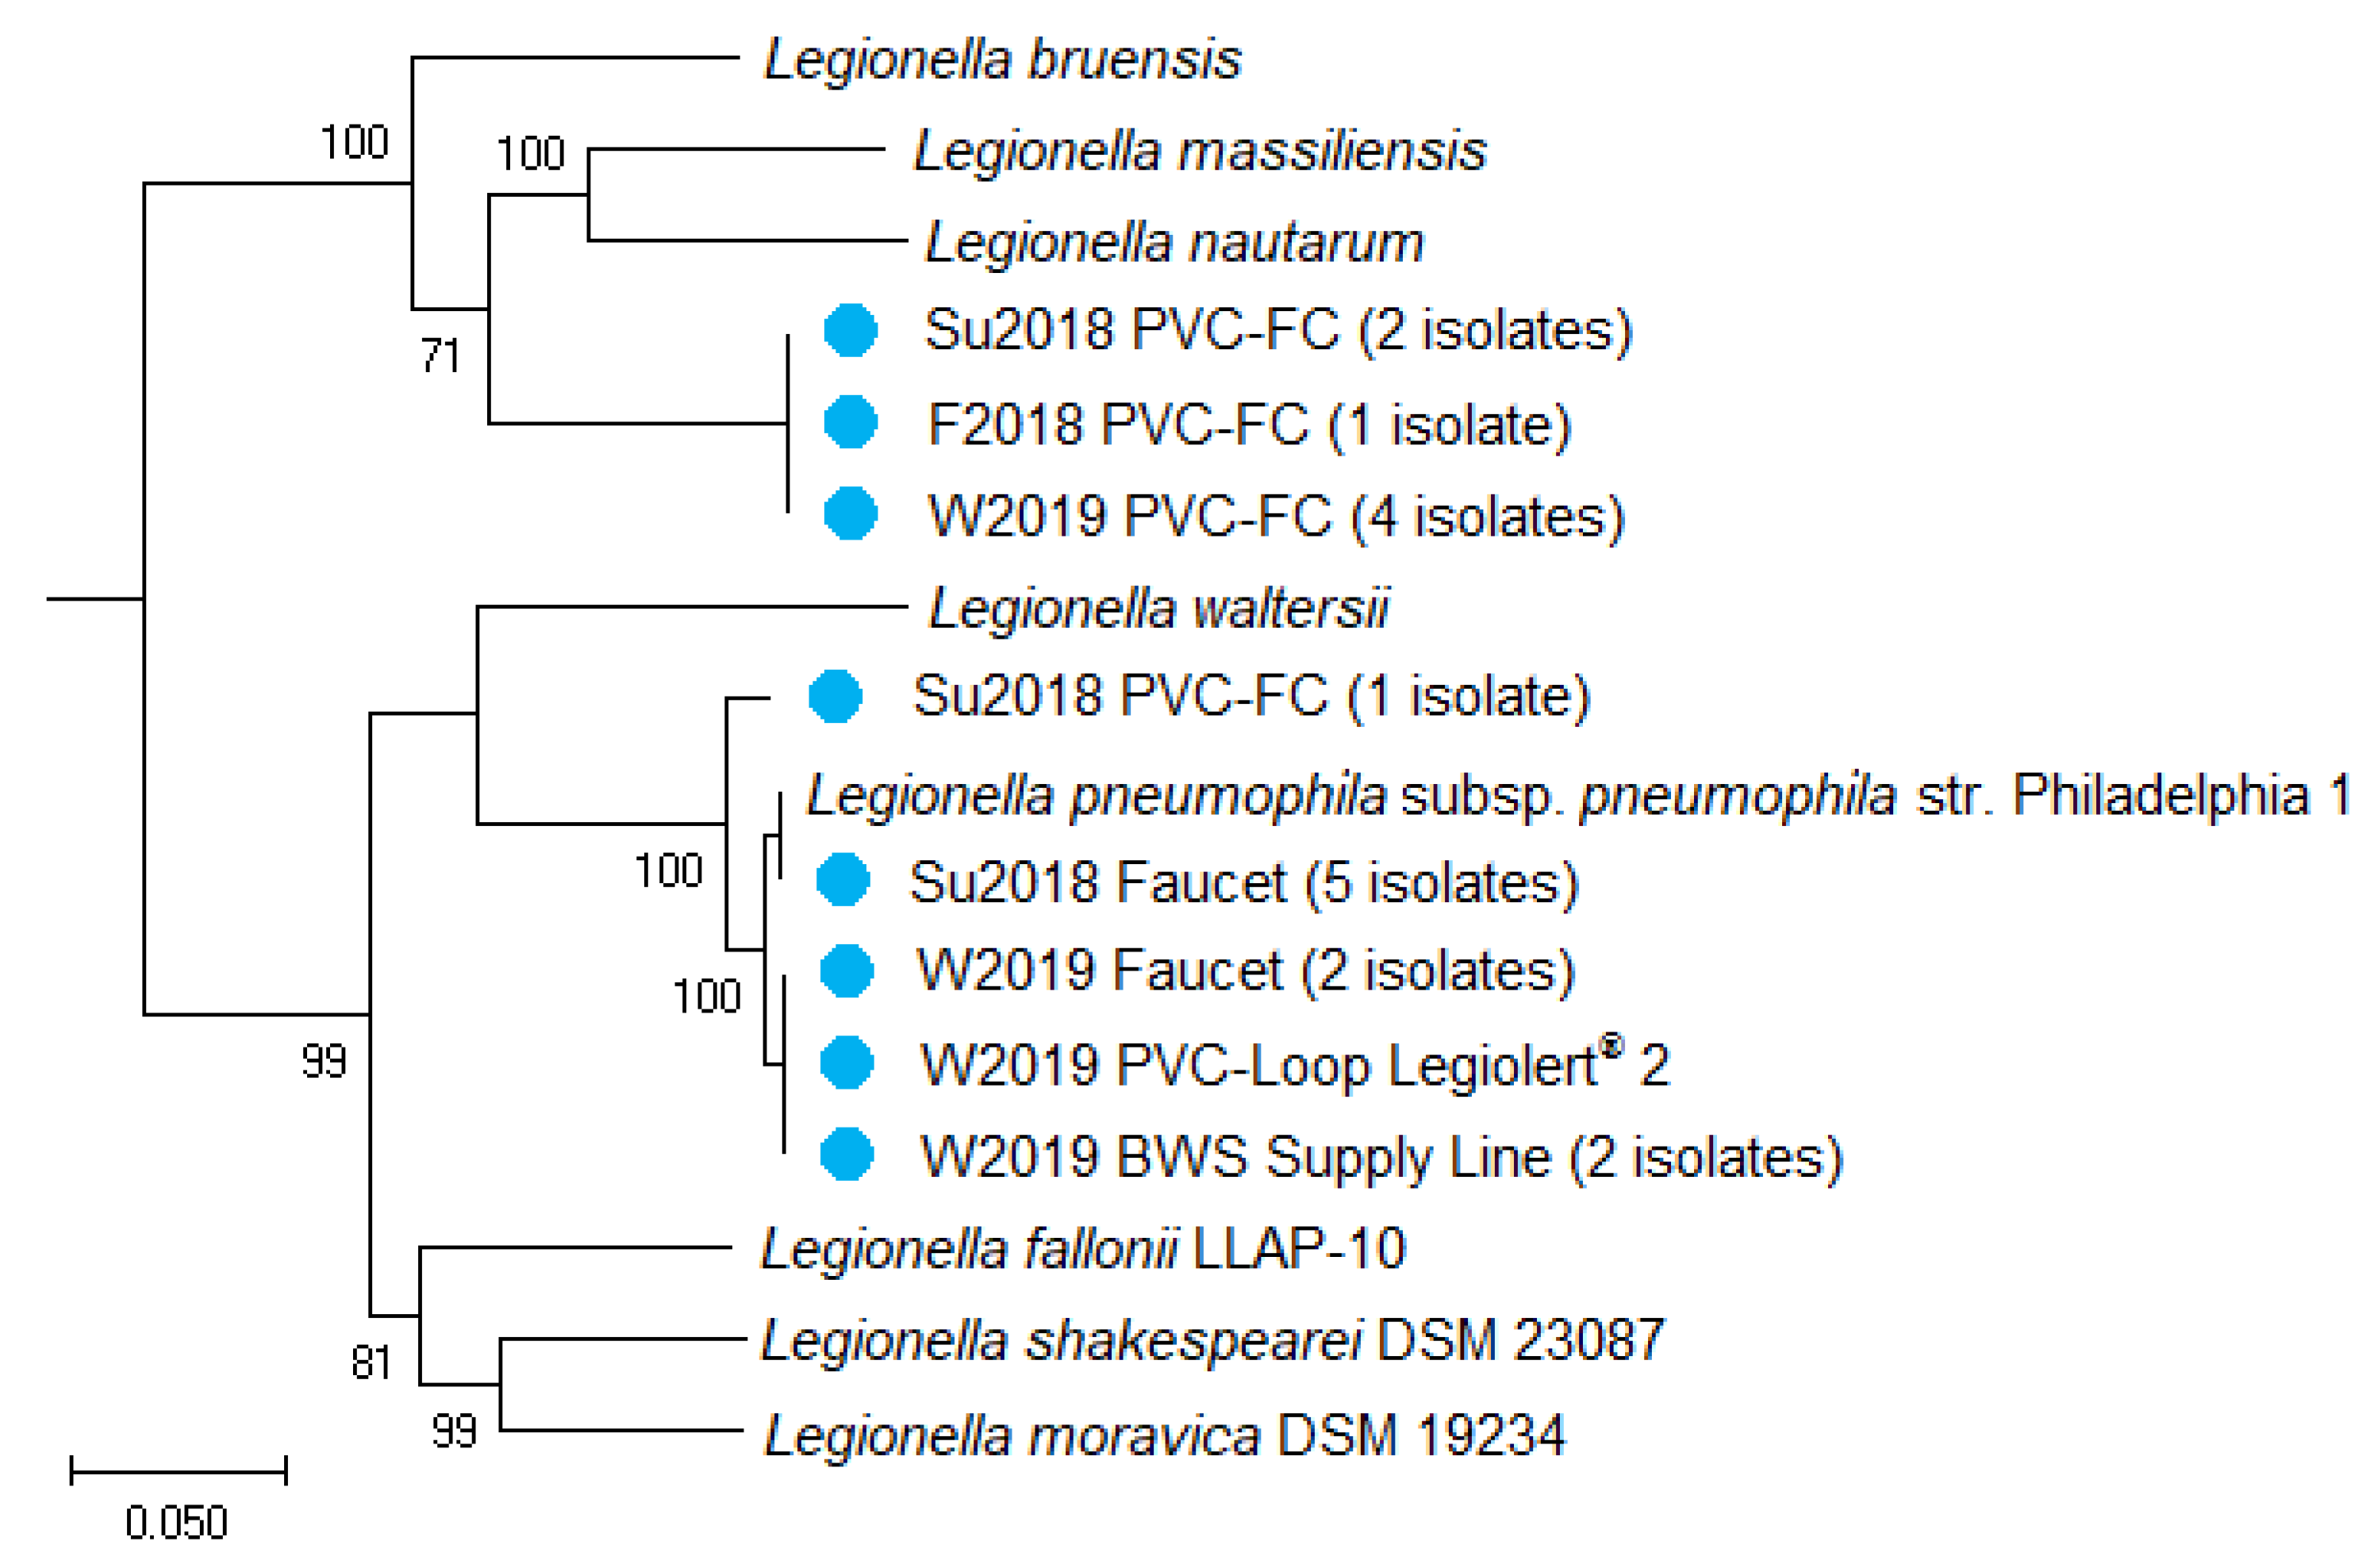
2.6. Whole Genome Sequencing of Drinking Water Isolates

Nineteen representative L. pneumophila and non-pneumophila isolates from the Su2018, F2018, and W2019 time points and PVC-FC, Faucet, BWS Supply Line, and PVC-Loop locations were submitted for whole genome sequencing as described in Section 4.7 (Table 4). All seven Faucet isolates from the Su2018 (Faucet 1–5) and W2019 (Faucet Legiolert® 1 and Faucet 2) time points, and the W2019 BWS Supply Line 1 and 2 isolates, were identified as L. pneumophila Sequence Type (ST) 1 with an average genome size of 3.6 million base pairs (Mbp), a guanine–cytosine (G + C) content of 38%, and approximately 3200 predicted genes. The average nucleotide identity (ANI) between these seven Faucet and two BWS Supply Line isolates was between 99.97% and 100% indicating that these isolates were the same L. pneumophila strain (Figure 4). These isolates were also identified as sg1 via latex agglutination as described in Section 2.2 and 2.4.
Of the eight PVC-FC isolates, two (Su2018 PVC-FC 1–2) were identified as L. pneumophila ST2037, with a comparable genome size (~3.5 Mbp), 38% G + C content, and 100% ANI (Table 4, Figure 4), with Su2018 PVC-FC 2 identified as L. pneumophila sg5 via indirect immunofluorescent antibody assay as described in Section 2.2. The remaining six PVC-FC isolates (Su2018 PVC-FC 3, F2018 PVC-FC, and W2019 PVC-FC 1–4) were identified as Legionella with a genome size of 3.0–3.3 Mbp, 41% G + C content, and 99.99–100% ANI (Table 4, Figure 4), with F2018 PVC-FC identified as L. feeleii via indirect immunofluorescent antibody assay. The W2019 PVC-Loop Legiolert® 1 isolate, derived from a L. pneumophila positive well, was identified as Ochrobactrum with a higher genome size of 4.7 Mbp, higher G + C content of 67% compared to the W2019 PVC-Loop Legiolert® 2 isolate identified as L. pneumophila ST1950, with a genome size of 3.4 Mbp, 38% G + C content, and 3057 predicted genes (Table 4).
Between the L. pneumophila sg5 ST1950 isolate and sg5 ST2037 isolates, the ANI was 92%, suggesting that they belong to the same species, but are different strains (Figure 4). Notably, the nine L. pneumophila sg1 ST1 isolates had a higher ANI of 96% with the L. pneumophila sg5 ST1950 isolate compared to the 92% ANI with the L. pneumophila sg5 ST2037 isolates. This higher nucleotide similarity between the L. pneumophila sg1 ST1 and L. pneumophila sg5 ST1950 can be visualized with their clustering in the phylogenetic tree (Figure 5). The L. pneumophila sg1 ST1 strains (W2019 BWS Supply Line, Su2018 and W2019 Faucet) were in the same branch as the L. pneumophila sg5 ST1950 strain, while the L. pneumophila sg5 ST2037 strain (Su2018 PVC-FC) was in a separate branch. The PVC-FC isolates were identified as L. feeleii via indirect immunofluorescent antibody assay and sequence similarities to two L. feeleii reference genomes (strain WO-44C and NCTC11978) which displayed >99.9% similarity based on 16S rRNA and ANI of 98.5%. Figure 5 shows the L. feeleii isolates in their own cluster with the reference genomes of L. massiliensis and L. nautarum in the next closest branch. The two L. feeleii reference genomes were not included in the sequence database at the time of this analysis and thus are not represented in the phylogenetic tree (Figure 5).

3. Discussion

The main objective of this study was to gain a better understanding of water quality parameters that correlated with Legionella occurrence within a large complex building water system (BWS) over an extended period of time. Cold bulk water and biofilm samples were collected to monitor the occurrence and distribution of Legionella, other water-based pathogens, and eukaryotic hosts, while considering seasonal fluctuations, and varying engineering, operational, and water quality characteristics. Cold water was analyzed in this study given (1) the high prevalence of Legionella contamination previously identified in cold water samples within public building, private residences, healthcare facilities, and water storage tanks; (2) Legionella transmission and infections epidemiologically linked to cold water exposure; and (3) the current recommendations to monitor both hot and cold water in BWS to control for Legionella [33]. In this study, both culture and molecular methods were used for Legionella detection and culture isolates were submitted for whole genome sequencing for further genetic characterization.
Two percent of biofilm samples (1/57) and 12% of bulk water samples (14/114) were culture-positive for Legionella of which 57% (8/14) were isolated during the winter; 21% (3/14) during the summer; 14% (2/14) during the fall; and 7% (1/14) during the spring. Legionnaires’ disease (LD) cases typically peak during the summer and fall seasons [34,35]. However, other epidemiological studies reported a winter peak for non-travel related cases [36] and no monthly or seasonal correlations for nosocomial-acquired [37] and community-acquired Legionella pneumonia cases [38]. Higher incidences of legionellosis have been associated with various meteorological factors (e.g., humidity, temperature, rainfall, atmospheric pressure); geographic location; and properties of the local watershed and source water (e.g., proximity and water temperature, levels, and flow) [39,40,41,42]. Thus, the exact environmental mechanisms and triggers of Legionella transmission and subsequent disease incidences are yet to be clearly defined.
Culture and qPCR are frequently used methods for Legionella environmental detection [43,44,45]. However, due to discrepancies between and within each of these methods, interpretations of Legionella occurrence across various studies and correlations to legionellosis health risks within BWSs are challenging [46]. Moreover, false positivity rates for the Legiolert® method have been reported to be between 0% and 3.3% for potable water and 4.9% and 11% for non-potable water [47,48,49]. Such as with Ochrobactrum identified in the PVC-Loop location, stable colonization of a Legiolert® false positive causing strain at an environmental monitoring site may continually overestimate L. pneumophila levels and confound interpretations of their occurrence at those sites. Culture-based methods are a reliable indicator of pathogen viability and potential health risks associated with Legionella detection; however, periodic validation of culture-based results can be performed using molecular methods.
In this study, the PVC-R W2018 first draw sample was Legionella culture positive, but Legionella qPCR negative (Table 3, Figure 1b), while the PVC-FC Su2018 second draw sample was Legionella and L. pneumophila culture positive, but only L. pneumophila qPCR negative (Table 3, Figure 1c,i). Culture-positivity/qPCR-negativity has been observed previously and was associated more with drinking water compared to cooling tower water samples [50,51,52]. Furthermore, L. pneumophila qPCR levels were higher than those of Legionella spp. in four first draw samples (Spigot F2017, W2019 and Fountain F2017, Su2018) (Figure 1d, j and f, l) and L. pneumophila was also observed in hot water, but not cooling tower water samples [53]. These discrepancies have been attributed to the presence of PCR inhibitors and competing non-target organisms, and varying culture conditions (e.g., growth temperature, agar type) and sample processing steps that may select for, or inhibit growth of, different strains of Legionella [46].
For Legionella environmental monitoring, samples that can be collected for analysis include (1) biofilm materials, which contain a concentration of surface attached microorganisms; (2) first draw, stagnant water samples, which represent water quality at the outlet; and (3) second draw, post-flushed samples, which represent water quality supplied to the outlet from within the building water system [54,55]. Of the Legionella pneumophila and non-pneumophila culture-positive bulk water samples, 64% (9/14) were first draw and 36% (5/14) were second draw samples, while only 2% (1/57) of biofilm samples were culture-positive (Table 3). From the qPCR analyses, Legionella was detected in 30% (17/57) of biofilm samples and 74% (84/114) of bulk water samples of which 48% (40/84) were first draw and 52% (44/84) were second draw samples. L. pneumophila was detected in 23% (13/57) of biofilm samples and 36% (41/114) of bulk water samples of which 59% (24/41) were first draw and 41% (17/41) were second draw samples (Figure 1).
Differences in physiochemical and microbial water quality parameters between first and second draw samples were previously reported with microbial loads generally higher in the first draw depending on the sampling location and volume collected [56,57]. As stated in Section 2.1, there were no statistical differences in pH, temperature, free chlorine, monochloramine, and total chlorine between the first and second draw samples at all locations with the exceptions of temperature for the Spigot samples and free and total chlorine for the Faucet samples. Three of the six locations had statistical differences between the first and second draw samples for HPCs: PVC-R, Spigot, and Faucet. For Legionella levels detected by qPCR, there were strong positive correlations between the first and second draw samples from all locations: PVC-MA (r = 0.9, P < 0.001), PVC-R (r = 0.6, P < 0.05), PVC-FC (r = 0.9, P < 0.01), Faucet (r = 0.8, P < 0.01), and Fountain (r = 0.8, P < 0.01), except for the Spigot location (r = 0.2, P = 0.575). For L. pneumophila levels as detected by qPCR, there were only strong positive correlations between the first and second draw samples at three of the six locations: PVC-MA (r = 1.0, P < 0.001), PVC-FC (r = 0.9, P < 0.01), and Faucet (r = 0.7, P < 0.05).
The results between the bulk water samples suggested that an analysis of either the first or second draw samples was able to indicate the presence of Legionella. Moreover, it is unclear why only the Faucet location showed statistical differences of both free and total chlorine between the first and second draw samples as water usage at this site was higher than two other locations and the distance of the Faucet outlet was greater than and almost equal to three other sampling locations (Table 1). The only difference between the Faucet location and all others was the ability to draw hot water from this outlet, but only cold water was analyzed in this study; thus, hot water may be contributing to bacterial contamination in the Faucet.
After conversion to monochloramine disinfection within BWSs, there were reductions in the number of distal sites testing positive for Legionella (39–100% to 0–18% positivity); however, there was a large range in the log reduction of Legionella levels (0.2 to 3 log10 CFU L−1) with one study reporting no changes in levels post-conversion during the one- to three-year monitoring period [58,59,60]. Control of biofilm-associated Legionella was also observed [58,61], most likely due to the better penetration of monochloramine into biofilms compared to chlorine [62]; however, control of biofilm-associated L. pneumophila (Lp) was previously reported to be pipe material specific during chlorine and monochloramine treatment [63]. The PVC-MA location used in this study has been operating with a monochloramine residual for approximately 10 years with a two-month chlorine conversion from December 2013 to February 2014. During the sampling period, no culturable Legionella was detected, but molecular analyses indicated a consistent and high level of Legionella and sporadic detection of L. pneumophila in the bulk water and biofilm samples. Specifically, 100% (20/20) of the bulk water samples and 10% (1/10) of biofilm samples had detectable Legionella; while L. pneumophila was detected in 30% (6/20) of bulk water samples (three first draw and three second draw samples) and 10% (1/10) of biofilm samples (Figure 1a and g). Using E. coli, monochloramine was shown to disrupt protein-mediated metabolic processes with no damage to the cell envelope or nucleic acids [64]. This finding is supported by other studies demonstrating no significant impacts on Legionella 16S rRNA gene transcript levels during monochloramine versus chlorine treatment [63] and Pseudomonas aeruginosa extracellular polymeric substances material limiting and delaying monochloramine access to the cell surface [65]. Thus, it is unclear what the exact mechanisms are for monochloramine control of Legionella bacteria and whether different surface properties (e.g., lipopolysaccharides used for L. pneumophila serogroup identification) would result in varying degrees of inactivation with intermediate stages allowing for Legionella regrowth.
Numerous studies have reported more frequent detection of V. vermiformis within BWSs compared to Acanthamoeba spp. [56,66,67]. Concordantly, Acanthamoeba spp. were undetectable in the bulk water and biofilm samples during F2016, thus the following five sampling time points were excluded; however, the analysis was resumed in Sp2018 to confirm the low frequency and/or undetectable observation for Acanthamoeba spp. in BWS samples (Figure 2g–l). Acanthamoeba spp. was detected in only one second draw sample at the PVC-MA location (Figure 2g). Similarly, M. intracellulare was infrequently detected in this study (Figure 2n and p) as previously observed for water samples from chlorinated BWSs [23,68]. V. vermiformis was detected at all locations except PVC-R (Figure 2a–f) with positive correlations between L. pneumophila and V. vermiformis in PVC-FC biofilms and Faucet first draw samples. Given that FLA detection has been correlated to Legionella and Mycobacterium in drinking water systems [69], there is utility in monitoring for FLA to better understand the conditions and FLA members contributing to Legionella and mycobacterial survival within BWSs.
Although diverse populations of Legionella bacteria have been described in drinking water [70,71], environmental monitoring of BWSs focuses primarily on L. pneumophila detection since this species makes up the majority of clinical isolates, with > 80% of those isolates belonging to serogroup (sg) 1 [72,73]. Serotyping allows for the differentiation of L. pneumophila isolates based on their reactivity to the Dresden Panel of antibodies that recognize distinct structures on the bacterial lipopolysaccharide molecule [74,75]. L. pneumophila contains 17 serogroups and 10 subgroups within sg1 [76,77]. The latex agglutination serotyping method used in this study has been shown to produce false negatives as Legionella-like colonies isolated from drinking water samples, confirmed as L. pneumophila via 16S rRNA sequence analyses, were agglutination negative (this study; [78]). Thus, molecular-based methods, such as sequence-based typing (SBT) and whole genome sequencing (WGS), are increasingly being used due to their reliability, better resolution, and discriminatory power for describing genetic diversity, environmental distribution, evolution, population structure, clonal expansion, and virulence properties of Legionella isolates [77,79].
In this study, L. feeleii, L. pneumophila sg1 sequence-type (ST) 1, and L. pneumophila sg5 ST 1950 and ST2037 were identified via 16S rRNA-based analyses, serotyping (latex agglutination and indirect immunofluorescent antibody assays), WGS, and SBT analyses. These unique Legionella strains were isolated from the Faucet, PVC-FC, PVC-Loop, and BWS Supply Line locations during the Su2018, F2018, and W2019 time points (Table 4 andFigure 4). ST1 is the most commonly identified and globally distributed strain isolated from both environmental and clinical samples ([79,80]; this study). Identification of previously unknown STs (e.g., ST1950 and ST2037 from this study) supports the continued SBT of clinical and environmental isolates. This will help elucidate which STs may be more globally distributed or geographically confined, and which are more associated with disease cases, such that when those are environmentally identified, preventative measures can be implemented to limit public health and exposure risks to these pathogens. WGS analyses provide more detailed genetic information about the Legionella strain, beyond those obtained from SBT alone, enabling potential subspecies identification, refined taxonomic classification, and genetic profiling for virulence properties [77]. Legionella diversity and distribution data may also reveal environmental parameters that influence Legionella occurrence and survival within specific environments such as BWSs.
Due to lengthy incubation periods required for Legionella culture, the tendency for qPCR to overestimate their levels, and the discrepancies associated with these methods, as described above, use of other microbial and/or physiochemical water quality parameters as potential indicators for Legionella presence in BWSs has been investigated [70]. As described in Section 2.5, there were strong statistical correlations observed between various water quality parameters and Legionella occurrence such as V. vermiformis, HPC, chlorine residual, temperature, and turbidity (Figure 3). However, these correlations were location and sample type specific with conflicting positive and negative correlations for turbidity and HPC. Conflicting correlations between the latter and Legionella levels have been reported previously with either strong correlations [81], no correlations [82,83,84,85], or possible seasonal dependencies for these correlations [7]. Other conflicting correlations were reported between Legionella occurrence and pH, temperature, various minerals and metals (Ca, Cu, Fe, Mg, Mn, and Zn), total organic carbon, conductivity, and free chlorine at the sampling site and building supply feed [85,86,87].
Thus, further analyses of existing data and correlations to Legionella occurrence, as well as more in-depth studies on identifying these correlations, need to be performed. This will enable determinations as to whether correlations are dependent on complex factors, either individually or in concert, such as disinfectant type; source water quality fluctuations; genetic background of detected Legionella populations; presence of other drinking water microorganisms; or certain engineering and operational water system aspects specific to sampled locations. The notable observations from this study were (1) detection and culture of Legionella from outlets that neither supply, nor are connected to plumbing for, hot water; (2) isolation of diverse L. pneumophila and non-pneumophila strains from different locations; (3) utility of whole genome sequencing and sequence-based typing for enhanced isolate description and characterization of their distribution; (4) Legionella levels detected during monitoring can significantly differ between the first and second draw sample; and (5) negative and positive correlations between Legionella and various water quality parameters were location and sample type specific.
Confoundingly, occurrence alone is not the most important factor for legionellosis risk. Environmental, bacterial, and host specific factors such as aerosolization into respirable droplets and their potential for human exposure; virulence of the environmental Legionella strain; and host immune status and susceptibility to infection, collectively play an important role in exposure risks and disease outcome. The main objective of this study was to gain a better understanding of Legionella occurrence and water quality parameters supporting their growth within a large, complex building water system. Information from this, and future studies, will help elucidate ways to effectively manage the risks associated with Legionella exposure within these drinking water distribution systems.

4. Materials and Methods

4.1. Sampling Locations

A 40-year old, 33,000 square ft. building with an average potable water usage of 3.6 million gallons (13.6 million L) per year was used in this study. Water usage at any given location varies widely depending upon the activity (floor washing, water storage tank cleanout, etc.) being conducted and the facility cooling demand during warmer months. The building’s potable water supply is derived from river water treated by coagulation, flocculation, and sedimentation; followed by sand, gravel, and granular activated carbon filtration; and then chlorination. Cold potable water samples were collected seasonally every three months from six locations throughout the building (Table 1, Figure S1). The total number of samples for each site was 30 (10 first and second draw bulk water and 10 biofilm samples) collected over a 28-month period, October 2016 to February 2019; except for site PVC-FC, where the total number of samples was 21 (seven first and second draw bulk water and biofilm samples) collected over an 18-month period, August 2017 to February 2019. Sampling time points are denoted F, for fall; W, for winter; Sp, for spring; and Su, for summer followed by the corresponding year. F, W, Sp, and Su samples were collected during the months of October, November, February, May, and August, respectively.
Within this building, a semi-closed pipe loop distribution system simulator was fed with the chlorinated municipal drinking water, described above, and amended with ammonium hydroxide and sodium hypochlorite (Sigma Aldrich, St. Louis, MO, USA) to yield a 2 mg L−1 monochloramine residual as previously described [88]. Average monochloramine and ammonia levels (± SD) during this sampling period were 1.25 ± 0.37 and 0.16 ± 0.07 ppm, respectively.

4.2. Sample Collection and Processing

For each sampling location, the first draw sample was taken immediately after turning the tap on, while the second draw was collected after 10 s of flushing (approximately 4 L), except for Fountain where the second draw sample was collected after 30 s of flushing (approximately 2 L). The 10–30-second flush time was used to ensure collection of non-stagnant water that was still representative of water quality conditions within the BWS. Sampling took place early in the morning after an overnight stagnation period. Water samples were collected in sterile 1 L plastic bottles and 1 mL of 10% w/v sodium thiosulfate was added to neutralize any disinfectant residual. An additional 100 mL was also collected for water quality analysis as described below. Approximately 1 L of each bulk water sample was filtered through a 0.2 μm polyethersulfone membrane (Supor® Membrane, PALL Life Sciences, Nassau, NY, USA). Filters were placed into 11 mL of UV-light dechlorinated, 0.22 μm filtered drinking water (dfH2O), and vortexed at maximum speed for 1 min to resuspend the concentrated bulk water material. For biofilm collection, a sterile polyester tipped applicator was used to swab an approximate area of 2 cm2 inside the tap. The applicator was then placed in a 14-mL round bottom tube containing 2 mL of dfH2O and vortexed vigorously for 1 min to resuspend the collected biofilm material.
Approximately 1 mL of the concentrated bulk water and biofilm suspension was analyzed for CFU, as described in Section 4.4, and the remaining volume was centrifuged at high speed (13,000 rcf, room temperature, 10 min; Eppendorf, Foster City, CA, USA). Pellets were resuspended in 200 μL of dfH2O and placed in a Lysing Matrix A tube (MP Biomedicals, Solon, OH, USA) along with the washed filter or biofilm swab for nucleic acid extraction as described below.

4.3. Water Quality Analysis

Bulk water samples were analyzed for pH, turbidity, temperature, disinfectant residual, and heterotrophic plate count (HPC). Free chlorine and total chlorine measurements were performed using the DPD colorimetric method (Powder Pillows; Hach USA) and monochloramine and free ammonia measurements were performed using the indophenol method (method 10200, Powder Pillows, free ammonia chlorinating solution; Hach USA). HPCs were enumerated by the spread plate method on Reasoner’s 2A agar (R2A, Difco Laboratories, Detroit, MI, USA) following incubation at 28 °C for 7 d. The limit of detection (LOD) for bulk water samples was 1.0 log10 CFU 100 mL−1 and 0.7 log10 CFU cm−2 for biofilm samples.

4.4. Legionella Enumeration and Presumptive Colony Analysis

For colony forming unit (CFU) enumeration, undiluted and serially diluted suspensions were spread plated on buffered charcoal yeast extract (BCYE) agar plates (BD Diagnostics, Franklin Lakes, NJ, USA) and incubated for 4–6 days at 37 °C [44]. Presumptive Legionella colonies were counted; and a subset was isolated and confirmed as Legionella spp. or L. pneumophila via polymerase chain reaction (PCR) using the 16S rRNA gene assays described in Section 4.6. An aliquot of the processed bulk water and biofilm samples was also heat-treated (incubation in a 55 °C water bath for 30 min) before plating on BCYE agar plates to evaluate potential differences in Legionella recovery from this pretreatment method [44]. Although growth of non-Legionella bacteria was inhibited by heat treatment, there were no significant differences between Legionella CFU observed between unheated and heated samples (data not shown).
For most probable number (MPN) enumeration, Legiolert® (Idexx Laboratories, Westbrook, ME, USA) was used to analyze 10 mL of the unconcentrated bulk water samples and 0.5 mL of the resuspended biofilm samples for only the Su2018, F2018, and W2019 time points. To obtain pure isolates from the Legiolert® tray, positive wells were punctured using a 26-gauge needle and 50–1000 μL of the well contents was collected. A 20 μL aliquot of the sampled well was streaked onto a BCYE agar plate and incubated for 4–6 days at 37 °C.
Those identified as L. pneumophila by PCR were serotyped using the OxoidTM Legionella Latex Agglutination Kit (ThermoFisher, Waltham, MA, USA), which allows for the separate identification of L. pneumophila serogroup 1 and serogroups 2–14 and detection of seven other Legionella species (L. anisa; L. bozemanii 1 and 2; L. dumoffii; L. gormanii; L. jordanis; L. longbeachae 1 and 2; and L. micdadei). Two L. pneumophila isolates identified as belonging to serogroups 2–14 via latex agglutination (Su2018 PVC-FC 1 and W2019 PVC-Loop Legiolert® 2) and one Legionella spp. PCR positive isolate (F2018 PVC-FC) were sent to an external laboratory (EMSL Analytical Inc., Cinnaminson, NJ, USA) for further identification via indirect immunofluorescent antibody assay [44].
To account for zero values, 1 was added to all data points before conversion to the log10 scale (e.g., log10 (CFU + 1)). Calculations from CFU and molecular analyses were adjusted and expressed as units per mL or cm2 for bulk water samples and biofilms, respectively. The LOD for bulk water samples was 1.0 log10 CFU 100 mL−1 and 0.7 log10 CFU cm−2 for biofilm samples.

4.5. Isolation and Preparation of Total DNA

DNA was extracted from bacterial cells using the MasterPure™ Complete DNA purification kit (Epicentre Biotechnologies Inc., Madison, WI, USA) according to manufacturer’s protocol and the Mini-Beadbeater−16 (Biospec Products, Bartlesville, OK, USA) where samples were processed twice for 30 s at 3450 oscillations min−1. The DNA pellet was resuspended in 100 μL of molecular grade water.

4.6. Quantitative Polymerase Chain Reaction (qPCR)

Biofilm and bulk water DNA samples were analyzed in duplicate using the Applied Biosystems QuantStudio 6 Flex Fast Real-Time PCR system (ThermoFisher, Waltham, MA, USA). A 10-fold dilution of each sample was also analyzed in duplicate to test for presence of environmental qPCR inhibitors. The TaqMan qPCR assay for Legionella spp., L. pneumophila, Mycobacterium intracellulare detection, targeting the 16S rRNA gene, was performed as previously described [63,89,90]. The TaqMan qPCR assay for Acanthamoeba spp. and SYBR green qPCR assay for Vermamoeba vermiformis detection, targeting the 18S rRNA gene, was performed as previously described [91,92].
The forward and reverse primers and probe sequences (5’ to 3’) and cycling parameters used in this study for the Legionella spp. qPCR assay, respectively, are 16S-LegF1c: TAG TGG AAT TTC CGG TGT A; 16S-LegR1c: CCA ACA GCT AGT TGA CAT C; 16S-LegP1: CGG CTA CCT GGC CTA ATA CTG A; and 50 °C for 2 min, 95 °C for 10 min, 40 cycles of 95 °C for 10 s and 50 °C for 30 s, and at 70 °C for 30 s [90]. The forward and reverse primers and probe sequences (5’ to 3’) and cycling parameters used in this study for the L. pneumophila qPCR assay, respectively, are LpneuF1: CGG AAT TAC TGG GCG TAA AGG-3; LpneuR1: GAG TCA ACC AGT ATT ATC TGA CCG T; LpneuP1: AAG CCC AGG AAT TTC ACA GAT AAC TTA ATC AAC CA; and 95 °C for 10 min, 40 cycles of 95 °C for 10 s, and at 60 °C for 1 min [63]. The forward and reverse primers and probe sequences (5’ to 3’) and cycling parameters used in this study for the M. intracellulare qPCR assay, respectively, are F: GGG TGA GTA ACA CGT GTG CAA; R: CCA CCT AAA GAC ATG CGA CTA AA; P: TGC ACT TCG GGA TAA GCC TGG GAA A; and 50 °C for 2 min, 95 °C for 10 min, 40 cycles of 95 °C for 15 s, and 60 °C for 1 min [89]. The forward and reverse primers and probe sequences (5’ to 3’) and cycling parameters used in this study for the Acanthamoeba spp. qPCR assay, respectively, are TaqAcF1: CGA CCA GCG ATT AGG AGA CG; TaqAcR1: CCG ACG CCA AGG ACG AC; TaqAcP1: TGA ATA CAA AAC ACC ACC ATC GGC GC; and 50 °C for 2 min, 95 °C for 10 min, followed by 40 cycles at 95 °C for 15 s and 60 °C for 1 min, respectively [92]. The forward and reverse primer sequences (5’ to 3’) and cycling parameters used in this study for the V. vermiformis spp. qPCR assay, respectively, are Hv1227F: TTA CGA GGT CAG GAC ACT GT; Hv1728R: GAC CAT CCG GAG TTC TCG; and 95 °C for 3 min, followed by 40 cycles at 95 °C for 20 s, 56 °C for 30 s, and 72 °C for 40 s, and then 72 °C for 10 min [91].
For Legionella spp. and L. pneumophila qPCR assays, standard curves were generated, on each plate, using a plasmid vector (pUCIDT-AMP; Integrated DNA Technologies, Inc., Coralville, IA, USA) containing a cloned 189-bp region of the L. pneumophila Philadelphia-1 16S rRNA gene (NCBI reference sequence NC_002942.5, positions 609325 to 609513) that contains the targets for each of these qPCR assays. M. intracellulare standard curves were generated from serially diluted purified genomic DNA. Cell-based calibration curves were constructed for Acanthamoeba spp. and V. vermiformis by preparing 10-fold serial dilutions of DNA extracted from amoeba cell cultures of known densities.
Standards ranging from 1 to 107 gene copy (GC) for Legionella spp. and L. pneumophila qPCR assays; 4 to 104 GC for M. intracellulare qPCR assays; and 1 to 105 cell equivalents (CE) for the amoeba qPCR assays were generated and analyzed in triplicate along with duplicate no-template control for each 96-well plate. Data were expressed as log10 gene copy or CE or GU per mL or cm2. The limits of detection for bulk water and biofilm samples were 1.6 log10 GC L−1 and 1.3 log10 GC cm−2 for the Legionella spp. and L. pneumophila assays; 1.3 log10 GC L−1 and 0.9 log10 GC cm−2 for the M. intracellulare assay; 1.4 log10 CE L−1 and 1.0 log10 CE cm−2 for the Acanthamoeba spp. assay; and 2.4 log10 CE L−1 and 2.0 log10 CE cm−2 for the V. vermiformis assay, respectively.

4.7. Whole Genome Sequencing and Sequence Analyses

Twenty-one bulk water isolates were chosen for whole genome sequencing. Total DNA from each strain was isolated as described in Section 4.5. DNA concentrations were estimated using the Nanodrop ND−1000 Spectrophotometer (NanoDrop Technologies, Inc., Wilmington, DE, USA). Total DNA was submitted for whole genome sequencing (Wright Labs LLC, Huntingdon, PA, USA) where genomic libraries were prepared using the Nextera XT Index Kit v2 Set A and sequenced on the HiSeq 4000 platform (Illumina Inc., San Diego, CA, USA) with a HiSeq 3000/4000 PE Cluster kit (2 × 150 bp). Prior to assembly, libraries were (i) cleaned from contaminants (adapters, phiX, artifacts, and human), (ii) error corrected, (iii) normalized to ≤ 100 ×, (iv) removed of low (< 6 ×) coverage reads, and (v) filtered to a minimum length read of 100 nt. Reads were processed using the software package BBMap v37.90 (http://sourceforge.net/projects/bbmap) and de novo assembly using the software Unicycler v0.4.4 [93]. The Illumina reads are deposited in the National Center for Biotechnology Information (NCBI) Sequence Read Archive database under the BioProject accession number PRJNA558750.
Sequence-based typing (SBT) analysis was performed in silico with legsta and multi-locus sequence typing (mlst) as described previously [94]. The phylogenetic tree was constructed combining the sequenced genomes from this study and a set of closely related genomes. Relatedness is determined by alignment similarity to a select subset of COG (Clusters of Orthologous Groups) domains. The phylogenetic tree is reconstructed using FastTree 2 [95] to determine maximum likelihood phylogeny. Average nucleotide identity (ANI), an index of similarity between two genomes [96], was calculated using FastANI v1.3 (https://github.com/ParBLiSS/FastANI) [97]. ANI is defined as mean nucleotide identity of orthologous gene pairs shared between two microbial genomes. No ANI output is reported for a genome pair if the ANI value is below 80%.

4.8. Statistical Analysis

For each water quality parameter, a Shapiro–Wilk normality test was conducted for each site to determine distribution of the data throughout the sampling period. A one-way analysis of variance (ANOVA) using the Tukey multiple comparisons test was conducted between each site and sample type. P-values of < 0.05 were considered statistically significant. Analyses were performed using Prism 8 (GraphPad Software, San Diego, CA, USA). The R functions cor() and cor.test() were used, with a Spearman correction, to determine the direction (positive or negative) and significance of correlation between pairs of water quality characteristics within each sample location [98]. The correlation between the pairs was denoted by the number, r, which varies between –1 and +1, with 0 meaning no correlation, +1 a complete positive correlation, and –1 a complete negative correlation.

Supplementary Materials

The following are available online at https://0-www-mdpi-com.brum.beds.ac.uk/2076-0817/9/7/567/s1; Figure S1: Images of outlets at each sampling location; Figure S2: Scatterplot of turbidity measurements for bulk water samples; Figure S3: Scatterplot of free (A) and total (B) chlorine measurements for bulk water samples.

Author Contributions

Conceptualization and methodology, H.Y.B. and J.S.H.; validation, H.B.; formal analysis, H.Y.B. and V.G.-A.; investigation, H.Y.B., B.J.M., J.G.S., and J.S.H.; data curation, H.Y.B.; writing—original draft preparation, H.Y.B.; writing—review and editing, H.Y.B., B.J.M., V.G.-A., J.G.S., and J.S.H.; visualization, H.Y.B. All authors have read and agreed to the published version of the manuscript.

Funding

The U.S. Environmental Protection Agency (EPA) through its Office of Research and Development funded and managed the research described herein under contract #EP-C−11-006 to Pegasus Technical Services, Inc.

Acknowledgments

We would like to thank our EPA colleagues, James Goodrich and Hodon Ryu, for their technical review of this manuscript and Chelsea Hintz, for her assistance with the correlation analyses using R.

Disclaimer

This manuscript has been subjected to the Agency’s review and has been approved for publication. The views expressed in this article are those of the authors and do not necessarily represent the views or policies of the Agency. Mention of trade names, commercial products, and/or services does not imply an endorsement or recommendation for use by the U.S. Government or EPA.

Conflicts of Interest

The authors declare no conflict of interest. With EPA funding, researchers designed the study; collected, analyzed, and interpreted the data; and wrote the manuscript intended for publication.

References

  1. WHO. Legionella and the Prevention of Legionellosis; World Health Organization Press: Geneva, Switzerland, 2007. [Google Scholar]
  2. Davis, G.S.; Winn, W.C., Jr.; Gump, D.W.; Craighead, J.E.; Beaty, H.N. Legionnaires’ pneumonia after aerosol exposure in guinea pigs and rats. Am. Rev. Respir. Dis. 1982, 126, 1050–1057. [Google Scholar]
  3. Kaufmann, A.F.; McDade, J.E.; Patton, C.M.; Bennett, J.V.; Skaliy, P.; Feeley, J.C.; Anderson, D.C.; Potter, M.E.; Newhouse, V.F.; Gregg, M.B.; et al. Pontiac fever: Isolation of the etiologic agent (Legionella pneumophilia) and demonstration of its smode of transmission. Am. J. Epidemiol. 1981, 114, 337–347. [Google Scholar] [CrossRef]
  4. Beer, K.B.; Gargano, J.W.; Roberts, V.A.; Reses, H.E.; Hill, V.R.; Garrison, L.E.; Kutty, P.K.; Hilborn, E.D.; Wade, T.J.; Fullerton, K.E.; et al. Outbreaks associated with environmental and undetermined water exposures—United States, 2011–2012. MMWR Morb. Mortal. Wkly. Rep. 2015, 64, 849–851. [Google Scholar] [CrossRef] [Green Version]
  5. Bededict, K.M.; Reses, H.E.; Vigar, M.; Roth, D.M.; Roberts, V.A.; Mattioli, M.; Cooley, L.A.; Hilborn, E.D.; Wade, T.J.; Fullerton, K.E.; et al. Surveillance for waterborne disease outbreaks associated with drinking water—United States, 2013–2014. MMWR Morb Mortal. Wkly. Rep. 2017, 66, 1216–1221. [Google Scholar] [CrossRef]
  6. Fraser, D.W.; Tsai, T.R.; Orenstein, W.; Parkin, W.E.; Beecham, H.J.; Sharrar, R.G. Legionnaires’ disease: Description of an epidemic of pneumonia. N. Engl. J. Med. 1977, 297, 1189–1197. [Google Scholar] [CrossRef]
  7. Rodríguez-Martínez, S.; Sharaby, Y.; Pecellín, M.; Brettar, I.; Höfle, M.; Halpern, M. Spatial distribution of Legionella pneumophila MLVA-genotypes in a drinking water system. Water Res. 2015, 77, 119–132. [Google Scholar] [CrossRef]
  8. King, D.N.; Donohue, M.J.; Vesper, S.J.; Villegas, E.N.; Ware, M.W.; Vogel, M.E.; Furlong, E.F.; Kolpin, D.W.; Glassmeyer, S.T.; Pfaller, S. Microbial pathogens in source and treated waters from drinking water treatment plants in the United States and implications for human health. Sci. Total Environ. 2016, 562, 987–995. [Google Scholar] [CrossRef] [Green Version]
  9. Donohue, M.J.; King, D.; Pfaller, S.; Mistry, J.H. The sporadic nature of Legionella pneumophila, Legionella pneumophila Sg1 and Mycobacterium avium occurrence within residences and office buildings across 36 states in the United States. J. Appl. Microbiol. 2019, 126, 1568–1579. [Google Scholar] [CrossRef]
  10. Stout, J.E.; Brennen, C.; Muder, R.R. Legionnaires’ disease in a newly constructed long-term care facility. J. Am. Geriatr. Soc. 2000, 48, 1589–1592. [Google Scholar] [CrossRef]
  11. Orsi, G.B.; Vitali, M.; Marinelli, L.; Ciorba, V.; Tufi, D.; Del Cimmuto, A.; Ursillo, P.; Fabiani, M.; De Santis, S.; Protano, C.; et al. Legionella control in the water system of antiquated hospital buildings by shock and continuous hyperchlorination: 5 years experience. BMC Infect. Dis. 2014, 14, 394. [Google Scholar] [CrossRef] [PubMed] [Green Version]
  12. Perola, O.; Kauppinen, J.; Kusnetsov, J.; Kärkkäinen, U.-M.; Lück, P.C.; Katila, M.-L. Persistent Legionella pneumophila colonization of a hospital water supply: Efficacy of control methods and a molecular epidemiological analysis. APMIS 2005, 113, 45–53. [Google Scholar] [CrossRef]
  13. Scaturro, M.; Dell’eva, I.; Helfer, F.; Ricci, M.L. Persistence of the same strain of Legionella pneumophila in the water system of an Italian hospital for 15 years. Infect. Control. Hosp. Epidemiol. 2007, 28, 1089–1092. [Google Scholar] [CrossRef]
  14. Cooper, I.R.; White, J.; Mahenthiralingam, E.; Hanlon, G.W. Long-term persistence of a single Legionella pneumophila strain possessing the mip gene in a municipal shower despite repeated cycles of chlorination. J. Hosp. Infect. 2008, 70, 154–159. [Google Scholar] [CrossRef] [PubMed]
  15. Garcia-Nuñez, M.; Sopena, N.; Ragull, S.; Pedro-Botet, M.L.; Morera, J.; Sabria, M. Persistence of Legionella in hospital water supplies and nosocomial Legionnaires’ disease. FEMS Immunol. Med. Microbiol. 2008, 52, 202–206. [Google Scholar] [CrossRef] [Green Version]
  16. Bédard, E.; Boppe, I.; Kouamé, S.; Martin, P.; Pinsonneault, L.; Valiquette, L.; Racine, J.; Prévost, M. Combination of heat shock and enhanced thermal regime to control the growth of a persistent Legionella pneumophila strain. Pathogens 2016, 5, 35. [Google Scholar] [CrossRef] [Green Version]
  17. Gomez-Valero, L.; Rusniok, C.; Jarraud, S.; Vacherie, B.; Rouy, Z.; Barbe, V.; Medigue, C.; Etienne, J.; Buchrieser, C. Extensive recombination events and horizontal gene transfer shaped the Legionella pneumophila genomes. BMC Genom. 2011, 12, 536. [Google Scholar] [CrossRef] [Green Version]
  18. Segal, G.; Shuman, H.A. Legionella pneumophila utilizes the same genes to multiply within Acanthamoeba castellanii and human macrophages. Infect. Immun. 1999, 67, 2117–2124. [Google Scholar] [CrossRef] [Green Version]
  19. Ensminger, A.W. Legionella pneumophila, armed to the hilt: Justifying the largest arsenal of effectors in the bacterial world. Curr. Opin. Microbiol. 2016, 29, 74–80. [Google Scholar] [CrossRef]
  20. Ashbolt, N.J. Environmental (saprozoic) pathogens of engineered water systems: Understanding their ecology for risk assessment and management. Pathogens 2015, 4, 390–405. [Google Scholar] [CrossRef] [Green Version]
  21. Ben Salah, I.; Drancourt, M. Surviving within the amoebal exocyst: The Mycobacterium avium complex paradigm. BMC Microbiol. 2010, 10, 99. [Google Scholar] [CrossRef] [Green Version]
  22. Griffith, D.E.; Aksamit, T.; Brown-Elliott, B.A.; Catanzaro, A.; Daley, C.; Gordin, F.; Holland, S.M.; Horsburgh, R.; Huitt, G.; Iademarco, M.F.; et al. An official ATS/IDSA statement: Diagnosis, treatment, and prevention of nontuberculous mycobacterial diseases. Am. J. Respir. Crit. Care Med. 2007, 175, 367–416. [Google Scholar] [CrossRef] [PubMed]
  23. Falkinham, J.O., 3rd; Norton, C.D.; LeChevallier, M.W. Factors influencing numbers of Mycobacterium avium, Mycobacterium intracellulare, and other Mycobacteria in drinking water distribution systems. Appl. Environ. Microbiol. 2001, 67, 1225–1231. [Google Scholar] [CrossRef] [PubMed] [Green Version]
  24. Wadowsky, R.M.; Yee, R.B. Satellite growth of Legionella pneumophila with an environmental isolate of Flavobacterium breve. Appl. Environ. Microbiol. 1983, 46, 1447–1449. [Google Scholar] [CrossRef] [Green Version]
  25. Wadowsky, R.M.; Yee, R.B. Effect of non-Legionellaceae bacteria on the multiplication of Legionella pneumophila in potable water. Appl. Environ. Microb. 1985, 49, 1206–1210. [Google Scholar] [CrossRef] [Green Version]
  26. Temmerman, R.; Vervaeren, H.; Noseda, B.; Boon, N.; Verstraete, W. Necrotrophic growth of Legionella pneumophila. Appl. Environ. Microbiol. 2006, 72, 4323–4328. [Google Scholar] [CrossRef] [Green Version]
  27. Tison, D.L.; Pope, D.H.; Cherry, W.B.; Fliermans, C.B. Growth of Legionella pneumophila in association with blue-green algae (cyanobacteria). Appl. Environ. Microb. 1980, 39, 456–459. [Google Scholar] [CrossRef] [Green Version]
  28. Rogers, J.; Dowsett, A.B.; Dennis, P.J.; Lee, J.V.; Keevil, C.W. Influence of temperature and plumbing material selection on biofilm formation and growth of Legionella pneumophila in a model potable water system containing complex microbial flora. Appl. Environ. Microbiol. 1994, 60, 1585–1592. [Google Scholar] [CrossRef] [Green Version]
  29. Cristino, S.; Legnani, P.P.; Leoni, E. Plan for the control of Legionella infections in long-term care facilities: Role of environmental monitoring. Int. J. Hyg. Environ. Health 2012, 215, 279–285. [Google Scholar] [CrossRef]
  30. CDC. Developing a Water Management Program to Reduce Legionella Growth & Spread in Buildings: A Practical Guide to Implementing Industry Standards; USDHHS, Ed.; CDC: Atlanta, GA, USA, 2017; p. 36.
  31. ANSI/ASHRAE. Standard 188-2018 Legionellosis: Risk Management for Building Water Systems; ANSI/ASHRAE: Atlanta, GA, USA, 2018. [Google Scholar]
  32. Szabo, J.G.; Meiners, G.; Heckman, L.; Rice, E.W.; Hall, J. Decontamination of Bacillus spores adhered to iron and cement-mortar drinking water infrastructure in a model system using disinfectants. J. Environ. Manag. 2017, 187, 1–7. [Google Scholar] [CrossRef]
  33. National Academies of Science, Engineering, and Medicine. Management of Legionella in Water Systems; The National Academies Press: Washington, DC, USA, 2020. [Google Scholar]
  34. Neil, K.; Berkelman, R. Increasing incidence of legionellosis in the United States, 1990–2005: Changing epidemiologic trends. Clin. Infect. Dis. 2008, 47, 591–599. [Google Scholar] [CrossRef]
  35. Alarcon Falconi, T.M.; Cruz, M.S.; Naumova, E.N. The shift in seasonality of legionellosis in the USA. Epidemiol. Infect. 2018, 146, 1824–1833. [Google Scholar] [CrossRef] [PubMed] [Green Version]
  36. Bhopal, R.S.; Fallon, R.J. Seasonal variation of Legionnaires’ disease in Scotland. J. Infect. 1991, 22, 153–160. [Google Scholar] [CrossRef]
  37. Joseph, C.A.; Watson, J.M.; Harrison, T.G.; Bartlett, C.L.R. Nosocomial Legionnaires’ disease in England and Wales, 1980–92. Epidemiol. Infect. 1994, 112, 329–346. [Google Scholar] [CrossRef]
  38. Von Baum, H.; Ewig, S.; Marre, R.; Suttorp, N.; Gonschior, S.; Welte, T.; Lück, C.; Group CNfCAPS. Community-acquired Legionella pneumonia: New insights from the German Competence Network for Community Acquired Pneumonia. Clin. Infect. Dis. 2008, 46, 1356–1364. [Google Scholar] [CrossRef] [Green Version]
  39. Ng, V.; Tang, P.; Jamieson, F.; Drews, S.J.; Brown, S.; Low, D.E.; Johnson, C.C.; Fisman, D.N. Going with the flow: Legionellosis risk in Toronto, Canada is strongly associated with local watershed hydrology. Ecohealth 2008, 5, 482–490. [Google Scholar] [CrossRef] [Green Version]
  40. Simmering, J.E.; Polgreen, L.A.; Hornick, D.B.; Sewell, D.K.; Polgreen, P.M. Weather-dependent risk for Legionnaires’ Disease, United States. Emerg. Infect. Dis. 2017, 23, 1843–1851. [Google Scholar] [CrossRef]
  41. Cassell, K.; Gacek, P.; Warren, J.L.; Raymond, P.A.; Cartter, M.; Weinberger, D.M. Association between sporadic legionellosis and river systems in Connecticut. J. Infect. Dis. 2018, 217, 179–187. [Google Scholar] [CrossRef] [Green Version]
  42. Barskey, A.; Lackraj, D.; Tripathi, P.S.; Cooley, L.A.; Lee, S.; Smith, J.; Edens, C. Legionnaires’ Disease Surveillance Summary Report, United States—2016 and 2017; Centers for Disease Control and Prevention: Atlanta, GA, USA, 2020.
  43. ISO. ISO 12869:2012 Water Quality—Detection and Quantification of Legionella spp. and/or Legionella Pneumophila by Concentration and Genic Amplification by quantitative Polymerase Chain Reaction (qPCR); ISO/TR 13843; International Organization for Standardization: Geneva, Switzerland, 2012. [Google Scholar]
  44. ISO. ISO 11731:2017 Water Quality—Enumeration of Legionella; International Organization for Standardization: Geneva, Switzerland, 2017. [Google Scholar]
  45. Kozak, N.A.; Lucas, C.E.; Winchell, J.M. Identification of Legionella in the environment. In Legionella Methods and Protocols; Buchrieser, C., Hilbi, H., Eds.; Springer: New York, NY, USA; Humana Press: London, UK, 2013. [Google Scholar]
  46. Whiley, H.; Taylor, M. Legionella detection by culture and qPCR: Comparing apples and oranges. Crit. Rev. Microbiol. 2016, 42, 65–74. [Google Scholar] [CrossRef] [Green Version]
  47. Sartory, D.P.; Spies, K.; Lange, B.; Schneider, S.; Langer, B. Evaluation of a most probable number method for the enumeration of Legionella pneumophila from potable and related water samples. Lett. Appl. Microbiol. 2017, 64, 271–275. [Google Scholar] [CrossRef]
  48. Petrisek, R.; Hall, J. Evaluation of a most probable number method for the enumeration of Legionella pneumophila from North American potable and nonpotable water samples. J. Water Health 2018, 16, 25–33. [Google Scholar] [CrossRef] [PubMed] [Green Version]
  49. Rech, M.M.; Swalla, B.M.; Dobranic, J.K. Evaluation of Legiolert for quantification of Legionella pneumophila from non-potable water. Curr. Microbiol. 2018, 75, 1282–1289. [Google Scholar] [CrossRef] [PubMed] [Green Version]
  50. Levi, K.; Smedley, J.; Towner, K.J. Evaluation of a real-time PCR hybridization assay for rapid detection of Legionella pneumophila in hospital and environmental water samples. Clin. Microbiol Infect. 2003, 9, 754–758. [Google Scholar] [CrossRef] [PubMed] [Green Version]
  51. Lee, J.V.; Lai, S.; Exner, M.; Lenz, J.; Gaia, V.; Casati, S.; Hartemann, P.; Luck, C.; Pangon, B.; Ricci, M.L.; et al. An international trial of quantitative PCR for monitoring Legionella in artificial water systems. J. Appl. Microbiol. 2011, 110, 1032–1044. [Google Scholar] [CrossRef] [PubMed] [Green Version]
  52. Toplitsch, D.; Platzer, S.; Pfeifer, B.; Hautz, J.; Mascher, F.; Kittinger, C. Legionella detection in environmental samples as an example for successful implementation of qPCR. Water 2018, 10, 1012. [Google Scholar] [CrossRef] [Green Version]
  53. Joly, P.; Falconnet, P.A.; André, J.; Weill, N.; Reyrolle, M.; Vandenesch, F.; Maurin, M.; Etienne, J.; Jarraud, S. Quantitative real-time Legionella PCR for environmental water samples: Data interpretation. Appl. Environ. Microbiol. 2006, 72, 2801–2808. [Google Scholar] [CrossRef] [Green Version]
  54. ISO. ISO 19458:2006 Water Quality—Sampling for Microbiological Analysis; International Organization for Standardization: Geneva, Switzerland, 2006. [Google Scholar]
  55. The European Guidelines Working Group. Infections EWGfL: European Technical Guidelines 2017: Minimising the Risk from Legionella Infections in Building Water Systems; The European Guidelines Working Group: London, UK, 2017. [Google Scholar]
  56. Lu, J.; Buse, H.; Struewing, I.; Zhao, A.; Lytle, D.; Ashbolt, N. Annual variations and effects of temperature on Legionella spp. and other potential opportunistic pathogens in a bathroom. Environ. Sci. Pollut. Res. Int. 2017, 24, 2326–2336. [Google Scholar] [CrossRef]
  57. Bédard, E.; Laferrière, C.; Déziel, E.; Prévost, M. Impact of stagnation and sampling volume on water microbial quality monitoring in large buildings. PLoS ONE 2018, 13, e0199429. [Google Scholar] [CrossRef] [Green Version]
  58. Flannery, B.; Gelling, L.B.; Vugia, D.J.; Weintraub, J.M.; Salerno, J.J.; Conroy, M.J.; Stevens, V.A.; Rose, C.E.; Moore, M.R.; Fields, B.S.; et al. Reducing Legionella colonization in water systems with monochloramine. Emerg. Infect. Dis. 2006, 12, 588–596. [Google Scholar] [CrossRef] [Green Version]
  59. Duda, S.; Kandiah, S.; Stout, J.E.; Baron, J.L.; Yassin, M.; Fabrizio, M.; Ferrelli, J.; Hariri, R.; Wagener, M.M.; Goepfert, J.; et al. Evaluation of a new monochloramine generation system for controlling Legionella in building hot water systems. Infect. Control. Hosp. Epidemiol. 2014, 35, 1356–1363. [Google Scholar] [CrossRef]
  60. Mancini, B.; Scurti, M.; Dormi, A.; Grottola, A.; Zanotti, A.; Cristino, S. Effect of monochloramine treatment on colonization of a hospital water distribution system by Legionella spp.: A 1 year experience study. Environ. Sci. Technol. 2015, 49, 4551–4558. [Google Scholar] [CrossRef]
  61. Waak, M.B.; LaPara, T.M.; Hallé, C.; Hozalski, R.M. Occurrence of Legionella spp. in water-main biofilms from two drinking water distribution systems. Environ. Sci. Technol. 2018, 52, 7630–7639. [Google Scholar] [CrossRef] [PubMed]
  62. Lee, W.H.; Pressman, J.G.; Wahman, D.G. Three-dimensional free chlorine and monochloramine biofilm penetration: Correlating penetration with biofilm activity and viability. Environ. Sci. Technol. 2018, 52, 1889–1898. [Google Scholar] [CrossRef] [PubMed]
  63. Buse, H.Y.; Morris, B.J.; Struewing, I.T.; Szabo, J.G. Chlorine and monochloramine disinfection of Legionella pneumophila colonizing copper and polyvinyl chloride drinking water biofilms. Appl. Environ. Microbiol. 2019, 85, e02956-18. [Google Scholar] [CrossRef] [PubMed] [Green Version]
  64. Jacangelo, J.G.; Olivieri, V.P.; Kawata, K. Investigating the mechanism of inactivation of Escherichia coli B by monochloramine. J. AWWA 1991, 83, 80–87. [Google Scholar] [CrossRef]
  65. Xue, Z.; Hessler, C.M.; Panmanee, W.; Hassett, D.J.; Seo, Y. Pseudomonas aeruginosa inactivation mechanism is affected by capsular extracellular polymeric substances reactivity with chlorine and monochloramine. FEMS Microbiol. Ecol. 2013, 83, 101–111. [Google Scholar] [CrossRef] [PubMed] [Green Version]
  66. Thomas, V.; Herrera-Rimann, K.; Blanc, D.S.; Greub, G. Biodiversity of amoebae and amoeba-resisting bacteria in a hospital water network. Appl. Environ. Microbiol. 2006, 72, 2428–2438. [Google Scholar] [CrossRef] [Green Version]
  67. Pagnier, I.; Valles, C.; Raoult, D.; Scola, B. Isolation of Vermamoeba vermiformis and associated bacteria in hospital water. Microb. Pathog. 2015, 80, 14–20. [Google Scholar] [CrossRef]
  68. Le Dantec, C.; Duguet, J.P.; Montiel, A.; Dumoutier, N.; Dubrou, S.; Vincent, V. Occurrence of mycobacteria in water treatment lines and in water distribution systems. Appl. Environ. Microbiol. 2002, 68, 5318–5325. [Google Scholar] [CrossRef] [Green Version]
  69. Garcia, A.; Goni, P.; Cieloszyk, J.; Fernandez, M.T.; Calvo-Begueria, L.; Rubio, E.; Fillat, M.F.; Peleato, M.L.; Clavel, A. Identification of free-living amoebae and amoeba-associated bacteria from reservoirs and water treatment plants by molecular techniques. Environ. Sci. Technol. 2013, 47, 3132–3140. [Google Scholar] [CrossRef] [PubMed]
  70. Buse, H.Y.; Schoen, M.E.; Ashbolt, N.J. Legionellae in engineered systems and use of quantitative microbial risk assessment to predict exposure. Water Res. 2012, 46, 921–933. [Google Scholar] [CrossRef]
  71. Lesnik, R.; Brettar, I.; Höfle, M.G. Legionella species diversity and dynamics from surface reservoir to tap water: From cold adaptation to thermophily. ISME J. 2016, 10, 1064. [Google Scholar] [CrossRef] [PubMed] [Green Version]
  72. Yu, V.L.; Plouffe, J.F.; Pastoris, M.C.; Stout, J.E.; Schousboe, M.; Widmer, A.; Summersgill, J.; File, T.; Heath, C.M.; Paterson, D.L.; et al. Distribution of Legionella species and serogroups isolated by culture in patients with sporadic community-acquired legionellosis: An international collaborative survey. J. Infect. Dis. 2002, 186, 127–128. [Google Scholar] [CrossRef] [Green Version]
  73. Harrison, T.G.; Doshi, N.; Fry, N.K.; Joseph, C.A. Comparison of clinical and environmental isolates of Legionella pneumophila obtained in the UK over 19 years. Clin. Microbiol. Infect. 2007, 13, 78–85. [Google Scholar] [CrossRef] [PubMed] [Green Version]
  74. Ciesielski, C.A.; Blaser, M.J.; Wang, W.L. Serogroup specificity of Legionella pneumophila is related to lipopolysaccharide characteristics. Infect. Immun. 1986, 51, 397–404. [Google Scholar] [CrossRef] [Green Version]
  75. Otten, S.; Iyer, S.; Johnson, W.; Montgomery, R. Serospecific antigens of Legionella pneumophila. J. Bacteriol. 1986, 167, 893–904. [Google Scholar] [CrossRef] [Green Version]
  76. Helbig, J.H.; Amemura-Maekawa, J. Serotyping of Legionella pneumophila and epidemiological investigations. Nowa Medycyna 2009, 16, 69–75. [Google Scholar]
  77. Kozak-Muiznieks, N.A.; Morrison, S.S.; Mercante, J.W.; Ishaq, M.K.; Johnson, T.; Caravas, J.; Lucas, C.E.; Brown, E.; Raphael, B.H.; Winchell, J.M. Comparative genome analysis reveals a complex population structure of Legionella pneumophila subspecies. Infect. Genet. Evol. 2018, 59, 172–185. [Google Scholar] [CrossRef]
  78. Carvalho, F.R.; Vazoller, R.F.; Foronda, A.S.; Pellizari, V.H. Phylogenetic study of legionella species in pristine and polluted aquatic samples from a tropical Atlantic forest ecosystem. Curr. Microbiol. 2007, 55, 288–293. [Google Scholar] [CrossRef]
  79. Kozak-Muiznieks, N.A.; Lucas, C.E.; Brown, E.; Pondo, T.; Taylor, T.H., Jr.; Frace, M.; Miskowski, D.; Winchell, J.M. Prevalence of sequence types among clinical and environmental isolates of Legionella pneumophila serogroup 1 in the United States from 1982 to 2012. J. Clin. Microbiol. 2014, 52, 201–211. [Google Scholar] [CrossRef] [PubMed] [Green Version]
  80. Quero, S.; Párraga-Niño, N.; Barrabeig, I.; Sala, M.R.; Pedro-Botet, M.L.; Monsó, E.; Jané, M.; Sabrià, M.; Garcia-Núñez, M. Population structure of environmental and clinical Legionella pneumophila isolates in Catalonia. Sci. Rep. 2018, 8, 6241. [Google Scholar] [CrossRef]
  81. Edagawa, A.; Kimura, A.; Doi, H.; Tanaka, H.; Tomioka, K.; Sakabe, K.; Nakajima, C.; Suzuki, Y. Detection of culturable and nonculturable Legionella species from hot water systems of public buildings in Japan. J. Appl. Microbiol. 2008, 105, 2104–2114. [Google Scholar] [CrossRef] [PubMed]
  82. Leoni, E.; Legnani, P.P. Comparison of selective procedures for isolation and enumeration of Legionella species from hot water systems. J. Appl. Microbiol. 2001, 90, 27–33. [Google Scholar] [CrossRef] [PubMed]
  83. Asghari, F.B.; Nikaeen, M.; Hatamzadeh, M.; Hassanzadeh, A. Surveillance of Legionella species in hospital water systems: The significance of detection method for environmental surveillance data. J. Water Health 2013, 11, 713–719. [Google Scholar] [CrossRef] [PubMed]
  84. Duda, S.; Baron, J.L.; Wagener, M.M.; Vidic, R.D.; Stout, J.E. Lack of correlation between Legionella colonization and microbial population quantification using heterotrophic plate count and adenosine triphosphate bioluminescence measurement. Environ. Monit. Assess. 2015, 187, 393. [Google Scholar] [CrossRef]
  85. Pierre, D.; Baron, J.L.; Ma, X.; Sidari, F.P., 3rd; Wagener, M.M.; Stout, J.E. Water quality as a predictor of Legionella positivity of building water systems. Pathogens 2019, 8, 295. [Google Scholar] [CrossRef] [Green Version]
  86. Rakić, A.; Perić, J.; Foglar, L. Influence of temperature, chlorine residual and heavy metals on the presence of Legionella pneumophila in hot water distribution systems. Ann. Agric. Environ. Med. 2012, 19, 431–436. [Google Scholar]
  87. Rakić, A.; Štambuk-Giljanović, N.; Foglar, L. Monitoring Legionella pneumophila in drinking water distribution systems in southern Croatia. Fresenius Environ. Bull. 2013, 22, 3390–3397. [Google Scholar]
  88. Revetta, R.P.; Gomez-Alvarez, V.; Gerke, T.L.; Curioso, C.; Santo Domingo, J.W.; Ashbolt, N.J. Establishment and early succession of bacterial communities in monochloramine-treated drinking water biofilms. FEMS Microbiol. Ecol. 2013, 86, 404–414. [Google Scholar] [CrossRef] [Green Version]
  89. Chern, E.C.; King, D.; Haugland, R.; Pfaller, S. Evaluation of quantitative polymerase chain reaction assays targeting Mycobacterium avium, M. intracellulare, and M. avium subspecies paratuberculosis in drinking water biofilms. J. Water Health 2015, 13, 131–139. [Google Scholar] [CrossRef] [Green Version]
  90. Lu, J.; Struewing, I.; Yelton, S.; Ashbolt, N. Molecular survey of occurrence and quantity of Legionella spp., Mycobacterium spp., Pseudomonas aeruginosa and amoeba hosts in municipal drinking water storage tank sediments. J. Appl. Microbiol. 2015, 119, 278–288. [Google Scholar] [CrossRef]
  91. Kuiper, M.W.; Valster, R.M.; Wullings, B.A.; Boonstra, H.; Smidt, H.; van der Kooij, D. Quantitative detection of the free-living amoeba Hartmannella vermiformis in surface water by using real-time PCR. Appl. Environ. Microbiol. 2006, 72, 5750–5756. [Google Scholar] [CrossRef] [Green Version]
  92. Riviére, D.; Szczebara, F.M.; Berjeaud, J.M.; Frére, J.; Héchard, Y. Development of a real-time PCR assay for quantification of Acanthamoeba trophozoites and cysts. J. Microbiol. Methods 2006, 64, 78–83. [Google Scholar] [CrossRef]
  93. Wick, R.R.; Judd, L.M.; Gorrie, C.L.; Holt, K.E. Unicycler: Resolving bacterial genome assemblies from short and long sequencing reads. PLoS Comput. Biol. 2017, 13, e1005595. [Google Scholar] [CrossRef] [PubMed] [Green Version]
  94. Gomez-Alvarez, V.; Boczek, L.; King, D.; Pemberton, A.; Pfaller, S.; Rodgers, M.; SantoDomingo, J.; Revetta, R.P. Draft genome sequences of seven Legionella pneumophila isolates from a hot water system of a large building. Microbiol. Resour. Announc. 2019, 8, e00384-19. [Google Scholar] [CrossRef] [PubMed] [Green Version]
  95. Price, M.N.; Dehal, P.S.; Arkin, A.P. FastTree 2—Approximately maximum-likelihood trees for large alignments. PLoS ONE 2010, 5, e9490. [Google Scholar] [CrossRef] [PubMed]
  96. Goris, J.; Konstantinidis, K.T.; Klappenbach, J.A.; Coenye, T.; Vandamme, P.; Tiedje, J.M. DNA-DNA hybridization values and their relationship to whole-genome sequence similarities. Int. J. Syst. Evol. Microbiol. 2007, 57, 81–91. [Google Scholar] [CrossRef] [Green Version]
  97. Jain, C.; Rodriguez-R, L.M.; Phillippy, A.M.; Konstantinidis, K.T.; Aluru, S. High throughput ANI analysis of 90K prokaryotic genomes reveals clear species boundaries. Nat. Commun. 2018, 9, 5114. [Google Scholar] [CrossRef] [Green Version]
  98. Team RC. R: A Language and Environment for Statistical Computing; R Foundation for Statistical Computing: Vienna, Austria, 2013; Available online: http://www.R-project.org/ (accessed on 1 April 2020).
Figure 1. qPCR detection of Legionella at six locations within a building water system. Bulk water (first draw, filled circles ●; second draw, open squares □) and biofilm (filled triangles ▲) samples were analyzed by Legionella spp. (af) and L. pneumophila (gl) 16S rRNA qPCR as described in Section 4.6 from each of the six locations listed on the left. Each data point is the mean of duplicate wells with standard deviation. No sampling occurred in F2016–Sp2017 for location PVC-FC. The limit of detection for bulk water and biofilm samples were 1.6 log10 genomic copies (GC) L−1, and 1.3 log10 GC cm−2, respectively.
Pathogens 09 00567 g001
Figure 2. qPCR detection of free-living amoeba and Mycobacterium intracellulare. Bulk water (first draw, filled circles ●; second draw, open squares □) and biofilm (filled triangles ▲) samples were analyzed for Vermamoeba vermiformis (af), Acanthamoeba spp. (gl), and M. intracellulare (mr) by qPCR as described in Section 4.6 from each of the six locations listed on the left. Each data point is the mean of duplicate wells with standard deviation. No sampling occurred from fall (F) 2016 to spring (Sp) 2017 for location PVC-FC. The limit of detection for bulk water and biofilm samples were 2.4 log10 cell equivalents (CE) L−1 and 2.0 log10 CE cm−2 for the V. vermiformis; 1.4 log10 CE L−1 and 1.0 log10 CE cm−2 for the Acanthamoeba spp.; and 1.3 log10 GC L−1 and 0.9 log10 GC cm−2 for M. intracellulare assays, respectively.
Pathogens 09 00567 g002
Figure 3. Negative and positive correlations between water quality characteristics. Pairwise comparisons with statistically significant and strong correlations are shown for each location (A: PVC-MA; B: PVC-R; C: PVC-FC; D: Spigot; E: Faucet; F: Fountain) and sample type. Negative and positive correlations are shown on the left and right half of each square, respectively. Abbreviations: 1st, first draw; 2nd, second draw; bf, biofilm; FCl, free chlorine; HPC, heterotrophic plate count; Leg, Legionella spp.; Leg CFU, culturable Legionella; Lp, L. pneumophila; NH2Cl, monochloramine; NTU, turbidity; pH, potential of hydrogen; TCl, total chlorine; Vv, V. vermiformis.
Pathogens 09 00567 g003
Figure 4. Average nucleotide identity (ANI) matrix for the whole-genome sequenced isolates
Pathogens 09 00567 g004
Figure 5. Phylogenetic tree illustrating isolate relatedness to reference genomes. Representative strains (blue dots) from each sampling location and time were chosen for construction of this phylogenetic tree. Numbers presented are confidence values (bootstrapping) used by FastTree 2 to estimate maximum likelihood. The scale bar represents 0.05 nucleotide substitutions per site.
Pathogens 09 00567 g005
Table 1. Description of each sampling location.
Sampling Locations
Site NamePVC-MAPVC-RPVC-FCSpigotFaucetFountain
Disinfectant typemonochloraminechlorinechlorinechlorinechlorinechlorine
Water typepotable waterchiller waterpotable waterpotable waterpotable waterpotable water
Approx. usage per season172,709 L1,492,209 L5 L1703 L864 L689 L
Outlet typevalvevalvevalvespigotfaucetbubbler
Outlet materialPVC80; PharMed BPT1PVC80PVC80cast brasschrome plated, forged brassSS/EDPM rubber
Pipe materialPVC80FDI and PPT2PVC80 and copper2coppercoppercopper
Total distance to feed water14 m46 ft396 m1299 ft21 m70 ft102 m334 ft20 m65 ft9.7 m32 ft
Section 114 m46 ft366 m1201 ft9 m30 ft5 m16 ft8 m26 ft9.1 m30 ft
pipe diameter15 cm6 in7.6 cm3 in2.5 cm1 in1.9 cm0.75 in1.9 cm0.75 in1.3 cm0.5 in
Section 2-30 m98 ft12 m40 ft97 m318 ft12 m39 ft0.6 m2 ft
pipe diameter-1.3 cm0.5 in2.5 cm1 in5.1 cm2 in5.1 cm2 in0.6 cm0.25 in
Abbreviations: -, not applicable; cm, centimeter; EDPM, ethylene propylene diene; FDI, fiberglass ductile iron; ft, feet; in, inch; m, meter; PPT, PVC-reinforced plastic tubing; PVC80, polyvinyl chloride schedule 80; SS, stainless steel. 1 Masterflex PharMed BPT tubing approximately 1 m (3.5 ft) in length and inner diameter 4.8 mm (0.189 in). 2 Section 1 and Section 2, respectively.
Table 2. Summary of water quality parameters for each sampling location.
Location Name & Sample TypeHPCpHTurbidityTempFree Cl2Total Cl2
MeanSEMMeanSEMMeanSEMMeanSEMMeanSEMMeanSEM
PVC-MA aFirst Draw5.50.18.210.080.230.0320.20.30.060.011.210.11
Second Draw4.90.28.190.070.260.0420.20.30.060.011.220.11
Biofilm3.40.2----------
PVC-RFirst Draw5.40.28.530.076.943.2324.81.41.040.101.130.09
Second Draw4.50.28.680.052.130.9624.81.40.900.061.020.06
Biofilm2.60.1----------
PVC-FCFirst Draw4.20.68.470.150.420.1520.72.50.830.070.920.08
Second Draw4.00.18.600.170.220.0218.63.00.990.041.100.05
Biofilm2.00.6----------
SpigotFirst Draw5.40.18.670.060.810.3524.81.20.530.120.590.12
Second Draw2.80.28.730.060.230.0818.42.31.000.061.120.04
Biofilm2.50.2----------
FaucetFirst Draw5.50.28.670.060.170.0224.00.70.350.100.400.11
Second Draw4.20.28.720.060.180.0220.01.71.050.041.130.04
Biofilm4.20.2----------
FountainFirst Draw4.00.28.750.060.250.0613.50.40.590.070.690.07
Second Draw3.80.38.780.070.180.0215.41.00.890.030.980.03
Biofilm4.00.5----------
Abbreviations: -, no data; Cl2, chlorine, mg L−1; HPC, heterotrophic plate count, log10 CFU per 100 mL or cm2; LOD, limit of detection; NTU, Nephelometric Turbidity Unit; SEM, standard error mean; Temp, temperature in degrees Celsius. a see Materials and Methods, Section 4.1, for average monochloramine and free ammonia levels during the entire sampling period.
Table 3. Summary of Legionella spp. culture results for positive sites.
Time PointPVC-RPVC-FCFaucet
First DrawFirst DrawSecond DrawFirst DrawSecond DrawBiofilm
CFUsgPCRCFUsgPCRCFUsgPCRCFUsgPCRCFUsgPCRCFUsgPCR
F2016---ndndndndndnd------1.91 & 2-14Leg/Lp
W2017---ndndndndndnd---------
Sp2017---ndndndndndnd1.22-14Leg/Lp------
Su2017------------------
F2017---------1.2negLeg------
W20182.6negLeg4.5negLeg2.6negLeg2.11 & 2-14Leg/Lp------
Sp2018----- ------------
Su2018---3.8neg & 2-14Leg & Leg/Lp2.8neg & 2-14Leg & Leg/Lp2.71Leg/Lp------
F2018----- 3.0negLeg---------
W2019---2.1negLeg2.6negLeg2.81Leg/Lp2.11Leg/Lp---
No culturable Legionella was detected in the PVC-MA; Spigot; Fountain; PVC-R Distal and Biofilm; and PVC-FC Biofilm samples. Abbreviations: -, below LOD; B, biofilm; LOD, limit of detection; nd, no data; qPCR, quantitative PCR; sg, serogroup. CFU is expressed as log10 CFU 100 mL−1 for bulk water samples (LOD 1.0 log10 CFU 100 mL−1) and log10 CFU cm−2 for biofilm samples (LOD 0.7 log10 CFU cm−2). sg results: 1, sg 1 positive; 2-14, sg 2-14 positive; 1 & 2-14, different colonies on the plate were sg 1 and 2-14 positive; neg, agglutination negative. PCR results: Leg, Legionella spp. assay positive only; Leg/Lp, Legionella spp. and L. pneumophila assay positive.
Table 4. Summary statistics of whole-genome assemblies for the drinking water isolates
IsolateLineageGenome Size (bp)No. of ContigsContig N50 (bp)G+C Content (%)No. Predicted GenesMLST
Su2018 Faucet 1L. pneumophila3,589,28672160,0183832401
Su2018 Faucet 2L. pneumophila3,589,05975160,0103832391
Su2018 Faucet 3L. pneumophila3,589,22871160,0183832361
Su2018 Faucet 4L. pneumophila3,574,3469988,9343832281
Su2018 Faucet 5L. pneumophila3,590,30369160,0103832401
W2019 Faucet Legiolert® 1L. pneumophila3,564,53112459,5383832291
W2019 Faucet 2L. pneumophila3,562,41877123,1083832241
Su2018 PVC-FC 1L. pneumophila3,510,69839413,4523831512037
Su2018 PVC-FC 2L. pneumophila3,498,27340223,6953831382037
Su2018 PVC-FC 3Legionella3,285,02157260,915413028-
F2018 PVC-FCLegionella3,287,86849348,799413028-
W2019 PVC-FC 1Legionella3,063,33943348,799412812-
W2019 PVC-FC 2Legionella3,288,04253321,108413033-
W2019 PVC-FC 3Legionella3,286,78453283,321413031-
W2019 PVC-FC 4Legionella3,285,77845466,387413022-
W2019 PVC-Loop Legiolert® 1Ochrobactrum4,764,47755478,728584621-
W2019 PVC-Loop Legiolert® 2L. pneumophila3,388,35342255,1263830571950
W2019 BWS Supply Line 1L. pneumophila3,589,20067176,9303832371
W2019 BWS Supply Line 2L. pneumophila3,588,65870160,0103832421
Abbreviations: -, not applicable; bp, base pair; BWS, building water system; LST, multi-locus sequence typing; No., number.

