Article

A Simple Dynamic Characterization Method for Thin Stacked Dielectric Elastomer Actuators by Suspending a Weight in Air and Electrical Excitation

1
Mechanical Engineering, Toyohashi University of Technology, Hibarigaoka, Tenpaku-cho, Toyohashi 441-8580, Japan
2
Mechanical Systems Engineering, Nagoya University, Furo-cho, Chikusa-ku, Nagoya 464-8603, Japan
*
Author to whom correspondence should be addressed.
Submission received: 27 December 2020 / Revised: 11 February 2021 / Accepted: 20 February 2021 / Published: 24 February 2021
(This article belongs to the Special Issue Dielectric Elastomer Actuators (DEAs))

Abstract

:
This paper proposes a simple but effective method for characterizing dielectric elastomer actuators (DEAs), especially for thin stacked DEAs, which are promising for haptic devices but which measure the dynamic elastic modulus with great difficulty. The difficulty of the measurement of such a thin stacked DEA arises from the friction and local deformation of the surface between the DEA and a contact, as shown in this paper. In the proposed method, a DEA is vertically suspended and a weight is attached to it. The proposed method requires no contact with the surface of a DEA and uses only a weighting mass. Experimental results demonstrated the proposed method can estimate almost essential constants, such as the dynamic elastic modulus (Young’s modulus and damping time constant), the electrical constants (permittivity and resistivity), and the coefficient of electromechanical coupling, through the forced vibration induced by voltage actuation.

1. Introduction

Dielectric elastomer actuators (DEAs) are a type of electroactive polymer actuator, and research on them has been progressing rapidly since the late 1990s [1,2,3]. A DEA is made of a thin elastomer laminated with flexible electrodes and requires a higher actuation voltage than other polymer actuators, but has the advantage of a fast response [3,4]. DEAs are expected to have many applications, such as automation, robotics, biomedicine, optics, and acoustic systems [4,5,6,7]. Among them, haptic devices are one of the most promising applications [6,8]. There have been many studies on haptic devices using DEAs, e.g., [8,9,10,11,12,13,14,15,16,17]. Stacked DEAs [18,19] are suitable for haptic applications because it is possible to make a device with a large generating force with a small volume. The studies on haptic devices using stacked DEAs include, e.g., [20,21,22].
In haptic applications using stacked DEAs, it is especially important to characterize and model the mechanical impedance that affects the sense of touch. See, e.g., [23] for characterization of DEAs. There exist many studies on modeling, for example, [24] for theory, [25,26,27,28,29,30] for electromechanical coupling, [29,31,32,33,34,35,36,37,38,39,40,41,42,43] for linear and nonlinear viscoelasticity of materials, and [28,29,33,34,36,37,38,39,41,44,45] for equivalent electrical circuits. For use in applications where DEAs deform slowly and significantly, it is necessary to employ models and characterizations of nonlinear elasticity and creep deformation.
For use in haptic device applications, on the other hand, our interests include relatively fast and small deformation and vibration damping. Therefore, it may be sufficient to employ the model of linear elasticity and vibration damping near the equilibrium point, in haptic device applications. Haus et al. performed linear modeling of a stacked DEA for haptic device applications and measured the characteristics of the mechanical impedance of the stacked DEA using a voice coil motor and an impedance head [29]. As a result, Haus et al. succeeded in measuring the mechanical impedance of a relatively thick DEA (30 layers, thickness of 1500 μm) at frequencies between 0.1 Hz and 10 kHz. However, it is difficult to measure the mechanical impedance in the thickness direction for thin stacked DEAs compared to thick stacked ones. In fact, as will be shown in the experimental section in this paper, the deformation shape of the surface of a thin stacked DEA is not uniform but localized. Therefore, it is sometimes hardly possible to measure the mechanical impedance correctly depending on the contact position of the impedance head probe, as shown in Figure 1.
This paper proposes a new and simple characterization method for thin stacked DEAs that is not affected by friction or local deformation of the surface. In the proposed method, a DEA with a weight attached is suspended and electrically actuated to measure the characteristics. Because extra measurement devices like an impedance head are not required, other than a weight, there is no effect such as friction, and the effect of local deformation of DEA can be ignored. The proposed method can estimate the viscoelastic constants, i.e., the dynamic modulus of elasticity, as well as the electromechanical coupling coefficients and the relative permittivity and resistivity. Experiments using a thin stacked DEA made of silicone elastomer demonstrated the effectiveness of the proposed method.

2. Thin Stacked Dielectric Elastomer Actuator and Measurement of the Deformation

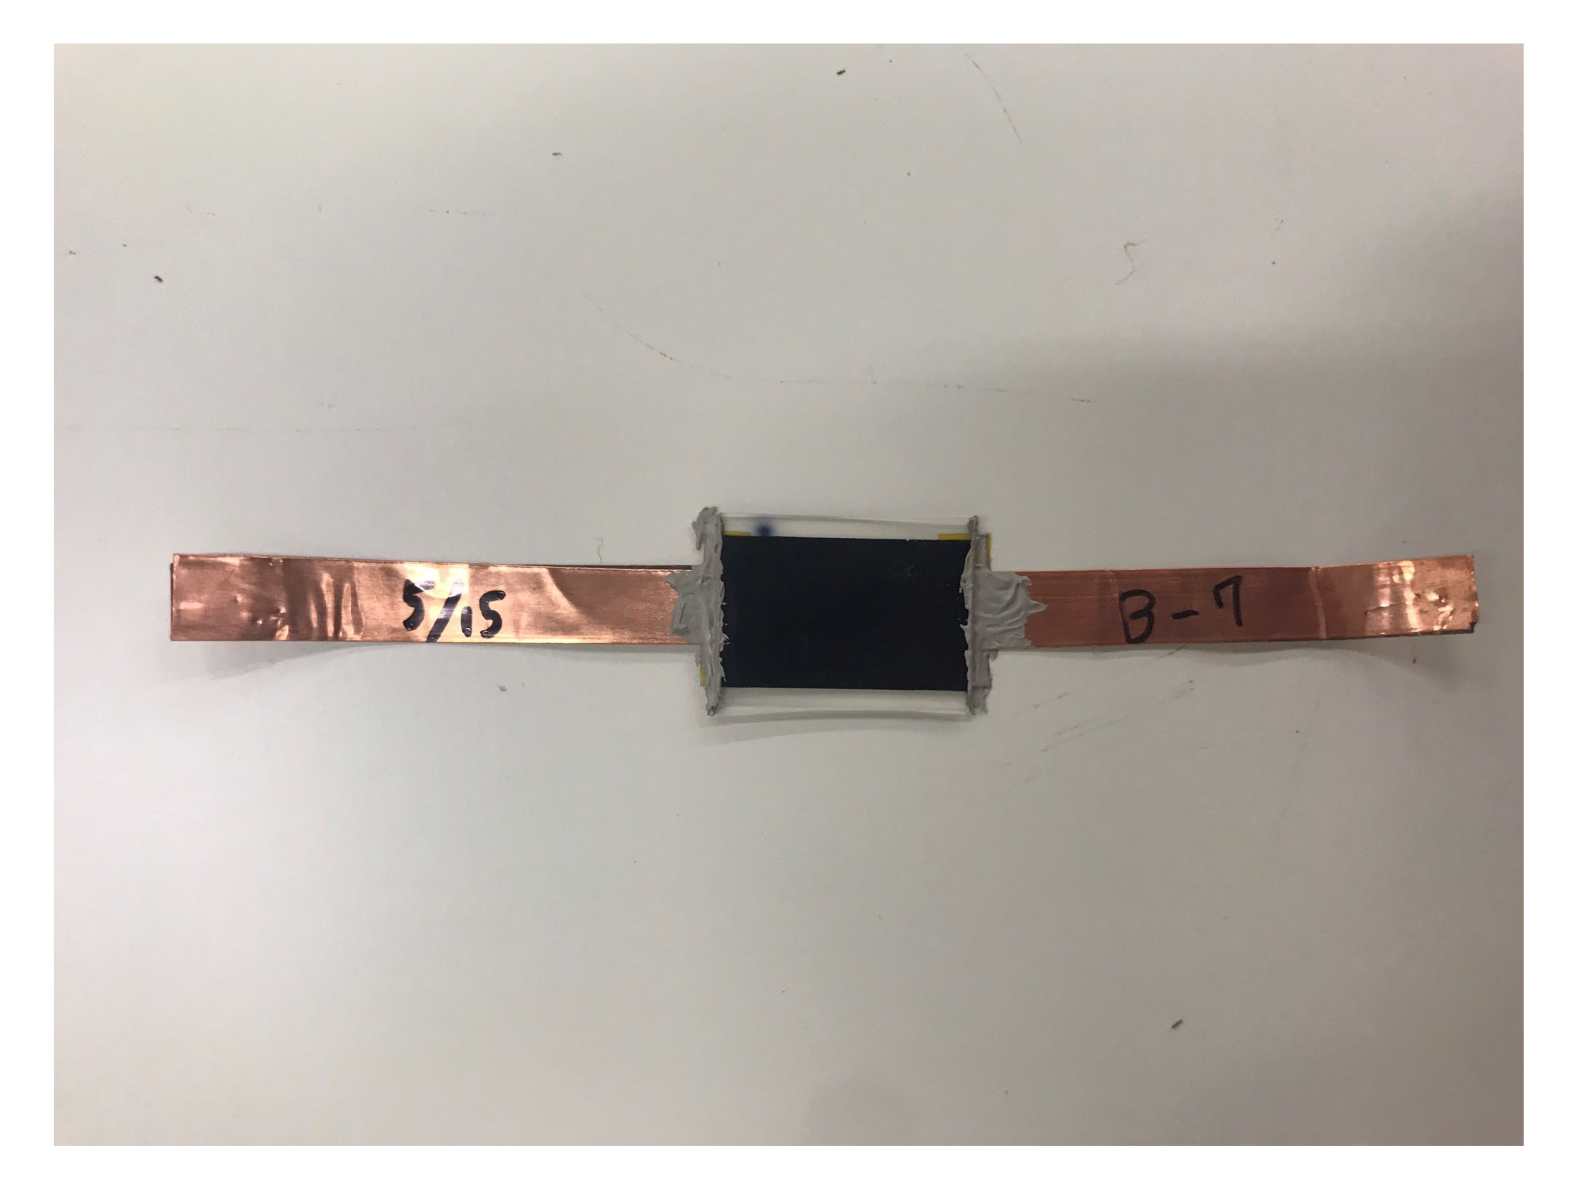
2.1. Thin Stacked Dielectric Elastomer Actuator

Figure 2 shows a photo of a thin stacked dielectric elastomer actuator (DEA) used in this study. The dielectric material of the DEA is silicone elastomer (ELASTOSIL FILM 2030, Wacker Asahikasei Silicone Co. Ltd., Tokyo, Japan) with a thickness of 50 μm per layer. The electrode material consists of carbon black and elastomer, and has a thickness of 5 μm. The number of the layers is 10, and the total thickness is about 600 μm. The width of the DEA is 13 mm.

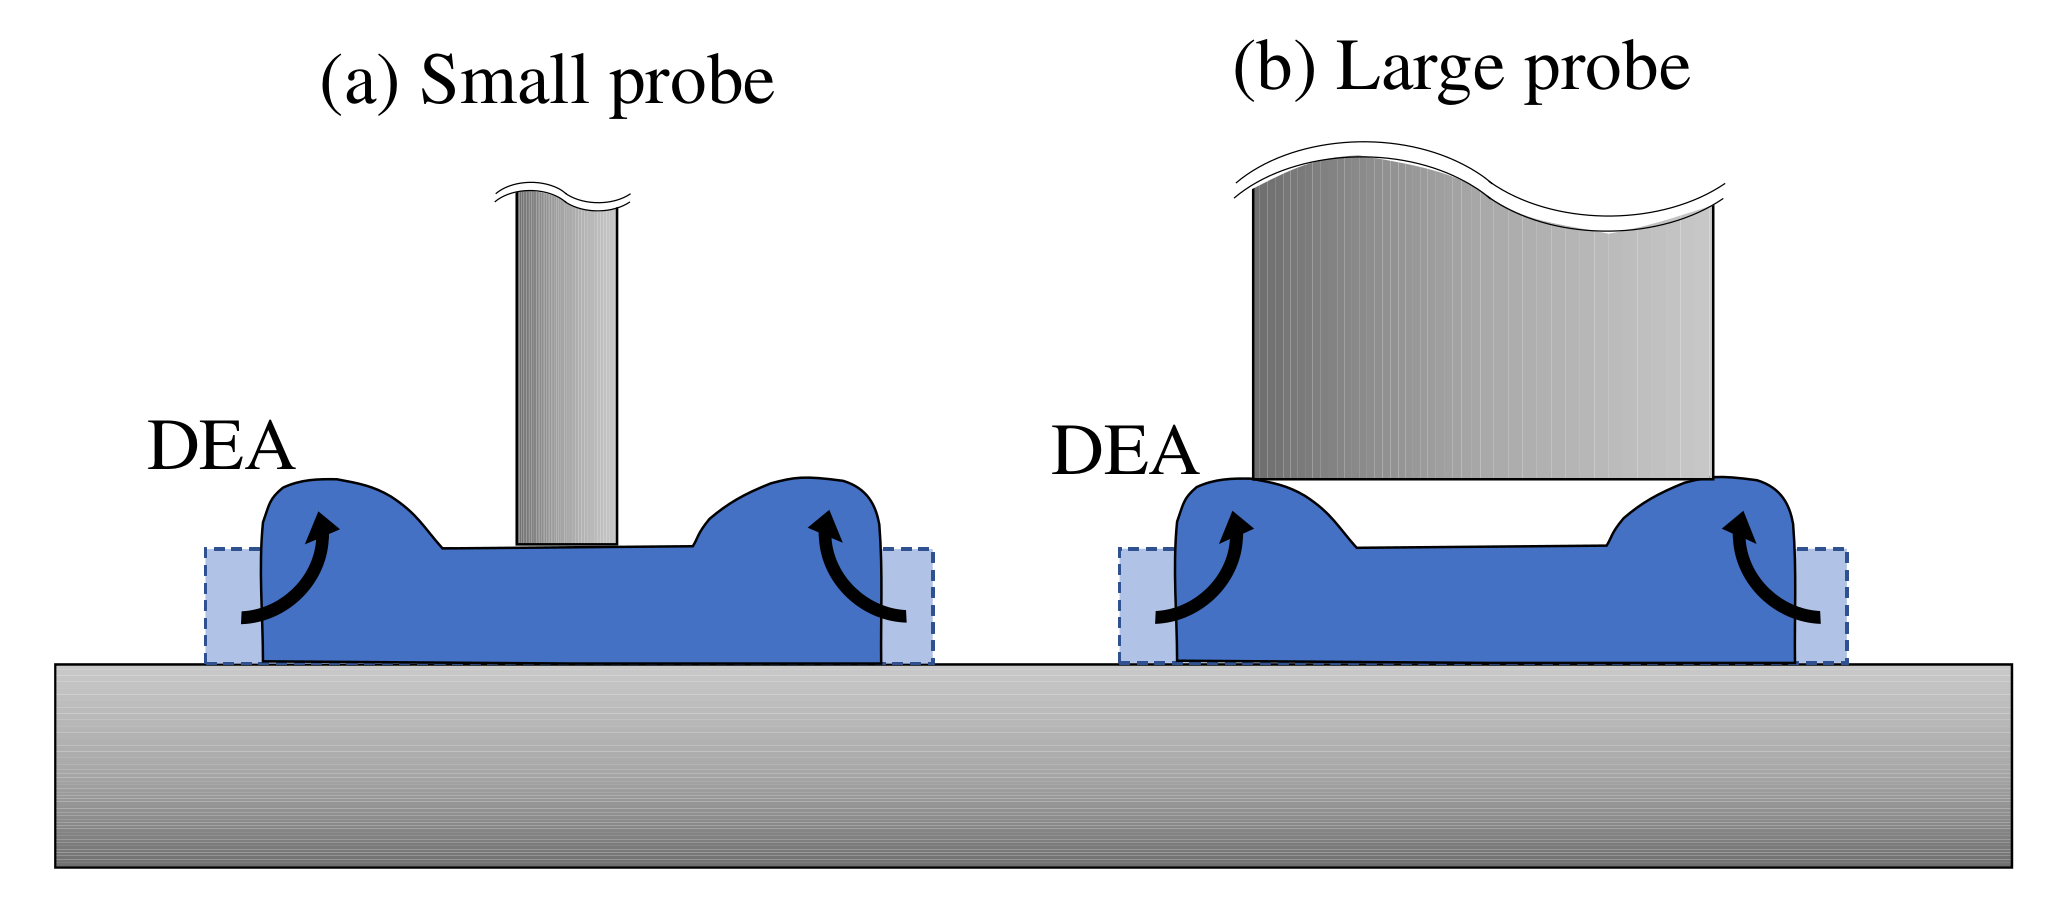
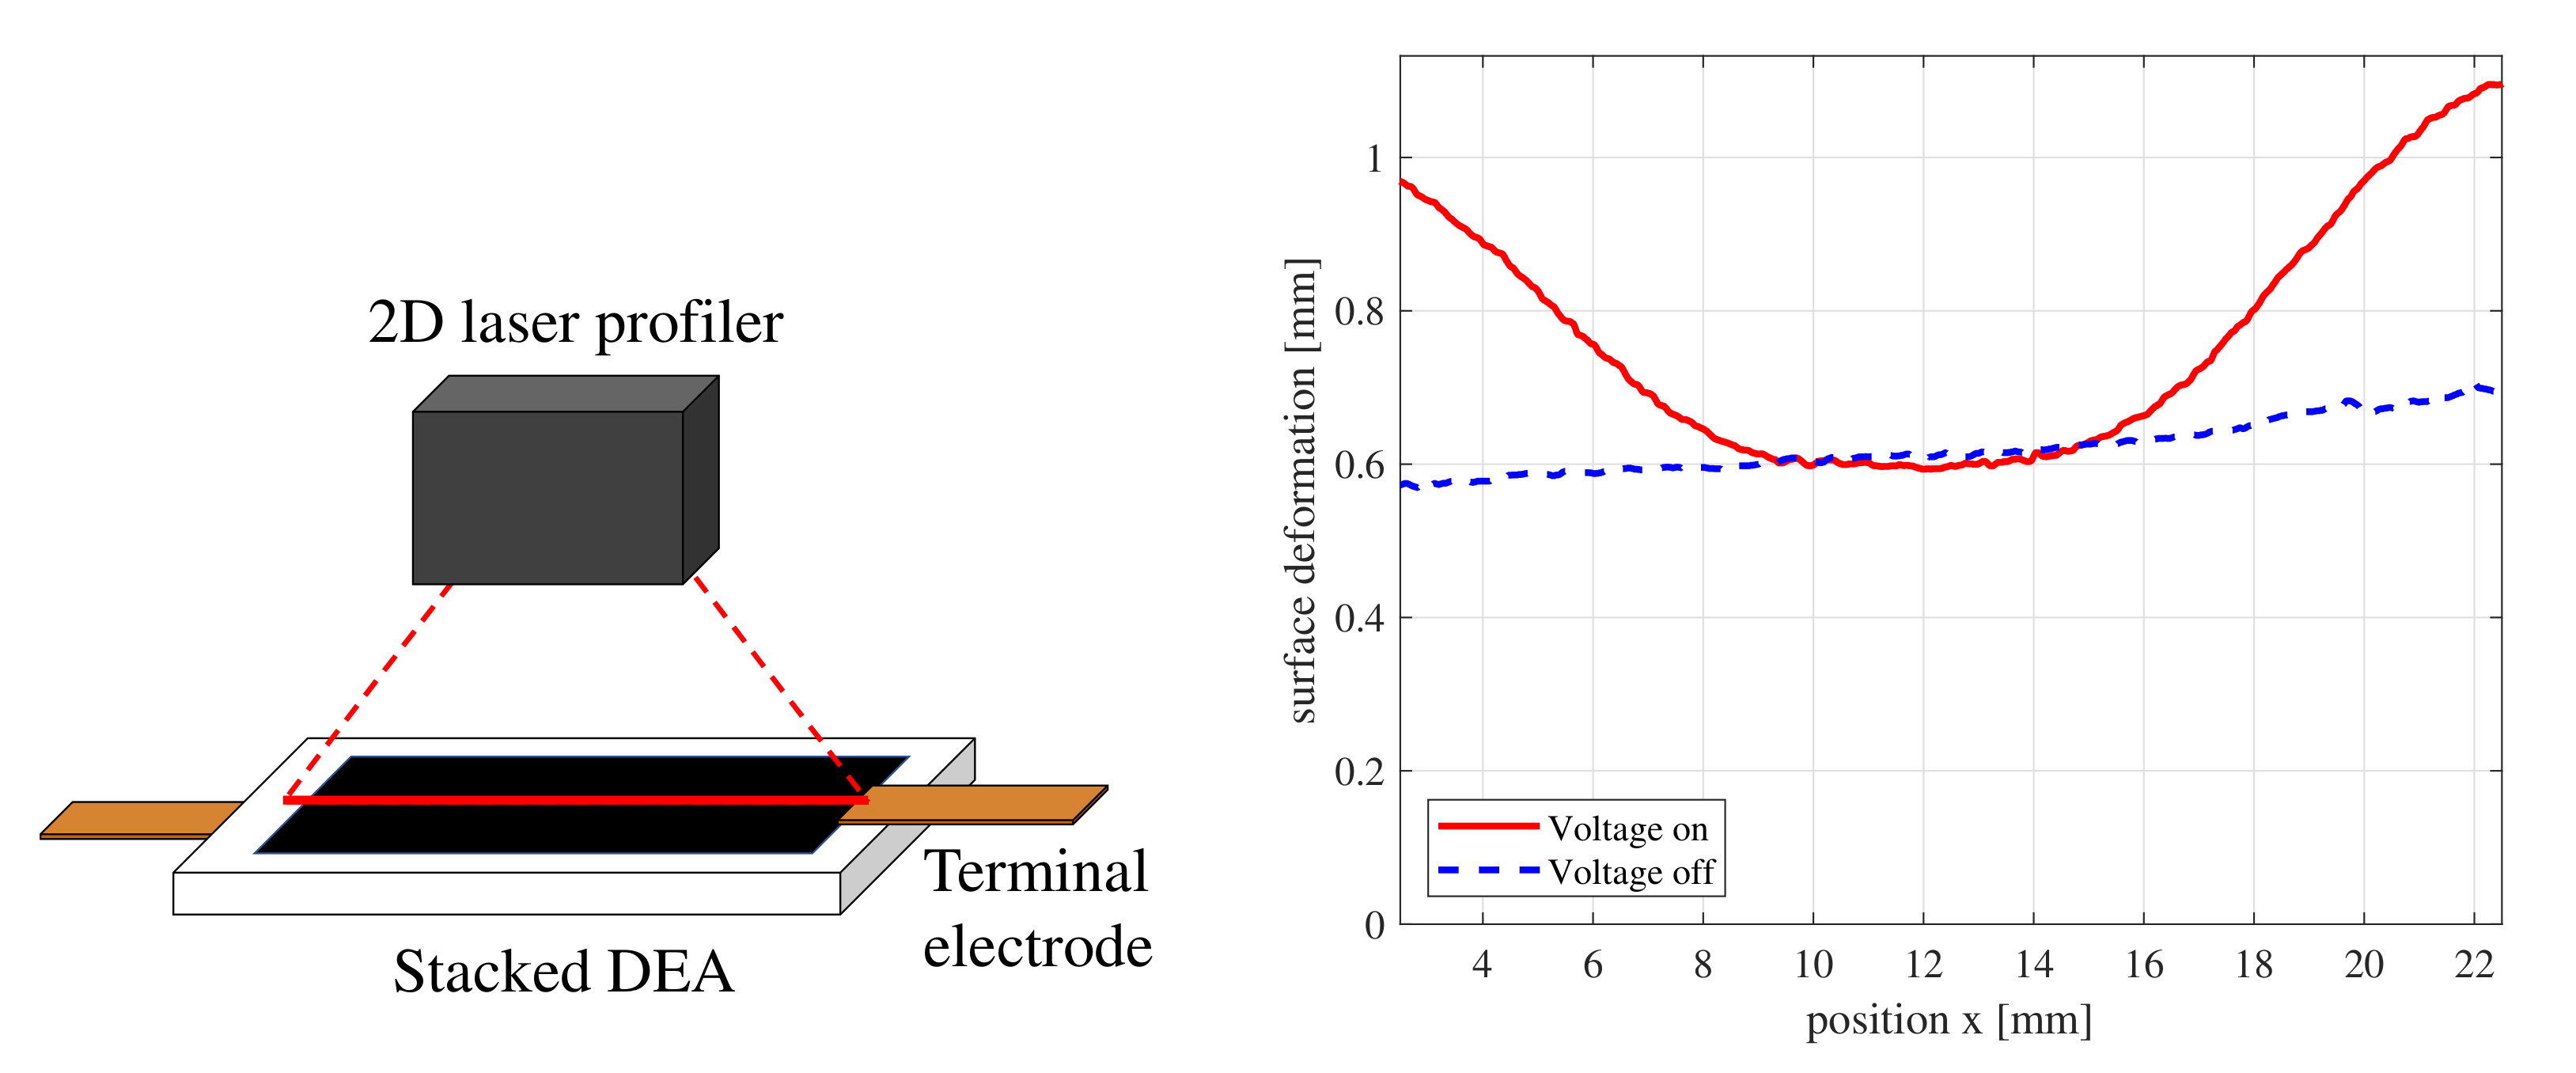
2.2. Preliminary Experiment with a DEA Placed Flat

This section shows that it is difficult to properly measure the deformation of a thin stacked DEA placed in a flat position. The experimental method is as follows.
  • A DEA is placed flat on a smooth insulated table (phenol formaldehyde resin, 10 mm thick).
  • A voltage of 750 V is applied to the DEA.
  • The deformed shape is measured using a two-dimensional laser displacement sensor (Keyence, LJ-X8000).
Figure 3 shows the results of measuring the surface shape of DEA using a two-dimensional laser displacement sensor. The blue dashed line shows the shape in rest, and the red solid line shows the deformed shape when the voltage of 750 V is applied. In Figure 3, it is observed that both ends of the DEA are swollen and deformed. On the other hand, the central part of the DEA is hardly deformed. The reason for such deformation is thought to be that the friction with the lower table prevented the DEA from extending in the longitudinal direction. It is also possible that the deformed shape was not uniform and was localized because no extension was applied from the outside. In conclusion, it can be seen that the surface shape of the thin stacked DEA placed horizontally without tension is locally deformed, making it difficult to measure the mechanical impedance.

2.3. Proposal of Mechanical Impedance Measurement Using a Weight Suspension

This paper proposes a new method for measuring the mechanical impedance of a thin stacked DEA, which is difficult to measure when placed flat. In the proposed method, additional weight is attached to a DEA for causing mechanical resonance. The viscoelasticity of the DEA is estimated from the frequency response electrically excited.
Figure 4 shows a schematic and photo of a suspended DEA with additional weight. Both ends of the stacked DEA are sandwiched with glass fiber reinforced epoxy polymer (GFRP) plates. A weight is attached to the free end of the clamped sample. Regarding the sample used in the experiment, the length of the moving part was 12 mm. Table 1 summarizes the size of the DEA.

3. Modeling

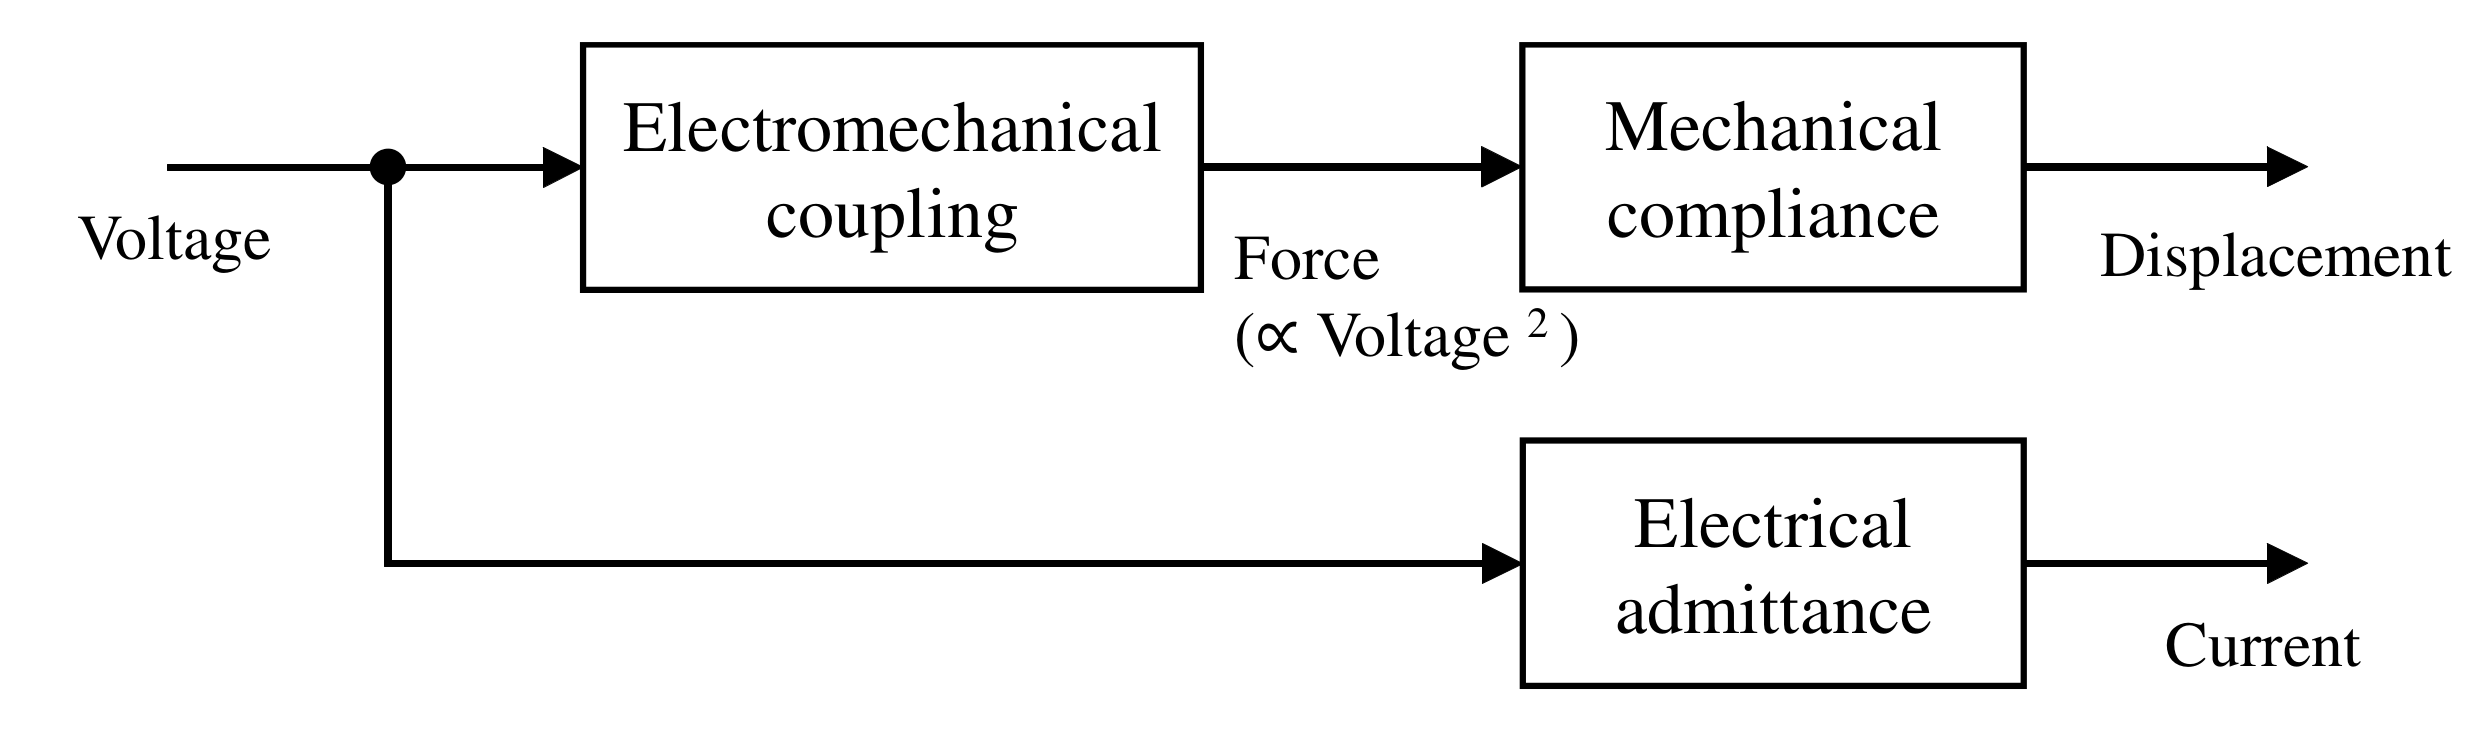
3.1. Model Structure of a Dielectric Elastomer Actuator

We employ the model structure shown in Figure 5 to represent the responses of DEAs. The input to the actuator is voltage, and the voltage is transformed into electrostatic force. Since the electrostatic force, or the Maxwell stress to be more precise, is proportional to the square of the electric field, the actuation force can be modeled as a force proportional to the square of the voltage occurs. The deformation of the actuator is caused by the stress generated by the electric field. On the other hand, the electrical admittance models the system from the voltage input to the current output. A more detailed block diagram will be shown at the end of this section.

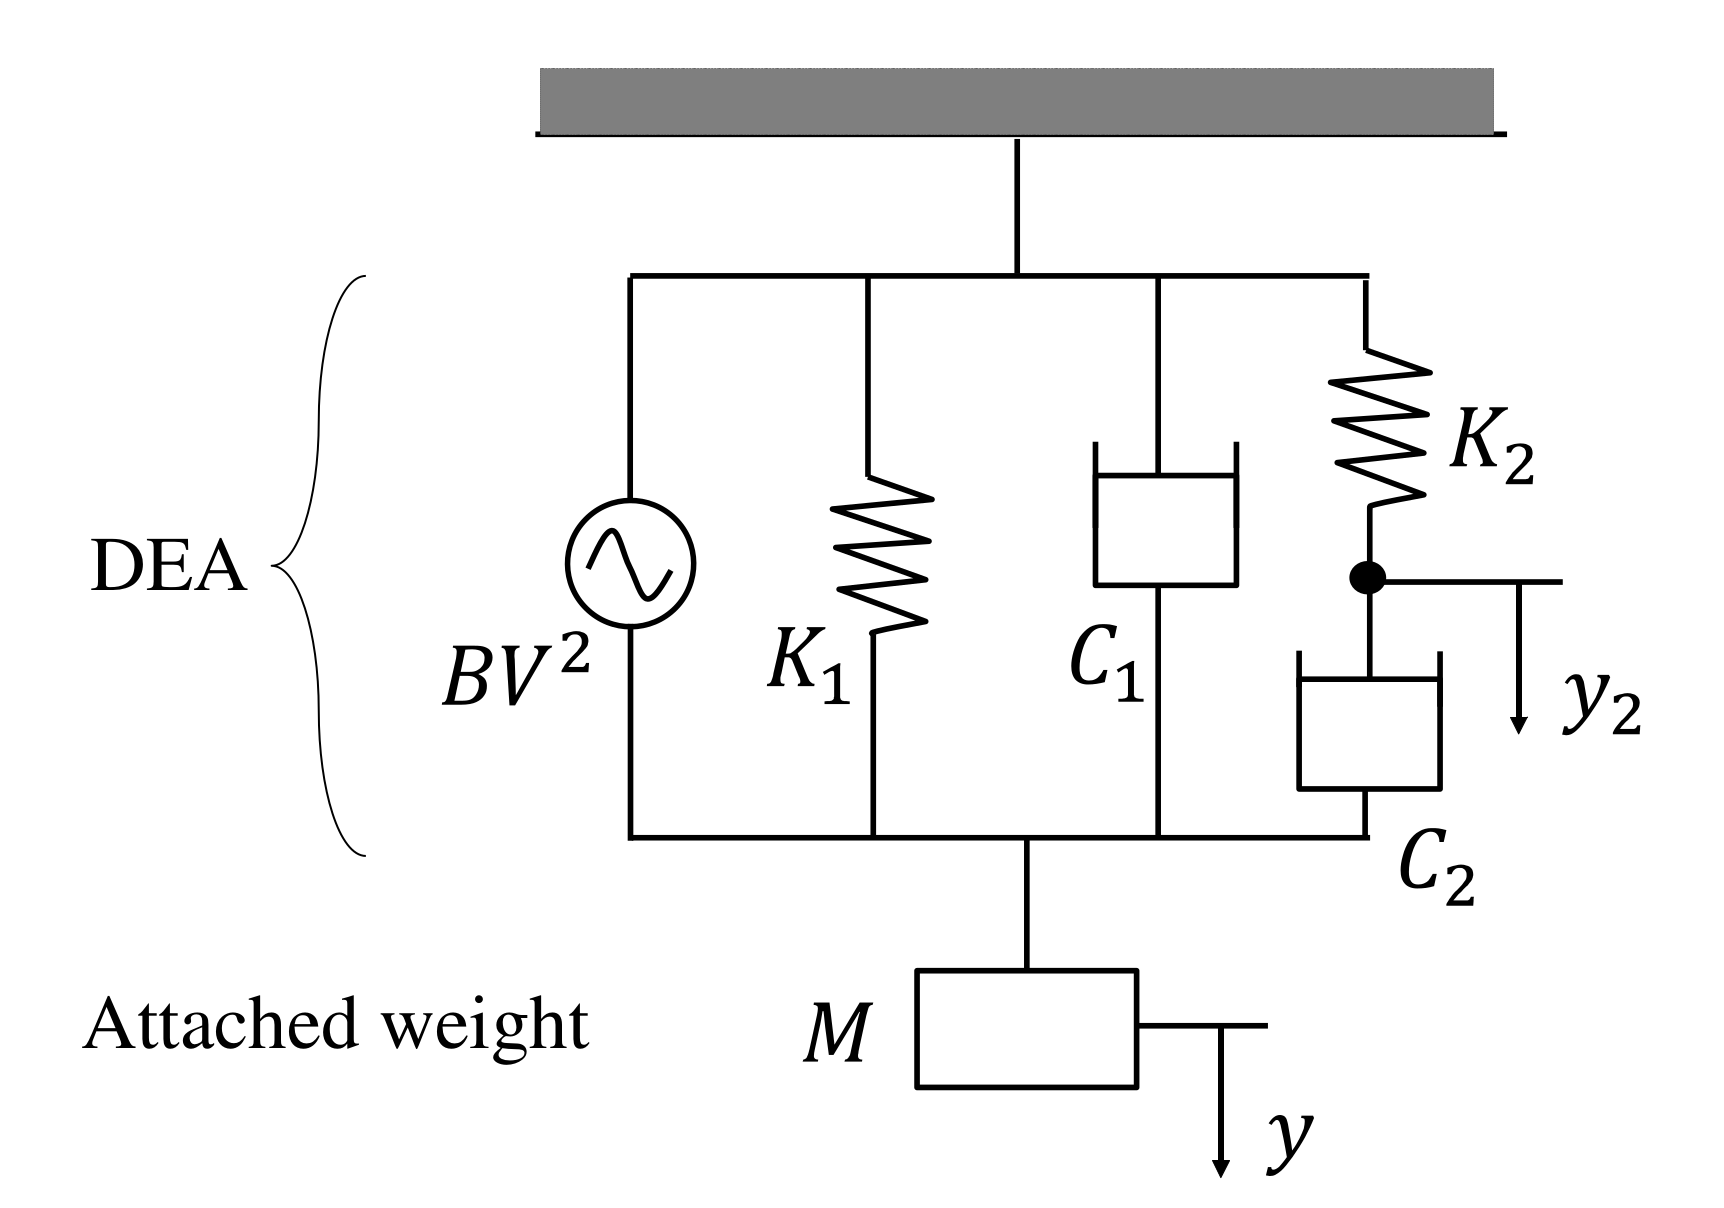
3.2. Mechanical Impedance Model

Figure 6 shows the mechanical impedance model. M represents the mass of the attached weight, and the other elements represent the DEA. If the mass of a DEA is sufficiently small compared to the mass of the weight, then M can be assumed to be the mass of the weight. The employed viscoelastic model is a combination of the Maxwell and Voigt models, as employed in previous studies [23,29]. K 1 represents the in-plane longitudinal spring constant of the DEA, and C 1 represents the damping coefficient for relatively fast vibrations. C 2 and K 2 express slow creep characteristics (viscoelasticity), and the creep can be ignored at relatively fast vibrations as described later. In usual cases, C 1 K 1 C 2 K 2 holds. B represents the electromechanical coupling coefficient from the square of the voltage to the generated force.
The equation of motion of the system is derived based on the model shown in Figure 6.
M y ¨ + C 1 y ˙ + K 1 y + C 2 ( y ˙ y ˙ 2 ) = B V 2 K 2 y 2 + C 2 ( y ˙ 2 y ˙ ) = 0
where y denotes the displacement of the mass M and y 2 denotes the displacement of the stiffness K 2 . Here, to derive the transfer function, we replace V 2 with a new variable u defined as follows.
u : = V 2
The transfer function from u to y is defined as G. The transfer function G is obtained by the Laplace transform of the equation of motion, Equation (1).
G ( s ) = B M s 2 + s Z mech ( s )
where s denotes the Laplace variable and Z mech denotes the mechanical impedance.
Z mech ( s ) = C 1 + K 2 C 2 C 2 s + K 2 + K 1 s
We approximate the mechanical impedance model Equation (4) by considering that the time constant (period) of vibration is much smaller than that of the creep. In Equation (4), the second term including C 2 is related to creep deformation. The creep deformation is usually slow, and the creep time constant is about several seconds to several tens of seconds. The creep time constant is defined as:
τ 2 : = C 2 K 2 .
Since the time constant of this creep deformation is sufficiently large compared to the vibration period (less than 0.1 s), we can neglect the creep dynamics. If we consider the frequency ranges ω τ 2 1 rad/s where the creep deformation can be ignored, the mechanical impedance can be approximated as:
Z mech ( s ) C 1 + K 1 + K 2 s s = j ω , ω τ 2 1
where j = 1 . Substituting Equation (6) into Equation (3), we obtain the approximated G as:
G ( s ) B M s 2 + C 1 s + K s = j ω , ω τ 2 1
where
K : = K 1 + K 2 .
The mechanical impedance parameters K and C 1 and the electromechanical coupling coefficient B can be estimated from the curve fitting of the frequency response if one obtains the frequency response of G.
It is useful to find the material constants, which do not depend on the shape or size of a DEA, once one obtains the constants of the actuator. The Young’s modulus E (Pa) is derived from the estimated spring constant K.
E = K l h w
where h, l, and w denote the thickness, effective length, and width of the actuator, respectively. The conversion of C 1 and B to the corresponding equivalent material constants is also shown below. The damping time constant τ 1 is defined as:
τ 1 : = C 1 K .
The dynamic modulus, denoted by E * (Pa), can be consequently expressed as follows using E, τ 1 , and the angular frequency ω .
E * 1 + j ω τ 1 E ω τ 2 1

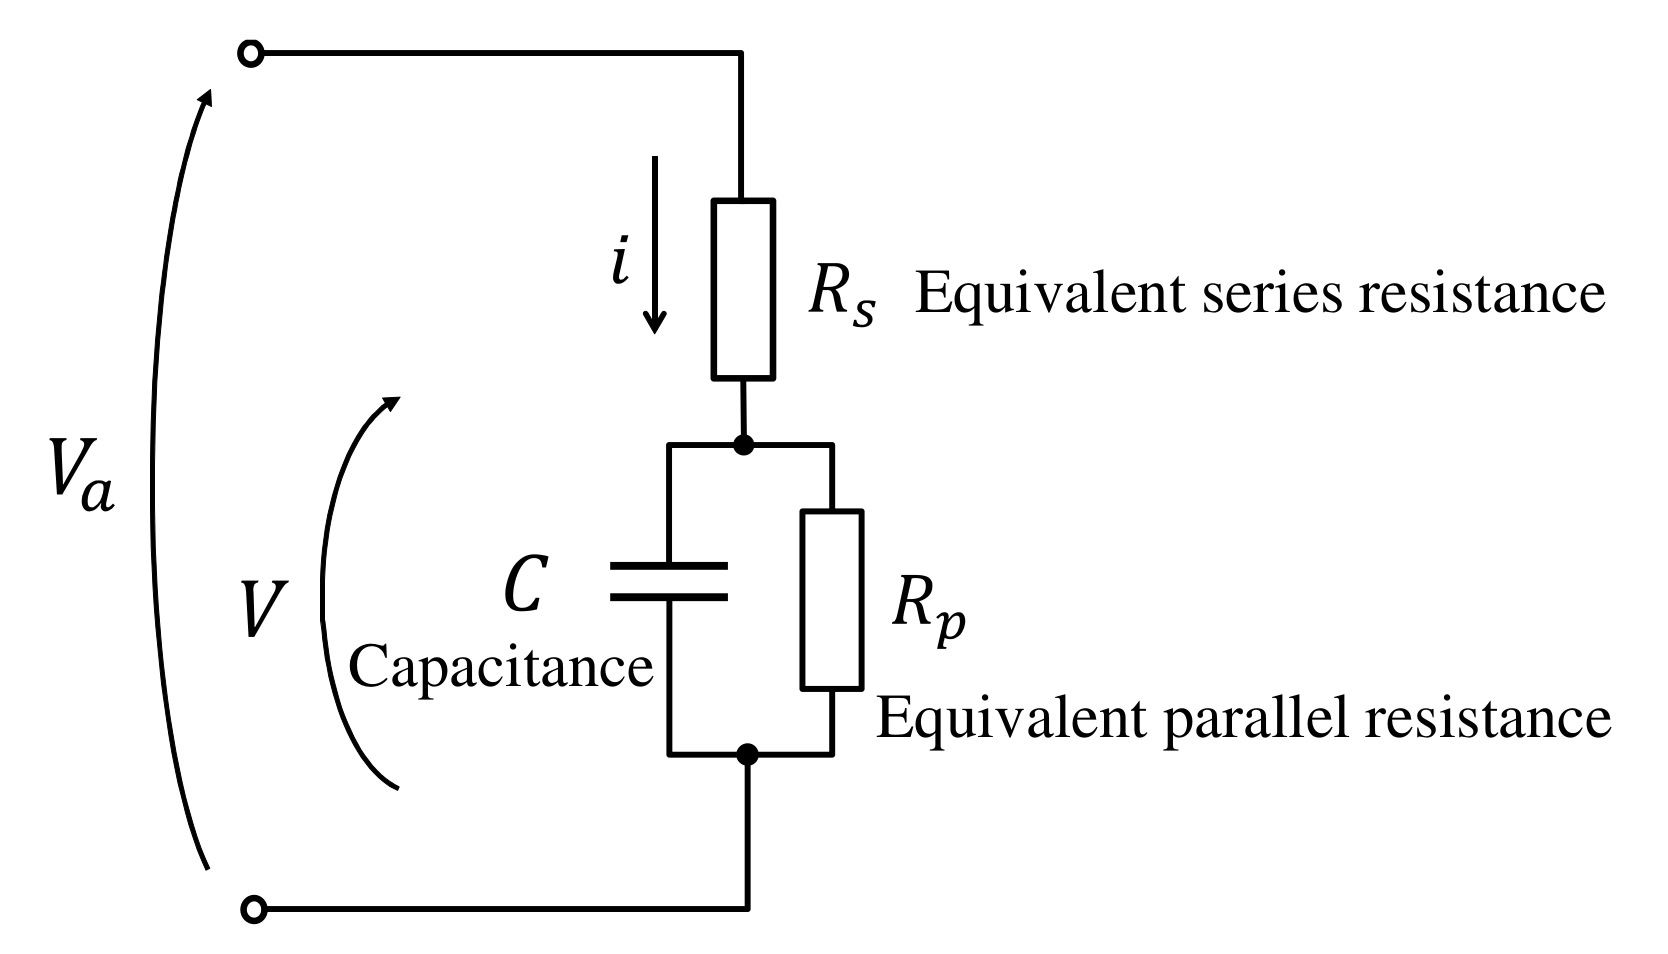
3.3. Electrical Impedance Model

The model of the electrical impedance of a DEA is shown in Figure 7. R s is the equivalent series resistance corresponding to the electrode resistance, C is the capacitance, and R p is the equivalent parallel resistance corresponding to the electrical resistivity of the dielectric material. The model consists of three elements, as employed in previous studies [23,29]. From Figure 7, the circuit equation is obtained as:
V a ( t ) = R s i ( t ) + V ( t ) i ( t ) = R p 1 V ( t ) + C V ˙ ( t ) .
The transfer function from the current I to the voltage V a , that is, the electrical impedance Z elec , can be obtained from the Laplace transform of Equation (12).
Z elec ( s ) = R s C s + R s R p 1 + 1 C s + R p 1
The frequency response of the electrical impedance Z elec can be approximated depending on the frequency band.
Z elec ( j ω ) R s + R p ( ω R p 1 C 1 ) 1 j ω C ( R p 1 C 1 ω ( R s 1 + R p 1 ) C 1 ) R s ( ω ( R s 1 + R p 1 ) C 1 )
At the low frequency of ω R p 1 C 1 , the influence of the leakage current becomes dominant, and the frequency response of impedance is asymptotic to that of R p (and R s ). In the range of ( R p 1 C 1 ω ( R s 1 + R p 1 ) C 1 ) , the frequency response is asymptotic to that of a capacitor with a capacitance of C. At the high frequency of ω ( R s 1 + R p 1 ) C 1 , the influence of the electrode resistance becomes dominant, and the impedance asymptotically approaches R s .
The transfer function from V a to V, denoted by G V V a , may be useful for considering voltage attenuation or electrode-resistance loss in high frequencies.
G V V a ( s ) = 1 R s C s + R s R p 1 + 1
However the difference of V and V a is negligible in the model. G V V a ( j ω ) 1 if the frequency ω is sufficiently small such that the effect of R s is negligible, i.e., ω ( R s 1 + R p 1 ) C 1 . Therefore, V V a , that is, the effective voltage V applied to the dielectric, is well approximated by the terminal voltage V a , for ω ( R s 1 + R p 1 ) C 1 . As shown in the later experimental section, the cut-off frequency (over 1 kHz in the experiment) is sufficiently higher than the natural frequency (about 23 Hz in the experiment) of the mechanical vibration, therefore the approximation V V a holds in the experiment in this paper.
Regarding the material constants estimated from the equivalent circuit parameters, the equivalent relative permittivity of the dielectric material is estimated from the capacitance C.
ϵ r = C h d ϵ 0 l e w e N
where ϵ 0 is the permittivity of vacuum and l e w e represents the effective electrode area. The electrical resistivity (or volume resistivity), denoted by ρ p , is estimated from the equivalent parallel resistance R p .
ρ p = l e w e N R p h d

3.4. Electromechanical Coupling Coefficient
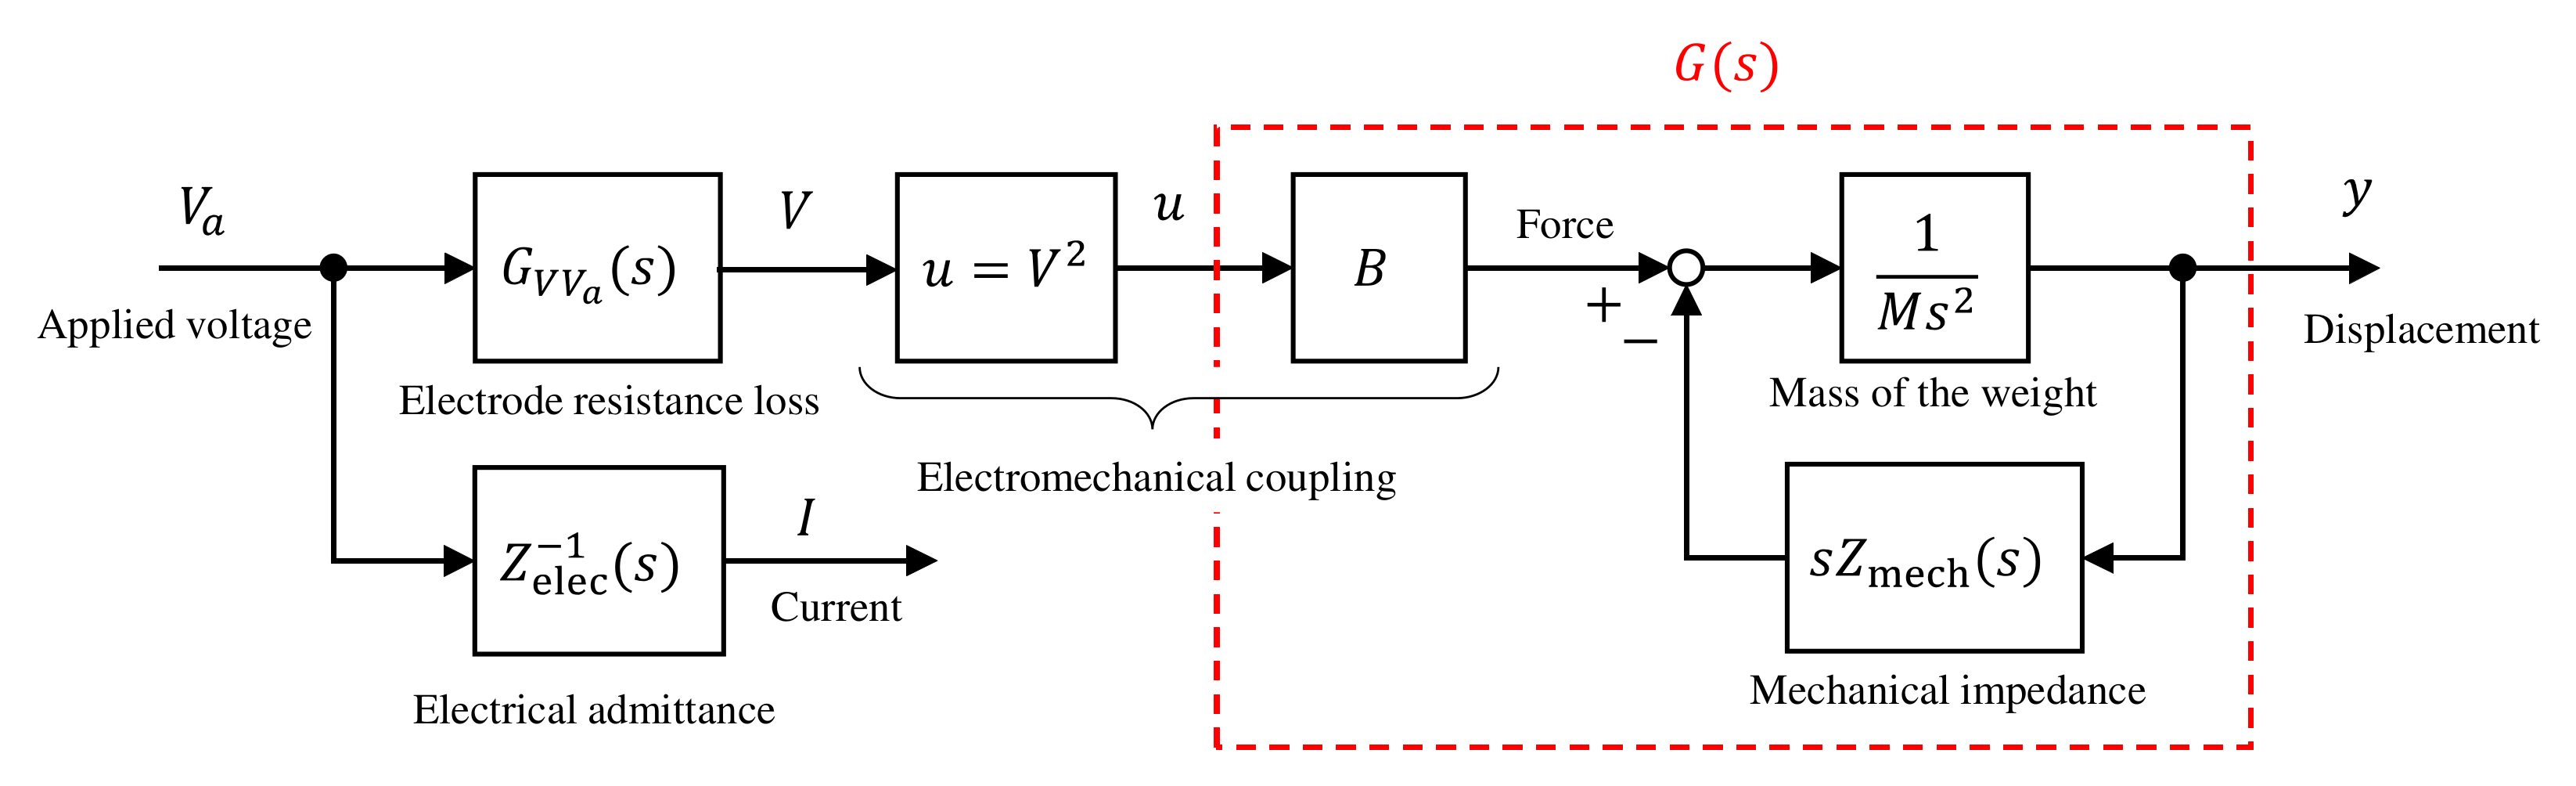
It is useful to define the “material” electromechanical coupling coefficient, as well as the electromechanical coupling coefficient B. The material electromechanical coupling coefficient may be defined as the stress generated for the squared applied electric field. For an ideal dielectric elastomer with simple boundary conditions, the actuation pressure is given by ϵ r ϵ 0 ( V / h d ) 2  [23]. Therefore, in ideal cases, the permittivity corresponds to the material electromechanical coupling coefficient. Let β l be the electromechanical coupling ratio representing the ratio relative to the ideal electrostatic stress in the longitudinal direction when the voltage is applied in the thickness direction.
σ l = β l ϵ r ϵ 0 V h d 2
where σ l denotes the actuation stress and h d denotes the thickness of the single dielectric layer. Note that β l = 1 for ideal DEAs. The actuation force in the longitudinal direction is derived from σ l and is therefore modeled as B V 2 = N σ l h d w e . Thus, from Equations (16) and (18), β l is calculated as
β l = B h d 2 ϵ r ϵ 0 N h d w e = B l e C .

3.5. Overall Model

We can obtain the overall model with the input as V and the output as y and I by combining all the electromechanical coupling, mechanical system, and electrical system models. Figure 8 shows the block diagram of the overall model. Note that the model assumes a linear system except for the non-linearity of u = V 2 .

4. Experiment

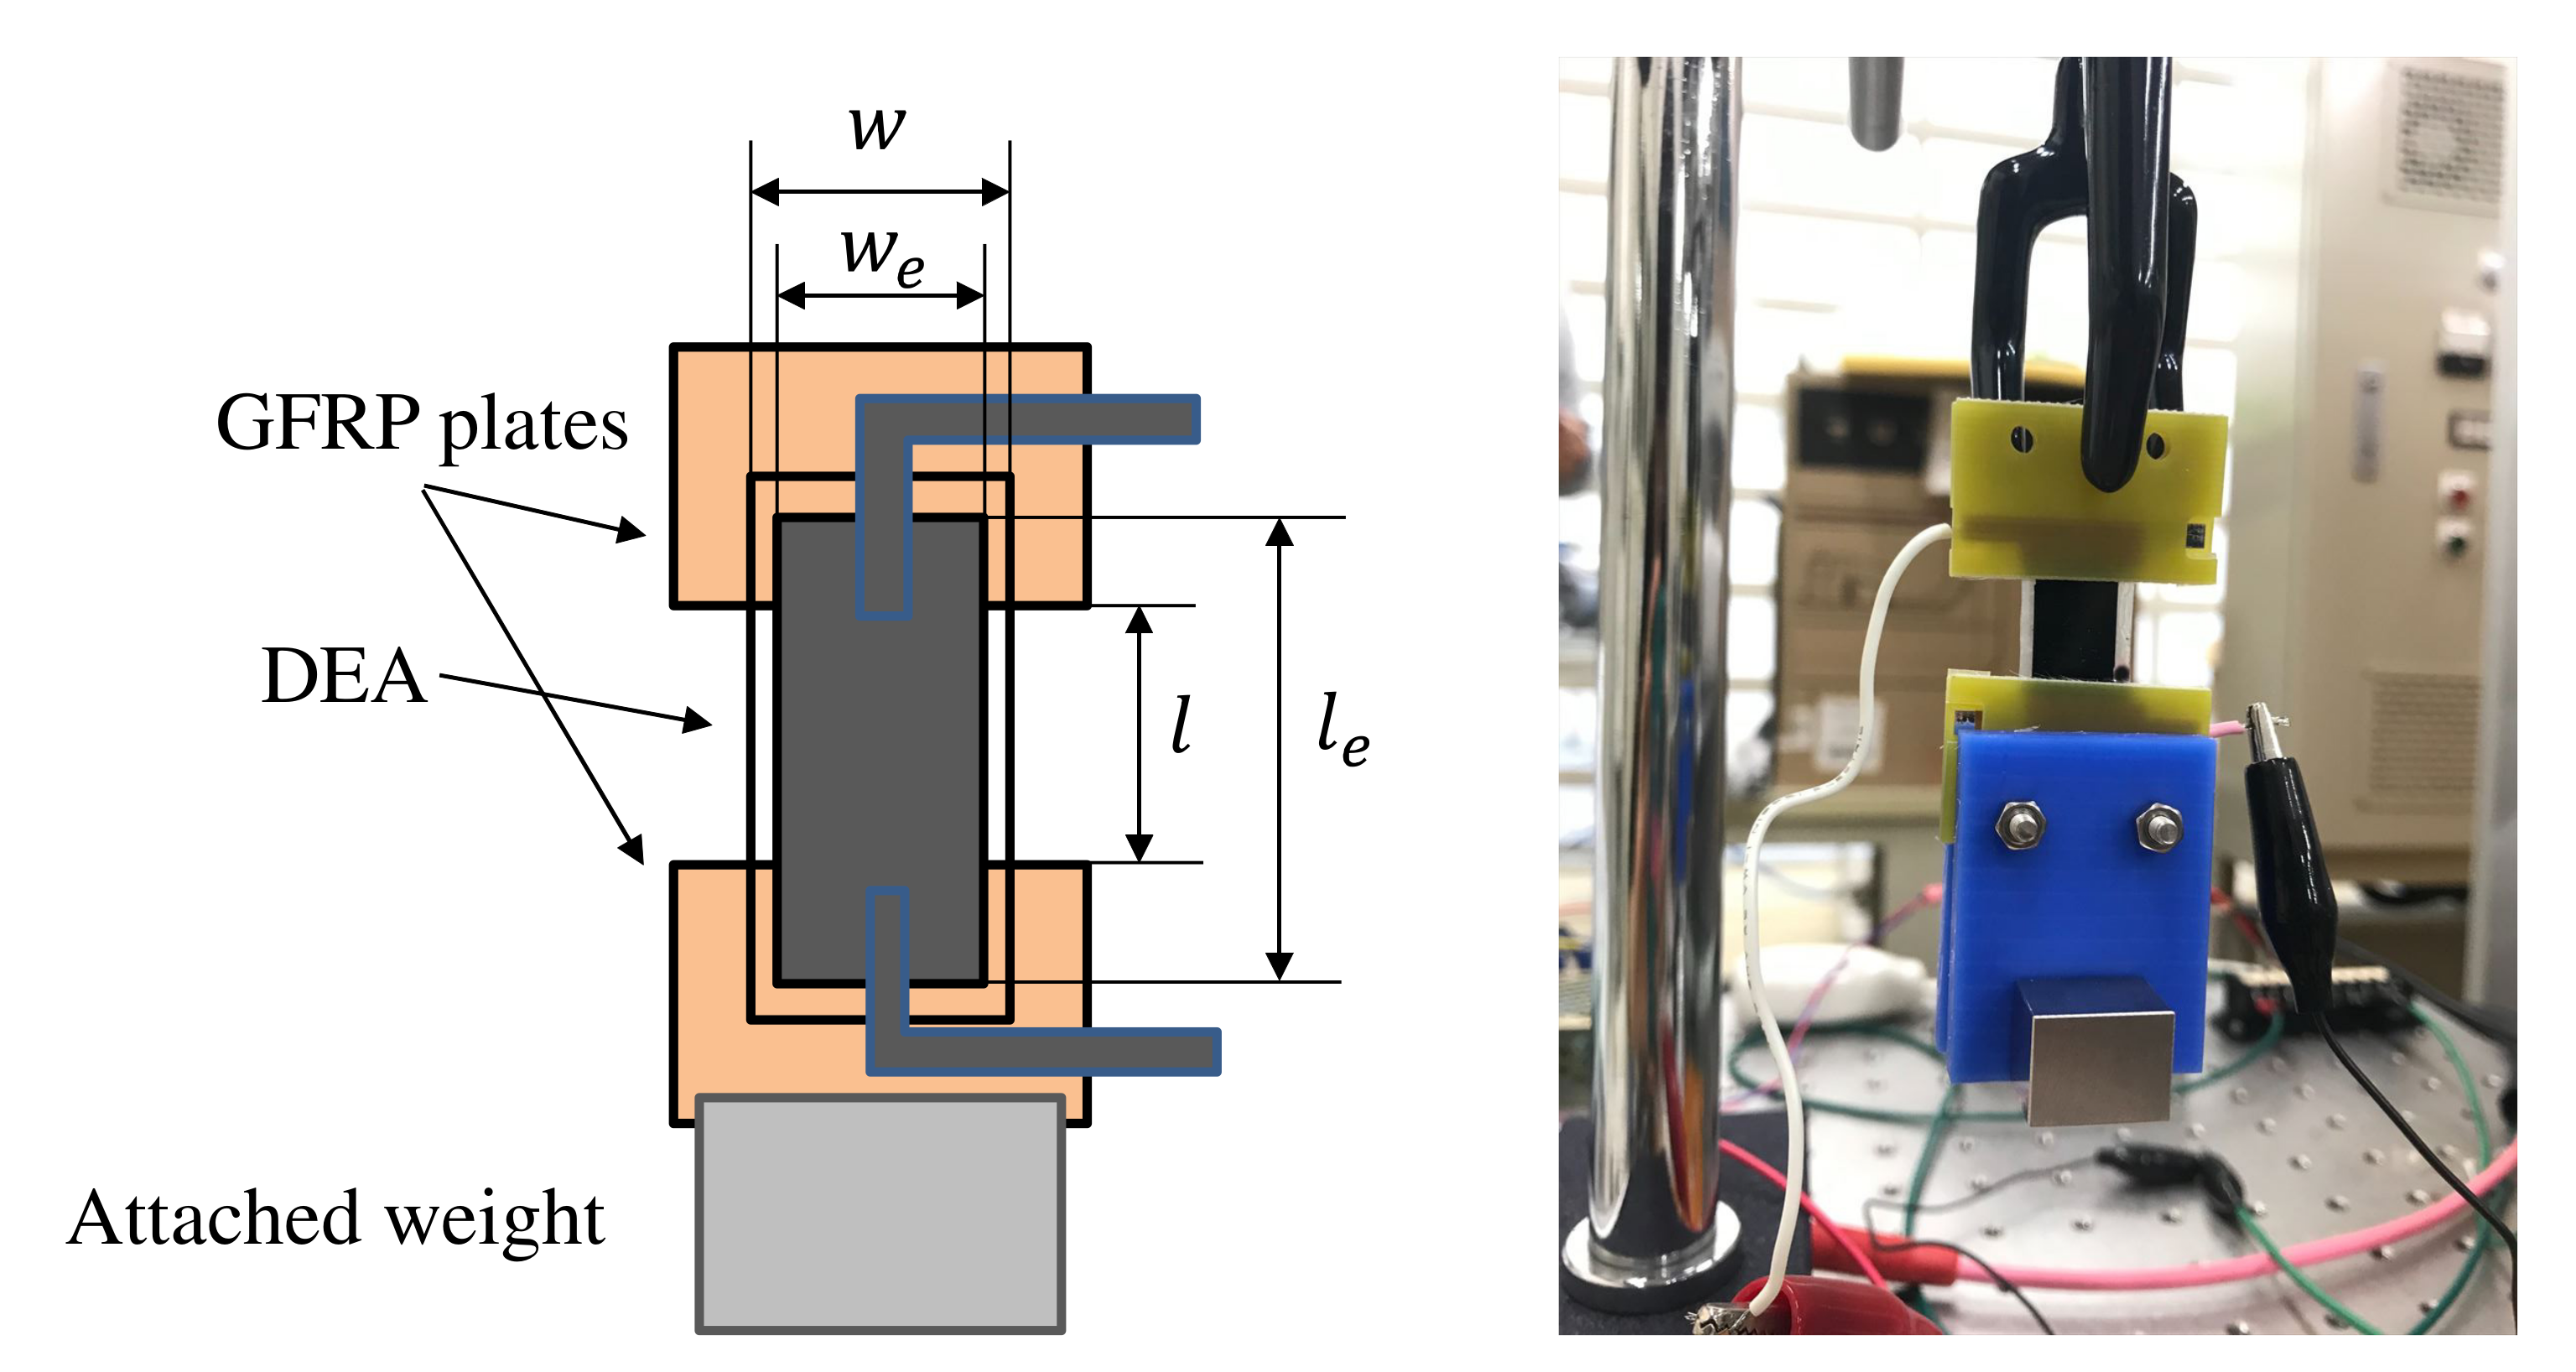
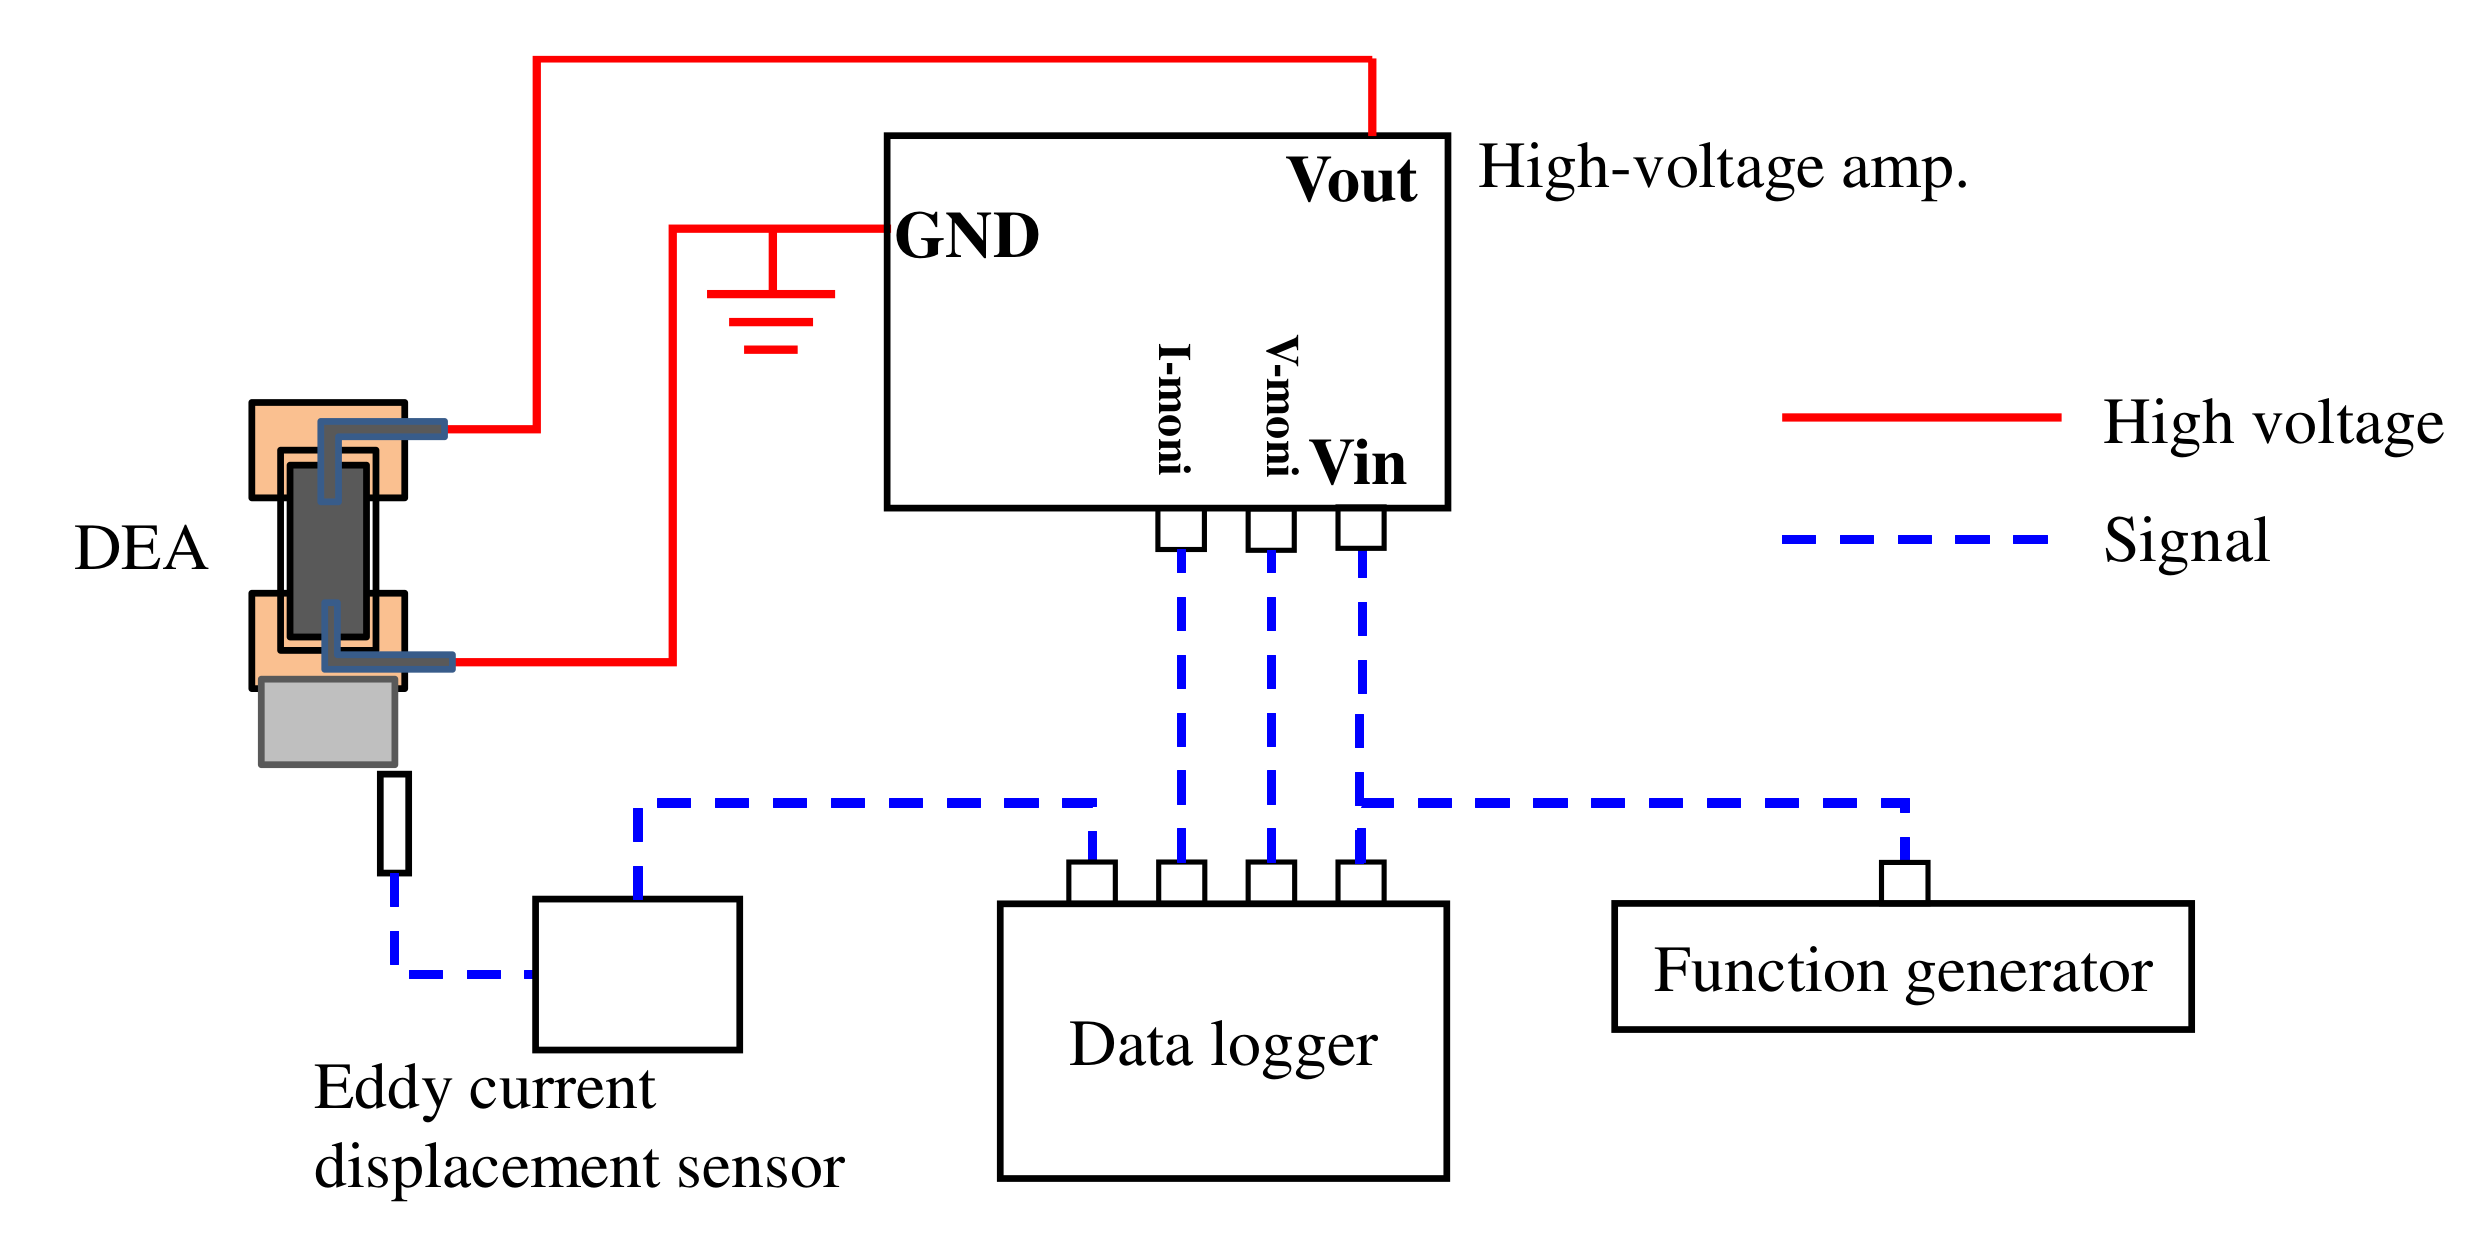
4.1. Experimental Setup and Method

Figure 9 shows a schematic of the wiring of the experimental setup. The displacement of the suspended DEA is measured at the upper surface of the stainless steel weight attached to the actuator with an eddy current displacement sensor (Keyence, EX-305). A high-voltage amplifier (Matsusada, HEOPS-5B6-L1) is used for applying voltages to the DEA. The detail of the stacked dielectric elastomer actuator used in the experiment has been shown in Section 2.1.
The experimental procedure is as follows.
  • A weight is attached to the DEA and let hang. Two types of weights ( M = 52.8 g or M = 34.9 g) are used to investigate the effect of different prestress.
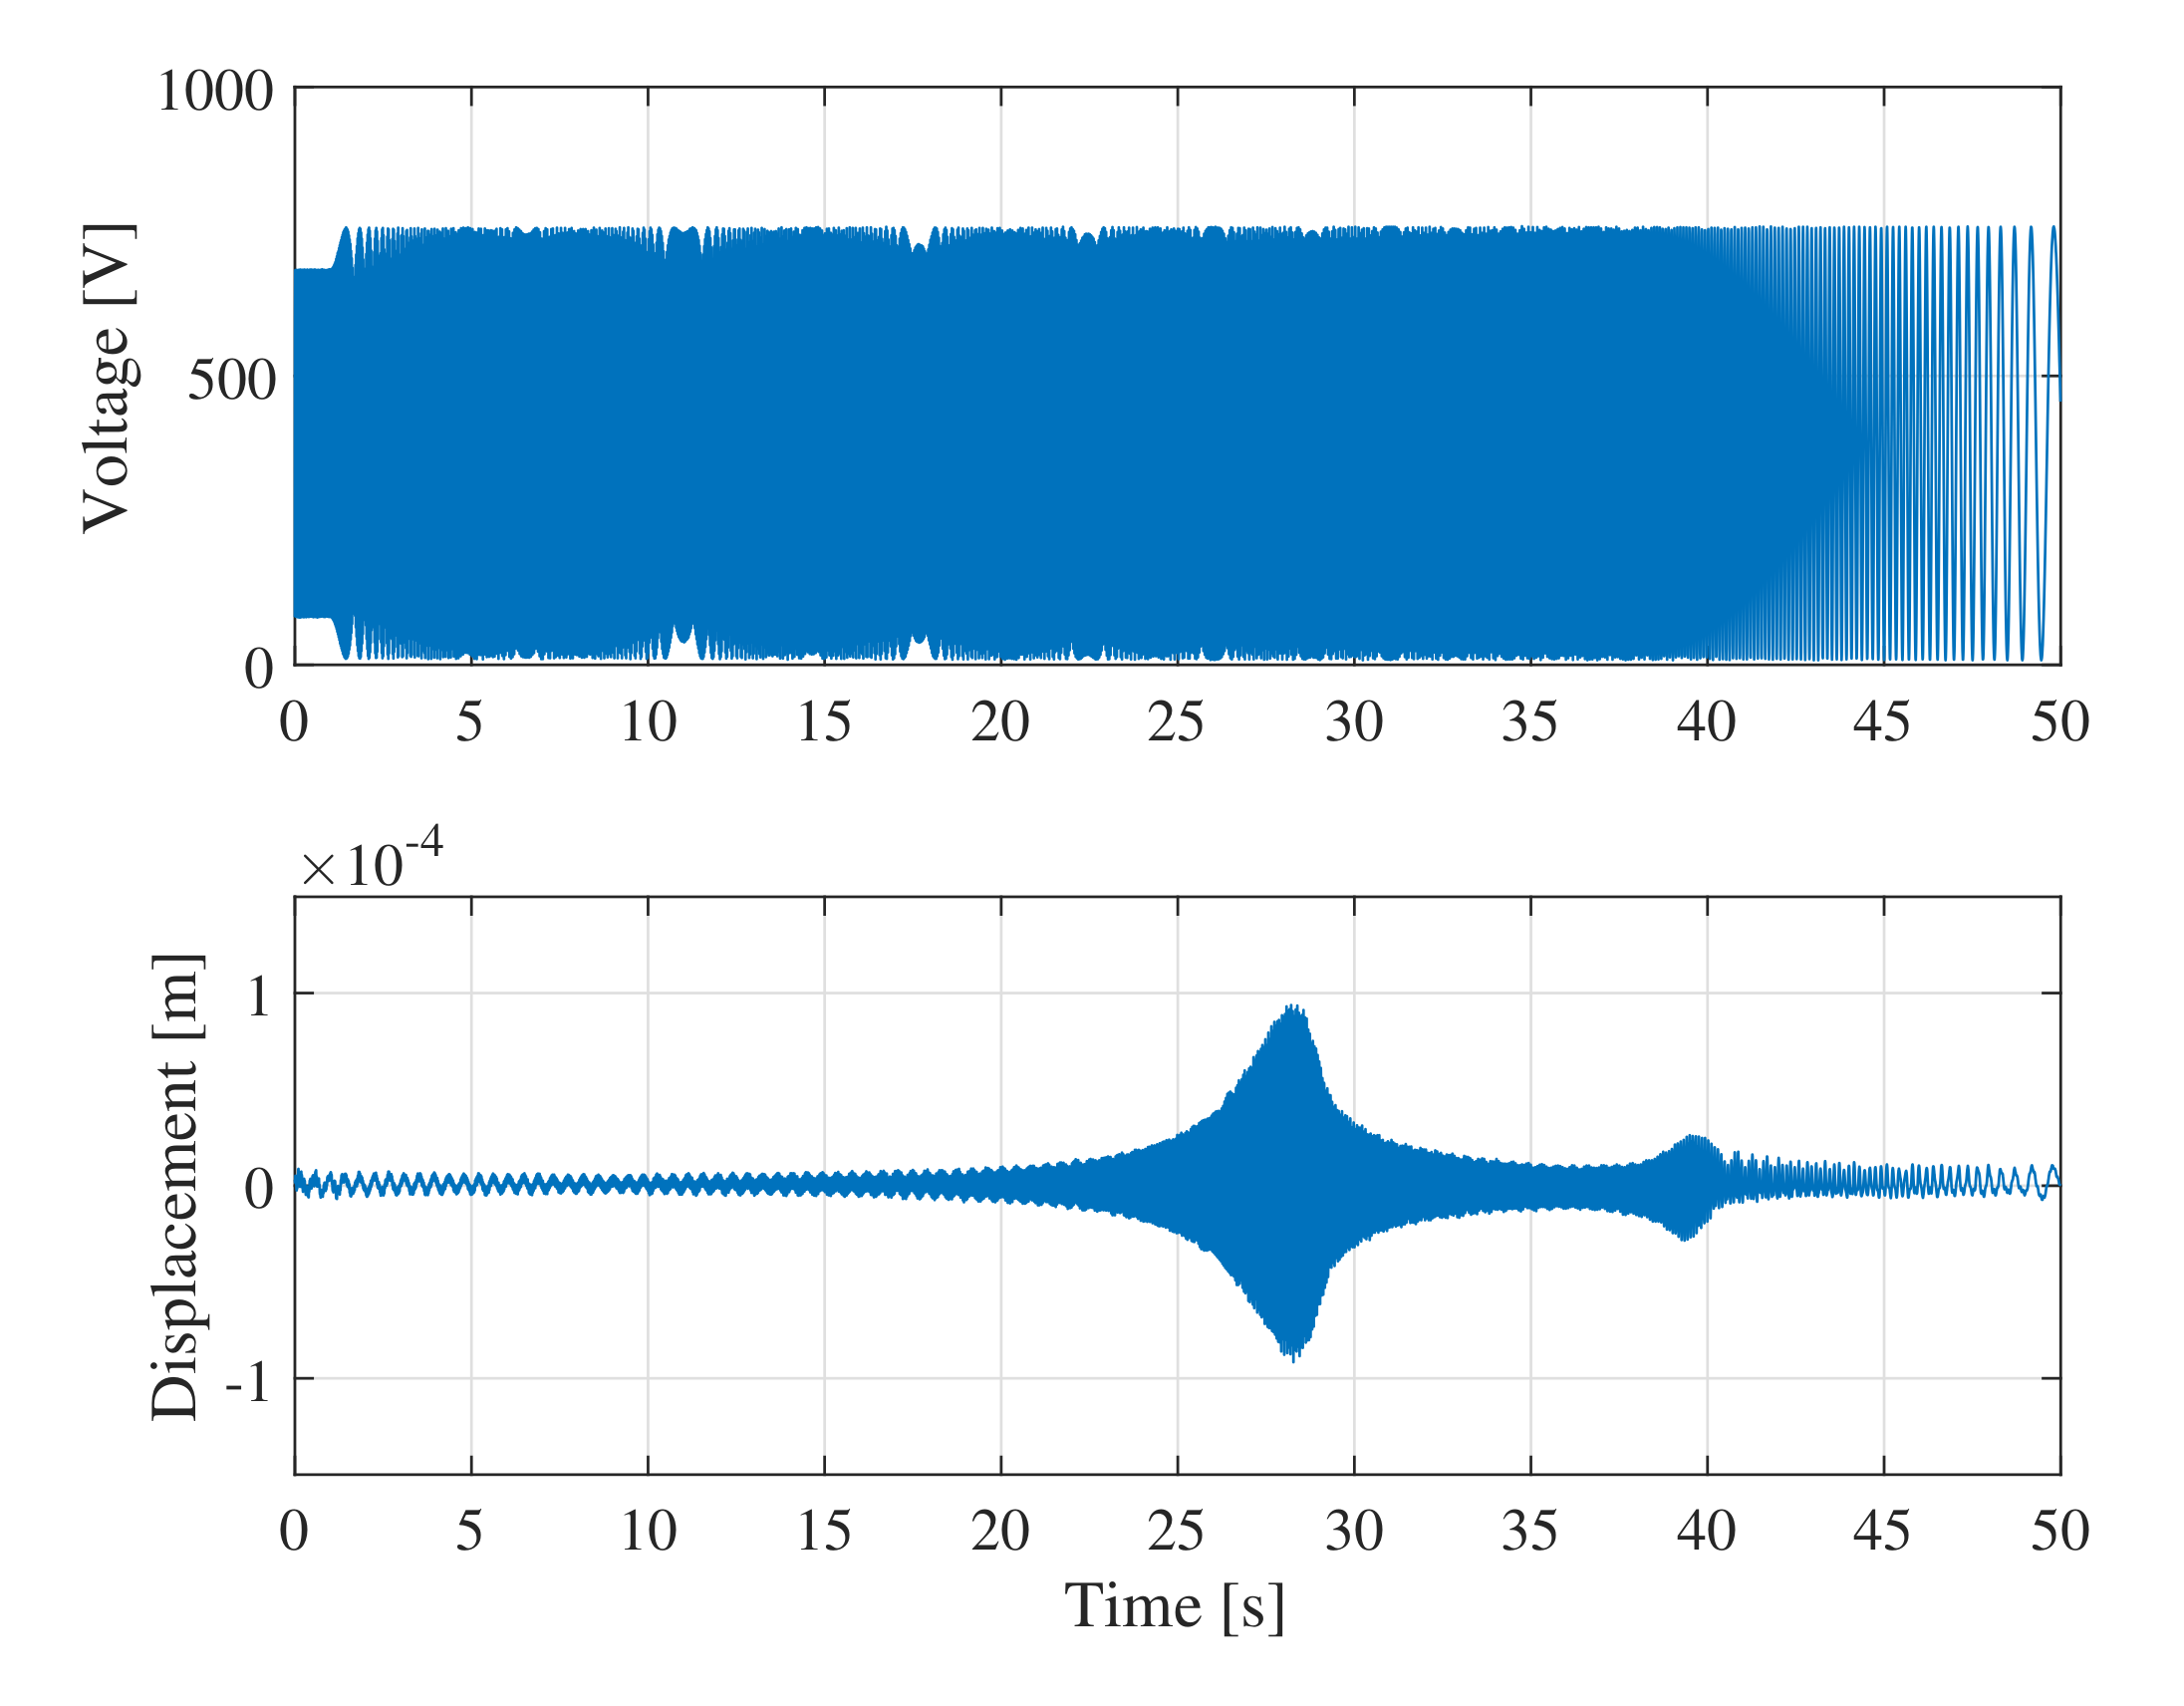
  • Swept sinusoidal voltage is applied to the DEA. The applied voltage is 0 V to 750 V, the frequency range is 0.02 to 5000 Hz divided into five, and the swept sine wave is output from a function generator. The divided ranges are shown in Table 2.
  • The displacement of the weight is measured and recorded in a data logger together with the voltage and current. Experiments are performed three times for averaging.
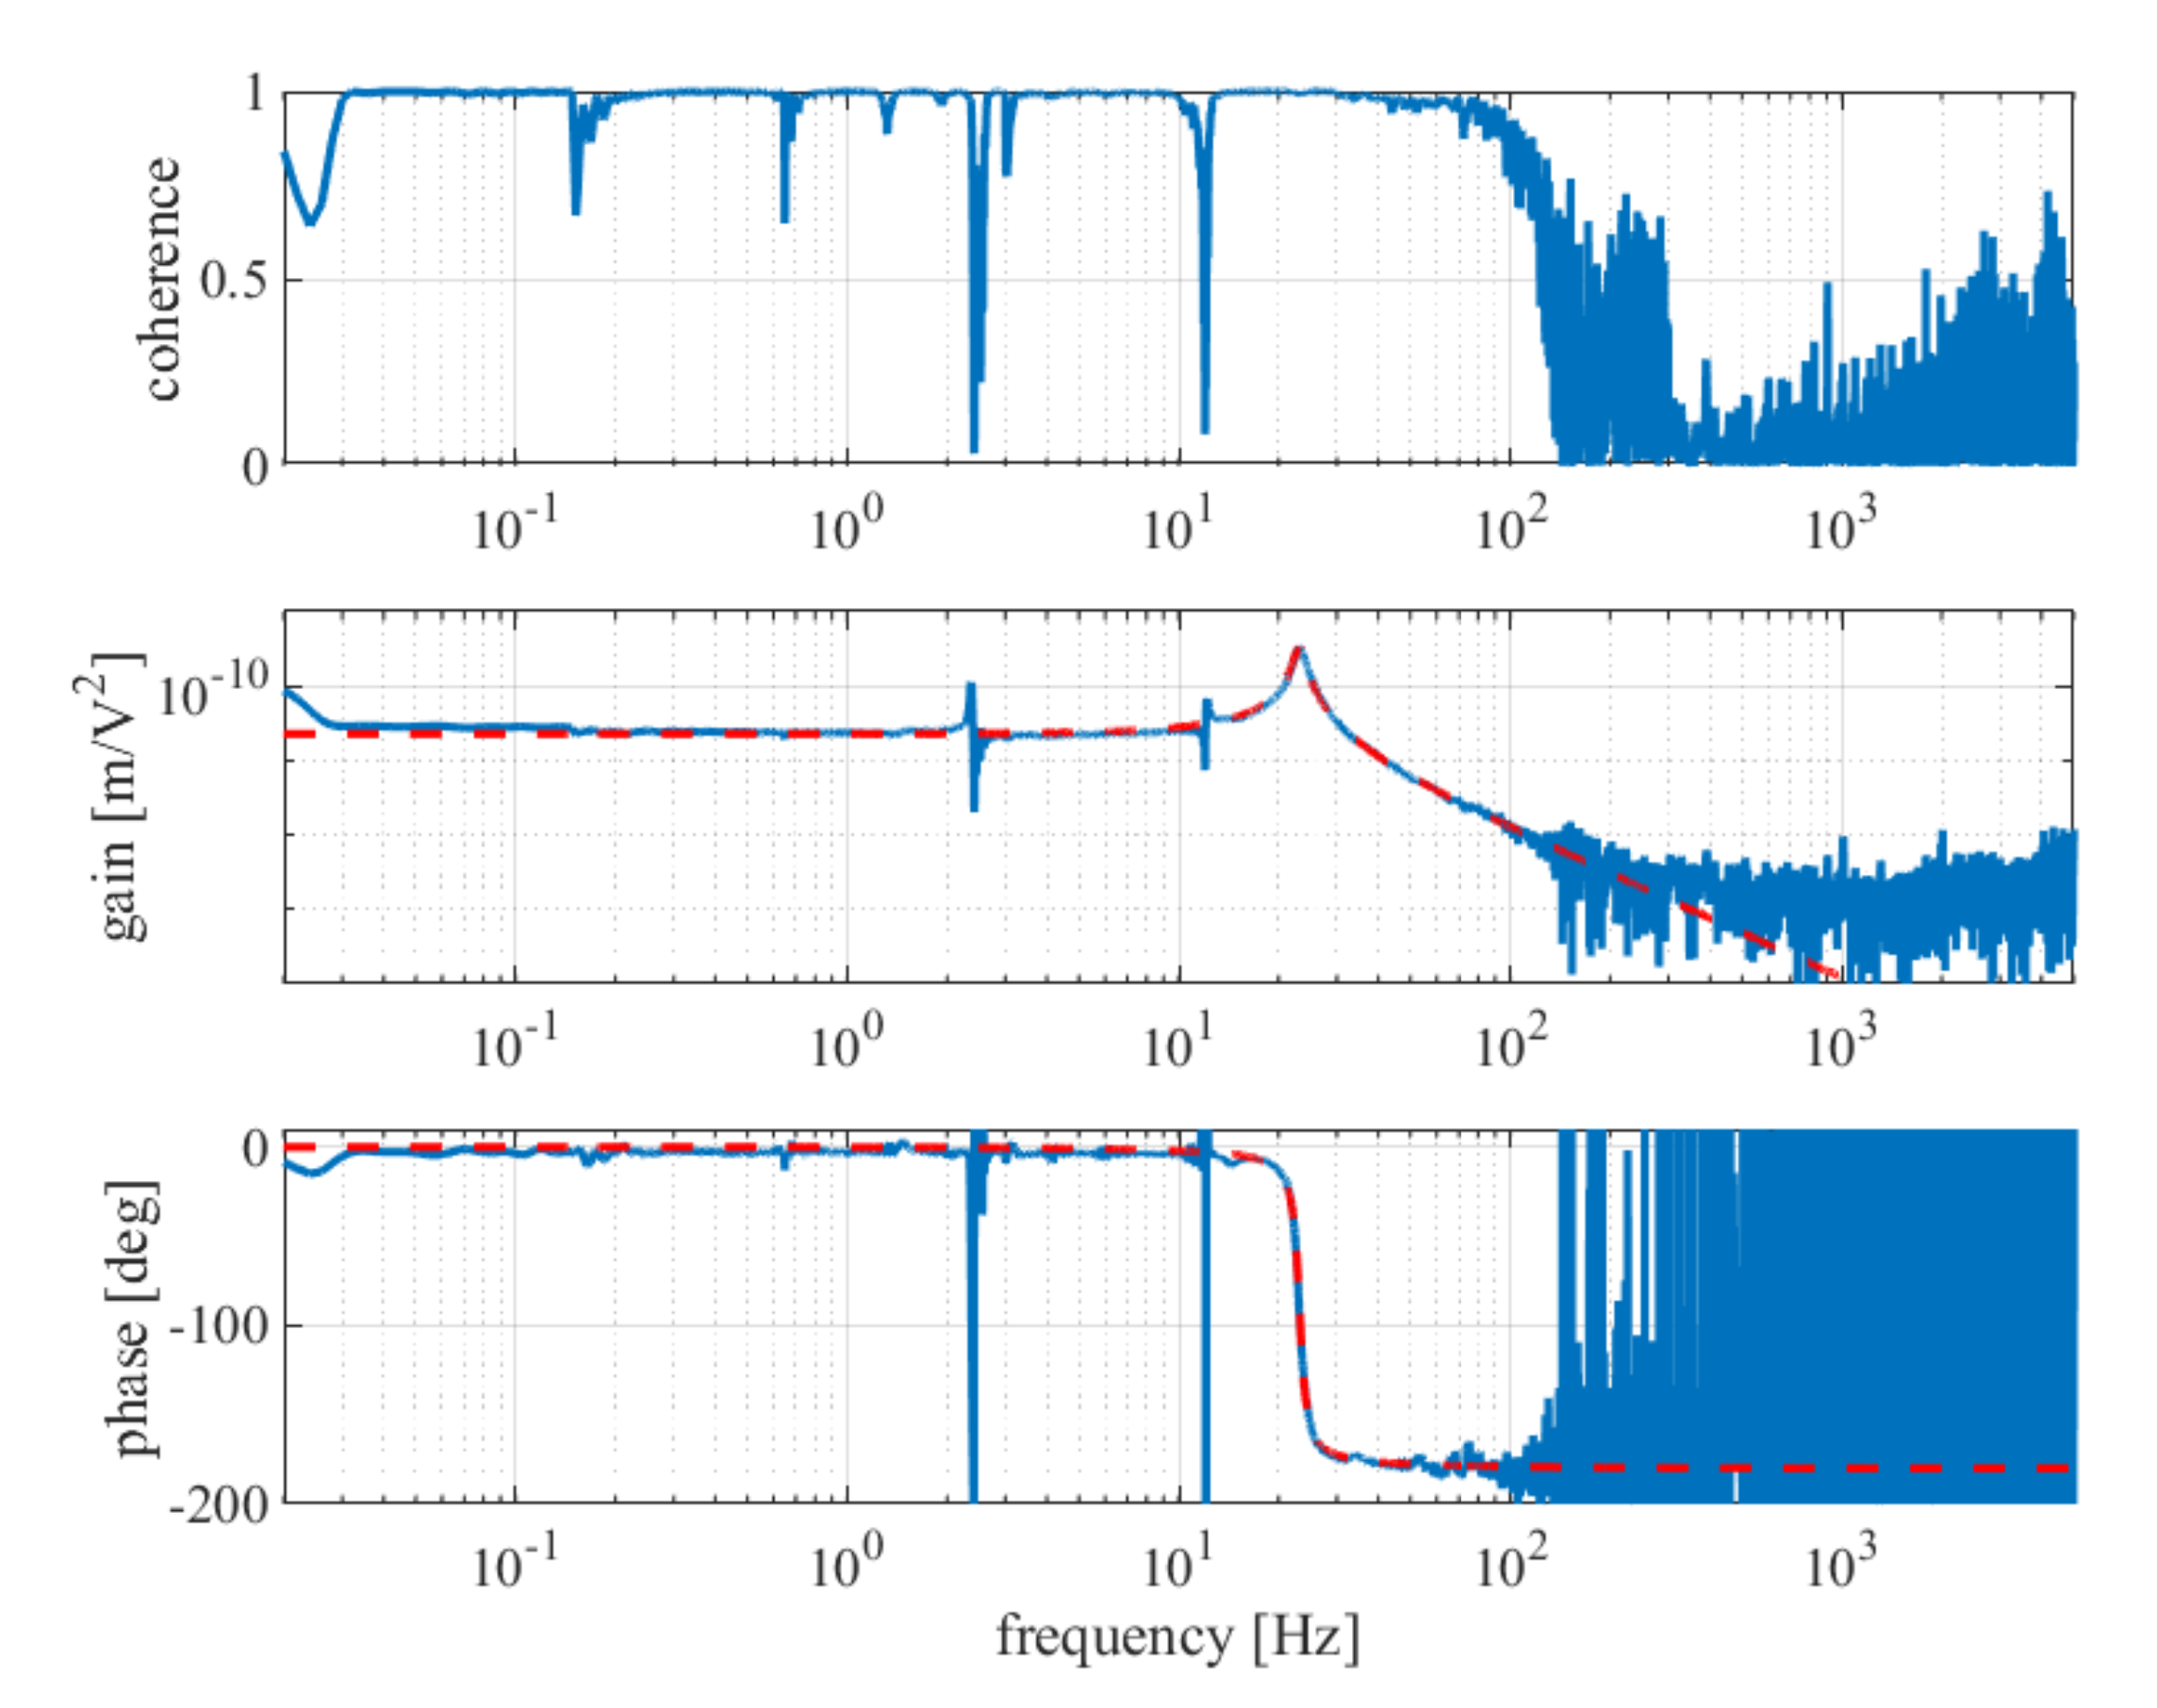
  • The frequency response is calculated based on the recorded voltage, current, and displacement. The tfestimate function (MATLAB, MathWorks) can estimate the frequency response based on the averaged spectra, and the influence of noise can be reduced. Besides, estimation is performed for each frequency range shown in Table 2, and the estimated frequency responses are concatenated together.
  • The transfer function is identified from the estimated frequency response. For the mechanical model, use Equation (7), and for the electrical model, use the inverse of Equation (13). The invfreqs function (MATLAB, MathWorks) is used to identify the transfer function.

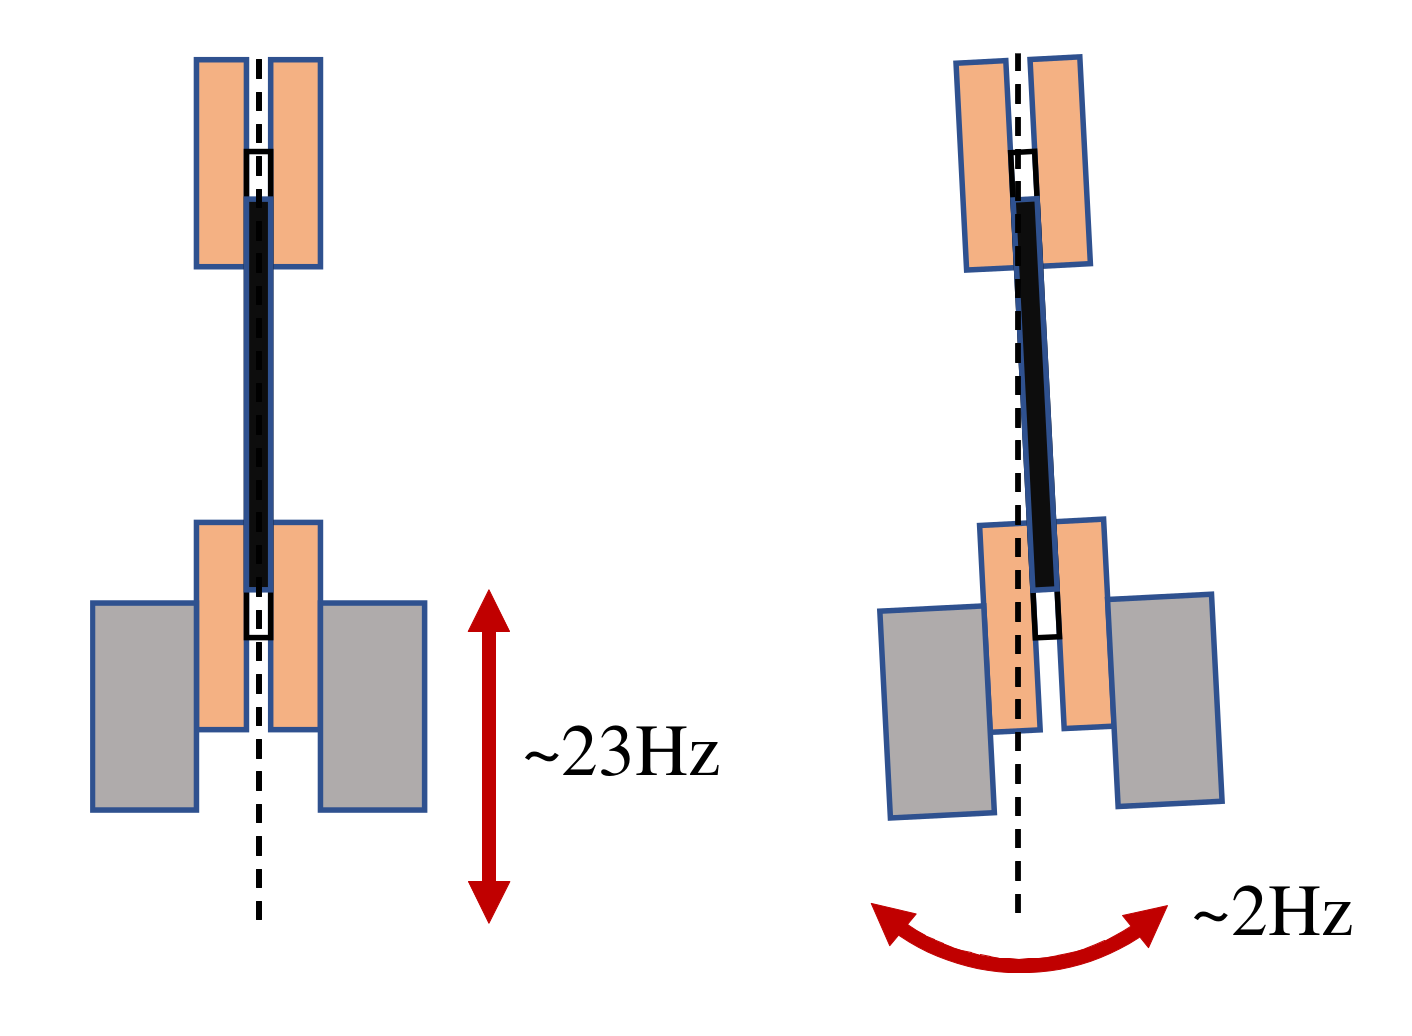
4.2. Results and Discussions: Identification of the Mechanical Model

Figure 10 shows a typical example of the time response of displacement when a sweep sinusoidal voltage of 1 to 50 Hz is applied. Figure 10 shows the case of weight M = 52.8 g. The upper figure shows the time series of the voltage, and the lower side is the time series of the displacement. We can observe a large resonance around 28 s.
Based on the obtained time response data, the frequency response from U to Y was estimated by spectral analysis. Figure 11 shows the coherence, gain, and phase in order from the top. The solid blue line is the estimated frequency response. Figure 11 shows the case of weight M = 52.8 g. When the mass of the weight was M = 34.9 g, similar results were observed except that the resonance frequency was high. The frequency response shows good agreement with the typical characteristics of the second-order transfer function shown in Equation (7). A resonance peak of 23 Hz is clearly confirmed from the gain graph in Figure 11. Moreover, as shown in the phase graph in Figure 11, the phase changes smoothly from 0 degrees to 180 degrees near the resonance.
On the quality of the frequency response data, the coherence is almost 1 between 0.03 Hz and 100 Hz and the data reproducibility is high except for some frequencies (around 2 Hz and around 12 Hz), as shown in the coherence graph in Figure 11. The noise around 2 Hz corresponds to the natural frequency of the pendulum motion, and the noise around 12 Hz corresponds to that of the laboratory table. The low coherence at frequencies over 100 Hz due to the vibration displacement was too small to measure.
It should be noted that the pendulum vibration, around 2 Hz noise in this experiment, may occur as undesirable motion in the proposed method. Figure 12 is a side view of the suspended DEA that measures displacement, and the figure on the left shows the vertical motion assumed in the model. The figure on the right side of Figure 12 shows the undesirable pendulum motion by the influence of disturbance. However, because the weight is selected so that the natural frequency of the vertical vibration mode is not close to that of the pendulum vibration mode, we expect that the coefficient of the transfer function identified by the fitting will not be affected.
The identified transfer function is overlaid with red dashed lines. The identified model (dashed red line) and the estimated frequency response (solid blue line) agree very well between 0.03 Hz and 100 Hz. Table 3 shows the constants estimated from the identified transfer functions. The estimated Young’s modulus is in good agreement with that of the datasheet of Elastosil ( E = 0.5 to 2 [MPa]) [46]. Further, the damping time constant τ 1 and the electromechanical coupling ratio β l are also obtained.
Lastly, the effects of weights or prestress should be addressed. It is known that the characteristics of DE are greatly affected by the magnitude of prestress (e.g., [47]). The difference between K and E is considered to be due to nonlinear elasticity. Moreover, the differences in the electrical coupling B and β l are thought to have been affected by the magnitude of prestress. However, further investigation of the effect of prestress will be required as the future direction of this study.

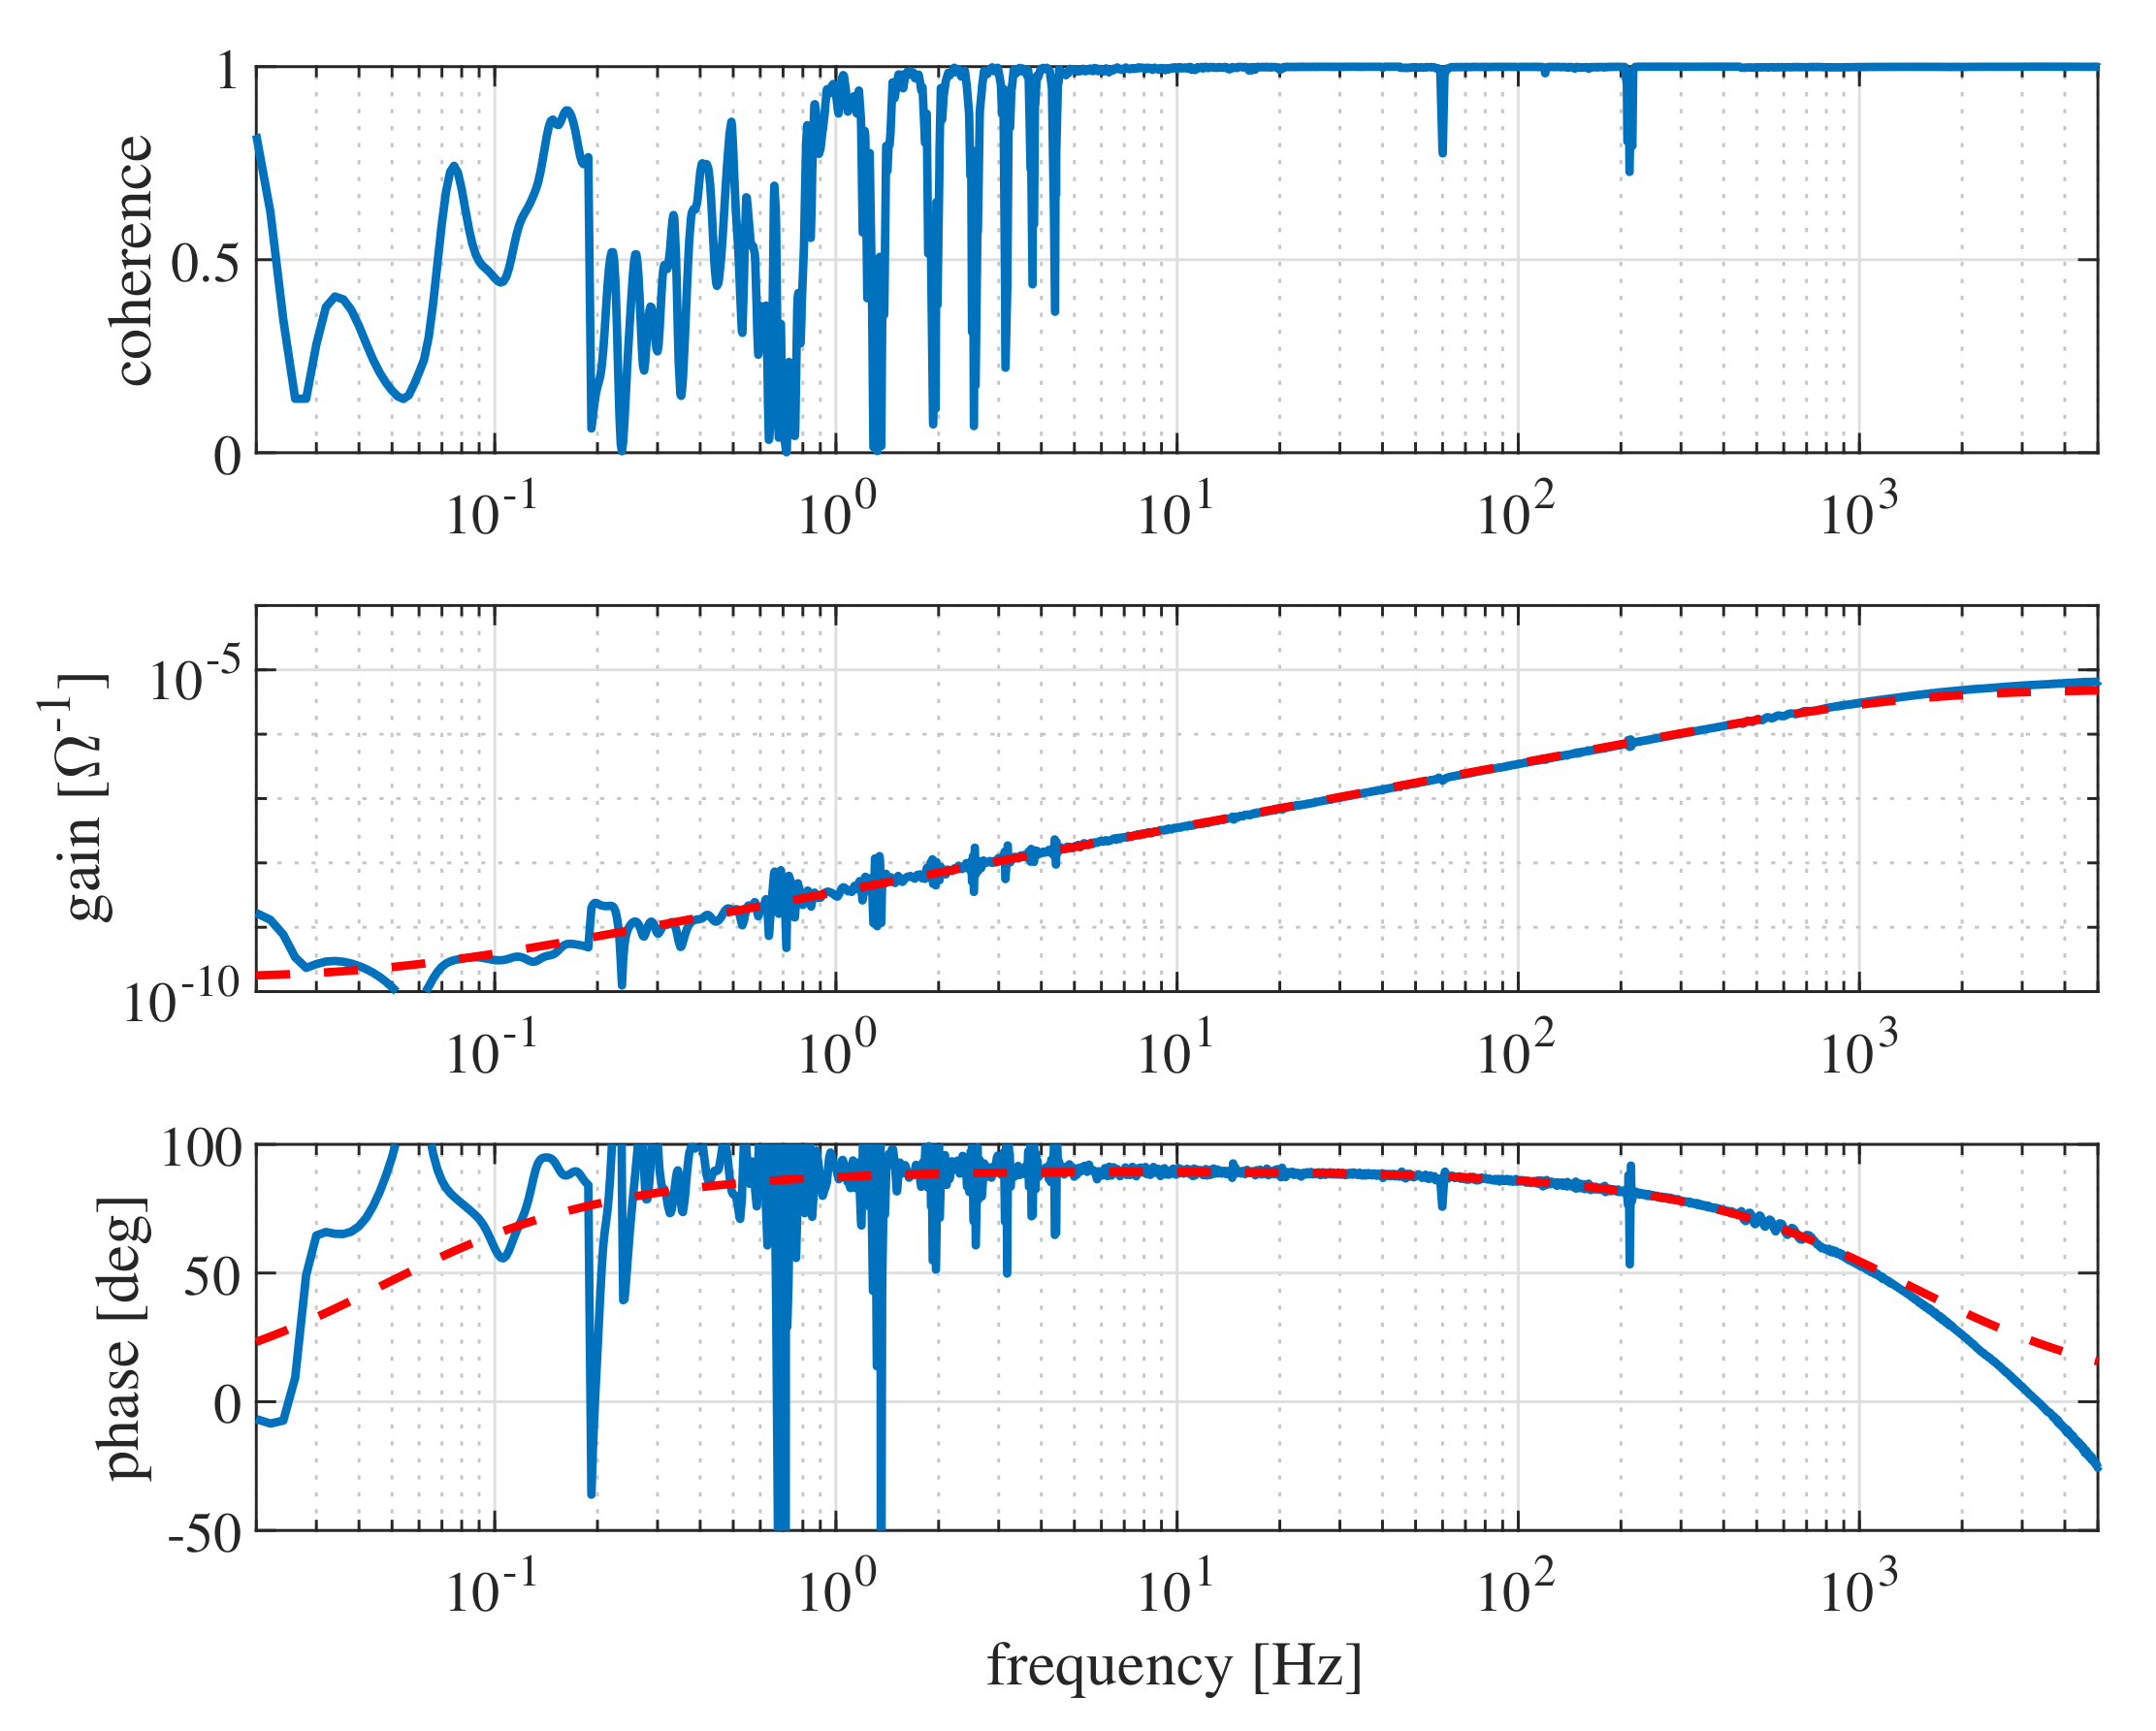
4.3. Results and Discussions: Identification of the Electrical Model

Figure 13 shows the coherence, gain, and phase of the frequency response from the applied voltage to the flowing current. Figure 13 shows the case of weight M = 52.8 g. When the mass of the weight was M = 34.9 g, similar results were observed except for the gain difference corresponding to the difference of the capacitance. In Figure 13, the coherence is high from 5 Hz to 5 kHz and the quality of the frequency response data is good. The graph shows a typical capacitive response in the frequencies from 5 Hz to 1 kHz since the gain increases linearly and the phase remains about 90 degrees. At frequencies lower than 5 Hz, the coherence is low, and the gain and phase are also disturbed. This is because there are almost no current flows and adequate measurement is not possible. At frequencies higher than 3 kHz, the phase is below 0 degrees. This is probably due to the effect of the noise filter on the monitor terminals of the amplifier.
The red dashed line in Figure 13 shows the transfer function identified using the inverse of Z elec in Equation (13). Table 4 shows the estimated electrical constants obtained by the identification. The identified model and the frequency response are in good agreement from 1 Hz to 1 kHz. The frequency range from 1 Hz to 1 kHz corresponds to that of capacitive impedance as shown in Equation (14); therefore, the estimated value of C is considered to be valid. However the estimated relative permittivity ( ϵ r = 1.98 for M = 52.8 g and ϵ r = 1.63 for M = 34.9 g) deviates from the datasheet value ( ϵ r = 2.8 ) [46]. This is probably due to the differences of the voltage amplitudes used in the proposed method and in the typical electrical measurement. The proposed method uses large-amplitude voltages but typically the permittivity can be measured using an impedance analyzer with small-amplitude voltage.
The estimated values of R p and R s are not very reliable because of the current measurement limit at low frequencies below 1 Hz and the unmodeled phase lag at high frequencies above 1 kHz. The estimated relative resistivity ρ p is less than the one shown in the datasheet ( ρ p = 10 12 Ω m) [46]; however, it is difficult to precisely measure such high resistivity by the current monitor of the amplifier used in the experiment. The estimation errors of R p and R s are also not expected to have a significant impact on the model of haptic devices in the practical frequency range.
The effects of the weights or prestress in the electrical characterization should be addressed as was similarly discussed in Section 4.2. The difference in the capacitance can be clearly explained because the heavier weight causes larger deformation and larger capacitance. The difference in the permittivity ϵ r is thought to have been affected by the magnitude of prestress.

5. Conclusions

This paper proposed a new method of characterization of DEAs. The proposed method is particularly suitable for estimating the dynamic elastic modulus, which characterizes the vibration damping of thin stacked DEAs, because it is not almost affected by friction and local deformation, and it can also estimate the electromechanical coupling and electrical constants. The experiment is very simple since the proposed method requires only a weight attached to the DEA and a displacement (or velocity or acceleration) sensor, other than a high-voltage amplifier and a data acquisition device. It is expected that the proposed method will be widely employed as a simple method for the characterization of DEAs.
The future direction of this paper includes the investigation of the effect of the choice of weight or prestress. Moreover, another direction may include the estimation of viscoelastic constants associated with slow creep deformation using similar experimental methods.

Author Contributions

K.T. conceived this work. Y.K., K.T., and K.K. performed the experiments. K.T., Y.K., and K.K. performed signal processing. K.T. and Y.K. checked the validity of the work. Y.K. and K.T. wrote the draft. K.T. revised the manuscript. K.T. is the supervisor of Y.K. and K.K. All authors have read and agreed to the published version of the manuscript.

Funding

This research was partially supported by JSPS Kakenhi 17H03204.

Data Availability Statement

Not applicable.

Conflicts of Interest

The authors declare no conflict of interest.

Abbreviations

The following abbreviations are used in this manuscript:
DEDielectric elastomer
DEADielectric elastomer actuator

References

  1. Hirai, T.; Sadatoh, H.; Ueda, T.; Kasazaki, T.; Kurita, Y.; Hirai, M.; Hayashi, S. Polyurethane-elastomer-actuator. Die Angew. Makromol. Chem. Appl. Macromol. Chem. Phys. 1996, 240, 221–229. [Google Scholar] [CrossRef]
  2. Pelrine, R.E.; Kornbluh, R.D.; Joseph, J.P. Electrostriction of polymer dielectrics with compliant electrodes as a means of actuation. Sens. Actuators A Phys. 1998, 64, 77–85. [Google Scholar] [CrossRef]
  3. Pelrine, R.; Kornbluh, R.; Pei, Q.; Joseph, J. High-speed electrically actuated elastomers with strain greater than 100%. Science 2000, 287, 836–839. [Google Scholar] [CrossRef]
  4. Carpi, F. Dielectric Elastomers as Electromechanical Transducers: Fundamentals, Materials, Devices, Models and Applications of an Emerging Electroactive Polymer Technology; Elsevier: Amsterdam, The Netherlands, 2008. [Google Scholar]
  5. Wingert, A.; Lichter, M.D.; Dubowsky, S.; Hafez, M. Hyper-redundant robot manipulators actuated by optimized binary-dielectric polymers. In Proceedings of the SPIE’s 9th Annual International Symposium on Smart Structures and Materials, San Diego, CA, USA, 17–21 March 2002; Volume 4695, pp. 415–423. [Google Scholar]
  6. Carpi, F.; Bauer, S.; De Rossi, D. Stretching dielectric elastomer performance. Science 2010, 330, 1759–1761. [Google Scholar] [CrossRef]
  7. Carpi, F.; Frediani, G.; Turco, S.; De Rossi, D. Bioinspired tunable lens with muscle-like electroactive elastomers. Adv. Funct. Mater. 2011, 21, 4152–4158. [Google Scholar] [CrossRef]
  8. Koo, I.M.; Jung, K.; Koo, J.C.; Nam, J.D.; Lee, Y.K.; Choi, H.R. Development of soft-actuator-based wearable tactile display. IEEE Trans. Robot. 2008, 24, 549–558. [Google Scholar] [CrossRef]
  9. Bolzmacher, C.; Hafez, M.; Khoudja, M.B.; Bernardoni, P.; Dubowsky, S. Polymer-based actuators for virtual reality devices. In Proceedings of the Smart Structures and Materials, San Diego, CA, USA, 14–18 March 2004; Volume 5385, pp. 281–289. [Google Scholar]
  10. Ozsecen, M.Y.; Sivak, M.; Mavroidis, C. Haptic interfaces using dielectric electroactive polymers. In Proceedings of the SPIE Smart Structures and Materials + Nondestructive Evaluation and Health Monitoring, San Diego, CA, USA, 7–11 March 2010; Volume 7647, p. 764737. [Google Scholar]
  11. Frediani, G.; Mazzei, D.; De Rossi, D.E.; Carpi, F. Wearable wireless tactile display for virtual interactions with soft bodies. Front. Bioeng. Biotechnol. 2014, 2, 31. [Google Scholar] [CrossRef] [Green Version]
  12. Boys, H.; Frediani, G.; Poslad, S.; Busfield, J.; Carpi, F. A dielectric elastomer actuator-based tactile display for multiple fingertip interaction with virtual soft bodies. In Proceedings of the SPIE Smart Structures and Materials + Nondestructive Evaluation and Health Monitoring, Portland, OR, USA, 25–29 March 2017; Volume 10163, p. 101632D. [Google Scholar]
  13. Ma, J.; Cheng, X.; Wang, P.; Jiao, Z.; Yu, Y.; Yu, M.; Luo, B.; Yang, W. A Haptic Feedback Actuator Suitable for the Soft Wearable Device. Appl. Sci. 2020, 10, 8827. [Google Scholar] [CrossRef]
  14. Pyo, D.; Ryu, S.; Kyung, K.U.; Yun, S.; Kwon, D.S. High-pressure endurable flexible tactile actuator based on microstructured dielectric elastomer. Appl. Phys. Lett. 2018, 112, 061902. [Google Scholar] [CrossRef] [Green Version]
  15. Phung, H.; Nguyen, C.T.; Jung, H.; Nguyen, T.D.; Choi, H.R. Bidirectional tactile display driven by electrostatic dielectric elastomer actuator. Smart Mater. Struct. 2020, 29, 035007. [Google Scholar] [CrossRef]
  16. Zhao, H.; Hussain, A.M.; Israr, A.; Vogt, D.M.; Duduta, M.; Clarke, D.R.; Wood, R.J. A Wearable Soft Haptic Communicator Based on Dielectric Elastomer Actuators. Soft Robot. 2020, 7, 451–461. [Google Scholar] [CrossRef] [PubMed]
  17. Ji, X.; Liu, X.; Cacucciolo, V.; Civet, Y.; El Haitami, A.; Cantin, S.; Perriard, Y.; Shea, H. Untethered Feel-Through Haptics Using 18-μm Thick Dielectric Elastomer Actuators. Adv. Funct. Mater. 2020. [Google Scholar] [CrossRef]
  18. Kovacs, G.; Düring, L.; Michel, S.; Terrasi, G. Stacked dielectric elastomer actuator for tensile force transmission. Sens. Actuators A Phys. 2009, 155, 299–307. [Google Scholar] [CrossRef]
  19. Biggs, J.; Danielmeier, K.; Hitzbleck, J.; Krause, J.; Kridl, T.; Nowak, S.; Orselli, E.; Quan, X.; Schapeler, D.; Sutherland, W.; et al. Electroactive polymers: Developments of and perspectives for dielectric elastomers. Angew. Chem. Int. Ed. 2013, 52, 9409–9421. [Google Scholar] [CrossRef] [PubMed]
  20. Matysek, M.; Lotz, P.; Flittner, K.; Schlaak, H.F. High-precision characterization of dielectric elastomer stack actuators and their material parameters. In Proceedings of the SPIE Smart Structures and Materials + Nondestructive Evaluation and Health Monitoring, San Diego, CA, USA, 9–13 March 2008; Volume 6927, p. 692722. [Google Scholar]
  21. Lotz, P.; Matysek, M.; Schlaak, H.F. Fabrication and application of miniaturized dielectric elastomer stack actuators. IEEE/ASME Trans. Mechatron. 2010, 16, 58–66. [Google Scholar] [CrossRef]
  22. Kaal, W.; Bartel, T.; Herold, S. Active vibration isolation with a dielectric elastomer stack actuator. Smart Mater. Struct. 2017, 26, 055016. [Google Scholar] [CrossRef]
  23. Carpi, F.; Anderson, I.; Bauer, S.; Frediani, G.; Gallone, G.; Gei, M.; Graaf, C.; Jean-Mistral, C.; Kaal, W.; Kofod, G.; et al. Standards for dielectric elastomer transducers. Smart Mater. Struct. 2015, 24, 105025. [Google Scholar] [CrossRef] [Green Version]
  24. Suo, Z. Theory of dielectric elastomers. Acta Mech. Solida Sin. 2010, 23, 549–578. [Google Scholar] [CrossRef]
  25. Kofod, G.; Sommer-Larsen, P.; Kornbluh, R.; Pelrine, R. Actuation response of polyacrylate dielectric elastomers. J. Intell. Mater. Syst. Struct. 2003, 14, 787–793. [Google Scholar] [CrossRef]
  26. Lochmatter, P.; Michel, S.; Kovacs, G. Electromechanical model for static and dynamic activation of elementary dielectric elastomer actuators. In Proceedings of the SPIE Smart Structures and Materials + Nondestructive Evaluation and Health Monitoring, San Diego, CA, USA, 26 February–2 March 2006; Volume 6168. [Google Scholar] [CrossRef]
  27. Schmidt, A.; Bergamini, A.; Jordi, C.; Kovacs, G.; Mazza, E. Electro-mechanical modeling of dielectric elastomer transducers with micro-structured electrodes. In Proceedings of the SPIE Smart Structures and Materials + Nondestructive Evaluation and Health Monitoring, San Diego, CA, USA, 6–10 March 2011; Volume 7976, p. 79760L. [Google Scholar] [CrossRef]
  28. Sarban, R.; Lassen, B.; Willatzen, M. Dynamic electromechanical modeling of dielectric elastomer actuators with metallic electrodes. IEEE/ASME Trans. Mechatron. 2012, 17, 960–967. [Google Scholar] [CrossRef]
  29. Haus, H.; Matysek, M.; Mößinger, H.; Schlaak, H.F. Modelling and characterization of dielectric elastomer stack actuators. Smart Mater. Struct. 2013. [Google Scholar] [CrossRef]
  30. Rizzello, G.; Naso, D.; York, A.; Seelecke, S. Modeling, Identification, and Control of a Dielectric Electro-Active Polymer Positioning System. IEEE Trans. Control. Syst. Technol. 2015, 23, 632–643. [Google Scholar] [CrossRef]
  31. Hackl, C.M.; Tang, H.Y.; Lorenz, R.D.; Turng, L.S.; Schroder, D. A multidomain model of planar electro-active polymer actuators. IEEE Trans. Ind. Appl. 2005, 41, 1142–1148. [Google Scholar] [CrossRef]
  32. Choi, H.R.; Jung, K.; Ryew, S.; Nam, J.D.; Jeon, J.; Koo, J.C.; Tanie, K. Biomimetic soft actuator: Design, modeling, control, and applications. IEEE/ASME Trans. Mechatron. 2005, 10, 581–593. [Google Scholar] [CrossRef]
  33. Wissler, M.; Mazza, E. Electromechanical coupling in dielectric elastomer actuators. Sens. Actuators A Phys. 2007, 138, 384–393. [Google Scholar] [CrossRef]
  34. Kaal, W.; Herold, S. Electroactive polymer actuators in dynamic applications. IEEE/ASME Trans. Mechatron. 2010, 16, 24–32. [Google Scholar] [CrossRef]
  35. York, A.; Dunn, J.; Seelecke, S. Experimental characterization of the hysteretic and rate-dependent electromechanical behavior of dielectric electro-active polymer actuators. Smart Mater. Struct. 2010, 19, 094014. [Google Scholar] [CrossRef]
  36. Chiang Foo, C.; Cai, S.; Jin Adrian Koh, S.; Bauer, S.; Suo, Z. Model of dissipative dielectric elastomers. J. Appl. Phys. 2012, 111, 034102. [Google Scholar] [CrossRef]
  37. Rizzello, G.; Naso, D.; York, A.; Seelecke, S. A nonlinear electro-mechanical model for an annular dielectric elastomer actuator with a biasing mass. In Proceedings of the VDI Tagung Mechatronik, Aachen, Germany, 6–8 March 2013; pp. 117–122. [Google Scholar]
  38. Hoffstadt, T.; Maas, J. Analytical modeling and optimization of DEAP-based multilayer stack-transducers. Smart Mater. Struct. 2015, 24, 094001. [Google Scholar] [CrossRef]
  39. Rizzello, G.; Hodgins, M.; Naso, D.; York, A.; Seelecke, S. Modeling of the effects of the electrical dynamics on the electromechanical response of a DEAP circular actuator with a mass–spring load. Smart Mater. Struct. 2015, 24, 094003. [Google Scholar] [CrossRef]
  40. Liu, L.; Sun, W.; Sheng, J.; Chang, L.; Li, D.; Chen, H. Effect of temperature on the electromechanical actuation of viscoelastic dielectric elastomers. EPL 2015, 112, 27006. [Google Scholar] [CrossRef]
  41. Gu, G.Y.; Gupta, U.; Zhu, J.; Zhu, L.M.; Zhu, X.Y. Feedforward deformation control of a dielectric elastomer actuator based on a nonlinear dynamic model. Appl. Phys. Lett. 2015, 107, 042907. [Google Scholar] [CrossRef] [Green Version]
  42. Rizzello, G.; Naso, D.; Turchiano, B.; Seelecke, S. Robust position control of dielectric elastomer actuators based on LMI optimization. IEEE Trans. Control. Syst. Technol. 2016, 24, 1909–1921. [Google Scholar] [CrossRef]
  43. Gu, G.Y.; Gupta, U.; Zhu, J.; Zhu, L.M.; Zhu, X. Modeling of viscoelastic electromechanical behavior in a soft dielectric elastomer actuator. IEEE Trans. Robot. 2017, 33, 1263–1271. [Google Scholar] [CrossRef]
  44. Choi, H.R.; Ryew, S.; Jung, K.M.; Kim, H.; Jeon, J.W.; Nam, J.; Maeda, R.; Tanie, K. Soft actuator for robotic applications based on dielectric elastomer: Quasi-static analysis. In Proceedings of the 2002 IEEE International Conference on Robotics and Automation (ICRA), Washington, DC, USA, 11–15 May 2002; Volume 3, pp. 3212–3217. [Google Scholar]
  45. Berselli, G.; Vertechy, R.; Babič, M.; Parenti Castelli, V. Dynamic modeling and experimental evaluation of a constant-force dielectric elastomer actuator. J. Intell. Mater. Syst. Struct. 2013, 24, 779–791. [Google Scholar] [CrossRef]
  46. Wacker Chemie AG. ELASTOSIL® Film 2030 250/50. Available online: https://www.wacker.com/h/en-us/silicone-rubber/silicone-films/elastosil-film-2030/p/000038005 (accessed on 8 December 2020).
  47. Carpi, F.; Chiarelli, P.; Mazzoldi, A.; De Rossi, D. Electromechanical characterisation of dielectric elastomer planar actuators: Comparative evaluation of different electrode materials and different counterloads. Sens. Actuators A Phys. 2003, 107, 85–95. [Google Scholar] [CrossRef]
Figure 1. Schematic showing difficulty of surface contact between a probe and a locally deformed thin stacked dielectric elastomer actuator (DEA). The appropriate contact cannot be achieved both (a) when a small probe is used and (b) when a large probe is used.
Actuators 10 00040 g001
Figure 2. Photo of a thin stacked DEA.
Actuators 10 00040 g002
Figure 3. Schematic of measuring the surface deformation by a 2D laser displacement sensor (left) and experimentally measured surface deformation (right). The DEA was placed flat on a smooth flat table. The central part did not become thinner than expected, but the part away from the center became thicker. The electrode is located from about 4 mm to 20 mm.
Actuators 10 00040 g003
Figure 4. The schematic (left) and photo (right) of a DEA sample attached to a weighting mass.
Actuators 10 00040 g004
Figure 5. Structure of the model of a DEA.
Actuators 10 00040 g005
Figure 6. Mechanical impedance model of a suspended DEA.
Actuators 10 00040 g006
Figure 7. Electrical impedance model of a DEA.
Actuators 10 00040 g007
Figure 8. Block diagram of the overall model.
Actuators 10 00040 g008
Figure 9. Schematic of the wiring of the experimental setup.
Actuators 10 00040 g009
Figure 10. Measured time history of the swept voltage input and the displacement. In this case the frequency range is selected as 1 to 50 Hz. The graph shows the case of weight M = 52.8 g.
Actuators 10 00040 g010
Figure 11. Coherence (top), gain (middle), and phase (bottom) of the experimental frequency response (blue solid line) of the mechanical compliance. The identified model G (red dashed line) is also shown. The graph shows the case of weight M = 52.8 g.
Actuators 10 00040 g011
Figure 12. Dominant vertical vibration mode (left) and minor pendulum vibration mode (right).
Actuators 10 00040 g012
Figure 13. Coherence (top), gain (middle), and phase (bottom) of the experimental frequency response (blue solid line) of the electrical admittance. The identified model Z elec 1 (red dashed line) is also shown. The graph shows the case of weight M = 52.8 g.
Actuators 10 00040 g013
Table 1. Size of the DEA.
Deformable lengthl[m] 12 × 10 3
Length of the electrode l e [m] 16 × 10 3
Widthw[m] 13 × 10 3
Width of the electrode w e [m] 10 × 10 3
Total thicknessh[m] 600 × 10 6
Thickness of the dielectric h d [m] 50 × 10 6
Number of the layersN-10
Table 2. Segmented frequency range of the swept sinusoidal input.
Input Frequency [Hz]Sampling Frequency f s [Hz]Length of the Record T [s]
(1)0.02 to 0.220500
(2)0.1 to 520500
(3)1 to 5020050
(4)10 to 50020005
(5)100 to 500020,0000.5
Table 3. Estimated parameters of the mechanical model and the electromechanical coupling.
Attached massMkg 52.8 × 10 3 34.9 × 10 3
(Equivalent prestress) σ l 0 Pa 66.4 × 10 3 43.9 × 10 3
Spring constantK[N/m] 1.11 × 10 3 1.45 × 10 3
Damping coefficient C 1 [Ns/m] 0.54 0.45
Electromechanical coupling coefficientB[N/V 2 ] 25.3 × 10 9 18.1 × 10 9
Young’s modulusEPa 1.71 × 10 6 2.23 × 10 6
Damping time constant τ 1 [s] 0.482 × 10 3 0.311 × 10 3
Electromechanical coupling ratio β l - 0.722 0.630
Table 4. Estimated parameters of the electrical model.
Attached massMkg 52.8 × 10 3 34.9 × 10 3
(Equivalent prestress) σ l 0 Pa 66.4 × 10 3 43.9 × 10 3
CapacitanceCF 0.561 × 10 9 0.461 × 10 9
Equivalent parallel resistance R p Ω > 6.10 × 10 9 > 17.6 × 10 9
Equivalent series resistance R s Ω < 202 × 10 3 82.5 × 10 3
Relative permittivity ϵ r - 1.98 1.63
Resistivity ρ p Ω m> 0.195 × 10 12 > 0.562 × 10 12
Publisher’s Note: MDPI stays neutral with regard to jurisdictional claims in published maps and institutional affiliations.

