Article

Effects of Trailing Edge Deflections Driven by Shape Memory Alloy Actuators on the Transonic Aerodynamic Characteristics of a Super Critical Airfoil

China Aerodynamic Research and Development Center, Mianyang 621000, China
*
Author to whom correspondence should be addressed.
Submission received: 21 May 2021 / Revised: 7 July 2021 / Accepted: 11 July 2021 / Published: 15 July 2021
(This article belongs to the Special Issue Shape Memory Alloy Actuators)

Abstract

:
A smart structure to actuate a morphing trailing edge based on the super critical airfoil NASA sc-0714(2) was designed and verified in a transonic wind tunnel. The pressure distribution over the wing was measured to evaluate the structure ability and effects of trailing edge deflections on the aerodynamic characteristics. In the experiment, Mach number was from 0.4 to 0.8, and the angle of attack was from 0° to 6°. The results showed that the smart structure based on shape memory alloy could carry aerodynamic loads under transonic flow and deflect the trailing edge. When the driving force was constant, deformation would be influenced by the Mach number and angle of attack. Increasing the Mach number weakened the actuation capability of the smart structure, which decreased the deflection angle and rate of the trailing edge. The influence of the angle of attack is more complex, and couples with the influence of the Mach number. The higher the Mach number, the stronger the influence of the angles of attack. Additionally, the trailing edge deflection would dramatically change the flow structure over the airfoil, such as the shock wave position and strength. If separation was caused by the trailing edge deflection, the limitation of the smart structure would be further found.

1. Introduction

With the development of technology, much attention was paid to vehicle performance and flight quality. Modern vehicles were expected to adjust their configurations to real-time flow conditions maintaining optimal aerodynamics in the whole flight envelope, which promoted the development of morphing aircraft. Owing to the impact of camber on wing performance, a flexible shape of the wing camber is one of the most important issues among morphing aircraft techniques. Many important projects were conducted to design smart actuation mechanisms and study the aerodynamic characteristics of morphing wings. For example, the Morphing Aircraft Structures project [1,2,3,4,5] conducted by DARPA aimed at a new generation of multi-task military aircraft by adapting aerodynamic configurations to maintain the optimal performance. The emphasis of the project was the development of the morphing wing technology under subsonic and transonic flight conditions. NASA projected the “flexible high aspect ratio wing” plan [6,7] in the development of a new passenger transport vehicle for the year of 2030 to 2035. In this plan, the structure weight would be reduced by 25 percent and the aspect ratio increased by 30 percent to 40 percent.
One of the most important issues for morphing wing was the actuation system based on smart materials. Compared with other smart materials, shape memory alloy (SMA) has a high power to weight ratio and high breaking deformation [8], which made it promising in the field of aeronautics and astronautics. The study of morphing vehicles based on SMA started earlier, as studied by NASA/DARPA/AFRL jointly [9,10,11,12,13] in the “smart wing” project. This project emphasized the wing twist and non-hinge control surface technique, aiming at driving the surfaces to be deflected smoothly and seamlessly by shape memory alloys (SMAs) torque-tube. Three stages of wind tunnel experiment results showed that this scheme brought significant improvement on cruise drag and rolling moment controlling. The maximum Mach number was 0.9. Recently, NASA and the company Boeing developed a kind of continuous flexible trailing edge flap to decrease cruise drag by making both wing twist and camber adapted to the changing of vehicle weight and cruise conditions [14]. The outer wing was composed of 42 short flap sections divided into 14 groups of “3 segment flaps”. The two leading edge flaps were driven by an SMA actuator with a maximum deformation velocity of 10°/min. This type of designing had a lightweight structure, but slow response. Trailing edge flaps were driven by a rotating motor that had a heavy weight and quick response. This type of design meant the flaps would act as an aileron, which could eliminate the effect of slat flow and aerodynamic noise of traditional trailing edge flaps. The University of Quebec of Canada designed a kind of variable airfoil wing, the deformation of which was composed of a flexible wing skin, SMA actuator, and inner rigid base. The results of wind tunnel experiments under the condition of M0.2 and M0.3 showed that drag reduction changed from 14.5% to 26.7% with an average reduction of 18.5% when angles of attack ranged from −1° to 2°. Airfoil thickness changing could affect the lift force coefficient and drag force coefficient, which would meet the requirement for aerodynamic configuration of different flight conditions. U.Icardi et al. designed a kind of morphing wing driven by an SMA torch tube. The trailing edge of the wing would be deflected by 21.7°.
Leng et al. applied the shape memory polymer skin on camber morphing [15]. Xu et al. designed a kind of subsection type of trailing edge deflection structure, which was verified in a load-on/-off experiment [16].
It can be found that the current research activities of the smart structures were verified by the wind tunnel tests at a low speed. In this paper, an SMA-based smart structure and its effects on transonic vehicle aerodynamics were explored, a morphing trailing edge deflection structure based on the SMA actuator was designed, and transonic wind tunnel tests were performed to verify its actuation capability. The pressure distributions on the airfoil were obtained to investigate the effects of the trailing edge deflections. The results would be helpful to verify the SMA-based actuator validity under transonic conditions. It would also be helpful to study the flow mechanism over the morphing wing.

2. Mechanic Modeling and Test of Shape Memory Alloy

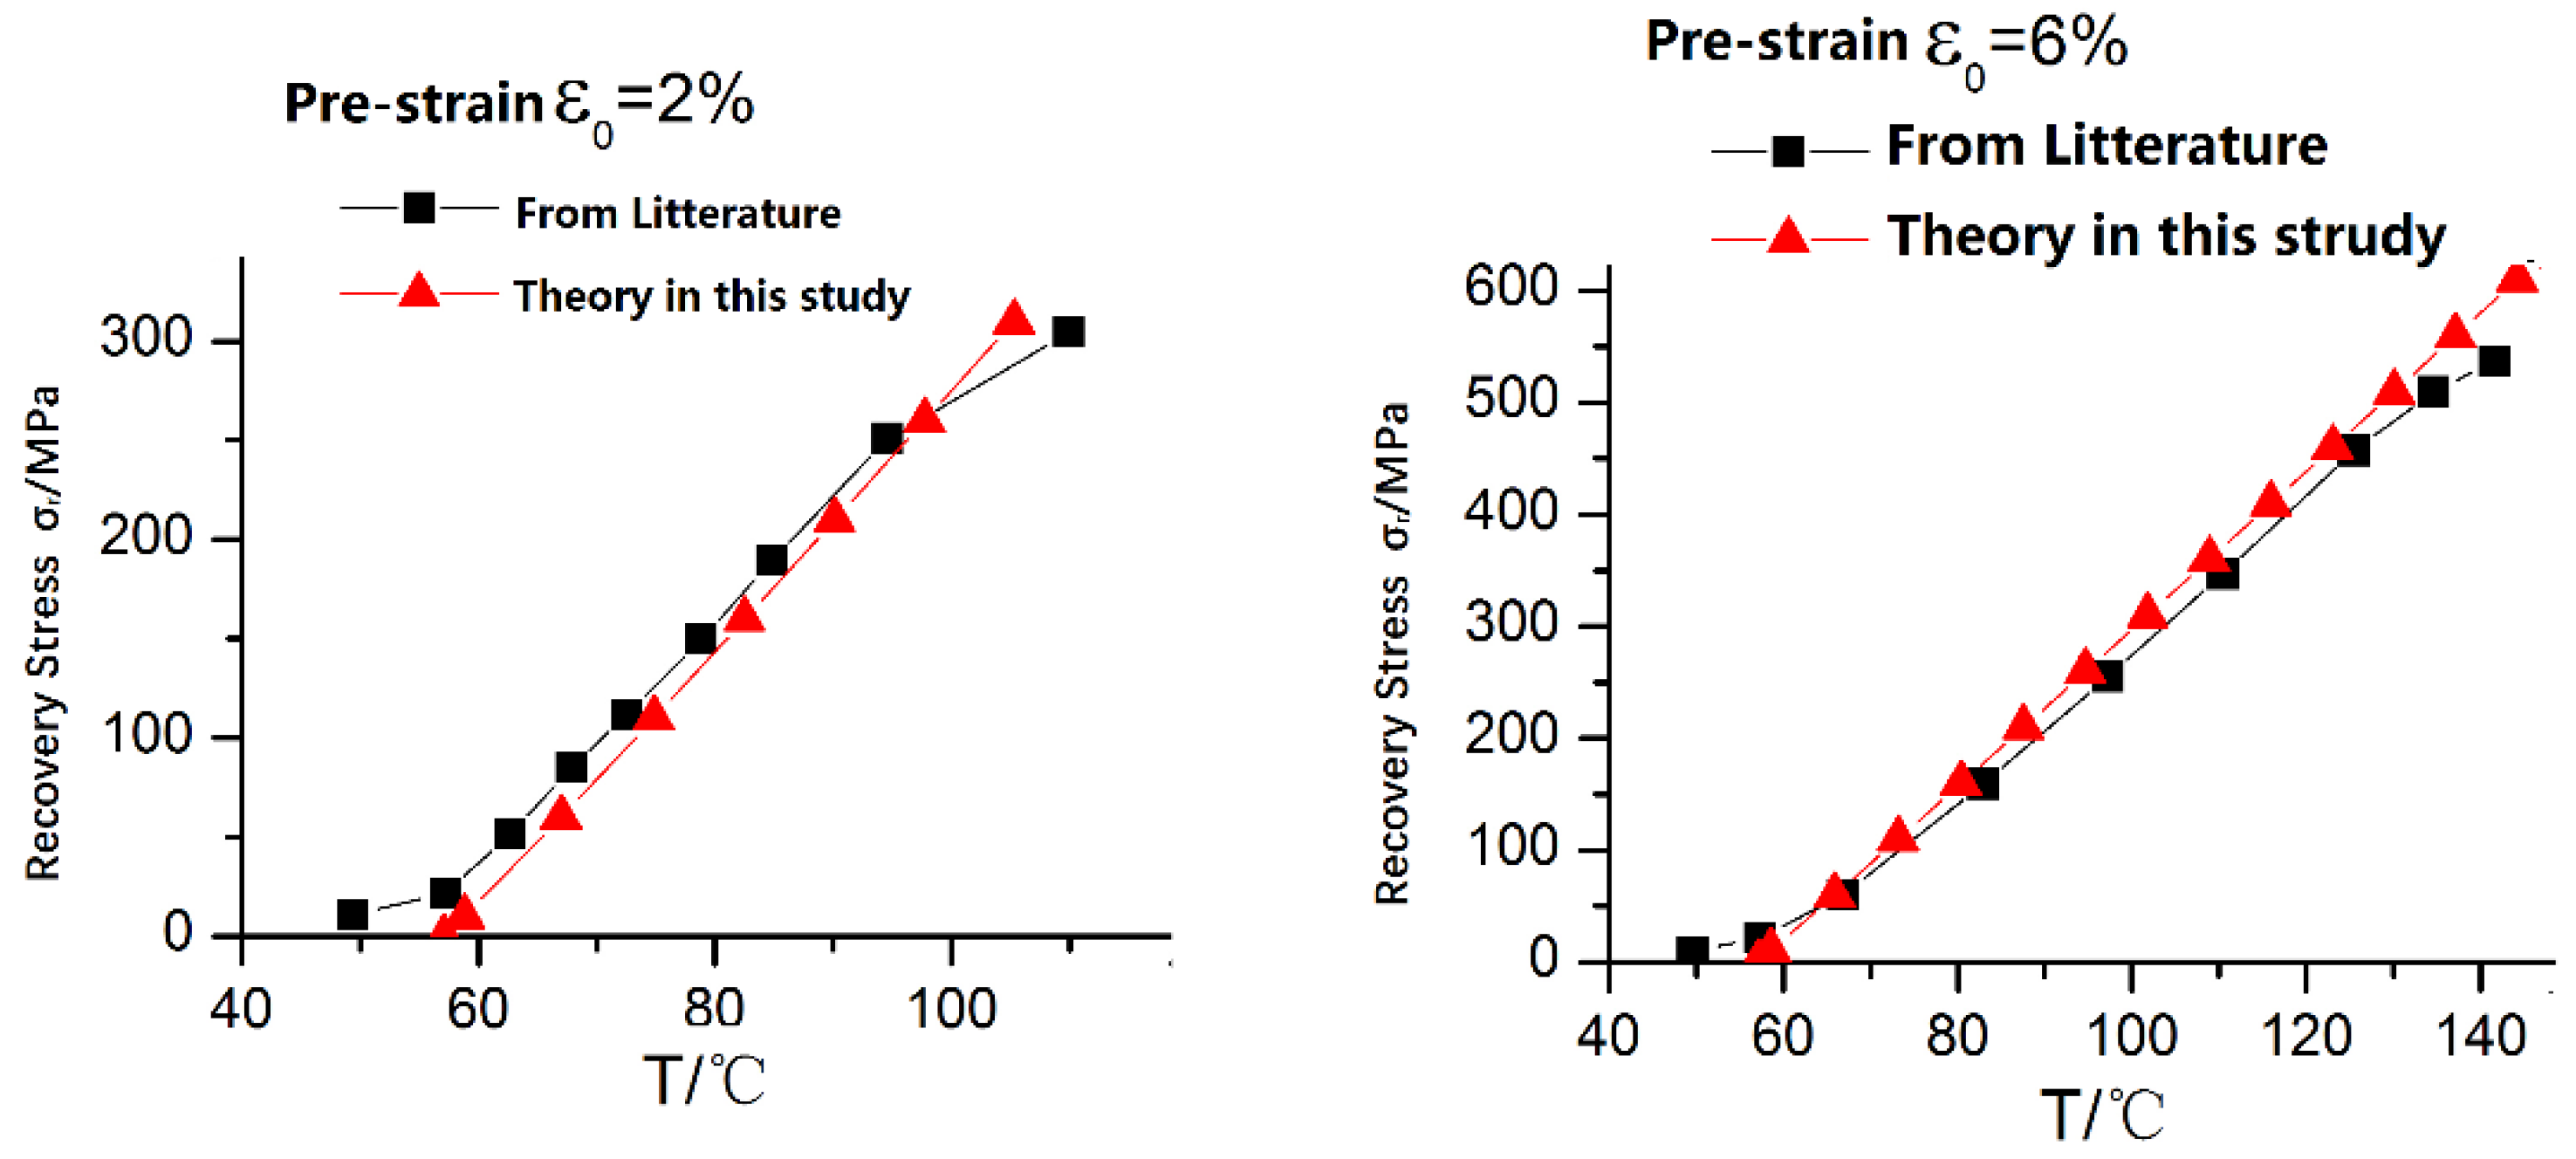
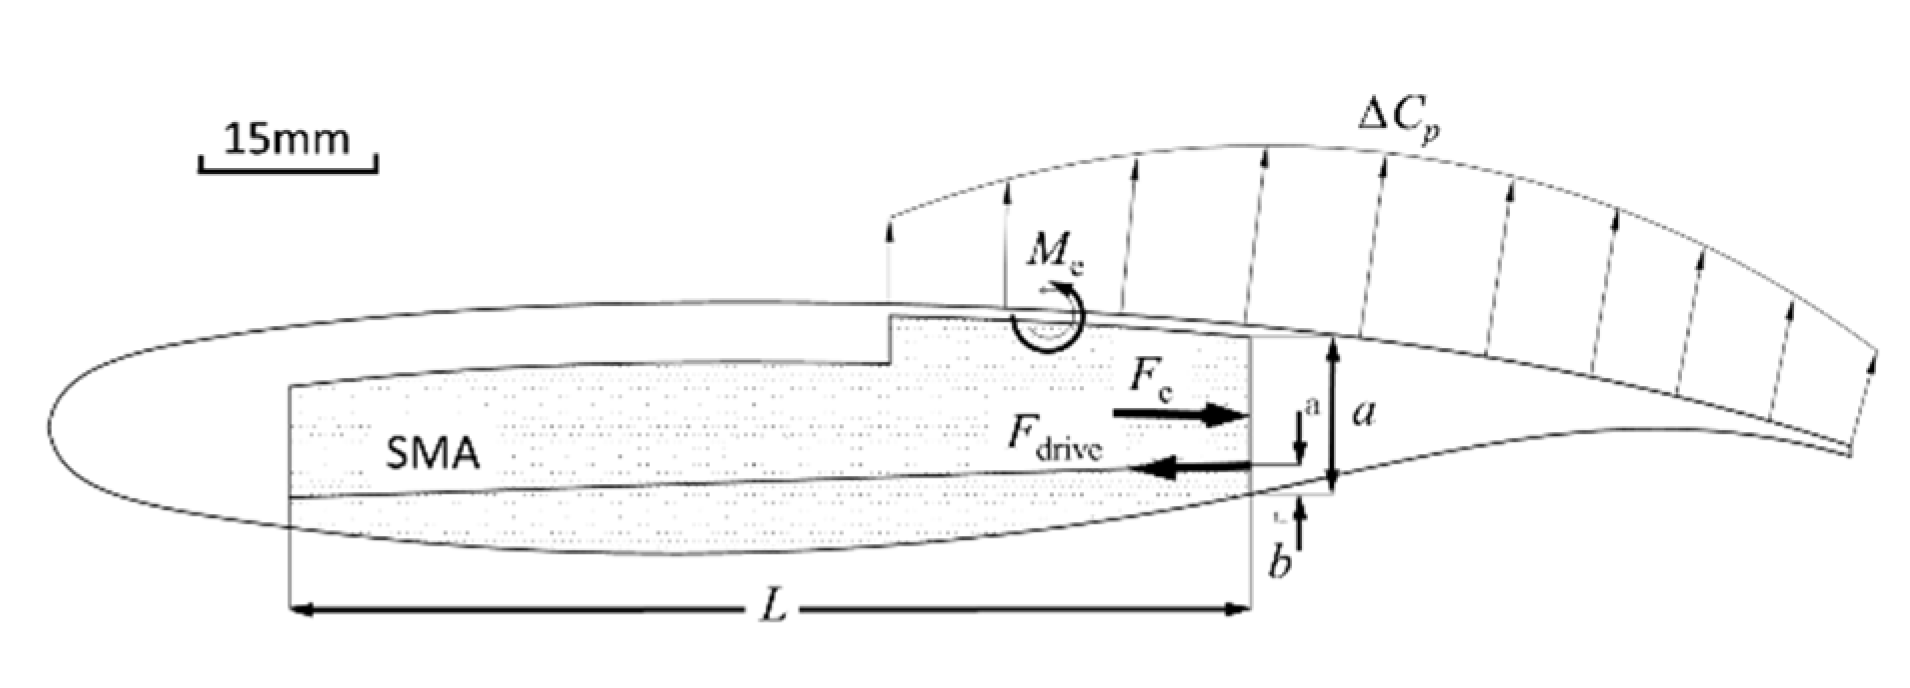
2.1. Theoretical Model of the SMA Actuator

Phase transition would happen when shape memory alloy was heated to a certain temperature. The characteristics of output restoring force and recovery displacement were ideal to be used as smart actuators. Thus, the deformation of supersonic airfoil was driven by an SMA-based actuator. The mechanical model was the basis of SMA application in smart structure designing, which includes constitutive equation and the relationship of recovery stress with temperature and strain.
Simple stress state constitutive equation was obtained based on the basic law of thermodynamics and constraints [17]:
  σ ˙   = E ε ˙ + Ω ξ ˙ + θ T ˙
Here, σ was stress, E is elastic modulus, ε is the strain, Ω is the transformation tensor, θ is the thermos elastic coefficient, ξ is the volume percentage of Martensite, and T is temperature.
Integrating the above equation and ignoring the thermoplastic changing, we can obtain the following:
Ω(ξ) = EA + ξ(EMEA)
Here, EA is elastic modulus of Martensite; ξ is the volume percentage of Martensite and it is the function of temperature and stress state, which is called the Martensite kinetic equation of phase transition.
When transitioning from the Martensite phase to parent phase, the following equation could be expressed [18]:
ξ = ξ M 2 { c o s [ α A ( T A s ) + b A σ ] + 1 }
Conversely, the following equation could be expressed:
ξ = 1 ξ A 2 { c o s [ α M ( T M f ) + b M σ ] + 1 + ξ A 2 }
Here, ξA, ξM is the volume percentage of Martensite at the beginning of phase transition; and aA, bA, aM, and bM are material constants.
When the phase transformation process of shape memory alloy was constrained, it could overcome the constraint and complete the phase transformation recovery. If the constraint was replaced by the loading, the phase transformation process of shape memory alloy would have the driving ability. For engineering applications, it was necessary to obtain the relationship between the recovery stress of SMA and other parameters. At present, the calculation of recovery stress in the current study was based on the constitutive proposed by Tanaka et al. [19].
The relationship between recovery stress (σr) and temperature of shape memory alloy in full constrained state was an important characterization of shape memory alloy driving characteristics. The relationship could be expressed by derivation of the constitutive equation as follows:
A s r < T < A f r ,   σ r σ A s r = Ω 2 { c o s [ α A ( T A S ) + b A σ ] + 1 } Ω 0 + θ ( T A s r )
T = A f r ,   σ A f r σ A s r = Ω 0 + θ ( A f r A s r )
T > A s m ,   σ r σ A s r = θ ( T A f r )
where Asr, Afr are the temperature at phase transition beginning and end, respectively.
Recovery stress at different temperatures obtained from constitutive equations was compared to that obtained from the literature [20]. As can be seen in Figure 1, stress appearance temperature and gradient of stress–temperature curves were consistent with the literature results. However, the maximum recovery stress was not consistent, because the constitutive equation could not simulate maximum recovery stress at different pre-strain. Therefore, the recovery force calculated by the constitutive equation was relatively accurate only in the small pre-strain (less than 2%). If the pre-strain of SMA actuator was large, the relationship between the recovery stress and temperature should be given based on experiment results. It should be noted that, when the shape memory alloy is used repeatedly, the stress should be gradually unloaded during the cooling recovery process, so that the shape memory alloy can accurately return to its original state, so as to ensure the repeatability of the next loading.
External heating SMA wires were applied, which had high efficiency and a uniform heating effect. The relationship between heating current and SMA wire temperature should be defined. The convective and heat conduction model was established according to the convective heat conduct principle [21].
T 1 = i 2 2 4 · ρ 0 ( 1 + α · Δ T ) π 2 d 3 · h 2
Here, i is the current, ρ0 is the conductivity, α is the coefficient of thermal expansion, d is the diameter of enameled SAM wires, and h2 is the coefficient of convective heat transfer.
The simulation shows that the steady-state temperature is only related to the current, and has nothing to do with the wire length.

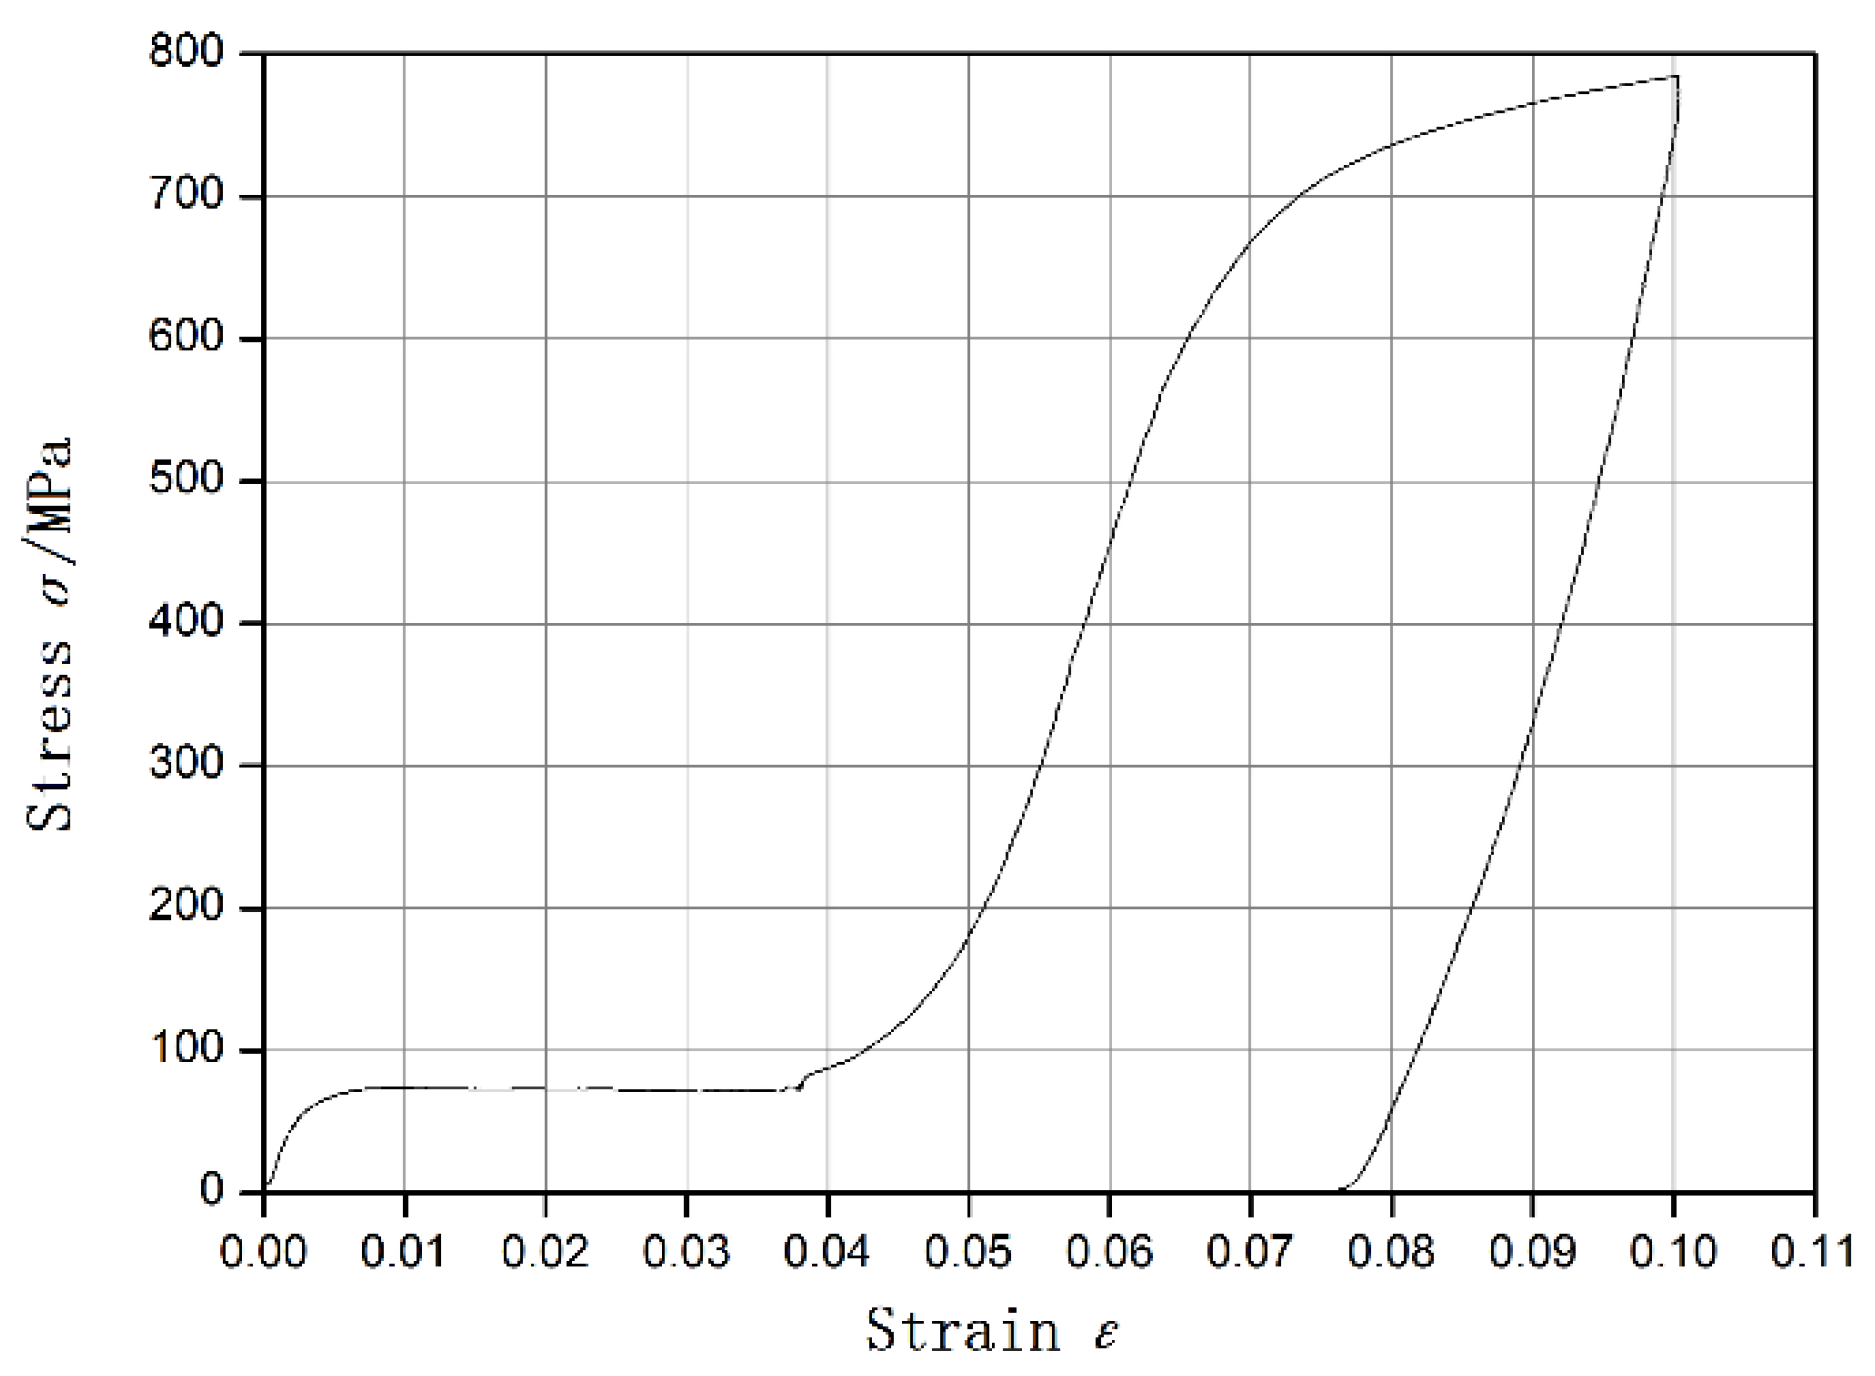
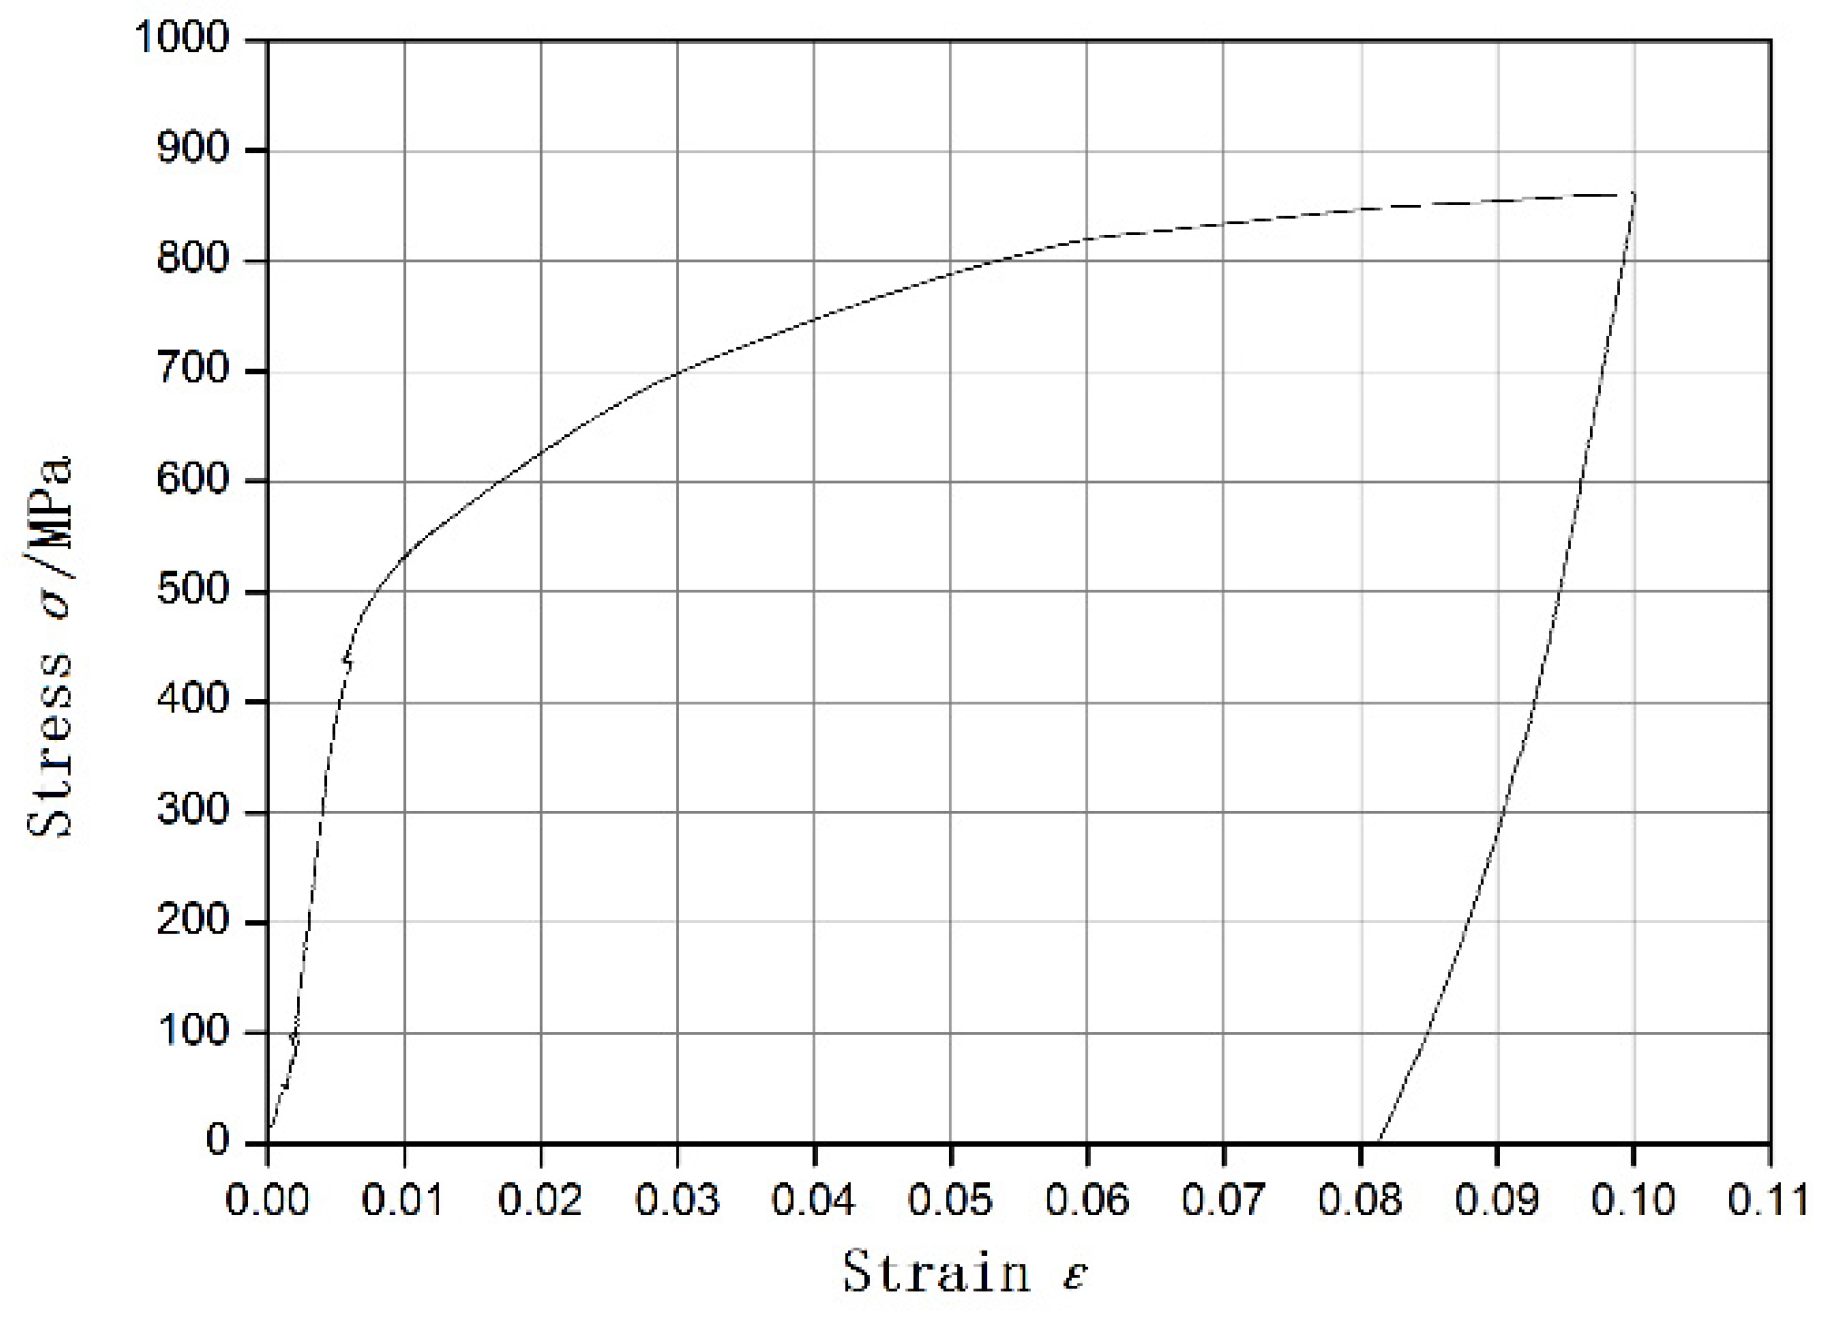
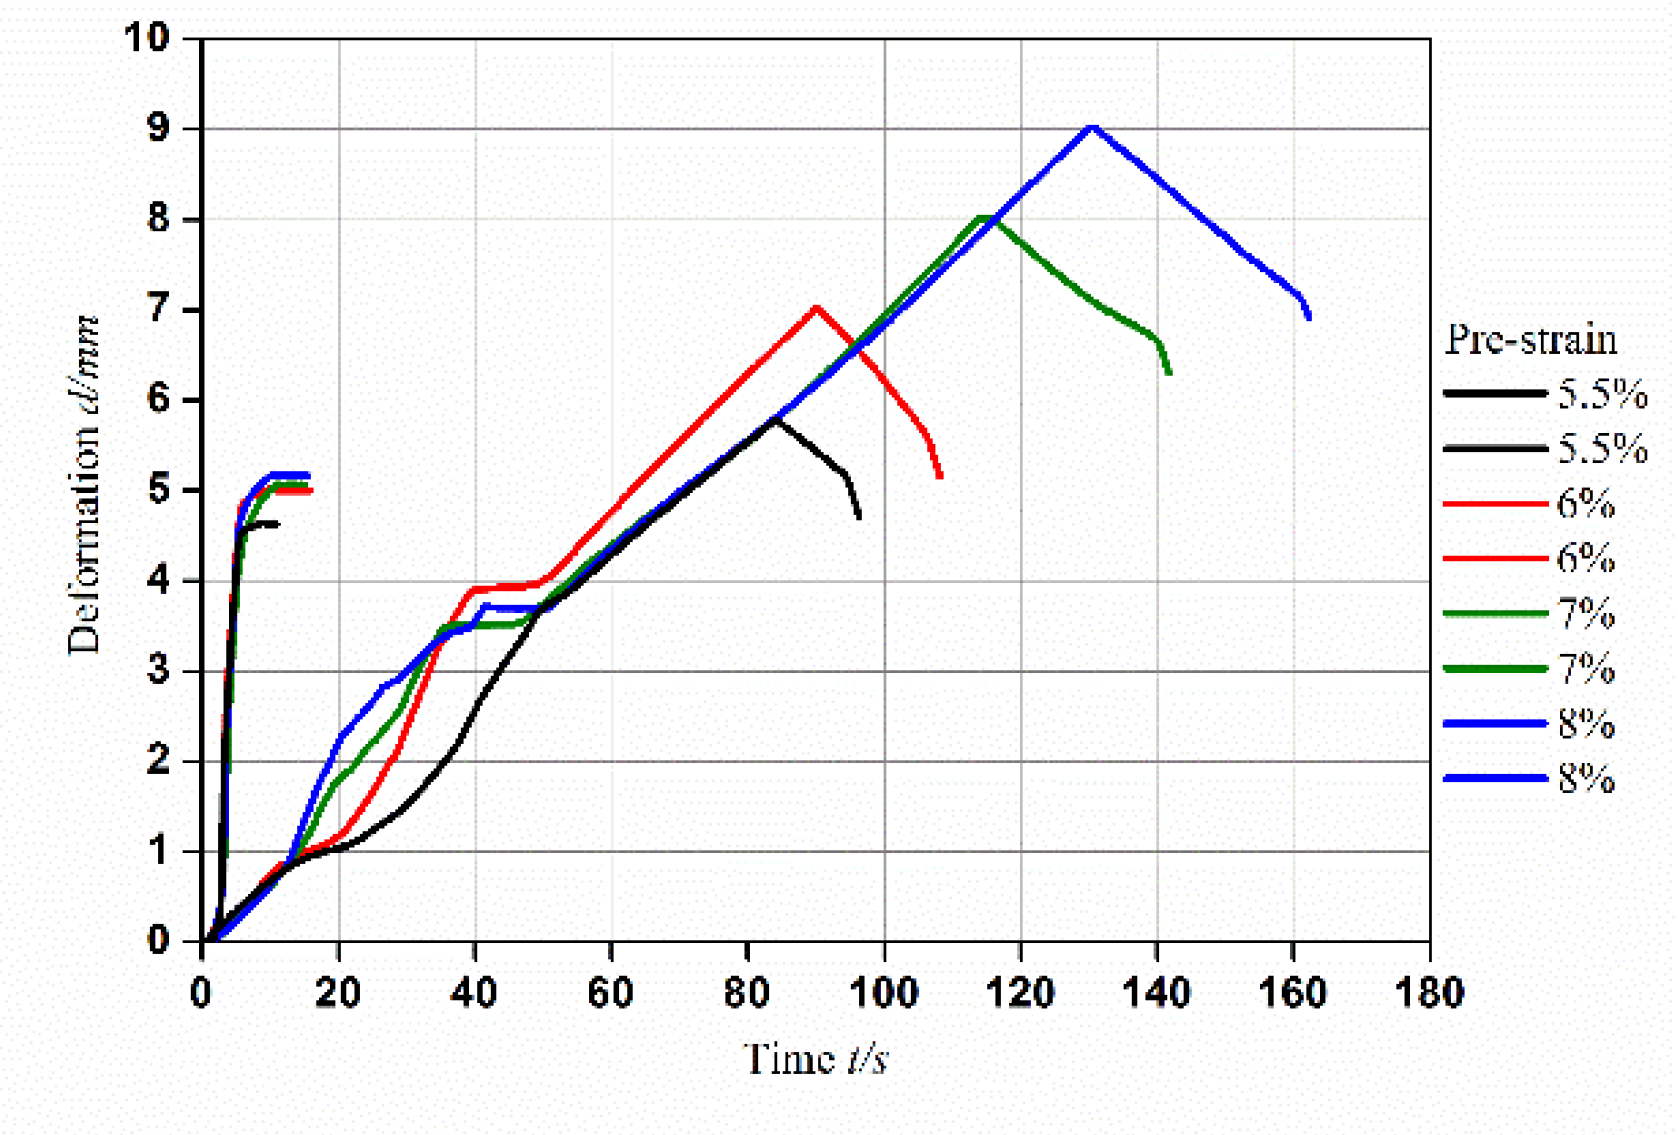
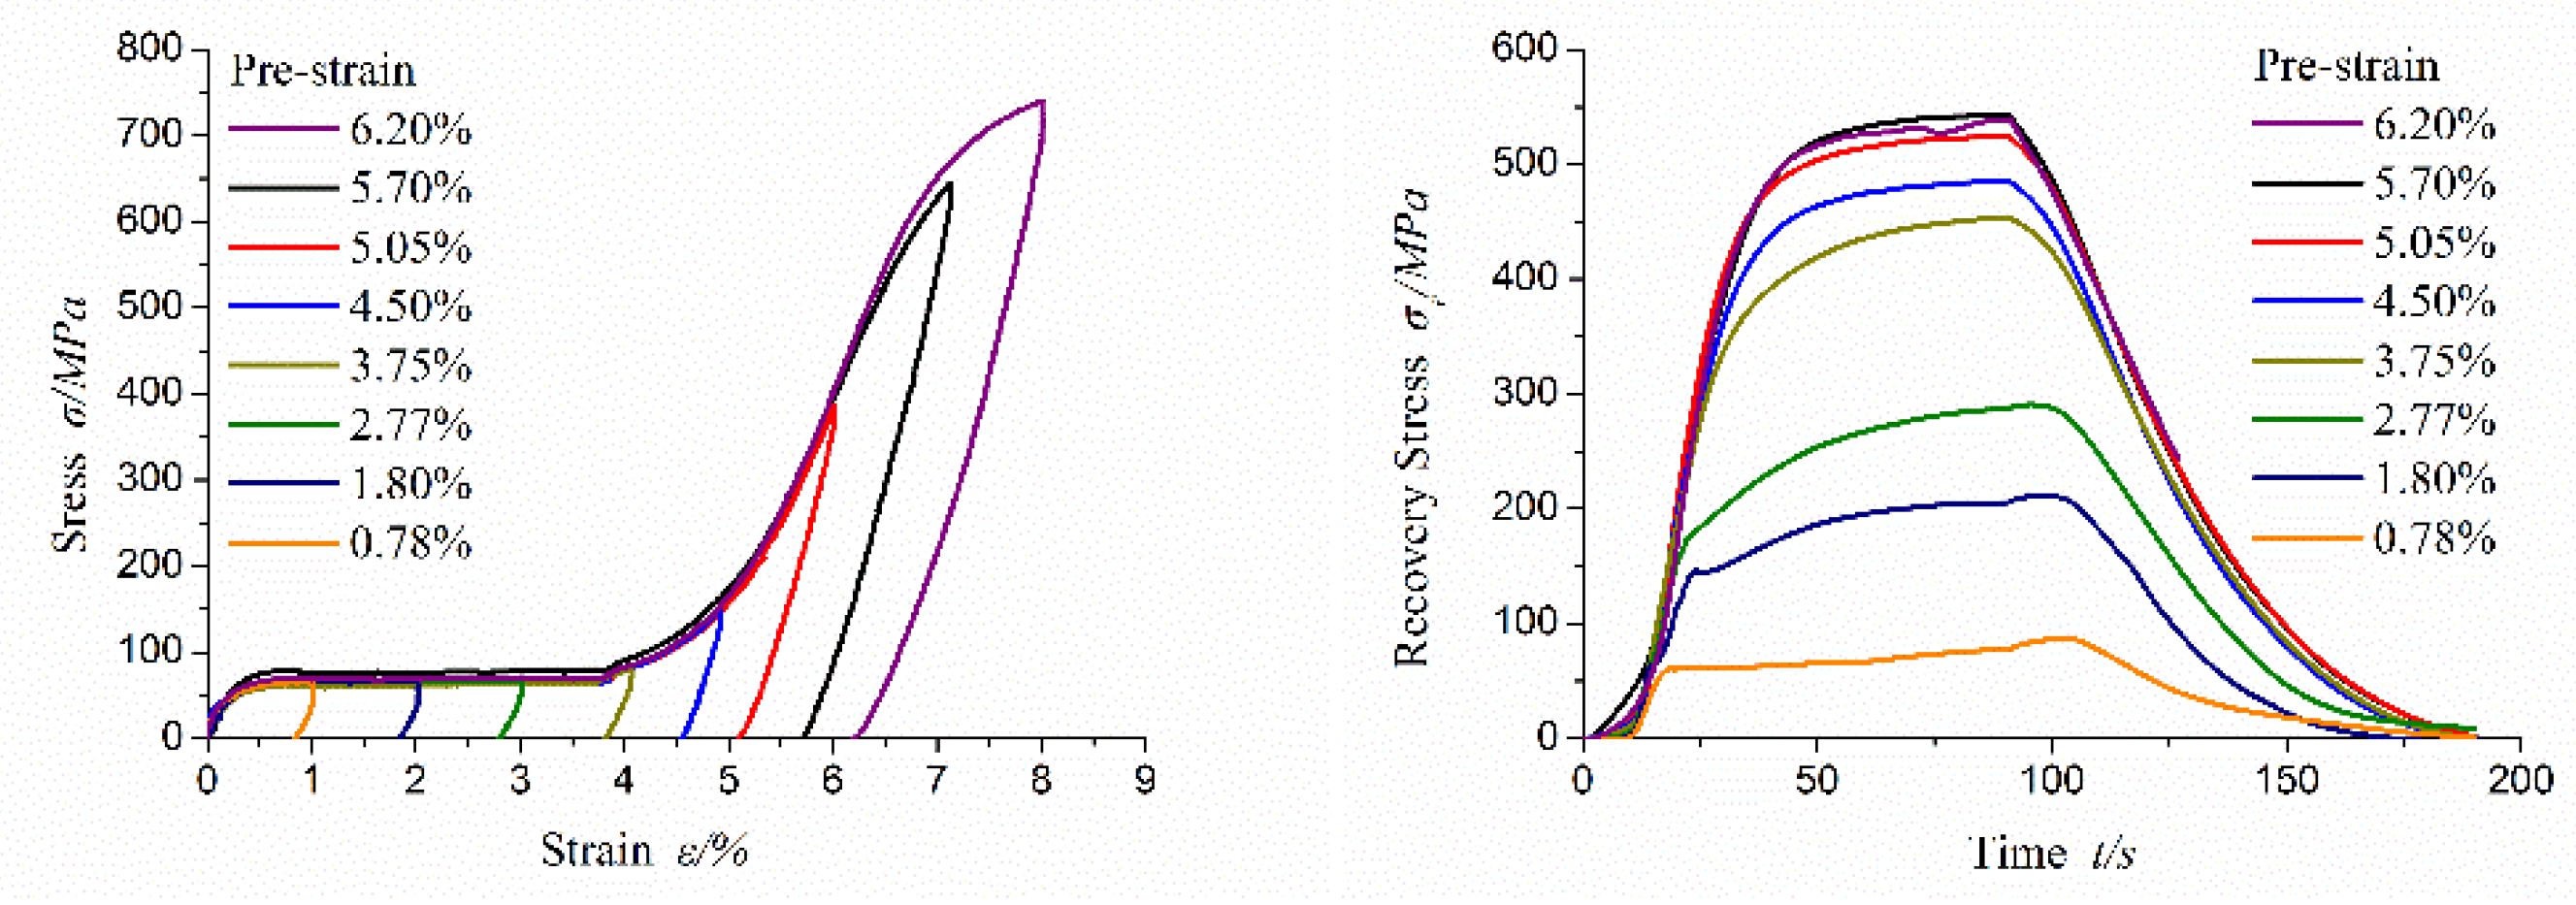
2.2. SMA Performance Test

To design the SMA actuator reasonably, mechanical characteristics must be tested before its applications and the relationship between stress, strain, recovery force, and temperature must be established. Parameters of the SMA materials applied in this project were as follows: Ms = 20 °C, Mf = 9 °C, As = 45 °C, Af = 56 °C. Measurements on the relationship between strain and stress, maximum recovery strain and stress, and response speed under different heating currents were conducted.
The mechanical properties of SMA wire were tested by the CMT6104 electronic universal testing machine.
Figure 2 gives the relationship between strain and stress at ambient environment (18 °C). As can be seen in the figure, elastic modulus in ambient temperature was 19 GPa and the strain versus stress curve showed nonlinear characteristics. The stress–strain curve could be fitted by piecewise polynomial as follows:
{ σ M = 2.709 e 10 3 ε 4.512 e 10 6 ε 2 + 2.564 e 10 8 ε 3 σ M = 59.07 + 179.6 ε σ M = 332.02 + 3.445 e 10 4 ε 1.035 e 10 6 ε 2 + 1.097 e 10 7 ε 3 0 % ε < 0.75 % 0.75 % ε < 3 % 3 % ε
Figure 3 gives the relationship between strain and stress at the high temperature of 56 °C. SMA wires were heated by constant current power (2A) to a constant temperature of 56 °C. As seen in Figure 3, in the first stage, the elastic deformation of the parent phase occurred firstly. Because the elastic modulus of the parent image was larger than that of martensitic, the stress in the first stage rose rapidly and then the stress-induced martensitic elastic modulus decreases gradually, and the curve became smooth.
The driving displacement of SMA actuator should be large enough. It was necessary to measure the maximum recovery strain of SMA wires. The process was as follows. Four SMA wires were chosen as the test samples, and then they were soaked in ice water and boiling water repeatedly to make their performance stable. The SMA wires were stretched to 5.8%, 7%, 8%, and 9%, respectively. The deformation of SMA wires was measured by a large deformation measuring instrument, with the gauge distance of 100 mm and tensile speed of 0.7% per minute. After unloading, four samples with different pre-strain were obtained. The upper end of the wires was installed on the fixture of the drawing machine and the lower end was kept free. The free recovery curve of SMA wire was measured by the large deformation measuring instrument after the wires were electric heated. As can be seen from Figure 4, when the pre-strain exceeded 7%, the twin martensitic reorientation and stress-induced martensitic transformation of SMA had been completed and the stage of parent phase sliding would happen. During the stage of alma mater, strain would be irrecoverable. The results show that, when the pre-strain exceeds 5.5%, the recovery strain remains unchanged. That is, the maximum recoverable strain is 5.5%.
Recovery force was also tested. As can be seen in Figure 5, under the same heating current, the rising speed of the recovery stress and the time required to reach the maximum value were basically the same, and the response time of the maximum recovery stress was about 50 s. The experimental results showed that the recovery stress of SMA increased with the increase of pre-strain. When the pre-strain exceeded the maximum recoverable strain, the recovery stress remained unchanged. Pre-stain was less than 5% and recovery stress would change linearly with pre-strain. While pre-strain was larger than 5%, the recovery stress tended to be stable with the change of pre-strain, reaching the maximum recovery stress of SMA.
The relationship between recovery strain, temperature, and stress was tested. The results showed that the recovery force of SMA wires with fixed pre-strain decreased with the recovery of strain, which was similar to the change of recovery stress. It was linear in small strain state and nonlinear in large strain state. The recovery force derived from the Tanaka series model was only accurate at small strain, and SMA was often used at large strain and large recovery stress. Thus, the restoring force model of SMA under the maximum strain state was determined by fitting the experiment results.
σ r = ( 9561.7 · ε 0 + 150020.9 · ε 0 2 2615844.6 · ε 0 3 ) × T 9.282 T 9.282 + 35.043 9.282 × ε 2.466 ε 2.466 + 0.0229 2.466

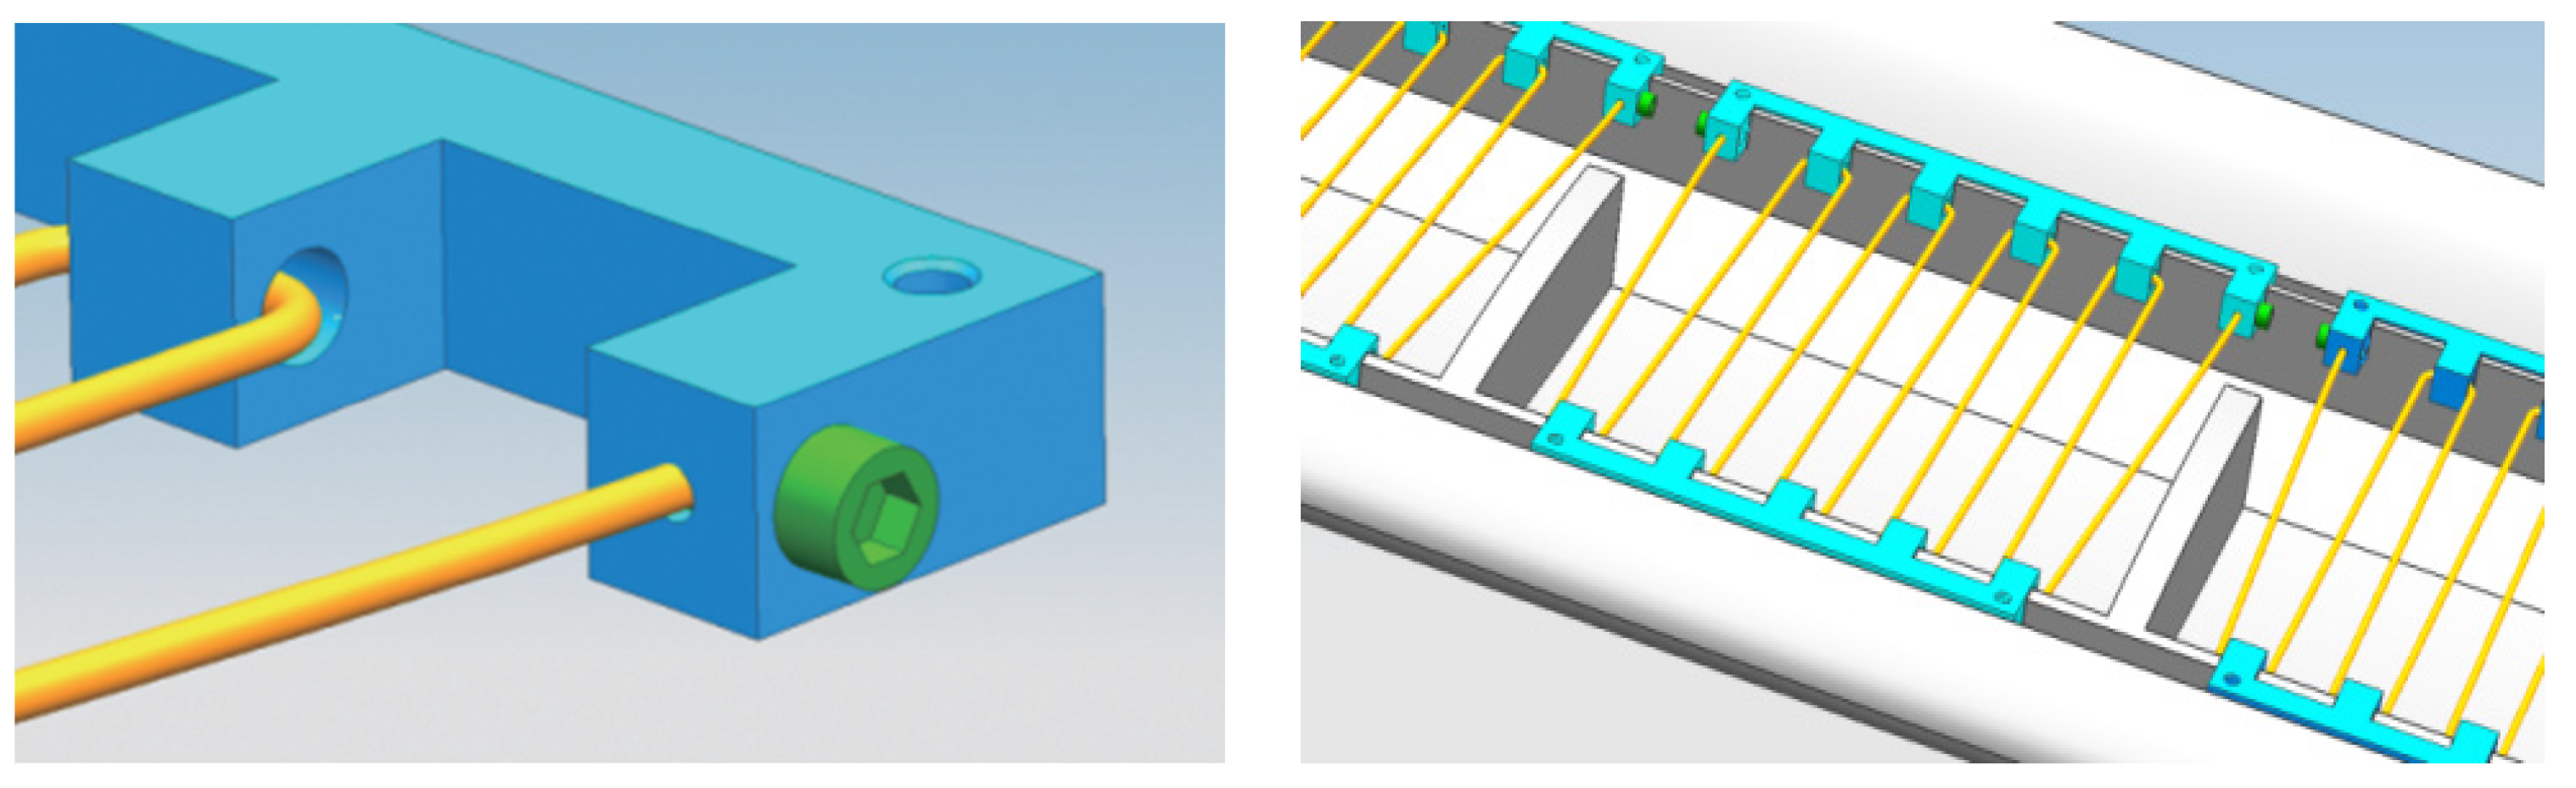
3. Design of the Smart Structure

A super critical airfoil NASA sc-0714 (2) was chosen as the study objective. The span of the test model was 365 mm, and its chord was 150 mm. Deformation of the airfoil was realized by trailing edge deflection actuated by SMA wires.
The trailing edge of the airfoil deflection was realized by a specially designed flexible cantilever beam, which was designated with a flexible joint. In the flexible cantilever beam design scheme, drive force provided by SMA wire is the function of strain, temperature, and pre-strain. Aerodynamic force is the function of airfoil profile. Structure elastic force is comprised by the flexible joint and filler tension (Figure 6).
Owing to the small curvature of the airfoil profile near the flexible joint, the restore moment of the flexible joint was analyzed with simplified horizontal cantilever beam static model, by which the deflection can be expressed as follows:
M e [ x , y ( x ) ] = E I x d 2 y d x 2 [ 1 + ( d y d x ) 2 ] 3 2 E I x d 2 y d x 2
Here, EIx is the stiffness of the flexible joint, l is its width, and x ∈ (0, l) is the horizontal coordinate pointing at the trailing edge.
Flexible joint width and thickness were 30 mm and 1 mm, respectively. These two parameters were chosen according to the effect of flexible joint width and thickness on deflection angle and stress of airfoil trailing edge. Further, a, b is the force arm length from the driving force acting point to the cantilever beam end point of the flexible joint; the dimensions of a and b are 13.3 mm and 3.7 mm, respectively.
One cantilever beam type of deflection structure driven by SMA wire was designed. The SMA wires were bound and fixed on the dentate connectors inside the model (Figure 7). SMA wires were arranged per 15 mm along the model span for the convenience of the model assembly. Its diameter is 1 mm. SMA wire was heated by enameled wires. The heating current is 2.5 A supplied by a constant current power source, and the corresponding temperature is about 60 °C. Deflection was controlled by a power switch and the wires were cooled by flow in the wind tunnel. SMA wire was pre-stretched with a 5.6% pre-strain before the installation, and certain preload was retained. Cavity on low surface was filled with glass glue and model profile was maintained after the installation of drive mechanism.
The relationship between trailing edge and temperature/pre-strain should be considered after the flexible joint dimension was chosen. At present, the finite element modeling method of SMA to express the relationship between restore/elastic modulus and SMA wire temperature was to introduce “negative thermal strain coefficient” or “negative thermal expansion coefficient”. The finite element model would be resolved after temperature load was applied.
Displacements of the airfoil trailing edge at different temperatures are given in Figure 8. Displacement of the trailing edge increased from 2.69 to 8.28 mm, while the wire temperature increased from 31 °C to 32 °C, as the restoring stress would increase rapidly when the SMA phase transformation began. However, when phase transformation finished, the restoring force tended to be constant. Phase transformation was accomplished when the temperature exceeded 58 °C, after which the trailing edge displacement increased very slowly.
Finite element analysis showed that restoring stress at the cross section of a flexible joint would reach a maximum value of 1052 MPa with the temperature increase. When SMA wire was heated from 31 °C to 32 °C, the stress output by SMA wire would be increased from 86.9 Mpa to 260 Mpa. Further, the stress would be 467 Mpa when the SMA wire was heated to 66 °C.
The airfoil cross-section configuration was measured with a three-dimensional measuring machine (type: HREA24.10.9, made in Italy Coord3company) to verify the flexible joint deflection ability (Figure 9). The results showed that airfoil profile was changed smoothly during the deflection, resulting in the maximum trailing edge displacement to 9.65 mm and the trailing edge deflection angle to 10.9°, which were both relative to its original position. Compared with the finite element analysis results, there was a maximum displacement difference of about 5.75 mm owing to the obstruction from filler viscosity and expansion. Additionally, the fillers might affect the airfoil profile and its lower surface continuity. However, no special treatment has been made because of the weak impact on aerodynamics.

4. Effects of the Airfoil Trailing Edge Deflection on the Aerodynamic Characteristics

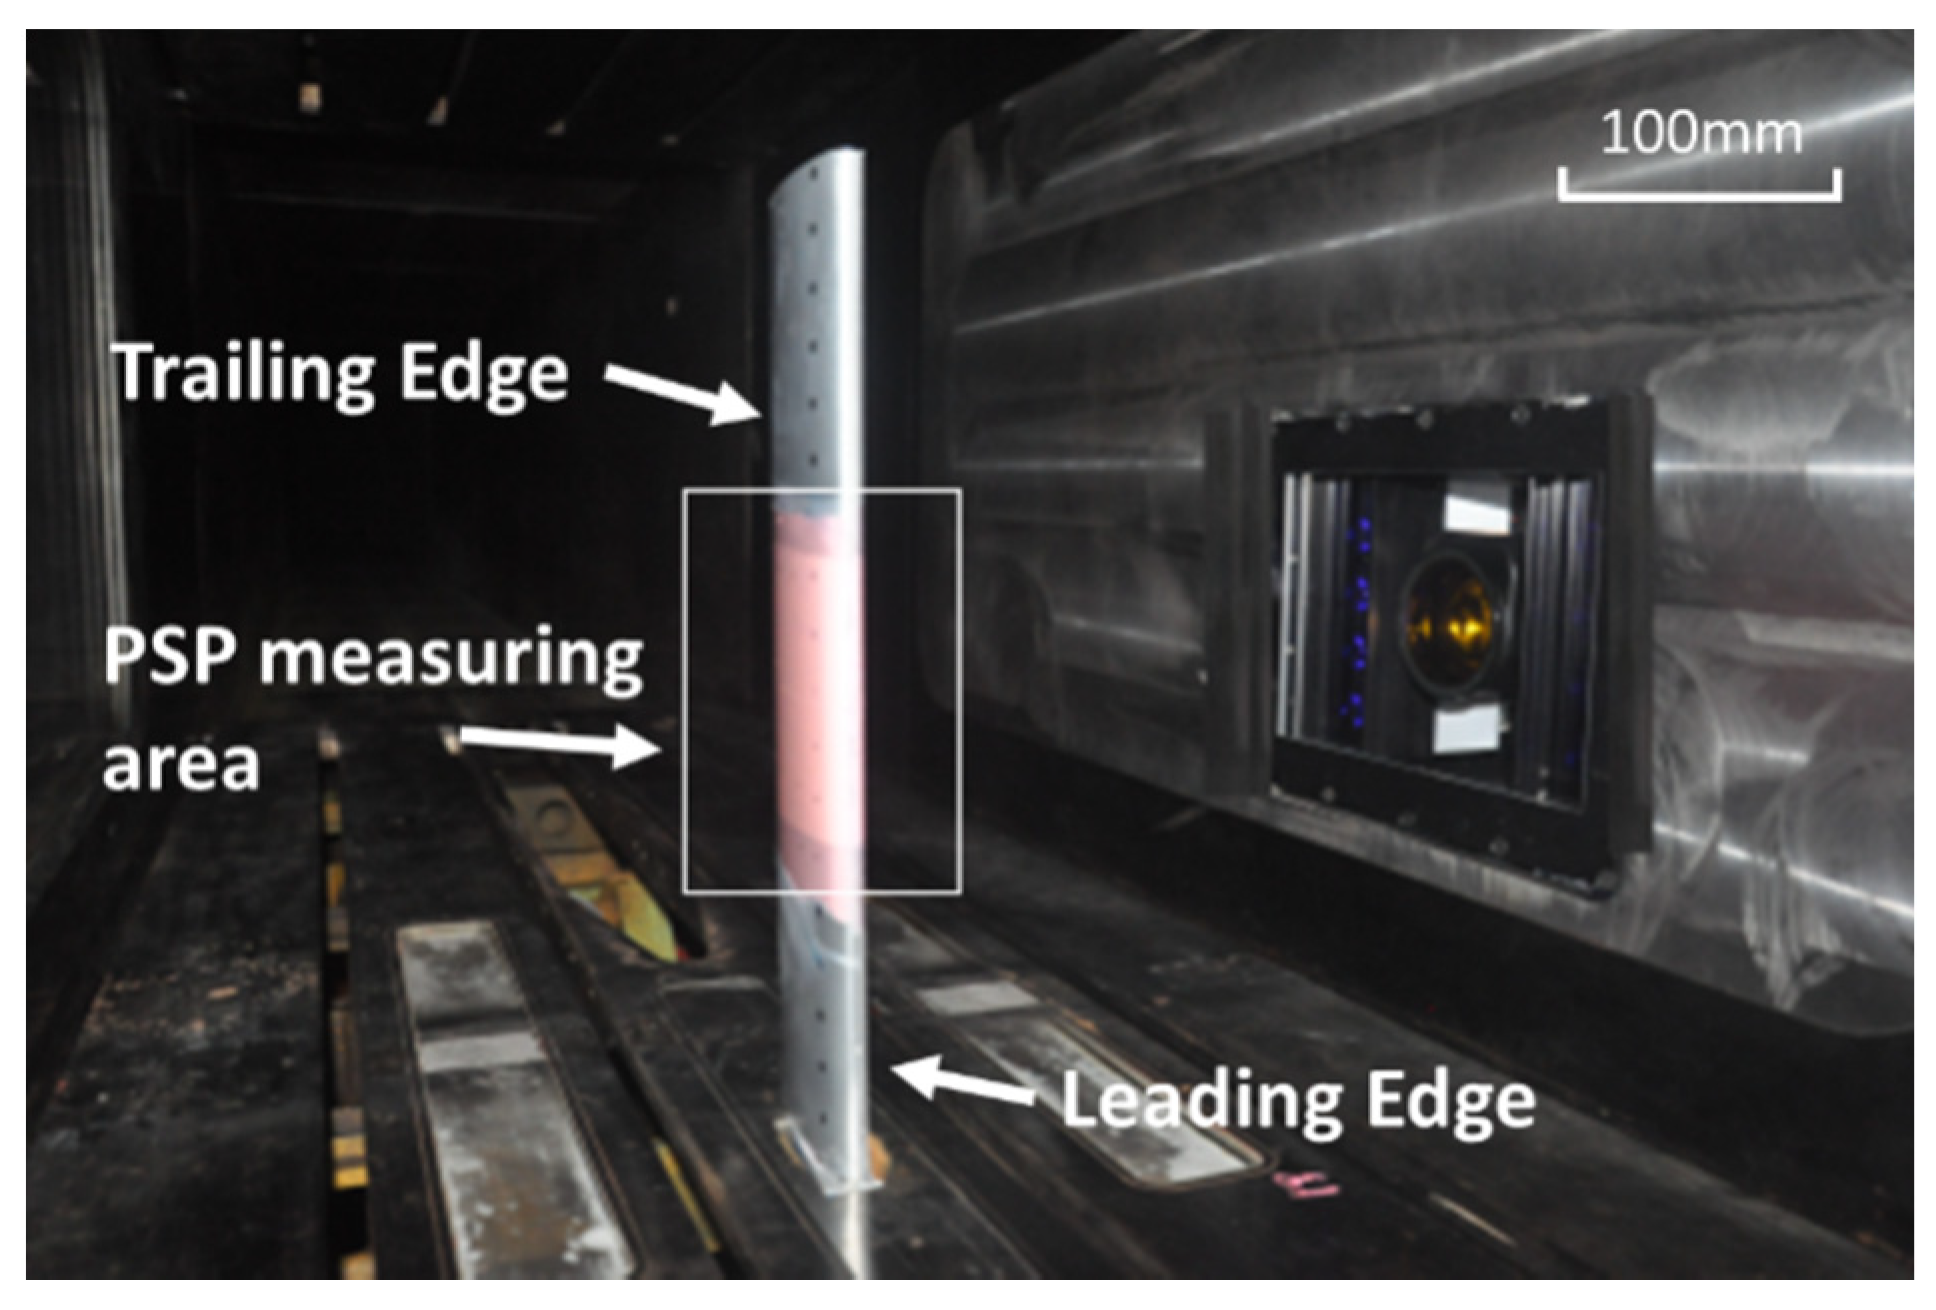
4.1. Test Facilities
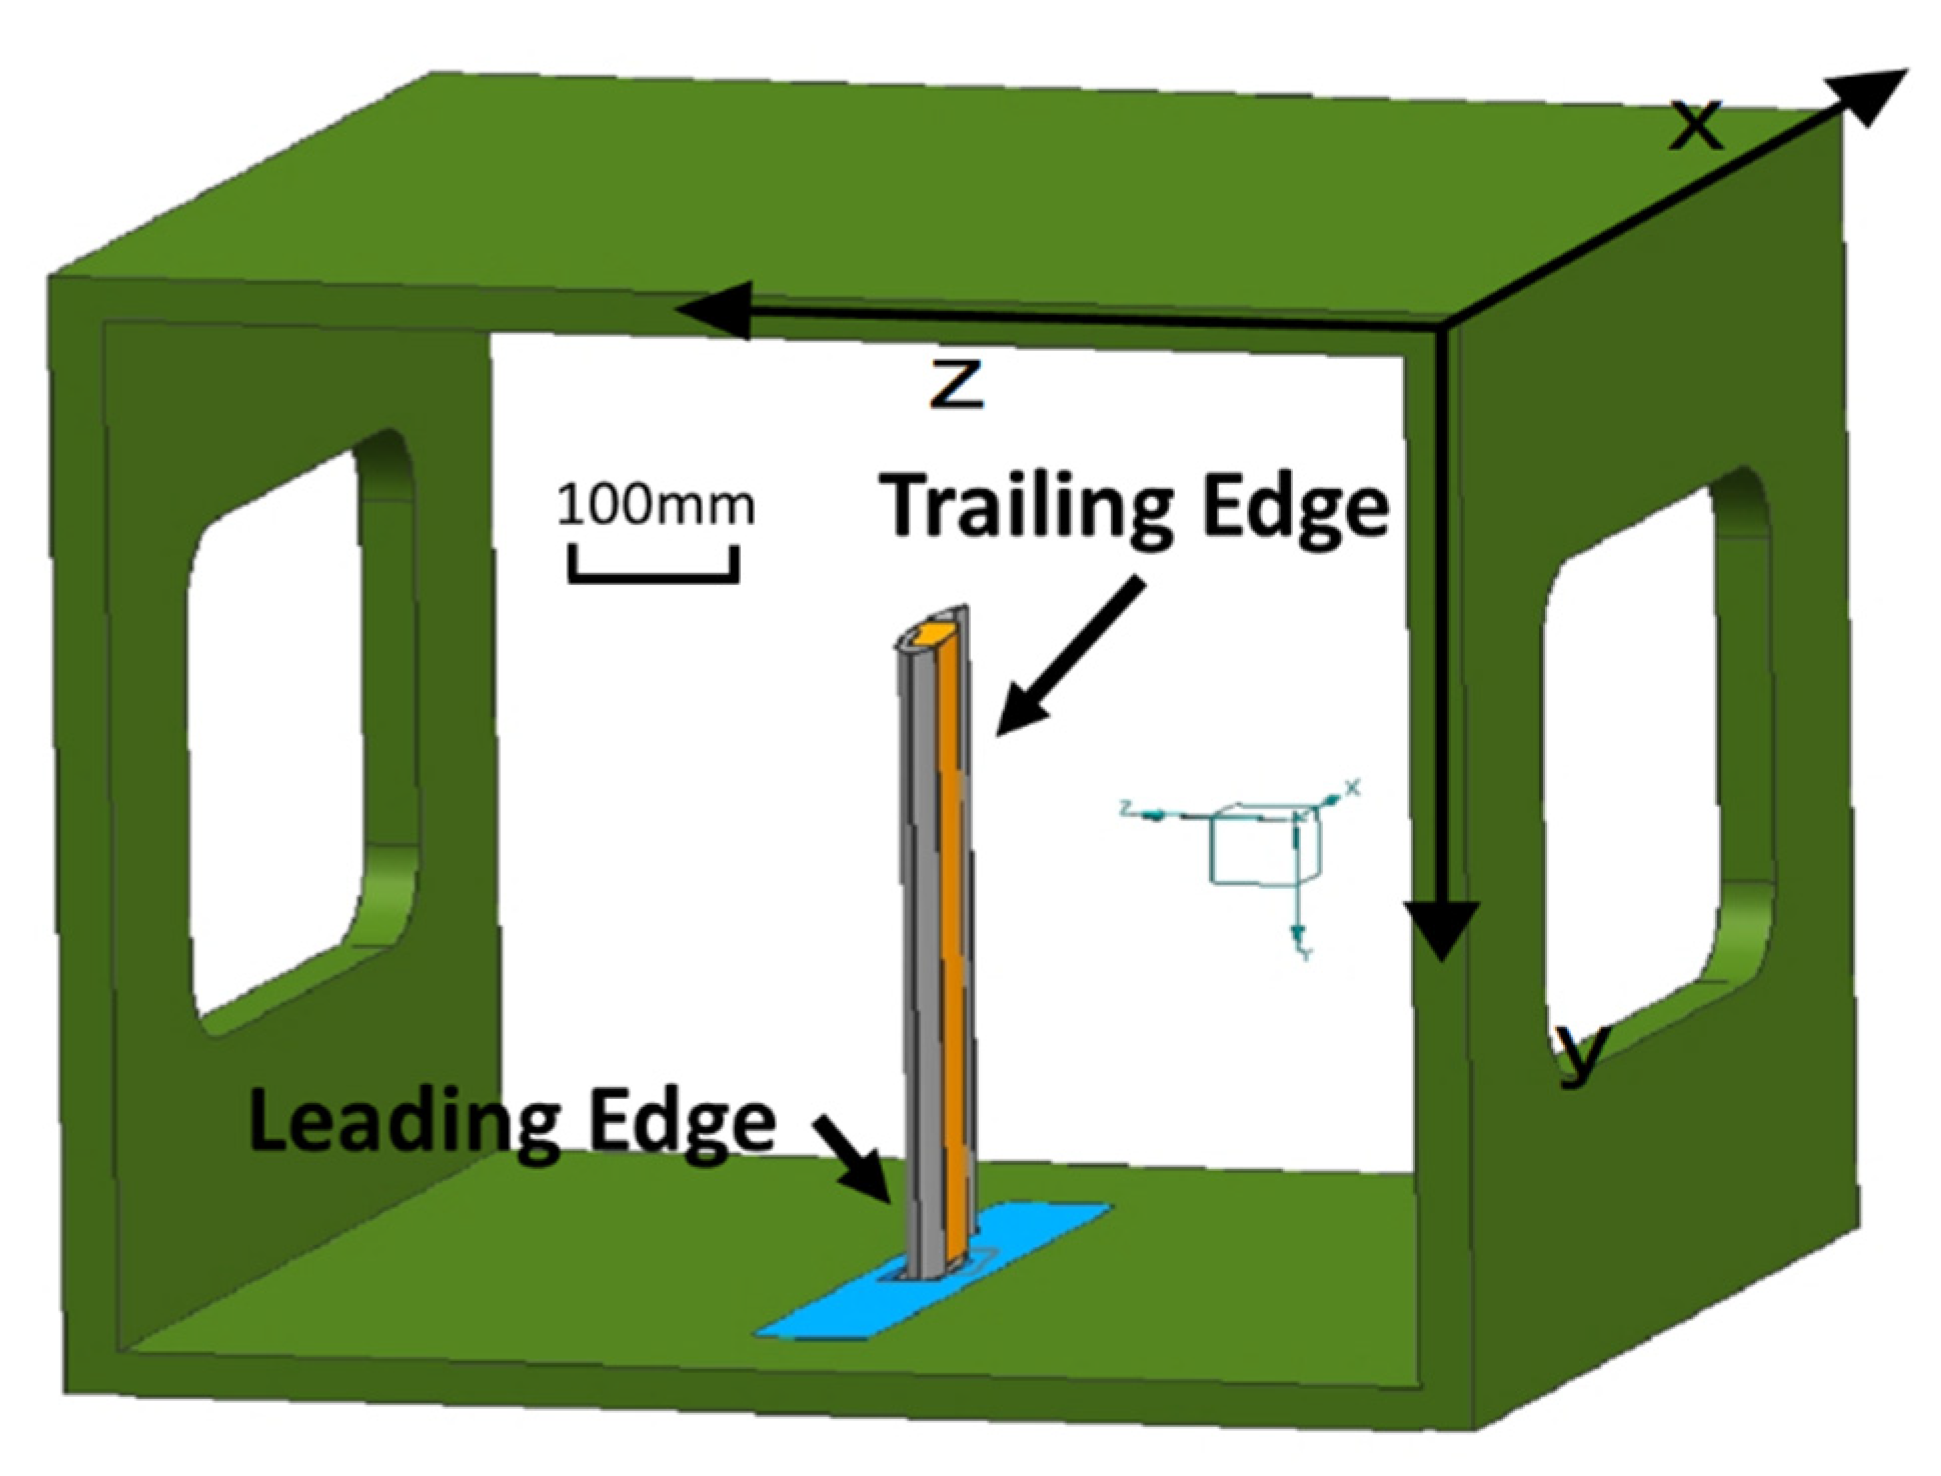
The experiment was conducted in a transonic wind tunnel and its Mach number ranged from 0.4 to 3.5. The cross test section size was 0.6 m × 0.6 m. The upper and lower wall of test section was slotted. The side-walls were solid with rectangular optical windows for VMD (video grammetric model deformation) and PSP (pressure-sensitive paint) measurements. The model and its relative location in the test section are shown in Figure 10.

4.2. Model Setup

The model was designed based on a super-critical airfoil; the length of the wing span was 365 mm and that of the chord was 150 mm. The distance from the wing tip to the ceiling was 235 mm. Block of the model at 0 angle is about 2 percent. The coordinate obeys the right hand rule with the x-axis pointing to the flow direction and the y-axis pointing to the lower wall (Figure 11). The trailing edge of the model would be deflected towards the z-axis (normal coordinate) in the xz plane.

4.3. Test Content

Trailing edge deflection and pressure distribution over the airfoil were both measured at different angles of attack. Trailing edge deflection angles were measured with the VMD technique. Pressure distribution was measured with both pressures scanning valve and the PSP technique. Only the upper surface pressure distribution of the model could be obtained with PSP. The test was conducted under the condition of Mach number ranging from 0.4 to 0.8. The pressure was measured at the angles of 0°, 2°, 4°, and 6°, respectively, while the current was kept at 2.5 A.

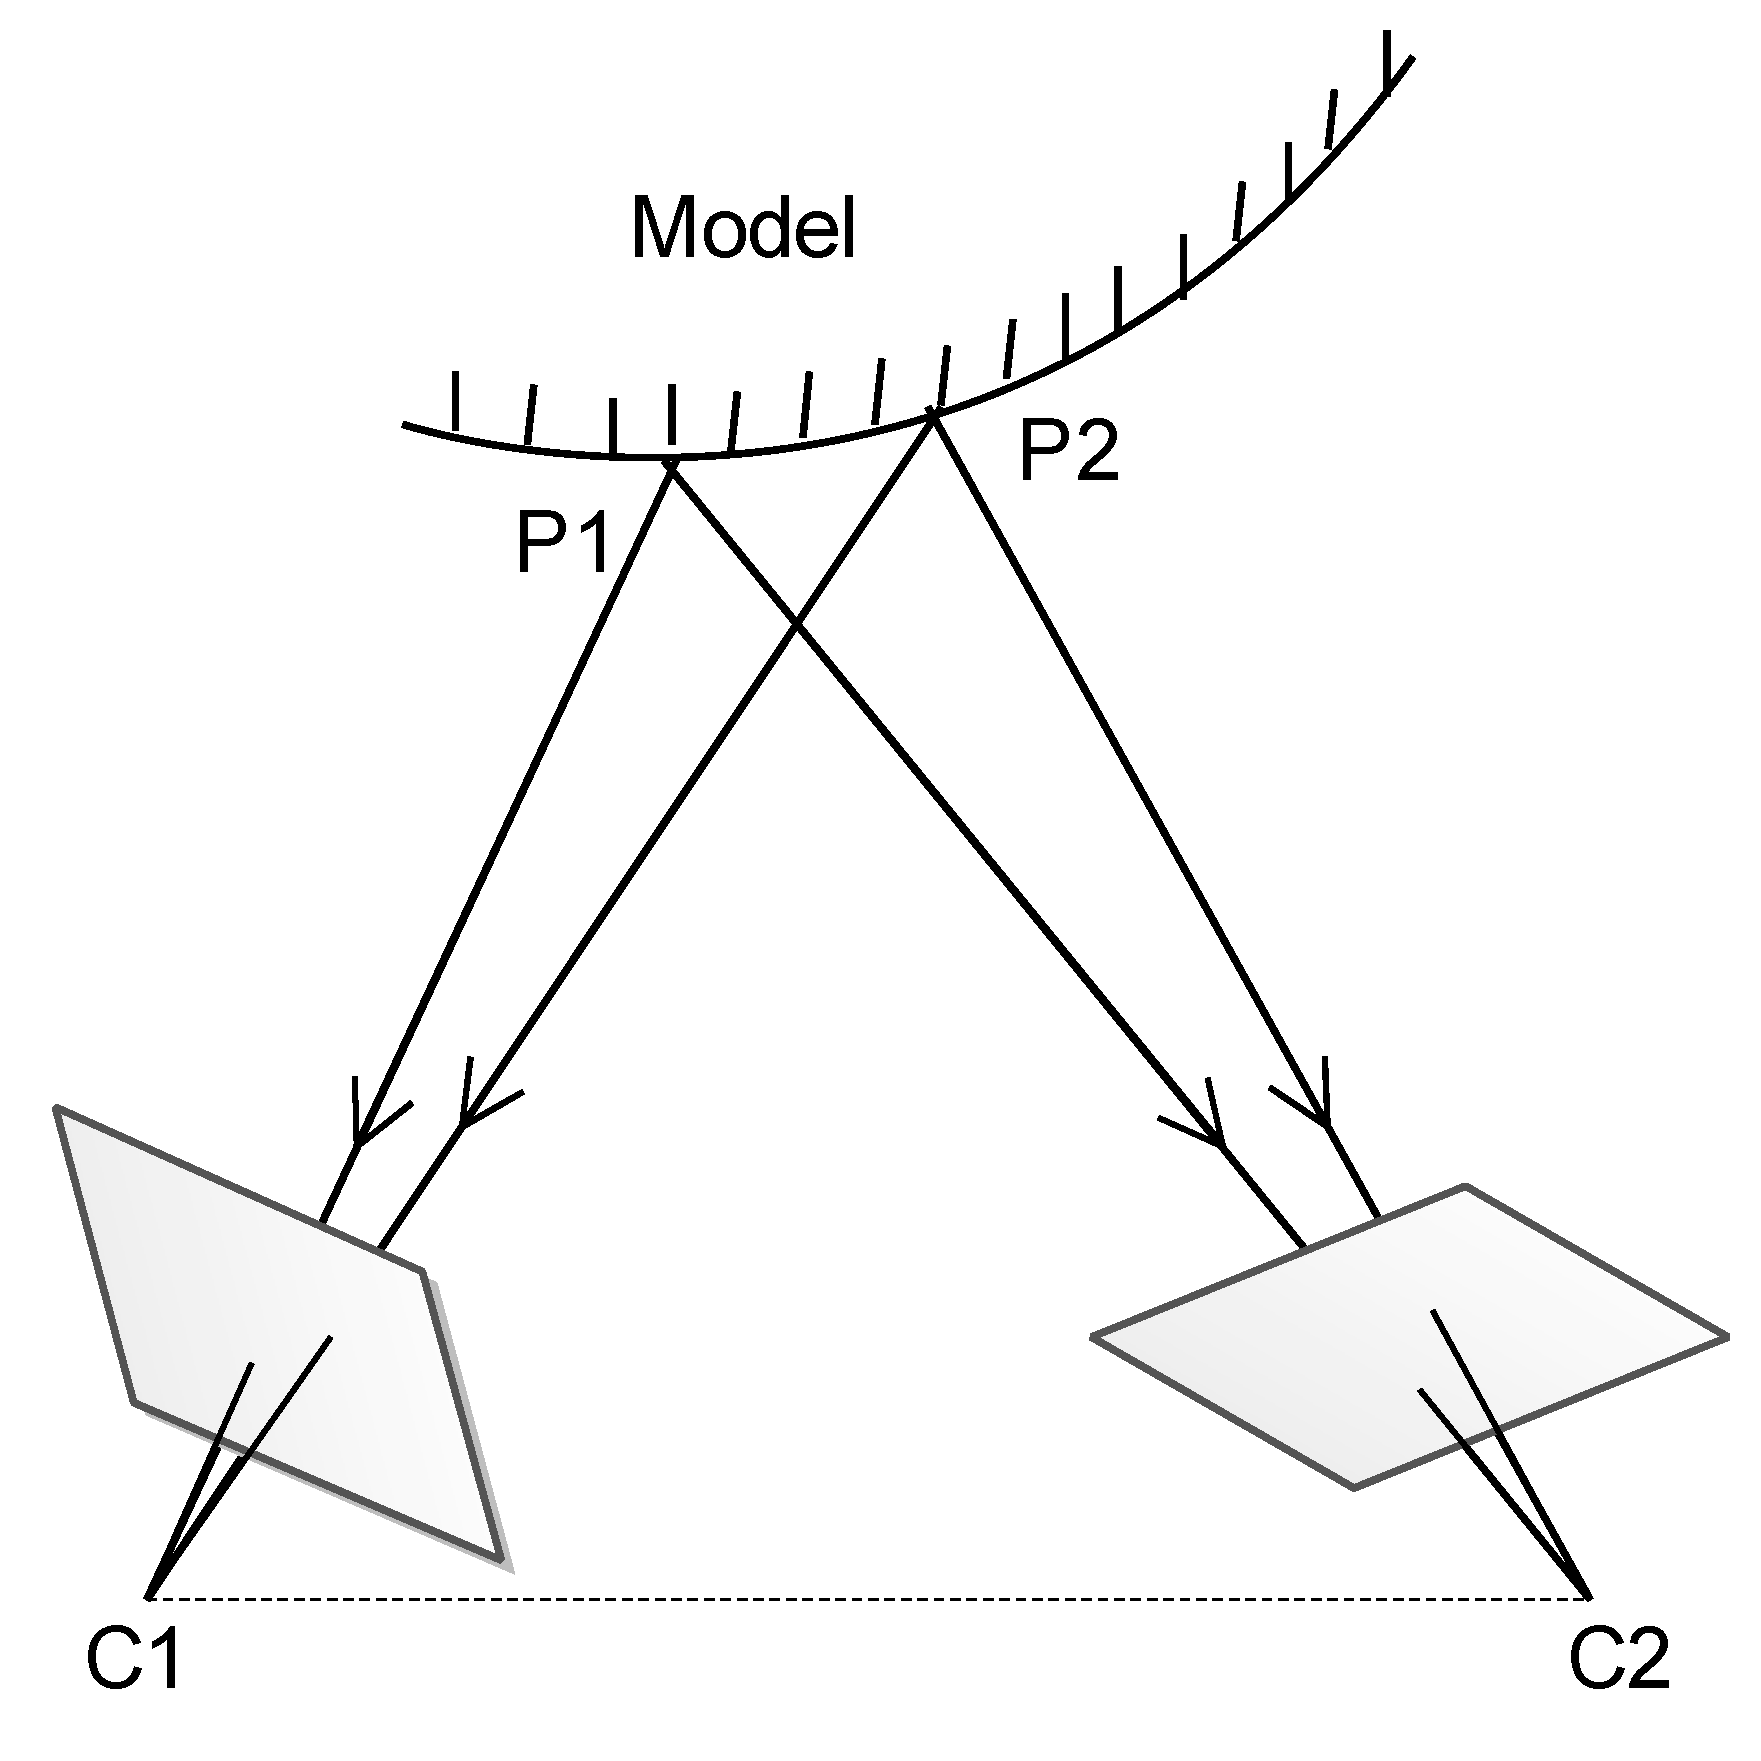
4.4. Instrumentation

DTC Initium pressure scanning modulus was applied to measure the pressure distribution over the model. Deflection angle of the model trailing edge was measured through ascertaining the coordinates of the markers on model surface, which is the principle of the VMD technique (Figure 12). The VMD system was comprised of an industrial camera, industry computer, light source, and markers. Angle measurement precision of the VMD system was 0.01°.
Eighteen groups of markers located on upper surface of the model (Figure 13), denoted by 0 to 17 laterally and 18 to 35 longitudinally. The lateral interval was 20 mm and the longitudinal interval was 5 mm.

4.5. Results and Discussions

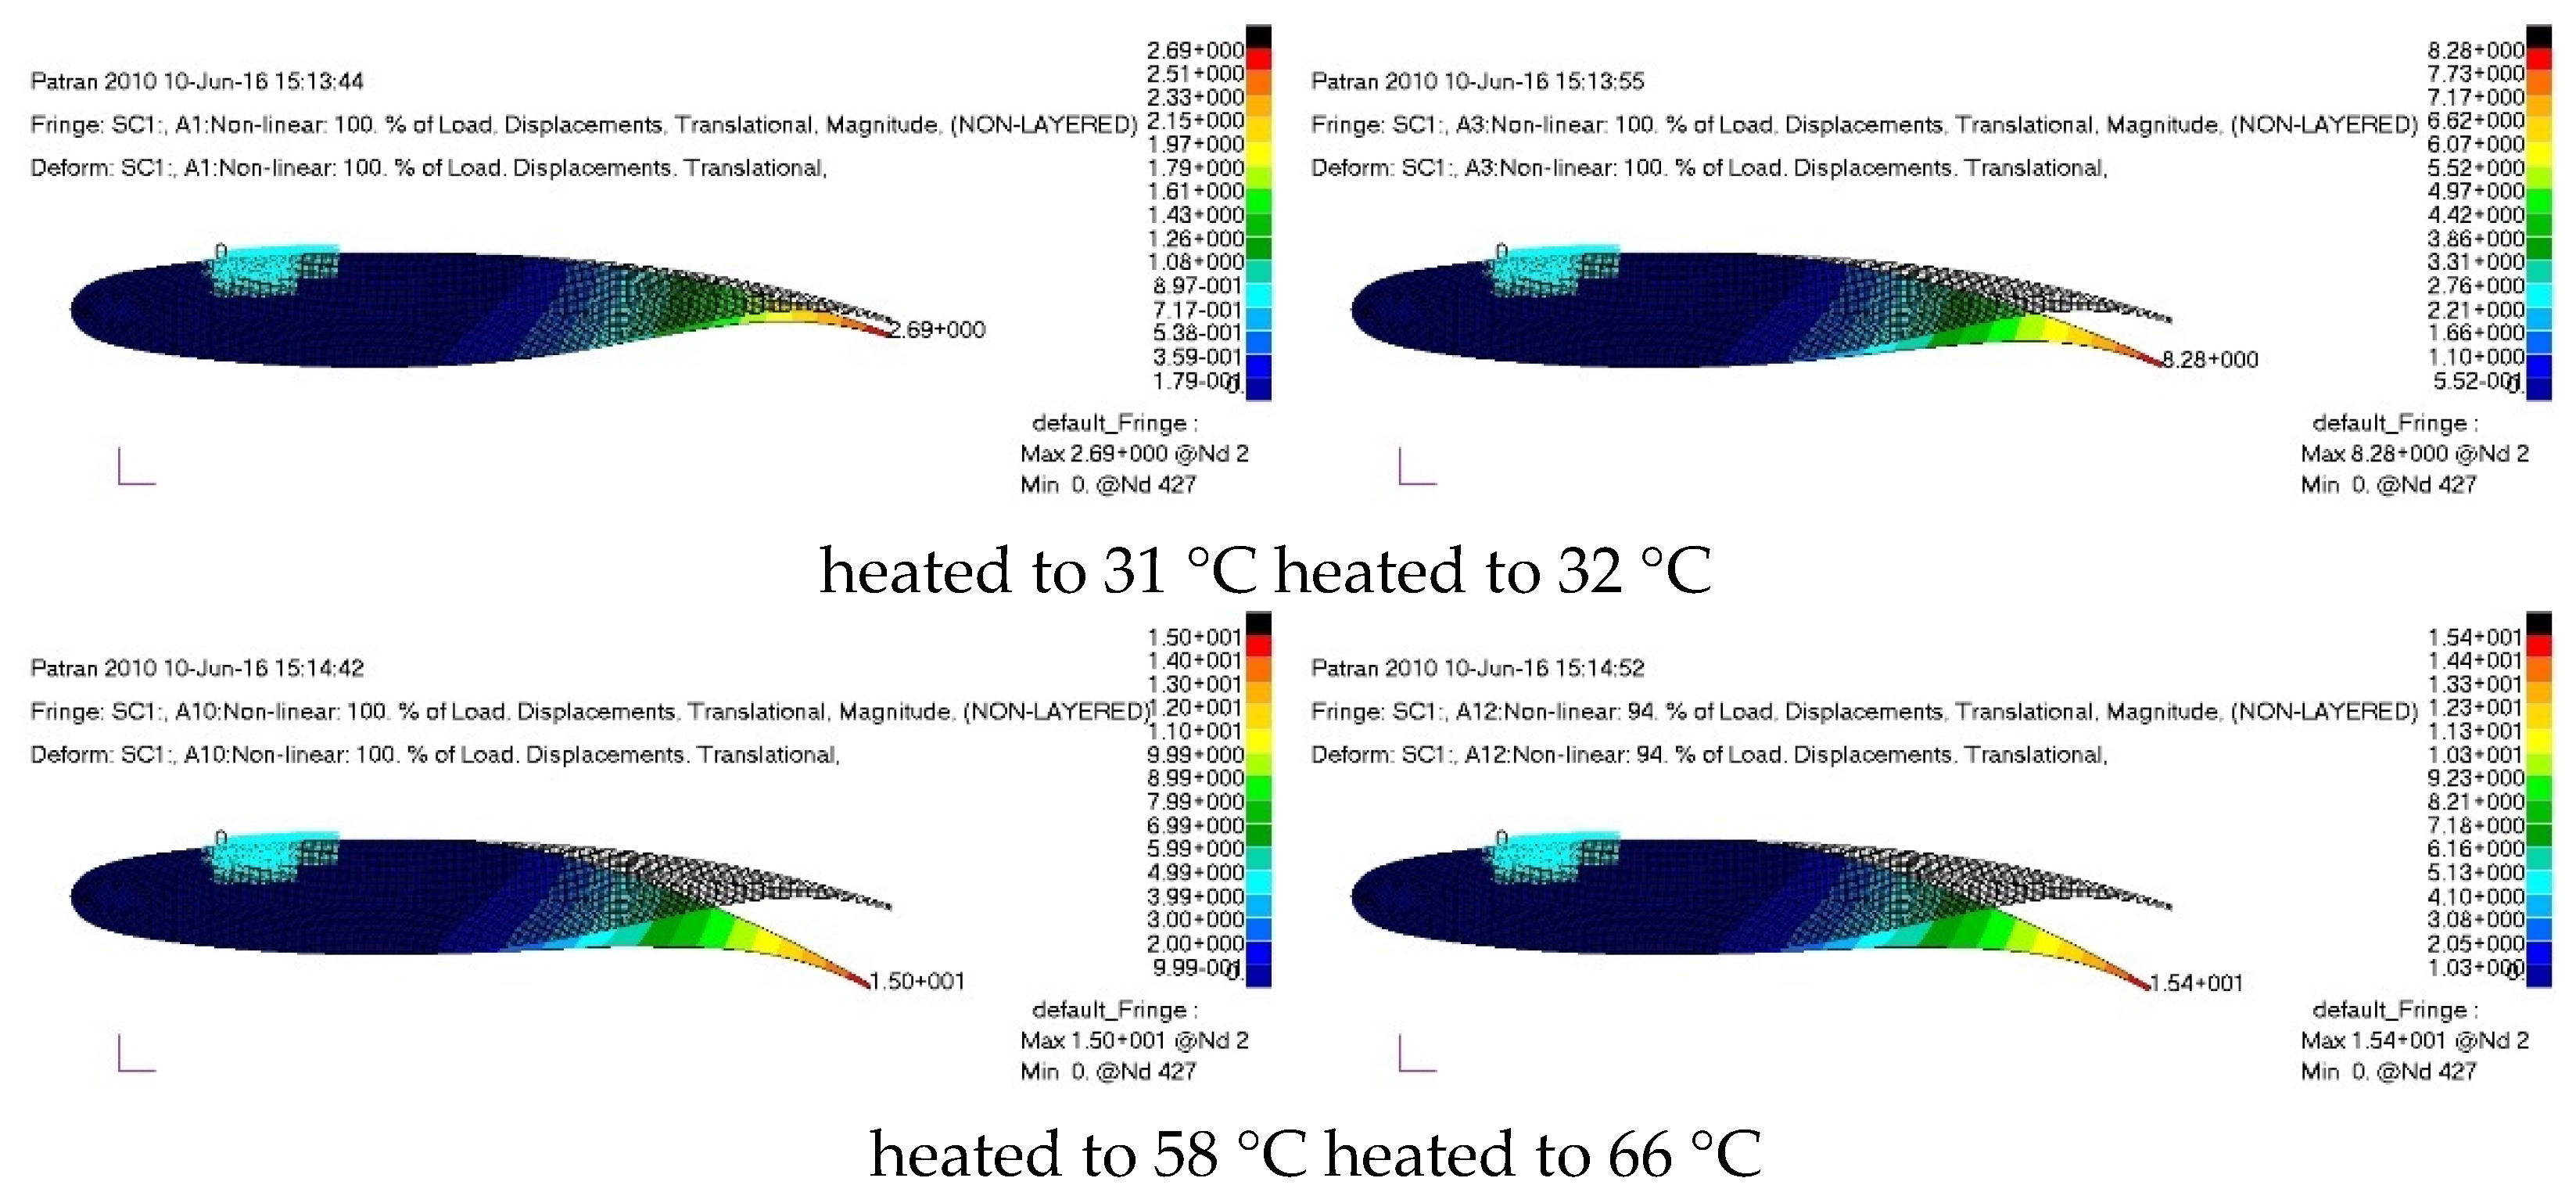
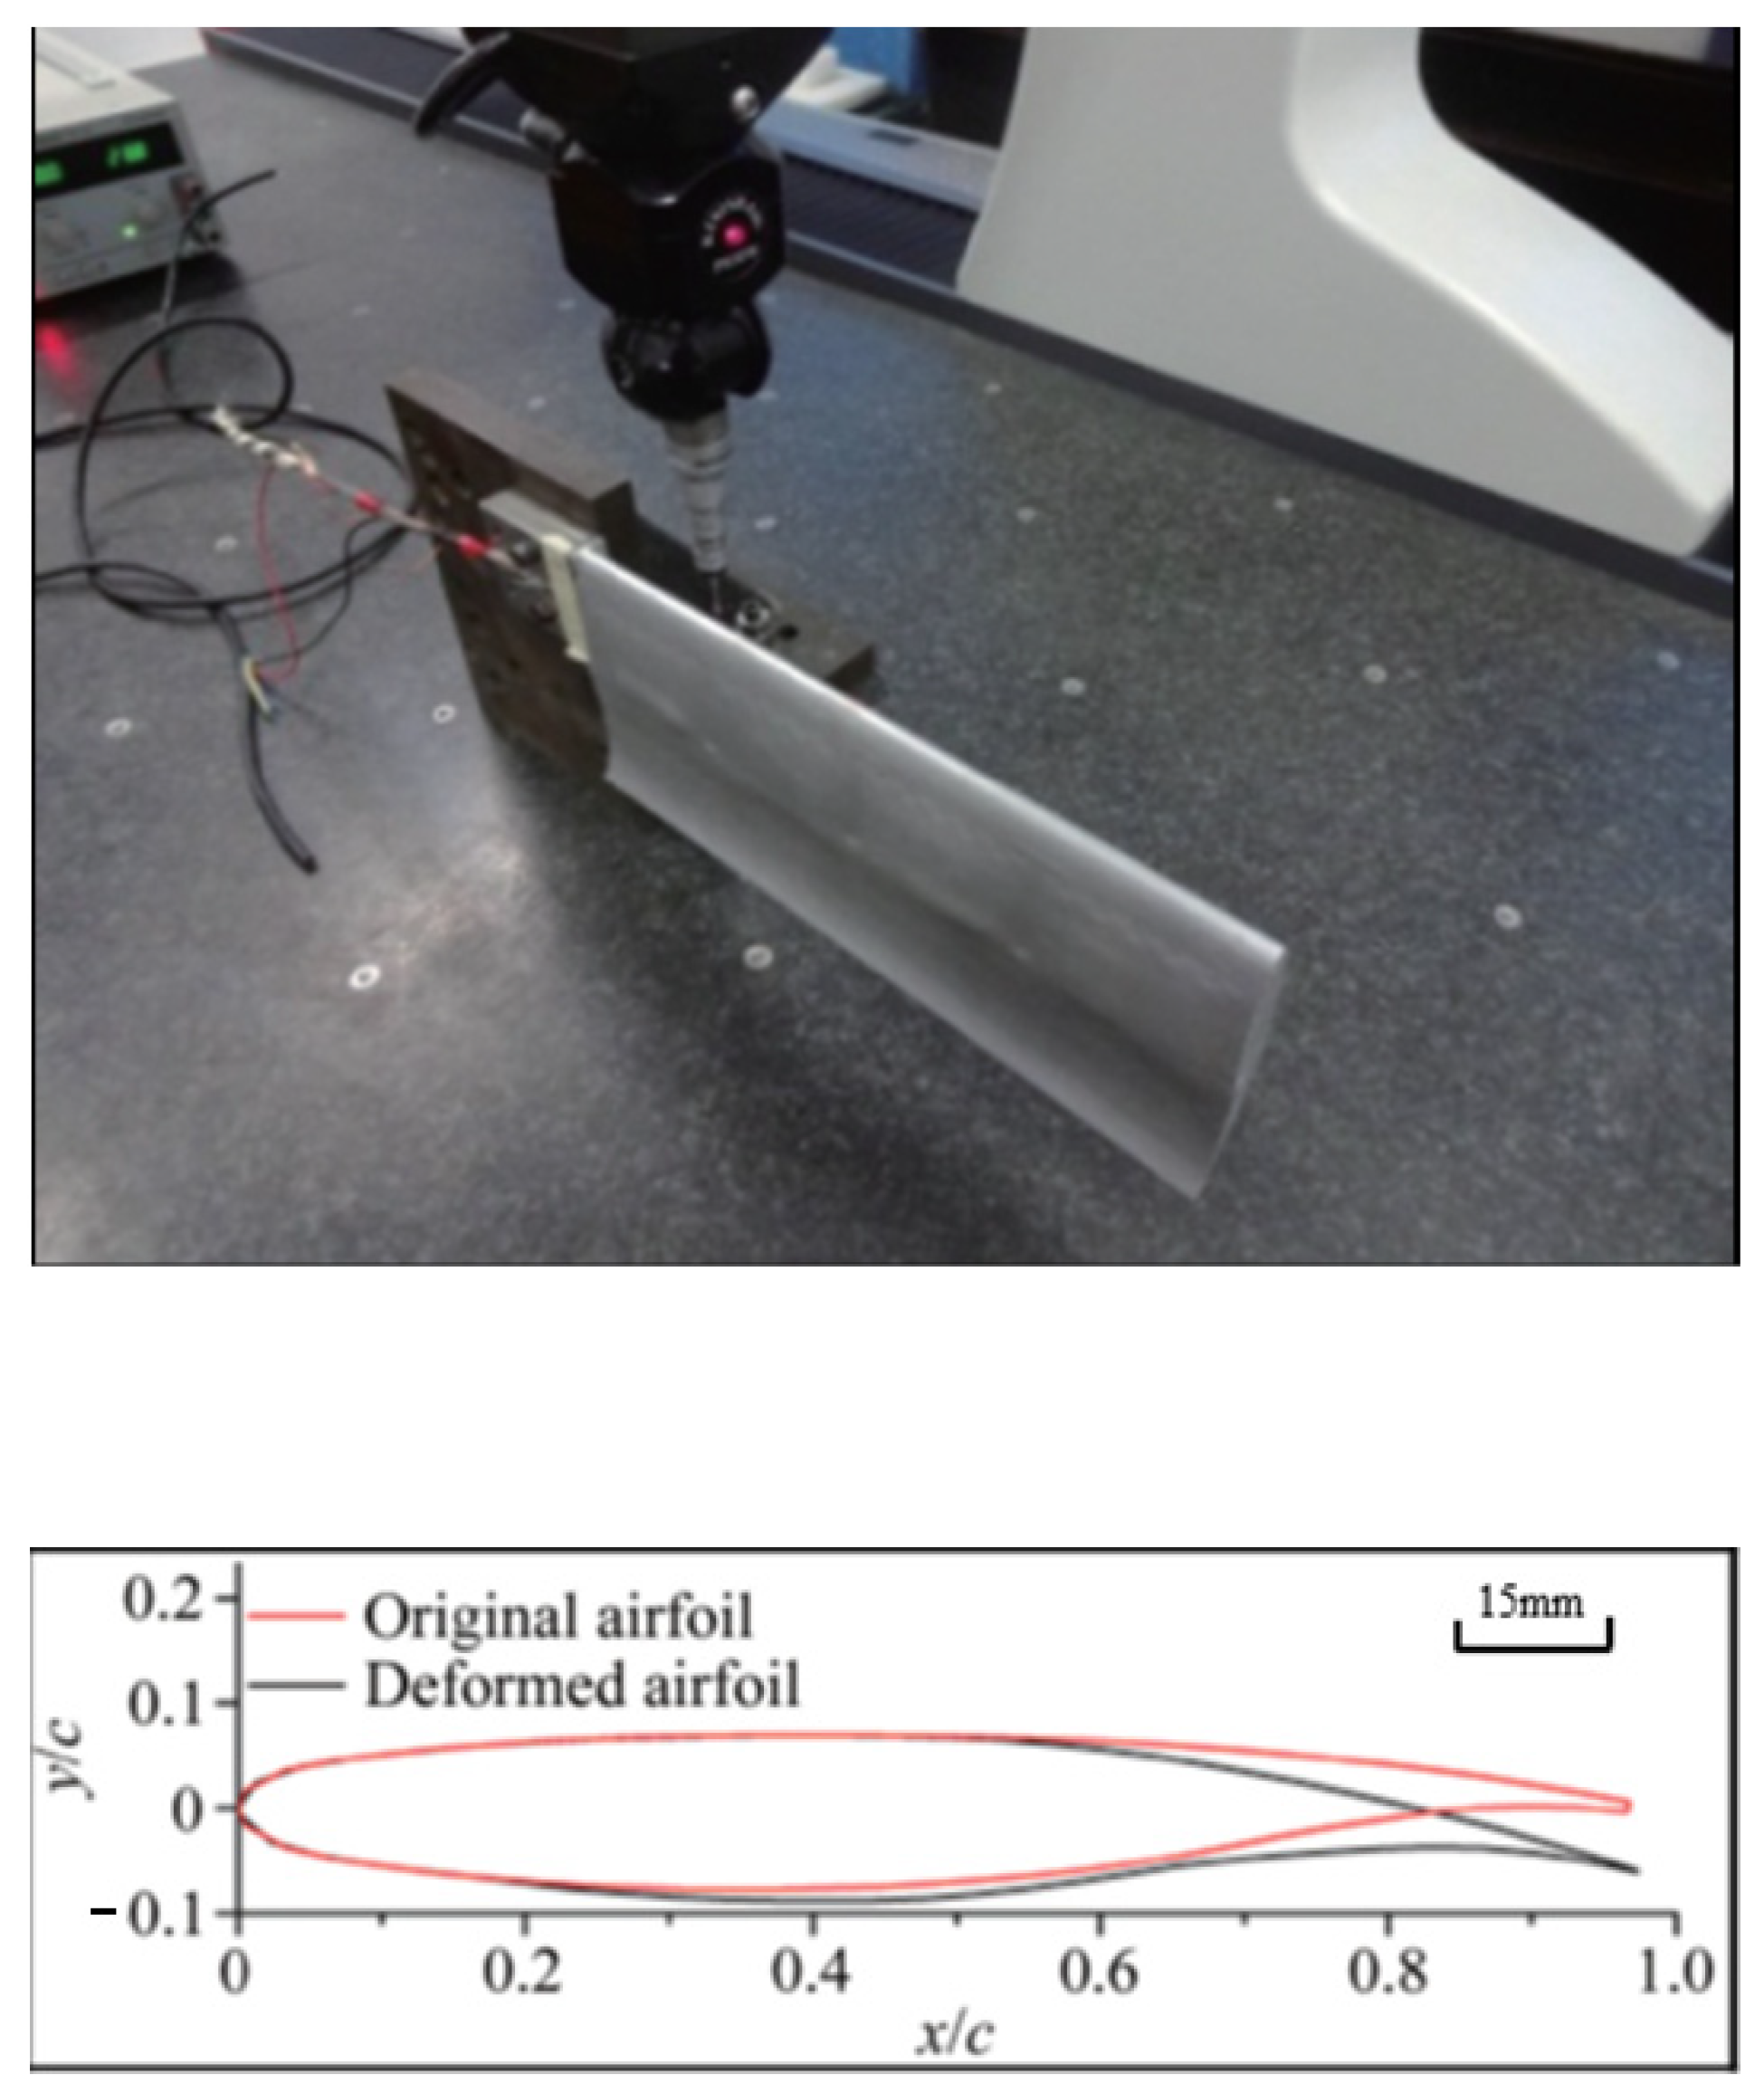
4.5.1. Computation of Trailing Edge Deflection Angle

The model was fixed on the lower wall of test section like a cantilever beam, which would result in both trailing edge deflection and wing bending during the test. Thus, data obtained should be processed to obtain the trailing edge deflection angle. The formulation to calculate the trailing edge deflection angle θp (the angle of trailing edge around the end of the flexible joint) is as follows:
ΔZp = (Zni − Z1i) − (Zni+18 − Z1i+18), i = 1, 2, …, 17
θp = arctan(−ΔZp/r)
where r is the linear distance from trailing edge to the beginning of the flexible joint, Zi0 is the normal coordinate of the i-th marker during wind-off, and Zin is the normal coordinate of the i-th marker recorded by the n-th frame image during wind-on.

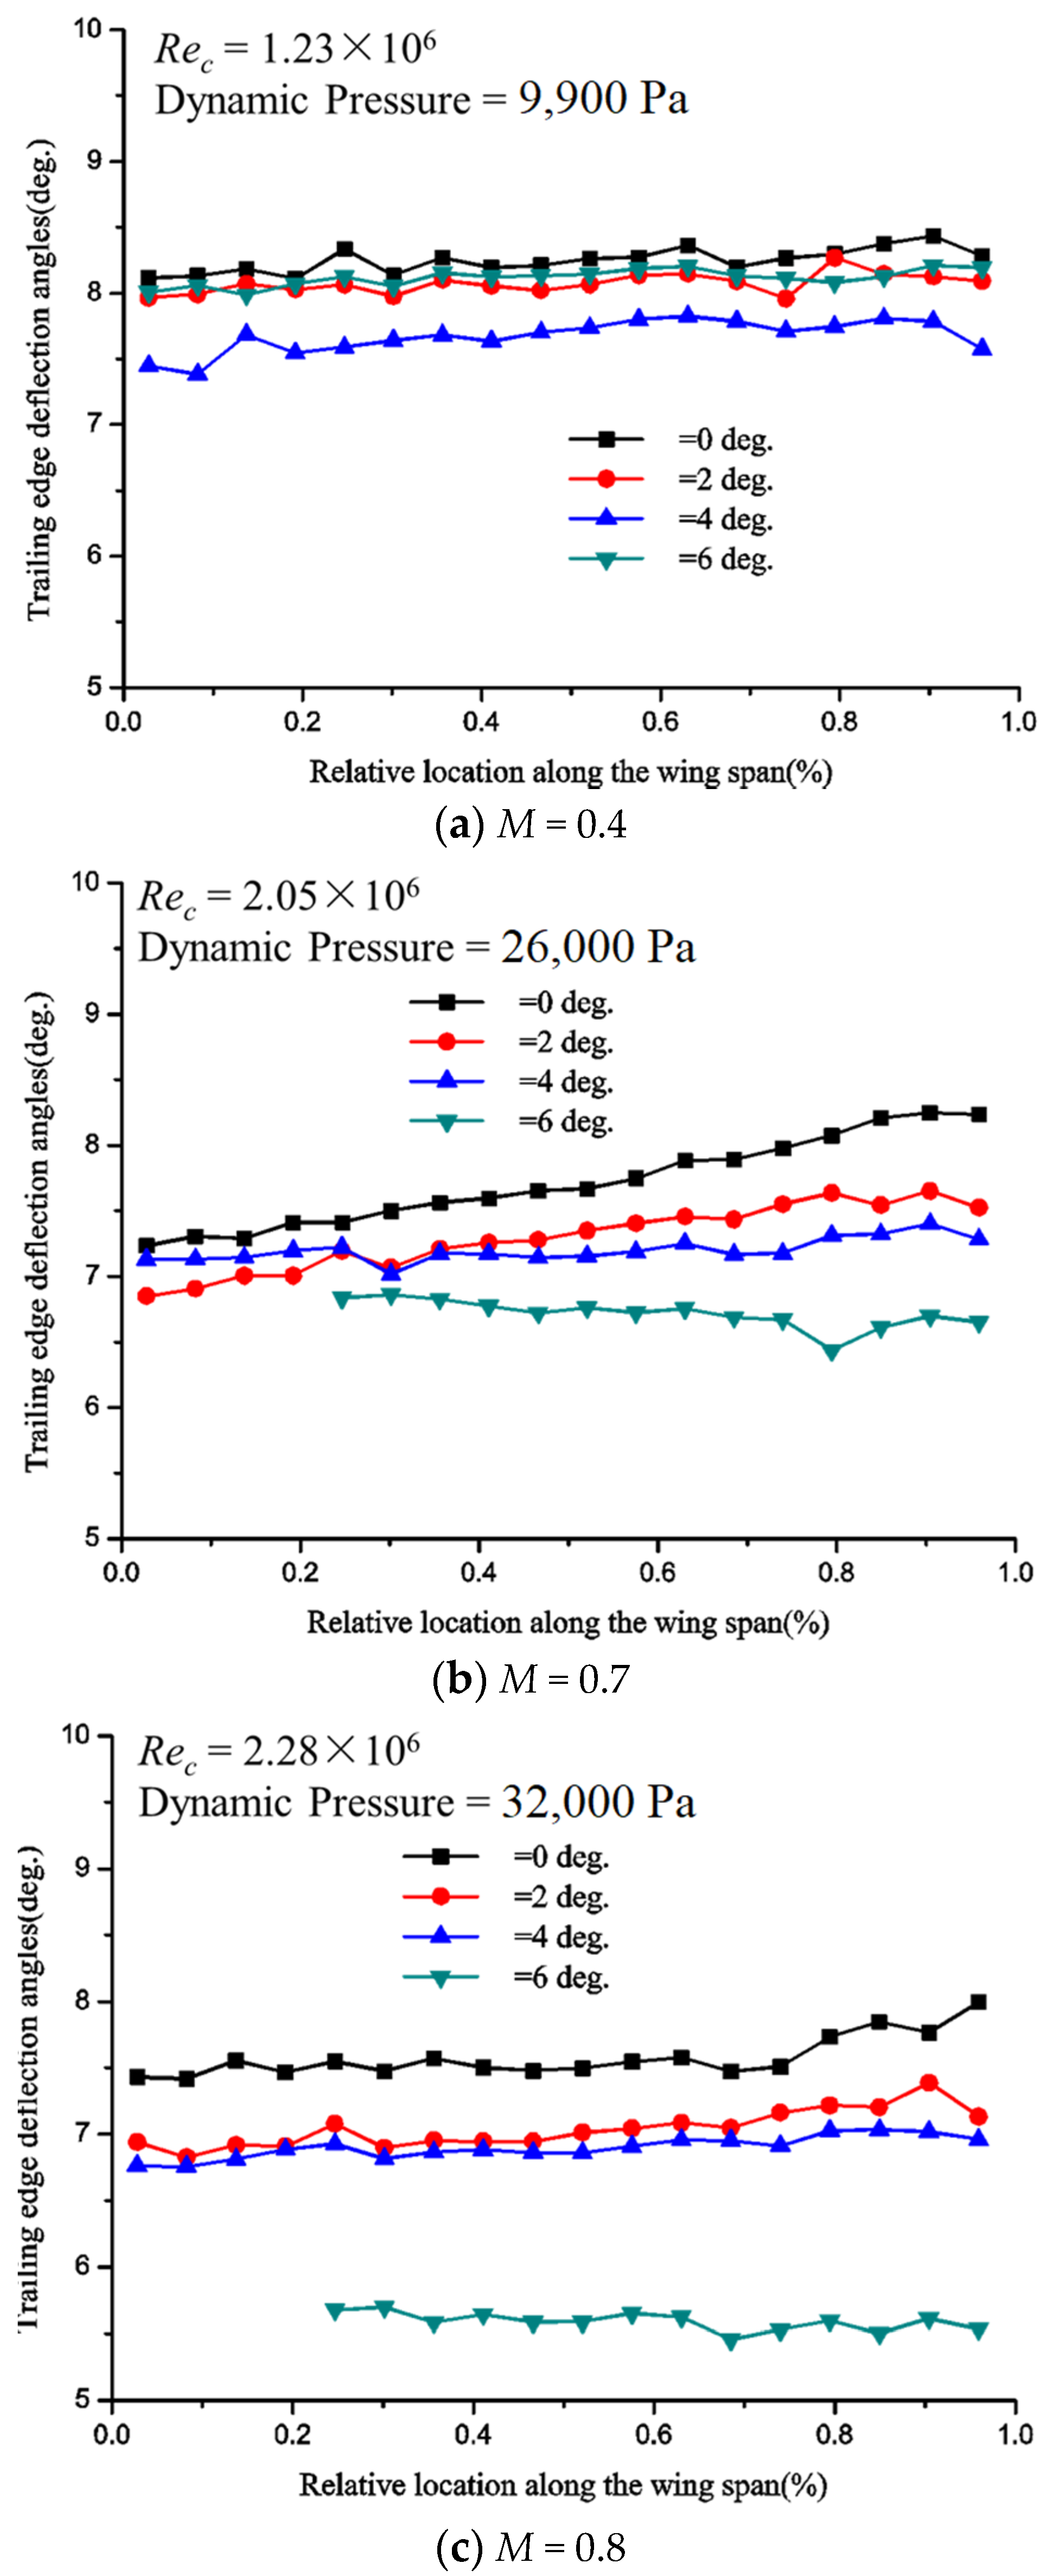
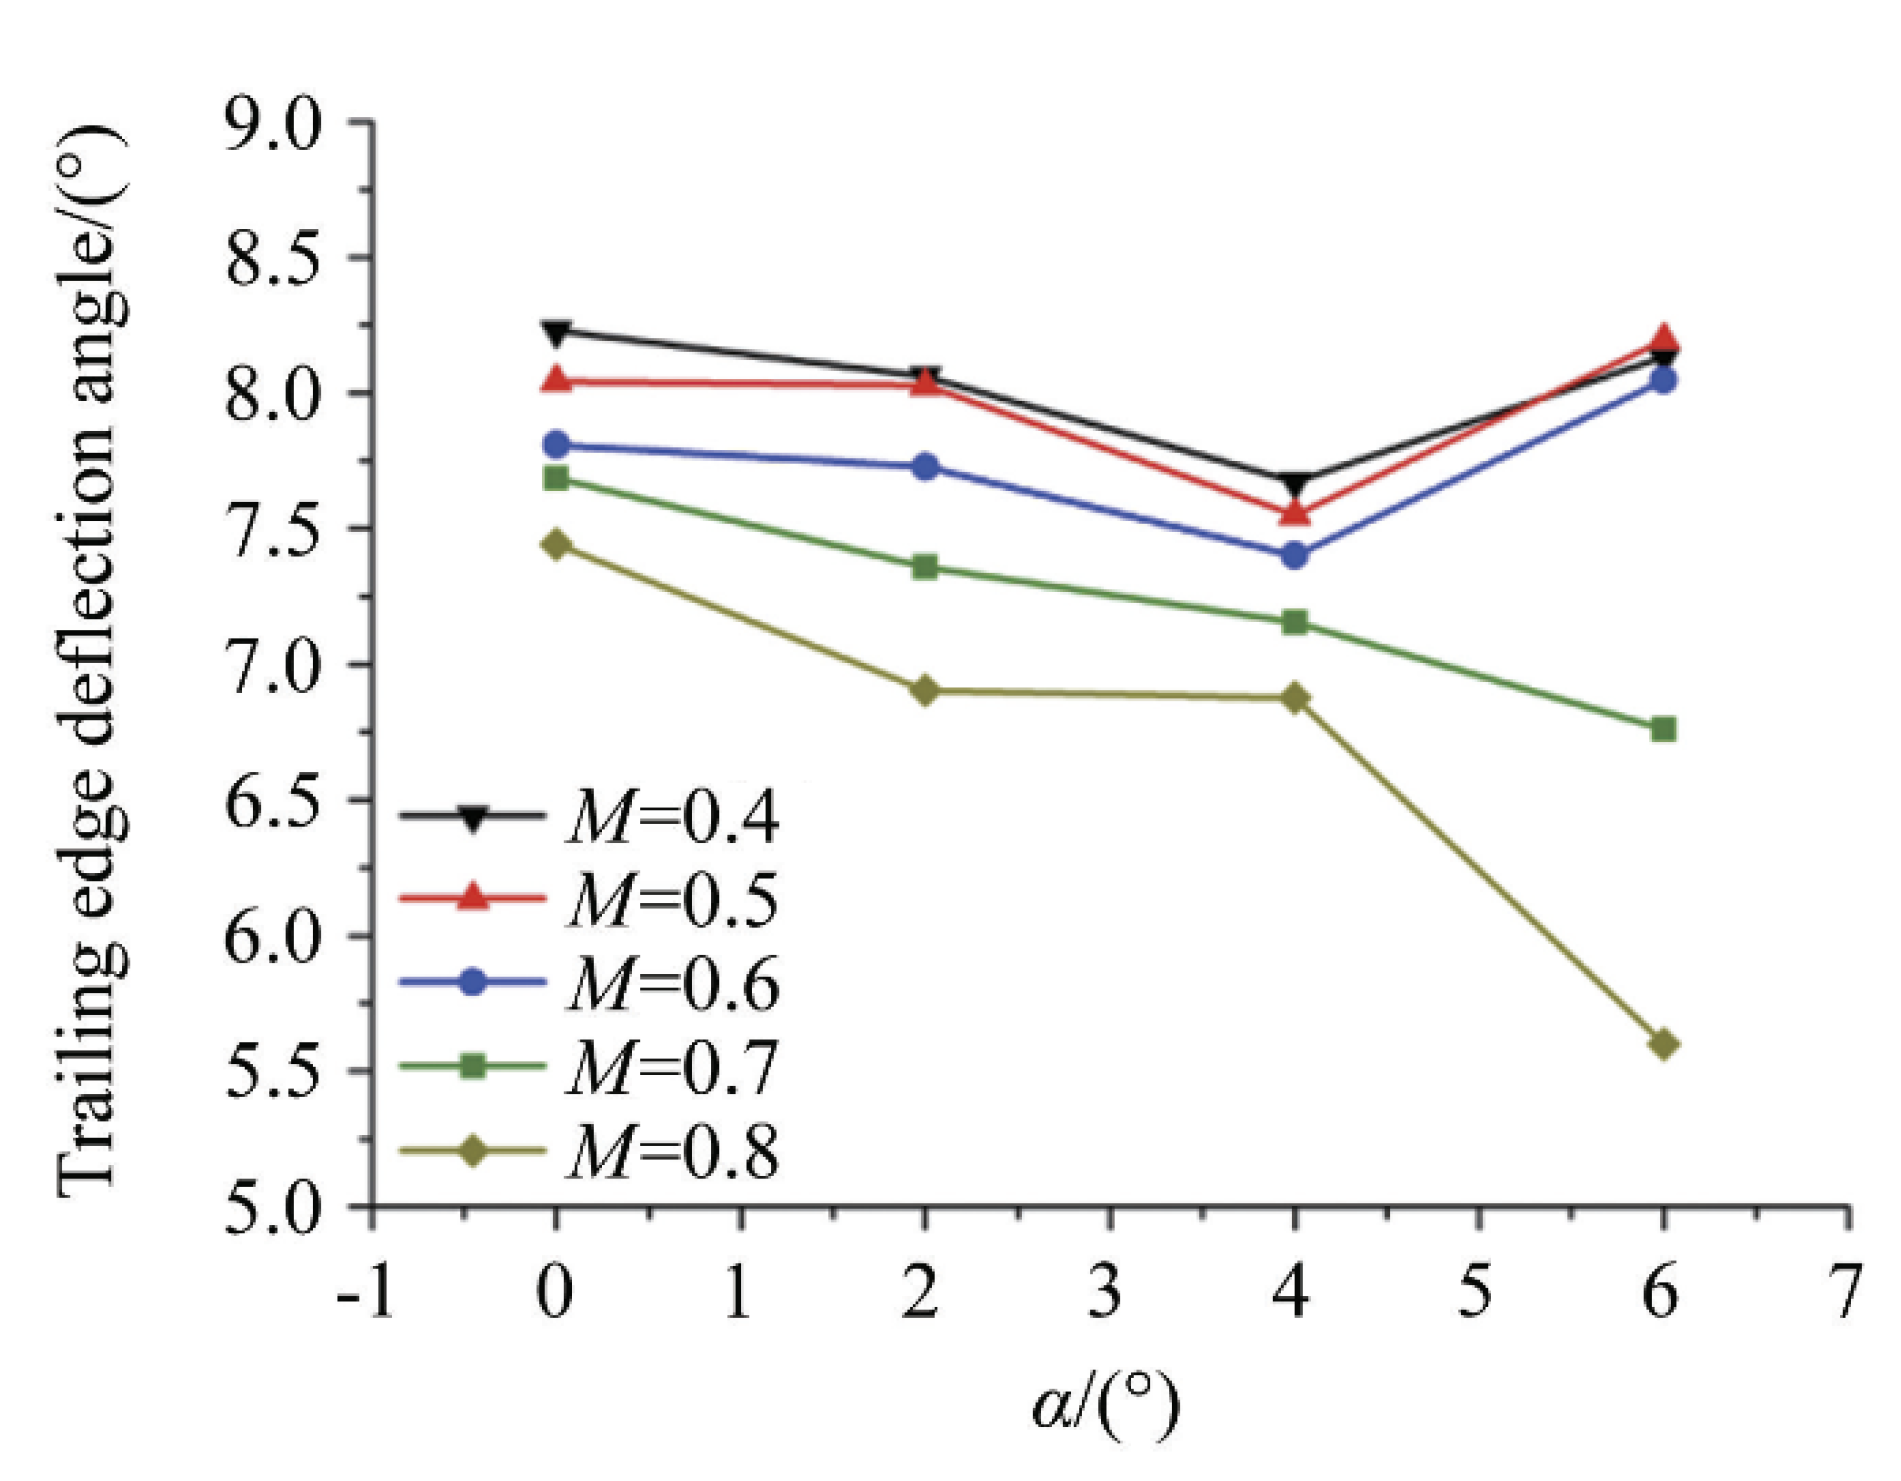
4.5.2. Effects of Mach Number and Angles of Attack on Trailing Edge Deflection

The effects of Mach number on maximum trailing edge deflection are given in Figure 14. Firstly, compared with the unload test, the effect of aerodynamic load reduces the trailing edge deflection angle obviously. With the increasing of the dynamic pressure, the deflection angle decreases gradually. The deflection angles were being reduced with the increasing of Mach number and dynamic pressure, showing that the deformation ability of the SMA actuator was weakened. For example, the maximum of the trailing edge could reach 8.05° at M0.4, while it only was 6.9° at M0.8.
In addition, the deflection distribution is also affected by the Mach number. When the Mach number was 0.4, deflection angles of model trailing edge along the wing span were well distributed with the maximum span wise variation of 0.2°. With the Mach number increased to 0.7, deflection angles of trailing edge would be increased from the wing root to wing tip and the maximum variation of deflection angle was about 0.82°. The cantilever support could cause the wing to bend under the aerodynamic loading, which would lead to different angles of local section. Thus, different aerodynamic characteristics resulting from different local angles would interact with SMA actuator deflection. Mach 0.7 was very close to the critical Mach number of this supercritical airfoil; flow structures and aerodynamics force were the most sensitive to a small change of attitude angle.
The effect of angles of attack on trailing edge deformation ability could also be seen in Figure 15. When the Mach number was low, trailing deflection angles curves along the wing span at different angles of attack had small dispersion, while they were dispersed seriously along the wing span at high Mach numbers. The maximum deviation of trailing edge deflection along the wing span at different attitude angles was 0.57° when the Mach number was 0.4. The deviation was increased to 1.86° when the Mach number was 0.8. As can be seen in Figure 15, attitude angles had little effect on the maximum deflection of trailing edge when the Mach number ranged from 0.4 to 0.6. When the Mach number was above 0.7, the maximum deflection of trailing edge was decreased monotonically with attitude angles increasing. It could be concluded that the effect of angles of attack on deformation ability would be enhanced gradually with the increasing of the Mach number.

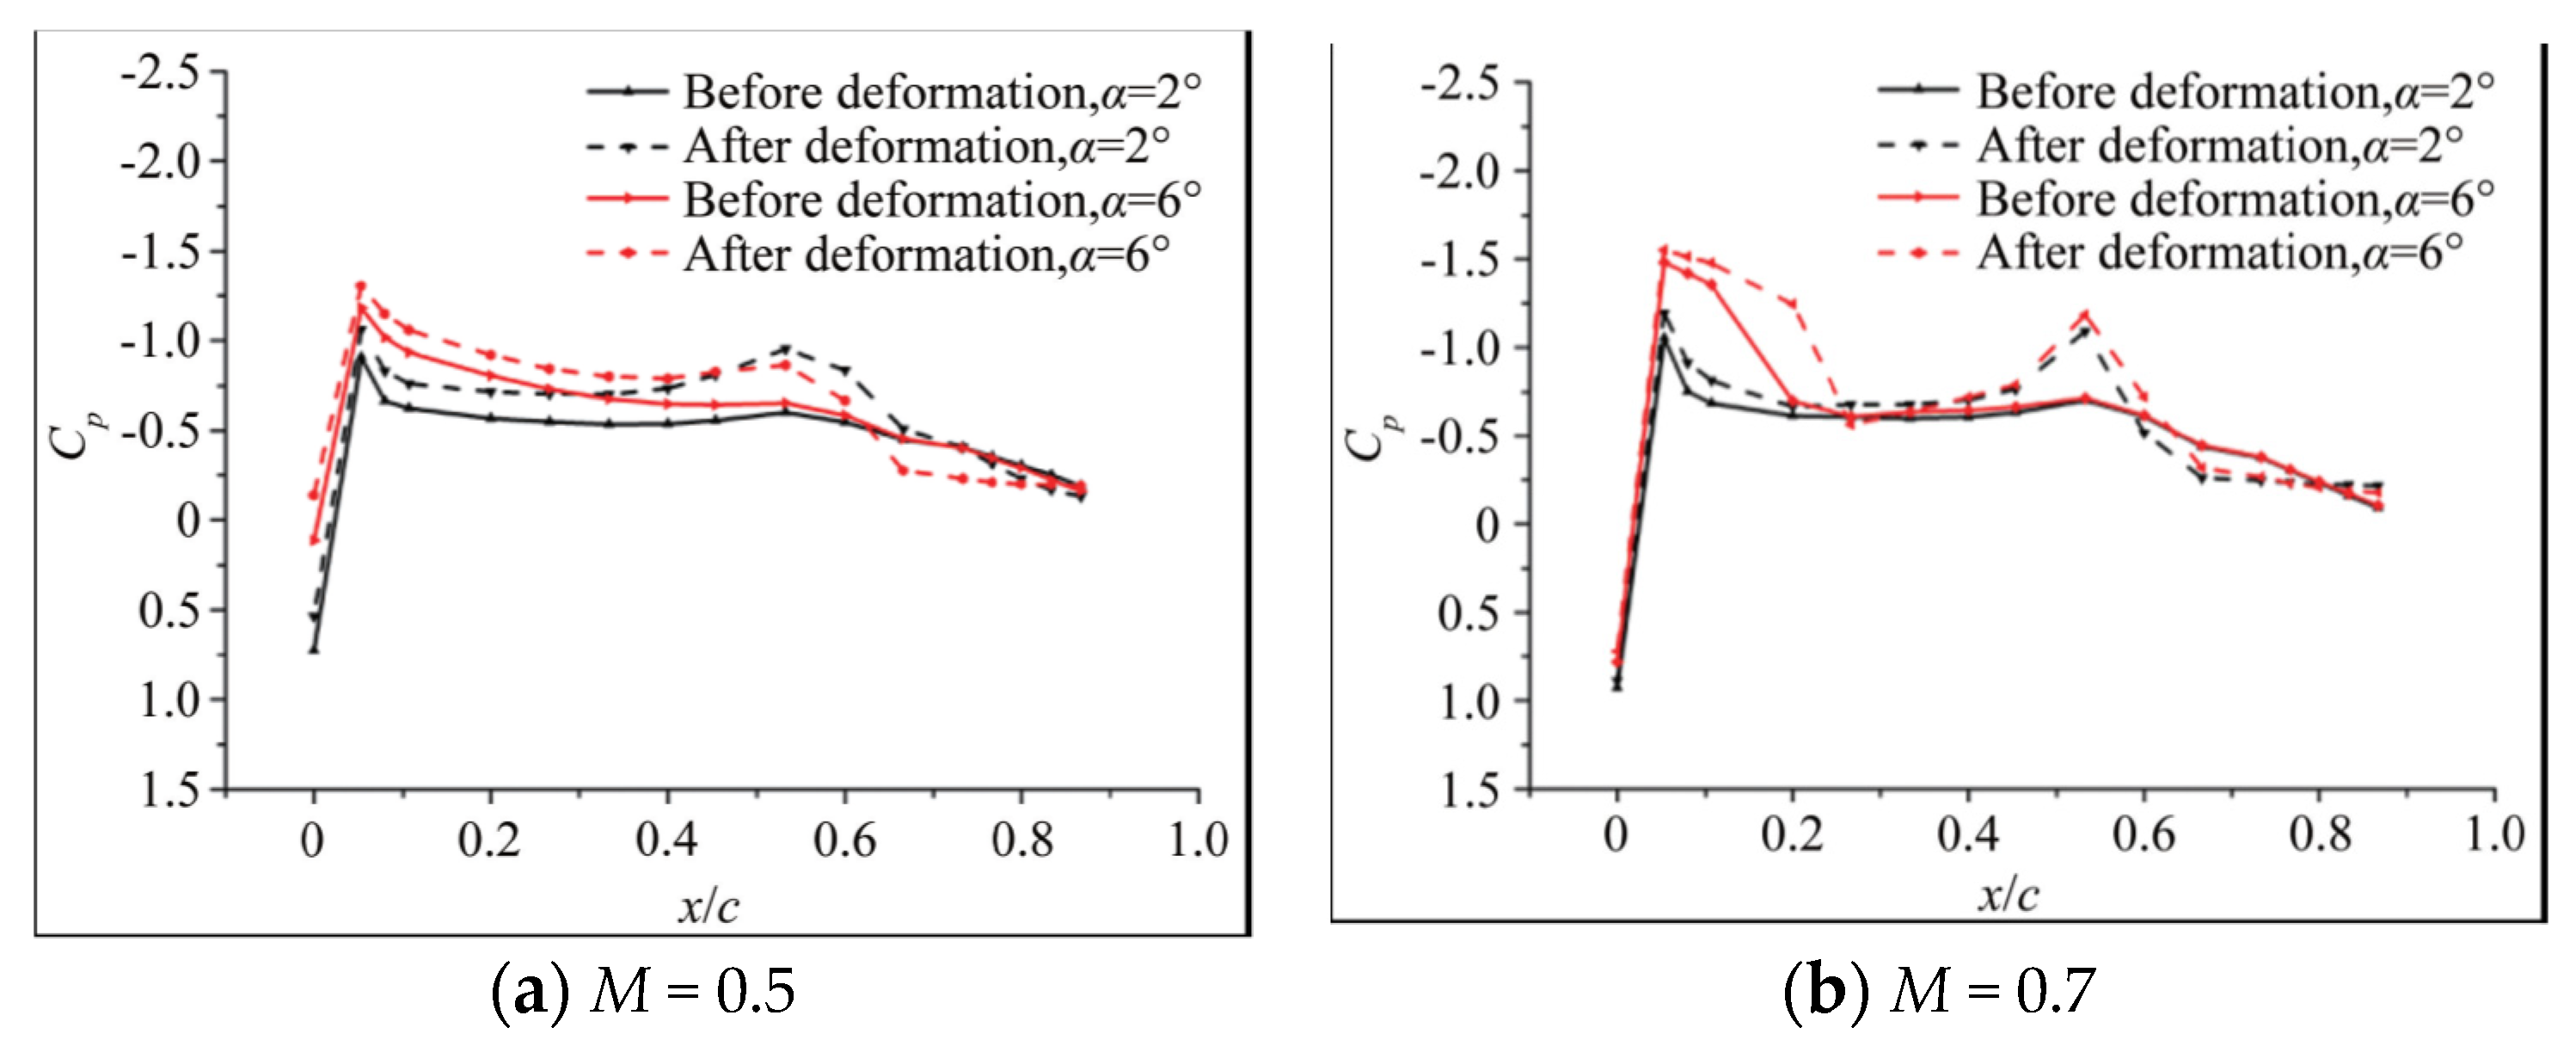
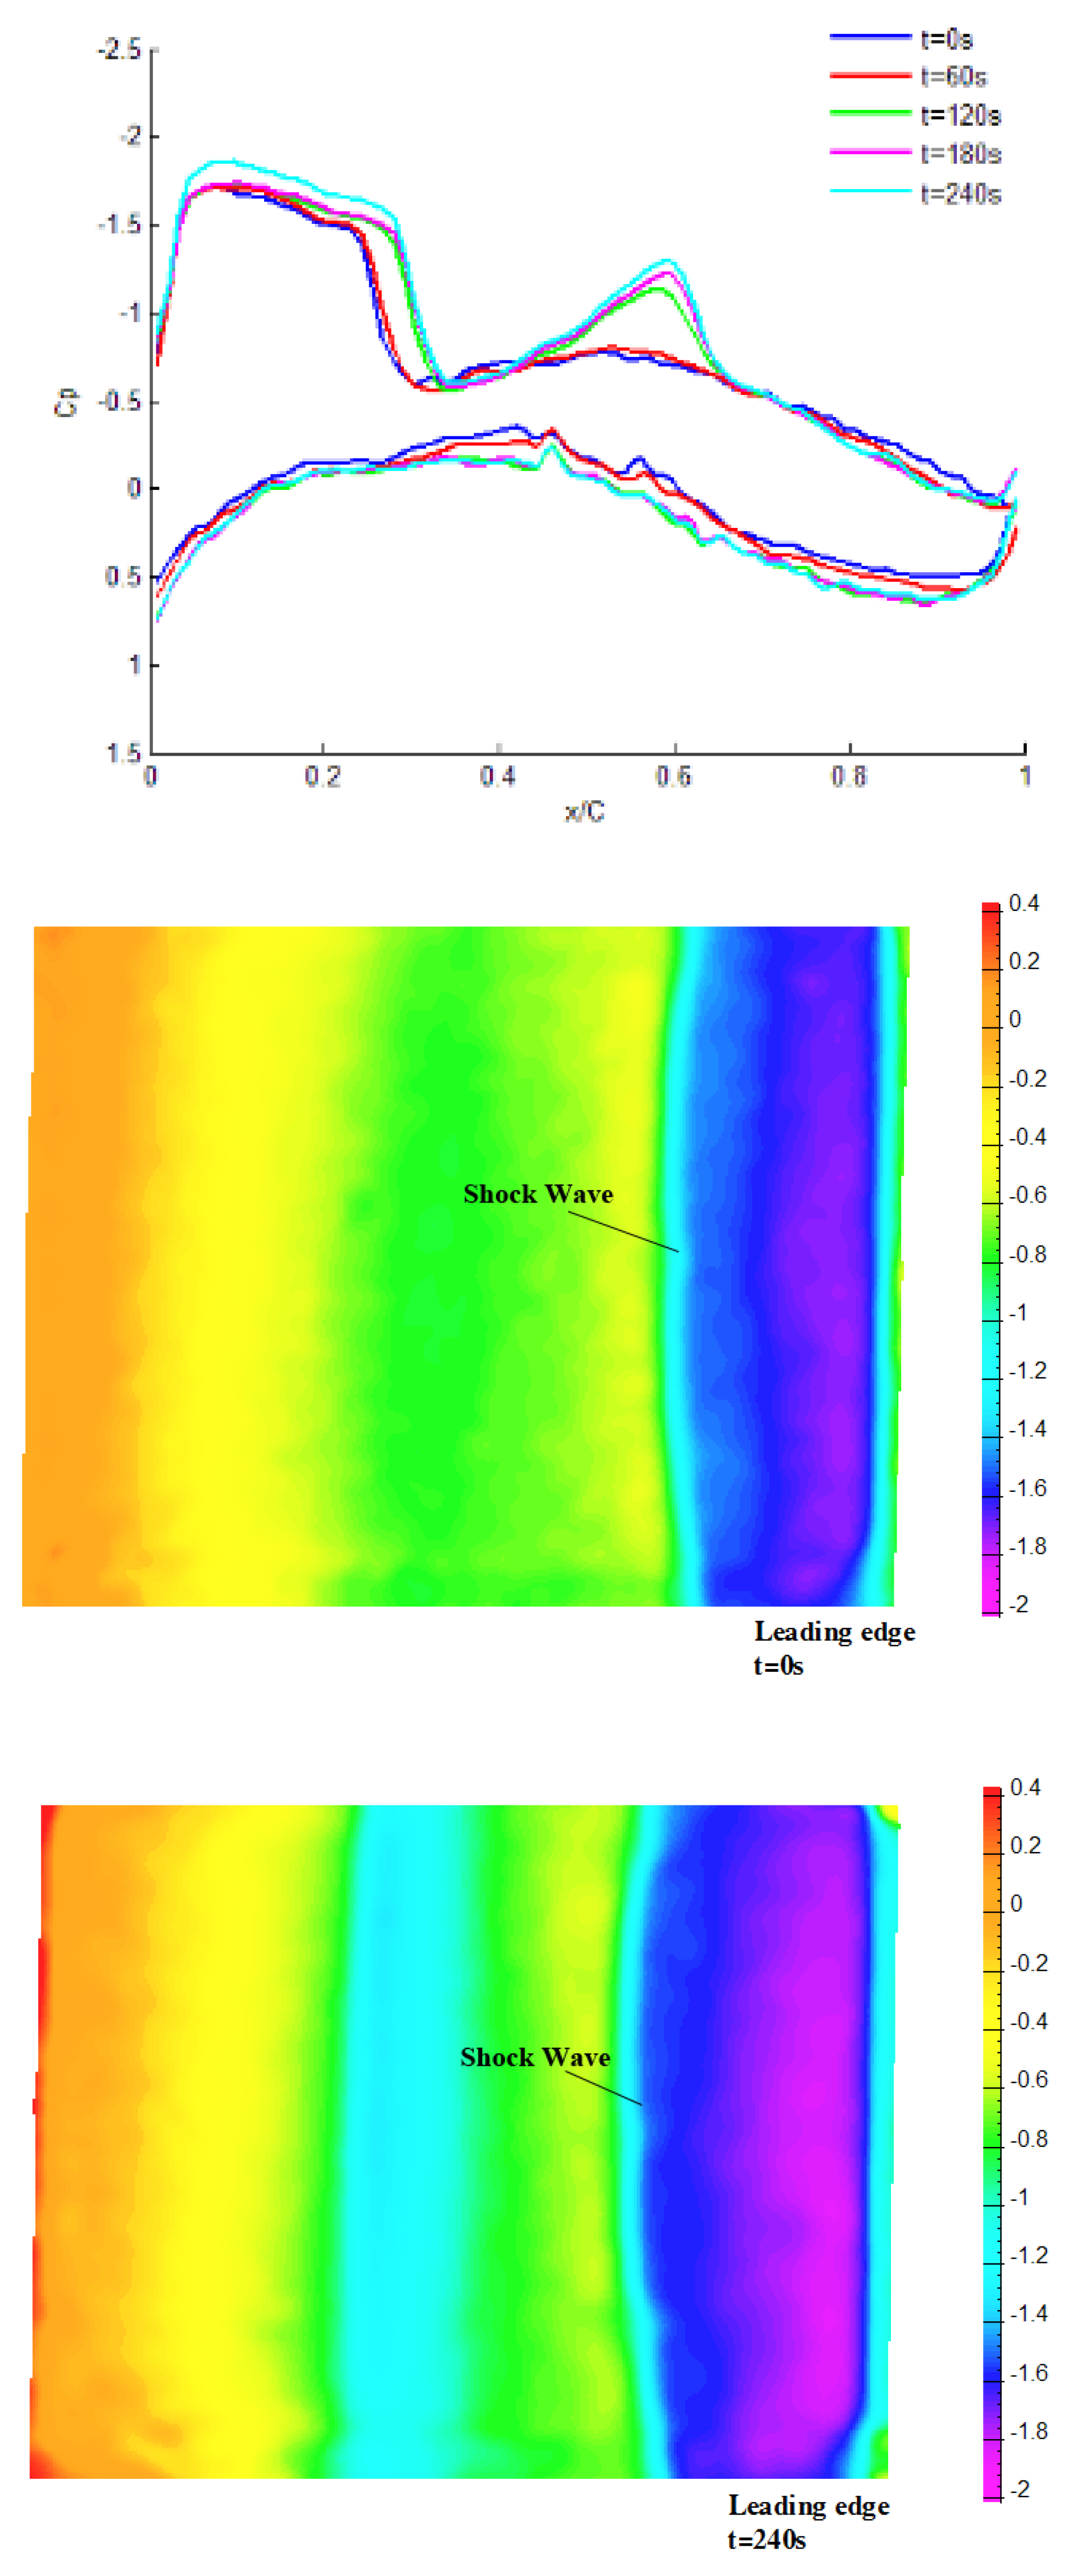
4.5.3. Effect of Trailing Edge Deflection on Pressure Distribution over the Model

The effect of trailing edge deformation on the pressure distribution is shown in Figure 16. Compared with the results of α = 2°, the flow over the rear part of the airfoil could not be kept attached at α = 6° when the Mach number was 0.5. The pressure over the rear part of the airfoil was increased obviously when the flow separated at α = 6°, which would lead to a decreased suction and force moment on the flexible joint. That explained why the trailing edge deflection would be increased first and then decreased versus attitude angles.
When the Mach number was 0.7, deformation at each angle of attack would lead to flow separation near the trailing edge (results at α = 2°,6° were taken as examples). After the flow separated, pressure coefficient of trailing edge was close in magnitude and the force moment produced by pressure suction on the upper wing was also close in magnitude. The monotonical decrease of trailing edge angle with the increase of attitude angle might be due to the increase of pressure coefficient and lift resulting from the obstruction of lower surface flow.
On the other hand, by comparing the pressure distribution curves with and without SMA actuation, the trailing edge deflection could significantly change the pressure distribution on the upper wing. At a lower Mach number, trailing edge deformation could accelerate the flow over the upper wing and increase the local lift force. Near the critical Mach number, the deformation would extend the pressure platform at the leading edge of the wing, which led to a negative pressure peak at the flexible joint and increased local lift coefficient. At the same time, it would cause flow separation at the trailing edge and increased pressure drag. For example, when the Mach number was increased to 0.74, shock wave would appear (Figure 17). Shock wave position would be pushed afterward and its strength would be enhanced strongly when the deflection angle of the trailing edge exceeded 4°. Thus, the flow ahead of the shock wave and flow over the flexible joint would both be accelerated, and secondary shock wave tended to be formed. A greater increment of lift force was induced.
According to the experimental results, the SMA actuation system could deflect the morphing trailing edge of the supercritical airfoil. Deflection of the trailing edge could change the shock wave position, strength, and pressure distribution over the critical airfoil obviously.

5. Conclusions

The cantilever beam type of mechanism based on SMA could carry static aerodynamic loads during the flight conditions, both upward and downwards.
Actuation capability of the SMA mechanism was affected by the angle of attack and the Mach number. With different Mach numbers, the span wise variation of the trailing edge deflection was observed. The effect of the angle of attack on the actuation capability would increase gradually as the Mach number increases. The effect of aerodynamic load and dynamic pressure reduces the trailing edge deflection angle obviously, and with the increasing of the dynamic pressure, the deflection angle decrease gradually. The maximum deflection angle of the wing trailing edge ranges from 8.4° to 5.6°. The deflection angle distribution is more uniform when the Mach number is 0.4–0.6 and dynamic pressure is 9900–20,400 Pa, and reached the minimum value when the angle of attack is 4°. When the Mach number is 0.7 and 0.8, and dynamic pressure is 26,000 Pa and 32,000 Pa, the deflection angle decreases obviously from wing tip to wing root, and decreases obviously with the increase of the angle of attack. This is caused by flow separation at the trailing edge with a different angle of attack and the critical Mach number of 0.74 of the air foil.
Obviously, flow structures over super critical airfoil would be changed by trailing edge deflection. When the Mach number was less than 0.74, the position of the main shock wave would be postponed and its strength be enhanced. Flow ahead of both the main shock wave and flexible joint would be accelerated, which would increase the lift. When the Mach number was 0.8, the main shock wave was so strong that it would induce the boundary separation, which would push the main shock wave windward, and the pressure recovery over the rear part of the airfoil worsens.

Author Contributions

Data curation, P.L.; Supervision, Y.W.; Writing—original draft, B.L.; Writing—review & editing, Y.W. All authors have read and agreed to the published version of the manuscript.

Funding

This research received no external funding.

Institutional Review Board Statement

Not applicable.

Informed Consent Statement

Not applicable.

Data Availability Statement

Data can be available from [email protected].

Conflicts of Interest

The authors declare no conflict of interest.

References

  1. Kudva, J.N. Overview of the DARPA Smart Wing Project. J. Intell. Mater. Syst. Struct. 2004, 15, 261–267. [Google Scholar] [CrossRef]
  2. Bye, D.R.; McClure, P.D. Design of a Morphing Vehicle. In Proceedings of the 48th AIAA/ASME/ASCE/AHS/ASC Structures, Structural Dynamics and Materials Conference, Honolulu, HI, USA, 23–26 April 2007. [Google Scholar]
  3. Ivanco, T.; Scott, R.; Love, M.; Zink, S.; Weisshaar, T. Validation of the Lockheed Martin Morphing Concept with Wind Tunnel Testing. In Proceedings of the 48th AIAA/ASME/ASCE/AHS/ASC Structures, Structural Dynamics and Materials Conference, Honolulu, HI, USA, 23–26 April 2007. [Google Scholar]
  4. Flanagan, J.; Strutzenberg, R.; Myers, R.; Rodrian, J. Development and flight testing of a morphing aircraft, the NextGen MFX-1. In Proceedings of the 48th AIAA/ASME/ASCE/AHS/ASC Structures, Structural Dynamics and Materials Conference, Honolulu, HI, USA, 23–26 April 2007. [Google Scholar]
  5. Bowman, J.; Sanders, B.; Cannon, B.; Kudva, J.; Joshi, S.; Weisshaar, T. Development of Next Generation Morphing Aircraft Structures. In Proceedings of the 48th AIAA/ASME/ASCE/AHS/ASC Structures, Structural Dynamics and Materials Conference, Honolulu, HI, USA, 23–26 April 2007. [Google Scholar]
  6. Nathan, P.; Marat, M.; Eli, L. Design, Construction, and Tests of an Aeroelastic Wind Tunnel Model of a Variable Camber Continuous Trailing Edge Flap (VCCTEF) Concept Wing. In Proceedings of the 32nd AIAA Applied Aerodynamics Conference, Atlanta, GA, USA, 16–20 June 2014. [Google Scholar]
  7. Nathan, P.; Marat, M.; Eli, L. The Design, Construction, and Tests of a Concept Aeroelastic Wind Tunnel Model of a High-Lift Variable Camber Continuous Trailing Edge Flap (HLVCCTEF) Wing configuration. In Proceedings of the 56th AIAA/ASCE/AHS/ASC Structures, Structural Dynamics, and Materials Conference, Kissimmee, FL, USA, 5–9 January 2015. [Google Scholar]
  8. Coutu, D.; Brailovski, V.; Terriault, P. Optimized design of an active extrados structure for an experimental morphing laminar wing. Aerosp. Technol. 2010, 14, 451–458. [Google Scholar] [CrossRef]
  9. Wlezien, R.W.; Horner, G.C.; McGowan AM, R.; Padula, S.L.; Scott, M.A.; Silcox, R.J.; Harrison, J.S. Aircraft morphing program. In Proceedings of the 5th Annual International Symposium on Smart Structures and Materials, San Diego, CA, USA, 1–5 March 1998; pp. 176–187. [Google Scholar]
  10. Kudva, J.N.; Jardine, A.P.; Martin, C.A.; Appa, K. Overview of the ARPA/WL smart structures and materials development-smart wing contract. In Proceedings of the 1996 Symposium on Smart Structures and Materials, International Society for Optics and Photonics, San Diego, CA, USA, 25–29 February 1996. [Google Scholar]
  11. Martin, C.A.; Jasmin, L.; Flanagan, J.S.; Appa, K.; Kudva, J.N. Smart wing wind tunnel model design. In Proceedings of the Smart Structures and Materials 1997: Industrial and Commercial Applications of Smart Structures Technologies, San Diego, CA, USA, 3–6 March 1997; Volume 3044, pp. 41–47. [Google Scholar]
  12. Scherer, L.B.; Martin, C.A.; Appa, K.; Kudva, J.N.; West, M.N. Smart wing wind tunnel test results. In Proceedings of the Smart Structures and Materials 1997: Industrial and Commercial Applications of Smart Structures Technologies, San Diego, CA, USA, 3–6 March 1997; pp. 56–66. [Google Scholar]
  13. Scherer, L.B.; Martin, C.A.; West, M.N.; Florance, J.P.; Wieseman, C.D.; Burner, A.W.; Fleming, G.A. DARPA/ARFL/ NASA Smart Wing second wind tunnel test results. In Proceedings of the 1999 Symposium on Smart Structures and Materials, International Society for Optics and Photonics, Newport Beach, CA, USA, 1 March 1999; pp. 249–259. [Google Scholar]
  14. Ting, E.; Dao, T.; Nguyen, N. Aerodynamic load analysis of a variable camber continuous trailing edge flap system on a flexible wing aircraft. In Proceedings of the 56th AIAA/ASCE/AHS/ASC Structures, Structural Dynamics, and Materials Conference, Kissimmee, FL, USA, 5–9 January 2015. [Google Scholar] [CrossRef] [Green Version]
  15. Chen, Q.; Bai, P.; Ying, W.L.; Leng, J.S.; Zhan, H.L.; Liu, Z.Q. Analysis on the aerodynamic characteristics of variable camber airfoils with continuous smooth morphing trailing edge. Acta Aerodyn. Sin. 2010, 28, 46–53. [Google Scholar]
  16. Yang, Y.; Xu, Z.W. Research of the wing structure based on a shape-memory alloy actuated morphing wing. Ordnance Mater. Sci. Eng. 2010, 33, 25–30. [Google Scholar]
  17. Liang, C.; Rogers, C.A. One-Dimensional Thermomechanical Constitute Relations for Shape Memory Materials. J. Intell. Mater. Syst. Struct. 1997, 84, 285–302. [Google Scholar] [CrossRef]
  18. Xing, T.; Zheng, Y.; Cui, L. Recovery stress characteristics of TiNi alloy wires after partial martensitic transformation under different constraint conditions. Trans. Nonferrous Met. Soc. China 2005, 15, 336–339. [Google Scholar]
  19. Tanaka, K.A. A thermomechanical sketch of shape memory effect: One-dimensional tensile behavior. Res. Mech. 1986, 18, 251–263. [Google Scholar]
  20. Tang, W.; Sandstrom, R. Limitations of Constitutive Relations for TiNi Shape Memory Alloys. J. Phys. 1995, 5, 185–190. [Google Scholar] [CrossRef] [Green Version]
  21. Dong, E. Research on Realization Mechanism and Some Key Technologies of Smart Morphing Aircraft Structures. Ph.D. Thesis, University of Science and Technology of China, Hefei, China, 2010. [Google Scholar]
Figure 1. Comparison of the results between constitutive model theory and literature.
Actuators 10 00160 g001
Figure 2. Strain versus stress curves of shape memory alloy (SMA) in an ambient environment.
Actuators 10 00160 g002
Figure 3. Strain versus stress curves of SMA at high temperature (56 °C).
Actuators 10 00160 g003
Figure 4. Maximum recovery strain curves.
Actuators 10 00160 g004
Figure 5. Recovery strain and recovery stress test results.
Actuators 10 00160 g005
Figure 6. Mechanical model of trailing edge.
Actuators 10 00160 g006
Figure 7. Schematic diagram of the model assembly.
Actuators 10 00160 g007
Figure 8. Analysis of finite element on trailing edge deflection displacement.
Actuators 10 00160 g008
Figure 9. Ground measuring results by coordinate measuring machines without aerodynamic loading.
Actuators 10 00160 g009
Figure 10. Model test section. PSP, pressure-sensitive paint.
Actuators 10 00160 g010
Figure 11. Model coordinates.
Actuators 10 00160 g011
Figure 12. Measurement principle of the video grammetric model deformation (VMD) system.
Actuators 10 00160 g012
Figure 13. Markers on the model surface.
Actuators 10 00160 g013
Figure 14. Effect of Mach number on trailing edge deflection ability.
Actuators 10 00160 g014
Figure 15. Maximum trailing edge deflection angle under different Mach numbers and angles of attack (middle section).
Actuators 10 00160 g015
Figure 16. Effect of trailing edge deflection on pressure distribution over the model.
Actuators 10 00160 g016
Figure 17. PSP measurement of surface pressure (M = 0.74).
Actuators 10 00160 g017
Publisher’s Note: MDPI stays neutral with regard to jurisdictional claims in published maps and institutional affiliations.

