First Proteomic Approach to Identify Cell Death Biomarkers in Wine Yeasts during Sparkling Wine Production


 ,
,  , and
, and
Abstract
:
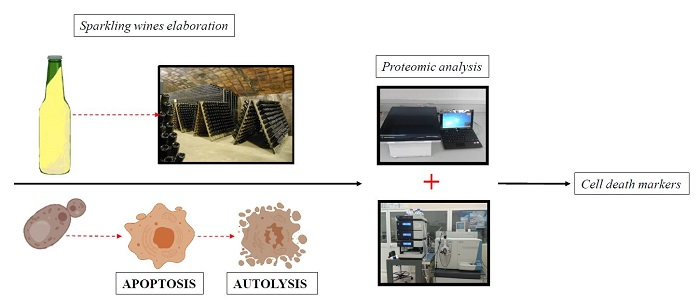
1. Introduction
2. Materials and Methods
2.1. Yeast Strains
2.2. Second Fermentation Conditions and Sampling Times
2.3. Viability
2.4. General Wine Parameters
2.5. Protein Extraction, Identification and Quantification
2.6. Confidence Parameters and Statistics
3. Results and Discussion
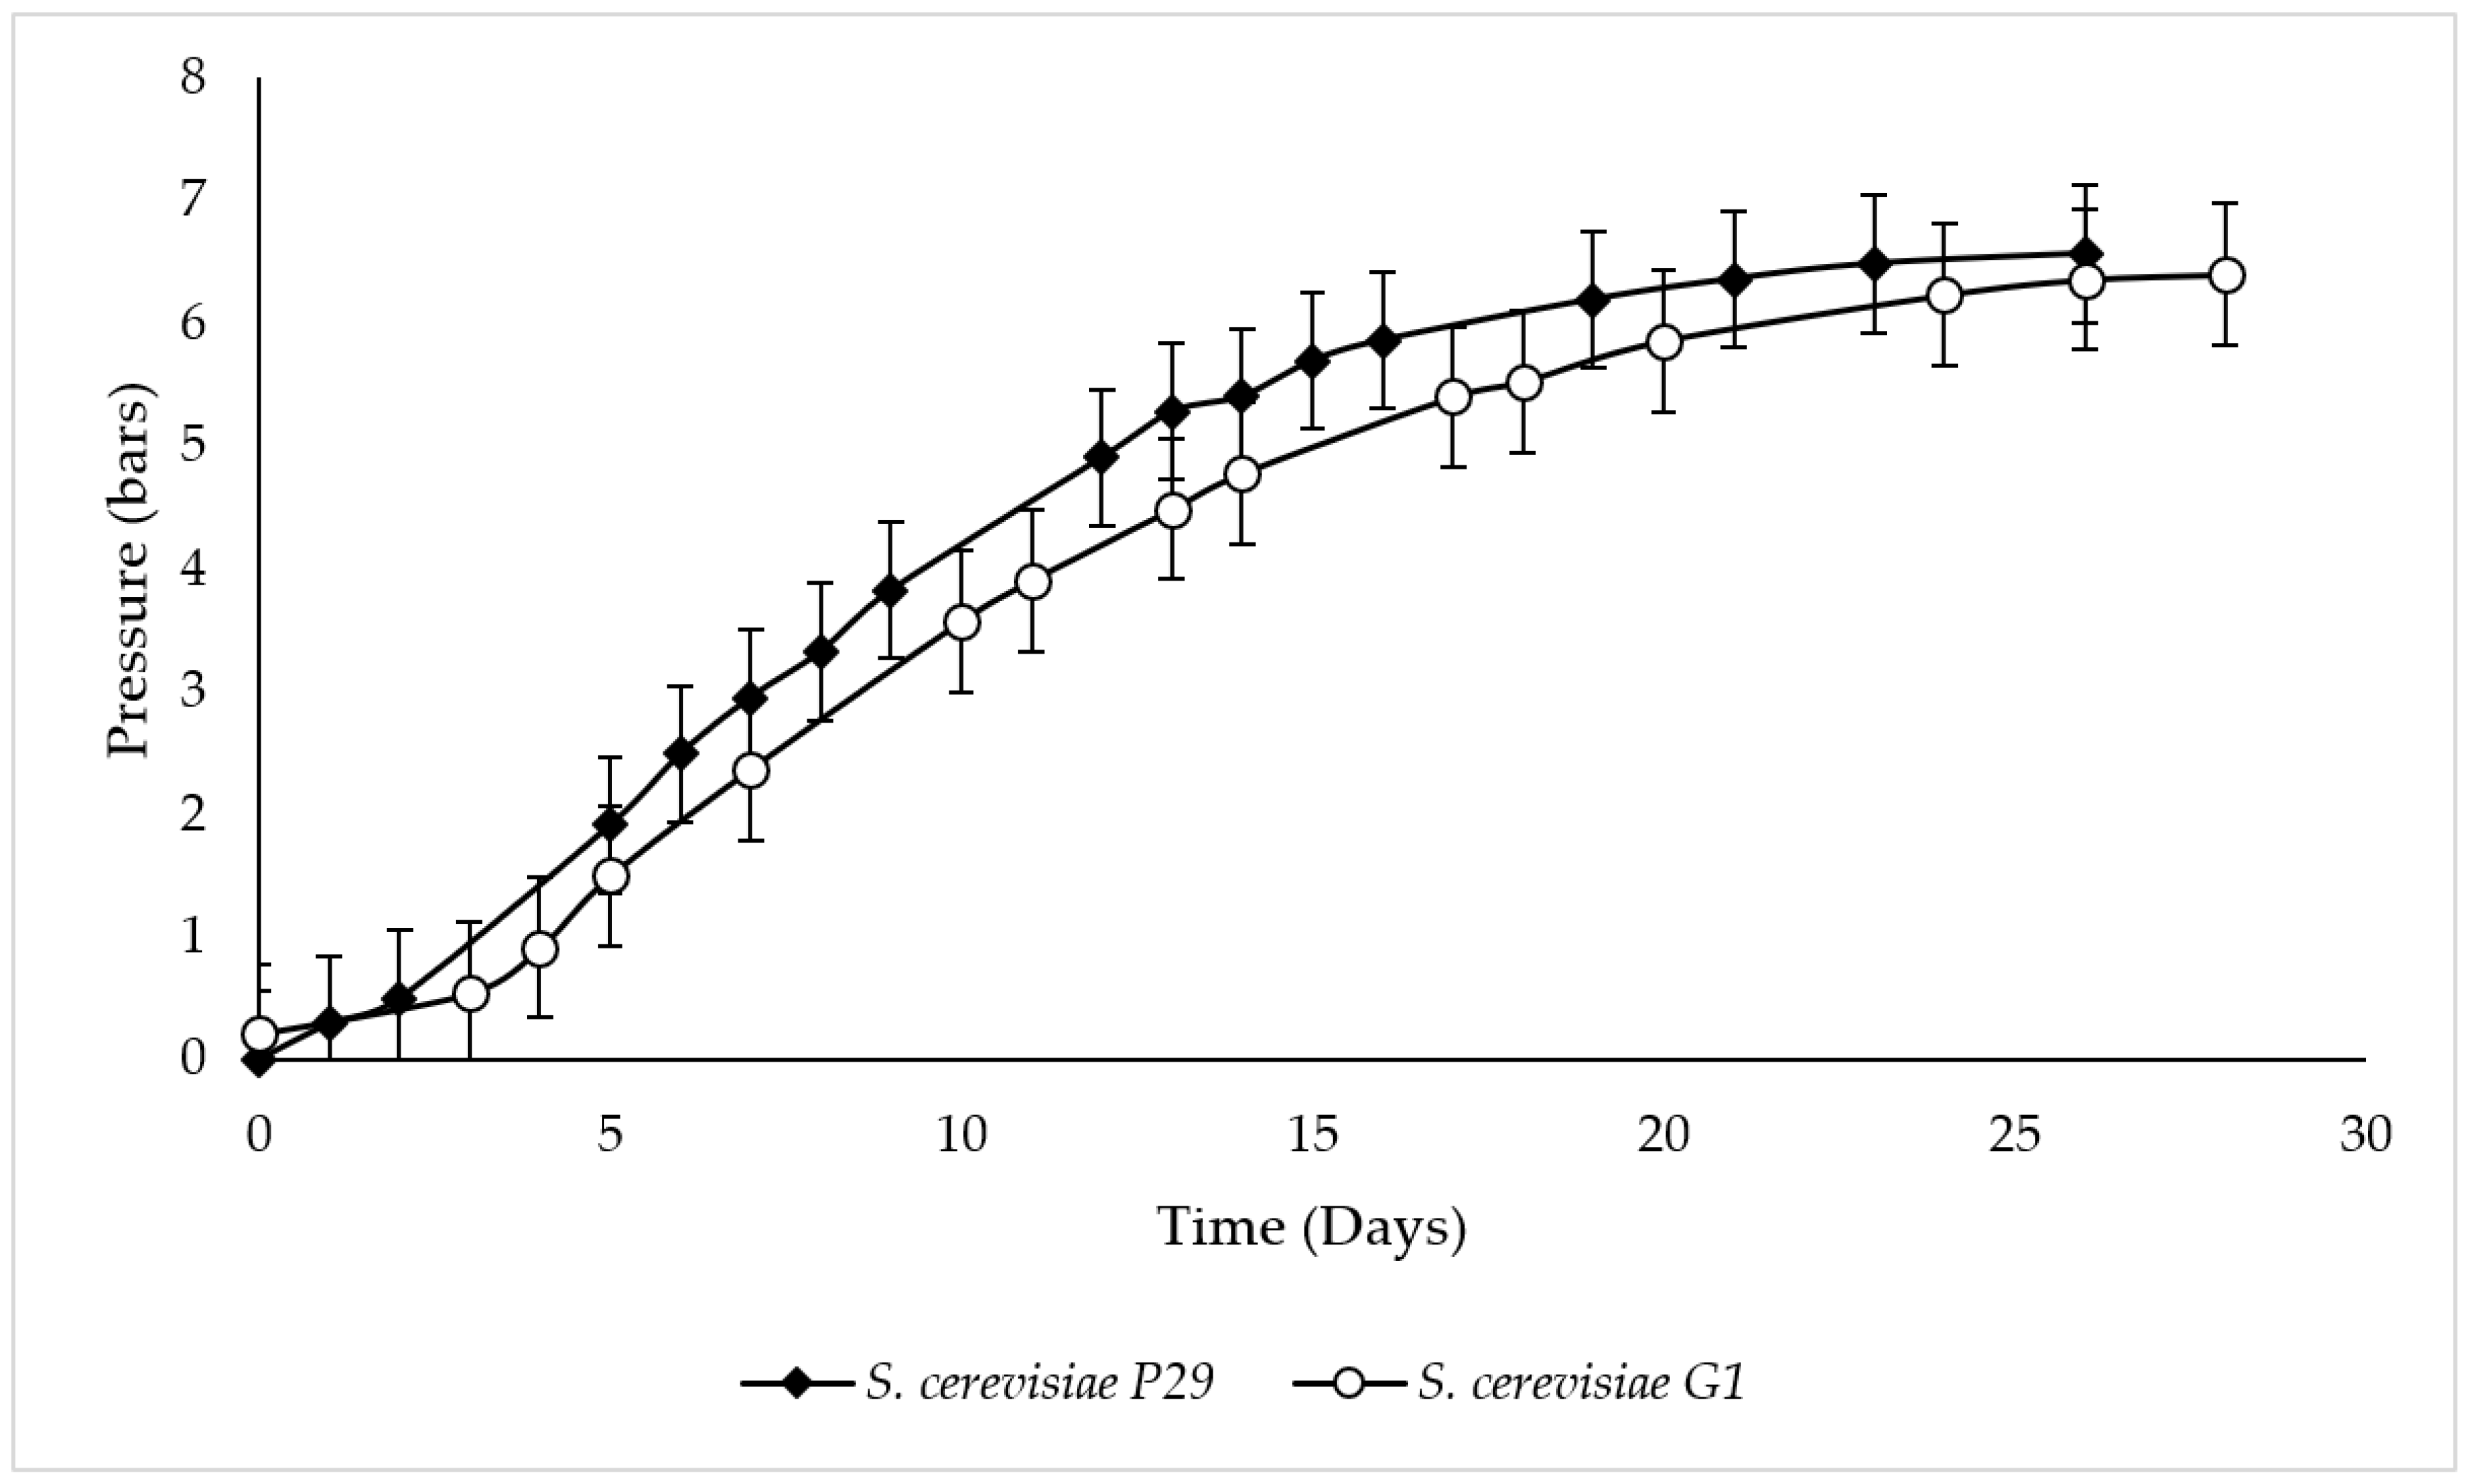
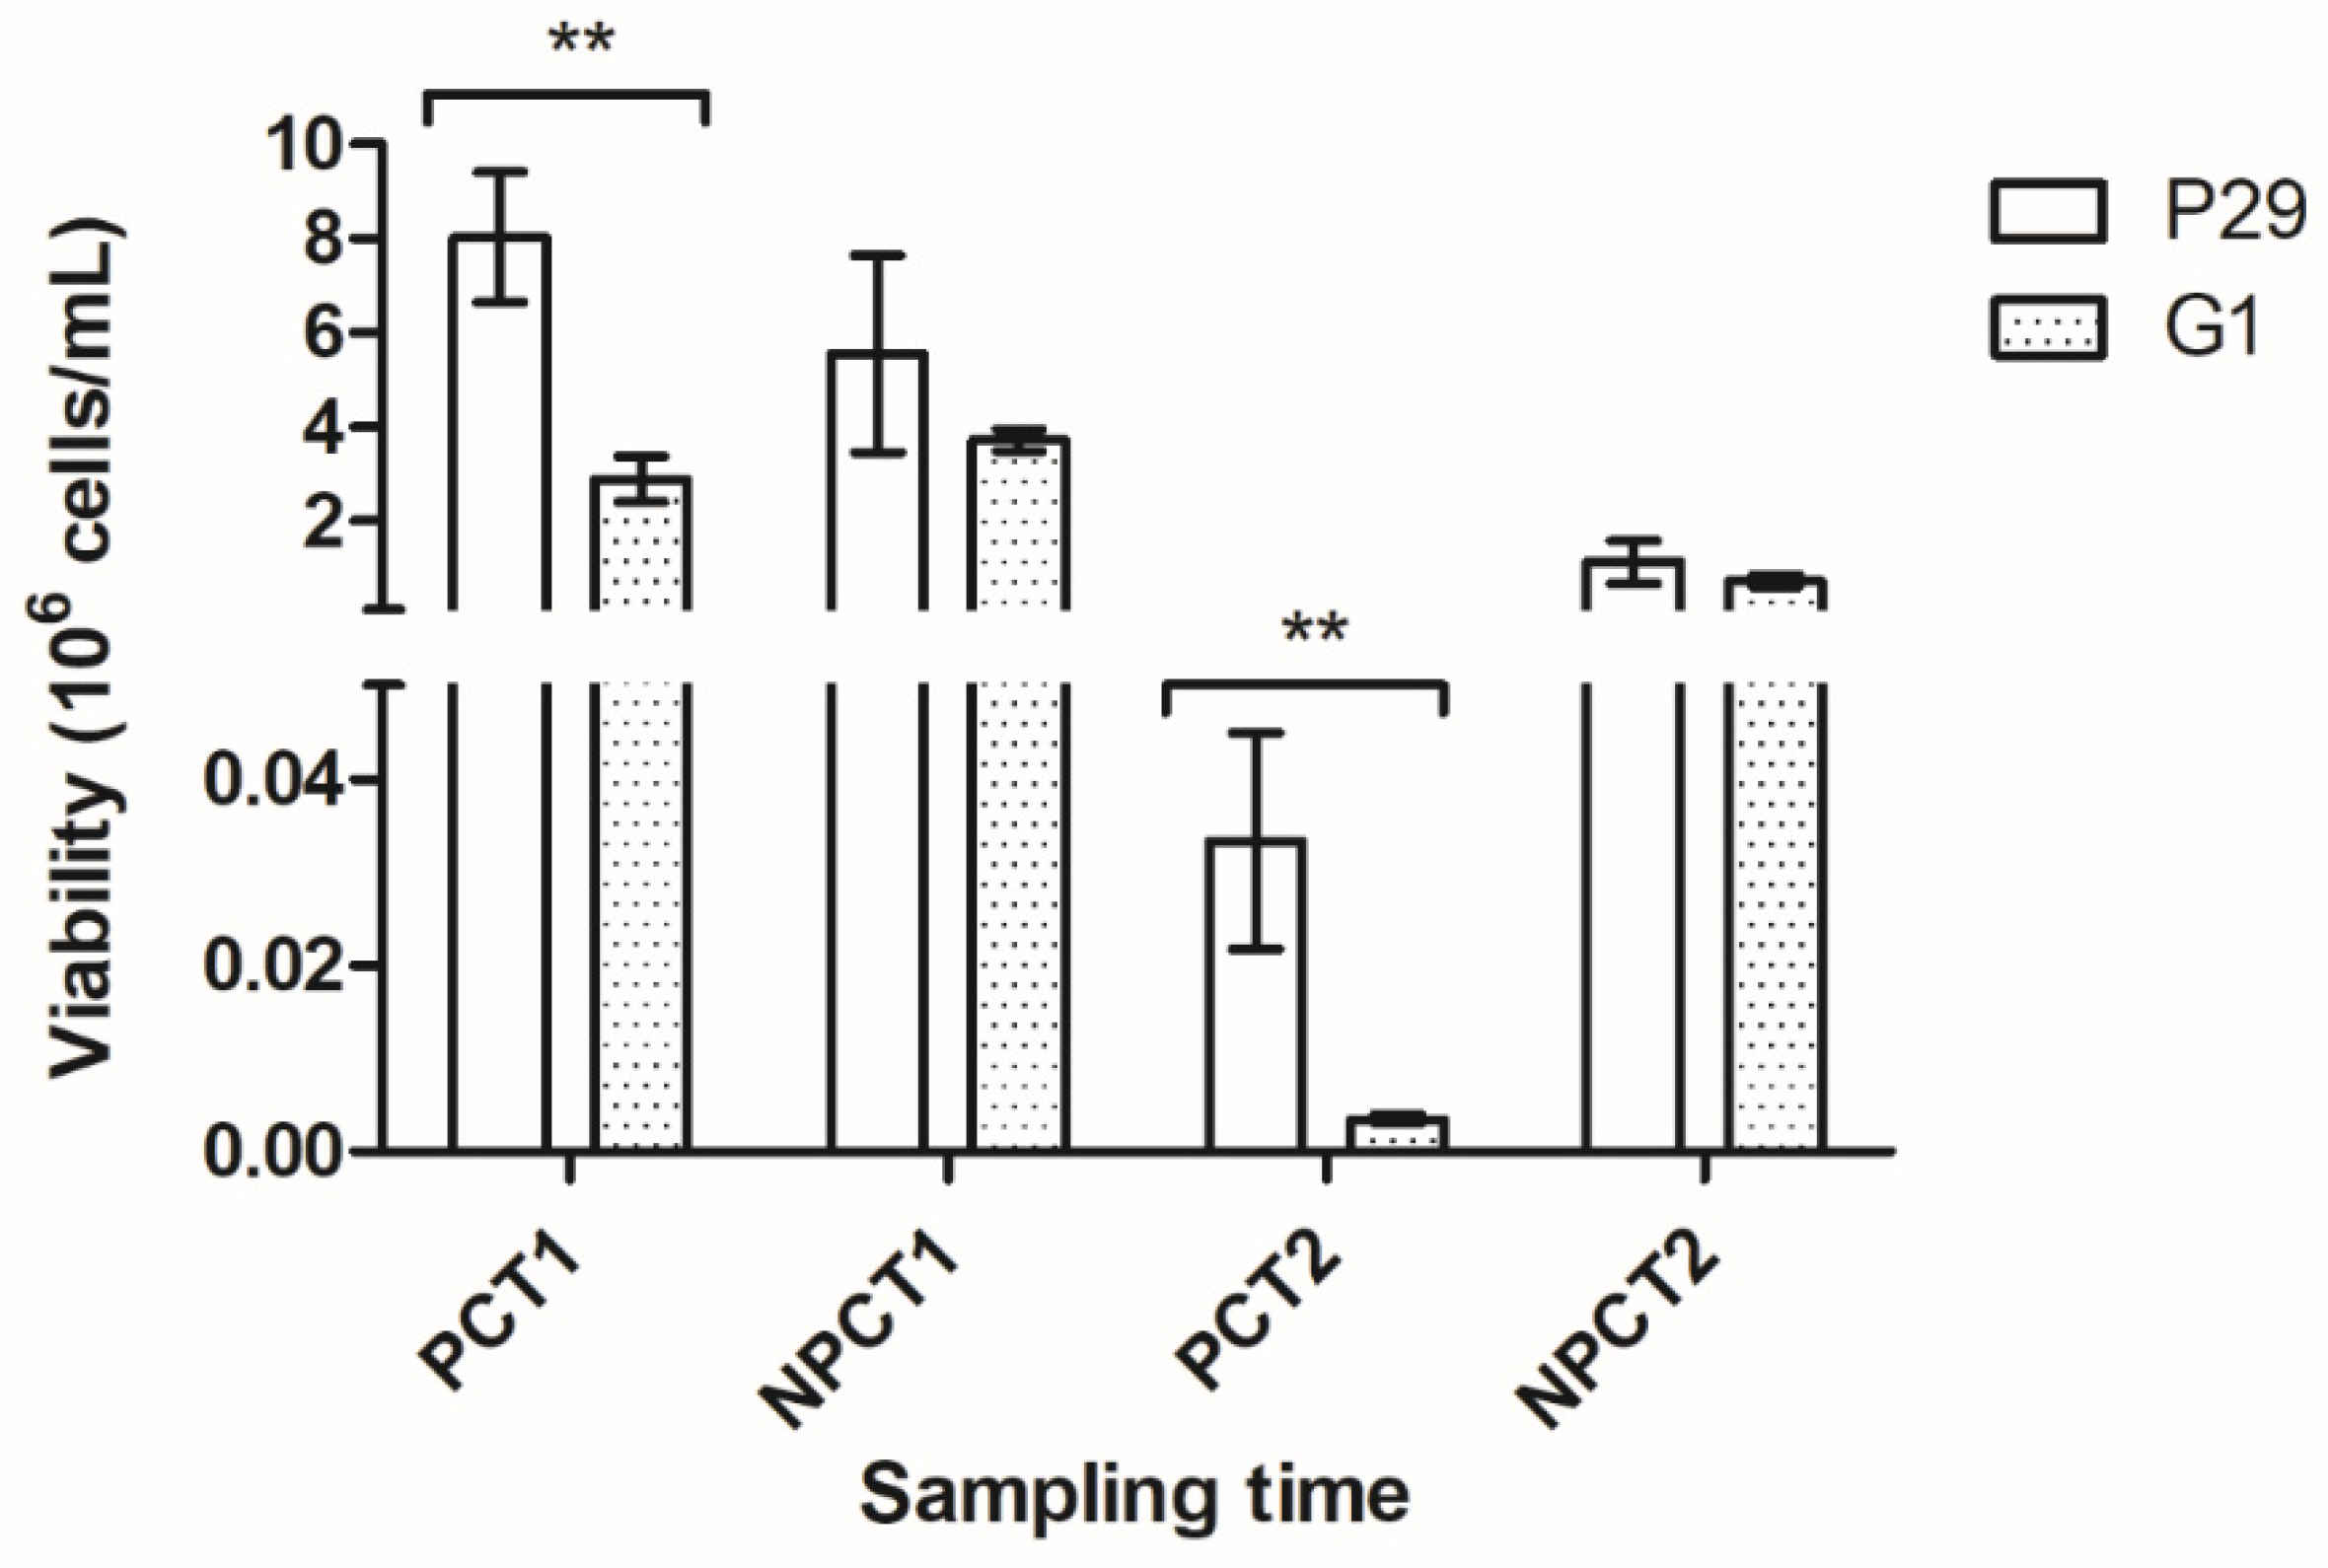
3.1. Second Fermentation Kinetics and Cell Viability
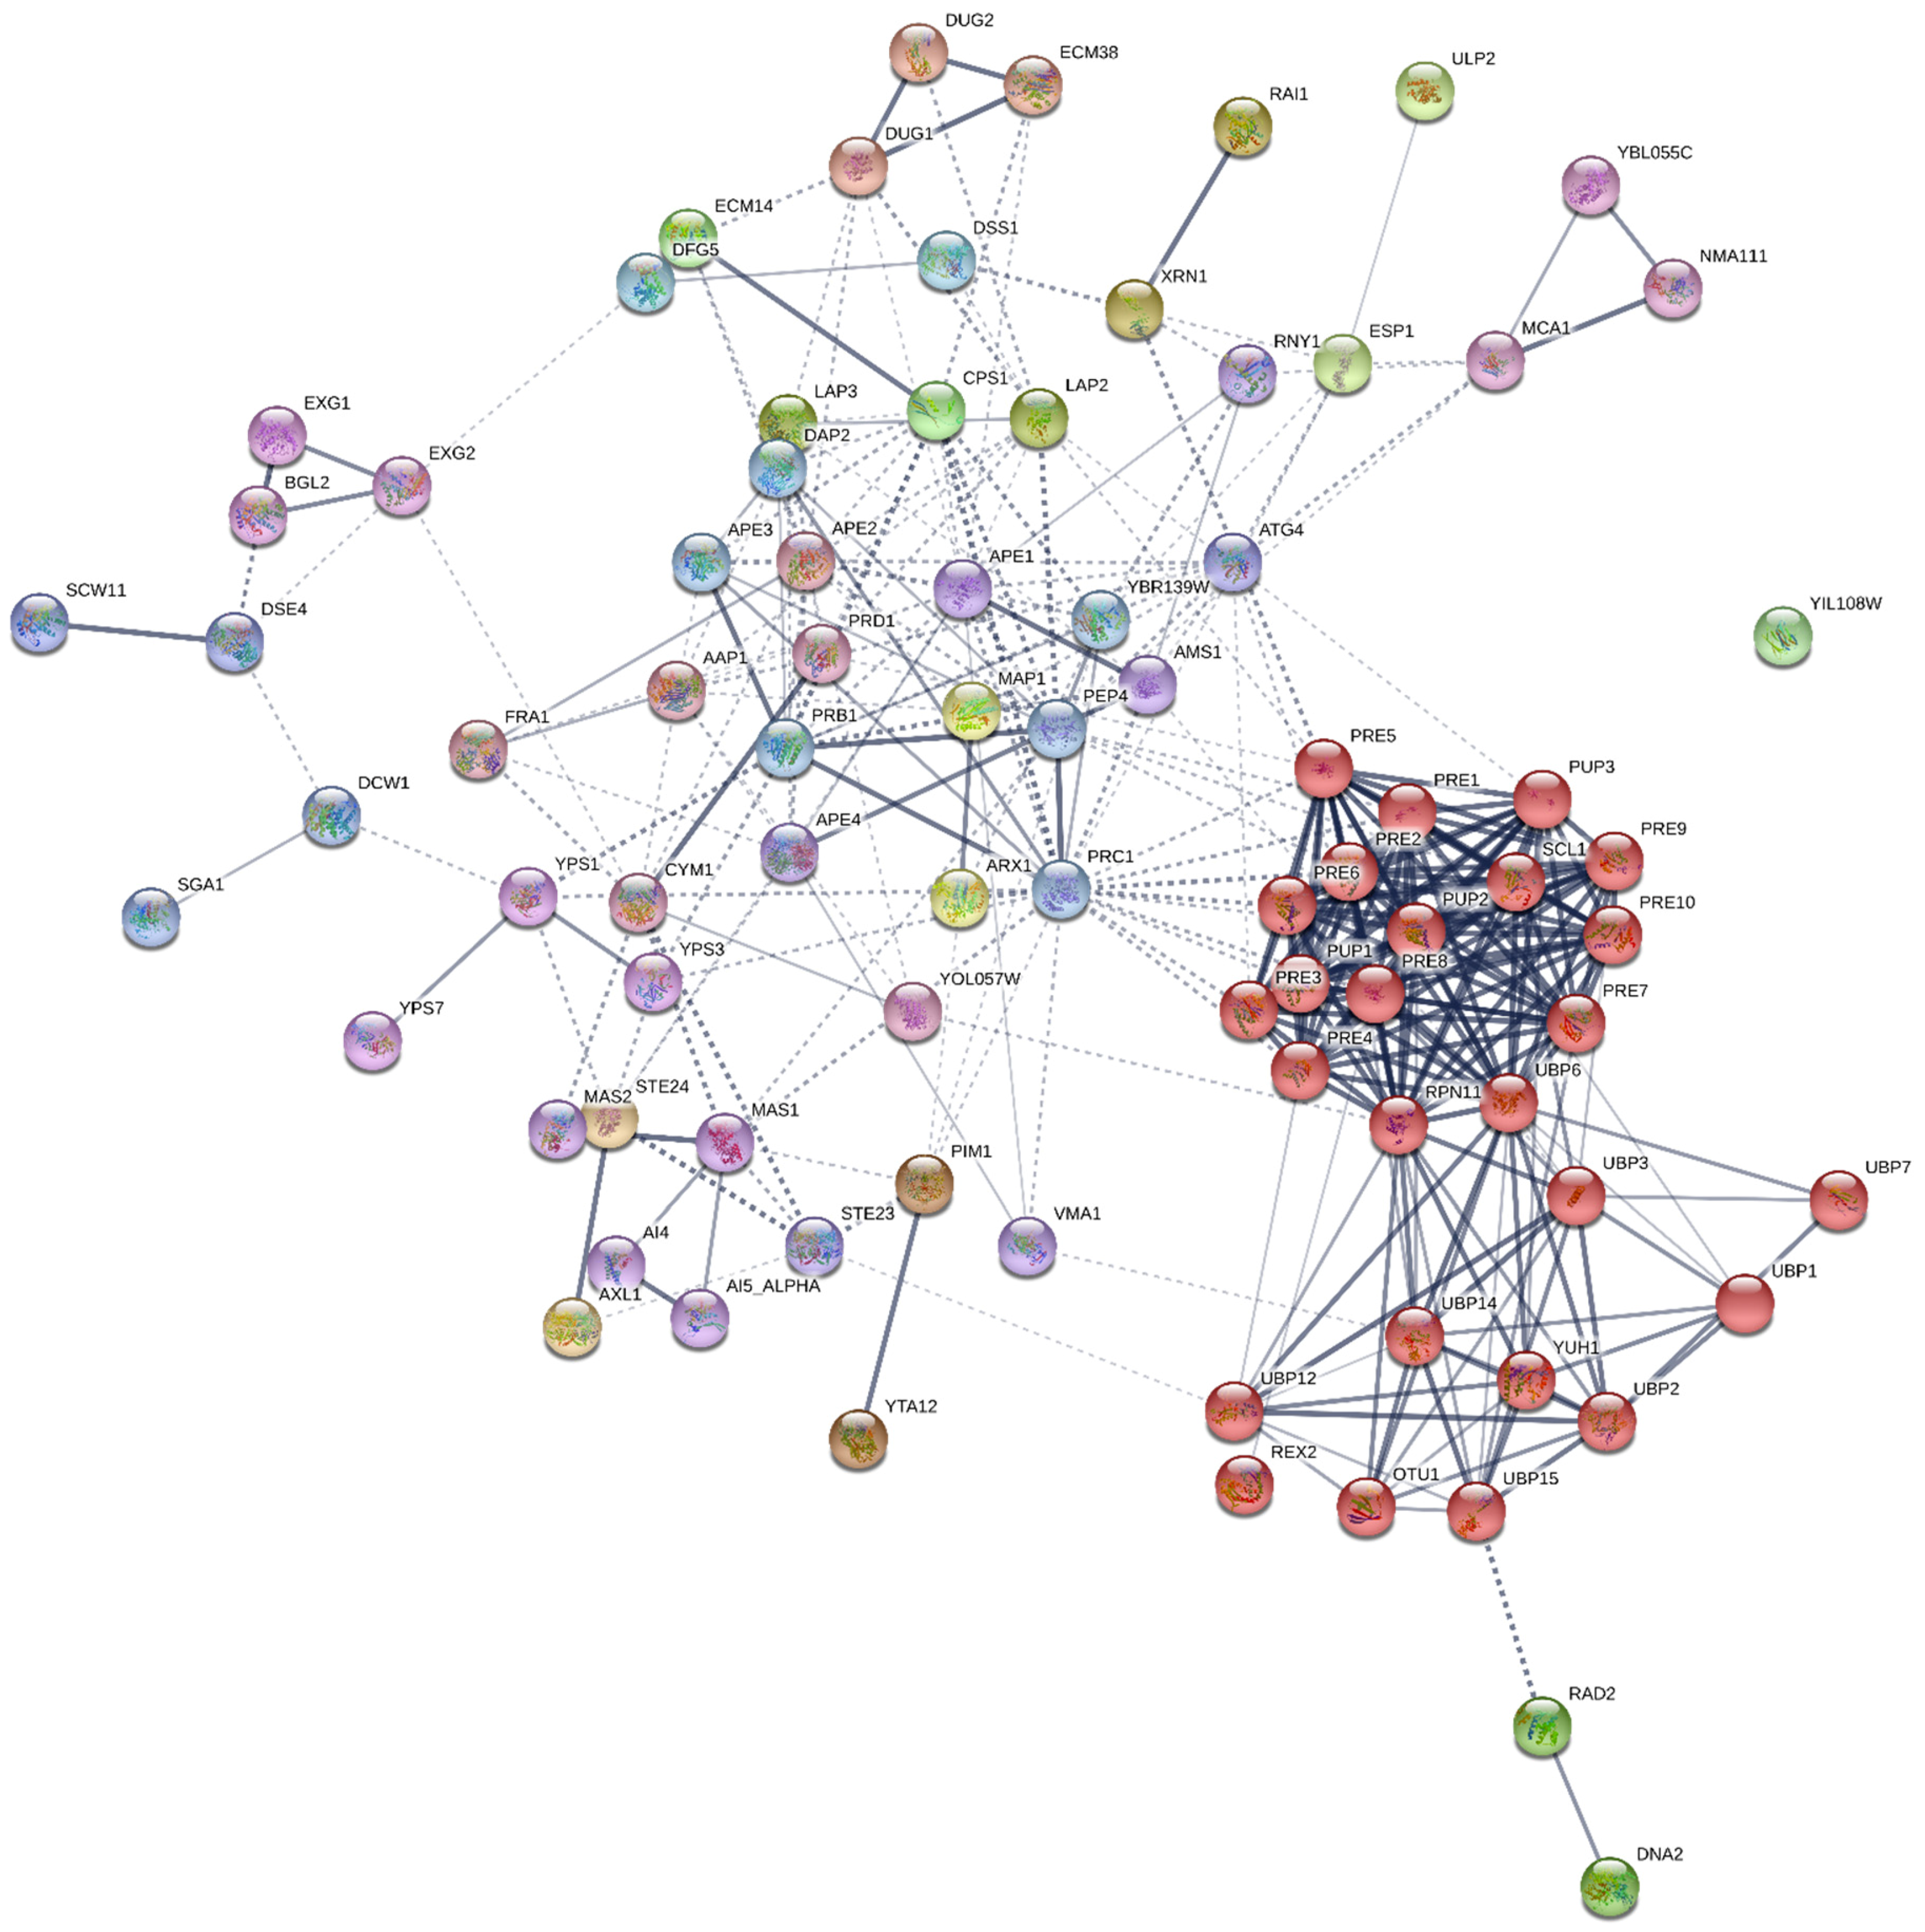
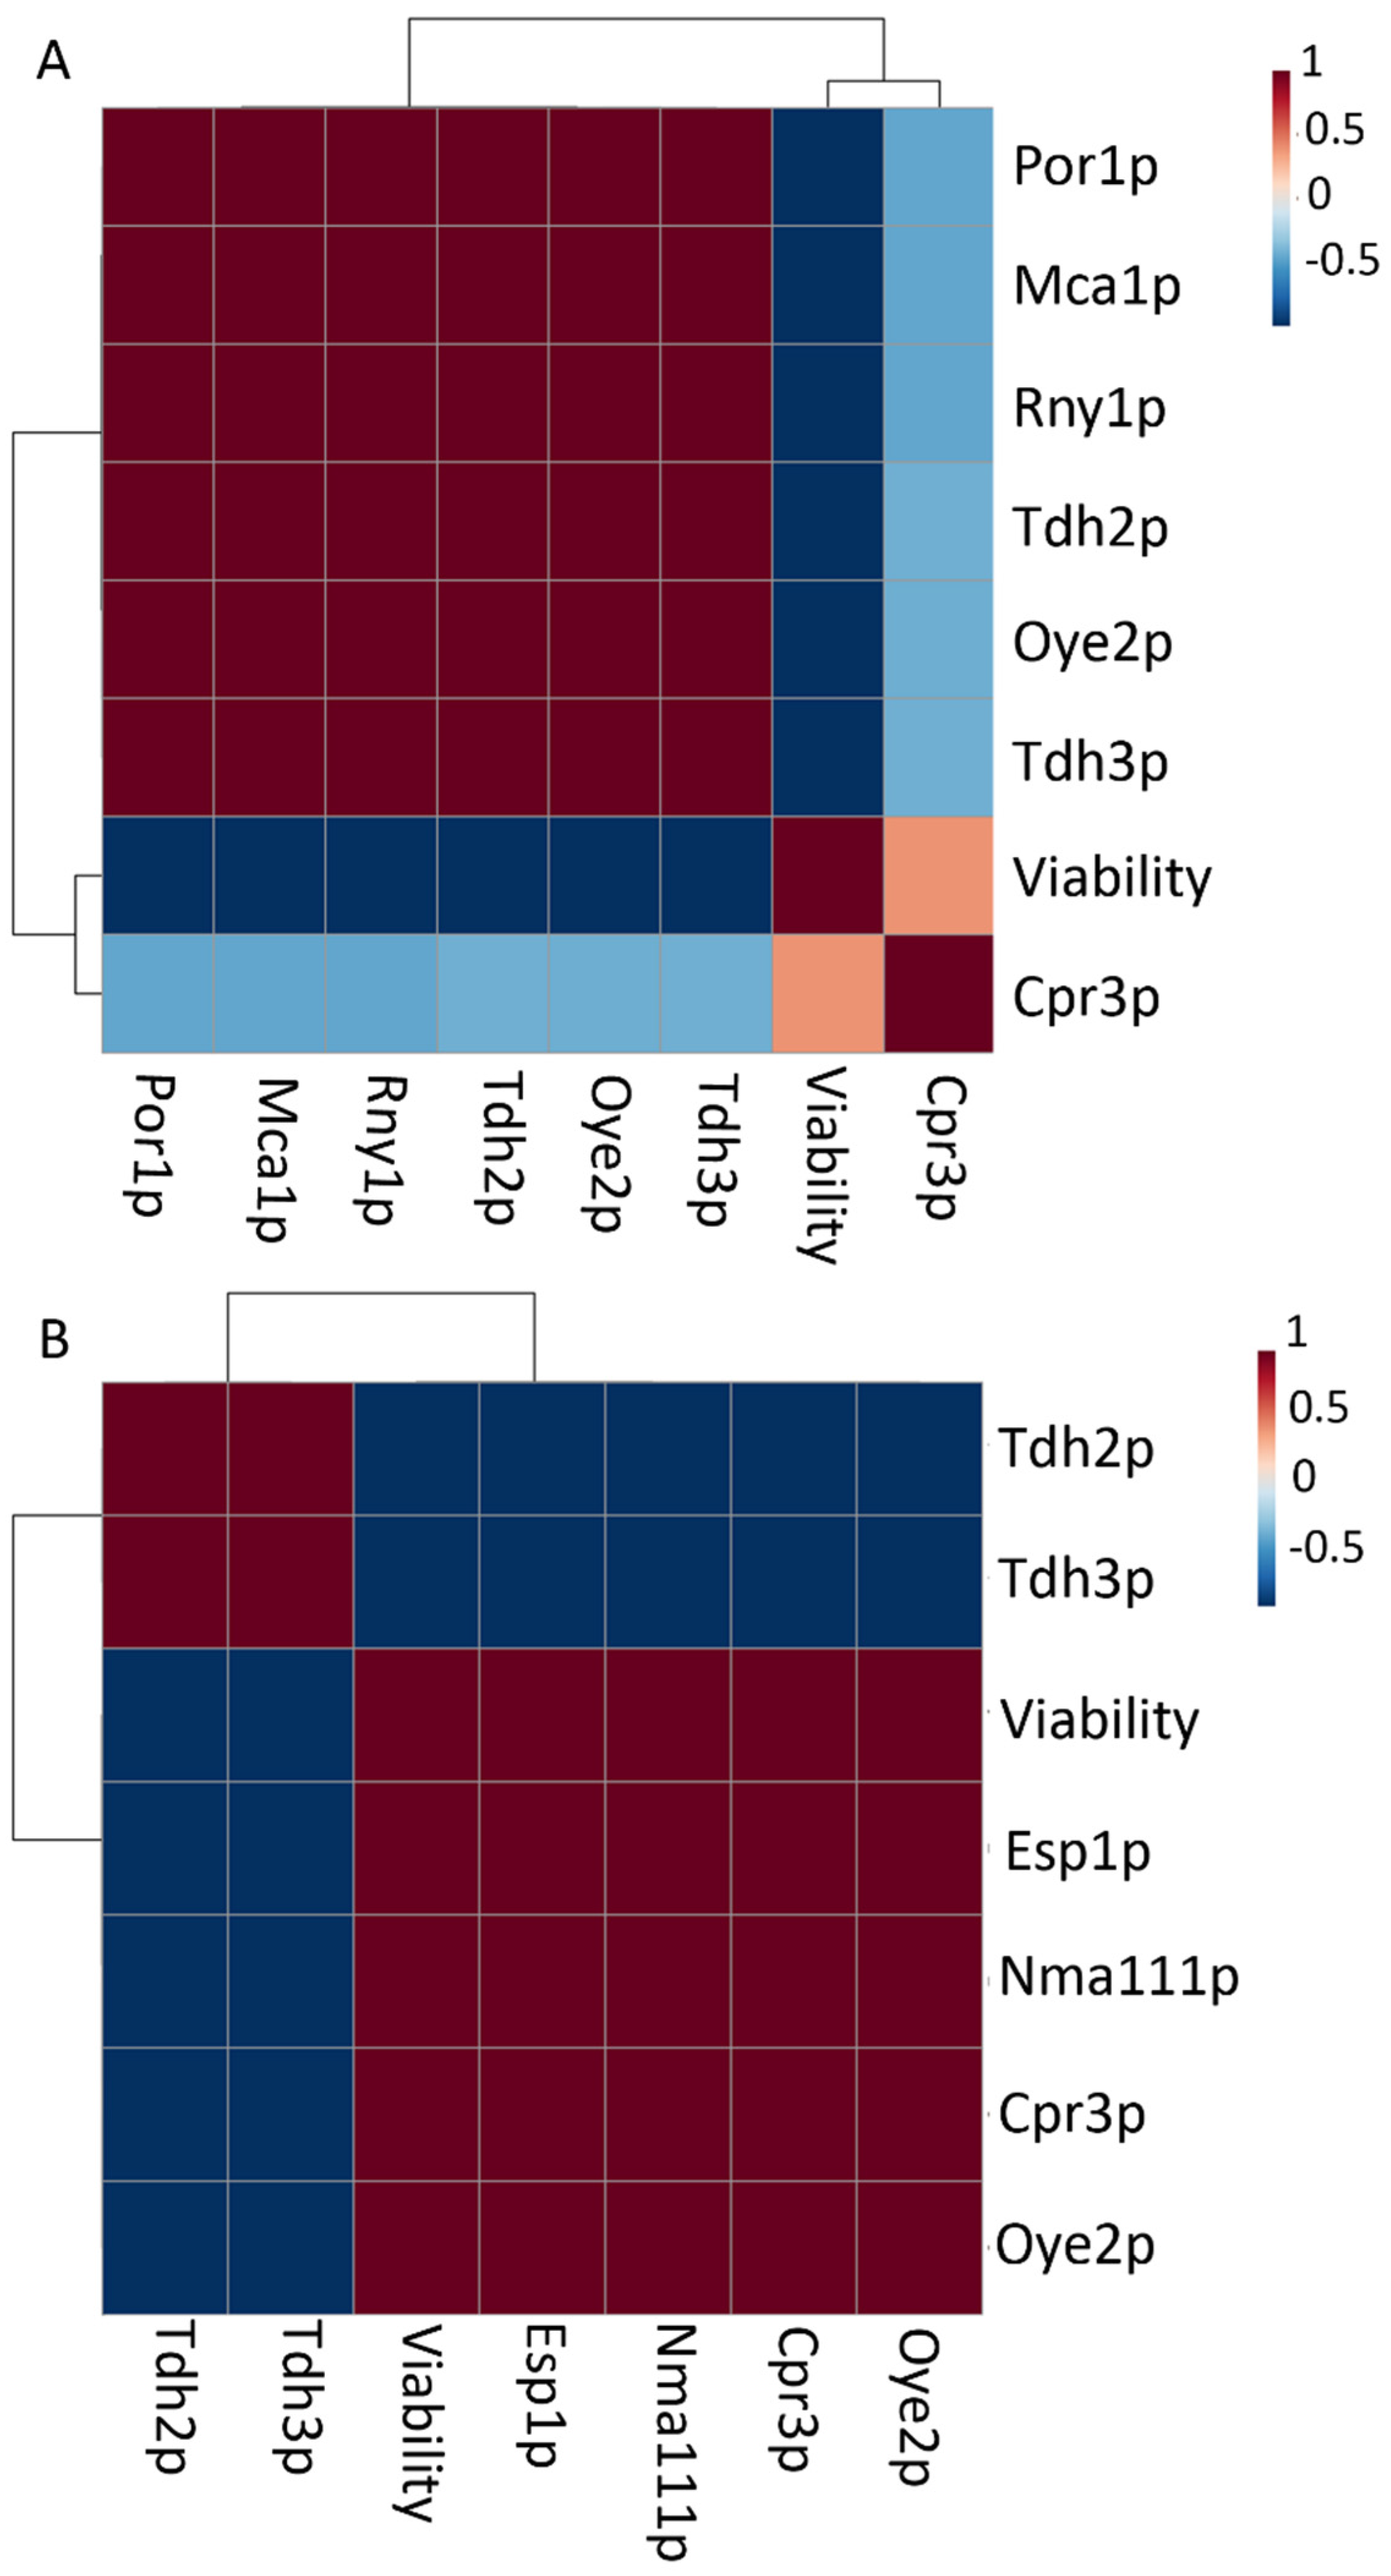
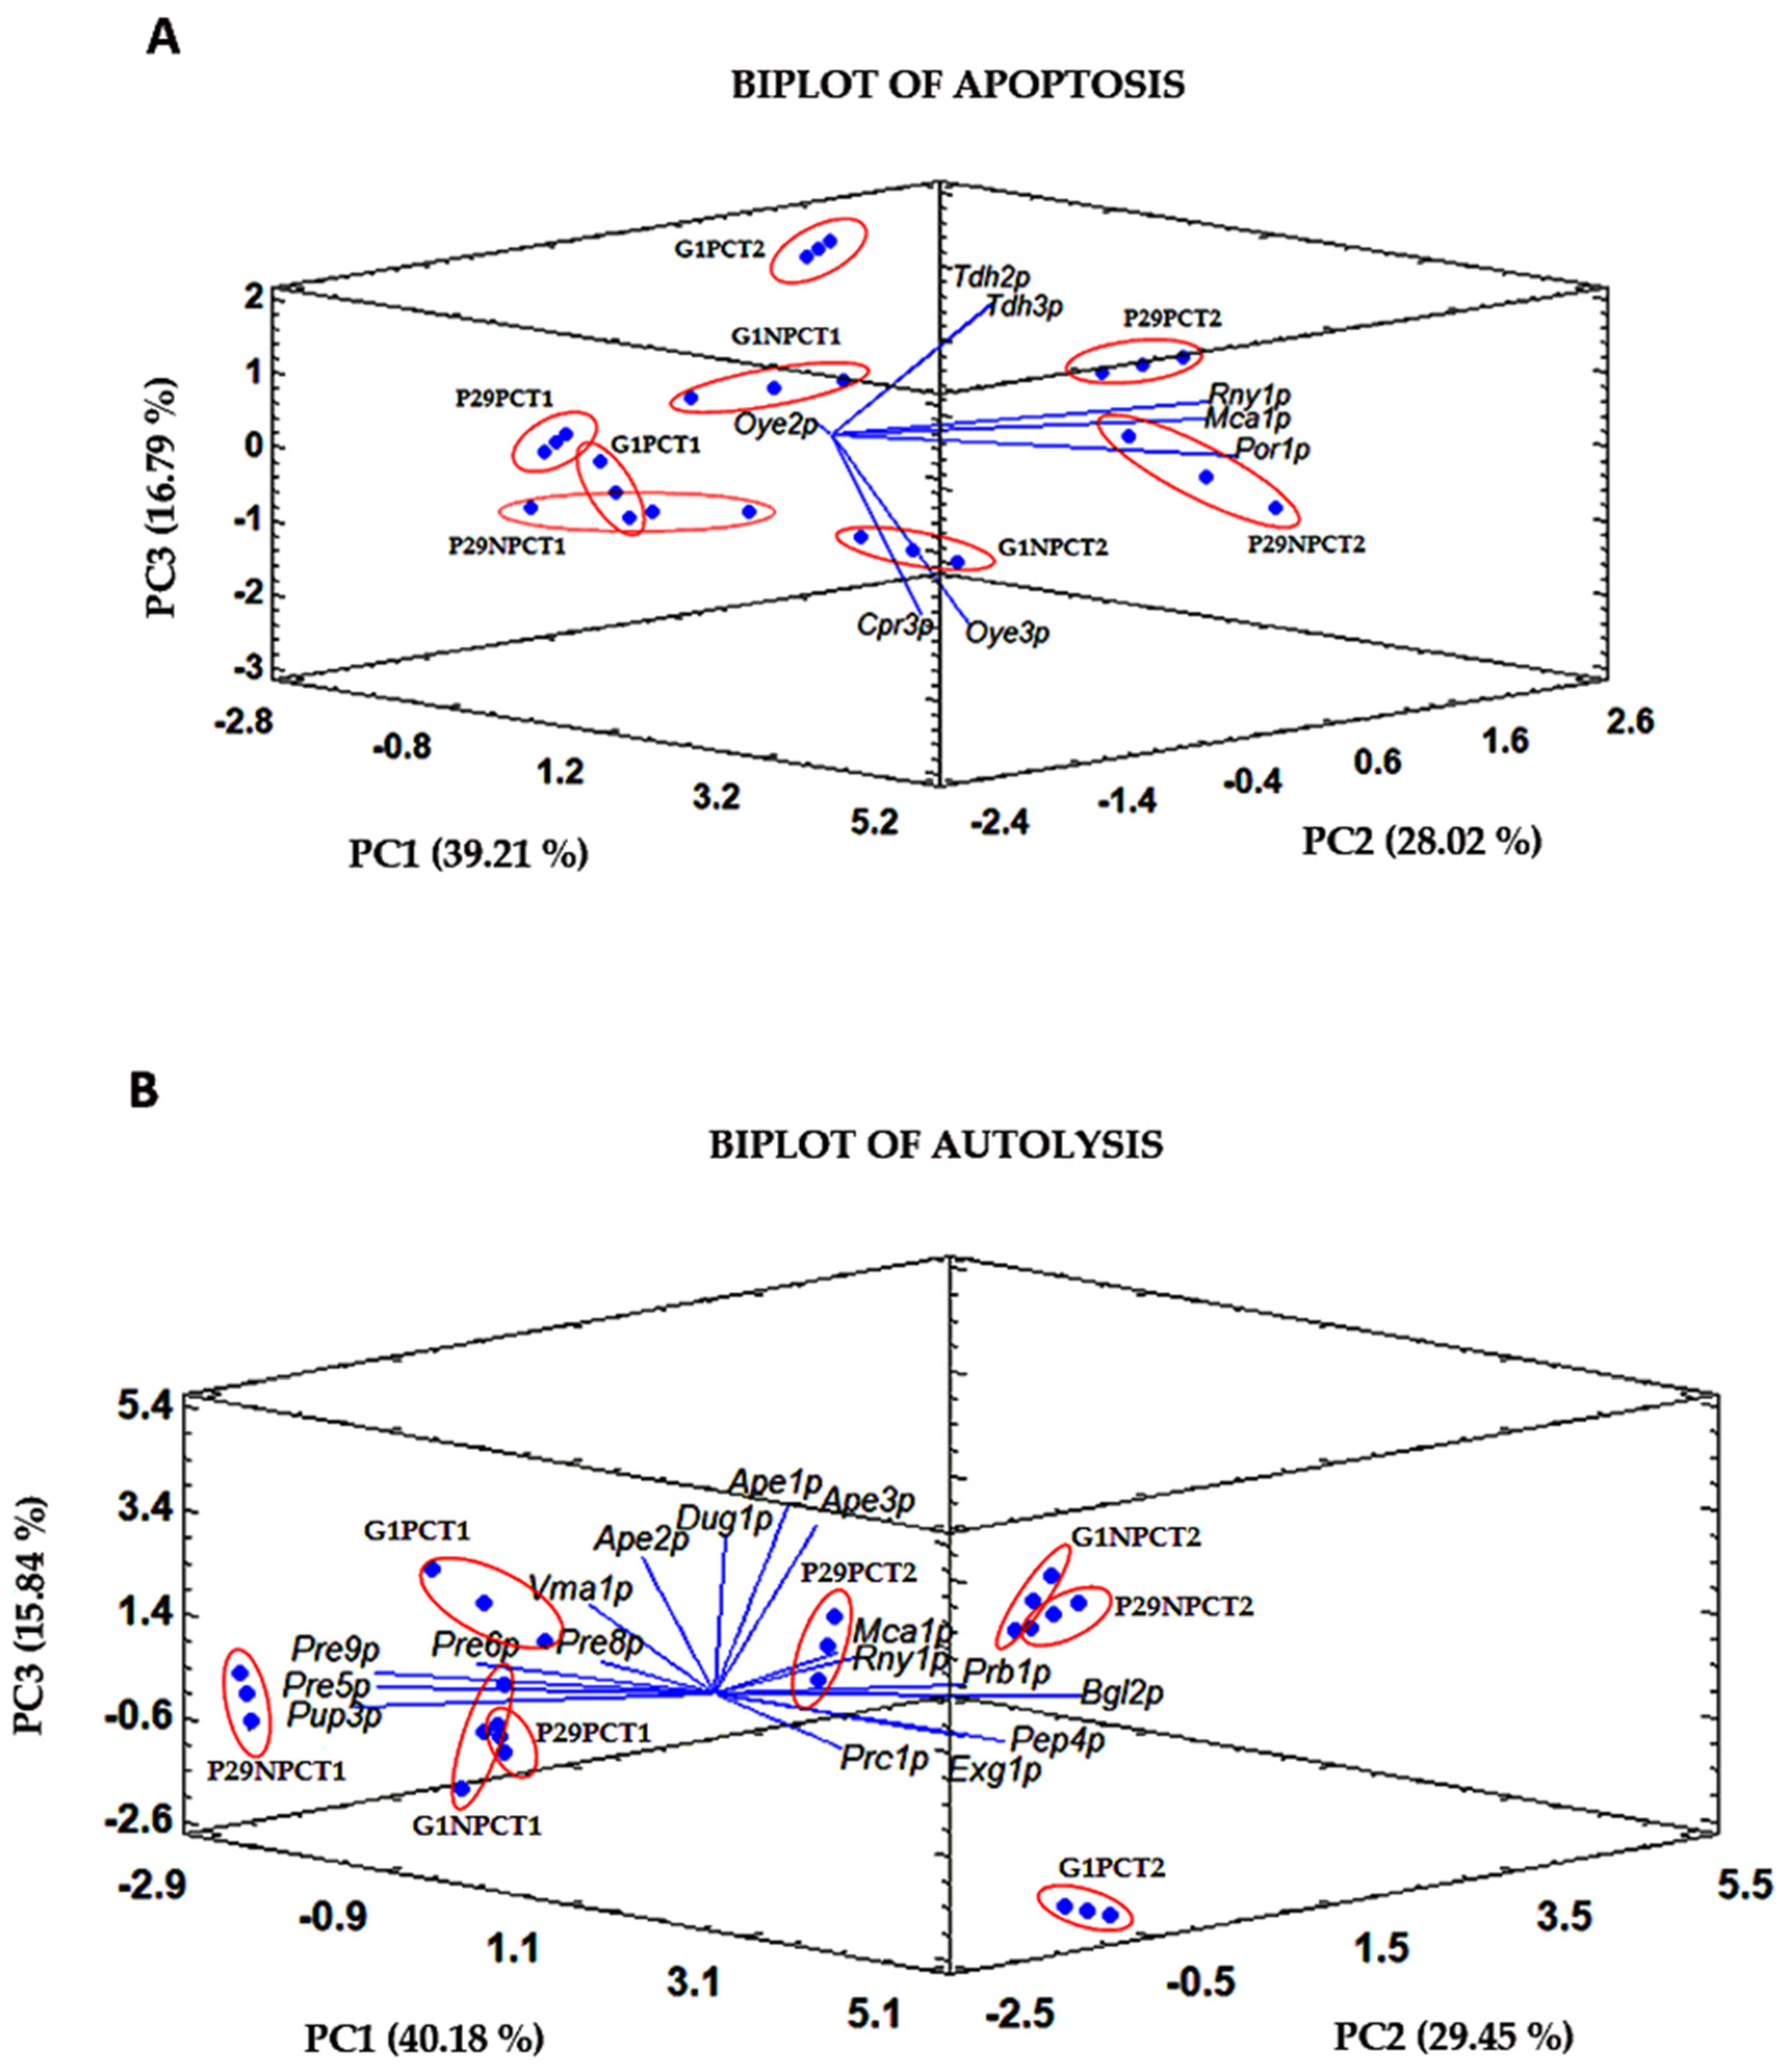
3.2. Study of the Proteome
4. Conclusions
Supplementary Materials
Author Contributions
Funding
Acknowledgments
Conflicts of Interest
References
- Torresi, S.; Frangipane, M.T.; Anelli, G. Biotechnologies in sparkling wine production. Interesting approaches for quality improvement: A review. Food Chem. 2011, 129, 1232–1241. [Google Scholar] [CrossRef] [PubMed]
- Carmona-Gutierrez, D.; Eisenberg, T.; Büttner, S.; Meisinger, C.; Kroemer, G.; Madeo, F. Apoptosis in yeast: Triggers, pathways, subroutines. Cell Death Differ. 2010, 17, 763. [Google Scholar] [CrossRef] [PubMed]
- Carmona-Gutierrez, D.; Bauer, M.A.; Zimmermann, A.; Aguilera, A.; Austriaco, N.; Ayscough, K.; Balzan, R.; Bar-Nun, S.; Barrientos, A.; Belenky, P.; et al. Guidelines and recommendations on yeast cell death nomenclature. Microb. Cell 2018, 5, 4. [Google Scholar] [CrossRef] [PubMed]
- Falcone, C.; Mazzoni, C. External and internal triggers of cell death in yeast. Cell. Mol. Life Sci. 2016, 73, 2237–2250. [Google Scholar] [CrossRef] [PubMed]
- Galluzzi, L.; Vitale, I.; Aaronson, S.A.; Abrams, J.M.; Adam, D.; Agostinis, P.; Alnemri, E.S.; Altucci, L.; Amelio, I.; Andrews, D.W.; et al. Molecular mechanisms of cell death: Recommendations of the Nomenclature Committee on Cell Death. Cell Death Differ. 2018, 25, 486–541. [Google Scholar] [CrossRef] [PubMed]
- Fröhlich, K.U.; Madeo, F. Apoptosis in yeast—A monocellular organism exhibits altruistic behaviour. FEBS Lett. 2000, 473, 6–9. [Google Scholar] [CrossRef]
- Orozco, H.; Matallana, E.; Aranda, A. Genetic manipulation of longevity-related genes as a tool to regulate yeast life span and metabolite production during winemaking. Microb. Cell Fact. 2013, 12, 1. [Google Scholar] [CrossRef] [PubMed]
- Duc, C.; Pradal, M.; Sanchez, I.; Noble, J.; Tesnière, C.; Blondin, B. A set of nutrient limitations trigger yeast cell death in a nitrogen-dependent manner during wine alcoholic fermentation. PLoS ONE 2017, 12, e0184838. [Google Scholar] [CrossRef] [PubMed]
- Babayan, T.L.; Bezrukov, M.G. Autolysis in yeasts. Acta Biotechnol. 1985, 5, 129–136. [Google Scholar] [CrossRef]
- Alexandre, H.; Guilloux-Benatier, M. Yeast autolysis in sparkling wine—A review. Aust. J. Grape Wine Res. 2006, 12, 119–127. [Google Scholar] [CrossRef]
- Leroy, M.J.; Charpentier, M.; Duteurtre, B.; Feuillat, M.; Charpentier, C. Yeast autolysis during champagne aging. Am. J. Enol. Viticult. 1990, 41, 21–28. [Google Scholar]
- Martínez-Rodríguez, A.J.; Polo, M.C. Characterization of the nitrogen compounds released during yeast autolysis in a model wine system. J. Agric. Food Chem. 2000, 48, 1081–1085. [Google Scholar] [CrossRef] [PubMed]
- Martınez-Rodriguez, A.J.; Carrascosa, A.V.; Polo, M.C. Release of nitrogen compounds to the extracellular medium by three strains of Saccharomyces cerevisiae during induced autolysis in a model wine system. Int. J. Food Microbiol. 2001, 68, 155–160. [Google Scholar] [CrossRef]
- Cebollero, E.; Carrascosa, A.V.; Gonzalez, R. Evidence for yeast autophagy during simulation of sparkling wine aging: A reappraisal of the mechanism of yeast autolysis in wine. Biotechnol. Prog. 2005, 21, 614–616. [Google Scholar] [CrossRef] [PubMed]
- Gonzalez, R.; Martinez-Rodriguez, A.J.; Carrascosa, A.V. Yeast autolytic mutants potentially useful for sparkling wine production. Int. J. Food Microbiol. 2003, 84, 21–26. [Google Scholar] [CrossRef]
- Tabera, L.; Muñoz, R.; Gonzalez, R. Deletion of BCY1 from the Saccharomyces cerevisiae genome is semidominant and induces autolytic phenotypes suitable for improvement of sparkling wines. Appl. Environ. Microbiol. 2006, 72, 2351–2358. [Google Scholar] [CrossRef] [PubMed]
- Alexandre, H. Flor yeasts of Saccharomyces cerevisiae-their ecology, genetics and metabolism. Int. J. Food Microbiol. 2013, 167, 269–275. [Google Scholar] [CrossRef] [PubMed]
- Legras, J.L.; Moreno-Garcia, J.; Zara, S.; Zara, G.; Garcia-Martinez, T.; Mauricio, J.C.; Mannazzu, I.; Coi, A.L.; Bou Zeidan, M.; Dequin, S.; et al. Flor yeast: New perspectives beyond wine aging. Front. Microbiol. 2016, 7, 503. [Google Scholar] [CrossRef] [PubMed]
- Reynolds, T.B.; Fink, G.R. Bakers’ yeast, a model for fungal biofilm formation. Science 2001, 291, 878–881. [Google Scholar] [CrossRef] [PubMed]
- Zara, S.; Antonio Farris, G.; Budroni, M.; Bakalinsky, A.T. HSP12 is essential for biofilm formation by a Sardinian wine strain of S. cerevisiae. Yeast 2002, 19, 269–276. [Google Scholar] [CrossRef] [PubMed]
- Charpentier, C.; Dos Santos, A.M.; Feuillat, M. Release of macromolecules by Saccharomyces cerevisiae during ageing of French flor sherry wine “Vin jaune”. Int. J. Food Microbiol. 2004, 96, 253–262. [Google Scholar] [CrossRef] [PubMed]
- Moreno-García, J.; García-Martínez, T.; Moreno, J.; Millán, M.C.; Mauricio, J.C. A proteomic and metabolomic approach for understanding the role of the flor yeast mitochondria in the velum formation. Int. J. Food Microbiol. 2014, 172, 21–29. [Google Scholar] [CrossRef] [PubMed]
- OIV. 2018. Available online: https://www.oiv.int/en (accessed on 15 January 2019).
- Moreno-García, J.; García-Martínez, T.; Moreno, J.; Mauricio, J.C. Proteins involved in flor yeast carbon metabolism under biofilm formation conditions. Food Microbiol. 2015, 46, 25–33. [Google Scholar] [CrossRef] [PubMed]
- Ishihama, Y.; Oda, Y.; Tabata, T.; Sato, T.; Nagasu, T.; Rappsilber, J.; Mann, M. Exponentially modified protein abundance index (emPAI) for estimation of absolute protein amount in proteomics by the number of sequenced peptides per protein. Mol. Cell. Proteom. 2005, 4, 1265–1272. [Google Scholar] [CrossRef] [PubMed]
- Martínez-Rodríguez, A.J.; Polo, M.C.; Carrascosa, A.V. Structural and ultrastructural changes in yeast cells during autolysis in a model wine system and in sparkling wines. Int. J. Food Microbiol. 2001, 71, 45–51. [Google Scholar] [CrossRef]
- Odat, O.; Matta, S.; Khalil, H.; Kampranis, S.C.; Pfau, R.; Tsichlis, P.N.; Makris, A.M. Old yellow enzymes, highly homologous FMN oxidoreductases with modulating roles in oxidative stress and programmed cell death in yeast. J. Biol. Chem. 2007, 282, 36010–36023. [Google Scholar] [CrossRef] [PubMed]
- Alexandre, H.; Ansanay-Galeote, V.; Dequin, S.; Blondin, B. Global gene expression during short-term ethanol stress in Saccharomyces cerevisiae. FEBS Lett. 2001, 498, 98–103. [Google Scholar] [CrossRef]
- Matouschek, A.; Rospert, S.; Schmid, K.; Glick, B.S.; Schatz, G. Cyclophilin catalyzes protein folding in yeast mitochondria. Proc. Natl. Acad. Sci. USA 1995, 92, 6319–6323. [Google Scholar] [CrossRef] [PubMed]
- Liang, Q.; Zhou, B. Copper and manganese induce yeast apoptosis via different pathways. Mol. Biol. Cell 2007, 18, 4741–4749. [Google Scholar] [CrossRef] [PubMed]
- Nakagawa, T.; Shimizu, S.; Watanabe, T.; Yamaguchi, O.; Otsu, K.; Yamagata, H.; Inohara, H.; Kubo, T.; Tsujimoto, Y. Cyclophilin D-dependent mitochondrial permeability transition regulates some necrotic but not apoptotic cell death. Nature 2005, 434, 652. [Google Scholar] [CrossRef] [PubMed]
- Eisenberg, T.; Carmona-Gutierrez, D.; Büttner, S.; Tavernarakis, N.; Madeo, F. Necrosis in yeast. Apoptosis 2010, 15, 257–268. [Google Scholar] [CrossRef] [PubMed]
- Yang, H.; Ren, Q.; Zhang, Z. Cleavage of Mcd1 by caspase-like protease Esp1 promotes apoptosis in budding yeast. Mol. Biol. Cell 2008, 19, 2127–2134. [Google Scholar] [CrossRef] [PubMed]
- Walter, D.; Wissing, S.; Madeo, F.; Fahrenkrog, B. The inhibitor-of-apoptosis protein Bir1p protects against apoptosis in S. cerevisiae and is a substrate for the yeast homologue of Omi/HtrA2. J. Cell Sci. 2006, 119, 1843–1851. [Google Scholar] [CrossRef] [PubMed]
- Penacho, V.; Valero, E.; Gonzalez, R. Transcription profiling of sparkling wine second fermentation. Int. J. Food Microbiol. 2012, 153, 176–182. [Google Scholar] [CrossRef] [PubMed]
- Almeida, B.; Buttner, S.; Ohlmeier, S.; Silva, A.; Mesquita, A.; Sampaio-Marques, B.; Osório, N.S.; Kollau, A.; Mayer, B.; Leão, C.; et al. NO-mediated apoptosis in yeast. J. Cell Sci. 2007, 120, 3279–3288. [Google Scholar] [CrossRef] [PubMed] [Green Version]
- Silva, A.; Almeida, B.; Sampaio-Marques, B.; Reis, M.I.R.; Ohlmeier, S.; Rodrigues, F.; Do Vale, A.; Ludovico, P. Glyceraldehyde-3-phosphate dehydrogenase (GAPDH) is a specific substrate of yeast metacaspase. Biochim. Biophys. Acta BBA Mol. Cell Res. 2011, 1813, 2044–2049. [Google Scholar] [CrossRef] [PubMed]
- McAlister, L.; Holland, M.J. Differential expression of the three yeast glyceraldehyde-3-phosphate dehydrogenase genes. J. Biol. Chem. 1985, 260, 15019–15027. [Google Scholar] [PubMed]
- Thompson, D.M.; Parker, R. The RNase Rny1p cleaves tRNAs and promotes cell death during oxidative stress in Saccharomyces cerevisiae. J. Cell Biol. 2009, 185, 43–50. [Google Scholar] [CrossRef] [PubMed]
- Trindade, D.; Pereira, C.; Chaves, S.R.; Manon, S.; Côrte-Real, M.; Sousa, M.J. VDAC regulates AAC-mediated apoptosis and cytochrome c release in yeast. Microb. Cell 2016, 3, 500. [Google Scholar] [CrossRef] [PubMed]
- Kitagaki, H.; Araki, Y.; Funato, K.; Shimoi, H. Ethanol-induced death in yeast exhibits features of apoptosis mediated by mitochondrial fission pathway. FEBS Lett. 2007, 581, 2935–2942. [Google Scholar] [CrossRef] [PubMed] [Green Version]
- Li, F.; Flanary, P.L.; Altieri, D.C.; Dohlman, H.G. Cell division regulation by BIR1, a member of the inhibitor of apoptosis family in yeast. J. Biol. Chem. 2000, 275, 6707–6711. [Google Scholar] [CrossRef] [PubMed]
- Wissing, S.; Ludovico, P.; Herker, E.; Büttner, S.; Engelhardt, S.M.; Decker, T.; Link, A.; Proksch, A.; Rodrigues, F.; Corte-Real, M.; et al. An AIF orthologue regulates apoptosis in yeast. J. Cell Biol. 2004, 166, 969–974. [Google Scholar] [CrossRef] [PubMed]
- Mrsa, V.; Klebl, F.; Tanner, W. Purification and characterization of the Saccharomyces cerevisiae BGL2 gene product, a cell wall endo-beta-1, 3-glucanase. J. Bacteriol. 1993, 175, 2102–2106. [Google Scholar] [CrossRef] [PubMed]
- Cappellaro, C.; Mrsa, V.; Tanner, W. New potential cell wall glucanases of Saccharomyces cerevisiae and their involvement in mating. J. Bacteriol. 1998, 180, 5030–5037. [Google Scholar] [PubMed]
- Chantret, I.; Frenoy, J.P.; Moore, S.E. Free-oligosaccharide control in the yeast Saccharomyces cerevisiae: Roles for peptide: N-glycanase (Png1p) and vacuolar mannosidase (Ams1p). Biochem. J. 2003, 373, 901–908. [Google Scholar] [CrossRef] [PubMed]
- Trumbly, R.J.; Bradley, G. Isolation and characterization of aminopeptidase mutants of Saccharomyces cerevisiae. J. Bacteriol. 1983, 156, 36–48. [Google Scholar] [PubMed]
- Jensen, R.E.; Yaffe, M.P. Import of proteins into yeast mitochondria: The nuclear MAS2 gene encodes a component of the processing protease that is homologous to the MAS1-encoded subunit. EMBO J. 1988, 7, 3863–3871. [Google Scholar] [CrossRef] [PubMed]
- Kambouris, N.G.; Burke, D.J.; Creutz, C.E. Cloning and characterization of a cysteine proteinase from Saccharomyces cerevisiae. J. Biol. Chem. 1992, 267, 21570–21576. [Google Scholar] [PubMed]
- Fischer, M.; Hilt, W.; Richter-Ruoff, B.; Gonen, H.; Ciechanover, A.; Wolf, D.H. The 26S proteasome of the yeast Saccharomyces cerevisiae. FEBS Lett. 1994, 355, 69–75. [Google Scholar] [CrossRef]
- Hochstrasser, M. Ubiquitin-dependent protein degradation. Ann. Rev. Genet. 1996, 30, 405–439. [Google Scholar] [CrossRef] [PubMed]
- Ganguli, D.; Kumar, C.; Bachhawat, A.K. The alternative pathway of glutathione degradation is mediated by a novel protein complex involving three new genes in Saccharomyces cerevisiae. Genetics 2007, 175, 1137–1151. [Google Scholar] [CrossRef] [PubMed]
- Hecht, K.A.; O’Donnell, A.F.; Brodsky, J.L. The proteolytic landscape of the yeast vacuole. Cell. Logist. 2014, 4, e28023. [Google Scholar] [CrossRef] [PubMed] [Green Version]
- Teichert, U.; Mechler, B.; Müller, H.; Wolf, D.H. Lysosomal (vacuolar) proteinases of yeast are essential catalysts for protein degradation, differentiation, and cell survival. J. Biol. Chem. 1989, 264, 16037–16045. [Google Scholar] [PubMed]
- Parzych, K.R.; Ariosa, A.; Mari, M.; Klionsky, D.J. A newly characterized vacuolar serine carboxypeptidase, Atg42/Ybr139w, is required for normal vacuole function and the terminal steps of autophagy in the yeast Saccharomyces cerevisiae. Mol. Biol. Cell 2018, 29, 1089–1099. [Google Scholar] [CrossRef] [PubMed]
- Klionsky, D.J.; Cueva, R.; Yaver, D.S. Aminopeptidase I of Saccharomyces cerevisiae is localized to the vacuole independent of the secretory pathway. J. Cell Biol. 1992, 119, 287–299. [Google Scholar] [CrossRef] [PubMed]
- Suzuki, K.; Kondo, C.; Morimoto, M.; Ohsumi, Y. Selective Transport of α-Mannosidase by Autophagic Pathways. Identification of a novel receptor, Atg34p. J. Biol. Chem. 2010, 285, 30019–30025. [Google Scholar] [CrossRef] [PubMed]
- Alexandre, H.; Heintz, D.; Chassagne, D.; Guilloux-Benatier, M.; Charpentier, C.; Feuillat, M. Protease A activity and nitrogen fractions released during alcoholic fermentation and autolysis in enological conditions. J. Ind. Microbiol. Biot. 2001, 26, 235–240. [Google Scholar] [CrossRef] [PubMed]
- Pereira, C.; Chaves, S.; Alves, S.; Salin, B.; Camougrand, N.; Manon, S.; Sousa, M.J.; Côrte-Real, M. Mitochondrial degradation in acetic acid-induced yeast apoptosis: The role of Pep4 and the ADP/ATP carrier. Mol. Microbiol. 2010, 76, 1398–1410. [Google Scholar] [CrossRef] [PubMed]
- Carmona-Gutiérrez, D.; Bauer, M.A.; Ring, J.; Knauer, H.; Eisenberg, T.; Büttner, S.; Ruckenstuhl, C.; Reisenbichler, A.; Magnes, C.; Rechberger, G.N.; et al. The propeptide of yeast cathepsin D inhibits programmed necrosis. Cell Death Dis. 2010, 19, e161. [Google Scholar] [CrossRef] [PubMed]
- Van den Hazel, H.B.; Kielland-Brandt, M.C.; Winther, J.R. Biosynthesis and function of yeast vacuolar proteases. Yeast 1996, 12, 1–16. [Google Scholar] [CrossRef]
- Charpentier, C.; Freyssinet, M. The mechanism of autolysis in wine. Yeast 1989, 5, S181–S186. [Google Scholar]
- Zhao, J.; Fleet, G.H. Degradation of RNA during the autolysis of Saccharomyces cerevisiae produces predominantly ribonucleotides. J. Ind. Microbiol. Biot. 2005, 32, 415–423. [Google Scholar] [CrossRef] [PubMed]
- Hirata, R.; Ohsumk, Y.; Nakano, A.; Kawasaki, H.; Suzuki, K.; Anraku, Y. Molecular structure of a gene, VMA1, encoding the catalytic subunit of H (+)-translocating adenosine triphosphatase from vacuolar membranes of Saccharomyces cerevisiae. J. Biol. Chem. 1990, 265, 6726–6733. [Google Scholar] [PubMed]
- Qiu, J.; Yoon, J.H.; Shen, B. Search for apoptotic nucleases in yeast role of Tat-D nuclease in apoptotic DNA degradation. J. Biol. Chem. 2005, 280, 15370–15379. [Google Scholar] [CrossRef] [PubMed]
- Bae, S.H.; Choi, E.; Lee, K.H.; Park, J.S.; Lee, S.H.; Seo, Y.S. Dna2 of Saccharomyces cerevisiae possesses a single-stranded DNA-specific endonuclease activity that is able to act on double-stranded DNA in the presence of ATP. J. Biol. Chem. 1998, 273, 26880–26890. [Google Scholar] [CrossRef] [PubMed]
- Garofalo, C.; Berbegal, C.; Grieco, F.; Tufariello, M.; Spano, G.; Capozzi, V. Selection of indigenous yeast strains for the production of sparkling wines from native Apulian grape varieties. Int. J. Food Microbiol. 2018, 20, 7–17. [Google Scholar] [CrossRef] [PubMed]
- Perpetuini, G.; Di Gianvito, P.; Arfelli, G.; Schirone, M.; Corsetti, A.; Tofalo, R.; Suzzi, G. Biodiversity of autolytic ability in flocculent Saccharomyces cerevisiae strains suitable for traditional sparkling wine fermentation. Yeast 2016, 33, 303–312. [Google Scholar] [CrossRef] [PubMed]
- Tofalo, R.; Perpetuini, G.; Di Gianvito, P.; Arfelli, G.; Schirone, M.; Corsetti, A.; Suzzi, G. Characterization of specialized flocculent yeasts to improve sparkling wine fermentation. J. Appl. Microbiol. 2016, 120, 1574–1584. [Google Scholar] [CrossRef] [PubMed]
- Martínez-García, R.; Roldán, Y.; Moreno, J.; Puig-Pujol, A.; Mauricio, J.C.; García-Martínez, T. Use of a flor yeast strain for the second fermentation of sparkling wines: Effect of endogenous CO2 over-pressure on the volatilome. Food Chem. 2020, in press. [Google Scholar]


| Condition | PC T1 | NPC T1 | PC T2 | NPC T2 | ||||
|---|---|---|---|---|---|---|---|---|
| Yeast Strain | P29 | G1 | P29 | G1 | P29 | G1 | P29 | G1 |
| mol% ± SD | mol% ± SD | mol% ± SD | mol% ± SD | mol% ± SD | mol% ± SD | mol% ± SD | mol% ± SD | |
| Total Apoptosis | 1.7b ± 0.2 | 2.5c ± 0.3 | 1.2a ± 0.2 | 2.7c ± 0.2 | 3.2d ± 0.3 | 4.5e ± 0.2 | 3.4d ± 0.4 | 3.5d ± 0.3 |
| Total Autolysis | 3.3a ± 0.4 | 3.7a ± 0.7 | 5bc ± 1 | 3.3a ± 0.8 | 3.3a ± 0.5 | 4.9bc ± 0.3 | 3.7ab ± 0.4 | 5.9c ± 0.5 |
| Glucanases | 0.73b ± 0.08 | 0.51a ± 0.04 | 0.7b ± 0.2 | 0.6ab ± 0.1 | 1.2c ± 0.2 | 2.4e ± 0.1 | 1.7d ± 0.2 | 2.18e ± 0.09 |
| Mannosidases | n.f.a | n.f.a | 0.13c ± 0.05 | 0.05b ± 0.02 | 0.022b ± 0.001 | n.f.a | n.f.a | 0.104c ± 0.001 |
| Non-vacuolar proteases | 1.5c ± 0.3 | 1.6c ± 0.4 | 2.94d ± 0.8 | 1.5c ± 0.4 | 0.8b ± 0.2 | n.f.a | 0.6b ± 0.1 | 1.4c ± 0.2 |
| Vacuolar proteases | 0.9a ± 0.1 | 1.3c ± 0.2 | 0.9a ± 0.2 | 1.0ab ± 0.2 | 0.9a ± 0.1 | 2.6d ± 0.2 | 1.2bc ± 0.1 | 2.3d ± 0.2 |
| Nucleases | 0.18c ± 0.01 | 0.3de ± 0.1 | 0.25cd ± 0.04 | 0.18c ± 0.1 | 0.43e ± 0.02 | n.f.a | 0.29d ± 0.02 | 0.06b ± 0.02 |
| Condition | PCT1 | PCT2 | NPCT1 | NPCT2 | |||||||||||||
|---|---|---|---|---|---|---|---|---|---|---|---|---|---|---|---|---|---|
| Strain | P29 | G1 | P29 | G1 | P29 | G1 | P29 | G1 | |||||||||
| Protein | Molecular Function | h mol% | i SD | mol% | SD | mol% | SD | mol% | SD | mol% | SD | mol% | SD | mol% | SD | mol% | SD |
| Bir1p | Subunit of chromosomal passenger complex | n.f.ns | n.f.ns | n.f.ns | n.f.ns | n.f.ns | 0.005ns | 0.003 | n.f.ns | n.f.ns | |||||||
| Cpr3p * | Cyclophilin C mitochondrial | 0.098 b | 0.001 | 0.3 d | 0.1 | 0.0977 b | 0.0003 | n.f. a | 0.081 ab | 0.005 | 0.098 b | 0.001 | 0.2 cd | 0.1 | 0.166 c | 0.003 | |
| Esp1p | Separin | n.f.ns | 0.007ns | 0.004 | n.f.ns | n.f.ns | 0.005ns | 0.002 | n.f.ns | n.f.ns | n.f.ns | ||||||
| Fis1p | Mitochondria fission 1 protein | n.f. a | n.f. a | n.f. a | n.f. a | 0.021 a | 0.007 | n.f. a | 0.13 b | 0.05 | n.f. a | ||||||
| Mca1p * | Metacaspase-1 | n.f. a | n.f. a | 0.11 c | 0.01 | n.f. a | 0.05 b | 0.02 | 0.05 b | 0.02 | 0.137 d | 0.008 | n.f. a | ||||
| Nma111p | Pro-apoptotic serine protease | n.f.ns | 0.02ns | 0.01 | n.f.ns | n.f.ns | 0.011ns | 0.006 | n.f.ns | n.f.ns | n.f.ns | ||||||
| Oye2p * | NADPH dehydrogenase 2 | 0.28 c | 0.03 | 0.4 cd | 0.1 | 0.4 d | 0.1 | n.f. a | 0.148 b | 0.001 | 0.13 b | 0.07 | 0.131 b | 0.003 | n.f. a | ||
| Oye3p * | NADPH dehydrogenase 3 | n.f. a | n.f. a | n.f. a | n.f. a | 0.04 b | 0.02 | 0.012 a | 0.006 | 0.09 c | 0.01 | 0.5 d | 0.1 | ||||
| Por1p * | Mitochondrial outer membrane protein porin 1 | n.f. a | n.f. a | 0.5 e | 0.1 | n.f. a | 0.09 b | 0.05 | 0.05 ab | 0.02 | 0.32 d | 0.07 | 0.15 c | 0.05 | |||
| Rny1p * | Ribonuclease T2-like | n.f. a | n.f. a | 0.100 e | 0.003 | n.f. a | 0.016 c | 0.004 | 0.011 b | 0.004 | 0.08 d | 0.01 | n.f. a | ||||
| Tdh2p * | Glyceraldehyde-3-phosphate dehydrogenase 2 | 0.6 b | 0.1 | 0.79 c | 0.05 | 0.90 c | 0.05 | 2.2 f | 0.1 | 0.36 a | 0.03 | 1.12 d | 0.07 | 1.1 d | 0.1 | 1.31 e | 0.04 |
| Tdh3p * | Glyceraldehyde-3-phosphate dehydrogenase 3 | 0.72 b | 0.02 | 0.98 c | 0.06 | 1.06 cd | 0.01 | 2.27 g | 0.09 | 0.36 a | 0.06 | 1.19 e | 0.05 | 1.14 de | 0.04 | 1.4 f | 0.1 |
| Ysp2p | GRAM domain-containing protein | n.f.ns | n.f.ns | n.f.ns | n.f.ns | 0.003ns | 0.002 | n.f.ns | n.f.ns | n.f.ns |
| Strain | S. cerevisiae P29 | S. cerevisiae G1 | |||
|---|---|---|---|---|---|
| Sampling time | T1 | T2 | T1 | T2 | |
| Apoptosis proteins | - | Oye2p a (3.3) | Cpr3p (2.8), Esp1p (specific), Nma111p (specific), Oye2p (3.1) | ||
| Autolysis proteins | Glucanases | - | - | Exg2p (2.4) | |
| Mannosidases | - | Ams1p (specific) | - | ||
| Vacuolar proteases | - | - | Ape1p (2.9), Ybr139wp (2.4) | ||
| Non-vacuolar proteases | - | Pre6p (specific), Pre7p (specific), Rpn11p (specific) | Ape2p (3.3), Esp1p (specific), Lap3p (2.4), Mas2p (3.2), Nma111p (specific), Pre10p (specific), Pre4p (2.4), Ste24p (specific), Ubp6p (specific) | ||
| Nucleases | Dna2p (specific) | - | Vma1p (2.1), Ybl055cp (specific) | ||
© 2019 by the authors. Licensee MDPI, Basel, Switzerland. This article is an open access article distributed under the terms and conditions of the Creative Commons Attribution (CC BY) license (http://creativecommons.org/licenses/by/4.0/).
Share and Cite
Porras-Agüera, J.A.; Moreno-García, J.; Mauricio, J.C.; Moreno, J.; García-Martínez, T. First Proteomic Approach to Identify Cell Death Biomarkers in Wine Yeasts during Sparkling Wine Production. Microorganisms 2019, 7, 542. https://0-doi-org.brum.beds.ac.uk/10.3390/microorganisms7110542
Porras-Agüera JA, Moreno-García J, Mauricio JC, Moreno J, García-Martínez T. First Proteomic Approach to Identify Cell Death Biomarkers in Wine Yeasts during Sparkling Wine Production. Microorganisms. 2019; 7(11):542. https://0-doi-org.brum.beds.ac.uk/10.3390/microorganisms7110542
Chicago/Turabian StylePorras-Agüera, Juan Antonio, Jaime Moreno-García, Juan Carlos Mauricio, Juan Moreno, and Teresa García-Martínez. 2019. "First Proteomic Approach to Identify Cell Death Biomarkers in Wine Yeasts during Sparkling Wine Production" Microorganisms 7, no. 11: 542. https://0-doi-org.brum.beds.ac.uk/10.3390/microorganisms7110542