Article

Identification of Microbial Profiles in Heavy-Metal-Contaminated Soil from Full-Length 16S rRNA Reads Sequenced by a PacBio System

1
Microorganism Resources Division, National Institute of Biological Resources, 42 Hwangyeong-ro, Incheon 22689, Korea
2
Department of Biology, Jeju National University, 102 Jejudaehak-ro, Jeju 63243, Korea
*
Author to whom correspondence should be addressed.
Submission received: 5 August 2019 / Revised: 10 September 2019 / Accepted: 13 September 2019 / Published: 16 September 2019

Abstract

:
Heavy metal pollution is a serious environmental problem as it adversely affects crop production and human activity. In addition, the microbial community structure and composition are altered in heavy-metal-contaminated soils. In this study, using full-length 16S rRNA gene sequences obtained by a PacBio RS II system, we determined the microbial diversity and community structure in heavy-metal-contaminated soil. Furthermore, we investigated the microbial distribution, inferred their putative functional traits, and analyzed the environmental effects on the microbial compositions. The soil samples selected in this study were heavily and continuously contaminated with various heavy metals due to closed mines. We found that certain microorganisms (e.g., sulfur or iron oxidizers) play an important role in the biogeochemical cycle. Using phylogenetic investigation of communities by reconstruction of unobserved states (PICRUSt) analysis, we predicted Kyoto Encyclopedia of Genes and Genomes (KEGG) functional categories from abundances of microbial communities and revealed a high proportion belonging to transport, energy metabolism, and xenobiotic degradation in the studied sites. In addition, through full-length analysis, Conexibacter-like sequences, commonly identified by environmental metagenomics among the rare biosphere, were detected. In addition to microbial composition, we confirmed that environmental factors, including heavy metals, affect the microbial communities. Unexpectedly, among these environmental parameters, electrical conductivity (EC) might have more importance than other factors in a community description analysis.

1. Introduction

As of 2017, 4677 out of 5544 mines (for coal, metal, and nonmetals) in Korea have been abandoned owing to environmental concerns and/or economic factors. In particular, in the case of metal mines, most mines (about 95%; 2084 out of 2184) in Korea are in disuse due to soil pollution caused by waste rock and mine tailings with acid mine drainage (AMD) [1]. The mine tailings dams and/or AMD contaminated by heavy metals, including iron and cadmium, have led to serious environmental problems related to crops and public health through the contamination of the water supply and food chain, respectively. Although these contaminated areas have been reclaimed by a long-term plan under the Ministry of Environment in Korea, there are rising concerns regarding soil contamination by heavy metals [2,3].
Heavy metal pollution by anthropogenic activities affects microbial activities and community structures in terrestrial environments. There is a specific relationship between microorganisms and minerals in these extremely toxic environments. Soil microorganisms can affect plant growth and increase the accumulation of heavy metals in plants (i.e., phytoremediation) [4,5]. Therefore, the analysis of microbial communities might provide fundamental information for phytoextraction improvement [6]. Most previous studies have focused on identifying microbial community structures in polluted soils or isolating useful microorganisms for the removal of heavy metals see review in [7]. Moreover, based on cultivation and metagenome approaches, we can easily understand and expand our knowledge of new microbe‒mineral interactions [8,9,10]. Recently, microbial communities from various environments have been extensively sequenced and analyzed by next-generation sequencing (NGS) platforms using partial regions of the 16S rRNA gene (e.g., V1‒V3, V3‒V4, V4‒V5, or V4‒V6) [5,11,12,13,14,15,16,17]. Additionally, numerous unrecognized bacteria and archaea have been identified by NGS technology, and the results can serve as fundamental taxonomic information in (meta)genome analysis with putatively deduced functional characterizations [18,19].
Although previous studies using specific regions of the 16S rRNA gene have shown that taxonomic assignments are highly sensitive, advanced high-throughput analysis revealed unintended missing classifications with less accuracy, especially at the genus or species level [20]. This might be because most of the naturally existing microorganisms have not yet been cultivated and identified.
Recently, a single molecular real-time (SMRT) DNA sequencing system has been developed by Pacific Biosciences (PacBio) and applied to microbial community and (meta)genome analyses [21,22,23,24]. This system is able to generate raw reads more than 10 kb long with a low error rate [25]. Although the PacBio platform is less attractive than other short-read platform such as Illumina and Ion-Torrent due to the higher cost, it has been applied to microbial community analysis without primer bias and with high quality [26,27,28]. Based on the advantages of the PacBio platform, we also expect to obtain more accurate results from full-length reads generated by the PacBio system for the microbial community in heavy-metal-contaminated soil (from disused mines) and identify the rare microorganism(s) in the biosphere [29]. As mentioned above, most mines in Korea are in disuse and crops and human health might be affected by contaminated water. Additionally, very little is known about the composition and structure of the bacterial community in these contaminated areas in Korea. Therefore, in the present study, we characterized and compared the microbial communities in heavy-metal-contaminated sites in the Korea. The main objectives of the present study are to demonstrate the practical application of the PacBio system in microbial community structure analysis and to investigate the microbial diversity and structure, along with the effect of environmental parameters, including heavy metals, on them.

2. Materials and Methods

2.1. Sample Collection and Characterization

For the microbial community analysis, we selected three sites in regions with heavy metal contamination, namely, Hwaseong (H), Daegu (D), and Bonghwa (B), in the Korea (Table S1). From each site, duplicate soil samples were collected from the surface (2–5 cm depth; F) and subsurface (60–75 cm depth; B) at five randomly selected spots (1–5) located 1 m from each other for replication [30]. Alphanumeric codes were assigned to each sample; for example, BF1 is the first surface sample collected at Bonghwa. The samples were transferred to sterile plastic tubes or bags and stored at ‒80 °C until the microbial community structure analysis. The sampling depths were determined based on the recovery depth for heavy-metal-contaminated soil from abandoned mines in the Korea [31]. Inductively coupled plasma atomic emission spectroscopy (ICP-OES; PerkinElmer Optima 7300 DV) was used to determine the concentrations of the heavy metals [copper (Cu), lead (Pb), arsenic (As), zinc (Zn), and cadmium (Cd)]. Before the analysis, the soil samples were sequentially filtered through 2.0-mm and 0.15-mm sieves, dried, and then digested with concentrated nitric acid. Calibration was performed using a distilled water blank and standard solution [31,32]. The concentrations of the selected heavy metals in each sample were determined in duplicate. Total nitrogen (TN), total carbon (TC), and organic matter (OM) were measured using a CNS analyzer (US/Vario Max CN, Elementar Analysensysteme, GmbH, Hanau, Germany). pH and electrical conductivity (EC) were determined using a pH/EC meter (Sevenmulti S40, Mettler Toledo, Greifensee, Switzerland) [33]. In situ temperature was determined using a thermometer (waterproof digital thermocouple thermometer, A1.T9234, Daihan, Seoul, Korea). The particle size distribution of the soil samples was plotted on a particle size distribution curve (semi-log graph; Table S1) to assess soil texture [33,34] (Table S1).

2.2. PCR Amplification of Bacterial 16S rRNA Gene and Sequencing by PacBio System

Total genomic DNA (gDNA) was extracted from each prepared sample using a Power Soil DNA kit (Mo Bio Laboratories, Solanan Beach, CA, USA). The quality and quantity of the extracted gDNA were determined using a DS-11 Plus Spectrophotometer (DeNovix, Inc., Wilmington, DE, USA) and by performing electrophoresis on a 1.0% (w/v) agarose gel, respectively.
For full-length bacterial 16S rRNA gene amplification, we performed PCR using the following mixture: 10 μL of 2× Dr. MAX Master Mix Solution (Doctor Protein Corp., Seoul, Korea), 1 μM of 27F (5’-AGRGTTYGATYMTGGCTCAG-3’) and 1492R (5’-RGYTACCTTGTTACGACTT-3’) primer set (final concentration), and ~10 ng of environmental DNA as a template. Where necessary, the template was diluted using 0.1× TRIS-EDTA buffer to decrease the concentration of PCR inhibitors. Cycling was performed with an initial denaturation at 95°C for 7 min, followed by 30 cycles at 95 °C for 30 s, 55 °C for 30 s, and 72 °C for 30 s, and a final extension at 72 °C for 10 min. The detailed sequences for barcode and adapter are provided in Table S2. Amplification products were separated by agarose gel electrophoresis and purified using a PCR Clean-up Kit (LaboPass, Cosmo Genetech, Seoul, Korea). SMRTbell adapters were then ligated onto the purified PCR products and the libraries were sequenced by Pacific Biosciences using P6-C4 chemistry on a PacBio RS II SMRT DNA sequencing system (Pacific Biosciences, Menlo Park, CA, USA).

2.3. Sequence Analysis, Diversity Indices, and Statistics

Raw sequences were initially processed through the PacBio SMRT portal. All purified sequencing data were then processed using Mothur version 1.39.5 [24,35,36]. All sequences were aligned against a SILVA-based reference alignment and classified against the greengenes (version gg_13_8_99) reference database using a negative Bayesian classifier implemented within Mothur [36]. Diversity indices (Shannon and Simpson indices, and the Chao1 nonparametric richness index (and Unweighted Pair Group Method with Arithmetic Mean (UPGMA) clustering, nonmetric multidimensional scaling (NMDS), and analysis of similarities (ANOSIM) were determined using the Mothur package [37]. A dissimilarity level of 3% was used in further investigations including diversity indices. Habitat specialization was calculated as described by Liu et al. [38] using Levin’s niche breadth index (B) [39], which assigns low niche breadth values to specialists (< 1.5) and higher values to generalists (> 3).
A Mann–Whitney U test was performed to compare the diversity indices between the microbial communities from each analyzed site. To estimate the relationship between microbial community and environmental factors, a canonical correspondence analysis (CCA) was performed using the VEGAN package [40,41,42]. The 32 highest-ranked genera (>5% proportion in each sample) were assessed using CCA. Manual selection of environmental parameters through application of a Monte Carlo permutation test (999 random permutations) was conducted to determine their statistical significance (p < 0.05). The resulting ordination biplot approximated the weight of each OTU with respect to each environmental variable, represented as arrows. The length of the arrows indicated the relative importance of environmental factors that explained variations in the microbial communities. All figures were generated by R packages [43] and/or Origin Pro 2018 (OriginLab, Northampton, MA, USA) [44]. Further, for estimation of the interactions between microbial compositions and environmental parameters, Spearman’s rank correlation coefficient (ρ) was calculated simultaneously using the ‘rcorr’ function with the Hmics package [45] in R to analyze the significance of the correlation. A high correlation coefficient (|ρ| ≥ 0.7) with a p-value < 0.05 between microbial compositions and environmental parameters was visualized via Cytoscape (v.3.6.1) [46]. To estimate correlation values between environmental parameters, we used Spearman’s rank correlation analysis [47]. Functional profiles of microbial communities were predicted by phylogenetic investigation of communities by reconstruction of unobserved states (PICRUSt) [13]. Although functional predictions were assigned up to all Kyoto Encyclopedia of Genes and Genomes (KEGG) orthology (KO) numbers, only xenobiotic biodegradation and metabolism, energy metabolism, and membrane transport were selected as contamination-related categories for analysis simplification and clarity. The categories related to “human disease” or “eukaryotes” were excluded due to the lack of relevance to environmental samples.
The full 16S rRNA gene sequences recovered in this study have been deposited in the DDBJ/ENA/GenBank Sequence Read Archive (SRA) under the accession number SRP137440, and are provided as a supplementary file.

3. Results

3.1. Environmental Data

The geographical and physiochemical parameters of 30 soil samples from the three sites are summarized in Table S1. A pH range of 2.8–6.9 (average pH 4.9 ± 1.3) indicated acidic to near-neutral pH. The subsurface (pH 4.3 ± 1.5) was slightly more acidic than the surface (pH 5.4 ± 1.2). The temperature reached an average of 23 ± 3.0 °C. The EC was in the range of 0.15–20.2 (average: 4.3 ± 5.5) ds/m. Except for the Bonghwa samples (11.1 ds/m), most samples had extremely low EC values (0.86 ds/m). In addition, we found significant differences in the other environmental factors (e.g., TN, OM, and temperature) between sampling site and depth. The average concentrations (ppm) of the major heavy metals (Cu, Pb, As, Zn, and Cd) were estimated as 322.6 ± 320.4, 1175.6 ± 1770.9, 5373.7 ± 9638.3, 3884.6 ± 7491.6, and 28.4 ± 51.7 ppm, respectively (Table S1). In particular, the concentration of As was higher than that of other heavy metals. However, in Hwaseong, the heavy metal concentrations were extremely low and As was undetectable. Although the soil texture was similar, the difference in the soil composition (e.g., sand, silt, and clay) was significant between samples from different sites (Table S1).

3.2. General Statistics for 16S rRNA Gene Amplification

A total of 122,702 sequences were obtained and analyzed from the 148,594 raw sequences after quality filtering supplied in the Mothur program (Table 1). The data analyzed for each sample ranged in size from 1490 sequences for sample HF4 to 8284 for sample DB5.
The whole analyzed sequences were classified into different well-determined, candidate, and unclassified phyla (Figure S1a). From all samples, the phylum Proteobacteria was identified as the highly accounted-for (i.e., dominant) group (comprising about 41% of the total number of purified sequences), followed by Acidobacteria, Actinobacteria, Chloroflexi, AD3, Firmicutes, Planctomycetes, Nitrospirae, and Gemmatimonadetes, comprising 19.7%, 10.2%, 7.5%, 5.4%, 4.8%, 3.6%, 2.8%, and 1.3% of all sequences, respectively.
The results of NMDS showed that microbial communities were apparently clustered by sampling site (Rsq: 0.560 and Stress: 0.302), excluding two samples (DF1 and BF1) (Figure 1). The stress value for NMDS indicated poor representation for microbial communities; however, the ANOSIM results indicated that the microbial community compositions (based on the 97% similarity level) were significantly different between most analyzed samples (Table S3). Furthermore, with the exception of the DF1 sample, UPGMA showed that samples from the three distantly located sites formed a separate cluster (Figure S2). In the case of Bonghwa, we found a tendency to split into two parts depending on the sampling depth. In addition, the samples from Hwaseong formed a separate and distant cluster outside the other samples, indicating a more distinguished relationship.
The analyzed sequences were affiliated with 42 phyla and the eight most abundant phyla (>5% proportion of all reads in each sample) were designated as major phyla: Acidobacteria, Actinobacteria, AD3, Chloroflexi, Firmicutes, Nitrospirae, Planctomycetes, and Proteobacteria (Figure 2a and Figure S1). These phyla contributed from 87.4% to 99.7% (average 95.0%) of all sequences. In particular, among the phyla, we found that Proteobacteria accounted for the highest proportion, especially in the BB sample, which had the greatest proportion (about 70%). On the other hand, the proportion of Acidobacteria of the BB sample was less than that of the other sites.
At the genus taxonomic level, the aforementioned sequences were assigned to 720 genera, including the unclassified group with a high taxonomic level (e.g., class, order, or family). For further analysis, we analyzed only 352 clearly assigned genera, excluding the sequences assigned as “unclassified,” although we might have lost many sequences (Figure 2b). Finally, we selected 32 genera from each sample based on >5% of total sequences for the following analyses such as CCA and interaction. Moreover, from a combined sample (as grouped together by the same depth of each site), we found only 16 genera (>5% proportion of each combined sample) designated as dominant microbes (Figure S1b). In this analysis, eight genera, Leptospirillum, Rhodoplanes, Thiobacillus, Acidithiobacillus, Sulfobacillus, Conexibacter, Candidatus Solibacter, and Rhodovastum, had the highest relative abundance, accounting for about 80% of total bacterial abundance from all samples. The genera Acidothiobacillus and Sulfobacillus were only identified in two samples (BF and BB) and in BF samples, respectively, as major taxa (Figure 2b). Iron-oxidizing gram-positive acidophiles were identified in Daegu and Hwaseong samples as a minor taxon (less than 0.5% of total bacterial abundance); however, this iron-oxidizer was detected in BF with comparatively high abundance (5% of total bacterial abundance). Unexpectedly, the genus Halothiobacillus, isolated from marine environments including hydrothermal vents and considered as an obligately chemolithoautotrophic and sulfur oxidizer, was identified in BB.
Subsequently, to determine generalist and specialist genera among those selected in this study (n = 32), we calculated niche breadth (B) by Levin’s index [38,39] from all analyzed sites and depths. From this analysis, only 16 genera were determined as generalists (B > 3, Alicyclobacillus, Aquicella, Clostridium, Conexibacter, Nitrospira, and Rhodanobacter) and specialists: (B < 1.5, Gallionella, gram-positive iron-oxidizing_acidophile, Halothiobacillus, Leptolyngbya, Leptospirillum, Rhodoferax, Sulfobacillus, Thioalkalivibrio, Thiobacillus, and YNPFFP6 classified into the family Sulfobacillaceae).
In Table 1, the metrics for alpha diversity (number of OTUs, Chao1 richness, Shannon evenness, Simpson diversity, and Goods’ coverage) of the microbial community are summarized. OTUs were defined as sequences with 97% sequence similarity. While variations in diversity indices were observed, there were no significant differences between surface and subsurface for intragroup and intergroup samples (estimated by Mann‒Whitney U test). However, diversity indices of the H (Hwaseong) samples combined from surface and subsurface showed higher values than those of other samples (Figure S4). In particular, the Simpson diversity index showed extremely remarkable differences (p = 0.0003 estimated by Mann‒Whitney U test). On the other hand, the diversity indices of the samples from Bonghwa and Daegu showed similar ranges (p > 0.11 estimated by Mann‒Whitney U test) (Figure S4).

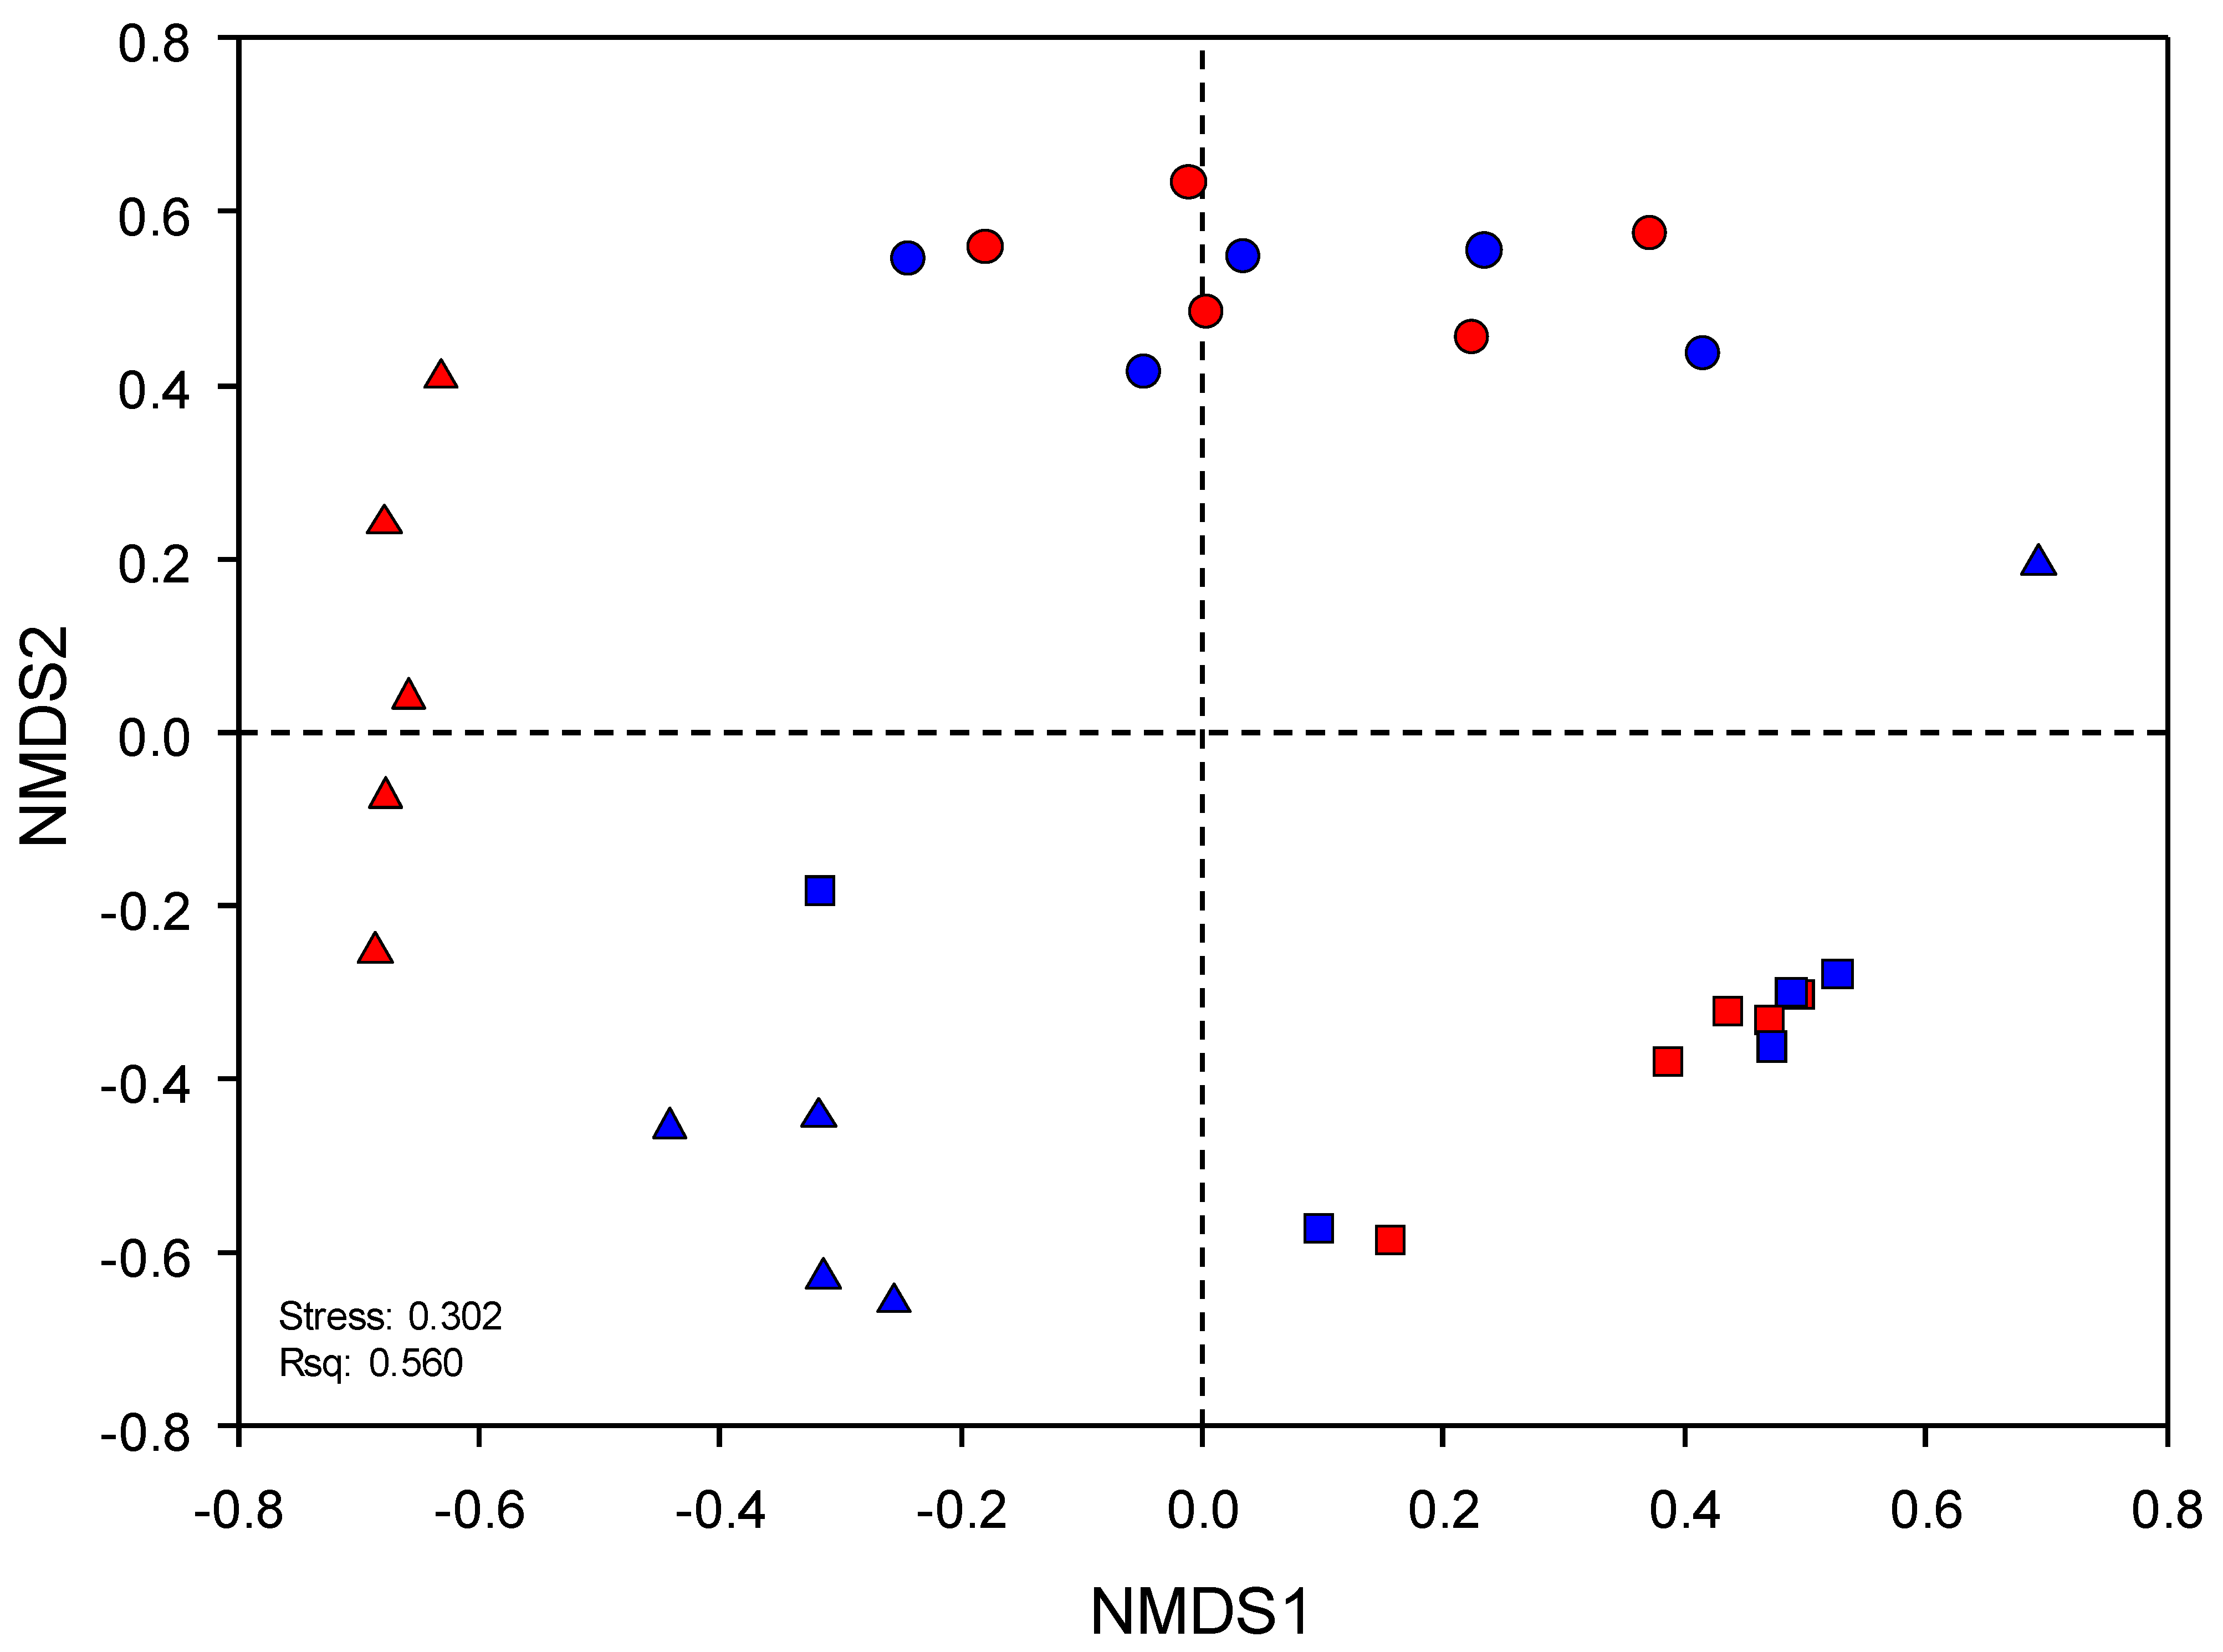
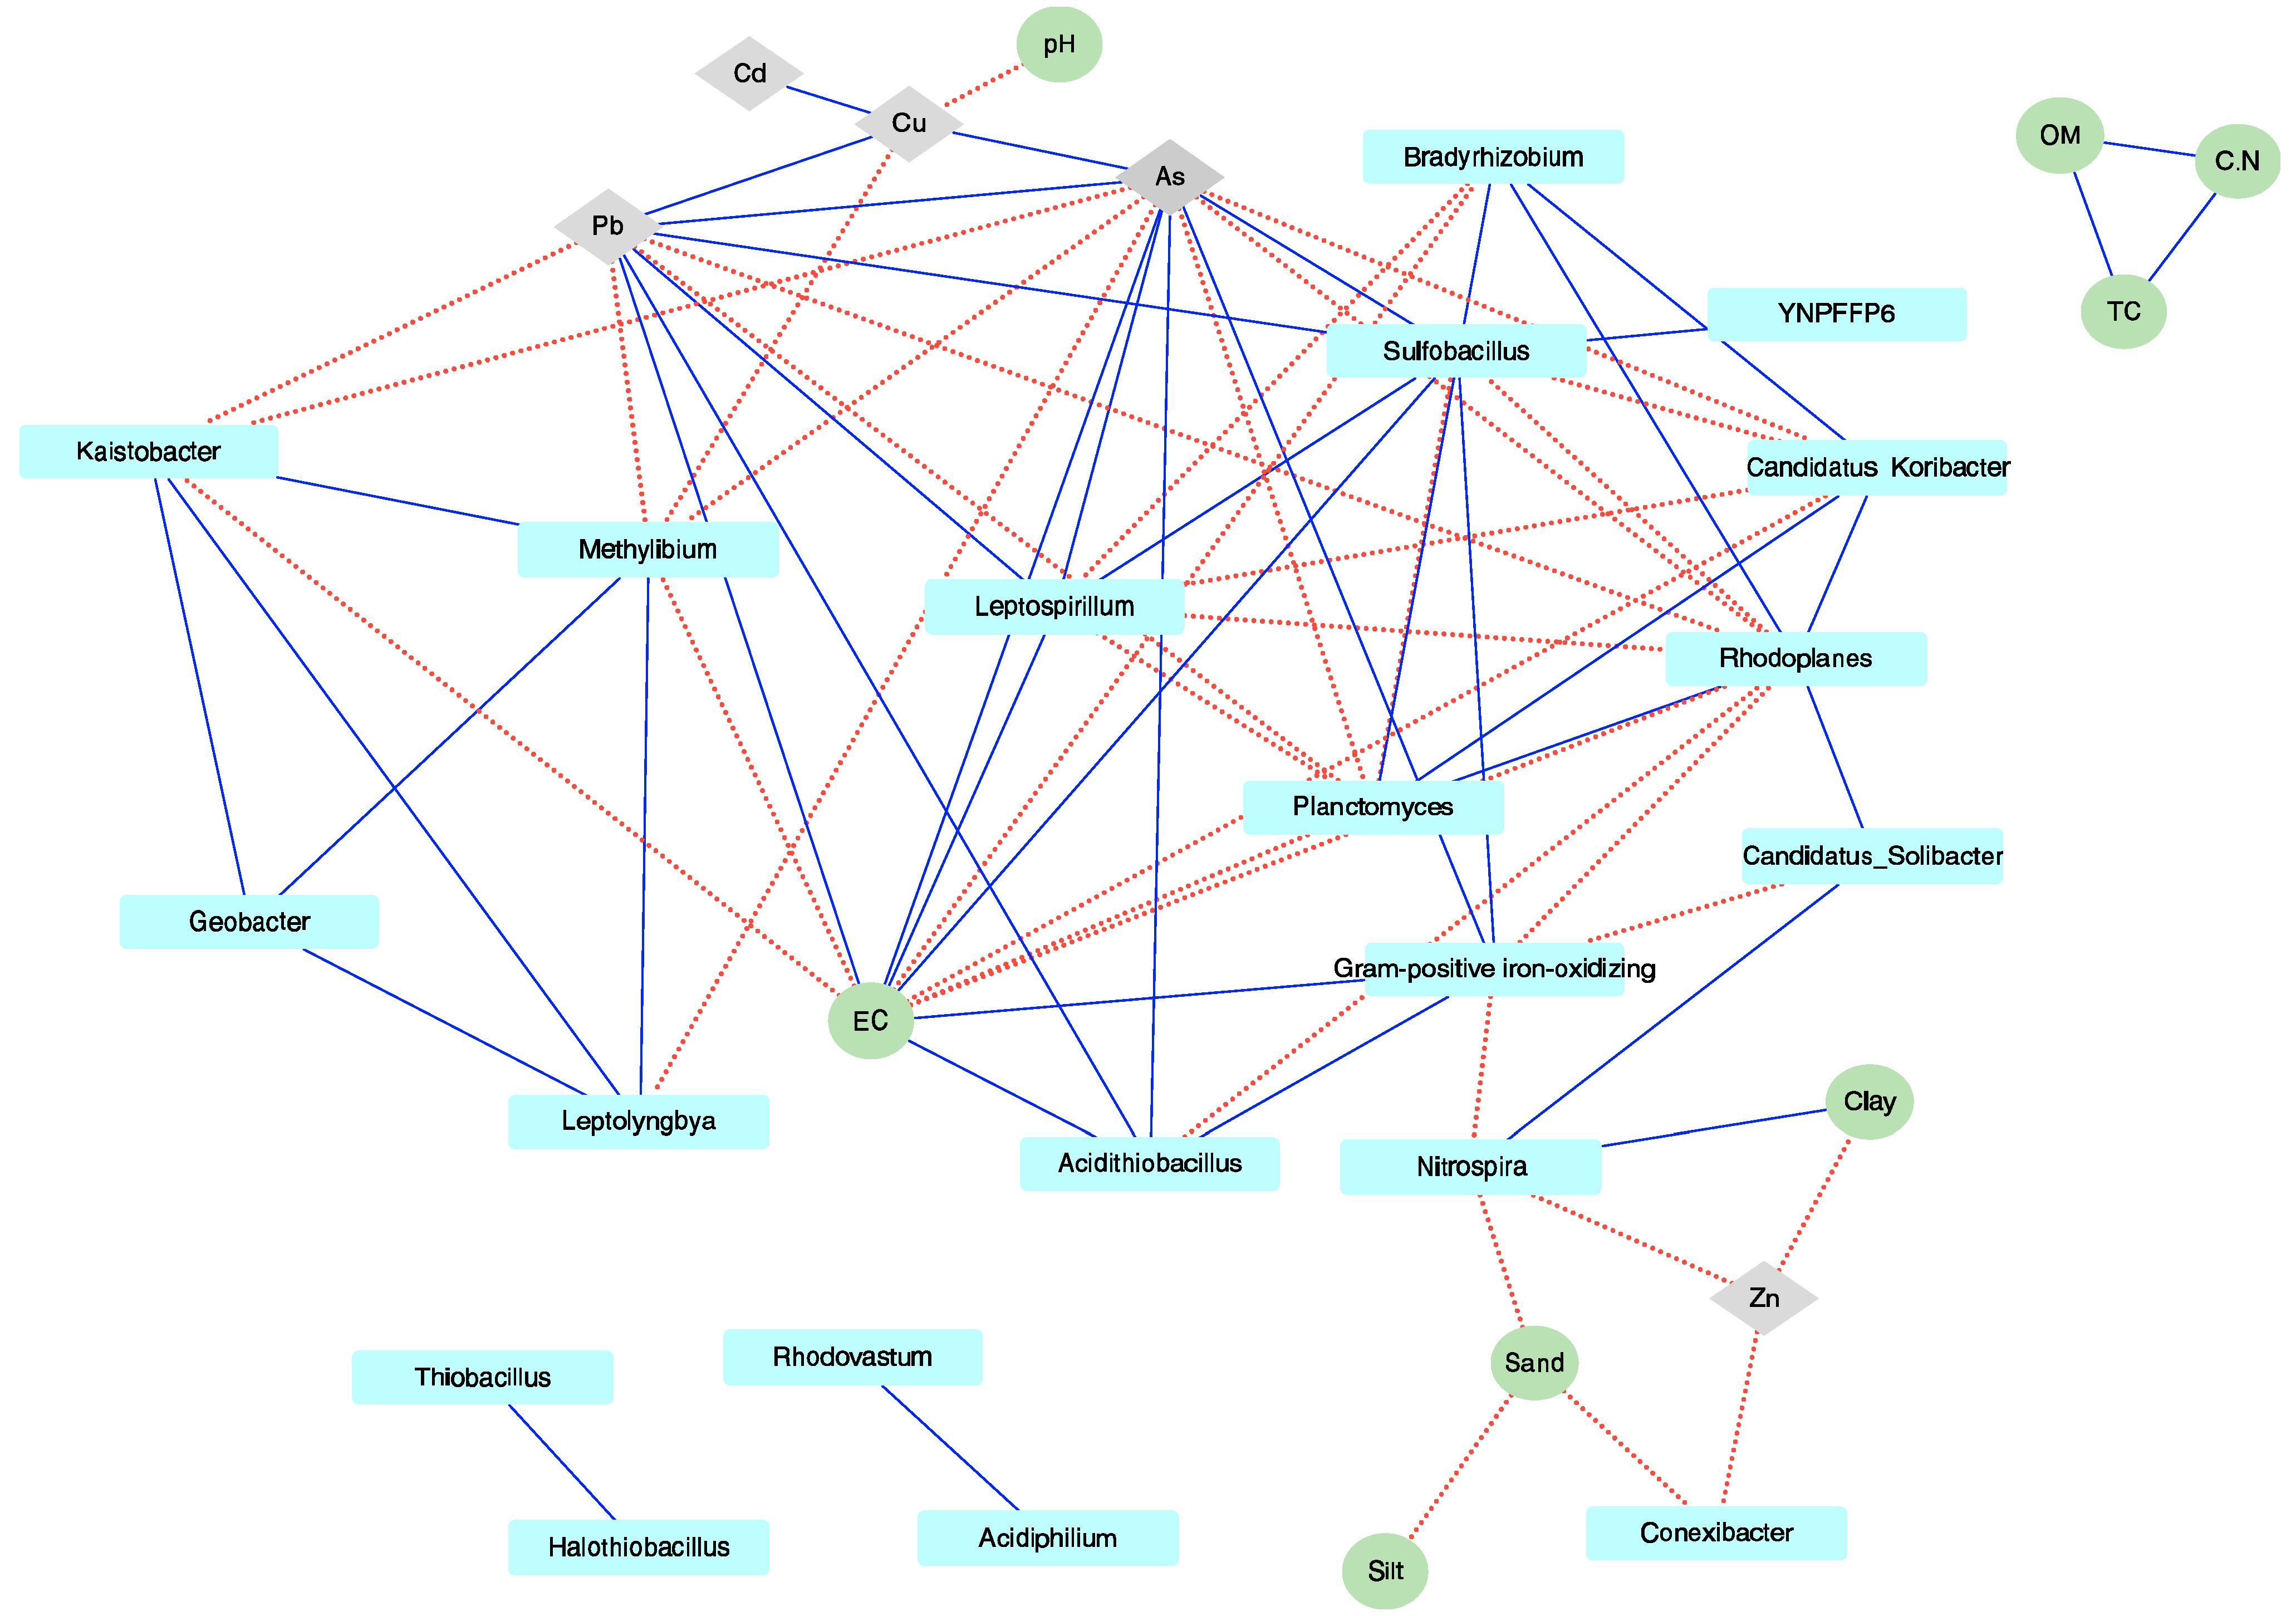
3.3. Environmental Factors Significantly Affecting the Microbial Community

To explain the variation in the microbial communities (i.e., the selected 32 genera) between sampling sites, CCA and association network analysis were performed. These analyses facilitated the investigation of the effect of environmental parameters including soil components. The CCA results indicated that with the exception of the pH and clay, most environmental variables exhibited significant effects on the microbial communities (p < 0.012 based on the 999 permutations) (Figure S3). On the x axis (CA1), OM, TC, EC, and C/N showed highly positive positions (0.93–0.97), while temperature, pH, and silt showed highly positive positions (0.90–0.99) on the y axis (CA2). To estimate the interactions between the microorganism(s) and environmental parameters, an associated network analysis was performed based on Spearman’s rank correlation coefficient (ρ) (Figure 3). From the network analysis, 20 genera and 13 environmental factors were obtained based on the criteria described in the Materials and Methods. Furthermore, a total of 76 correlations (41 positive and 35 negative) were established between environmental factors and genera (Figure 3). Based on this analysis, we found that As and EC, among the environmental factors, and Rhodoplanes genus, in the microbial composition, have higher interactions than others. Unexpectedly, four genera (Leptospirillum, Sulfobacillus, Acidithiobacillus, and Gram-positive iron-oxidizer) have positive interactions with EC, but not pH, and it was observed that pH exhibited a negative relationship only with Cu. These genera have been categorized as an acidophilic bacterial group [48]. In addition, four genera (Thiobacillus, Halothiobacillus, Rhodovastum, and Acidiphilum) and three environmental variables (TC, C/N, and OM) showed only an intragroup relationship (Figure 3).

3.4. Predictive Functional Profiles from Microbial Communities

Although we tried to understand microbial functional traits by analyzing the abundances and distribution of microorganisms in each site, it is difficult to predict their ecological roles. Therefore, to observe and compare study sites, putative functional profiles from 16S rRNA gene sequences were predicted via KEGG pathways of PICRUSt analysis. Among all KEGG pathways predicted by PICRUSt, the abundance of the KEGG category related to “Transport” was estimated as the highest (11.8–13.3% of total KEGG categories), after exclusion of the poorly relevant categories (see Materials and Methods). The proportions for xenobiotic biodegradation and energy metabolism were estimated to be 6.0% and 7.5%, respectively. Notably, between the studied sites, variation in some functional traits of third-tier KO was observed, such as in degradation of DDT, aminobenzoate, and nitrotoluene (Figure S5). However, the proportions of other third-tier functional categories were similar between sampling sites.

4. Discussion

Over the past 10 years, NGS technology has been introduced and developed, and has played a central role in the field of microbial ecology for sequencing small-subunit ribosomal RNA genes (e.g., the 16S rRNA gene). Traditional strategies, i.e., clone-based sequencing and culture-dependent methods, for microbial community analysis have recently been extensively replaced by NGS platforms such as pyrosequencing (of Roche 454), paired-end sequencing (HiSeq or MiSeq of Illumina), and an ion semiconductor (IonTorrent). These platforms are now commonly used to generate hundreds of thousands of read sequences from various environmental samples from an amplicon of the variable region(s) of the 16S rRNA gene [49,50]. However, it is well known that the amplicon approach might have an amplification bias that occurs by variable region selection associated with the primer choice [51]. The bias can affect the results for taxonomic classification and diversity indices [52]. Contrastingly, full-length 16S rRNA gene sequences enable the clear identification of taxonomy and phylogeny [53], despite amplification bias. In addition, some studies have reported molecular analysis of microbial community structures with no replication and randomization for experimental design [30,54,55]. Nevertheless, owing to the sequencing cost or analysis techniques that need computing ability, most previous studies have described the microbial community structures from various environments, including heavy-metal-contaminated soils, using a partial length of the 16S rRNA gene sequenced by other NGS platforms. In response, this study sought to analyze the microbial community structure and estimate the relationship between microbial compositions and environmental parameters in heavy-metal-contaminated soils using a full-length bacterial 16S rRNA gene sequenced by the PacBio RS II platform with plentiful replicates for each studied site.
A number of studies have reported that environmental parameters can affect the microbial community structure and chemical processing (i.e., nutrient cycles) of soil. In the present study, we found that environmental factors influence microbial compositions (Figure 3 and Figure S3). In particular, heavy metals have significantly higher impact than other factors on microbial community structure. Contrary to the NMDS results, the CCA results showed that the microbial communities from Hwaseong are closely formed (Figure 1 and Figure S3). In addition, we identified that EC (ds m-1) has a higher positive correlation with heavy metals than with other environmental factors (Figure 3 and Figure S3). Although organic matter may influence the retention of heavy metals [56,57], we found no significant correlation with heavy metals (Table S1). In fact, soil EC has been known as an indirect indicator of soil health. It affects yields and suitability of crop, and plant nutrient availability, as well as key soil processes such as the emission of greenhouse gases (e.g., nitrogen oxides and methane) [58,59]. Some studies proposed that soil EC is a major factor that contributes to bacterial community and activity [60,61]. Moreover, Jordán et al. [62] contended that EC, related to metal bioavailability, shows higher correlation with heavy metal distribution. The associated network analysis conducted in the present study revealed that EC had a direct, positive relationship only with Pb and As; however, EC was also found to have an indirect, positive relationship with Cu and Cd. In addition, the aforementioned heavy metals and EC exhibited more relationships, including a negative association with microorganisms, than other environmental factors. These findings suggest that EC is a major factor associated with the activities of microbial communities (see Figure 3). Additionally, we observed that only four genera (Acidothiobacillus, Leptosprillum, Sulfobacillus, and Gram-positive iron-oxidizing_acidophile) exhibited a positive relationship with EC. Although the members of these genera are known to be acidophiles, our analysis did not reveal any relationship between pH and these microorganisms. Therefore, this finding possibly indicates that, compared to other environmental factors, EC has a stronger relationship with the acidophiles. Collectively, these results indicate that metal concentrations alone do not reflect toxicity or environmental pollution. Measurement and analysis of EC and heavy metal concentration can be used to effectively assess contamination risk [62] and predict indigenous microbial activity [61].
With respect to the microbial composition, Proteobacteria, Acidobacteria, and Actinobacteria phyla were identified as predominant groups (Figure 2a and Figure S1a). Notably, these phyla are commonly found in terrestrial environments [63,64,65]. However, although Acidobacteria are considered to be dominant in soil, comprising an average of 20% of total soil bacteria, the ecological roles of the phylum are still poorly understood, due to the lack of cultured representatives references in [66].
At the genus level, 16 genera were identified in this study as generalist or specialist, which were dominant. Among the genera, 10 (Gallionella, Gram-positive iron-oxidizing_acidophile, Halothiobacillus, Leptolyngbya, Leptospirillum, Rhodoferax, Sulfobacillus, Thioalkalivibrio, Thiobacillus, and YNPFFP6 classified into the family Sulfobacillaceae) were identified as specialist for their habitat. This suggests the possibility of the development of a microbial indicator of contamination by heavy metals in soil. Interestingly, with the exception of samples from Bonghwa, the microbial compositions of surface and subsurface samples were similar. This might be because the physiochemical characterizations of surface and subsurface soil at Daegu and Hwaseong were similar (Table S1), indicating that environmental factors affect microbial community structures. In addition, some microorganisms in BF and BB were identified as unique compared to other samples. For example, Leptospirillum and Thiobacillus were only identified as predominant in BF and BB, respectively (Figure 2b). Generally, Leptosprillum has been identified as an iron oxidizer and acidophile under oxic conditions [7]. It has been classified into four groups [67]; in particular, group IV is reported to be capable of hydrogen and iron oxidation [67]. Moreover, Leptosprillum spp. contributes significantly to AMD processing and bioleaching [7,68]. Since first being described in 1904, Thiobacillus spp. are known as autotrophic sulfur oxidizers, using reduced sulfur compounds as an energy source [69]. Interestingly, we found that Halothiobacillus was identified only in BB. Also, Halothiobacillus has been shown to be a minor group in AMD environments [70]. In addition, some Halothiobacillus species isolated from hydrothermal vents are described as halotolerant and reclassified from the genus Thiobacillus [71]. However, recent investigation indicated that Halothiobacillus might be considered an important early indicator in acid mine drainage [72]. Some members of the genus Halothiobacillus might be adapted to play a role in t he sulfur cycle through sulfur oxidation metabolism in a metal mine environment. For this reason, the physiological and genomic characterization of the genus Halothiobacillus might be worth further investigation.
On the other hand, the genus Rhodoplanes, described as a primarily phototrophic purple nonsulfur bacterium [73], was only found in samples from Daegu and Hwaseong with high abundance (ranging from 8% to 15% of total bacterial abundance). In addition, we found sequences related to genera that are key players in geochemical cycling for nitrogen (i.e., Nitrospira) or sulfur (Sulfobacillus, Desulfosporosinus). Unexpectedly, in addition to microbial community analysis, PICRUSt indicated relatively little functional variation between sampling sites. Only a few functional categories were observed to exhibit variation between sampling sites. The “transport” category was identified as dominant in all studied sites with a similar proportion. However, it is possible that our PICRUSt results support the relationship between microbial communities and environmental factors. Moreover, we hypothesize that the microorganism(s) are adapted to their local habitat and microbial community stability is affected during a long period of heavy-metal contamination, which acts as a selective pressure [74,75]. Based on the present analysis, we observed that EC might have a greater effect on the microbial community structure compared to heavy metals or organic matter.
Although we successfully characterized the microbial distribution and their predicted functional traits from each sampling site, clear ecological roles and whole-metagenome analysis are lacking. Nevertheless, using full-length sequencing application, this study provides accurate information about microbial community structures and interactions in heavy-metal-contaminated soil in Korea. In addition, the findings might also enable identification of the rare biosphere [28] using full-length sequencing. For example, in DB and DF samples (Figure 2b), sequences classified in the genus Conexibacter were detected. To date, in the genus Conexibacter, only two species have been isolated as novel representatives of the deep branch of the phylum Actinobacteria from soil [76,77]. Moreover, Conexibacter spp. have been recently recognized in environmental metagenomics [78,79] and massive sequencing [80], including Oxford Nanopore MinION [81]. Finally, the findings of the present study provide valuable insight into the decrease in microbial activity and diversity variations caused by heavy metal pollution, as determined by full-length sequencing.

Supplementary Materials

Author Contributions

Conceived and designed the experiments: M.H. and S.J.P. Performed the experiments and analyzed the data: M.H. and S.J.P. Wrote the paper: S.J.P. All authors read and approved the final manuscript.

Funding

This work was supported by grants from the National Institute of Biological Resources funded by the Ministry of Environment (no. NIBR201501119) and the National Research Foundation of Korea (no. 2018R1C1B6006762).

Conflicts of Interest

The authors declare no conflicts of interest.

References

  1. MIRECO. 2016 Yearbook of MIRECO (Mine Reclamation Corp. in Korea) Statistics; Mine Reclamation Corp.: Wonju, Korea, 2017. [Google Scholar]
  2. NIER. Studies on the Assessment of Biological Exposure to Heavy Metals; National Institute of Environmental Research (NIER): Incheon, Korea, 1996. [Google Scholar]
  3. KMOE. Soil Environment Conservation Act in Korea; Ministry of Environment: Seoul, Korea, 2016. [Google Scholar]
  4. Gałązka, A.; Gałązka, R. Phytoremediation of polycyclic aromatic hydrocarbons in soils artificially polluted using plant-associated-endophytic bacteria and dactylis glomerata as the bioremediation plant. Pol. J. Microbiol. 2015, 64, 241–252. [Google Scholar] [CrossRef]
  5. Galazka, A.; Grzadziel, J.; Galazka, R.; Ukalska-Jaruga, A.; Strzelecka, J.; Smreczak, B. Genetic and functional diversity of bacterial microbiome in soils with long term impacts of petroleum hydrocarbons. Front. Microbiol. 2018, 9, 1923. [Google Scholar] [CrossRef] [PubMed]
  6. Wood, J.L.; Zhang, C.; Mathews, E.R.; Tang, C.; Franks, A.E. Microbial community dynamics in the rhizosphere of a cadmium hyper-accumulator. Sci. Rep. 2016, 6, 36067. [Google Scholar] [CrossRef] [PubMed]
  7. Baker, B.J.; Banfield, J.F. Microbial communities in acid mine drainage. FEMS Microbiol. Ecol. 2003, 44, 139–152. [Google Scholar] [CrossRef] [Green Version]
  8. Edwards, K.J.; Bond, P.L.; Gihring, T.M.; Banfield, J.F. An archaeal iron-oxidizing extreme acidophile important in acid mine drainage. Science 2000, 287, 1796–1799. [Google Scholar] [CrossRef] [PubMed]
  9. Baker, B.J.; Tyson, G.W.; Webb, R.I.; Flanagan, J.; Hugenholtz, P.; Allen, E.E.; Banfield, J.F. Lineages of acidophilic archaea revealed by community genomic analysis. Science 2006, 314, 1933–1935. [Google Scholar] [CrossRef] [PubMed]
  10. Baker, B.J.; Comolli, L.R.; Dick, G.J.; Hauser, L.J.; Hyatt, D.; Dill, B.D.; Land, M.L.; Verberkmoes, N.C.; Hettich, R.L.; Banfield, J.F. Enigmatic, ultrasmall, uncultivated Archaea. Proc. Natl. Acad. Sci. USA 2010, 107, 8806–8811. [Google Scholar] [CrossRef] [PubMed] [Green Version]
  11. Salipante, S.J.; Kawashima, T.; Rosenthal, C.; Hoogestraat, D.R.; Cummings, L.A.; Sengupta, D.J.; Harkins, T.T.; Cookson, B.T.; Hoffman, N.G. Performance comparison of Illumina and ion torrent next-generation sequencing platforms for 16S rRNA-based bacterial community profiling. Appl. Env. Microbiol. 2014, 80, 7583–7591. [Google Scholar] [CrossRef] [PubMed]
  12. Nelson, M.C.; Morrison, H.G.; Benjamino, J.; Grim, S.L.; Graf, J. Analysis, optimization and verification of Illumina-generated 16S rRNA gene amplicon surveys. PLoS ONE 2014, 9, e94249. [Google Scholar] [CrossRef] [PubMed]
  13. Langille, M.G.; Zaneveld, J.; Caporaso, J.G.; McDonald, D.; Knights, D.; Reyes, J.A.; Clemente, J.C.; Burkepile, D.E.; Vega Thurber, R.L.; Knight, R.; et al. Predictive functional profiling of microbial communities using 16S rRNA marker gene sequences. Nat. Biotechnol. 2013, 31, 814–821. [Google Scholar] [CrossRef] [PubMed]
  14. Kozich, J.J.; Westcott, S.L.; Baxter, N.T.; Highlander, S.K.; Schloss, P.D. Development of a dual-index sequencing strategy and curation pipeline for analyzing amplicon sequence data on the MiSeq Illumina sequencing platform. Appl. Env. Microbiol. 2013, 79, 5112–5120. [Google Scholar] [CrossRef] [PubMed]
  15. Choi, H.; Koh, H.W.; Kim, H.; Chae, J.C.; Park, S.J. Microbial community composition in the marine sediments of Jeju island: Next-generation sequencing surveys. J. Microbiol. Biotechnol. 2016, 26, 883–890. [Google Scholar] [CrossRef] [PubMed]
  16. Currie, A.R.; Tait, K.; Parry, H.; de Francisco-Mora, B.; Hicks, N.; Osborn, A.M.; Widdicombe, S.; Stahl, H. Marine microbial gene abundance and community composition in response to ocean acidification and elevated temperature in two contrasting coastal marine sediments. Front. Microbiol. 2017, 8, 1599. [Google Scholar] [CrossRef] [PubMed]
  17. Caporaso, J.G.; Lauber, C.L.; Walters, W.A.; Berg-Lyons, D.; Huntley, J.; Fierer, N.; Owens, S.M.; Betley, J.; Fraser, L.; Bauer, M.; et al. Ultra-high-throughput microbial community analysis on the Illumina HiSeq and MiSeq platforms. ISME J. 2012, 6, 1621–1624. [Google Scholar] [CrossRef] [PubMed] [Green Version]
  18. Lasken, R.S. Genomic sequencing of uncultured microorganisms from single cells. Nat Rev Microbiol 2012, 10, 631–640. [Google Scholar] [CrossRef] [PubMed]
  19. Lasken, R.S.; McLean, J.S. Recent advances in genomic DNA sequencing of microbial species from single cells. Nat. Rev. Genet. 2014, 15, 577–584. [Google Scholar] [CrossRef] [PubMed]
  20. Soergel, D.A.; Dey, N.; Knight, R.; Brenner, S.E. Selection of primers for optimal taxonomic classification of environmental 16S rRNA gene sequences. ISME J. 2012, 6, 1440–1444. [Google Scholar] [CrossRef] [Green Version]
  21. Koren, S.; Phillippy, A.M. One chromosome, one contig: Complete microbial genomes from long-read sequencing and assembly. Curr. Opin. Microbiol. 2015, 23, 110–120. [Google Scholar] [CrossRef]
  22. Mosher, J.J.; Bowman, B.; Bernberg, E.L.; Shevchenko, O.; Kan, J.; Korlach, J.; Kaplan, L.A. Improved performance of the PacBio SMRT technology for 16S rDNA sequencing. J. Microbiol. Methods 2014, 104, 59–60. [Google Scholar] [CrossRef]
  23. Myer, P.R.; Kim, M.; Freetly, H.C.; Smith, T.P. Metagenomic and near full-length 16S rRNA sequence data in support of the phylogenetic analysis of the rumen bacterial community in steers. Data Brief 2016, 8, 1048–1053. [Google Scholar] [CrossRef]
  24. Wagner, J.; Coupland, P.; Browne, H.P.; Lawley, T.D.; Francis, S.C.; Parkhill, J. Evaluation of PacBio sequencing for full-length bacterial 16S rRNA gene classification. BMC Microbiol. 2016, 16, 274. [Google Scholar] [CrossRef] [PubMed]
  25. Roberts, R.J.; Carneiro, M.O.; Schatz, M.C. The advantages of SMRT sequencing. Genome Biol. 2013, 14, 405. [Google Scholar] [CrossRef] [PubMed]
  26. Singer, E.; Bushnell, B.; Coleman-Derr, D.; Bowman, B.; Bowers, R.M.; Levy, A.; Gies, E.A.; Cheng, J.F.; Copeland, A.; Klenk, H.P.; et al. High-resolution phylogenetic microbial community profiling. ISME J. 2016, 10, 2020–2032. [Google Scholar] [CrossRef] [PubMed]
  27. Pootakham, W.; Mhuantong, W.; Yoocha, T.; Putchim, L.; Sonthirod, C.; Naktang, C.; Thongtham, N.; Tangphatsornruang, S. High resolution profiling of coral-associated bacterial communities using full-length 16S rRNA sequence data from PacBio SMRT sequencing system. Sci. Rep. 2017, 7, 2774. [Google Scholar] [CrossRef] [PubMed]
  28. Karst, S.M.; Dueholm, M.S.; McIlroy, S.J.; Kirkegaard, R.H.; Nielsen, P.H.; Albertsen, M. Retrieval of a million high-quality, full-length microbial 16S and 18S rRNA gene sequences without primer bias. Nat. Biotechnol. 2018, 36, 190–195. [Google Scholar] [CrossRef] [PubMed]
  29. Pedros-Alio, C. The rare bacterial biosphere. Ann. Rev. Mar. Sci. 2012, 4, 449–466. [Google Scholar] [CrossRef] [PubMed]
  30. Webster, R. Replicate and randomize, or lie. Env. Microbiol. 2017, 19, 25–28. [Google Scholar] [CrossRef]
  31. MOE. Official Test Methods of Soil Contamination; Ministry of Environment, Korea: Seoul, Korea, 2017. [Google Scholar]
  32. Koh, H.W.; Hur, M.; Kang, M.S.; Ku, Y.B.; Ghai, R.; Park, S.J. Physiological and genomic insights into the lifestyle of arsenite-oxidizing Herminiimonas arsenitoxidans. Sci. Rep. 2017, 7, 15007. [Google Scholar] [CrossRef]
  33. Burt, R.; United, S.; Natural Resources Conservation, S.; National Soil Survey, C.; National Soil Survey, L. Soil Survey Laboratory Methods Manual; United States Dept. of Agriculture, Natural Resources Conservation Service: Washington, DC, USA, 2004.
  34. Jahn, R.; Blume, H.P.; Asio, V.B.; Spaargaren, O.; Schad, P. Guidelines for soil description, 4th ed; FAO: Rome, Italy, 2006. [Google Scholar]
  35. Myer, P.R.; Kim, M.; Freetly, H.C.; Smith, T.P. Evaluation of 16S rRNA amplicon sequencing using two next-generation sequencing technologies for phylogenetic analysis of the rumen bacterial community in steers. J. Microbiol. Methods 2016, 127, 132–140. [Google Scholar] [CrossRef] [Green Version]
  36. Schloss, P.D.; Jenior, M.L.; Koumpouras, C.C.; Westcott, S.L.; Highlander, S.K. Sequencing 16S rRNA gene fragments using the PacBio SMRT DNA sequencing system. PeerJ 2016, 4, e1869. [Google Scholar] [CrossRef] [Green Version]
  37. Schloss, P.D.; Gevers, D.; Westcott, S.L. Reducing the effects of PCR amplification and sequencing artifacts on 16S rRNA-based studies. PLoS ONE 2011, 6, e27310. [Google Scholar] [CrossRef] [PubMed]
  38. Liu, M.; Yu, Z.; Yu, X.; Xue, Y.; Huang, B.; Yang, J. Invasion by cordgrass increases microbial diversity and alters community composition in a mangrove nature reserve. Front. Microbiol. 2017, 8, 2503. [Google Scholar] [CrossRef]
  39. Feinsinger, P.; Spears, E.E.; Poole, R.W. A simple measure of niche breadth. Ecology 1981, 62, 27–32. [Google Scholar] [CrossRef]
  40. Oksanen, J.; Blanchet, F.G.; Friendly, M.; Kindt, R.; Legendre, P.; McGlinn, D.; Minchin, P.R.; O’Hara, R.B.; Simpson, G.L.; Solymos, P.; et al. vegan: Community Ecology Package, R Package Version 2.4-5. 2017.
  41. Buttigieg, P.L.; Ramette, A. A guide to statistical analysis in microbial ecology: A community-focused, living review of multivariate data analyses. FEMS Microbiol. Ecol. 2014, 90, 543–550. [Google Scholar] [CrossRef] [PubMed]
  42. Rani, S.; Koh, H.W.; Rhee, S.K.; Fujitani, H.; Park, S.J. Detection and diversity of the nitrite oxidoreductase alpha subunit (nxrA) gene of Nitrospina in marine sediments. Microb. Ecol. 2017, 73, 111–122. [Google Scholar] [CrossRef] [PubMed]
  43. R Development Core Team. R: A Language and Environment for Statistical Computing; R Foundation for Statistical Computing: Vienna, Austria, 2010. [Google Scholar]
  44. Moberly, J.G.; Bernards, M.T.; Waynant, K.V. Key features and updates for origin 2018. J. Cheminform. 2018, 10, 5. [Google Scholar] [CrossRef]
  45. Harrell, F.E.J.; Dupont, C. Hmisc: Harrell Miscellaneous, R Package Version 4.1-1. 2018.
  46. Shannon, P.; Markiel, A.; Ozier, O.; Baliga, N.S.; Wang, J.T.; Ramage, D.; Amin, N.; Schwikowski, B.; Ideker, T. Cytoscape: A software environment for integrated models of biomolecular interaction networks. Genome. Res. 2003, 13, 2498–2504. [Google Scholar] [CrossRef] [PubMed]
  47. Bonett, D.G.; Wright, T.A. Sample size requirements for estimating pearson, kendall and spearman correlations. Psychometrika 2000, 65, 23–28. [Google Scholar] [CrossRef]
  48. González-Toril, E.; Gómez, F.; Malki, M.; Amils, R. The isolation and study of acidophilic microorganisms. In Methods in Microbiology; Academic Press: Cambridge, MA, USA, 2006; Volume 35, pp. 471–510. [Google Scholar]
  49. Hamady, M.; Knight, R. Microbial community profiling for human microbiome projects: Tools, techniques, and challenges. Genome. Res. 2009, 19, 1141–1152. [Google Scholar] [CrossRef] [Green Version]
  50. Baker, G.C.; Smith, J.J.; Cowan, D.A. Review and re-analysis of domain-specific 16S primers. J. Microbiol. Methods 2003, 55, 541–555. [Google Scholar] [CrossRef] [Green Version]
  51. Forney, L.J.; Zhou, X.; Brown, C.J. Molecular microbial ecology: Land of the one-eyed king. Curr. Opin. Microbiol. 2004, 7, 210–220. [Google Scholar] [CrossRef] [PubMed]
  52. Chakravorty, S.; Helb, D.; Burday, M.; Connell, N.; Alland, D. A detailed analysis of 16S ribosomal RNA gene segments for the diagnosis of pathogenic bacteria. J. Microbiol. Methods 2007, 69, 330–339. [Google Scholar] [CrossRef] [PubMed] [Green Version]
  53. Vinje, H.; Liland, K.H.; Almoy, T.; Snipen, L. Comparing K-mer based methods for improved classification of 16S sequences. BMC Bioinform. 2015, 16, 205. [Google Scholar] [CrossRef] [PubMed]
  54. van Dorst, J.; Bissett, A.; Palmer, A.S.; Brown, M.; Snape, I.; Stark, J.S.; Raymond, B.; McKinlay, J.; Ji, M.; Winsley, T.; et al. Community fingerprinting in a sequencing world. FEMS Microbiol. Ecol. 2014, 89, 316–330. [Google Scholar] [CrossRef] [PubMed]
  55. Prosser, J.I. Replicate or lie. Env. Microbiol. 2010, 12, 1806–1810. [Google Scholar] [CrossRef]
  56. Ferraz, M.C.M.A.; Lourençlo, J.C.N. The influence of organic matter content of contaminated soils on the leaching rate of heavy metals. Environ. Prog. 2000, 19, 53–58. [Google Scholar] [CrossRef]
  57. Uchimiya, M.; Bannon, D.I.; Wartelle, L.H. Retention of Heavy Metals by Carboxyl Functional Groups of Biochars in Small Arms Range Soil. J. Agric. Food Chem. 2012, 60, 1798–1809. [Google Scholar] [CrossRef]
  58. Adviento-Borbe, M.A.; Doran, J.W.; Drijber, R.A.; Dobermann, A. Soil electrical conductivity and water content affect nitrous oxide and carbon dioxide emissions in intensively managed soils. J. Env. Qual. 2006, 35, 1999–2010. [Google Scholar] [CrossRef]
  59. Krauss, S.; Schnitzler, W.H.; Grassmann, J.; Woitke, M. The influence of different electrical conductivity values in a simplified recirculating soilless system on inner and outer fruit quality characteristics of tomato. J. Agric. Food Chem. 2006, 54, 441–448. [Google Scholar] [CrossRef]
  60. Kim, J.M.; Roh, A.S.; Choi, S.C.; Kim, E.J.; Choi, M.T.; Ahn, B.K.; Kim, S.K.; Lee, Y.H.; Joa, J.H.; Kang, S.S.; et al. Soil pH and electrical conductivity are key edaphic factors shaping bacterial communities of greenhouse soils in Korea. J. Microbiol. 2016, 54, 838–845. [Google Scholar] [CrossRef]
  61. Atekwana, E.A.; Atekwana, E.A.; Werkema, D.D.; Allen, J.P.; Smart, L.A.; Duris, J.W.; Cassidy, D.P.; Sauck, W.A.; Rossbach, S. Evidence for microbial enhanced electrical conductivity in hydrocarbon-contaminated sediments. Geophys. Res. Lett. 2004, 31. [Google Scholar] [CrossRef]
  62. Jordán, M.M.; Rincón-Mora, B.; Almendro-Candel, M.B. Heavy metal distribution and electrical conductivity measurements in biosolid pellets. J. Soils Sediments. 2016, 16, 1176–1182. [Google Scholar] [CrossRef]
  63. Janssen, P.H. Identifying the dominant soil bacterial taxa in libraries of 16S rRNA and 16S rRNA genes. Appl. Env. Microbiol. 2006, 72, 1719–1728. [Google Scholar] [CrossRef]
  64. Zeng, Q.; Dong, Y.; An, S. Bacterial Community Responses to Soils along a Latitudinal and Vegetation Gradient on the Loess Plateau, China. PLoS ONE 2016, 11, e0152894. [Google Scholar] [CrossRef]
  65. Fierer, N.; Bradford, M.A.; Jackson, R.B. Toward an ecological classification of soil bacteria. Ecology 2007, 88, 1354–1364. [Google Scholar] [CrossRef]
  66. Greening, C.; Carere, C.R.; Rushton-Green, R.; Harold, L.K.; Hards, K.; Taylor, M.C.; Morales, S.E.; Stott, M.B.; Cook, G.M. Persistence of the dominant soil phylum Acidobacteria by trace gas scavenging. Proc. Natl. Acad. Sci. USA 2015, 112, 10497–10502. [Google Scholar] [CrossRef]
  67. Goltsman, D.S.; Dasari, M.; Thomas, B.C.; Shah, M.B.; VerBerkmoes, N.C.; Hettich, R.L.; Banfield, J.F. New group in the Leptospirillum clade: Cultivation-independent community genomics, proteomics, and transcriptomics of the new species "Leptospirillum group IV UBA BS". Appl. Env. Microbiol 2013, 79, 5384–5393. [Google Scholar] [CrossRef]
  68. Diaby, N.; Dold, B.; Pfeifer, H.R.; Holliger, C.; Johnson, D.B.; Hallberg, K.B. Microbial communities in a porphyry copper tailings impoundment and their impact on the geochemical dynamics of the mine waste. Env. Microbiol. 2007, 9, 298–307. [Google Scholar] [CrossRef]
  69. Robertson, L.A.; Kuenen, J.G. The Genus Thiobacillus. In The Prokaryotes: Volume 5: Proteobacteria: Alpha and Beta Subclasses; Dworkin, M., Falkow, S., Rosenberg, E., Schleifer, K.-H., Stackebrandt, E., Eds.; Springer: New York, NY, 2006; pp. 812–827. [Google Scholar]
  70. Schippers, A.; Breuker, A.; Blazejak, A.; Bosecker, K.; Kock, D.; Wright, T.L. The biogeochemistry and microbiology of sulfidic mine waste and bioleaching dumps and heaps, and novel Fe(II)-oxidizing bacteria. Hydrometallurgy 2010, 104, 342–350. [Google Scholar] [CrossRef]
  71. Kelly, D.P.; Wood, A.P. Reclassification of some species of Thiobacillus to the newly designated genera Acidithiobacillus gen. nov., Halothiobacillus gen. nov. and Thermithiobacillus gen. nov. Int. J. Syst. Evol. Microbiol. 2000, 50, 511–516. [Google Scholar] [CrossRef]
  72. Whaley-Martin, K.; Jessen, G.L.; Nelson, T.C.; Mori, J.F.; Apte, S.; Jarolimek, C.; Warren, L.A. The potential role of Halothiobacillus spp. in sulfur oxidation and acid generation in circum-neutral mine tailings reservoirs. Front. Microbiol. 2019, 10, 297. [Google Scholar] [CrossRef]
  73. Hiraishi, A.; Ueda, Y. Rhodoplanes gen. nov., a new genus of phototrophic bacteria including Rhodopseudomonas rosea as Rhodoplanes roseus comb. nov. and Rhodoplanes elegans sp. nov. Int. Syst. Bacteriol. 1994, 44, 665–673. [Google Scholar] [CrossRef]
  74. Gómez, P.; Paterson, S.; De Meester, L.; Liu, X.; Lenzi, L.; Sharma, M.D.; McElroy, K.; Buckling, A. Local adaptation of a bacterium is as important as its presence in structuring a natural microbial community. Nat. Commun. 2016, 7, 12453. [Google Scholar] [CrossRef]
  75. Brooks, A.N.; Turkarslan, S.; Beer, K.D.; Lo, F.Y.; Baliga, N.S. Adaptation of cells to new environments. Wiley Interdiscip. Rev. Syst. Biol. Med. 2011, 3, 544–561. [Google Scholar] [CrossRef]
  76. Seki, T.; Matsumoto, A.; Shimada, R.; Inahashi, Y.; Ōmura, S.; Takahashi, Y. Conexibacter arvalis sp. nov., isolated from a cultivated field soil sample. Int. J. Syst. Evol. Microbiol. 2012, 62, 2400–2404. [Google Scholar] [CrossRef]
  77. Monciardini, P.; Cavaletti, L.; Schumann, P.; Rohde, M.; Donadio, S. Conexibacter woesei gen. nov., sp. nov., a novel representative of a deep evolutionary line of descent within the class Actinobacteria. Int. J. Syst. Evol. Microbiol. 2003, 53, 569–576. [Google Scholar] [CrossRef]
  78. Deng, J.; Gu, Y.; Zhang, J.; Xue, K.; Qin, Y.; Yuan, M.; Yin, H.; He, Z.; Wu, L.; Schuur, E.A.G.; et al. Shifts of tundra bacterial and archaeal communities along a permafrost thaw gradient in Alaska. Mol. Ecol. 2015, 24, 222–234. [Google Scholar] [CrossRef]
  79. Krivushin, K.; Kondrashov, F.; Shmakova, L.; Tutukina, M.; Petrovskaya, L.; Rivkina, E. Two Metagenomes from Late Pleistocene Northeast Siberian Permafrost. Genome Announc. 2015, 3, e01380-14. [Google Scholar] [CrossRef] [Green Version]
  80. Liu, X.; Zhang, S.; Jiang, Q.; Bai, Y.; Shen, G.; Li, S.; Ding, W. Using community analysis to explore bacterial indicators for disease suppression of tobacco bacterial wilt. Sci. Rep. 2016, 6, 36773. [Google Scholar] [CrossRef] [Green Version]
  81. Kerkhof, L.J.; Dillon, K.P.; Häggblom, M.M.; McGuinness, L.R. Profiling bacterial communities by MinION sequencing of ribosomal operons. Microbiome 2017, 5, 116. [Google Scholar] [CrossRef]
Figure 1. Microbial community profiles of the samples from Hwaseong (circles), Daegu (squares), and Bonghwa (triangles) based on non-metric multidimensional scaling (NMDS) using the Mothur package. Distance matrix was calculated using the Yue and Clayton theta supplied in the Mothur package. Operational taxonomic units (OTUs) were determined based on 3% dissimilarity of nucleotide sequences. Blue and red denote surface and subsurface, respectively.
Microorganisms 07 00357 g001
Figure 2. Relative abundance of the most abundant eightbacterial phyla (a) and 16 genera (b) in the contaminated soil samples. At the genus level, only those with proportions above 5% of the total reads in each sample are shown.
Microorganisms 07 00357 g002
Figure 3. Profile clustering Cytoscape network visualization of the 32 most abundant genera with environmental correlation (solid line, positive correlation; dotted line, negative correlation) estimated by Spearman’s rank analysis. Analyzed genus, heavy metals, and other environmental factors are marked with cyan squares, gray diamonds, and green circles, respectively.
Microorganisms 07 00357 g003
Table 1. An overview of the soil samples and estimates of 16S rRNA gene sequence diversity and phylotype coverage of the PacBio data. Diversity was estimated using operational taxonomic units (OTUs). Diversity indices and richness estimators were calculated using the Mothur package (the mother project; http://www.mothur.org).
Sample*Grouping nameNo. of analyzed readsOTUChaoShannonSimpsonGood’s coverageSampling site (GPS, altitude)
BB1BB27383881629.033.798.620.89Bongwha (129°3’17.9"E, 36°51′45.6″N, 630 m)
BB229315442092.424.6524.990.87
BB322403551814.623.9813.510.88
BB424046004411.034.145.740.78
BB5776914927657.554.669.770.84
BF1BF56774862820.182.733.670.93
BF246065082393.164.0112.060.92
BF344205472592.364.0712.180.91
BF439697432787.005.2553.470.87
BF537846013295.084.6424.510.88
DB1DB41077922427.765.0316.910.87Daegu (128°40’18.6"E, 35°46′52.5″N, 243 m)
DB221494241513.364.308.740.86
DB3525010364241.845.0913.700.86
DB427625511756.514.387.550.86
DB582849523784.814.9940.100.92
DF1DF59626993354.824.1713.560.91
DF254897122880.124.158.730.91
DF340197113157.894.398.370.87
DF438807022803.694.135.050.87
DF535214781580.644.6936.540.91
HB1HB471224259038.207.57627.070.61Hwaseong (126°55’47.6"E, 37°13′09.1″N, 105 m)
HB2463421677723.747.30355.460.65
HB3448923088079.127.52557.240.61
HB4382520576954.947.50521.600.59
HB5336019547019.947.60726.930.55
hf1HF314216735914.557.30539.230.60
hf2166210264310.037.09348.380.51
hf3372020978645.227.57607.900.56
hf4149010323987.657.42861.260.45
hf55707280110771.697.62661.090.63
* Samples were named as follows: sampling site, depth [B: subsurface (below 60–75 cm), F: surface (below 2–15 cm)] and sampling replicates.

