Comparative Pangenomics of the Mammalian Gut Commensal Bifidobacterium longum


1
Molecular and Cellular Biology Graduate Program, University of Massachusetts, Amherst, MA 01003, USA
2
Department of Food Science, University of Massachusetts, Amherst, MA 01003, USA
3
Department of Microbiology and Physiological Systems, University of Massachusetts Medical School, Worcester, MA 01655, USA
*
Author to whom correspondence should be addressed.
Microorganisms 2020, 8(1), 7; https://0-doi-org.brum.beds.ac.uk/10.3390/microorganisms8010007
Submission received: 10 November 2019
/
Revised: 11 December 2019
/
Accepted: 12 December 2019
/
Published: 18 December 2019
(This article belongs to the Special Issue Bifidobacteria: Insights from Ecology to Genomics of a Key Microbial Group of the Mammalian Gut Microbiota)
Abstract
:Bifidobacterium longum colonizes mammalian gastrointestinal tracts where it could metabolize host-indigestible oligosaccharides. Although B. longum strains are currently segregated into three subspecies that reflect common metabolic capacities and genetic similarity, heterogeneity within subspecies suggests that these taxonomic boundaries may not be completely resolved. To address this, the B. longum pangenome was analyzed from representative strains isolated from a diverse set of sources. As a result, the B. longum pangenome is open and contains almost 17,000 genes, with over 85% of genes found in ≤28 of 191 strains. B. longum genomes share a small core gene set of only ~500 genes, or ~3% of the total pangenome. Although the individual B. longum subspecies pangenomes share similar relative abundances of clusters of orthologous groups, strains show inter- and intrasubspecies differences with respect to carbohydrate utilization gene content and growth phenotypes.
1. Introduction
The genus Bifidobacterium contains over 50 species of Gram-positive anaerobes isolated from host-associated environments, including the lower gastrointestinal tract of primates, other animals, and social insects [1]. Bifidobacterium longum is a common colonizer of the human and nonhuman gut and is associated with potential beneficial properties including reduction of gastrointestinal inflammation and pathogen exclusion [2,3,4,5]. B. longum strains are assigned to three subspecies, longum sensu stricto, infantis, and suis and colonize adults, infants, and animals, respectively. Notably, subspecies longum strains are isolated from infants as well [6,7,8]. Many B. longum strains are enriched by host-indigestible dietary carbohydrates, also referred to as prebiotics, which include substrates such as inulin and arabinoxylan [9,10]. Some end products of carbohydrate metabolism, such as the short-chain fatty acid acetate, benefit their host through reducing pathogen-induced colonic epithelial cell death and provide energy to specific tissue types such as the liver [11,12,13]. Thus, B. longum subsistence on dietary oligosaccharides is a likely example of host–microbe coevolution, potentially to benefit the population, aggregate microbiome, and host. A noteworthy example of this coevolutionary relationship is human milk oligosaccharide (HMO) metabolism by B. longum subsp. infantis which is facilitated by a ~40 Kb HMO utilization gene cluster [14,15]. As infants nurse, HMOs reach the colon relatively intact and are utilized as a carbohydrate source by B. infantis to thrive in this environment [16,17].
Previous analyses of the B. longum pangenome have noted that each subspecies has unique characteristics, including the presence and absence of carbohydrate utilization enzymes [18,19,20]. There are specific and generalizable traits ascribed to each subspecies (e.g., HMO utilization by B. infantis strains), although the variability inherent to given subspecies increases as more B. longum genomes are sequenced. As more B. longum genomes have been sequenced, a more rigorous approach to defining subspecies boundaries may be enabled including the candidate subspecies suillum. The current study constructs and investigates the pangenome of 191 B. longum strains using Average Nucleotide Identity (ANI) and phylogenetic analytical approaches. The presence/absence of carbohydrate active enzymes and subspecies-specific marker genes are also considered for their utility in defining subspecies boundaries. Finally, in vitro growth on carbohydrate substrates is used to confirm subspecies phenotypic definitions.
2. Materials and Methods
2.1. Bifidobacterial Propagation and Isolation
Bifidobacteria were routinely propagated on de Man Rogosa Sharpe media (MRS; BD Difco) with 0.05% (w/v) of L-cysteine (Sigma Aldrich, St. Louis, MO, USA). Cultures were incubated at 37 °C in an anaerobic chamber maintained with a gas mix of 7% H2, 10% CO2, and N2 to balance (Coy Laboratory Products, Grass Lake, MI, USA). Genomic DNA was extracted from liquid cultures using the MasterPure Gram Positive DNA Purification Kit according to the manufacturer’s protocol (Epicentre, Madison, WI, USA). In order to isolate bifidobacteria, fresh feces were mixed into 5 mL of peptone water. Serial dilutions of 10x and 100x were performed on bifidobacterial-specific media agar plates which consisted of MRS, 0.05% (w/v) L-cysteine, and 0.05% (w/v) mupirocin (AppliChem Panreac, Chicago, IL, USA). Isolated colonies were identified via the bifidobacteria-specific colorimetric fructose-6-phosphoketolase assay and PCR of the 16s and ITS rRNA gene regions (PCR primers: F-GGTGTGAAAGTCCATCGCT, R-GTCTGCCAAGGCATCCACCA; Sanger sequencing primers: F-GGTGTGAAAGTCCATCGCT, R-CATGCCCCTACGTCCAG) according to Turroni et al. and Milani et al. [21,22,23].
2.2. Whole Genome Sequencing
DNA quality and quantity were determined using a NanoDrop 2000 Spectrophotometer (Thermo Fisher Scientific, Waltham, MA, USA) and a Qubit 2.0 Fluorometer (Thermo Fisher Scientific, Waltham, MA, USA), respectively. Sequencing libraries were prepared using the NEBNext Ultra II library preparation kit (New England Biolabs, Ipswich, MA, USA). Subsequently, whole-genome sequencing was performed on the Illumina NextSeq platform with v2 reagents to generate 2 × 75 bp paired-end reads (Illumina, San Diego, CA, USA). Reads were assembled de novo via Unicycler v0.4.7 with default parameters, which utilizes SPAdes for the short-read assembly with Pilon, Bowtie2, and Samtools for genome polishing [24,25,26,27]. Assembly graphs were visualized with Bandage [28]. Gene model predictions and annotations were performed using the Rapid Annotation using Subsystem Technology (RAST) annotation service and PROKKA v.1.13 using default parameters [29,30,31]. The Whole Genome Shotgun projects for strains UMA3015, JCM19995, and CECT7894 have been deposited at DDBJ/ENA/GenBank under the accession numbers RJJN00000000, WJRJ00000000, and WKJF00000000, respectively.
2.3. Genomic and Pangenomic Analyses
Bifidobacterium longum genomes were downloaded from the National Center for Biotechnology Information GenBank database (https://ncbi.nlm.nih.gov/genbank) and the Department of Energy’s Joint Genome Institute Integrated Microbial Genomes and Microbiomes database (https://img.jgi.doe.gov) (see Table S1) [32,33]. For genomes found in both databases, the GenBank data were used. RAST and PROKKA v.1.13 were used for annotating genes using default parameters [29,30,31]. Pangenomes were calculated via Roary v.3.12.0 with the arguments -e and -n using the PROKKA gff files as input [34]. Gene content differences between subspecies were determined using the Roary query_pan_genome -a script. The Roary output was visualized using roary_plots.py and create_pan_genome_plots.R. Average nucleotide identity of all B. longum strains versus each other was calculated with pyani v.0.2.8 using the ANIm MuMmer method and plotted using heatmaps.2 in gplots [35,36].
B. infantis genomes were queried for HMO gene cluster genes as defined in B. infantis ATCC15697T using BLAST [37]. The resultant genes were aligned by CLUSTALW using slow/accurate parameters [38]. Phylogenetic analysis was performed via the raxmlGUI v1.5 using maximum likelihood with 1000 bootstraps [39]. Phylogenetic trees were visualized and edited for clarity using FigTree v1.4.4 [40].
Pangenome gene sequences were provided in the pan_genome_reference.fa output file in Roary. These sequences were inputted into the EggNOG 4.5.1 eggNOG-mapper v2 genome-wide functional annotation tool, which was run with DIAMOND mapping mode and all other settings as default [41,42]. The results from EggNOG were downloaded as csv files and organized based on Clusters of Orthologous Groups (COGs) found in each individual genome or subspecies pangenome. Values associated with COG categories represent the percentage of COGs belonging to each category out of the total number of identified COGs. If a gene was assigned to two COG categories, each COG category was counted separately. When applicable, genes in the B. infantis pangenome categorized by PROKKA/Roary as hypothetical were further annotated using HMMER against the Pfam database [43,44]. Genes associated with carbohydrate metabolism were identified using the Carbohydrate-Active Enzymes (CAZy) database (http://www.cazy.org/) via the Database for Automated Carbohydrate-Active Enzyme Annotation (dbCAN) meta server [45,46]. CAZY hits were considered positive if they were identified by at least two of the three available annotation tools (HMMER v3.2, DIAMOND v0.9, and Hotpep v1). Gene gain and loss were determined using Count with default parameters, automated rate optimization, and a Dollo parsimony analysis [47]. Ecotype modeling was calculated based on the approach described by Konstantinos and Tiedje with modifications [48]. The average nucleotide identity (ANI) of each genome was calculated in reference to the type strain of each subspecies [35,48,49]. This value was then plotted against the average percent identity of protein-coding genes, also in reference to the subspecies type strain [48].
2.4. Species-Wide Phylogenetic Inference
Phylogenetic analyses were performed using the up-to-date bacterial core gene (UBCG) pipeline, which infers a maximum-likelihood phylogeny using the concatenated sequences of 92 single-copy core genes [50]. UBCG utilizes the external programs Prodigal v2.6.3, hmmsearch v3.2.1, MAFFT v7.313, and RaxML v8.2 in the pipeline [51,52,53,54]. Support for each node is calculated as a Gene Support Index (GSI) representing the number of genes (from a total of 92) whose common sequences group the taxa together within a branch. The Bifidobacterium breve DSM20213 genome was used as an outgroup and obtained from the NCBI GenBank accession GCA_001025175.1. Phylogenetic trees were visualized and formatted using FigTree v.1.4.4 [40].
2.5. Carbohydrate Fermentation Phenotyping
Bifidobacterial strains were evaluated for their ability to utilize carbohydrates as a sole carbon source. Briefly, 1% v/v overnight culture was grown in triplicate on modified MRS (mMRS) media containing 2% w/v of each carbon substrate: arabinose, fructo-oligosaccharides (FOS), fructose, glucose, lactose, mannose, melezitose, N-acetylglucosamine, raffinose, and xylose. Biomass production was estimated by measuring the optical density at 600nm (OD600). To determine final OD600, mMRS was inoculated with an overnight culture at a concentration of 1% and then incubated for 72 h at 37 °C under anaerobic conditions. Two-way analysis of variance was performed using GraphPad Prism version 6 (GraphPad Software, La Jolla, CA, USA). In addition, isolates were tested for growth on lacto-N-tetraose (LNT) and lacto-N-neotetraose (LNnT) using a PowerWave HT Microplate Spectrophotometer (BioTek, Winooski, VT, USA). Overnight cultures grown in MRS were used to inoculate mMRS at a concentration of 1%. Isolates then grew anaerobically for 40 h at 37 °C with shaking and OD600 measurements every 15 min. The OD600 values were plotted using GraphPad Prism 6.
3. Results
3.1. Bifidobacterium longum General Genome Characteristics
A total of 191 Bifidobacterium longum genomes were analyzed (Supplemental Table S1). Two of these strains, UMA3015 and JCM19995, had their genomes sequence de novo, with the former isolated from infant feces and the latter isolated from pig feces [55]. The genome of a third strain, CECT7894, was provided by AB-Biotics and has been deposited in the NCBI GenBank database. Of 191 genomes, 71 (37.2%) had been assigned a subspecies designation within a public database: longum (43), infantis (22), and suis (6) (Supplemental Table S1). Noteworthy, 5 of the 71 strains (i.e., 157F, CECT7210, CCUG52486, JDM301, CMCCP0001) possess a subspecies designation that conflicts with our phylogenetic analysis (see Figure 1 and Supplemental Table S1). The misidentification of these strains has been noted in previous reports and is a result of challenges in accurately typing the closely related B. longum subspecies [14,18,56]. The average genome size for all B. longum strains is 2.42 Mb with a minimum of 1.87 Mb (strain 121.2) and a maximum of 2.88 Mb (strain BIC1307292462) (Table 1 and Supplemental Table S1). The average genome size of the infantis subspecies (2.67 Mb) is significantly larger than longum (2.38 Mb) and suis (2.42 Mb) (Table 1). The percent GC content of each subspecies does not vary considerably (subspecies longum, 60.03%, subspecies infantis, 59.70%, and subspecies suis, 59.85%). Interestingly, the mean genome size of 9 B. infantis strains (ATCC15697, BIC1206122787, BIC1307292462, BIC1401111250, Bifido_S1, NCTC13219, PC1, PC4, and UCD301) is significantly higher than the mean genome size of the remaining 14 B. infantis strains (2.78 ± 0.08 versus 2.59 ± 0.09; p < 0.01 via unpaired t test).
3.2. Bifidobacterium longum Inferred Phylogeny
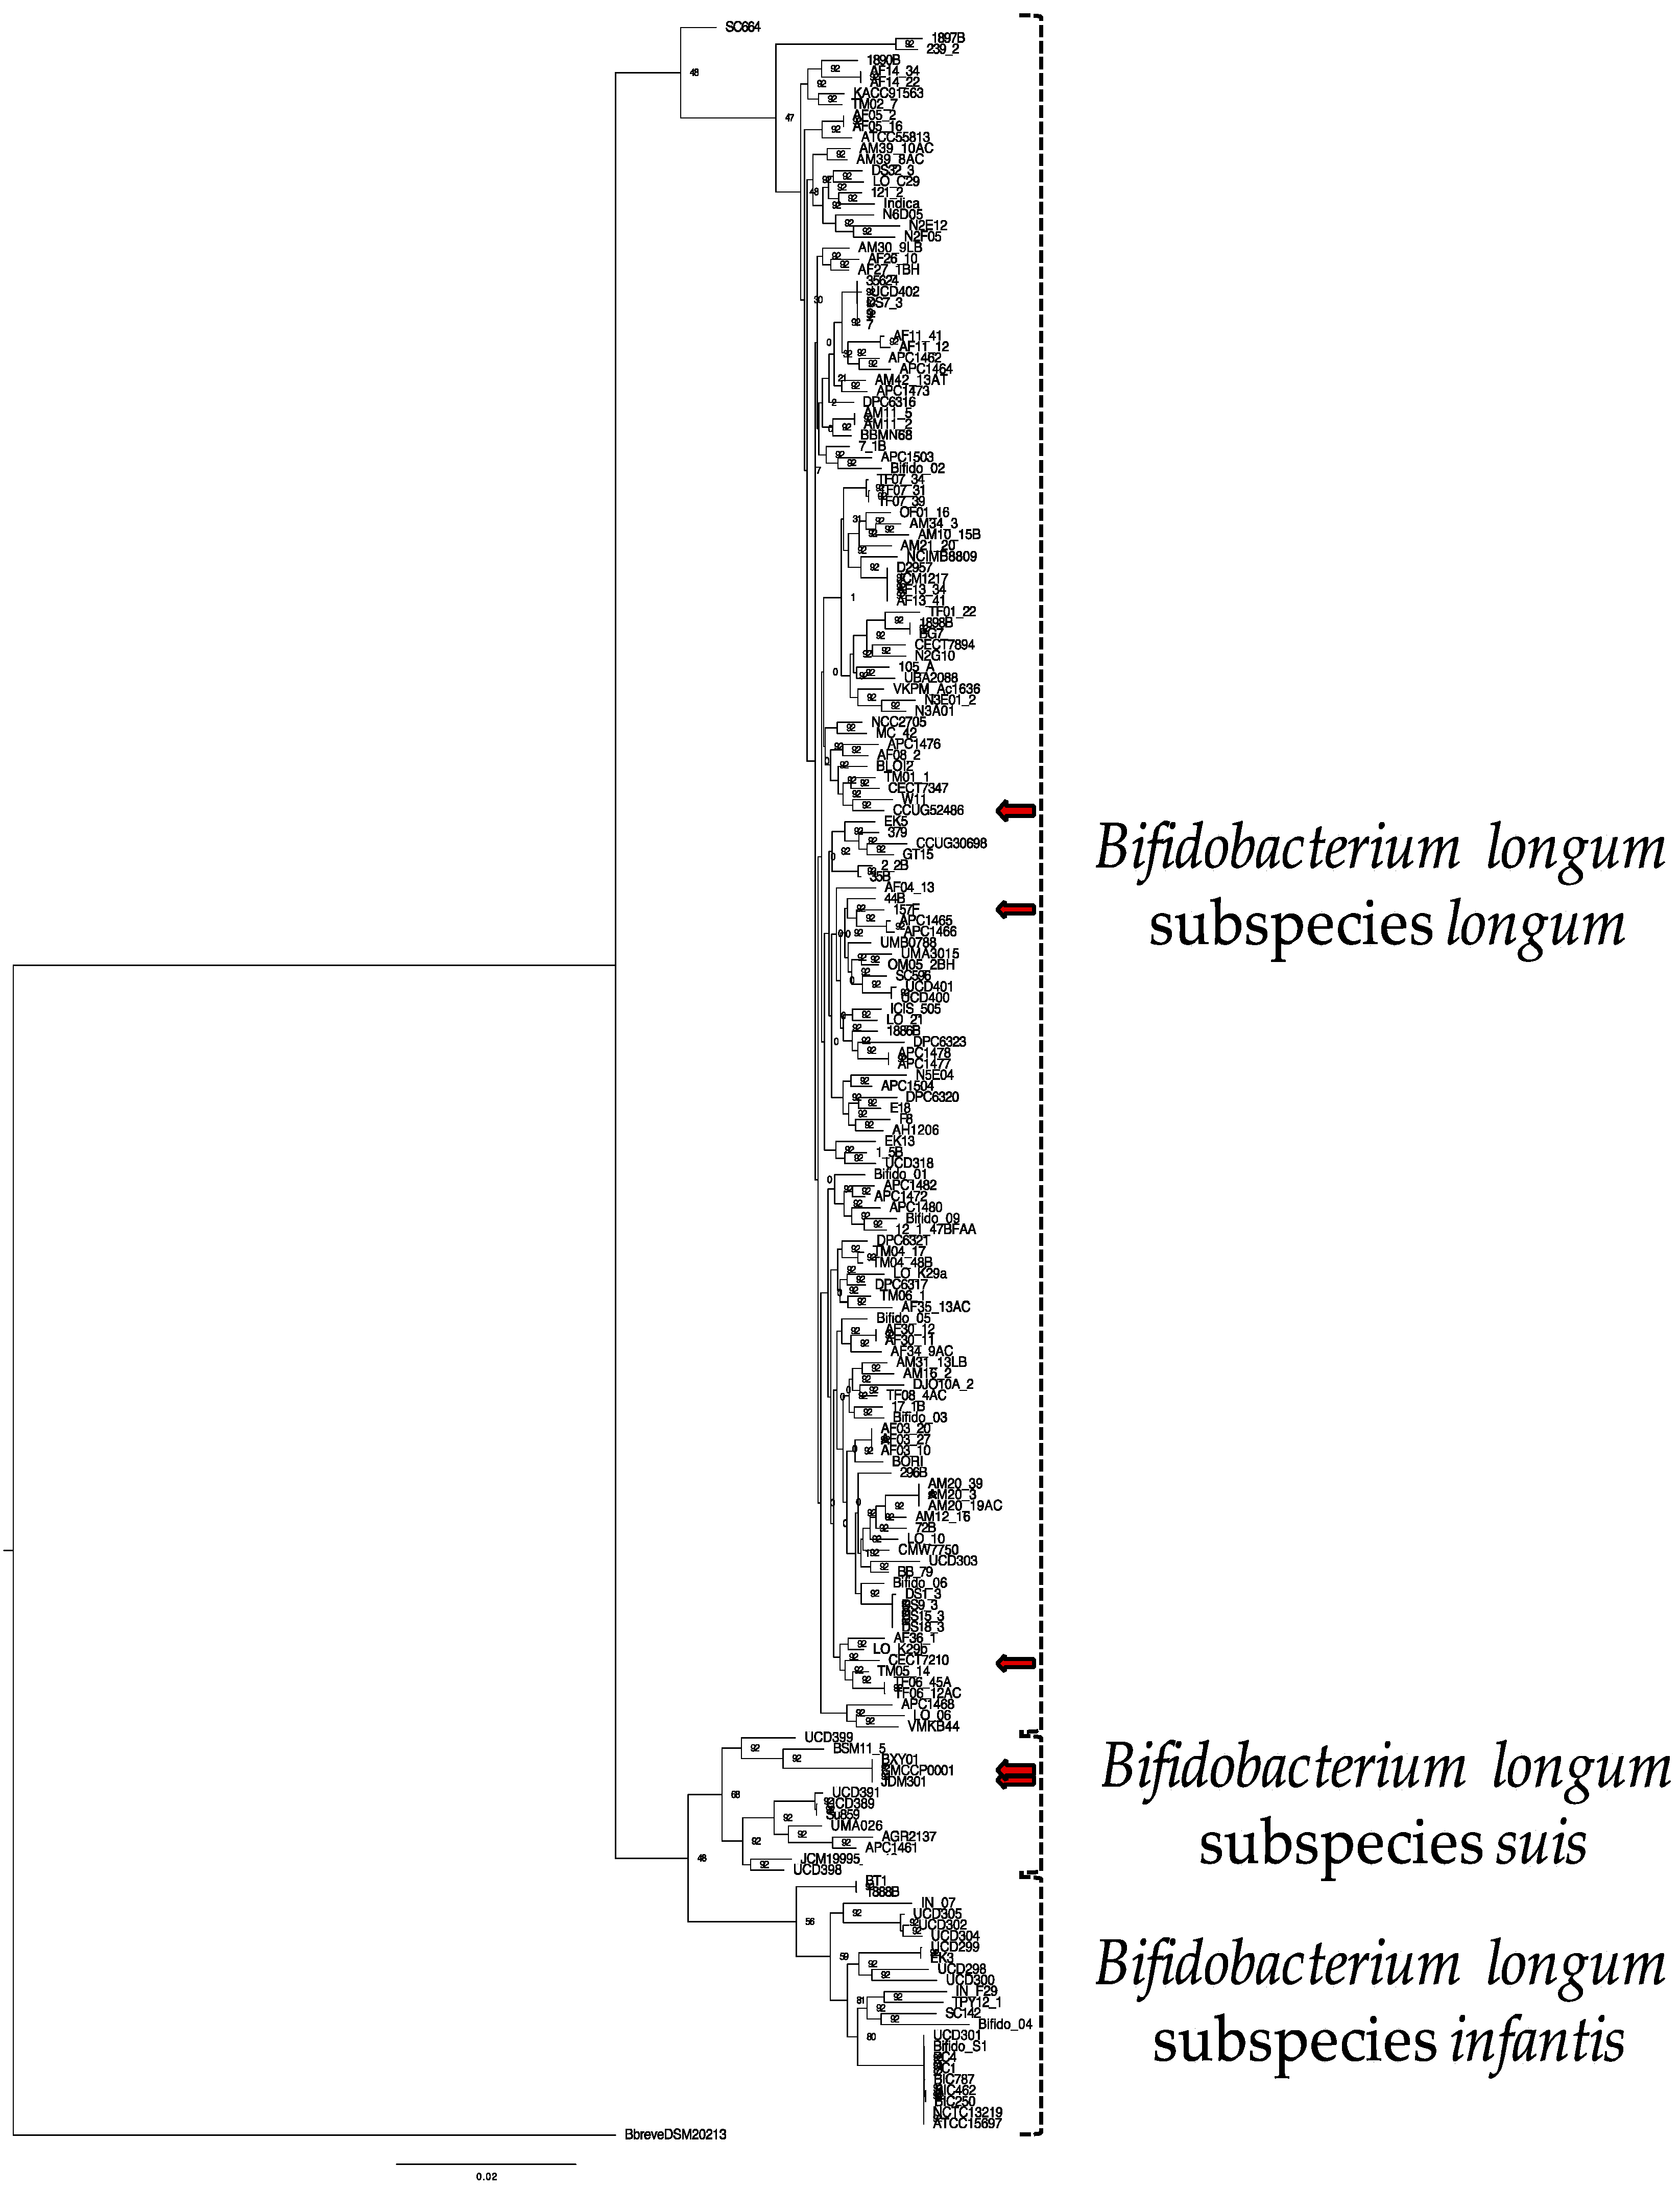
The evolutionary relationship between B. longum strains was inferred using the Up-to-Date Bacterial Core Gene (UBCG) pipeline via EZBioCloud, which uses the concatenated sequences of 92 single-copy core genes [50]. These core genes represent conserved phylogenetically informative loci that exhibit consistent divergence rates and are not likely a product of horizontal transfer. Maximum likelihood was applied to construct the resultant tree (Figure 1). The topology of this phylogeny indicates the separation of the B. longum species into the three accepted subspecies, with most strains segregating to longum and suis/infantis assembling into a distinct clade. This reflects subspecies divergence from a common ancestor. Furthermore, topology of this B. longum phylogeny is similar to a recent study of several Bifidobacterium species [57]. Within the infantis subspecies, there is a clear delineation between the strains where some cluster tightly with the remainder exhibiting more diversity. Interestingly, this clustering pattern matches the genome size disparity observed among infantis strains. Strain B. longum JCM19995 was proposed to be in a distinct and fourth subspecies closely related to subspecies suis, termed subspecies suillum, based partially on its urease-negative phenotype [55]. Interestingly, JCM19995 shares a node with B. suis UCD398, a urease-negative strain, but does not segregate with other strains lacking the urease gene cluster (Figure S1). This does not support assigning B. longum JCM19995 to a novel subspecies; rather, it is one of several B. longum subspecies suis strains lacking urease activity.
3.3. Average Nucleotide Identity Analyses
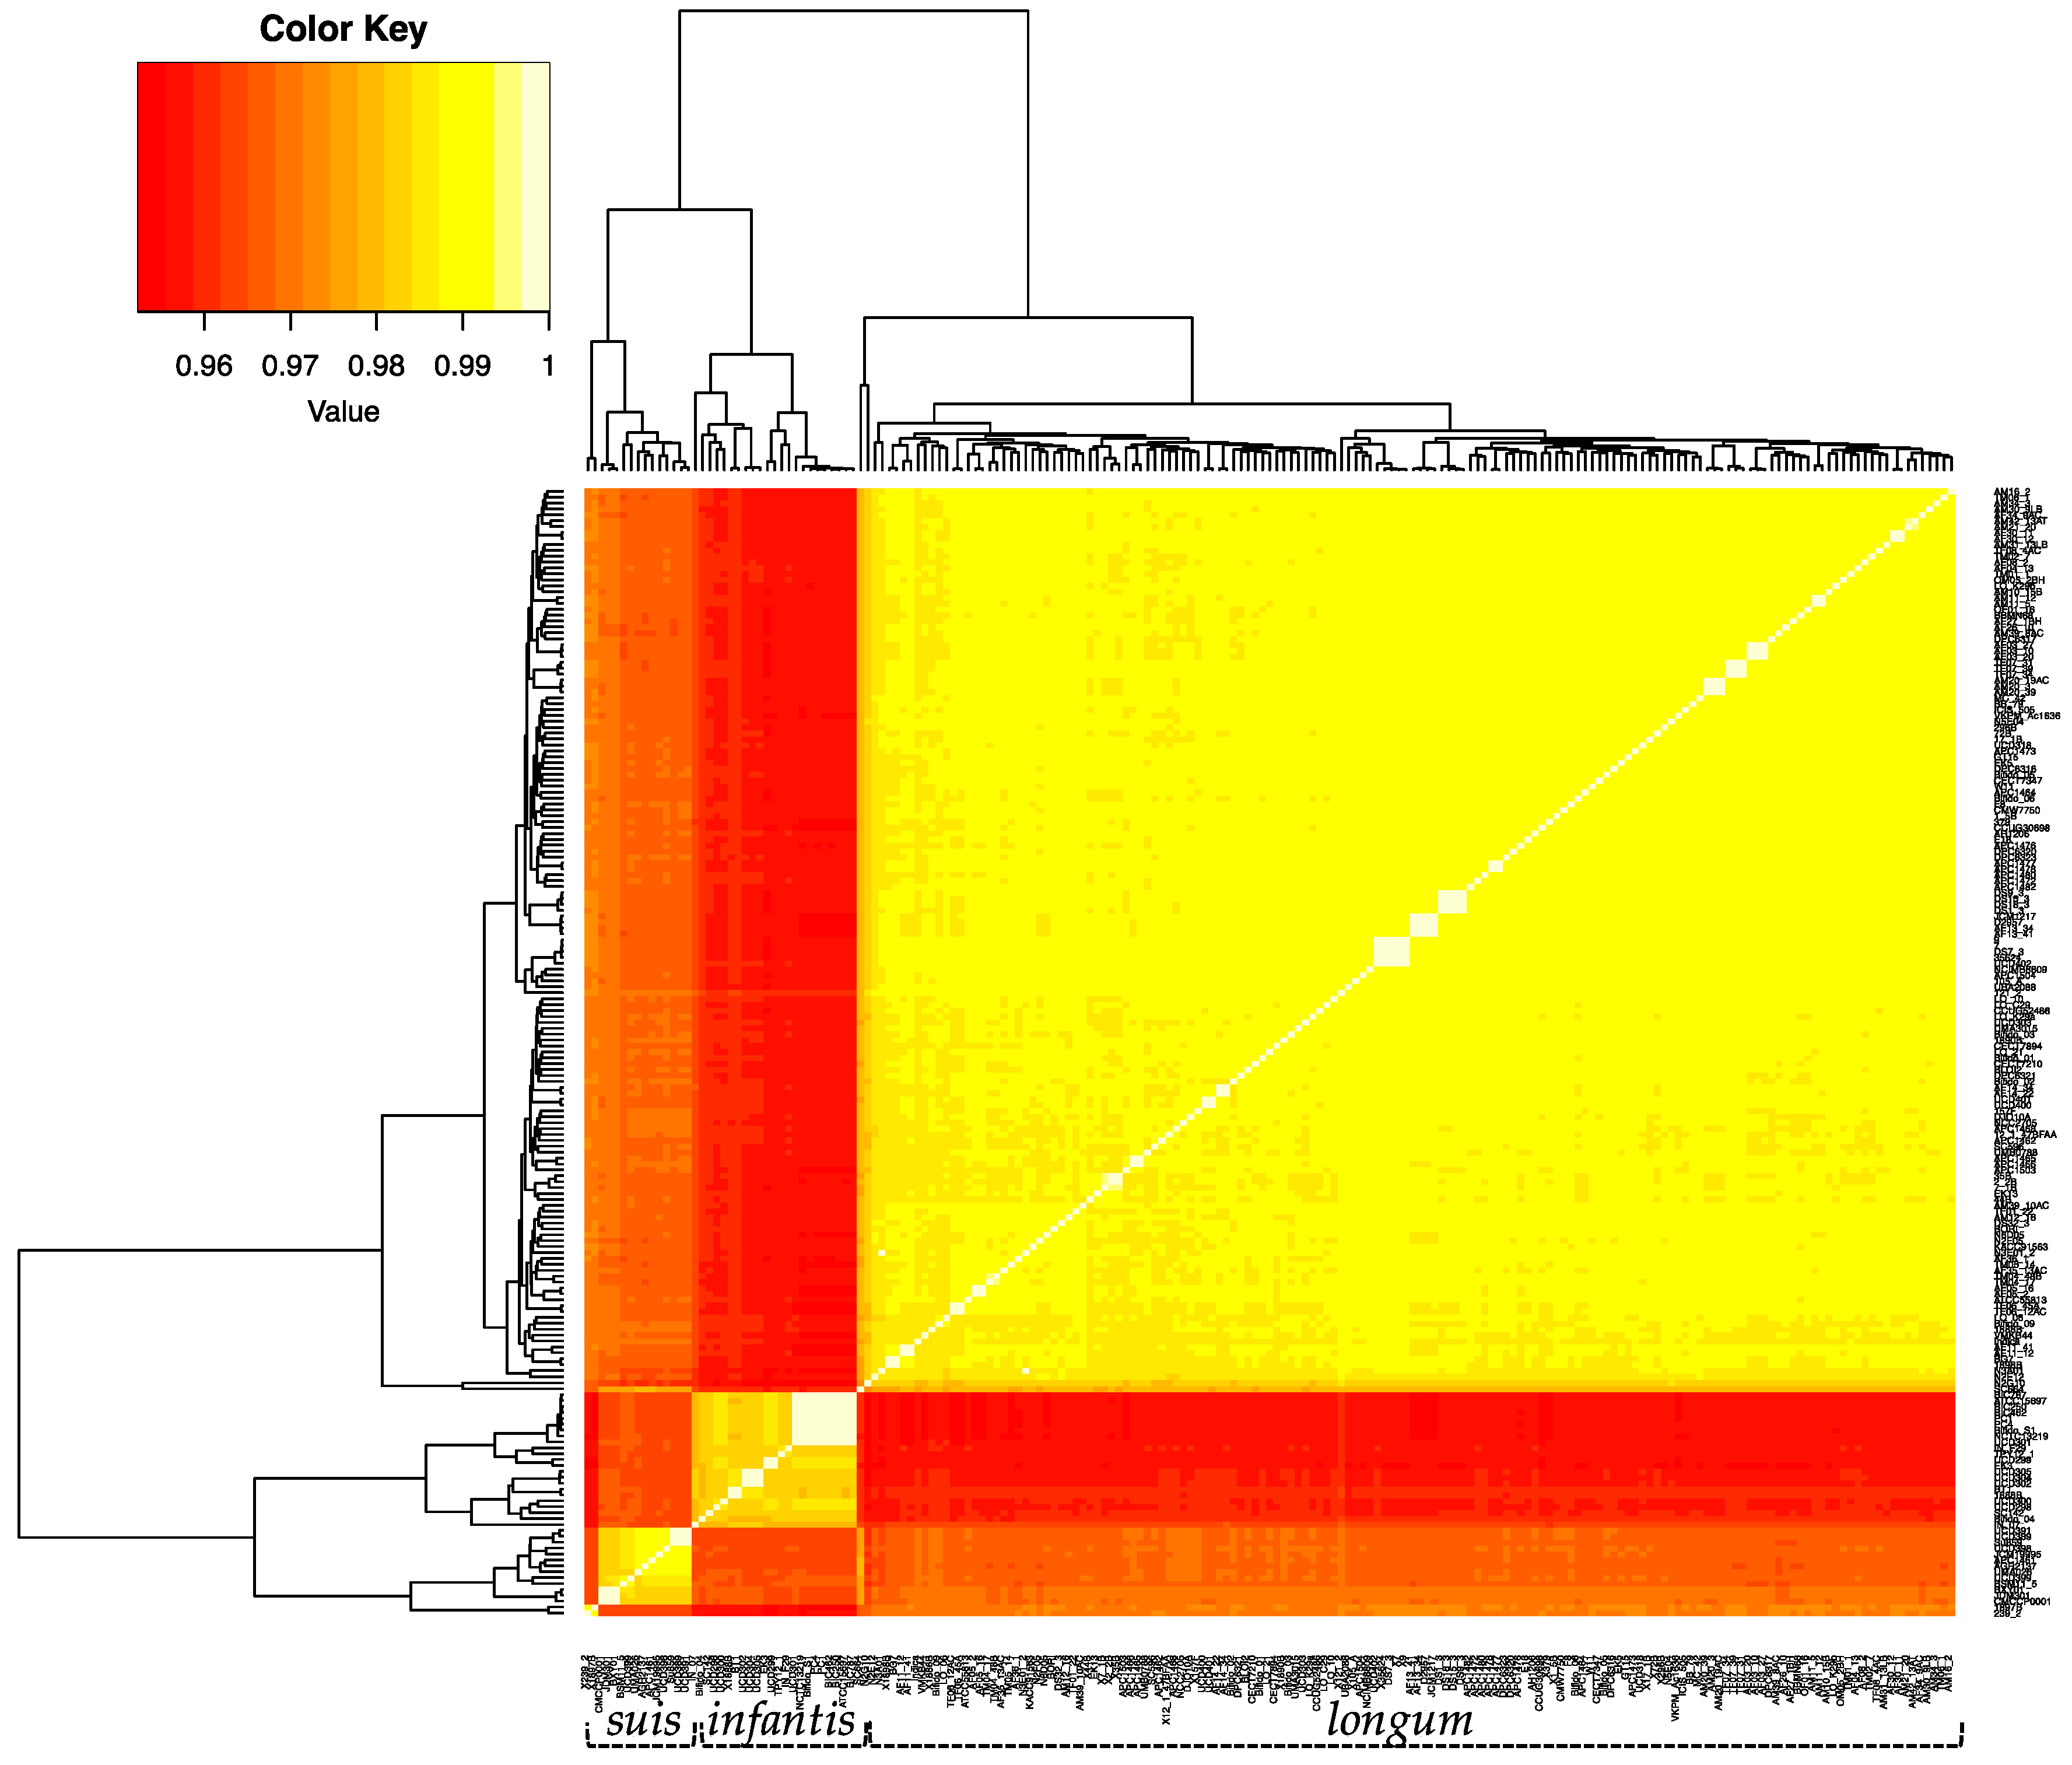
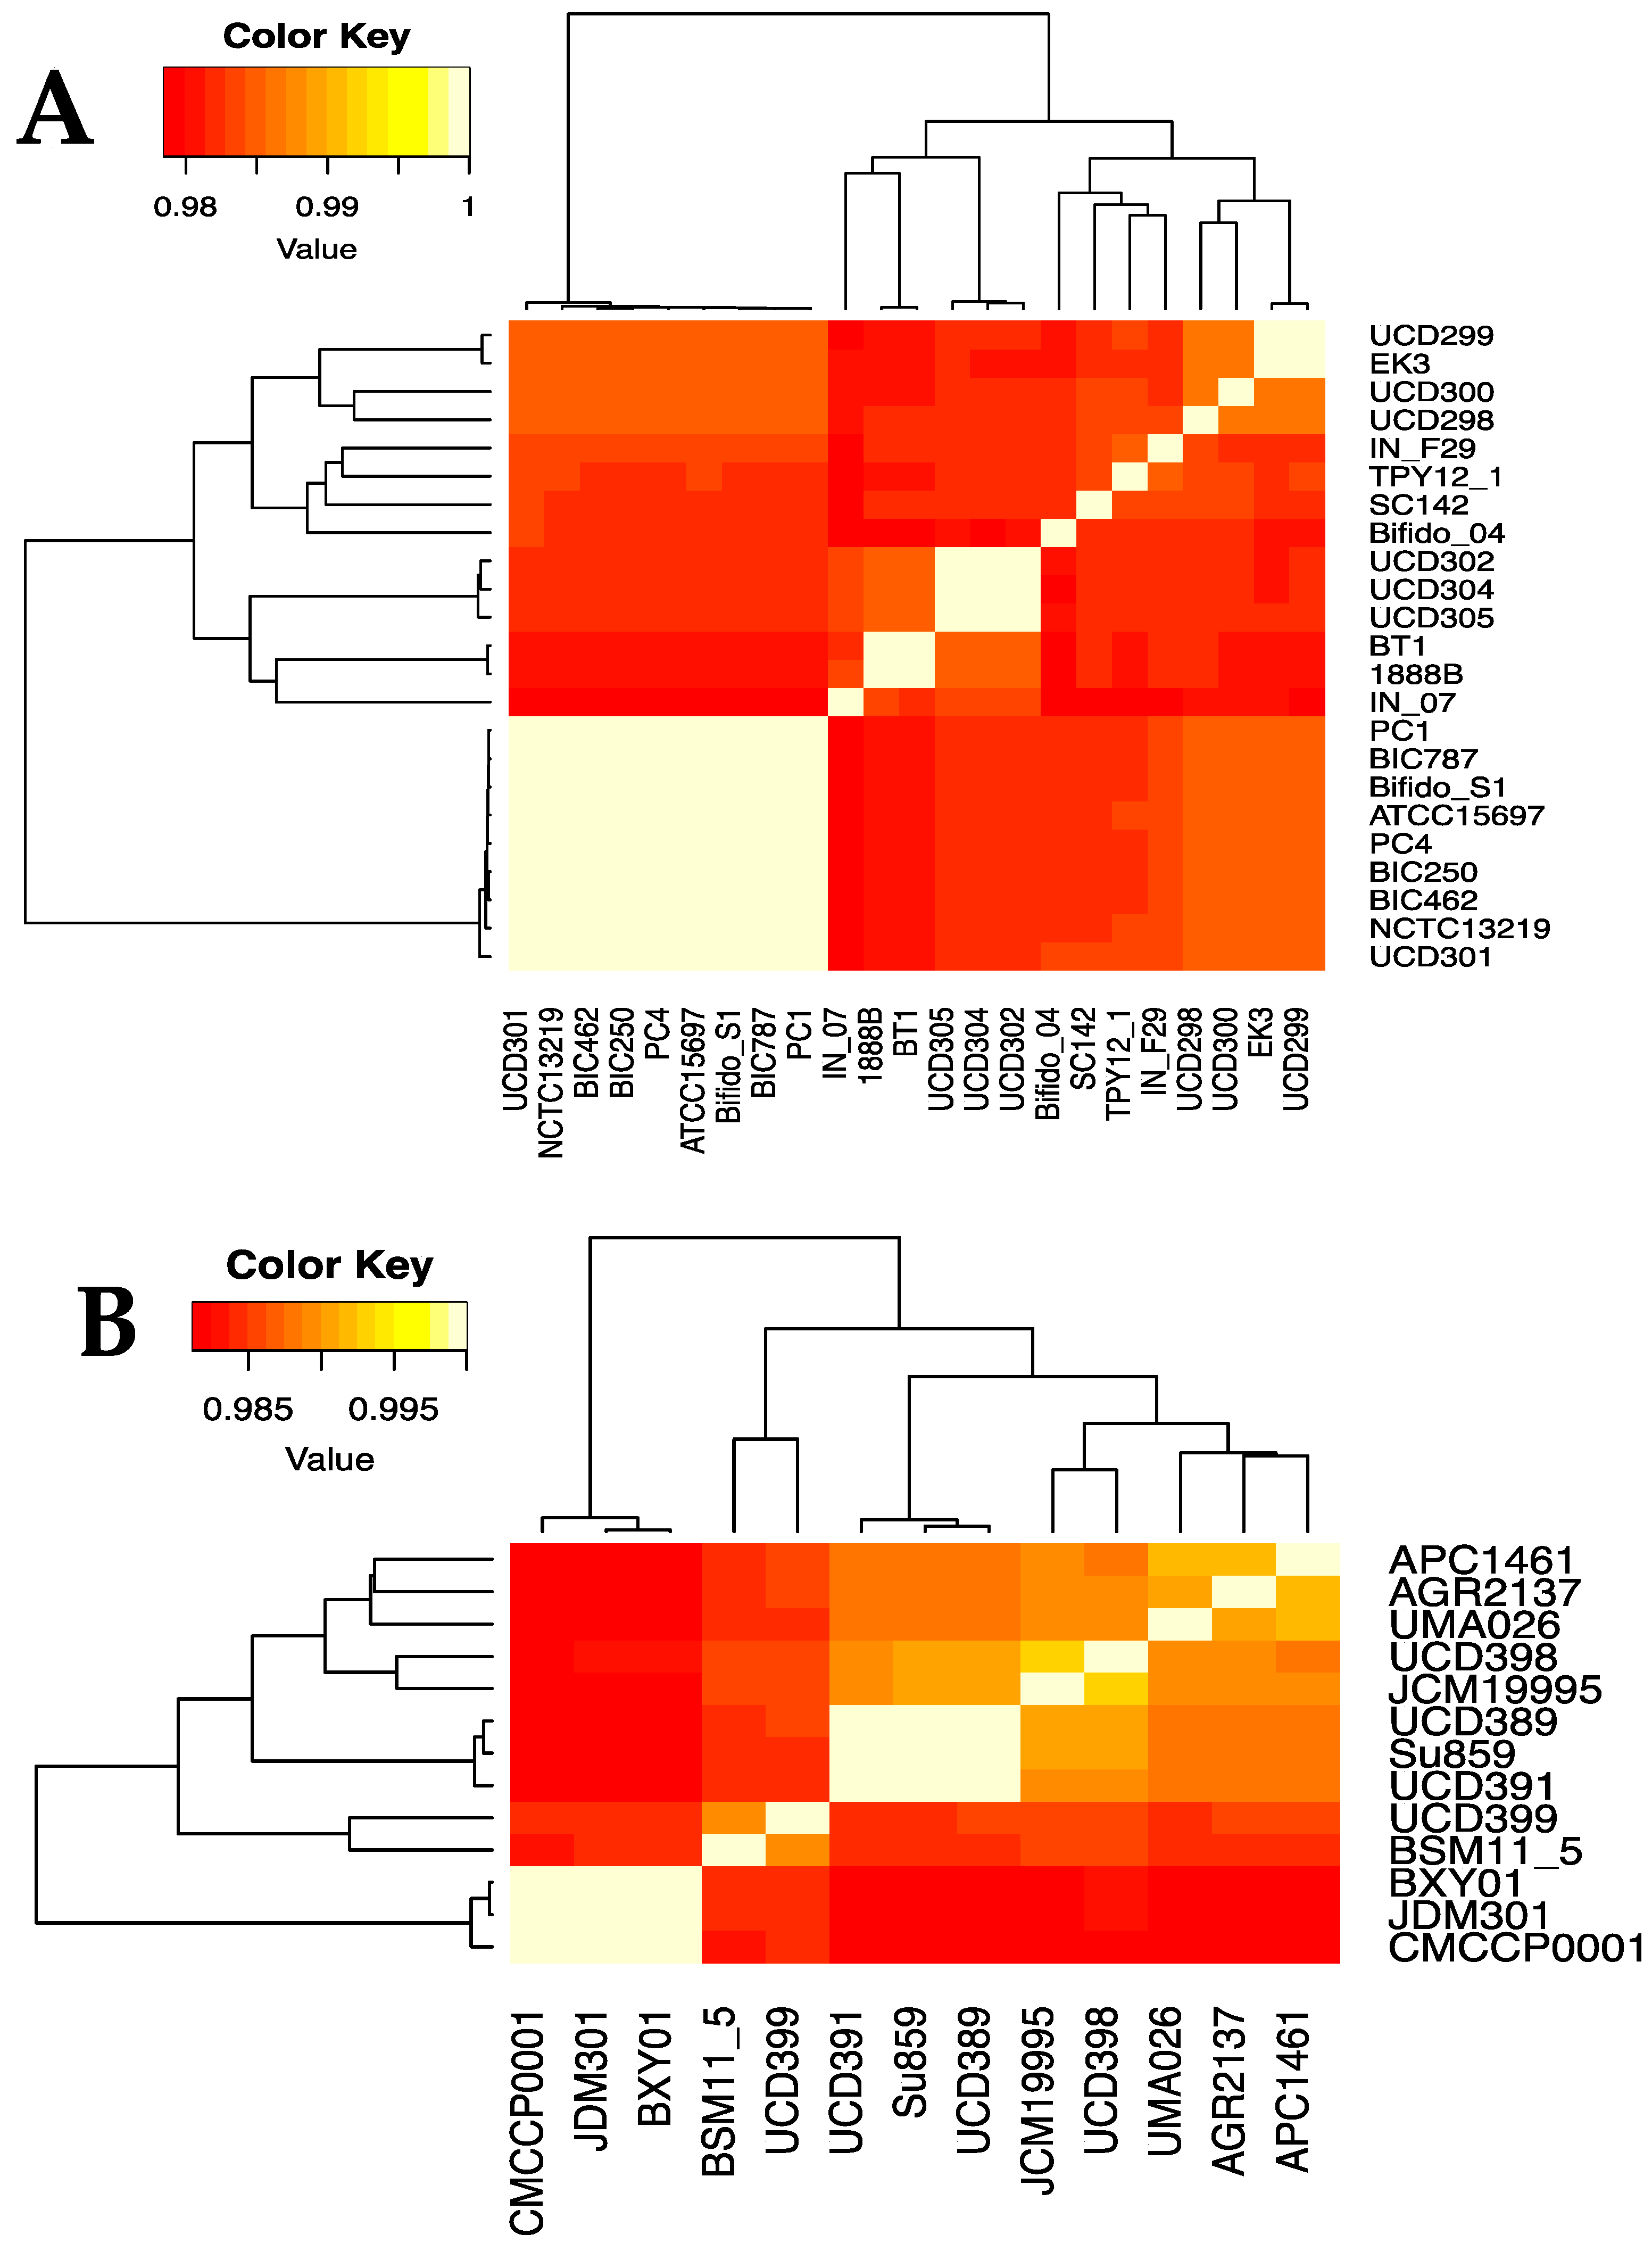
In order to further define the genomic relationships between the three subspecies, we calculated the percent average nucleotide identity (ANI) of all genomes against each other (Figure 2 and Supplemental Table S2). The ANI values of the 191 B. longum strains cluster into three groups corresponding to the three subspecies and recapitulate the single-copy gene phylogeny (Figure 1). Subspecies longum has the widest ANI range, with several strain/strain ANI values below 97%. Strain-level detail of ANI similarities between infantis and suis strains is depicted in Figure 3A,B. Taken together, the UBCG phylogeny and the ANI analysis support the separation of B. longum species strains into three separate subspecies. In addition, the separation of infantis strains into two groups in the inferred phylogeny and the ANI analysis demonstrates significant subspecies variation. It is possible that the B. infantis strains closely related to ATCC15697 are derived from this source strain and used in probiotic products. In support of this, several of these strains were isolated from the blood of patients taking oral probiotics [58,59].
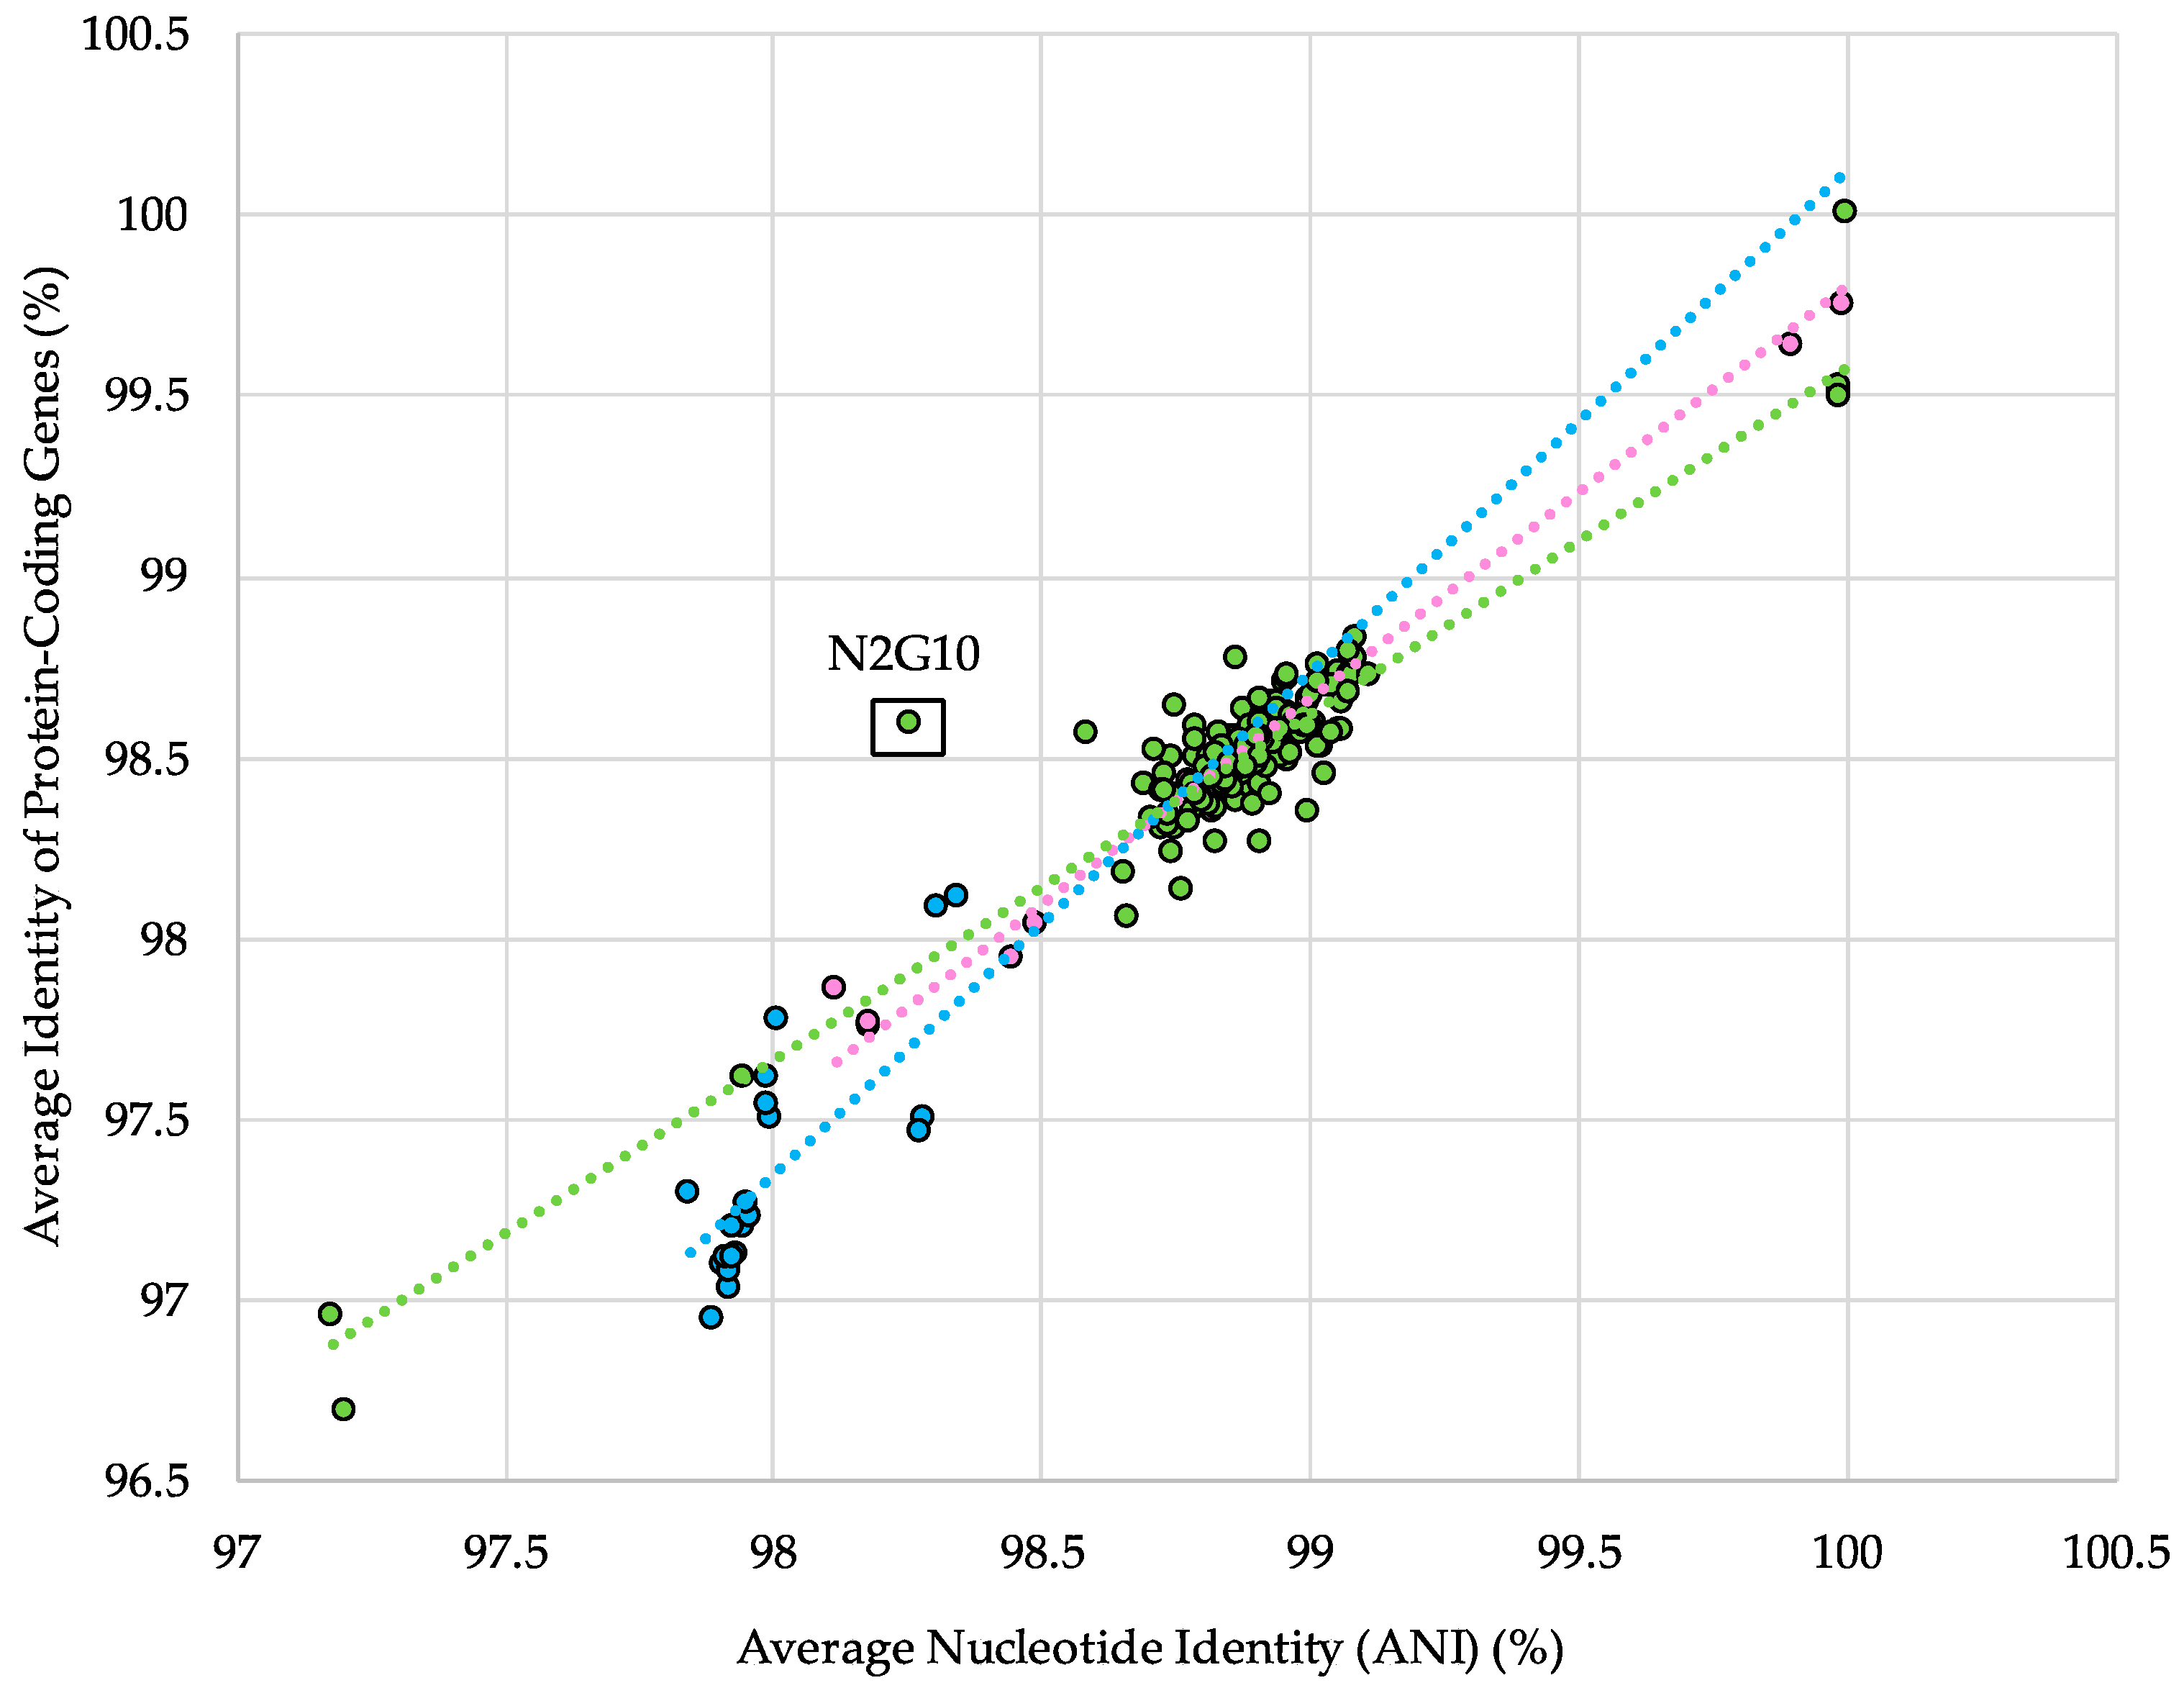
Despite the complementary and synergistic power of the ANI comparison and the concatenated core gene phylogeny in distinguishing subspecies, these analyses do not account for functional differences. To determine the relationship with predicted gene content, the ANI between each strain and a representative strain from its subspecies was plotted against the ANI of protein-coding genes (ANIpcg). Under neutral conditions, one would expect a linear relationship between changes in ANI and ANIpcg, and variations in this pattern may suggest differences in ecotypes within a subspecies. The results of this analysis identified one major ecotype outlier, B. longum subspecies longum N2G10 (Figure 4). It is unclear what factors may have influenced the high ANIpcg of this strain relative to its ANI. However, this strain is one of eight isolated from vaginal swab samples, a rare isolation source among B. longum genomes, and the genome assembly contains a high number of contigs (Supplemental Table S1) [60].
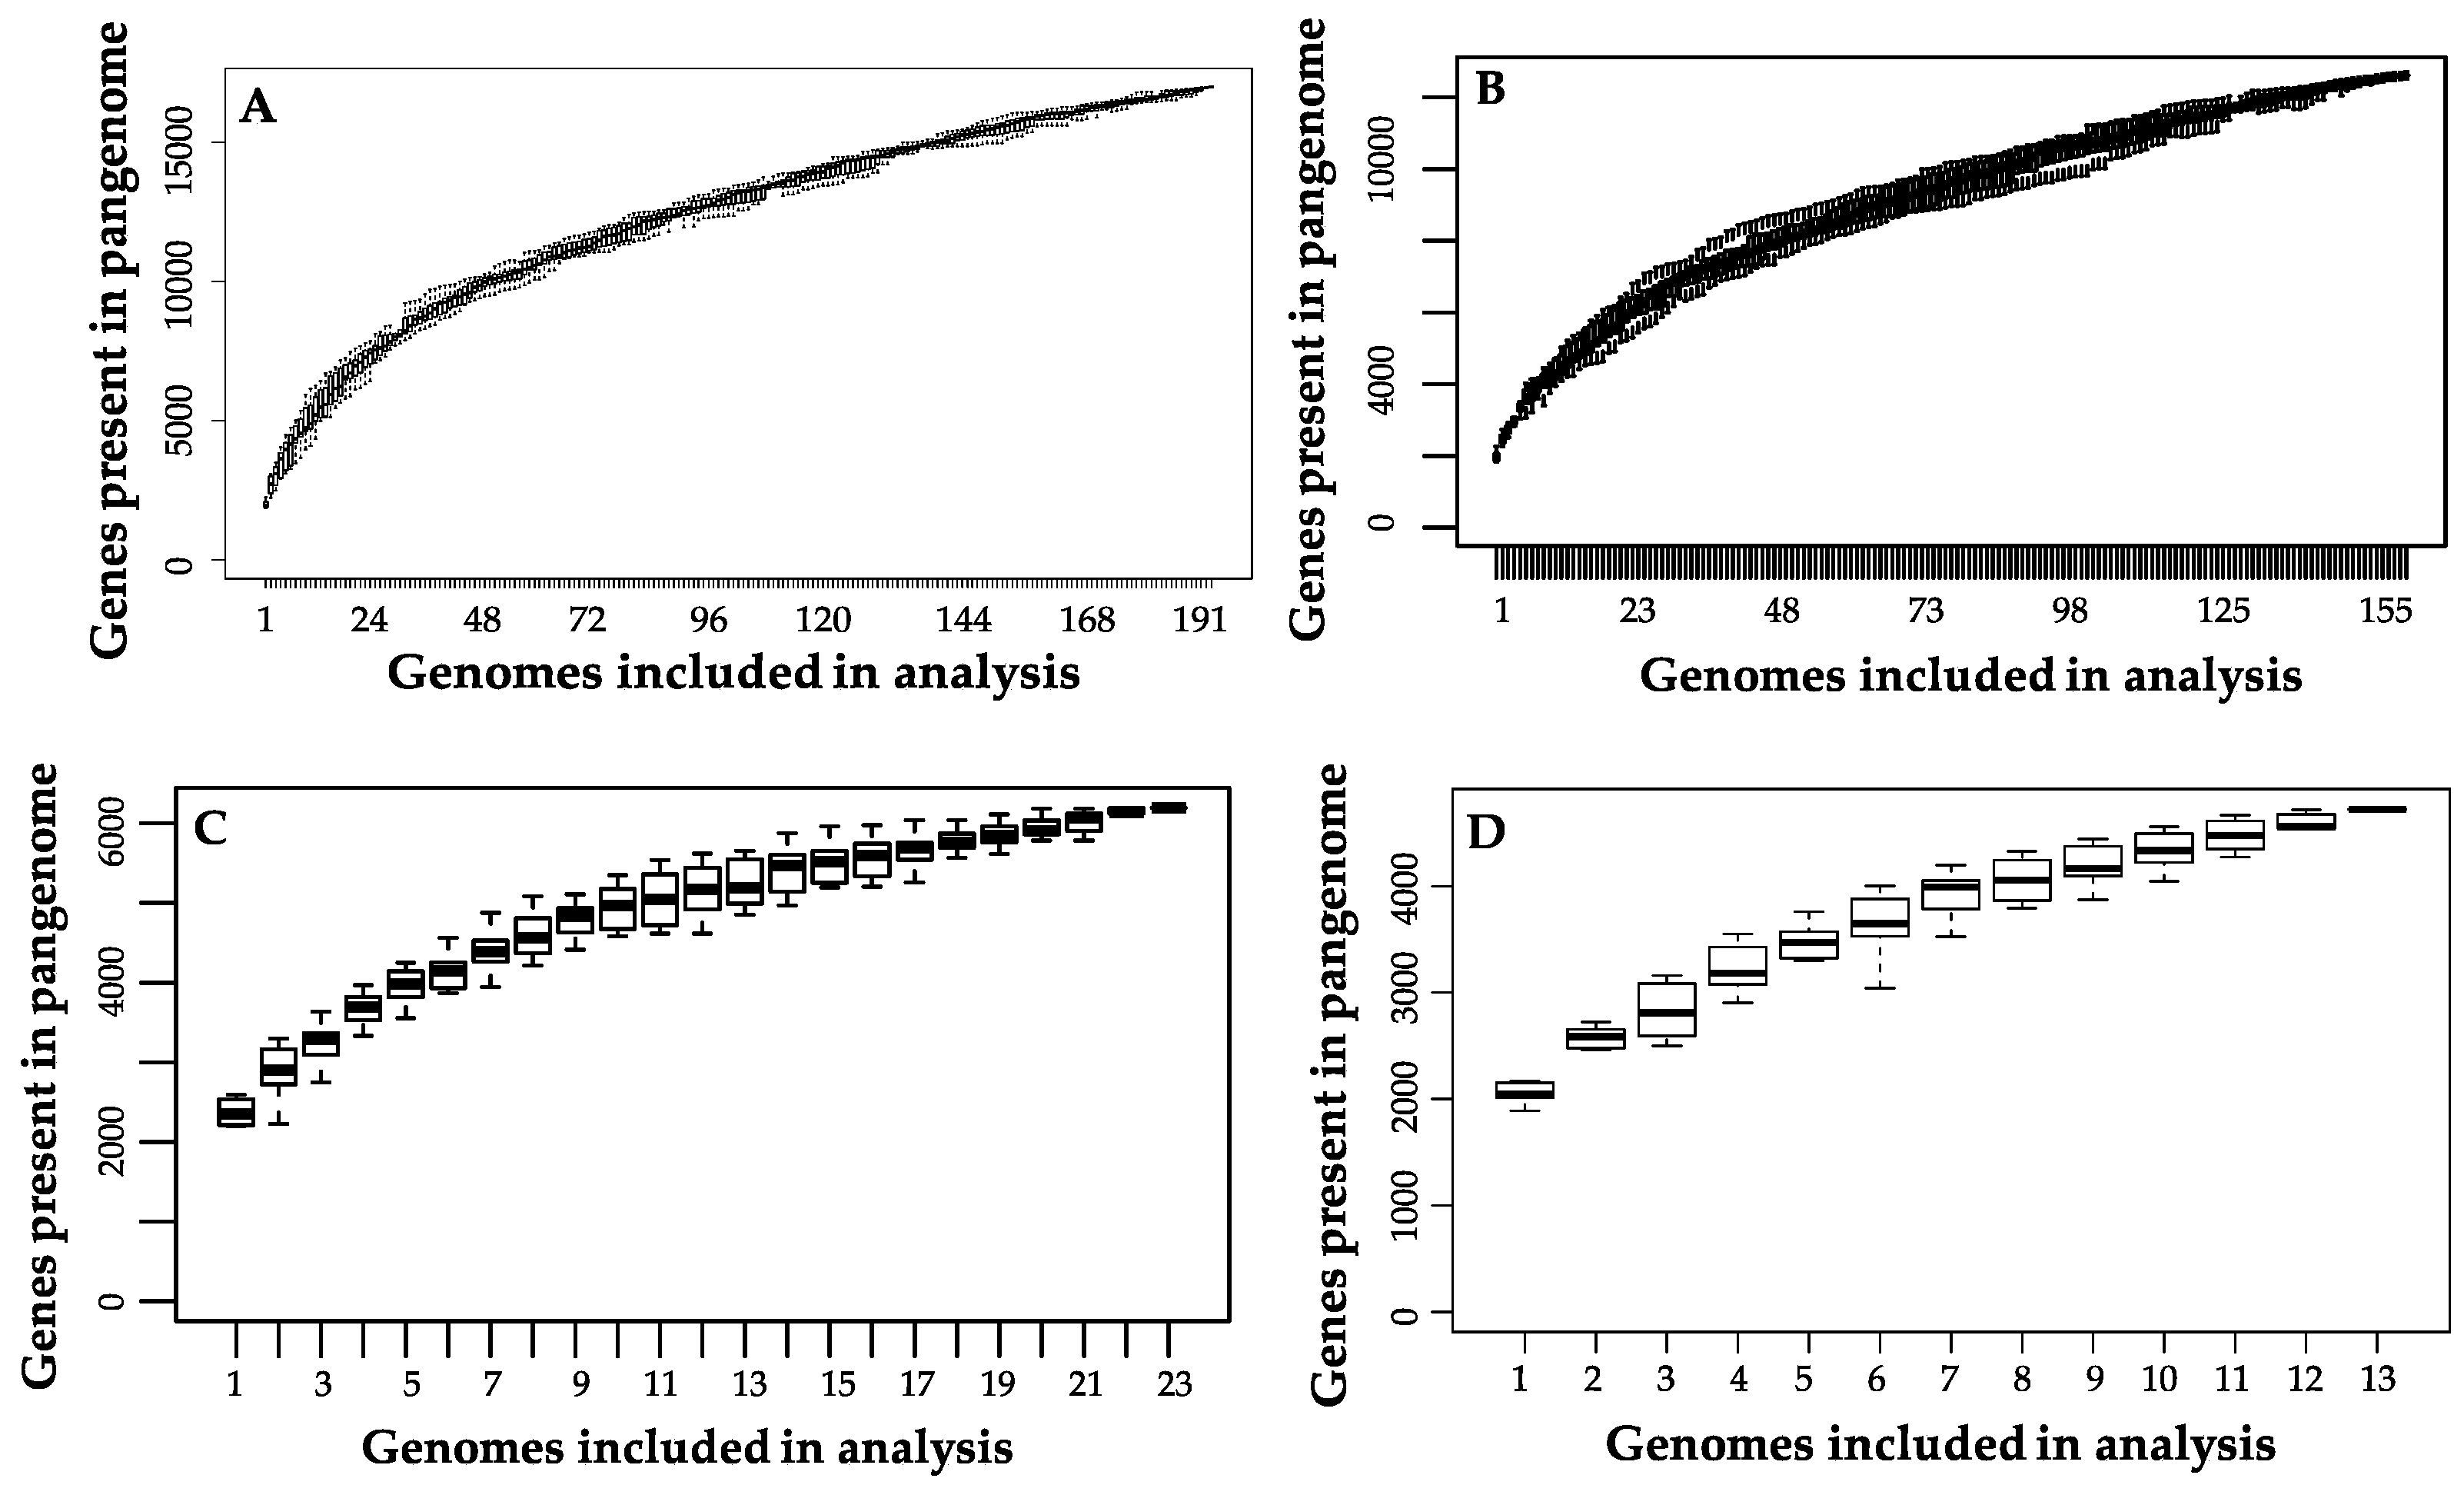
3.4. The Bifidobacterium longum Pangenome
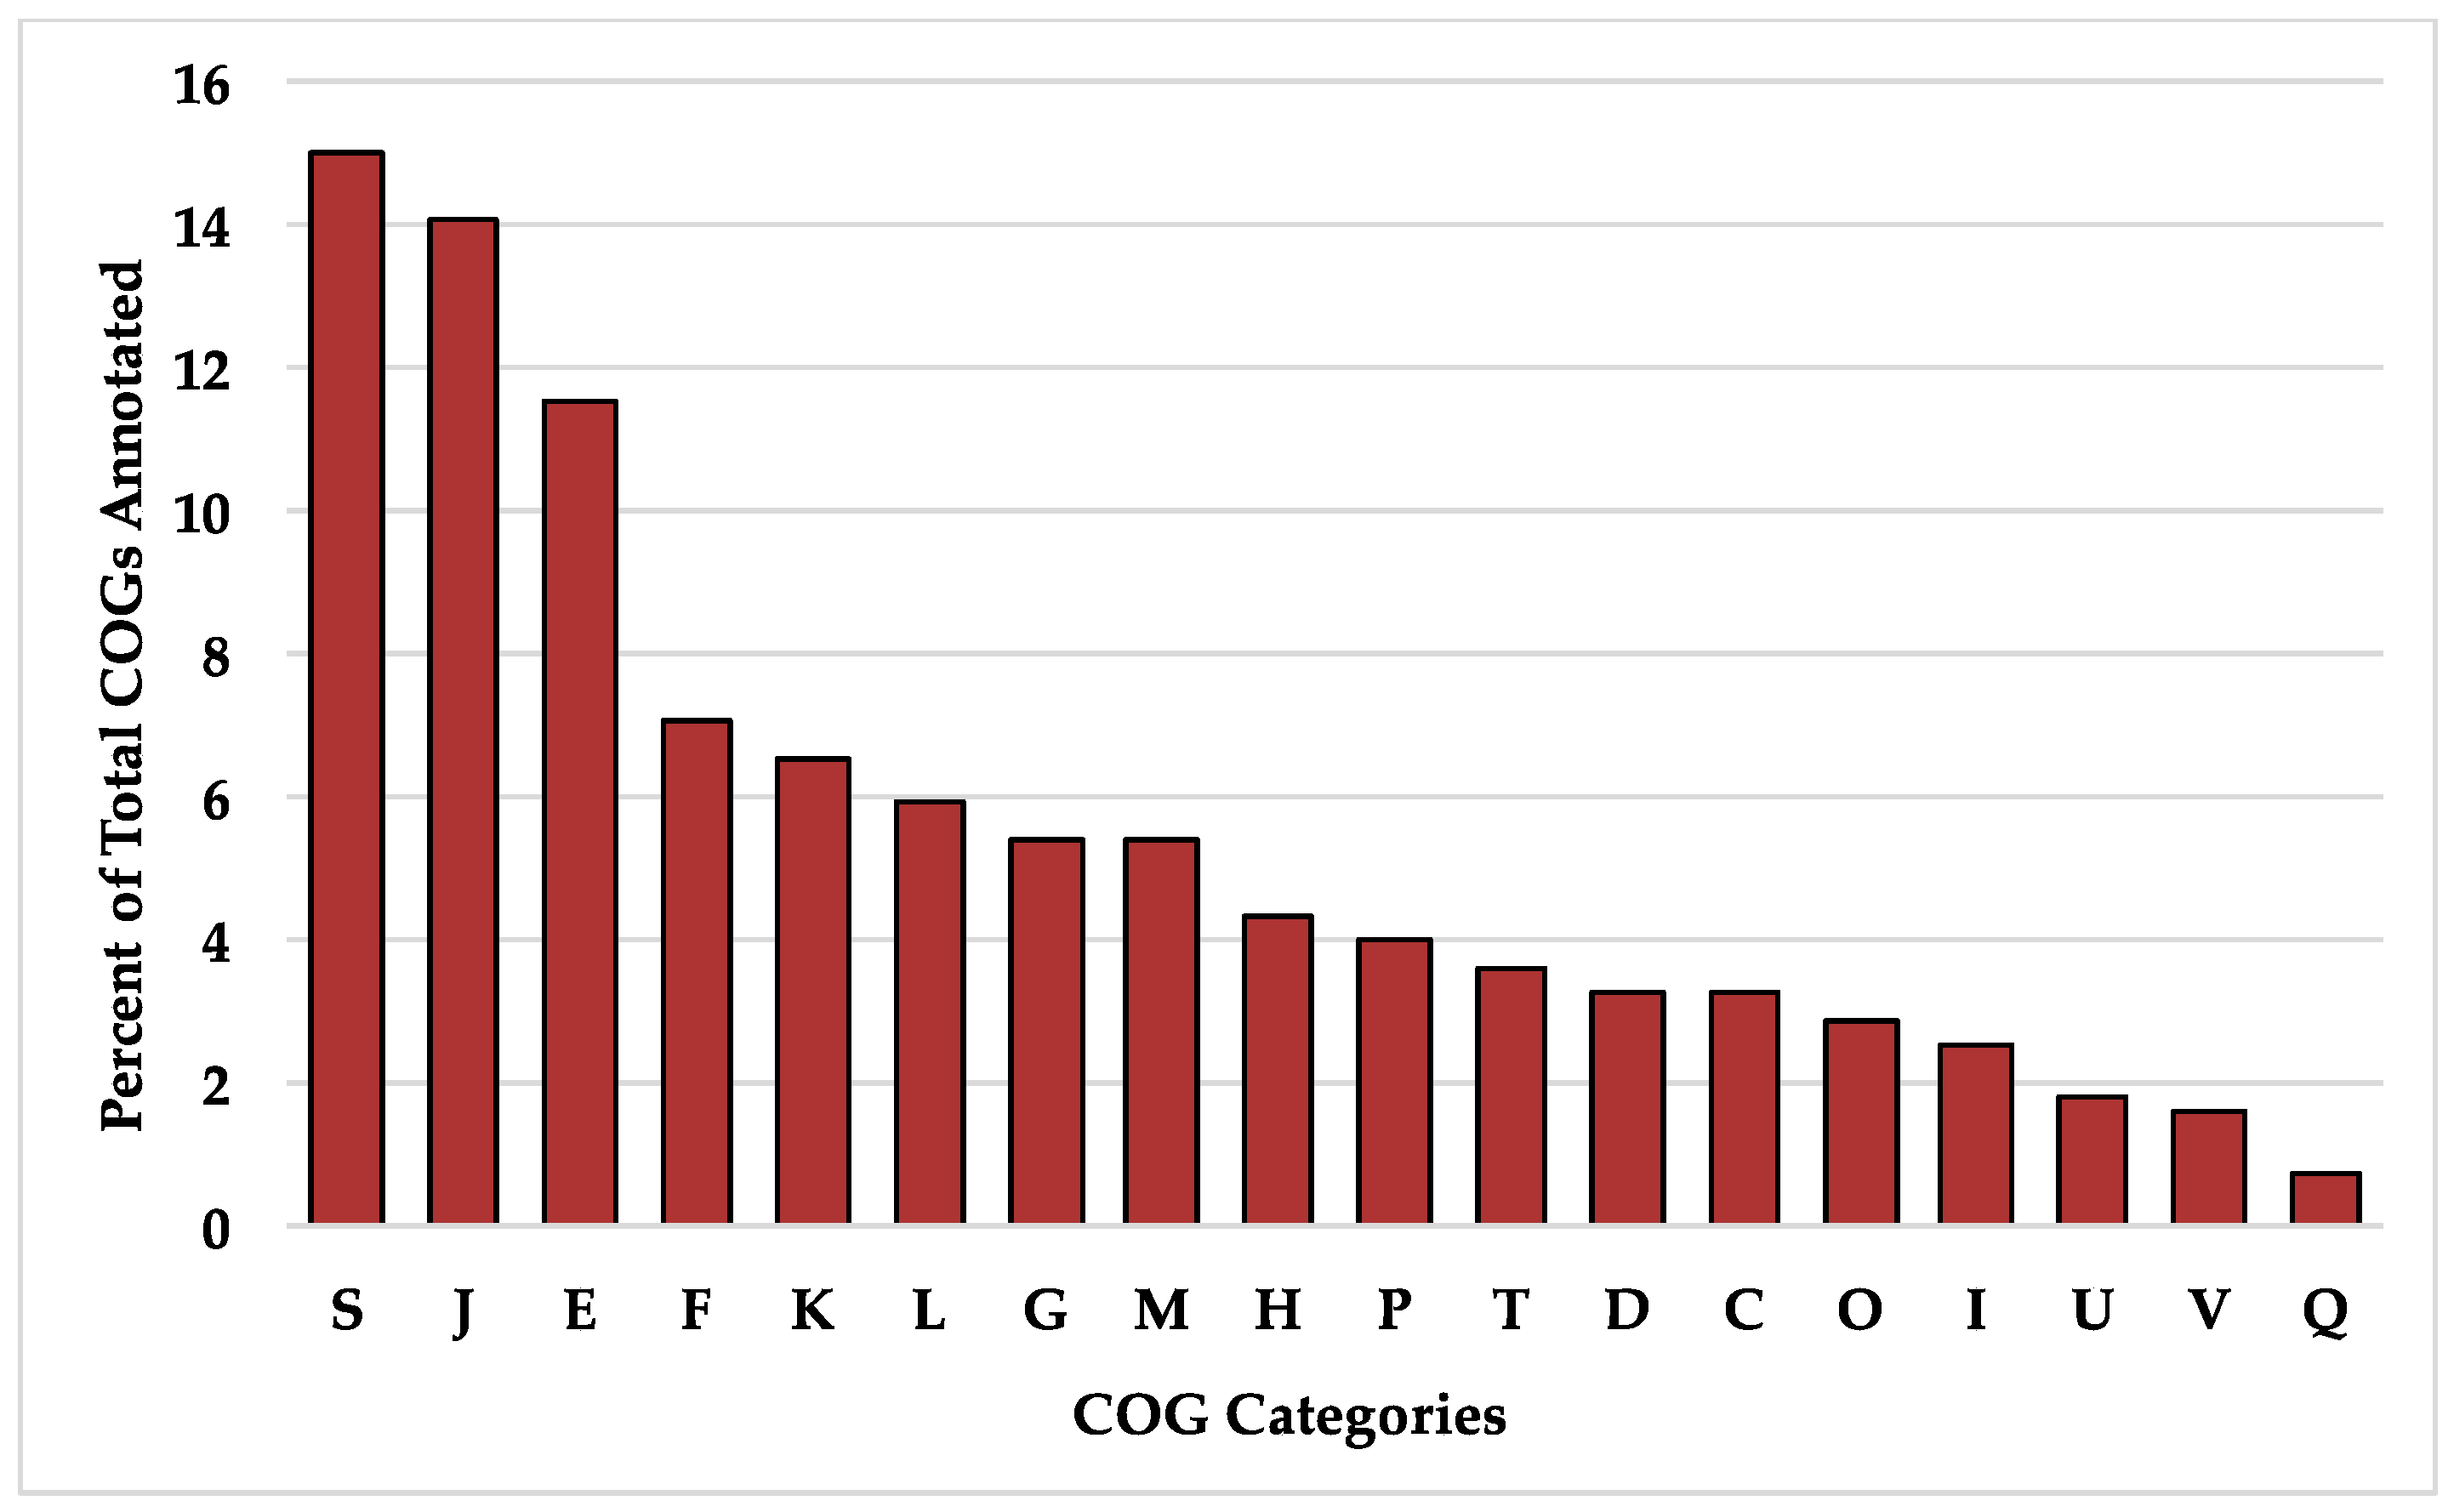
The B. longum species pangenome is open but is approaching a closed state given the current availability of strains in public databases. This is consistent with prior analyses conducted on B. longum [19,20]. Thus additional strains are required to describe the full diversity potential (Figure 5A). The B. longum pangenome contains 16,973 total genes, a majority of which (85.2%) are found in ≤28 strains. Out of the total gene set, only 551 (3.2%) are core genes defined as present in ≥190 strains (Table 2). The majority of identified COGs in the core gene set were assigned to the S category with an unknown function (15.0%), J which encompasses housekeeping functions translation, ribosomal structure, and biogenesis (14.1%), and E which includes amino acid transport and metabolism (11.6%) (Figure 6). The high prevalence of COG categories J and E represents cellular functions whose metabolic pathways are conserved among B. longum strains, whereas categories with less core gene representation demonstrate more strain-level metabolic flexibility. There are 124 gene sequences (22.5% of total core genes) annotated as “hypothetical protein”, “putative protein”, or “putative membrane protein”. Other genes included in the core set are essential to housekeeping functions, including cell division (ftsL, ftsQ, ftsZ, crgA, and sepF), protease activity (clpP and clpX), and peptidoglycan synthesis (pbpA, pbpB, and pbpG). Several core genes are known to interact with carbohydrates that B. longum encounter in the gut, including β-N-acetylhexosaminidase (EC 3.2.1.52), a glycosyl hydrolase critical for metabolizing human milk oligosaccharides, levanase (EC 3.2.1.65), which facilitates hydrolysis of fructose polymers, and various ABC transporters [61,62]. As expected, all genomes encode the bifidobacterial characteristic enzyme fructose-6-phosphate phosphoketolase (EC 4.1.2.22) which is critical in the central fermentative pathway termed the bifid shunt [63].
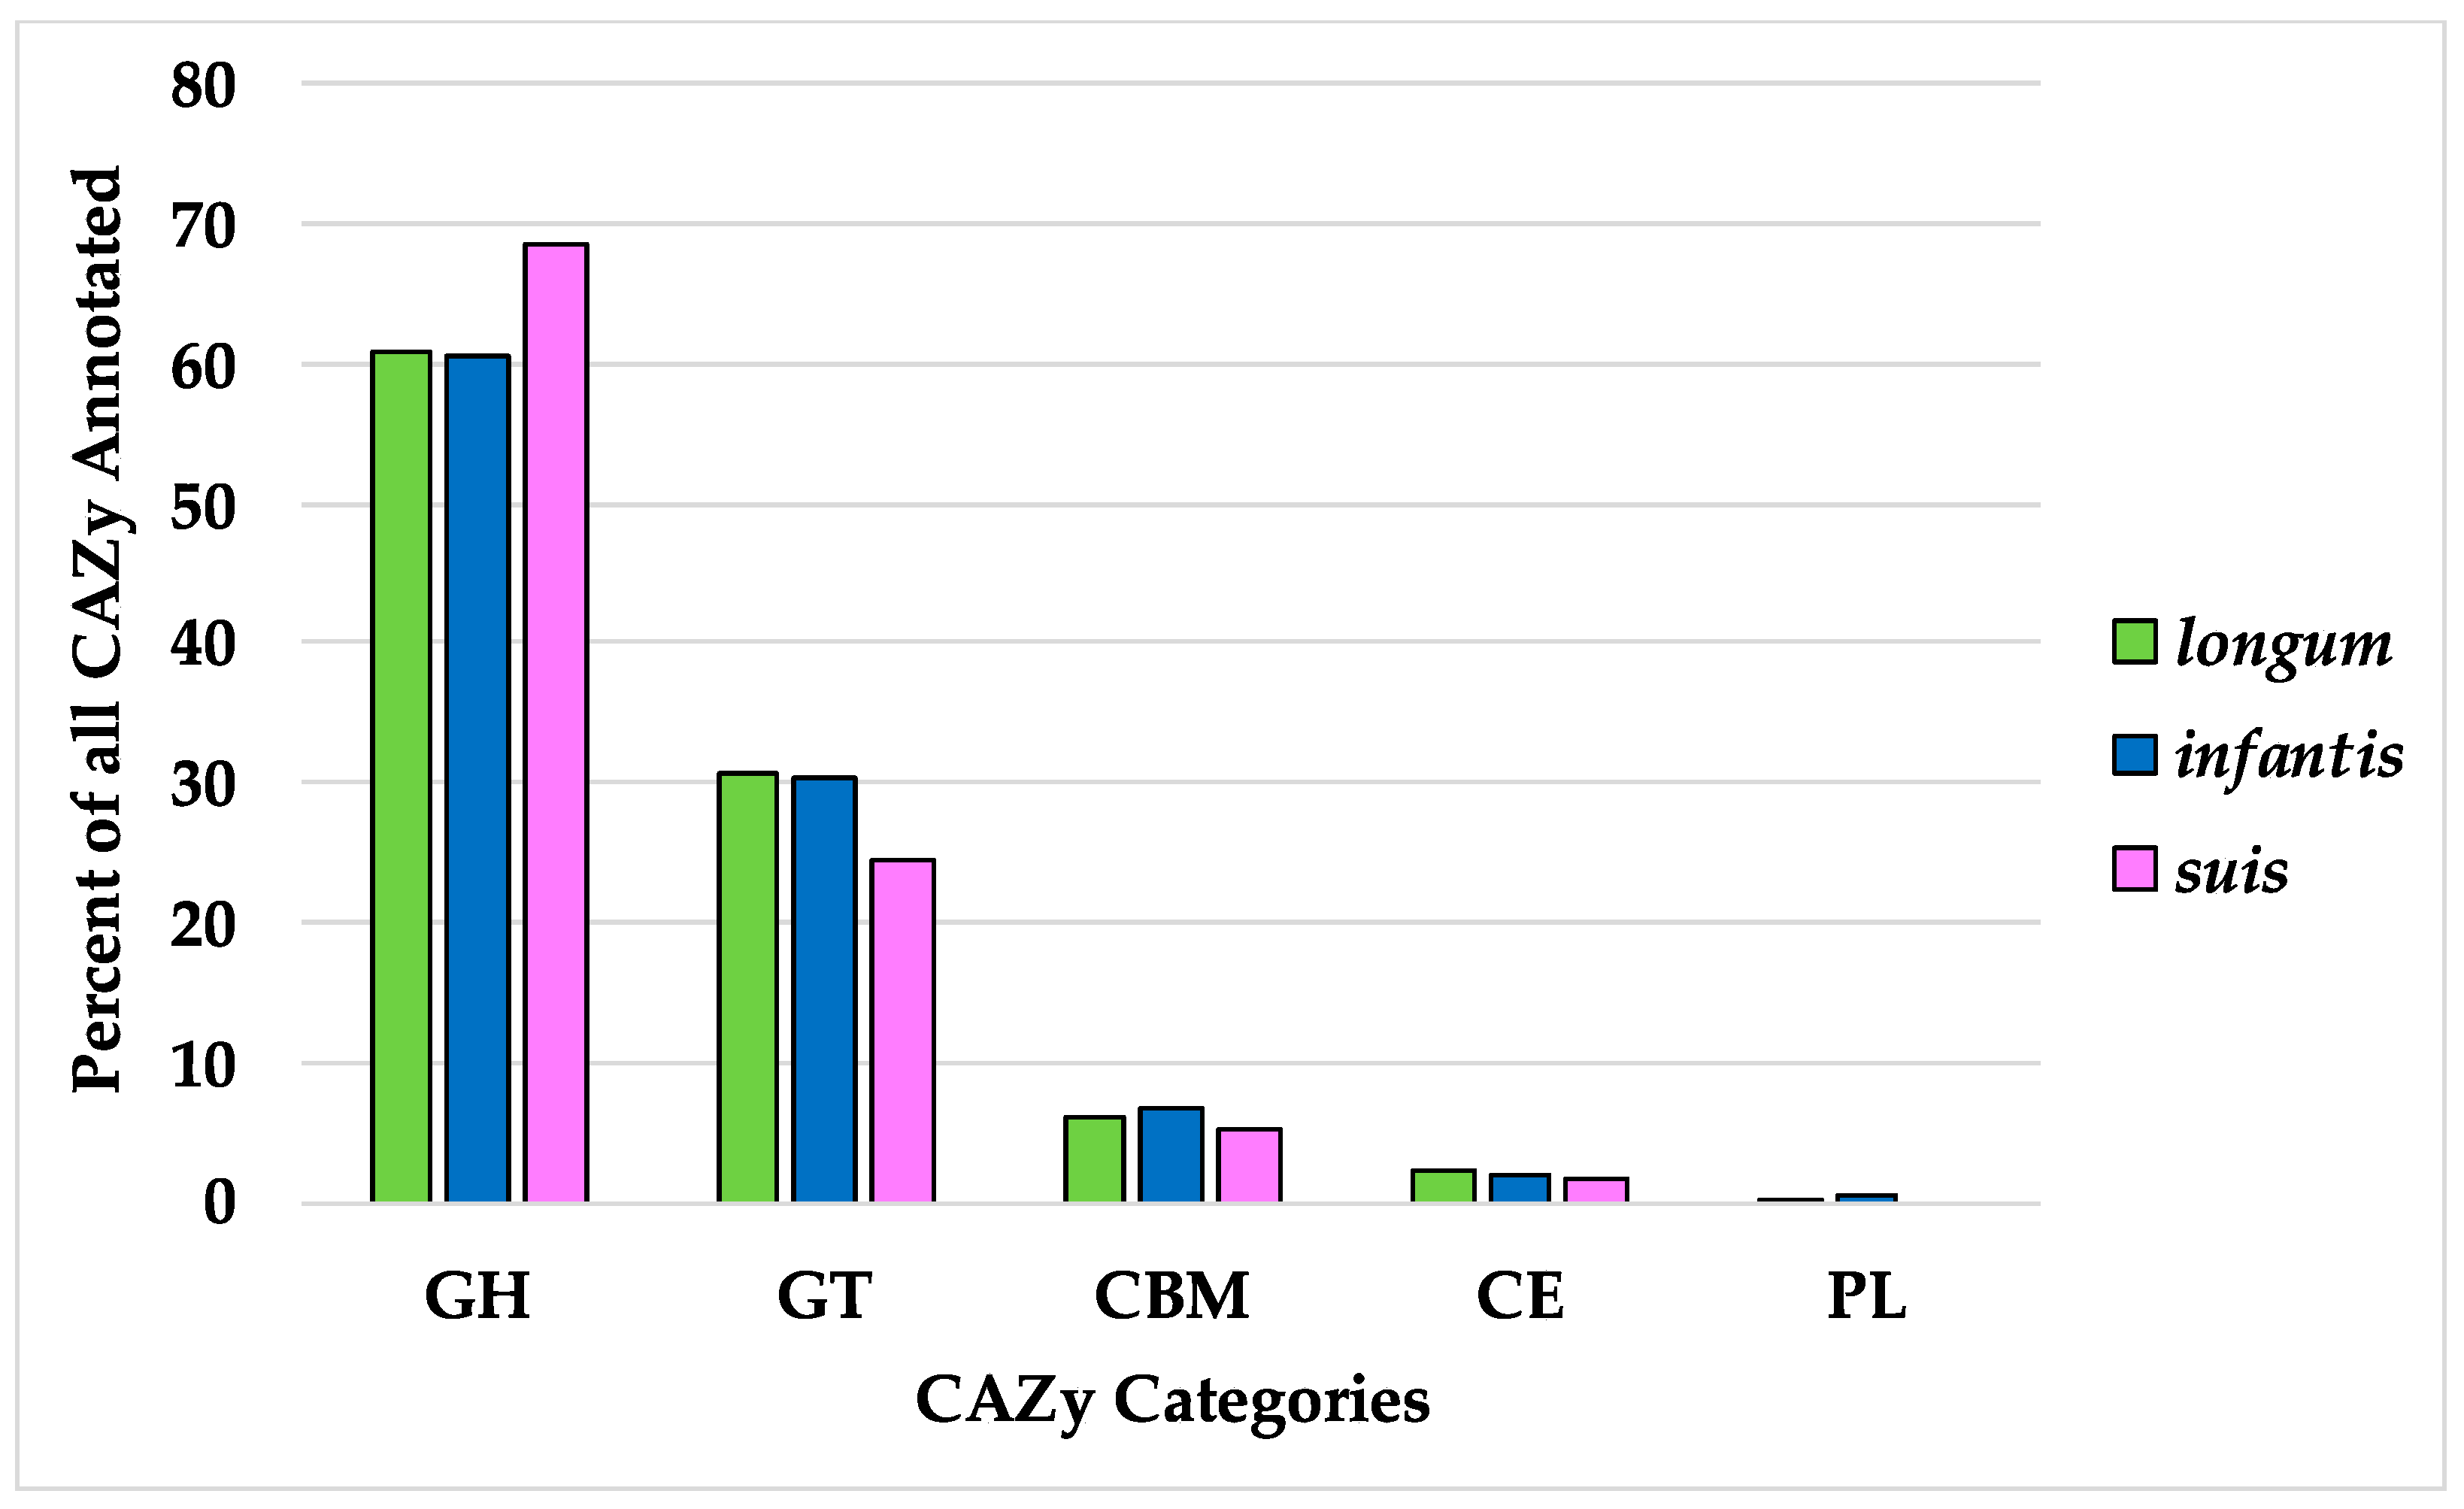
Bifidobacterial metabolism is primarily understood from its capacity to ferment carbohydrates. Thus carbohydrate-active enzyme (CAZy) gene homologs were identified in B. longum to define the distribution of this important class of genes [45,46]. By convention, carbohydrate genes are sorted as glycoside hydrolases (GH), glycosyltransferases (GT), polysaccharide lyases (PL), carbohydrate esterases (CE), and carbohydrate-binding modules (CBM). Of the B. longum core genes, nine were identified as carbohydrate-active enzymes including five GHs and four GTs (Table 3). Among these was GH13, a CAZy associated with plant-based carbohydrates which Milani et al. identified as being the most common CAZy in bifidobacterial genomes [64]. GHs were identified as the highest fraction of total CAZys, with the B. suis pangenome exhibiting the greatest proportion of the three subspecies (Figure 7). Interestingly, a broader pangenomic analysis identified almost identical proportions of GH (43.4%) and GT (43.8%) in the family Bifidobacteriaceae as a whole [65]. The high proportion of GH versus other carbohydrate-active enzymes in B. longum reflects their critical role in processing plant- and host-derived carbohydrates.
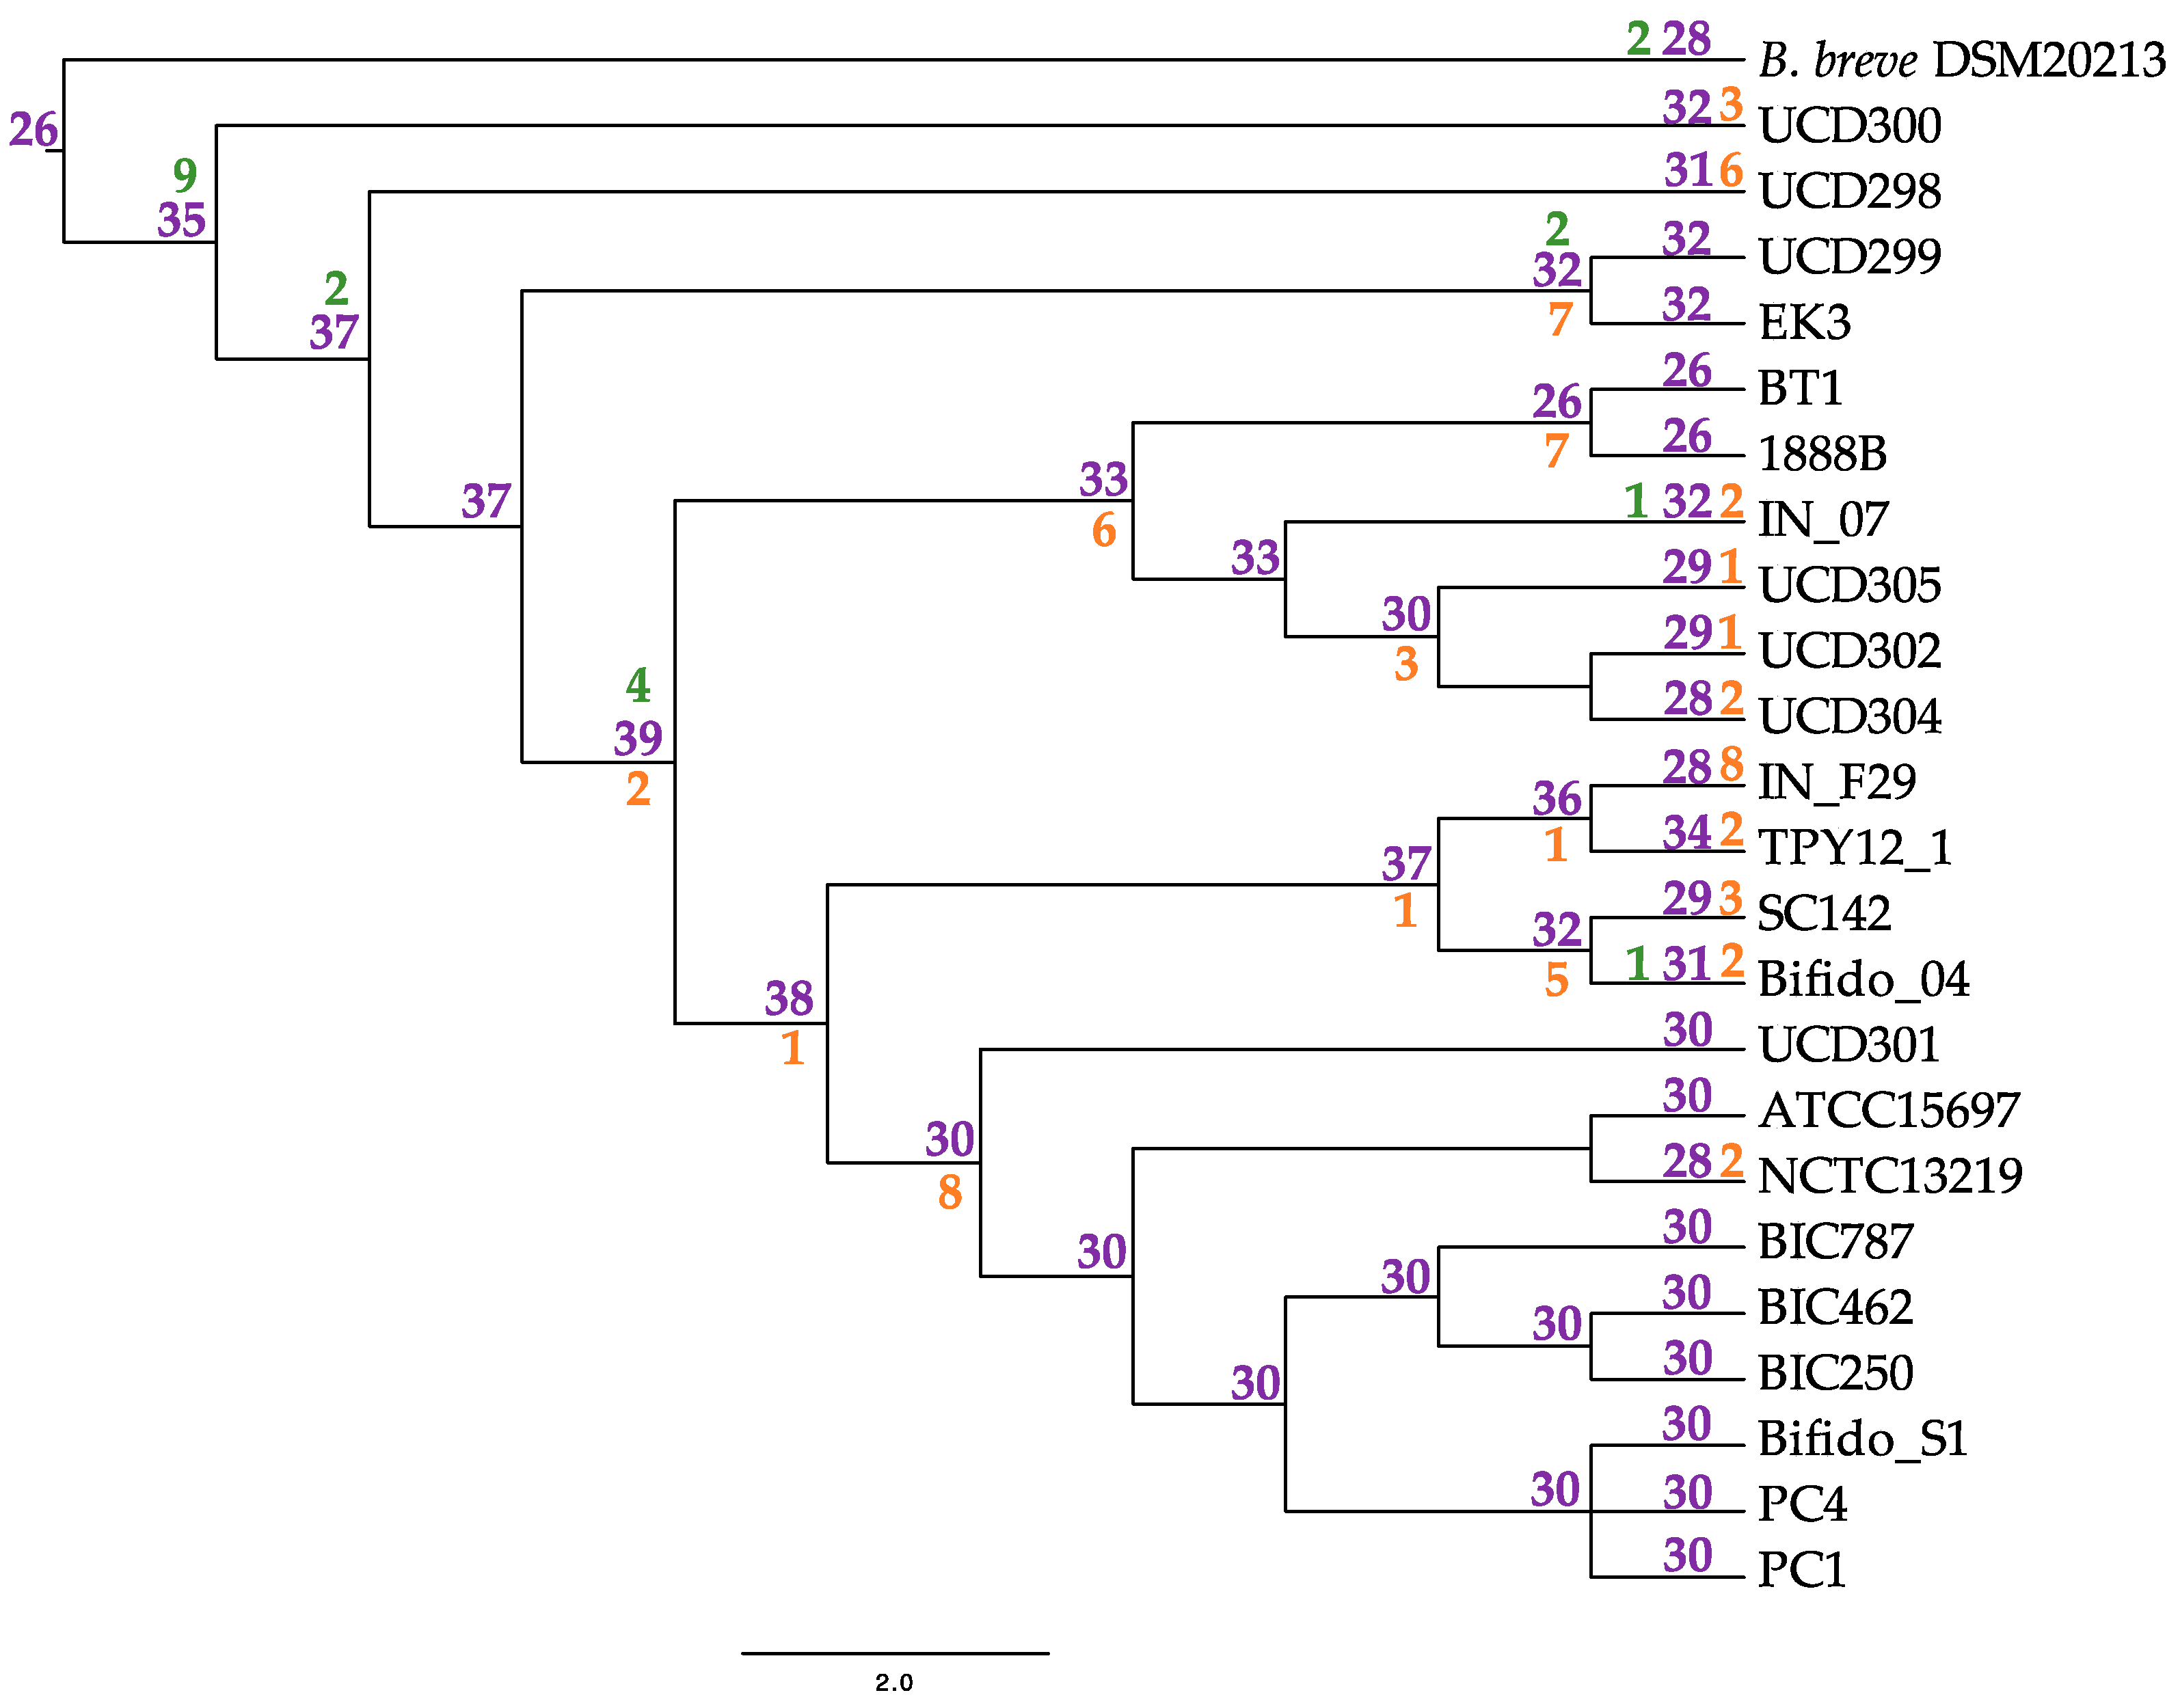
Each subspecies pangenome possesses at least one GH not present in the others. Subspecies longum and suis both contain GHs postulated to interact with plant-associated carbohydrate substrates. This includes GH16 (xyloglucan metabolism) in subspecies suis and GH65 (EC 3.2.1.28) in subspecies longum, which we postulate is linked to the plant-based diet of their host (Table 4) [66,67,68]. Subspecies infantis strains colonize the nursing infant gut, thus they encode an assortment of HMO metabolic enzymes within their genome. Accordingly, the infantis subspecies possess the HMO-degrading enzyme GH151 α-L-fucosidase (EC 3.2.1.51) and two GHs assigned N-acetylgalactosaminidase functions (GH109; EC 3.2.1.49) and (GH123; EC 3.2.1.53) (Table 4) [68,69,70,71]. Glycosyl hydrolases are essential for B. infantis HMO utilization, thus the gain and loss pattern of GHs within B. infantis was mapped onto the B. infantis phylogeny. This analysis infers 35 GH in the common ancestor of the infantis subspecies, followed by gain and loss events at 6 and 21 nodes, respectively (Figure 8). Numbers of GH in extant infantis strains varied from 26 (BT1, 1888B) to 34 (TPY12_1).
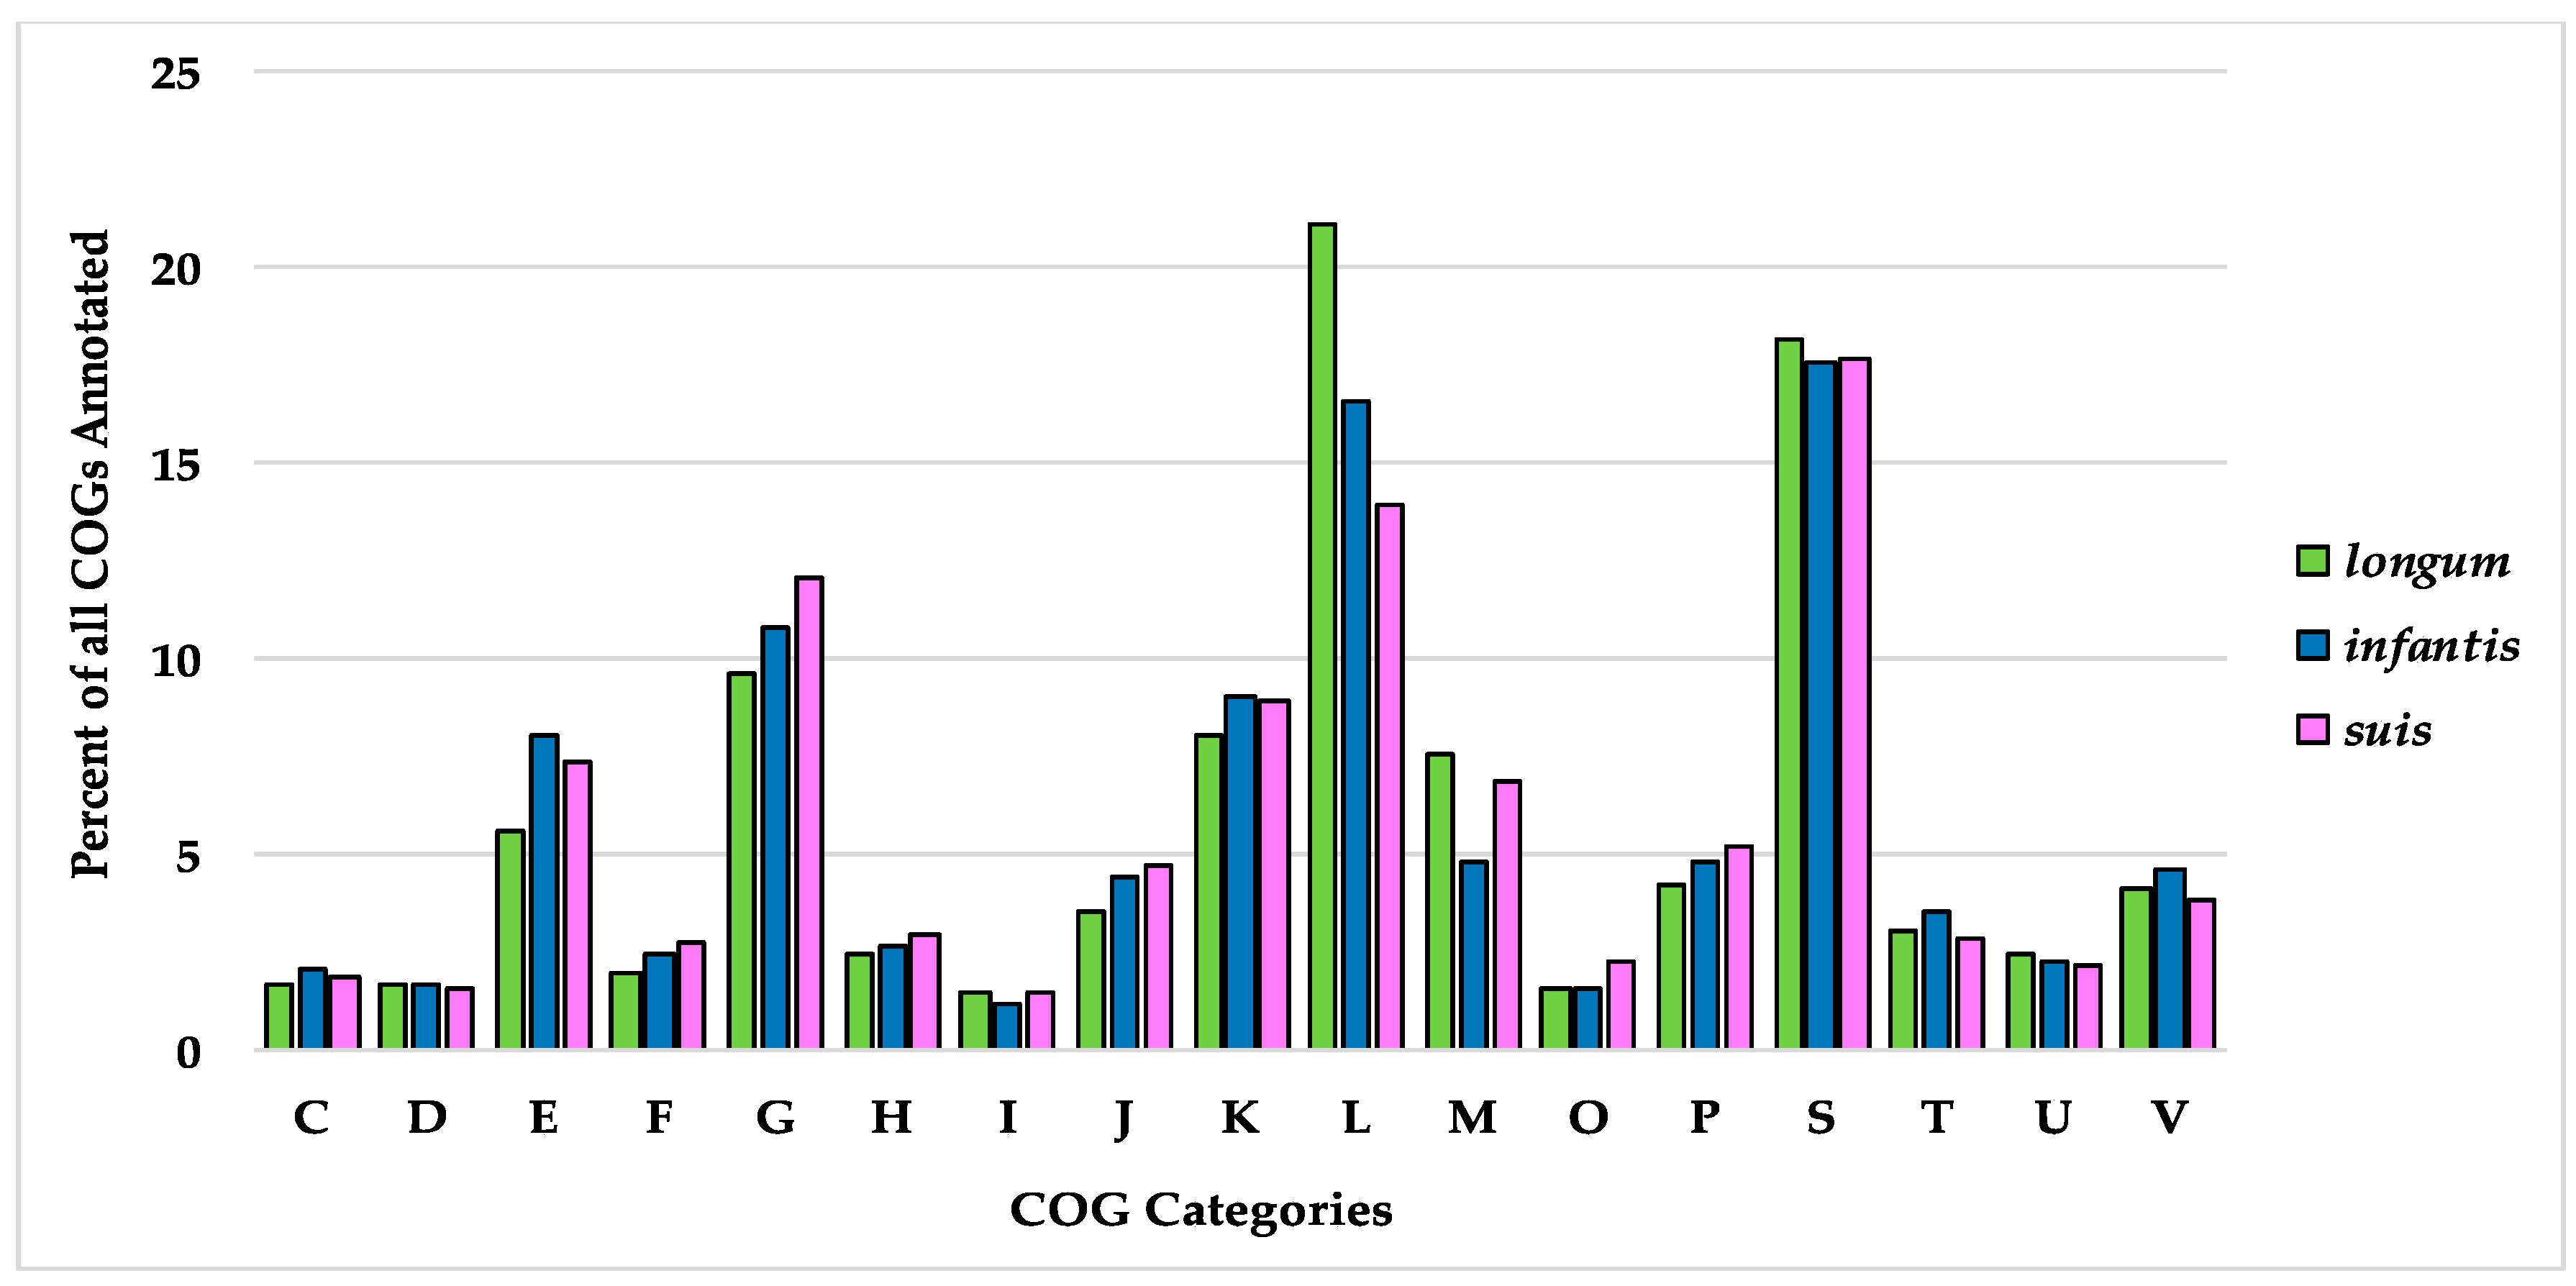
3.5. Comparative Pangenomics between Bifidobacterium longum Subspecies
Among 155 subspecies longum strains, 761 (6.0%) core genes shared (≥154 strains) were identified. Most genes of the longum subspecies pangenome (10,278; 81.5%) are only found in ≤23 strains (Table 2). Of the three subspecies, longum strains have the lowest percentage of core genes despite their close relatedness as determined by phylogenetics and ANI. In this current analysis, the longum subspecies pangenome is approaching but has not reached an asymptote, similar to a 2015 analysis performed by Chaplin et al. [18]. Within the subspecies longum pangenome, the highest represented COG categories are S: function unknown (20.40%), L: replication, recombination, and repair (21.48%), and G: carbohydrate transport and metabolism (10.72%). In comparison to the other subspecies, longum has the greatest proportion of COGs associated with replication, recombination, and repair (COG category L), cell wall/membrane/envelope biogenesis (COG category M), and defense mechanisms (COG category V) (Figure 9). Subspecies longum uniquely contains genes belonging to the COG category W (extracellular structures). Two genes COG category W are predicted collagen triple helix repeat protein and found in strain 12_1_47BFAA. An additional COG W gene, collagen type I alpha 1, was unique to strain APC1476. Collagen-related proteins are associated with the mammalian cell extracellular matrix, with some host-associated bacteria expressing collagen-like proteins to interact with host cells [72].
Thirteen B. longum strains were assigned to subspecies suis through phylogenetic relatedness and ANI. This includes strain JCM19995 which was previously proposed to belong to a fourth subspecies suillum, distinct from subspecies suis. The evidence presented in support of this taxonomic reorganization includes amplified fragment length polymorphisms, multilocus sequence analysis, multilocus sequence typing, and urease activity assays [55]. The lack of urease activity contributed prominently in the designation of a novel subspecies, although the original description of subspecies suis indicates variability in urease activity [7]. Thus urease activity is not a reliable discriminatory parameter for membership in subspecies suis. Accordingly, 6 of 13 subspecies suis genomes lacked all urease cluster genes: JCM19995, JDM301, CMCCP0001, BXY01, UCD398, and UMA026 (Supplemental Figure S1). Furthermore, there were no genes identified to all non-urease strains not found in the other B. suis strains. Therefore, the current analyses did not provide evidence to segregate JCM19995 from other suis strains, therefore not supporting subspecies suillum as a usable taxonomic boundary as currently defined (Figure 1 and Figure 3B).
Overall, the subspecies suis pangenome contains 4723 genes, of which 1187 (25.13%) are core genes (Table 2). As with subspecies longum, subspecies suis possesses a high representation of COG categories S: function unknown (20.26%), L: replication, recombination, and repair (14.47%), and G: carbohydrate transport and metabolism (12.76%) (Figure 9). In addition, the subspecies suis pangenome contains a higher percentage COGs associated with G: carbohydrate transport and metabolism, O: post-translational modifications, protein turnover, and chaperones, and P: inorganic ion transport and metabolism than subspecies longum and infantis. The subspecies suis pangenome is open, although it appears close to saturation (Figure 5C).
The subspecies infantis pangenome contains 6196 genes, 1019 (16.4%) of which are core genes. Almost half of the total genes (2980; 48.1%) are present in a maximum of three B. infantis strains (Table 2). Out of all the genes, 3998 (64.5%) were labeled as hypothetical, which is consistent with a prior study noting the high amount of hypothetical genes in the full subspecies infantis pangenome [18]. The subspecies infantis pangenome plot suggests that genomic diversity did not reach saturation as visualized as an asymptote (Figure 5D). As with the suis pangenome, the most highly represented COG categories are function unknown (COG category S; 20.88%), replication, recombination, and repair (COG category L; 18.17%), and carbohydrate transport and metabolism (COG category G; 11.71%). Overall, the representation of COGs is more evenly distributed across the COG categories in subspecies infantis versus subspecies longum and subspecies suis (Figure 9).
3.6. Variation within the Bifidobacterium longum Subsp. Infantis HMO Gene Cluster
B. infantis strains are characterized by the presence of a ~40 Kb gene cluster associated with HMO utilization within their genomes [15]. This region has been shown to contain a combination of HMO-active enzymes, including α-L-fucosidase (EC 3.2.1.51), exo-α-sialidase (EC 3.2.118), other glycosyl hydrolases, and ABC transporters to translocate HMOs intracellularly [14,15,73]. There is significant scientific evidence that B. infantis utilizes milk components as an evolved nutritive strategy, thus it is unsurprising that the HMO gene cluster is generally conserved across strains. Of the B. infantis genomes available, four strains with single-contig HMO clusters were selected for further analysis (ATCC 15697T, IN_07, IN_F29, and BT1). All clusters encode several anchor features, including 12 carbohydrate-related enzymes and oligosaccharide permeases (e.g., ABC transporters), in addition to mobile elements and hypothetical proteins (Figure 10 and Table 5). The cluster was originally described in Sela et al. 2008, and is defined herein as beginning with two major facilitator superfamily membrane transport proteins (Blon_2331 and Blon_2332) to terminate with a carbohydrate ABC transporter membrane protein (Blon_2369), with carbohydrate-related enzymes and transporter components interspersed between [15].
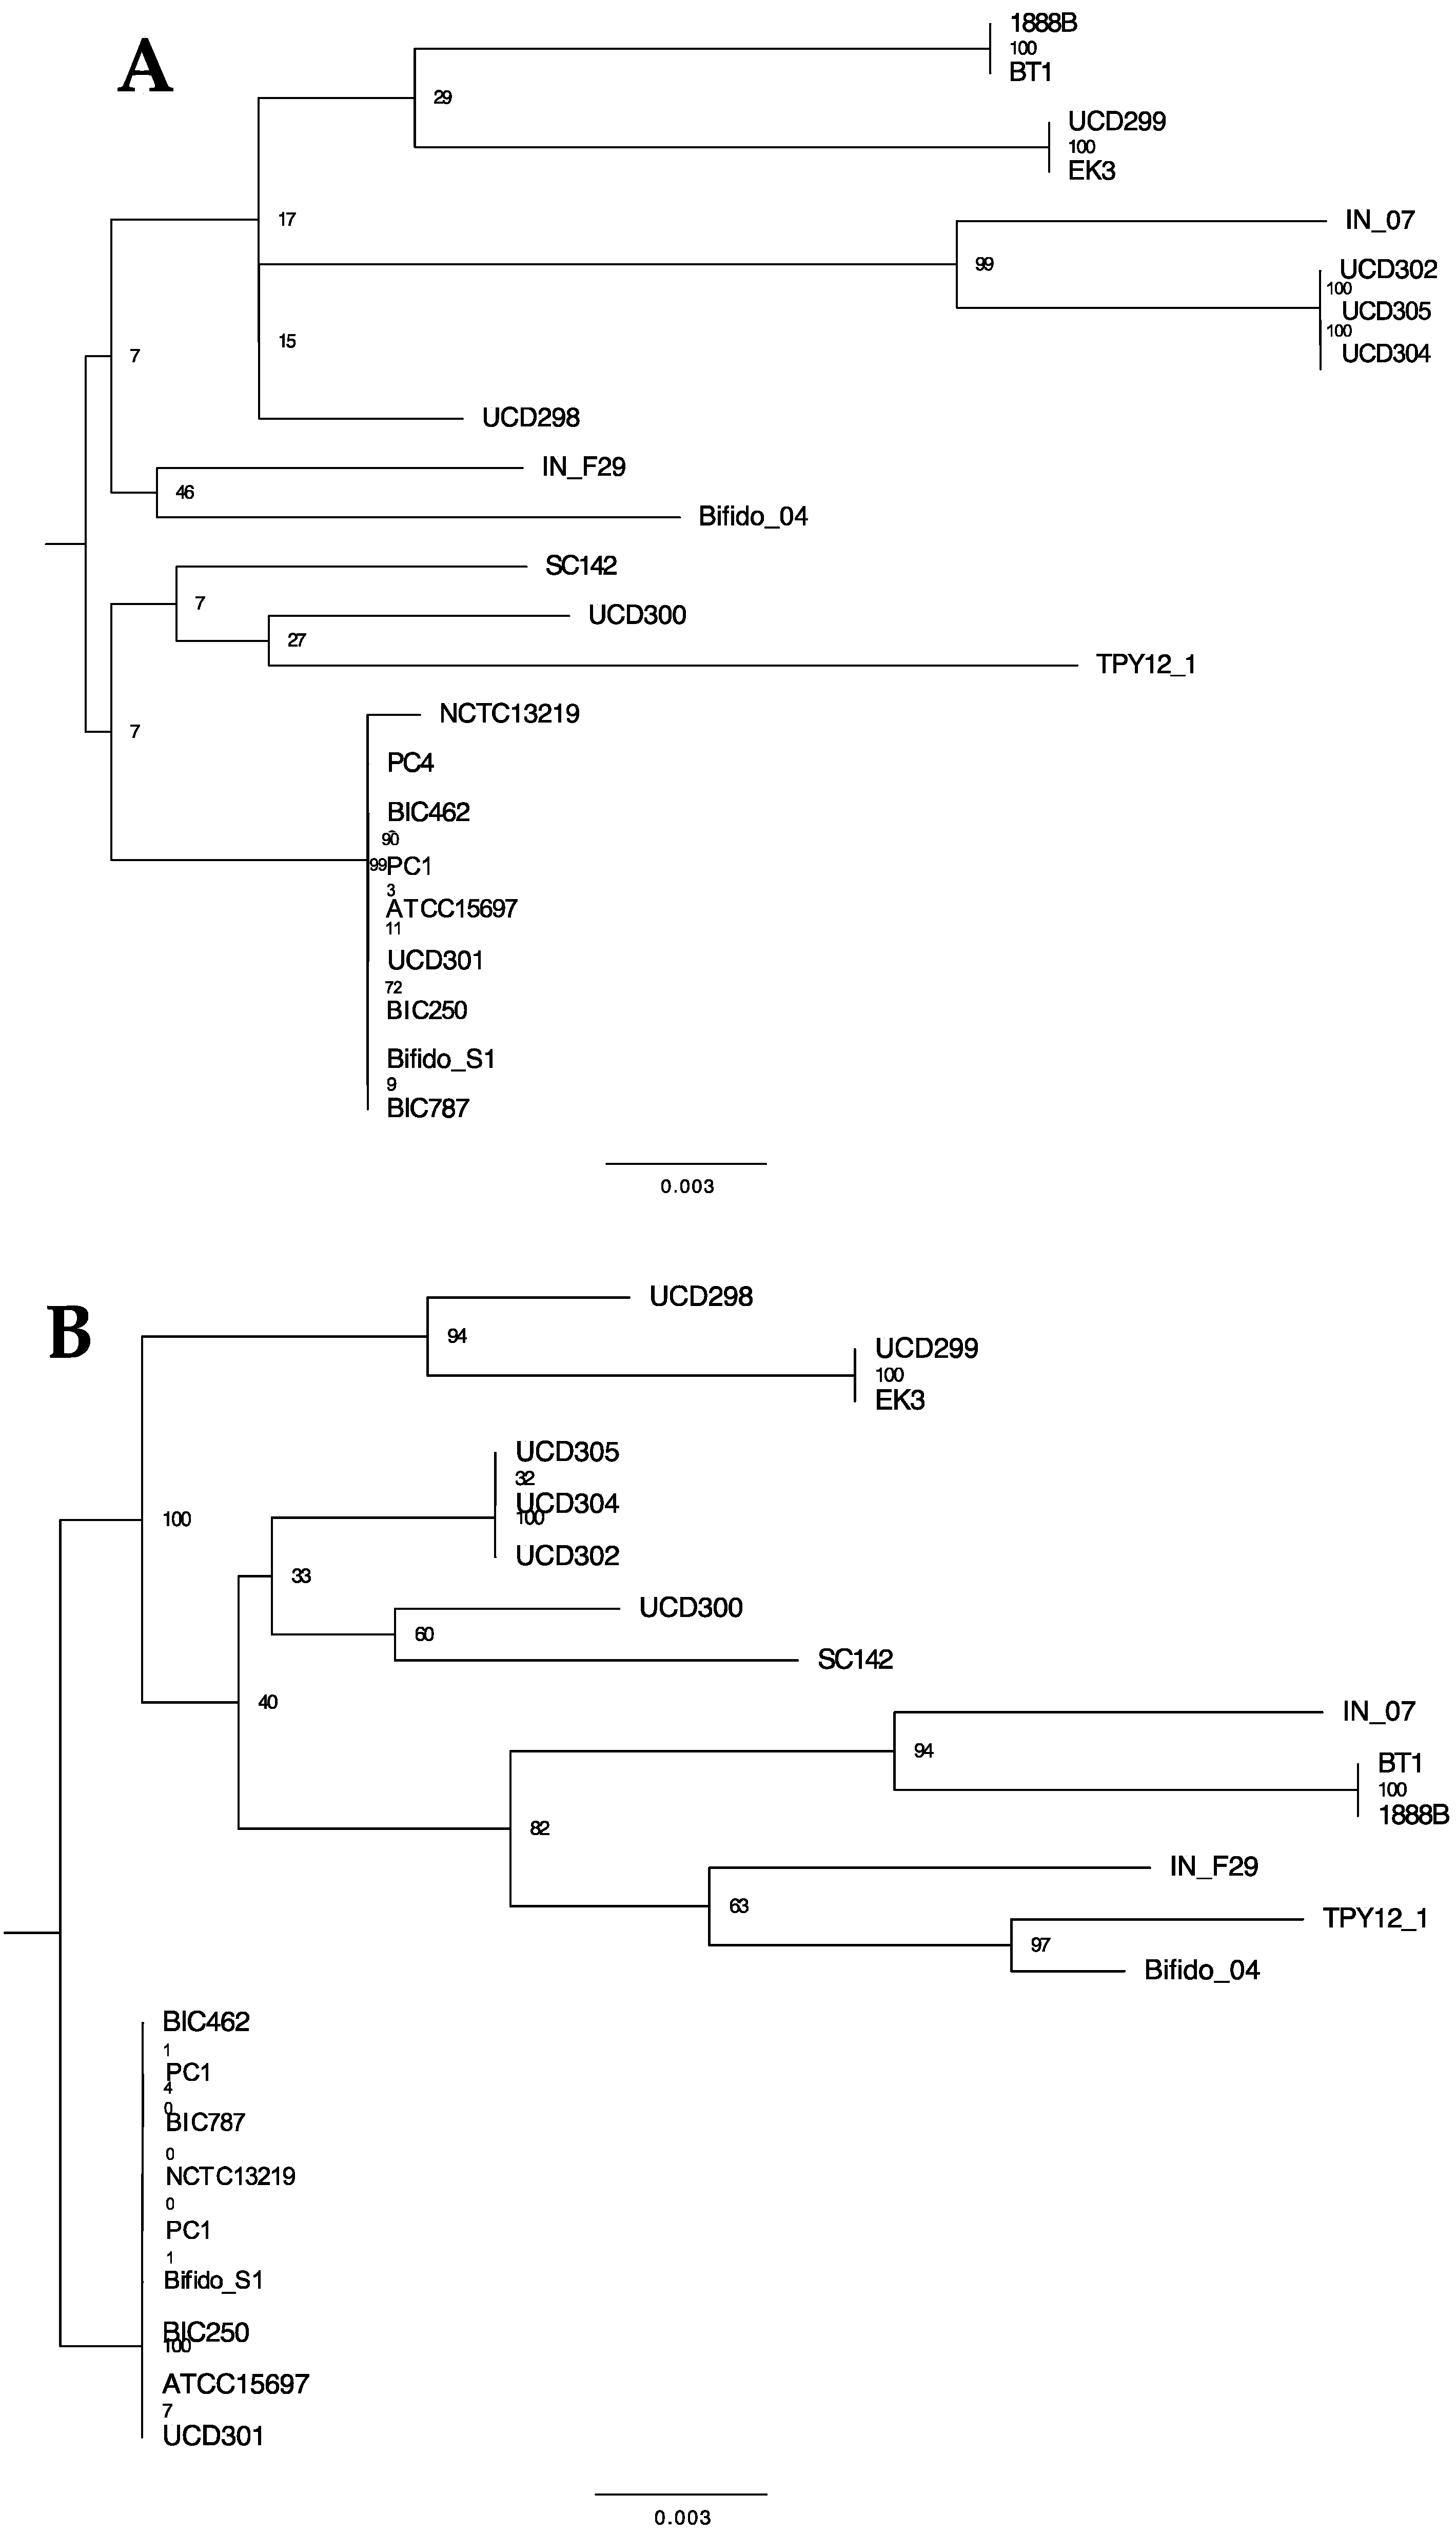
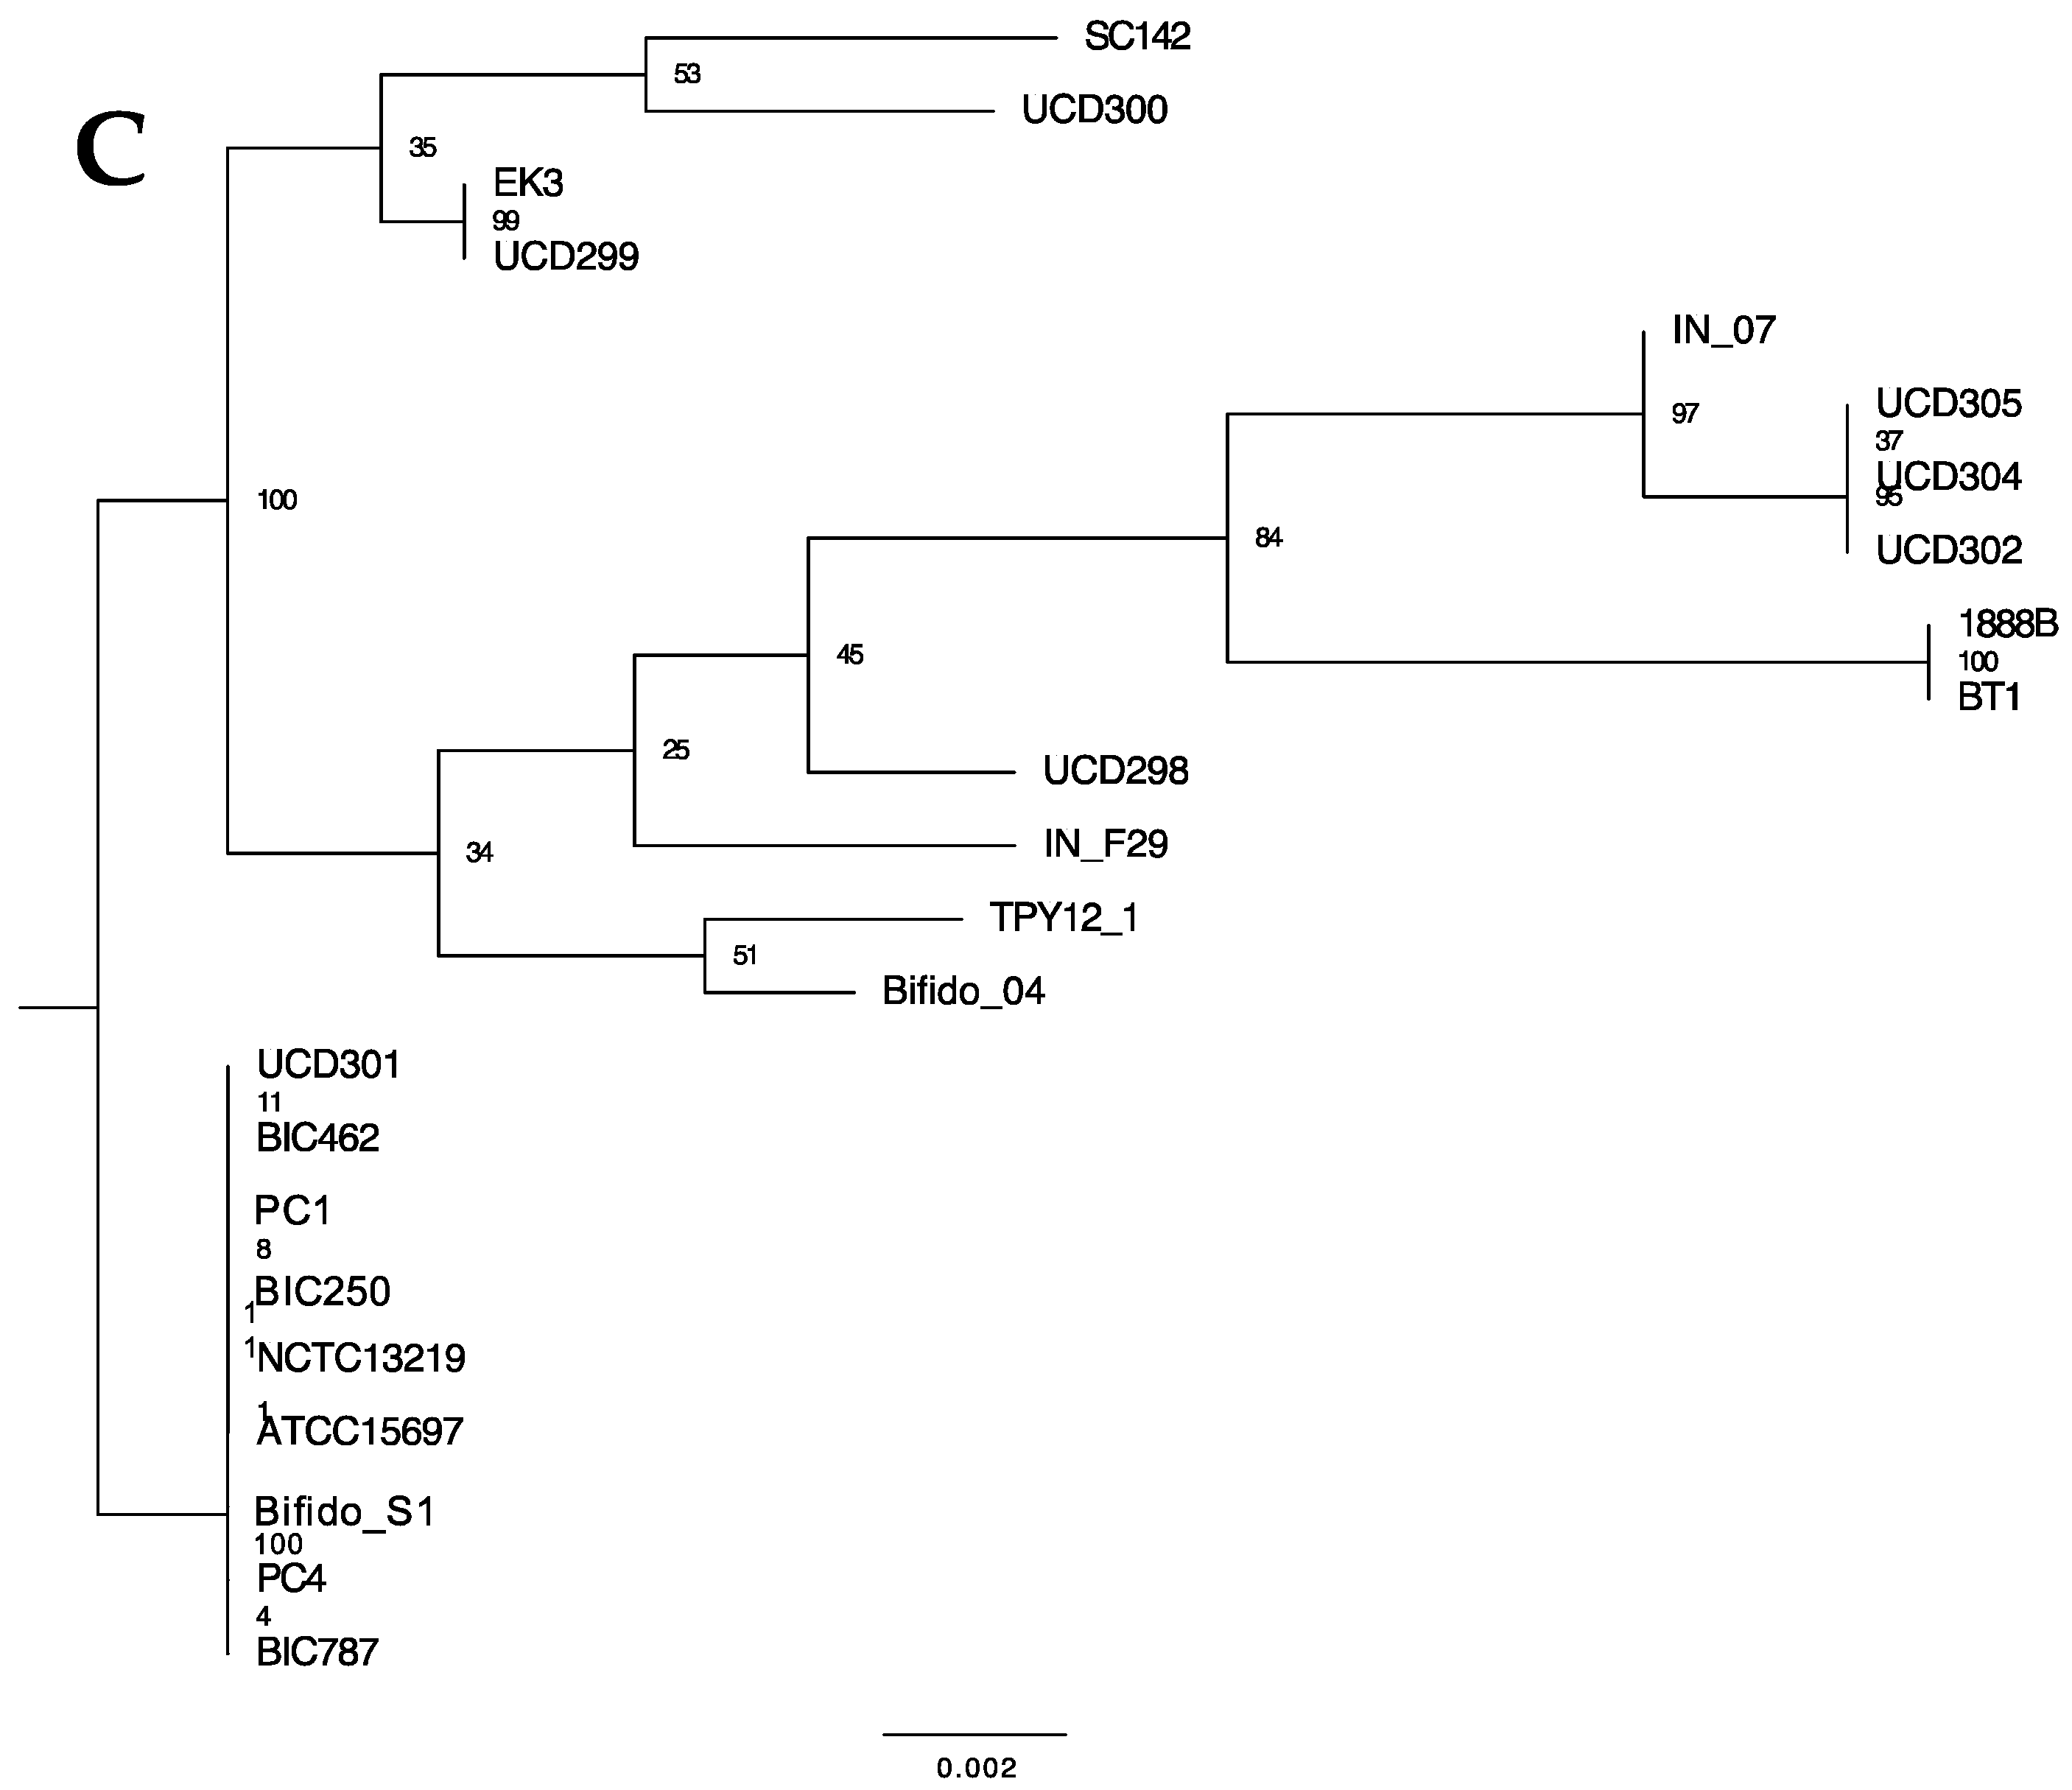
The HMO utilization gene cluster was first identified in B. longum subspecies infantis ATCC15697T and subsequently determined to be present in all subspecies infantis strains examined to date [14]. There are six carbohydrate transporter genes within the ATCC15697 gene cluster (Blon_2342 to Blon_2347) and conserved in IN_F29. It is likely that these arose from a duplication event of three genes, two ABC permeases and their associated extracellular solute-binding protein. Strains IN_07 and BT1 do not exhibit this duplication event which may represent a distinct lineage. These two strains, however, exhibit a likely duplication where additional copies of genes adjacent to the HMO cluster have been inserted within the cluster proximal to two transposases (Figure 10). Interestingly, these duplicated genes are not predicted to be involved directly in HMO catabolism. Maintenance of cluster integrity (i.e., colinearity) is measured by presence/absence and sequential order of genes. Moreover, the sequence of individual HMO-active enzymes reflects evolutionary divergence potentially consistent with phylogenetic divergence of the strains. To this end, three HMO-active genes were further analyzed to catalog variation and infer phylogenetic relatedness. The GH29 fucosidase (Blon_2336) and GH95 fucosidase (Blon_2335) contain nonsynonymous mutations at several sites along the genes which may reflect differences in HMO utilization phenotypes between groups. Both c gene trees depict the same nine strains separating into their own branch at the root of the tree (Figure 11B,C). These nine strains form also a distinct group in the genome-based phylogeny, but in that phylogeny, the nine strains share a node with IN_F29, TPY12_1, SC142, and Bifido_04 (Figure 1). The gene tree representing glycosyl hydrolase exo-α-sialidase (Blon_2348) is consistent with the genome-based phylogeny for many branches, although the exo-α-sialidase tree shows UCD300 as being more closely related to ATCC15697.
3.7. Bifidobacterium longum Carbohydrate Metabolism Phenotypes
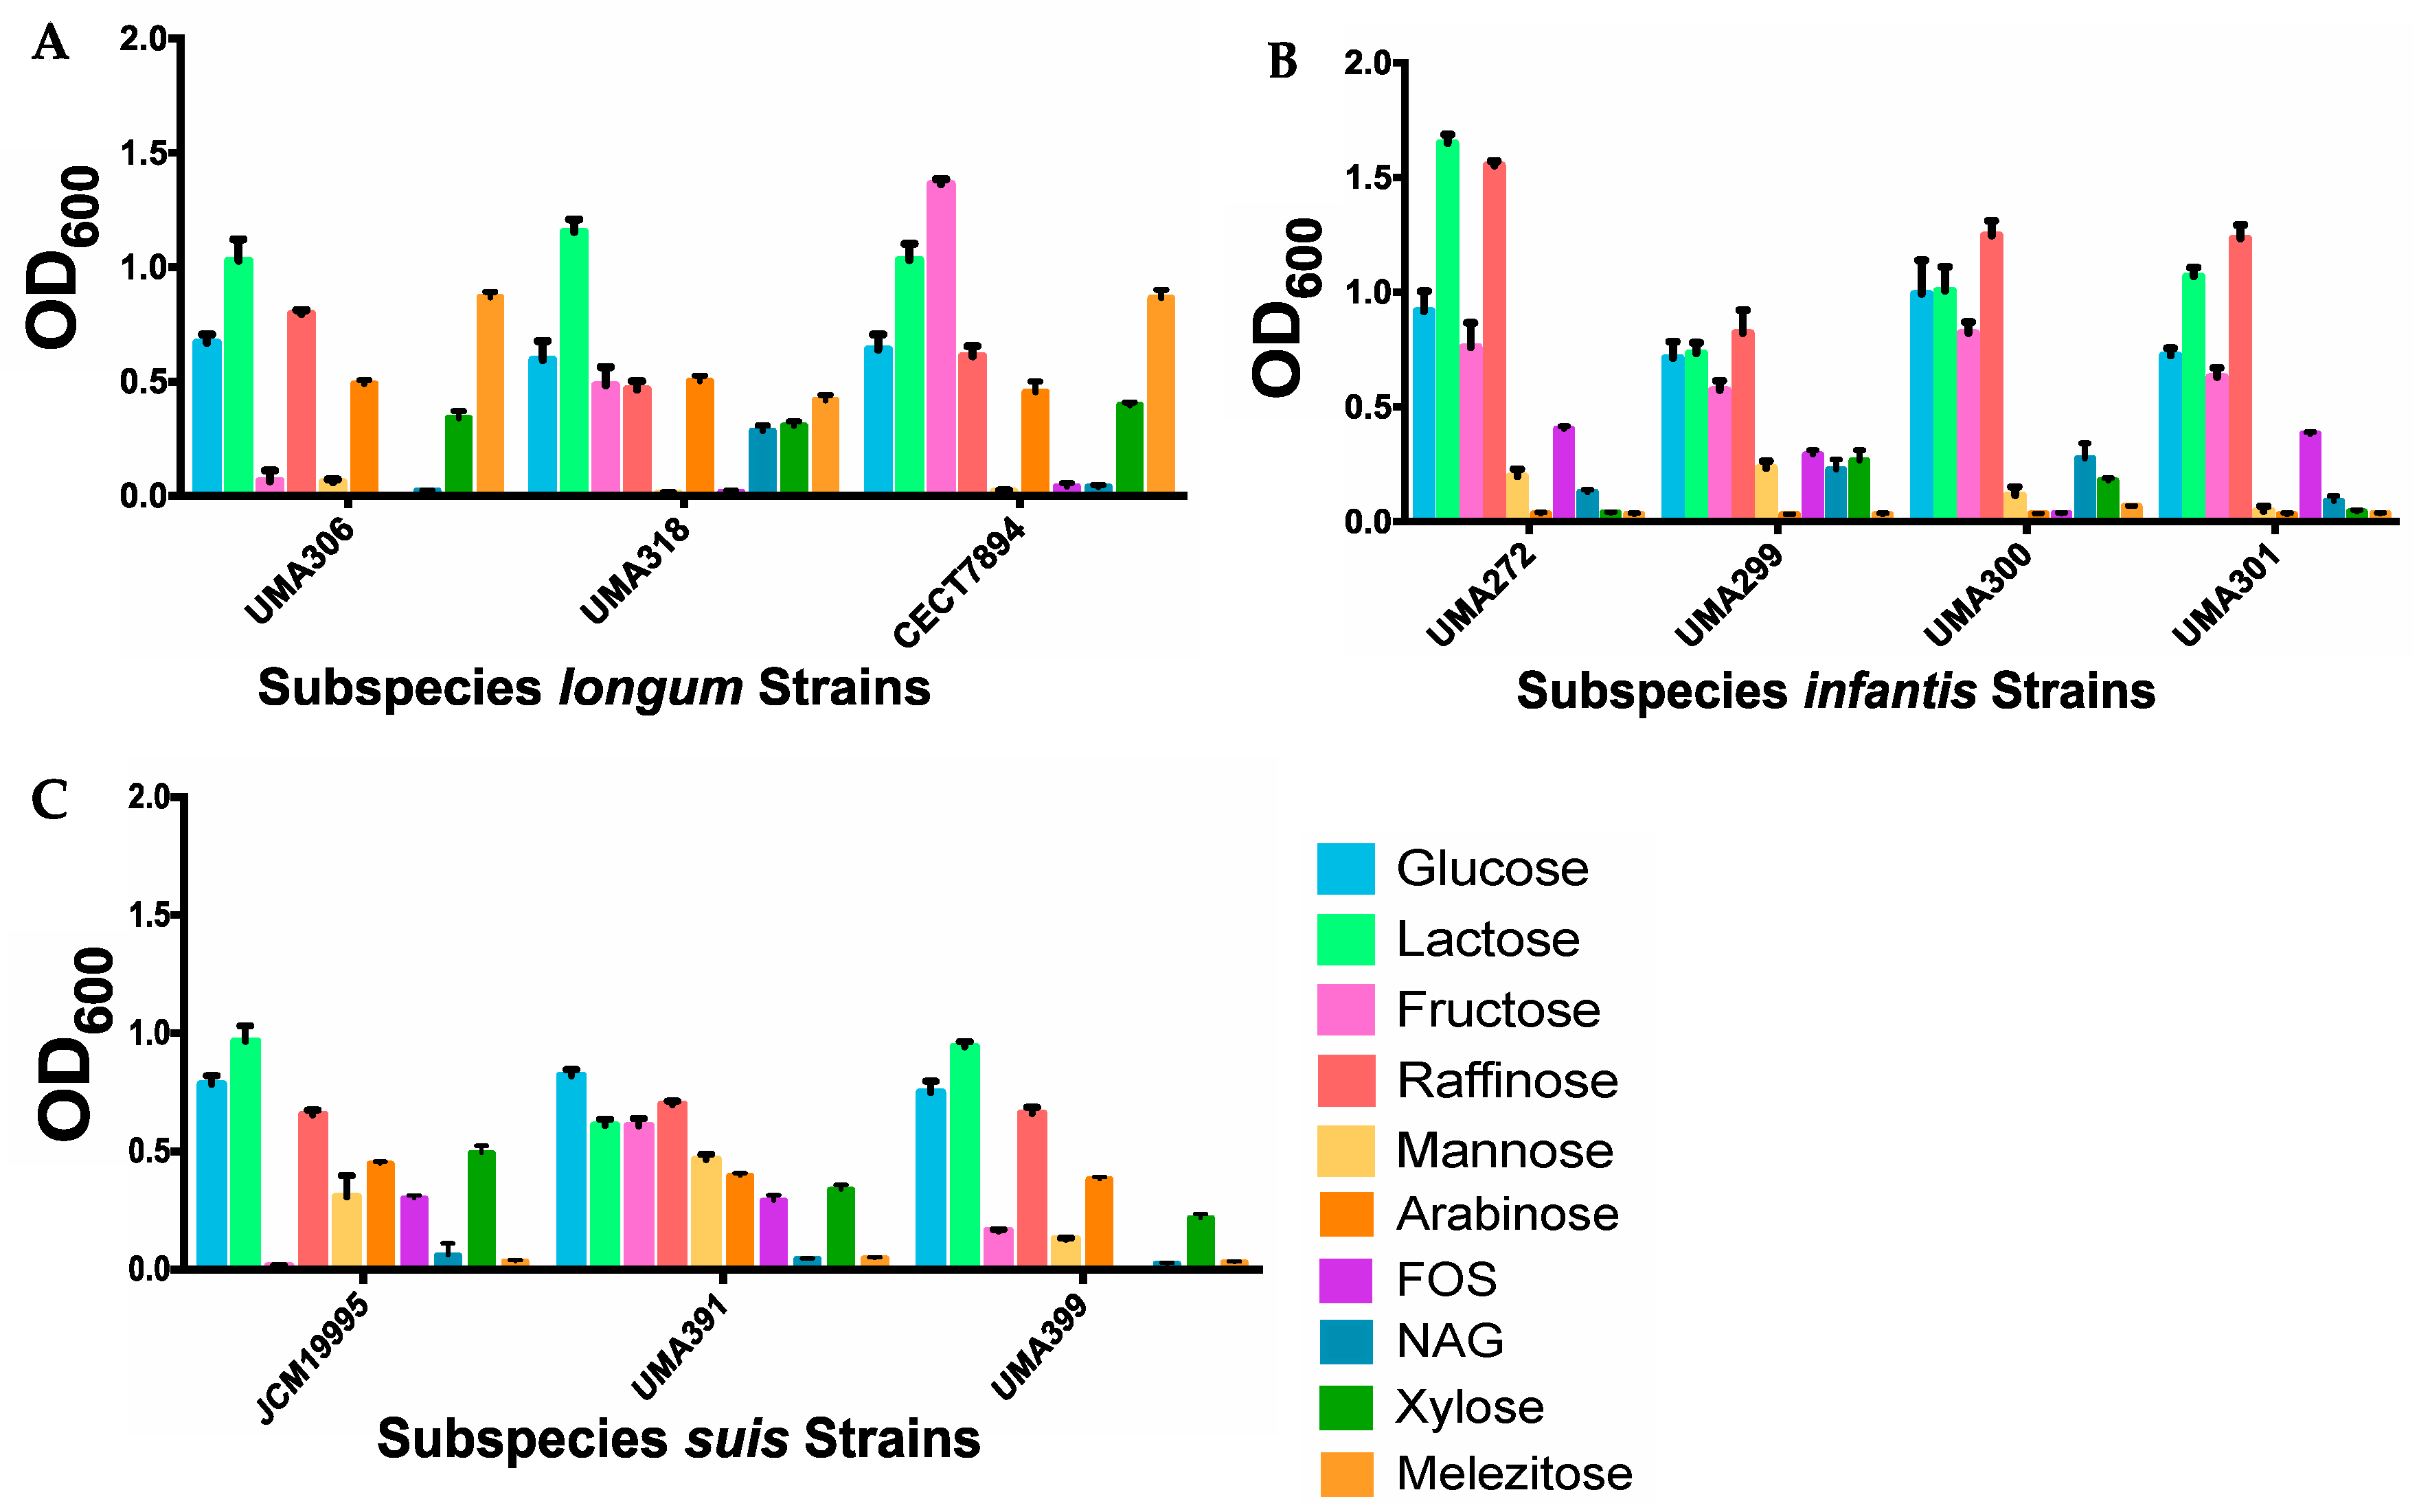
Although each subspecies generally exhibits a common genomic profile, individual strains may exhibit variant phenotypes under similar in vitro conditions. Thus, representative strains were evaluated for their ability to grow on sole carbohydrate sources. Substrates tested included arabinose, fructo-oligosaccharides (FOS), fructose, glucose, lactose, mannose, melezitose, N-acetylglucosamine (NAG), raffinose, and xylose. These substrates are known to be used by members of the genus Bifidobacterium as fermentable carbohydrates (Figure 12). B. longum subsp. longum strain CECT7894 grew significantly (p < 0.05) more than both UMA306 and UMA318 on fructose and xylose with mean OD600 values of 1.36 and 0.40, respectively. Interestingly, UMA306 grew the most on raffinose (mean OD600 = 0.80; p < 0.0001) as a sole carbohydrate source (Figure 12A). Previous studies indicated that specific strains of subspecies longum grow efficiently on raffinose [74]. The subspecies longum strains did not grow substantially on FOS, which is inconsistent with previous studies conducted on longum strains on this substrate [10,75,76]. This may be due to strain and media differences between studies. The subspecies longum strains did not grow on NAG. This result is congruous with another study documenting the inability of B. longum subsp. longum NCC2705 to grow on this substrate [77]. Studies characterizing subspecies longum growth on mannose indicate variability, even when analyzing the same strain (B. longum NCC2705) [77,78]. All B. infantis strains grew considerably on glucose (mean OD600 = 0.71–0.99), lactose (mean OD600 = 0.73–1.65), fructose (mean OD600 = 0.58–0.82), and raffinose (mean OD600 = 0.82–1.55) (Figure 12B). None of the B. infantis strains grew substantially on arabinose, which is consistent with previous reports [8]. Among B. suis strains, none grew appreciably on NAG or melezitose, while all grew on glucose, lactose, raffinose, arabinose, mannose, and xylose (Figure 12C). UMA391 utilized fructose most efficiently (mean OD600 = 0.61; p < 0.0001), whereas UMA399 grew to a less extent (mean OD600 = 0.16) and JCM19995 did not exhibit growth. It is noteworthy that strains of subspecies longum and suis grew on arabinose, whereas infantis strains did not. Strains assigned to subspecies longum utilized melezitose, while infantis and suis strains were incapable of doing so. These findings are consistent with long understood differentiating phenotypes between B. longum subspecies [7].
4. Discussion
Bifidobacterium longum metabolizes substrates in the gut (i.e., dietary and endogenous) and is integrated into physiological networks between microbiota and their host. This microorganism is commonly used as a probiotic to promote gut health. Greater scientific understanding of the molecular interactions between B. longum with their host has been enabled by the development of analytical and bioinformatic approaches. B. longum research may therefore yield novel targets for direct nutritional interventions and lifestyle modification. This, of course, includes optimized prebiotic and probiotic approaches to maximize quantifiable benefits to the consumer.
The B. longum pangenome described herein catalogs the genomic potential of the species through a comparative analysis of constitutive genomes. This enabled identification of B. longum core and accessory genes linked with groups of B. longum strains. More specifically, these strain groups are conventionally referred to as subspecies (i.e., infantis, longum, and suis). Subspecies is a taxonomic entity for which an accepted universal definition does not exist for bacteria, at least not in practical application beyond ad hoc definitions for a single species (e.g., Bifidobacterium animalis). As bacterial species boundaries are amorphous, subspecies demarcations are similarly prone to uncertainty with the isolation of strains exhibiting genotypic and phenotypic exceptions.
The emphasis on, and limitations in defining, a subspecies-centered perspective of B. longum have resulted in some taxonomic confusion. Accordingly, there are multiple examples of incorrectly assigned designations, most notably between subspecies longum and infantis. As this is primarily a taxonomic challenge, the potential to confound is mitigated and does not reflect metabolic or ecological function, although the predictive power of a subspecies assignment depends on the phenotype of interest. Novel subspecies infantis strains are predicted to utilize HMOs, an attribute that has considerable scientific support, whereas subspecies longum and suis isolates may be viewed as unlikely to be efficient consumers of milk oligosaccharides. However, this assumption may be incorrect or incomplete, as novel isolates may not conform to this potentially transient understanding.
As per current laboratory practice, assigning a strain to a subspecies is primarily based on identifying discriminatory genomic sequences. There are sequence principles that are currently considered to be characteristic of a subspecies. This includes the HMO cluster found in all infantis strains isolated to date, whereas other B. longum strains do not possess the contiguous locus in its entirety. One could conclude that the HMO cluster is unique to infantis and encodes fucosidase and sialidase enzymes that are critical to its lifestyle within the nursing infant gut. It is, however, incorrect that only subspecies infantis possesses fucosidase and sialidase genes. As with phenotype, genomic plasticity within B. longum may restrict firm subspecies definitions.
Accordingly, evidence for the proposed subspecies suillum is based on limited sequencing and the absence of ureolytic activity. Support for the fourth subspecies is undermined by the limited number of candidate suillum strains evaluated, and the isolation of suis strains that lack urease genes and activity. Additional isolates are thus required to validate subspecies suillum and exclude the alternative hypothesis that these are subspecies suis strains.
The three B. longum subspecies pangenomes are open and contain a considerable fraction of putative genes designated hypothetical or not assigned a function. The pangenomes of subspecies infantis and suis appear to approach saturation, suggesting that genetic accumulation primarily occurs in their core gene set. The subspecies longum pangenome reflects a tendency to utilize plant-based products inherent to the diet of their postweaned human host. This includes plant carbohydrate utilization genes such as amylopullanase and pectineasterase that are currently described as unique to subspecies longum, although this is subject to scientific revision as more strains are isolated.
The genetic granularity by which B. longum is understood will continue to increase as more genome sequences are deposited into public databases. Challenges remain that are not unique to bifidobacterial genomic research, including generating quality sequences, assemblies, and consistent unsupervised annotation in the absence of manual curation. Thus establishing productive collaborative networks among bifidobacterial researchers could address these limitations through implementation of standardized genomic approaches.
Supplementary Materials
The following are available online at https://0-www-mdpi-com.brum.beds.ac.uk/2076-2607/8/1/7/s1, Figure S1: Phylogenetic tree denoting urease-negative B. suis strains, Table S1: Strains included in this study, Table S2: Average nucleotide identity calculated for all strains.
Author Contributions
Conceptualization, K.A. and D.A.S.; Methodology, K.A. and D.A.S.; Validation, K.A. and A.R.; Formal analysis, K.A.; Investigation, K.A.; Resources, D.A.S.; Data curation, K.A.; Writing—original draft preparation, K.A., A.R., and D.A.S.; Writing—review and editing, K.A., A.R., and D.A.S.; Visualization, K.A. and A.R.; Supervision, D.A.S.; Project administration, D.A.S.; Funding acquisition, D.A.S. All authors have read and agreed to the published version of the manuscript.
Funding
This research was supported, in part, by the U.S. Department of Agriculture, Massachusetts Agricultural Experiment Station (MAS0045). The APC was funded by AB-Biotics (Barcelona, Spain).
Acknowledgments
We thank members of the Sela Lab and others in the University of Massachusetts Amherst campus community for insightful discussions. Cynthia (Cindy) Kane is acknowledged for technical assistance and lab management. The authors thank Ravi Ranjan at the University of Massachusetts Amherst Genomics Resource Center for whole genome sequencing support. KA acknowledges the MCB graduate program and the UMass Amherst Graduate School Dissertation Grant program for predoctoral support. We thank Jordi Espadaler Mazo (AB-Biotics) for providing B. longum strain CECT7894 and its genome sequence. Supratim Mukherjee (Lawrence Berkeley National Laboratory) is thanked for discussions in an earlier iteration of the project. David Mills (UC Davis) is acknowledged for mentorship and support in a previously unfinished pangenome project.
Conflicts of Interest
The authors declare no conflict of interest.
References
- Turroni, F.; van Sinderen, D.; Ventura, M. Genomics and ecological overview of the genus Bifidobacterium. Int. J. Food Microbiol. 2011, 149, 37–44. [Google Scholar] [CrossRef] [PubMed]
- Odamaki, T.; Bottacini, F.; Kato, K.; Mitsuyama, E.; Yoshida, K.; Horigome, A.; Xiao, J.-z.; van Sinderen, D. Genomic diversity and distribution of Bifidobacterium longum subsp. longum across the human lifespan. Sci. Rep. 2018, 8, 85. [Google Scholar] [CrossRef] [PubMed] [Green Version]
- Candela, M.; Perna, F.; Carnevali, P.; Vitali, B.; Ciati, R.; Gionchetti, P.; Rizzello, F.; Campieri, M.; Brigidi, P. Interaction of probiotic Lactobacillus and Bifidobacterium strains with human intestinal epithelial cells: Adhesion properties, competition against enteropathogens and modulation of IL-8 production. Int. J. Food Microbiol. 2008, 125, 286–292. [Google Scholar] [CrossRef] [PubMed]
- Hütt, P.; Shchepetova, J.; Loivukene, K.; Kullisaar, T.; Mikelsaar, M. Antagonistic activity of probiotic lactobacilli and bifidobacteria against entero-and uropathogens. J. Appl. Microbiol. 2006, 100, 1324–1332. [Google Scholar] [CrossRef] [PubMed]
- Furrie, E.; Macfarlane, S.; Kennedy, A.; Cummings, J.H.; Walsh, S.V.; O’neil, D.A.; Macfarlane, G.T. Synbiotic therapy (Bifidobacterium longum/Synergy 1) initiates resolution of inflammation in patients with active ulcerative colitis: A randomised controlled pilot trial. Gut 2005, 54, 242–249. [Google Scholar] [CrossRef] [PubMed]
- Matteuzzi, D.; Crociani, F.; Zani, O.; Trovatelli, L.D. Bifidobacterium suis n. sp.: A new species of the genus Bifidobacterium isolated from pig faces. Z. Allg. Mikrobiol. 1971, 11, 387–395. [Google Scholar] [CrossRef]
- Mattarelli, P.; Bonaparte, C.; Pot, B.; Biavati, B. Proposal to reclassify the three biotypes of Bifidobacterium longum as three subspecies: Bifidobacterium longum subsp. longum subsp. nov., Bifidobacterium longum subsp. infantis comb. nov. and Bifidobacterium longum subsp. suis comb. nov. Int. J. Syst. Evol. Microbiol. 2008, 58, 5. [Google Scholar] [CrossRef] [Green Version]
- Sakata, S.; Kitahara, M.; Sakamoto, M.; Hayashi, H.; Fukuyama, M.; Benno, Y. Unification of Bifidobacterium infantis and Bifidobacterium suis as Bifidobacterium longum. Int. J. Syst. Evol. Microbiol. 2002, 52, 1945–1951. [Google Scholar]
- Pokusaeva, K.; Fitzgerald, G.F.; van Sinderen, D. Carbohydrate metabolism in Bifidobacteria. Genes Nutr. 2011, 6, 285. [Google Scholar] [CrossRef] [Green Version]
- Rossi, M.; Corradini, C.; Amaretti, A.; Nicolini, M.; Pompei, A.; Zanoni, S.; Matteuzzi, D. Fermentation of fructooligosaccharides and inulin by bifidobacteria: A comparative study of pure and fecal cultures. Appl. Environ. Microbiol. 2005, 71, 6150–6158. [Google Scholar] [CrossRef] [Green Version]
- Fukuda, S.; Toh, H.; Hase, K.; Oshima, K.; Nakanishi, Y.; Yoshimura, K.; Tobe, T.; Clarke, J.M.; Topping, D.L.; Suzuki, T. Bifidobacteria can protect from enteropathogenic infection through production of acetate. Nature 2011, 469, 543–547. [Google Scholar] [CrossRef] [PubMed]
- Fukuda, S.; Toh, H.; Taylor, T.D.; Ohno, H.; Hattori, M. Acetate-producing bifidobacteria protect the host from enteropathogenic infection via carbohydrate transporters. Gut Microbes 2012, 3, 449–454. [Google Scholar] [CrossRef] [PubMed] [Green Version]
- Den Besten, G.; Lange, K.; Havinga, R.; van Dijk, T.H.; Gerding, A.; van Eunen, K.; Müller, M.; Groen, A.K.; Hooiveld, G.J.; Bakker, B.M. Gut-derived short-chain fatty acids are vividly assimilated into host carbohydrates and lipids. Am. J. Physiol. Gastrointest. Liver Physiol. 2013, 305, G900–G910. [Google Scholar] [CrossRef] [PubMed]
- LoCascio, R.G.; Desai, P.; Sela, D.A.; Weimer, B.; Mills, D.A. Broad conservation of milk utilization genes in Bifidobacterium longum subsp. infantis as revealed by comparative genomic hybridization. Appl. Environ. Microbiol. 2010, 76, 7373–7381. [Google Scholar] [CrossRef] [Green Version]
- Sela, D.A.; Chapman, J.; Adeuya, A.; Kim, J.H.; Chen, F.; Whitehead, T.R.; Lapidus, A.; Rokhsar, D.S.; Lebrilla, C.B.; German, J.B.; et al. The genome sequence of Bifidobacterium longum subsp. infantis reveals adaptations for milk utilization within the infant microbiome. Proc. Natl. Acad. Sci. USA 2008, 105, 6. [Google Scholar] [CrossRef] [Green Version]
- De Leoz, M.L.A.; Wu, S.; Strum, J.S.; Niñonuevo, M.R.; Gaerlan, S.C.; Mirmiran, M.; German, J.B.; Mills, D.A.; Lebrilla, C.B.; Underwood, M.A. A quantitative and comprehensive method to analyze human milk oligosaccharide structures in the urine and feces of infants. Anal. Bioanal. Chem. 2013, 405, 4089–4105. [Google Scholar] [CrossRef] [Green Version]
- Dotz, V.; Rudloff, S.; Meyer, C.; Lochnit, G.; Kunz, C. Metabolic fate of neutral human milk oligosaccharides in exclusively breast-fed infants. Mol. Nutr. Food Res. 2015, 59, 355–364. [Google Scholar] [CrossRef]
- Chaplin, A.V.; Efimov, B.A.; Smeianov, V.V.; Kafarskaia, L.I.; Pikina, A.P.; Shkoporov, A.N. Intraspecies genomic diversity and long-term persistence of Bifidobacterium longum. PLoS ONE 2015, 10, e0135658. [Google Scholar] [CrossRef] [Green Version]
- Arboleya, S.; Bottacini, F.; O’Connell-Motherway, M.; Ryan, C.A.; Ross, R.P.; Van Sinderen, D.; Stanton, C. Gene-trait matching across the Bifidobacterium longum pan-genome reveals considerable diversity in carbohydrate catabolism among human infant strains. BMC Genom. 2018, 19, 33. [Google Scholar] [CrossRef]
- O’Callaghan, A.; Bottacini, F.; Motherway, M.C.; Van Sinderen, D. Pangenome analysis of Bifidobacterium longum and site-directed mutagenesis through by-pass of restriction-modification systems. BMC Genom. 2015, 16, 832. [Google Scholar] [CrossRef] [Green Version]
- Orban, J.I.; Patterson, J.A. Modification of the phosphoketolase assay for rapid identification of bifidobacteria. J. Microbiol. Methods 2000, 40, 221–224. [Google Scholar] [CrossRef]
- Milani, C.; Lugli, G.A.; Turroni, F.; Mancabelli, L.; Duranti, S.; Viappiani, A.; Mangifesta, M.; Segata, N.; van Sinderen, D.; Ventura, M. Evaluation of bifidobacterial community composition in the human gut by means of a targeted amplicon sequencing (ITS) protocol. FEMS Microbiol. Ecol. 2014, 90, 493–503. [Google Scholar] [CrossRef] [PubMed]
- Turroni, F.; Foroni, E.; Pizzetti, P.; Giubellini, V.; Ribbera, A.; Merusi, P.; Cagnasso, P.; Bizzarri, B.; de’Angelis, G.L.; Shanahan, F. Exploring the diversity of the bifidobacterial population in the human intestinal tract. Appl. Environ. Microbiol. 2009, 75, 1534–1545. [Google Scholar] [CrossRef] [PubMed] [Green Version]
- Bankevich, A.; Nurk, S.; Antipov, D.; Gurevich, A.A.; Dvorkin, M.; Kulikov, A.S.; Lesin, V.M.; Nikolenko, S.I.; Pham, S.; Prjibelski, A.D. SPAdes: A new genome assembly algorithm and its applications to single-cell sequencing. J. Comput. Biol. 2012, 19, 455–477. [Google Scholar] [CrossRef] [PubMed] [Green Version]
- Langmead, B.; Salzberg, S.L. Fast gapped-read alignment with Bowtie 2. Nat. Methods 2012, 9, 357–359. [Google Scholar] [CrossRef] [PubMed] [Green Version]
- Walker, B.J.; Abeel, T.; Shea, T.; Priest, M.; Abouelliel, A.; Sakthikumar, S.; Cuomo, C.A.; Zeng, Q.; Wortman, J.; Young, S.K. Pilon: An integrated tool for comprehensive microbial variant detection and genome assembly improvement. PLoS ONE 2014, 9, e112963. [Google Scholar] [CrossRef]
- Li, H.; Handsaker, B.; Wysoker, A.; Fennell, T.; Ruan, J.; Homer, N.; Marth, G.; Abecasis, G.; Durbin, R. The sequence alignment/map format and SAMtools. Bioinformatics 2009, 25, 2078–2079. [Google Scholar] [CrossRef] [Green Version]
- Wick, R.R.; Schultz, M.B.; Zobel, J.; Holt, K.E. Bandage: Interactive visualization of de novo genome assemblies. Bioinformatics 2015, 31, 3350–3352. [Google Scholar] [CrossRef] [Green Version]
- Brettin, T.; Davis, J.J.; Disz, T.; Edwards, R.A.; Gerdes, S.; Olsen, G.J.; Olson, R.; Overbeek, R.; Parrello, B.; Pusch, G.D. RASTtk: A modular and extensible implementation of the RAST algorithm for building custom annotation pipelines and annotating batches of genomes. Sci. Rep. 2015, 5, 8365. [Google Scholar] [CrossRef] [Green Version]
- Overbeek, R.; Olson, R.; Pusch, G.D.; Olsen, G.J.; Davis, J.J.; Disz, T.; Edwards, R.A.; Gerdes, S.; Parrello, B.; Shukla, M. The SEED and the Rapid Annotation of microbial genomes using Subsystems Technology (RAST). Nucleic Acids Res. 2014, 42, D206–D214. [Google Scholar] [CrossRef]
- Seemann, T. Prokka: Rapid prokaryotic genome annotation. Bioinformatics 2014, 30, 2068–2069. [Google Scholar] [CrossRef] [PubMed]
- Chen, I.M.A.; Markowitz, V.M.; Chu, K.; Palaniappan, K.; Szeto, E.; Pillay, M.; Ratner, A.; Huang, J.; Andersen, E.; Huntemann, M. IMG/M: Integrated genome and metagenome comparative data analysis system. Nucleic Acids Res. 2016. [Google Scholar] [CrossRef] [PubMed] [Green Version]
- Benson, D.A.; Cavanaugh, M.; Clark, K.; Karsch-Mizrachi, I.; Ostell, J.; Pruitt, K.D.; Sayers, E.W. GenBank. Nucleic Acids Res. 2018, 46, D41. [Google Scholar] [CrossRef] [PubMed] [Green Version]
- Page, A.J.; Cummins, C.A.; Hunt, M.; Wong, V.K.; Reuter, S.; Holden, M.T.G.; Fookes, M.; Falush, D.; Keane, J.A.; Parkhill, J. Roary: Rapid large-scale prokaryote pan genome analysis. Bioinformatics 2015, 31, 3691–3693. [Google Scholar] [CrossRef] [PubMed]
- Richter, M.; Rosselló-Móra, R. Shifting the genomic gold standard for the prokaryotic species definition. Proc. Natl. Acad. Sci. USA 2009, 106, 19126–19131. [Google Scholar] [CrossRef] [PubMed] [Green Version]
- Pritchard, L.; Glover, R.H.; Humphris, S.; Elphinstone, J.G.; Toth, I.K. Genomics and taxonomy in diagnostics for food security: Soft-rotting enterobacterial plant pathogens. Anal. Methods 2016, 8, 12–24. [Google Scholar] [CrossRef]
- Sayers, E.W.; Agarwala, R.; Bolton, E.E.; Brister, J.R.; Canese, K.; Clark, K.; Connor, R.; Fiorini, N.; Funk, K.; Hefferon, T. Database resources of the National Center for Biotechnology Information. Nucleic Acids Res. 2019, 47, D23. [Google Scholar] [CrossRef] [PubMed] [Green Version]
- Thompson, J.D.; Higgins, D.G.; Gibson, T.J. CLUSTAL W: Improving the sensitivity of progressive multiple sequence alignment through sequence weighting, position-specific gap penalties and weight matrix choice. Nucleic Acids Res. 1994, 22, 4673–4680. [Google Scholar] [CrossRef] [PubMed] [Green Version]
- Silvestro, D.; Michalak, I. raxmlGUI: A graphical front-end for RAxML. Org. Divers. Evol. 2012, 12, 335–337. [Google Scholar] [CrossRef]
- Rambaut, A. FigTree v1. 4. Computer Program Distributed by the Author. Available online: http://tree.bio.ed.ac.uk/software/figtree (accessed on 25 November 2018).
- Huerta-Cepas, J.; Szklarczyk, D.; Forslund, K.; Cook, H.; Heller, D.; Walter, M.C.; Rattei, T.; Mende, D.R.; Sunagawa, S.; Kuhn, M. eggNOG 4.5: A hierarchical orthology framework with improved functional annotations for eukaryotic, prokaryotic and viral sequences. Nucleic Acids Res. 2015, 44, D286–D293. [Google Scholar] [CrossRef] [Green Version]
- Huerta-Cepas, J.; Forslund, K.; Coelho, L.P.; Szklarczyk, D.; Jensen, L.J.; von Mering, C.; Bork, P. Fast genome-wide functional annotation through orthology assignment by eggNOG-mapper. Mol. Biol. Evol. 2017, 34, 2115–2122. [Google Scholar] [CrossRef] [PubMed] [Green Version]
- Potter, S.C.; Luciani, A.; Eddy, S.R.; Park, Y.; Lopez, R.; Finn, R.D. HMMER web server: 2018 update. Nucleic Acids Res. 2018, 46, W200–W204. [Google Scholar] [CrossRef] [PubMed] [Green Version]
- El-Gebali, S.; Mistry, J.; Bateman, A.; Eddy, S.R.; Luciani, A.; Potter, S.C.; Qureshi, M.; Richardson, L.J.; Salazar, G.A.; Smart, A. The Pfam protein families database in 2019. Nucleic Acids Res. 2018, 47, D427–D432. [Google Scholar] [CrossRef] [PubMed]
- Lombard, V.; Golaconda Ramulu, H.; Drula, E.; Coutinho, P.M.; Henrissat, B. The carbohydrate-active enzymes database (CAZy) in 2013. Nucleic Acids Res. 2013, 42, D490–D495. [Google Scholar] [CrossRef] [Green Version]
- Yin, Y.; Mao, X.; Yang, J.; Chen, X.; Mao, F.; Xu, Y. dbCAN: A web resource for automated carbohydrate-active enzyme annotation. Nucleic Acids Res. 2012, 40, W445–W451. [Google Scholar] [CrossRef]
- Csűös, M. Count: Evolutionary analysis of phylogenetic profiles with parsimony and likelihood. Bioinformatics 2010, 26, 1910–1912. [Google Scholar] [CrossRef]
- Konstantinidis, K.T.; Tiedje, J.M. Genomic insights that advance the species definition for prokaryotes. Proc. Natl. Acad. Sci. USA 2005, 102, 2567–2572. [Google Scholar] [CrossRef] [Green Version]
- Kim, M.; Oh, H.-S.; Park, S.-C.; Chun, J. Towards a taxonomic coherence between average nucleotide identity and 16S rRNA gene sequence similarity for species demarcation of prokaryotes. Int. J. Syst. Evol. Microbiol. 2014, 64, 346–351. [Google Scholar] [CrossRef]
- Na, S.-I.; Kim, Y.O.; Yoon, S.-H.; Ha, S.-m.; Baek, I.; Chun, J. UBCG: Up-to-date bacterial core gene set and pipeline for phylogenomic tree reconstruction. J. Microbiol. 2018, 56, 281–285. [Google Scholar] [CrossRef]
- Eddy, S. HMMER3: A New Generation of Sequence Homology Search Software. 2010. Available online: http://hmmer.janelia.org (accessed on 25 April 2018).
- Hyatt, D.; Chen, G.-L.; LoCascio, P.F.; Land, M.L.; Larimer, F.W.; Hauser, L.J. Prodigal: Prokaryotic gene recognition and translation initiation site identification. BMC Bioinform. 2010, 11, 119. [Google Scholar] [CrossRef] [Green Version]
- Katoh, K.; Standley, D.M. MAFFT multiple sequence alignment software version 7: Improvements in performance and usability. Mol. Biol. Evol. 2013, 30, 772–780. [Google Scholar] [CrossRef] [PubMed] [Green Version]
- Stamatakis, A. RAxML version 8: A tool for phylogenetic analysis and post-analysis of large phylogenies. Bioinformatics 2014, 30, 1312–1313. [Google Scholar] [CrossRef]
- Yanokura, E.; Oki, K.; Makino, H.; Modesto, M.; Pot, B.; Mattarelli, P.; Biavati, B.; Watanabe, K. Subspeciation of Bifidobacterium longum by multilocus approaches and amplified fragment length polymorphism: Description of B. longum subsp. suillum subsp. nov., isolated from the faeces of piglets. Syst. Appl. Microbiol. 2015, 38, 305–314. [Google Scholar] [CrossRef] [PubMed]
- Lugli, G.A.; Milani, C.; Duranti, S.; Mancabelli, L.; Mangifesta, M.; Turroni, F.; Viappiani, A.; van Sinderen, D.; Ventura, M. Tracking the taxonomy of the genus Bifidobacterium based on a phylogenomic approach. Appl. Environ. Microbiol. 2018, 84. [Google Scholar] [CrossRef] [Green Version]
- Cordeiro, R.L.; Pirolla, R.A.S.; Persinoti, G.F.; Gozzo, F.C.; de Giuseppe, P.O.; Murakami, M.T. N-glycan Utilization by Bifidobacterium Gut Symbionts Involves a Specialist β-Mannosidase. J. Mol. Biol. 2019, 431, 732–747. [Google Scholar] [CrossRef]
- Bertelli, C.; Pillonel, T.; Torregrossa, A.; Prod’hom, G.; Fischer, C.J.; Greub, G.; Giannoni, E. Bifidobacterium longum bacteremia in preterm infants receiving probiotics. Clin. Infect. Dis. 2014, 60, 924–927. [Google Scholar] [CrossRef] [Green Version]
- Esaiassen, E.; Hjerde, E.; Cavanagh, J.P.; Simonsen, G.S.; Klingenberg, C. Bifidobacterium Bacteremia: Clinical Characteristics and a Genomic Approach to Assess Pathogenicity. J. Clin. Microbiol. 2017, 55, 2234–2248. [Google Scholar] [CrossRef] [Green Version]
- Freitas, A.C.; Hill, J.E. Quantification, isolation and characterization of Bifidobacterium from the vaginal microbiomes of reproductive aged women. Anaerobe 2017, 47, 145–156. [Google Scholar] [CrossRef]
- Garrido, D.; Ruiz-Moyano, S.; Mills, D.A. Release and utilization of N-acetyl-D-glucosamine from human milk oligosaccharides by Bifidobacterium longum subsp. infantis. Anaerobe 2012, 18, 430–435. [Google Scholar] [CrossRef]
- Wanker, E.; Huber, A.; Schwab, H. Purification and characterization of the Bacillus subtilis levanase produced in Escherichia coli. Appl. Environ. Microbiol. 1995, 61, 1953–1958. [Google Scholar]
- Yin, X.; Chambers, J.R.; Barlow, K.; Park, A.S.; Wheatcroft, R. The gene encoding xylulose-5-phosphate/fructose-6-phosphate phosphoketolase (xfp) is conserved among Bifidobacterium species within a more variable region of the genome and both are useful for strain identification. FEMS Microbiol. Lett. 2005, 246, 251–257. [Google Scholar] [CrossRef] [PubMed] [Green Version]
- Milani, C.; Lugli, G.A.; Duranti, S.; Turroni, F.; Mancabelli, L.; Ferrario, C.; Mangifesta, M.; Hevia, A.; Viappiani, A.; Scholz, M. Bifidobacteria exhibit social behavior through carbohydrate resource sharing in the gut. Sci. Rep. 2015, 5, 15782. [Google Scholar] [CrossRef] [PubMed] [Green Version]
- Lugli, G.A.; Milani, C.; Turroni, F.; Duranti, S.; Mancabelli, L.; Mangifesta, M.; Ferrario, C.; Modesto, M.; Mattarelli, P.; Jiří, K. Comparative genomic and phylogenomic analyses of the Bifidobacteriaceae family. BMC Genom. 2017, 18, 568. [Google Scholar] [CrossRef] [PubMed]
- Gullfot, F.; Ibatullin, F.M.; Sundqvist, G.; Davies, G.J.; Brumer, H. Functional characterization of xyloglucan glycosynthases from GH7, GH12, and GH16 scaffolds. Biomacromolecules 2009, 10, 1782–1788. [Google Scholar] [CrossRef]
- Nakai, H.; Kitaoka, M.; Svensson, B.; Ohtsubo, K.I. Recent development of phosphorylases possessing large potential for oligosaccharide synthesis. Curr. Opin. Chem. Biol. 2013, 17, 301–309. [Google Scholar] [CrossRef]
- Sela, D.A.; Mills, D.A. Nursing our microbiota: Molecular linkages between bifidobacteria and milk oligosaccharides. Trends Microbiol. 2010, 18, 298–307. [Google Scholar] [CrossRef] [Green Version]
- Benešová, E.; Lipovová, P.; Dvořáková, H.; Králová, B. α-L-fucosidase from Paenibacillus thiaminolyticus: Its hydrolytic and transglycosylation abilities. Glycobiology 2013, 23, 1052–1065. [Google Scholar] [CrossRef] [Green Version]
- Sela, D.A.; Garrido, D.; Lerno, L.; Wu, S.; Tan, K.; Eom, H.-J.; Joachimiak, A.; Lebrilla, C.B.; Mills, D.A. Bifidobacterium longum subsp. infantis ATCC 15697 α-fucosidases are active on fucosylated human milk oligosaccharides. Appl. Environ. Microbiol. 2012, 78, 795–803. [Google Scholar] [CrossRef] [Green Version]
- Sumida, T.; Fujimoto, K.; Ito, M. Molecular cloning and catalytic mechanism of a novel glycosphingolipid-degrading β-N-acetylgalactosaminidase from Paenibacillus sp. TS12. J. Biol. Chem. 2011, 286, 14065–14072. [Google Scholar] [CrossRef] [Green Version]
- Yu, Z.; An, B.; Ramshaw, J.A.M.; Brodsky, B. Bacterial collagen-like proteins that form triple-helical structures. J. Struct. Biol. 2014, 186, 451–461. [Google Scholar] [CrossRef] [Green Version]
- Sela, D.A. Bifidobacterial utilization of human milk oligosaccharides. Int. J. Food Microbiol. 2011, 149, 7. [Google Scholar] [CrossRef] [PubMed]
- Xiao, M.; Tanaka, K.; Qian, X.M.; Yamamoto, K.; Kumagai, H. High-yield production and characterization of α-galactosidase from Bifidobacterium breve grown on raffinose. Biotechnol. Lett. 2000, 22, 747–751. [Google Scholar] [CrossRef]
- Selak, M.; Rivière, A.; Moens, F.; Van den Abbeele, P.; Geirnaert, A.; Rogelj, I.; Leroy, F.; De Vuyst, L. Inulin-type fructan fermentation by bifidobacteria depends on the strain rather than the species and region in the human intestine. Appl. Microbiol. Biotechnol. 2016, 100, 4097–4107. [Google Scholar] [CrossRef] [PubMed]
- Mattarelli, P.; Biavati, B.; Holzapfel, W.H.; Wood, B.J. (Eds.) The Bifidobacteria and Related Organisms; Elsevier: Amsterdam, The Netherlands, 2018. [Google Scholar]
- Parche, S.; Amon, J.; Jankovic, I.; Rezzonico, E.; Beleut, M.; Barutçu, H.; Schendel, I.; Eddy, M.P.; Burkovski, A.; Arigoni, F. Sugar transport systems of Bifidobacterium longum NCC2705. J. Mol. Microbiol. Biotechnol. 2007, 12, 9–19. [Google Scholar] [CrossRef] [PubMed]
- Liu, D.; Wang, S.; Xu, B.; Guo, Y.; Zhao, J.; Liu, W.; Sun, Z.; Shao, C.; Wei, X.; Jiang, Z. Proteomics analysis of Bifidobacterium longum NCC2705 growing on glucose, fructose, mannose, xylose, ribose, and galactose. Proteomics 2011, 11, 2628–2638. [Google Scholar] [CrossRef] [PubMed]
Figure 1.
Phylogenetic tree of 191 B. longum strains using the concatenated sequences of 92 core single-copy genes via the UBCG pipeline. Node labels indicate the Gene Support Index value which represents the number of genes (from a total of 92) whose common sequences group the taxa together within a branch. Strains with assigned subspecies in public databases that are inconsistent with this phylogenetic analysis are shown with red arrows (157F, CECT7210, CCUG52486, JDM301, CMCCP0001). Bifidobacterium breve DSM20213 is used as an outgroup.

Figure 2.
Heatmap displaying the percent average nucleotide identity (ANI) between the 191 B. longum strains. ANI was calculated via pyani v.0.2.8. using the ANI MUMmer/NUCmer method. The color key represents the percentage identity of strains with lower (red) and higher (yellow) ANI values. Strains clustered via dendrograms based on row means with gplots heatmap.2.

Figure 3.
Heatmap indicating the percent average nucleotide identity (ANI) between the 23 B. infantis (A) and 13 B. suis (B) strains. ANI was calculated via pyani v.0.2.8. using the ANI MUMmer/NUCmer (ANIm) method. The color key represents the percentage identity of strains with lower (red) and higher (yellow) ANI values. Strains clustered via dendrograms based on row means with gplots heatmap.2.

Figure 4.
Percent average nucleotide identity (ANI) versus the percent average nucleotide identity of protein-coding genes, both calculated for each individual strain against a representative genome of its subspecies. Colored dots represent the strains from subspecies longum (green), infantis (blue), and suis (pink). Dotted lines represent the lines of best fit for each individual subspecies dataset.

Figure 5.
Pangenome plots for (A) all B. longum strains, (B) longum subspecies, (C) infantis subspecies, and (D) suis subspecies.
Figure 5.
Pangenome plots for (A) all B. longum strains, (B) longum subspecies, (C) infantis subspecies, and (D) suis subspecies.

Figure 6.
Percent of total clusters of orthologous groups (COGs) annotated in the B. longum core gene set. Single letter COG category designations are as follows: S, function unknown; J, translation, ribosomal structure, and biogenesis; E, amino acid transport and metabolism; F, nucleotide transport and metabolism; K, transcription; L, replication, recombination, and repair; G, carbohydrate transport and metabolism; M, cell wall/membrane/envelope biogenesis; H, coenzyme transport and metabolism; P, inorganic ion transport and metabolism; T, signal transduction mechanisms; D, cell cycle control, cell division, and chromosome partitioning; C, energy production and conversion; O, post-translational modification, protein turnover, and chaperones; I, lipid transport and metabolism; U, intracellular trafficking, secretion, and vesicular transport; V, defense mechanisms; Q, secondary metabolite biosynthesis, transport, and catabolism.

Figure 7.
Percent of all CAZy categories identified in the three subspecies pangenomes. CAZy category definitions are as follows: GH, glycoside hydrolases; GT, glycosyl transferases; CBM, carbohydrate-binding modules; CE, carbohydrate esterases; and PL, polysaccharide lyases.
Figure 7.
Percent of all CAZy categories identified in the three subspecies pangenomes. CAZy category definitions are as follows: GH, glycoside hydrolases; GT, glycosyl transferases; CBM, carbohydrate-binding modules; CE, carbohydrate esterases; and PL, polysaccharide lyases.

Figure 8.
Inferred glycosyl hydrolase gene flux in extant Bifidobacterium longum subspecies infantis. Nodes are represented in purple with gene gain denoted in green and loss in orange.
Figure 8.
Inferred glycosyl hydrolase gene flux in extant Bifidobacterium longum subspecies infantis. Nodes are represented in purple with gene gain denoted in green and loss in orange.

Figure 9.
Distribution of Clusters of Orthologous Groups of proteins (COGs) identified in the three subspecies pangenomes. Single-letter COG category designations are as follows: C, energy production and conversion; D, cell cycle control, cell division, and chromosome partitioning; E, amino acid transport and metabolism; F, nucleotide transport and metabolism; G, carbohydrate transport and metabolism; H, coenzyme transport and metabolism; I, lipid transport and metabolism; J, translation, ribosomal structure, and biogenesis; K, transcription; L, replication, recombination, and repair; M, cell wall/membrane/envelope biogenesis; O, post-translational modification, protein turnover, and chaperones; P, inorganic ion transport and metabolism; S, function unknown; T, signal transduction mechanisms; U, intracellular trafficking, secretion, and vesicular transport; V, defense mechanisms.

Figure 10.
The human milk oligosaccharide (HMO) utilization cluster in B. infantis strains ATCC15697, IN_F29, BT1, and IN_07. Genes are represented by blocks color-coded according to their function: yellow, carbohydrate transporters; blue, transposable elements; green, hypothetical genes; orange, HMO utilization enzymes; purple, uracil-related genes. Letters correspond to the HMO utilization enzymes listed in Table 5.

Figure 11.
Phylogenetic relationships between HMO cluster glycosyl hydrolases (A) sialidase, (B) α-fucosidase GH95, and (C) α-fucosidase GH29 gene sequences with 1000 bootstrap replicates. Node labels indicate the Gene Support Index value which represents the number of genes (from a total of 92) whose common sequences group the taxa together within a branch.


Figure 12.
Bifidobacterium longum strains generate biomass from utilizing sole carbohydrate sources inferred from optical density at 600nm. Panels (A) longum, (B) infantis, and (C) suis grown on sole carbohydrates.
Figure 12.
Bifidobacterium longum strains generate biomass from utilizing sole carbohydrate sources inferred from optical density at 600nm. Panels (A) longum, (B) infantis, and (C) suis grown on sole carbohydrates.


Table 1.
Average genome size (Mb) and average % GC content of the B. longum species and subspecies longum, infantis, and suis. Strains were assigned by phylogenetic and average nucleotide identity analyses.
Table 1.
Average genome size (Mb) and average % GC content of the B. longum species and subspecies longum, infantis, and suis. Strains were assigned by phylogenetic and average nucleotide identity analyses.
| Taxon | Average Genome Size (Mb) | Average % GC Content | Average No. of Genes | Substrate Preferences | Common Isolation Source |
|---|---|---|---|---|---|
| Bifidobacterium longum species | 2.42 | 59.97 | 2155 | Host-indigestible carbohydrates | Mammalian digestive tract |
| subspecies longum | 2.38 | 60.03 | 2098 | Plant-derived carbohydrate substrates | Human adults |
| subspecies infantis | 2.67 | 59.70 | 2524 | Human milk oligosaccharides (HMO) | Human infants |
| subspecies suis 1 | 2.42 | 59.85 | 2179 | Plant-derived carbohydrate substrates | Nonhuman mammals |
1 Includes Bifidobacterium longum JCM19995.
Table 2.
Genes distributed across the B. longum species pangenome. Categories are defined as follows: core genes are identified in between 99% and 100% of strains; soft core genes are identified in between 95% and 99% of strains; shell genes are identified in between 15% and 95% of strains; cloud genes are identified in between 0% and 15% of strains.
| Pangenome Scope | Core Genes | Soft Core Genes | Shell Genes | Cloud Genes | Total Genes |
|---|---|---|---|---|---|
| Bifidobacterium longum species | 551 | 340 | 1613 | 14,469 | 16,973 |
| subspecies longum | 761 | 376 | 1194 | 10,278 | 12,609 |
| subspecies infantis | 1019 | 231 | 1966 | 2980 | 6196 |
| subspecies suis | 1187 | 0 | 1883 | 1653 | 4723 |
Table 3.
B. longum CAZy domains identified in the core genes set.
| Core CAZy Domain | Representative Gene ID | Inferred Function |
|---|---|---|
| GH3 | nagZ | putative β-hexosaminidase |
| GH13 | glgE1 | α-1,4-glucan:maltose-1-phosphate maltosyltransferase |
| GH32 | sacA | β-fructofuranosidase |
| GH36 | rafA | α-galactosidase |
| GH77 | malQ | 4-α-glucanotransferase |
| GT2 | kfoC | Putative glycosyltransferase |
| GT4 | mgtA | glycosyltransferase |
| GT28 | murG | UDP-N-acetylglucosamine--N-acetylmuramyl-(pentapeptide) pyrophosphoryl-undecaprenol N-acetylglucosamine transferase |
| GT51 | pbpG | putative penicillin-binding protein |
Table 4.
Unique carbohydrate-active enzyme domains identified in B. longum subspecies pangenomes.
| Bifidobacterium longum Subspecies | CAZy Domain | Representative Gene ID | Inferred Function |
|---|---|---|---|
| longum | CBM25 | group_8095 * | amylopullulanase |
| longum | CBM35 | hypBA2_4 | hypothetical protein |
| longum | CE8 | group_812 * | pectinesterase |
| longum | GH65 | kojP | glycoside hydrolase family 65 protein |
| infantis | CBM5 | chiA | carbohydrate-binding protein |
| infantis | CE2 | celE | electron transport complex, RnfABCDGE type, D subunit |
| infantis | GH4 | licH | glucosidase |
| infantis | GH151 | lacZ | β-galactosidase |
| suis | GH16 | glcA | β-galactosidase |
| suis | GH50 | group_2620 * | hypothetical protein |
| suis | GH59 | group_1820 * | carbohydrate binding family 6 |
| suis | GH154 | group_1814 * | hypothetical protein |
* Gene name not assigned.
Table 5.
Select human milk oligosaccharide (HMO) gene cluster genes identified in B. longum subspecies infantis ATCC15697T. Locus tags and gene annotations are from the Joint Genome Institute Integrated Microbial Genomes and Microbiomes (IMG/M) database.
Table 5.
Select human milk oligosaccharide (HMO) gene cluster genes identified in B. longum subspecies infantis ATCC15697T. Locus tags and gene annotations are from the Joint Genome Institute Integrated Microbial Genomes and Microbiomes (IMG/M) database.
| Gene Abbreviation Used in Figure 10 | Locus Tag | Gene Annotation |
|---|---|---|
| A | Blon_2334 | β-galactosidase |
| B | Blon_2335 | α-L-fucosidase 2 (GH95) |
| C | Blon_2336 | α-1,3/4-fucosidase (GH29) |
| D | Blon_2337 | L-fucose mutarotase |
| E | Blon_2338 | dihydrodipicolinate synthetase |
| F | Blon_2339 | short-chain dehydrogenase/reductase SDR |
| G | Blon_2340 | L-fuconate dehydratase |
| H | Blon_2348 | exo-α -sialidase |
| I | Blon_2349 | dihydrodipicolinate synthetase |
| J | Blon_2355 | β-hexosaminidase |
| K | Blon_2356 | haloacid dehalogenase domain protein hydrolase |
| L | Blon_2358 | β-lactamase domain protein |
© 2019 by the authors. Licensee MDPI, Basel, Switzerland. This article is an open access article distributed under the terms and conditions of the Creative Commons Attribution (CC BY) license (http://creativecommons.org/licenses/by/4.0/).
Share and Cite
MDPI and ACS Style
Albert, K.; Rani, A.; Sela, D.A. Comparative Pangenomics of the Mammalian Gut Commensal Bifidobacterium longum. Microorganisms 2020, 8, 7. https://0-doi-org.brum.beds.ac.uk/10.3390/microorganisms8010007
AMA Style
Albert K, Rani A, Sela DA. Comparative Pangenomics of the Mammalian Gut Commensal Bifidobacterium longum. Microorganisms. 2020; 8(1):7. https://0-doi-org.brum.beds.ac.uk/10.3390/microorganisms8010007
Chicago/Turabian StyleAlbert, Korin, Asha Rani, and David A. Sela. 2020. "Comparative Pangenomics of the Mammalian Gut Commensal Bifidobacterium longum" Microorganisms 8, no. 1: 7. https://0-doi-org.brum.beds.ac.uk/10.3390/microorganisms8010007
Note that from the first issue of 2016, this journal uses article numbers instead of page numbers. See further details here.