Differential Analysis of Proteins Involved in Ester Metabolism in two Saccharomyces cerevisiae Strains during the Second Fermentation in Sparkling Wine Elaboration


 , , , ,
Abstract
:
1. Introduction
2. Materials and Methods
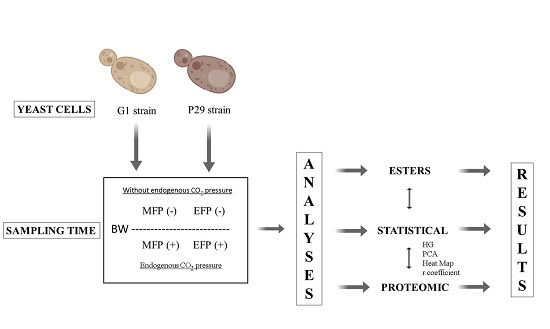
2.1. Microorganisms and Conditions Studied
2.2. Analysis of Volatile Metabolites
2.3. Proteomic Analysis
Extraction, Identification, and Quantification of Proteins
2.4. Statistical Analysis
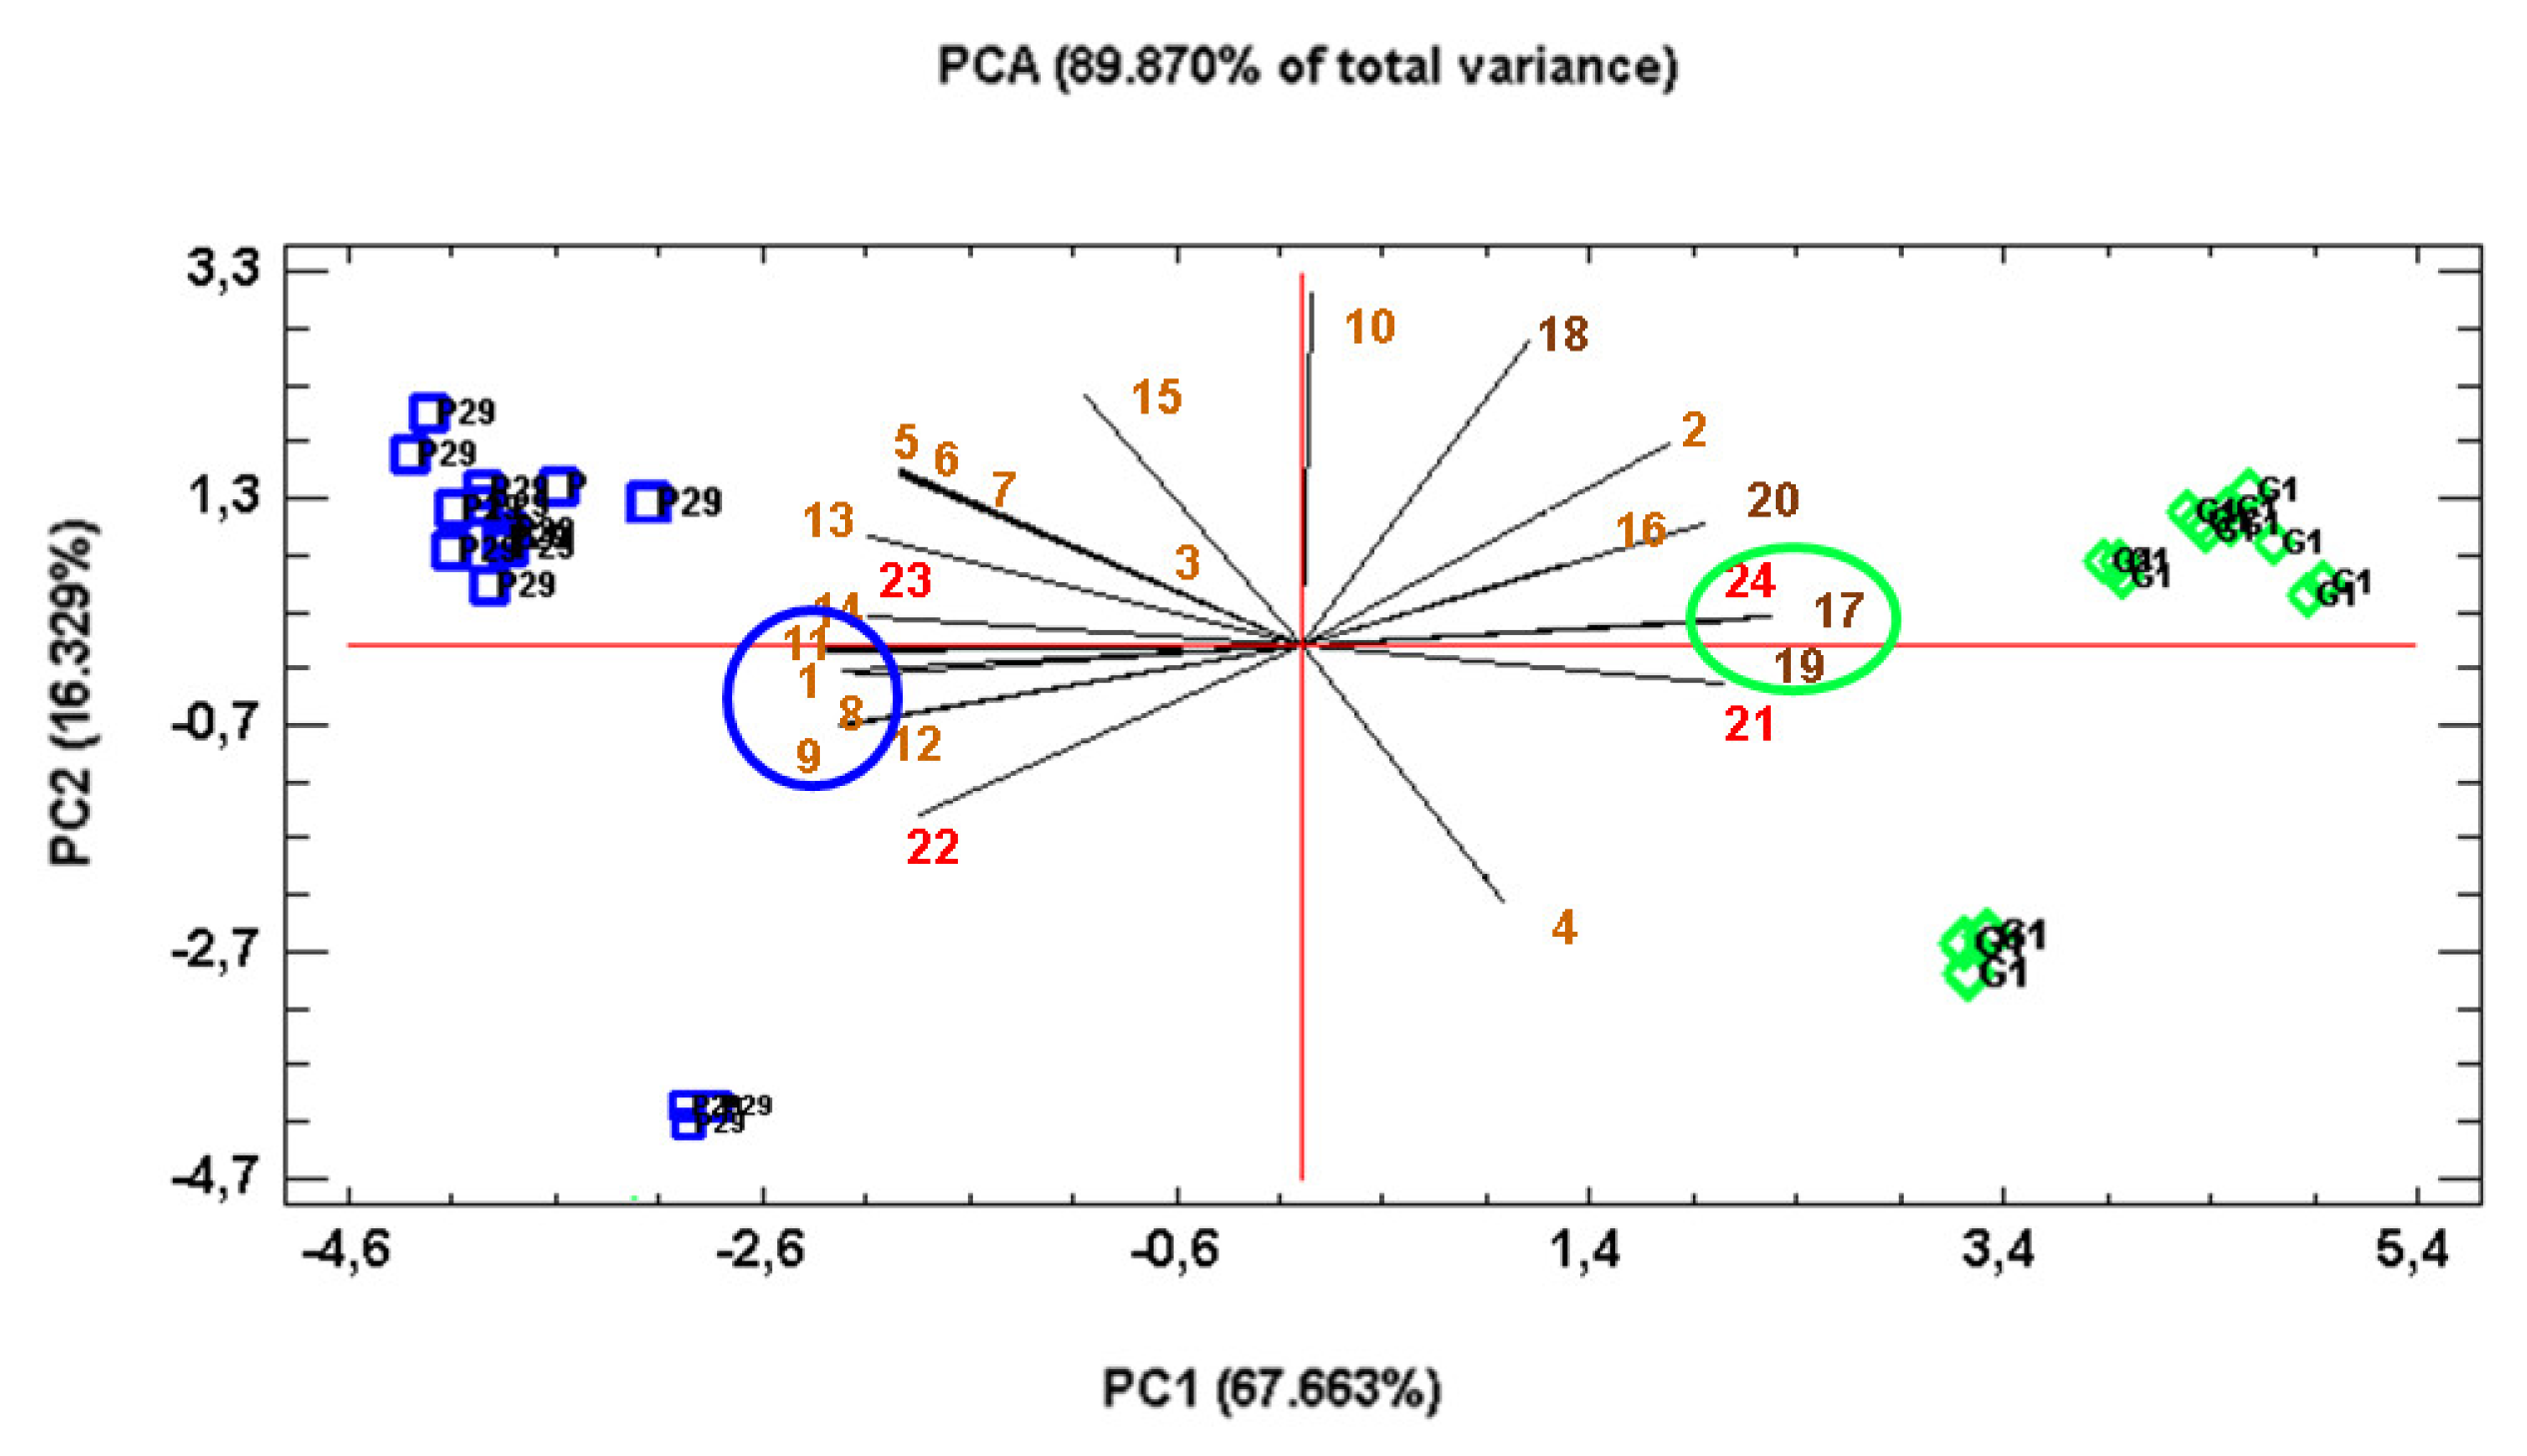
3. Results and Discussion
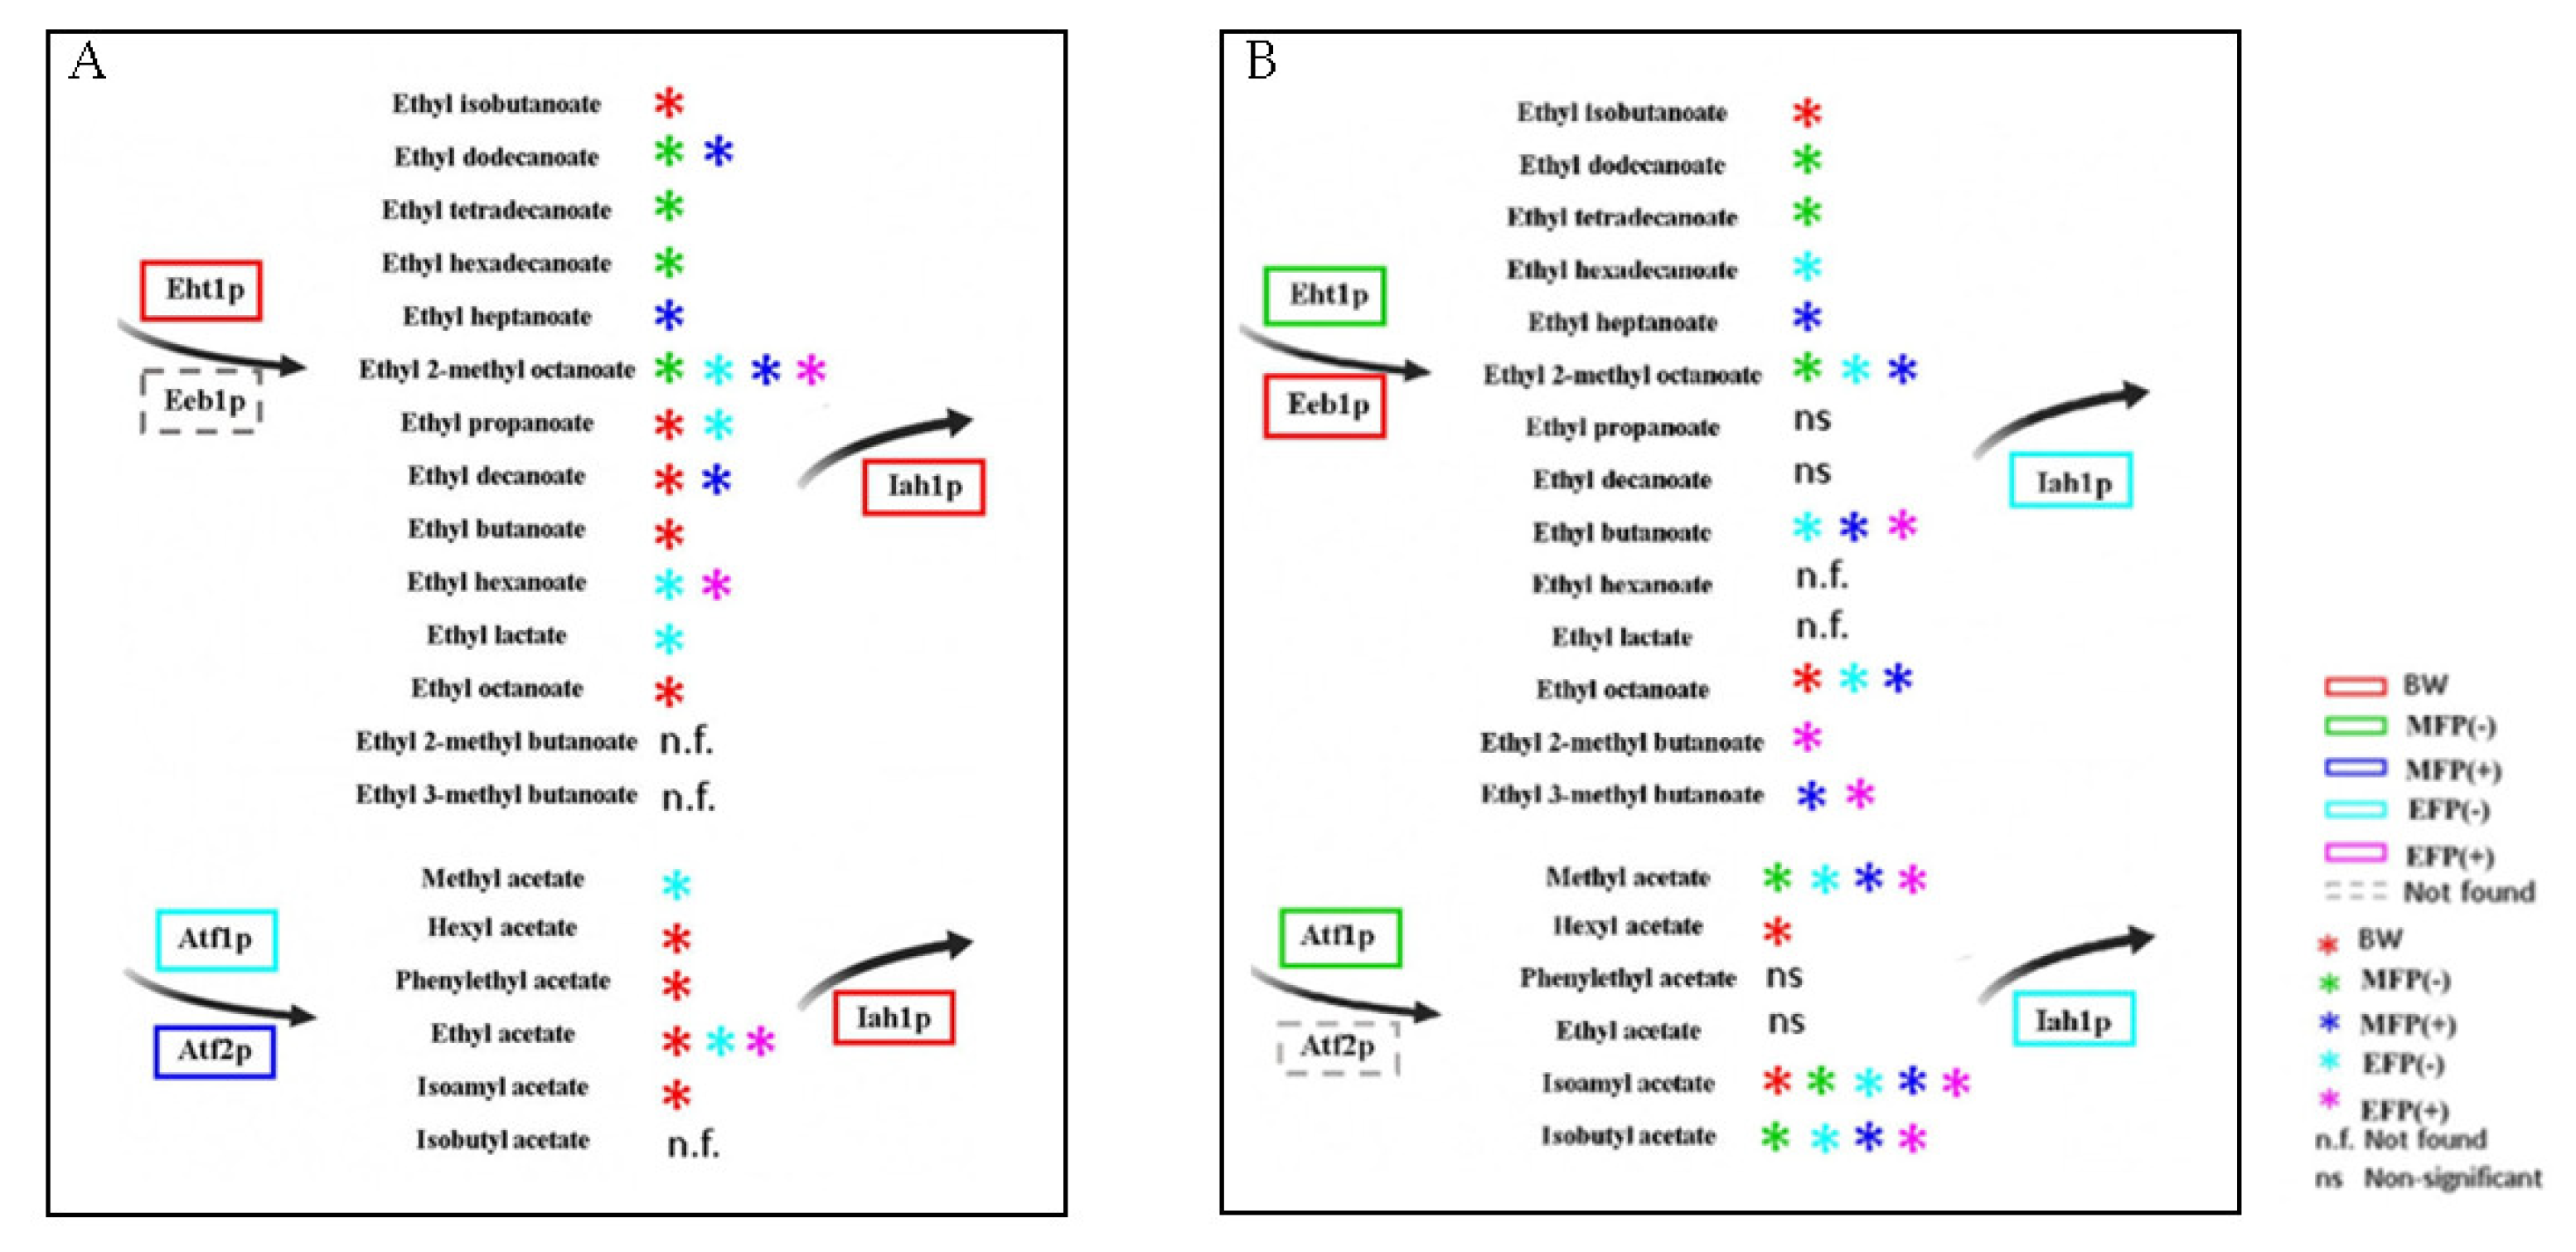
3.1. Acetate Esters
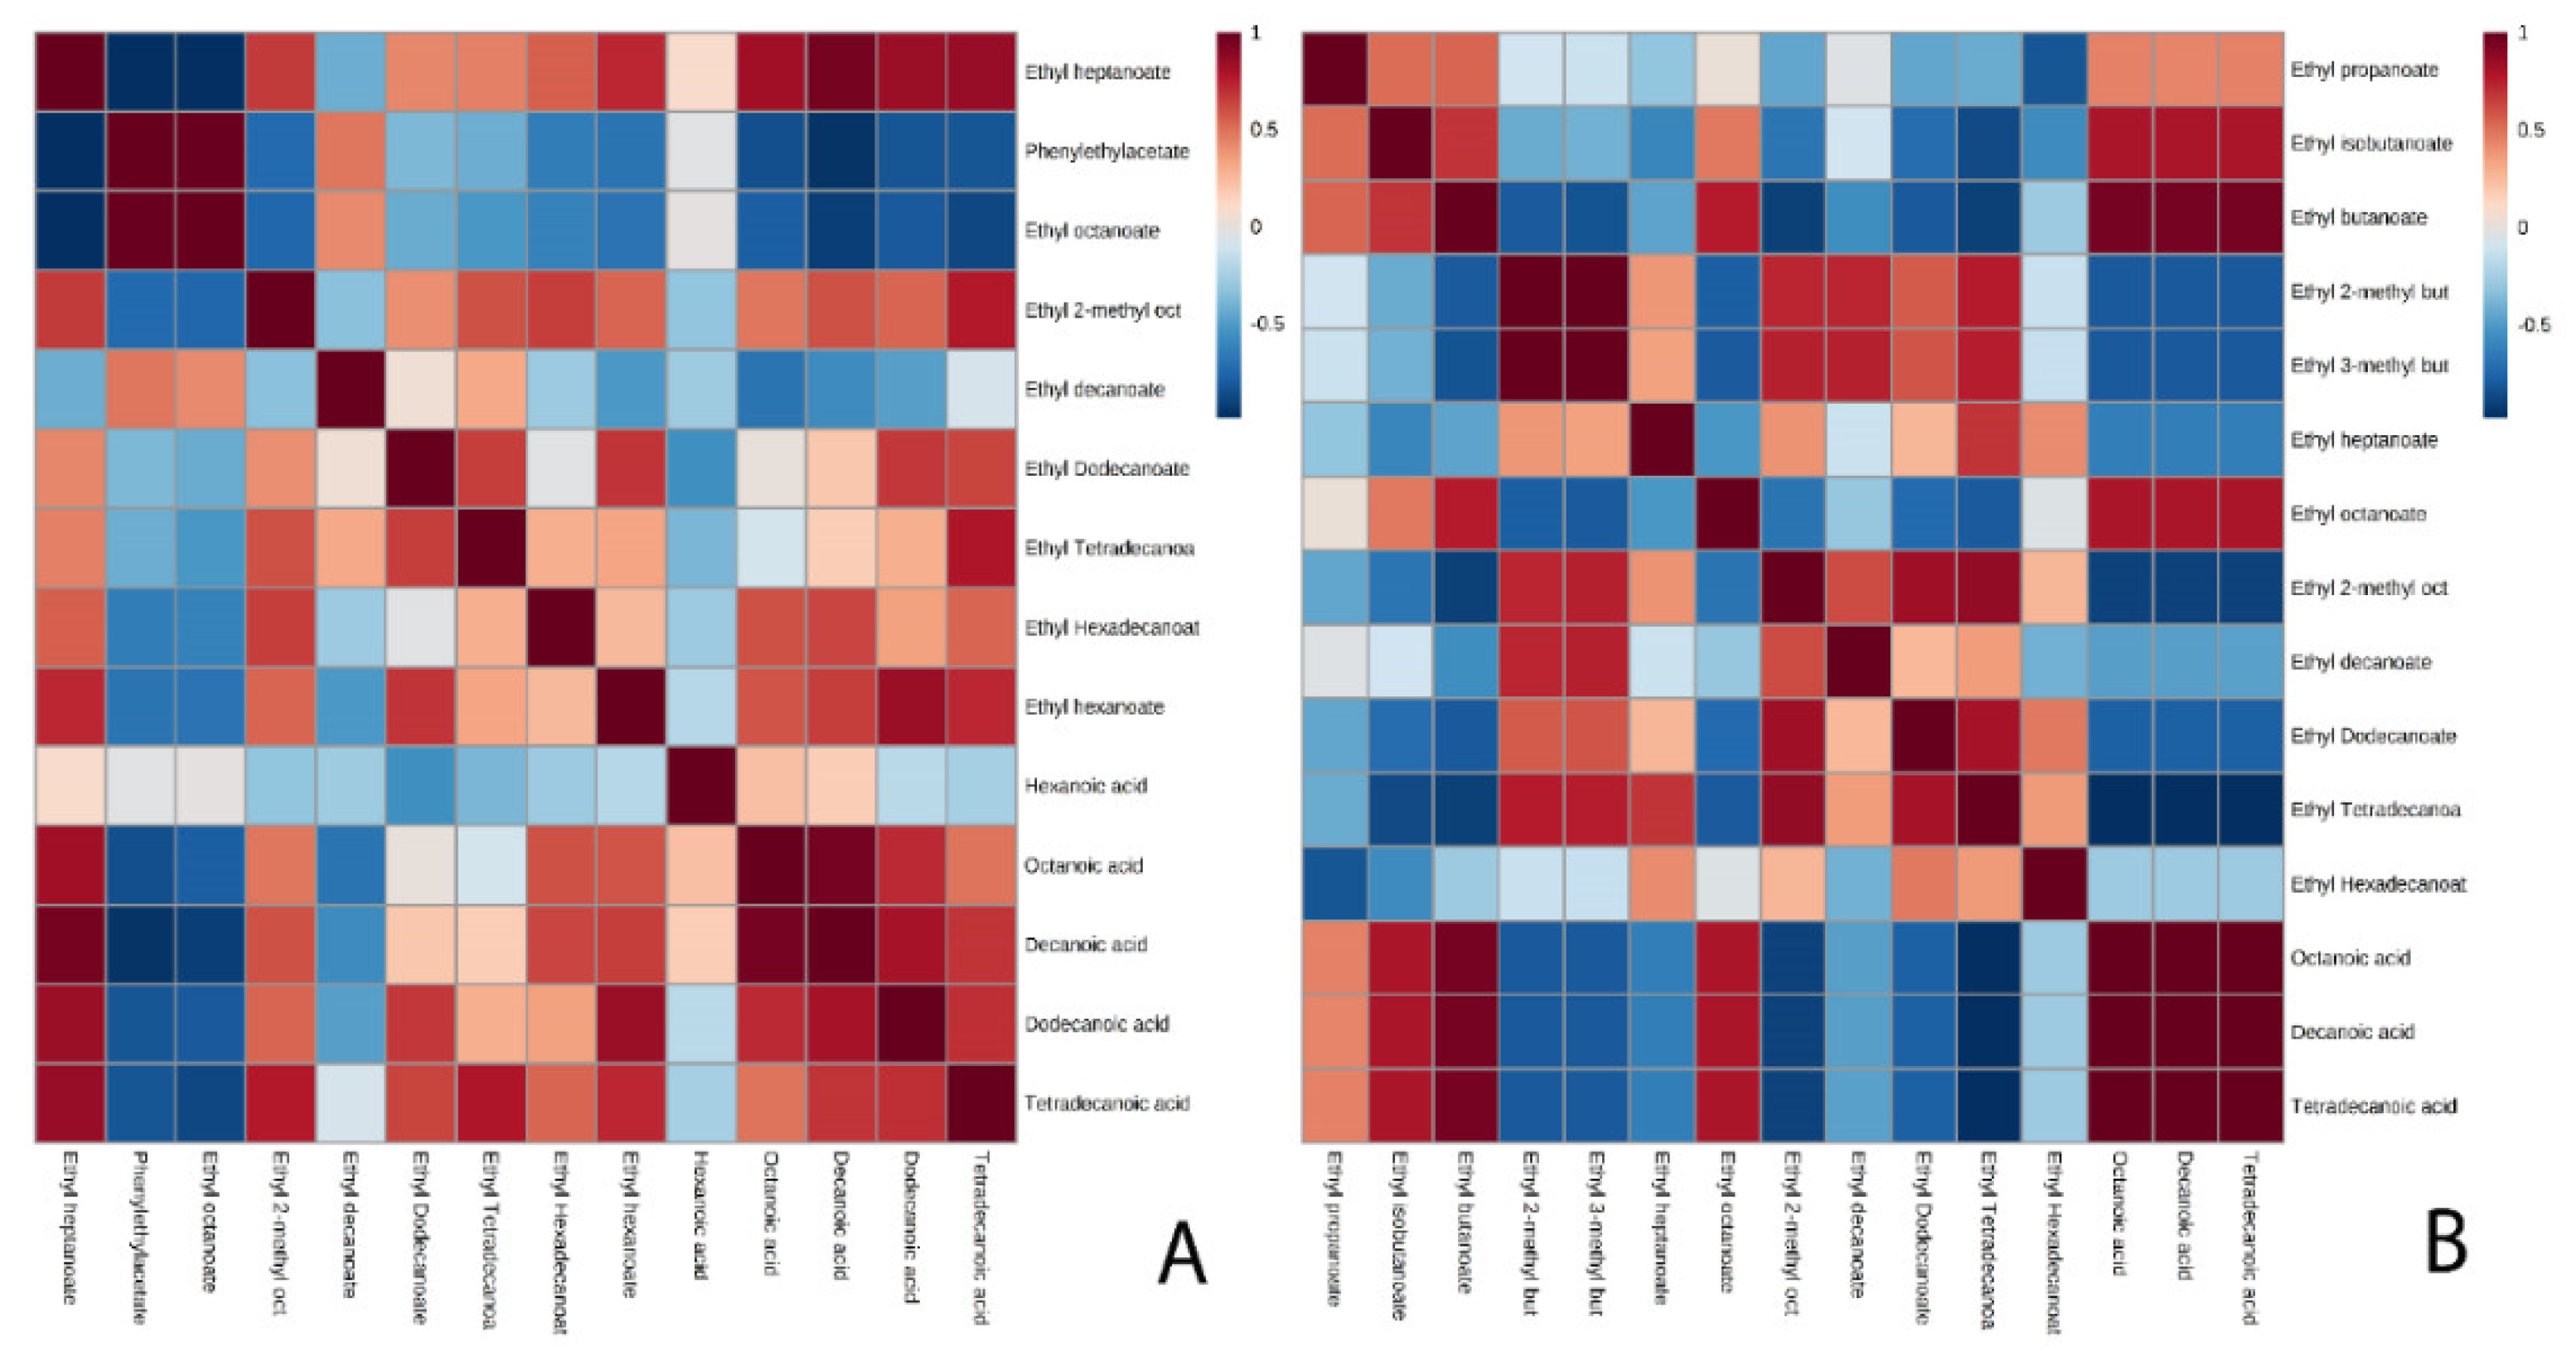
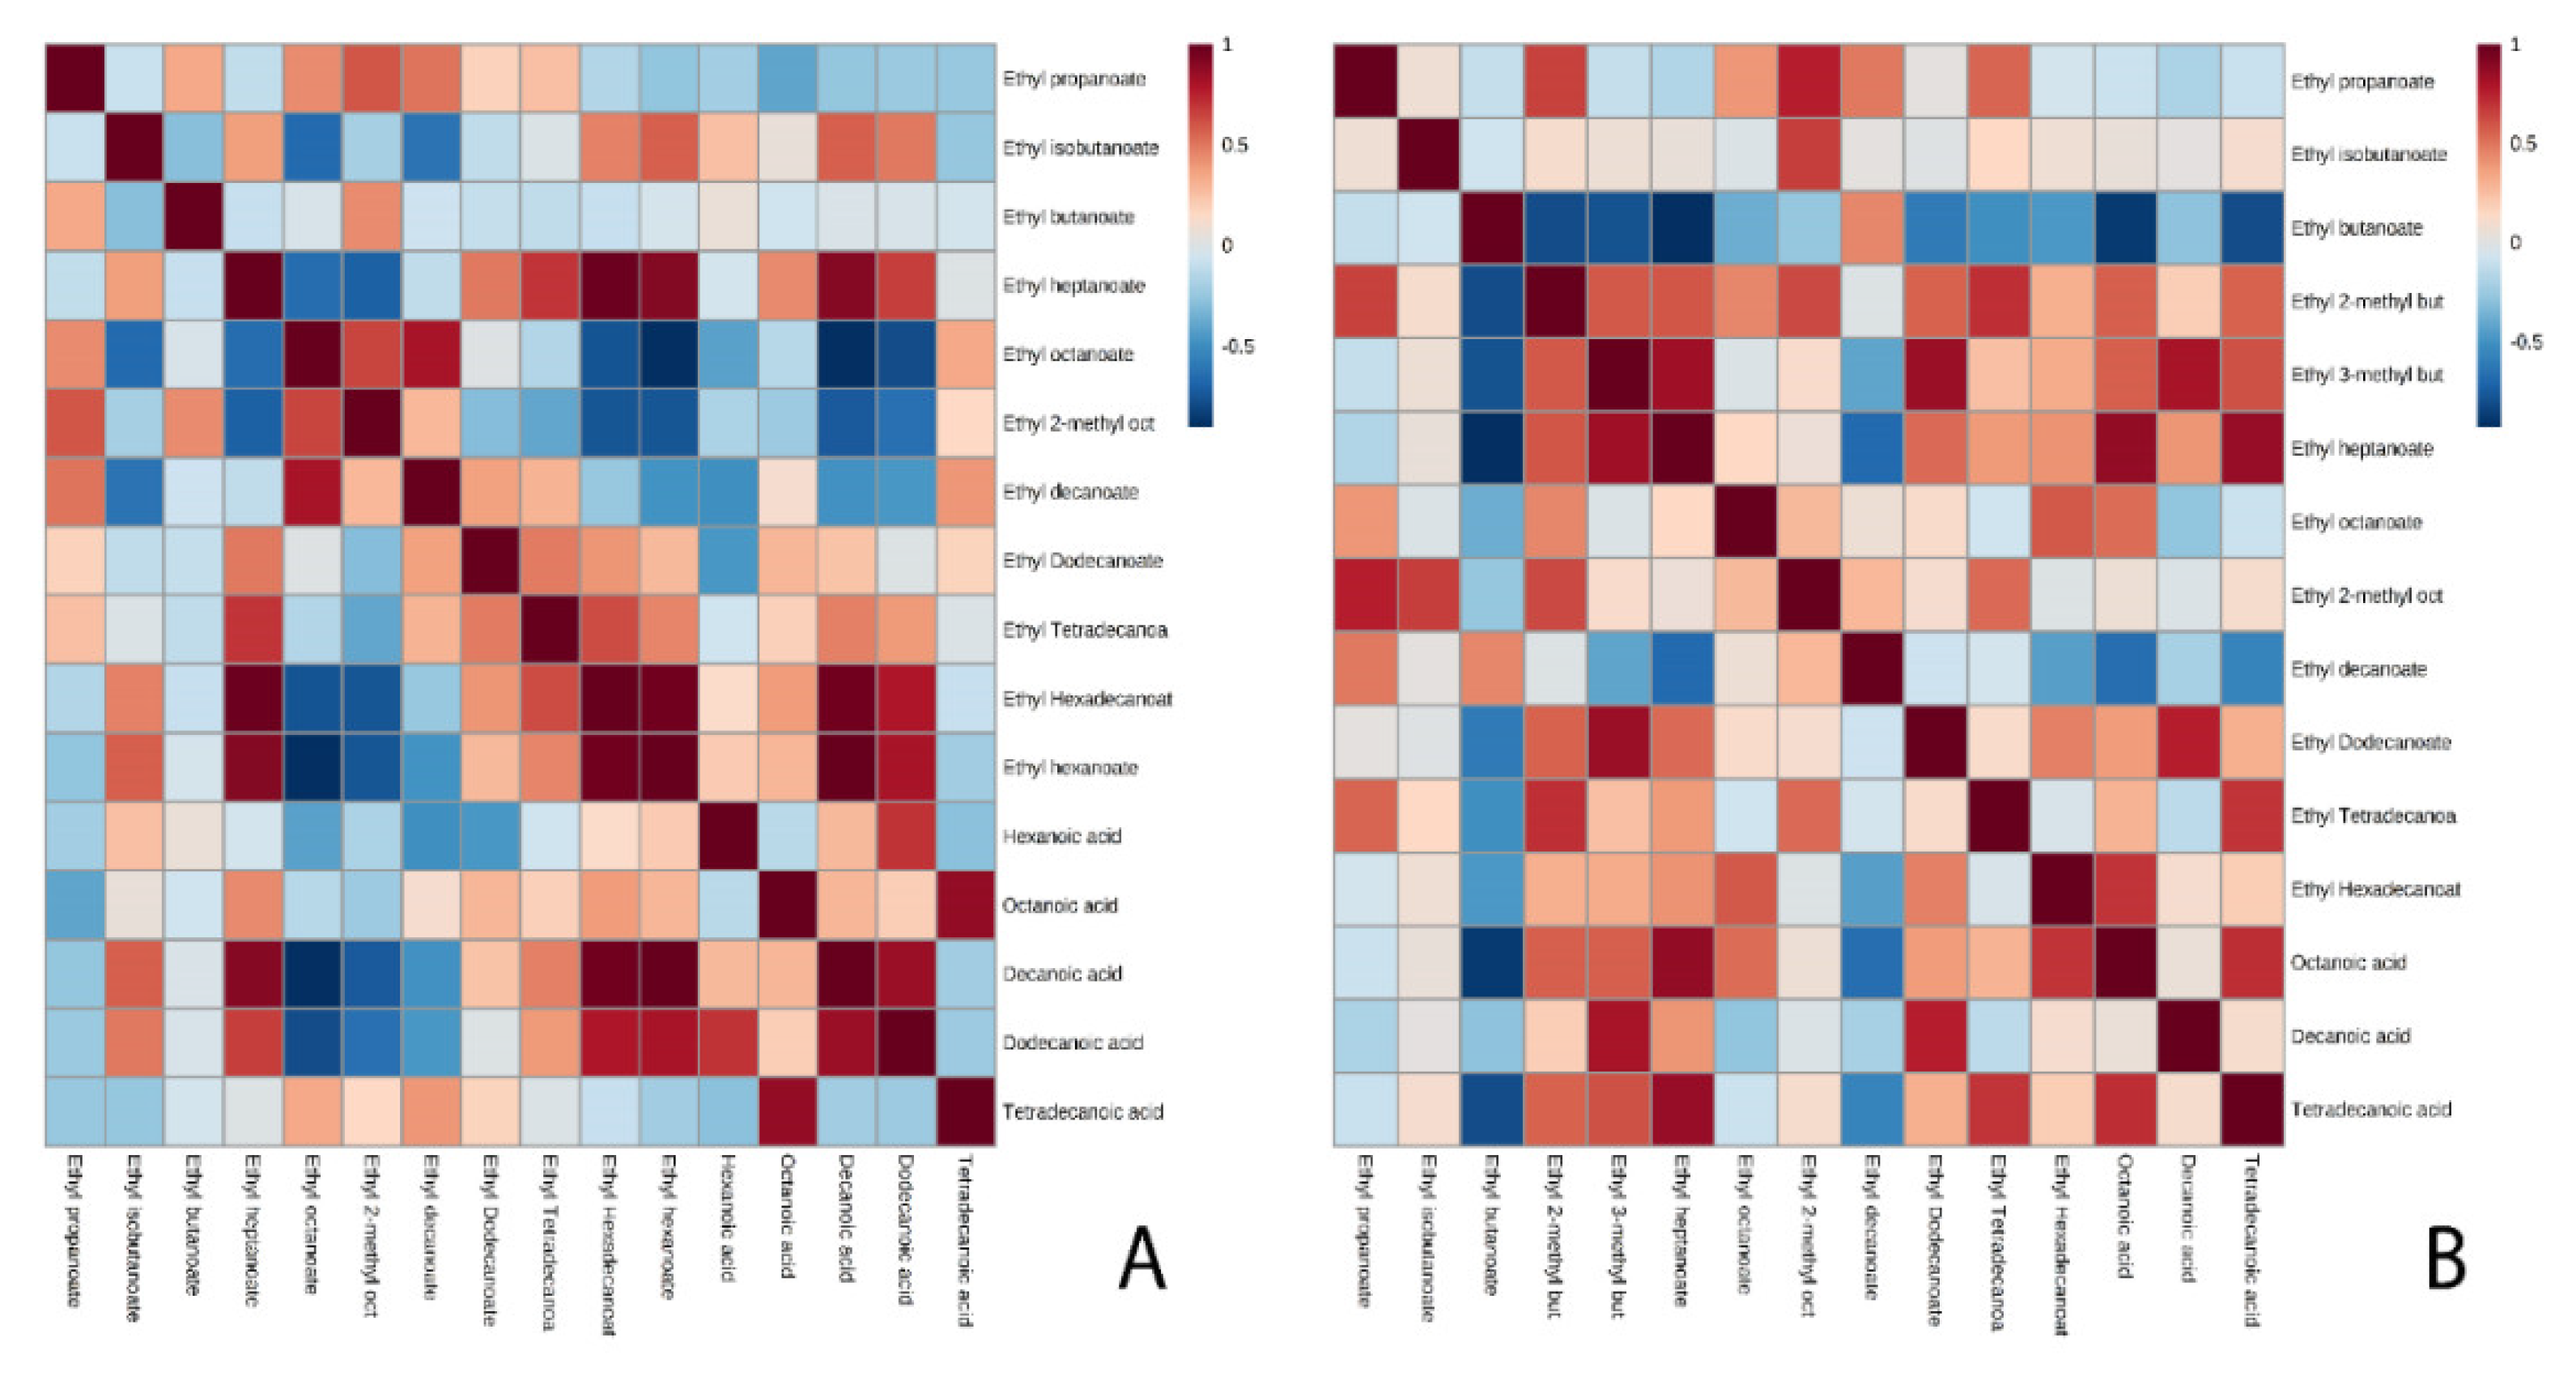
3.2. Ethyl Esters
4. Conclusions
Supplementary Materials
Author Contributions
Funding
Acknowledgments
Conflicts of Interest
References
- Belda, I.; Ruiz, J.; Esteban-Fernández, A.; Navascués, E.; Marquina, D.; Santos, A.; Moreno-Arribas, M. Microbial Contribution to Wine Aroma and its Intended use for Wine Quality Improvement. Molecules 2017, 22, 189. [Google Scholar] [CrossRef] [PubMed] [Green Version]
- Kurtzman, C.P.; Fell, J.W.; Boekhout, T. The Yeasts: A Taxonomic Study; Elsevier: Amsterdam, The Netherlands, 2011. [Google Scholar]
- Rapp, A.; Mandery, H. Wine Aroma. Experientia 1986, 42, 873–884. [Google Scholar] [CrossRef]
- Suomalainen, H. Yeast and its Effect on the Flavour of Alcoholic Beverages. J. Inst. Brew. 1971, 77, 164–177. [Google Scholar] [CrossRef]
- Soufleros, E.H.; Bertrand, A. Rôle de la Souche de Levure Dans la Production des Substances Volatiles au Cours de la Fermentation du jus de Raisin. OENO One 1979, 13, 181–198. [Google Scholar] [CrossRef]
- Lee, S.J.; Rathbone, D.; Asimont, S.; Adden, R.; Ebeler, S.E. Dynamic Changes in Ester Formation During Chardonnay Juice Fermentations with Different Yeast Inoculation and Initial Brix Conditions. Am. J. Enol. Vitic. 2014, 55, 346–354. [Google Scholar]
- Mateo, J.J.; Jimenez, M.; Huerta, T.; Pastor, A. Comparison of Volatiles Produced by Four Saccharomyces Cerevisiae Strains Isolated from Monastrell Musts. Am. J. Enol. Vitic. 1992, 43, 206–209. [Google Scholar]
- Plata, M.C.; Mauricio, J.C.; Millán, C.; Ortega, J.M. In Vitro Specific Activity of Alcohol Acetyltransferase and Esterase in Two Flor Yeast Strains during Biological Aging of Sherry Wines. J. Ferment. Bioeng. 1998, 85, 369–374. [Google Scholar] [CrossRef]
- Plata, M.C.; Millán, C.; Mauricio, J.C.; Ortega, J.M. Formation of Ethyl Acetate and Isoamyl Acetate by Various Species of Wine Yeasts. Food Microbiol. 2003, 20, 217–224. [Google Scholar] [CrossRef]
- Stribny, J.; Gamero, A.; Pérez-Torrado, R.; Querol, A. Saccharomyces Kudriavzevii and Saccharomyces uvarum Differ from Saccharomyces Cerevisiae during the Production of Aroma-Active Higher Alcohols and Acetate Esters Using Their Amino Acidic Precursors. Int. J. Food Microbiol. 2015, 205, 41–46. [Google Scholar] [CrossRef] [Green Version]
- Walker, G.; Stewart, G. Saccharomyces Cerevisiae in the Production of Fermented Beverages. Beverages 2016, 2, 30. [Google Scholar] [CrossRef]
- Di Gianvito, P.; Perpetuini, G.; Tittarelli, F.; Schirone, M.; Arfelli, G.; Piva, A.; Patrignani, F.; Lanciotti, R.; Olivastri, L.; Suzzi, G.; et al. Impact of Saccharomyces Cerevisiae Strains on Traditional Sparkling Wines Production. Food Res. Int. 2018, 109, 552–560. [Google Scholar] [CrossRef] [PubMed]
- Piendl, A.; Geiger, E. Technological Factors in the Formation of Esters during Fermentation (Brewing technology). Brew. Dig. 1980, 55, 26–55. [Google Scholar]
- Rollero, S.; Bloem, A.; Camarasa, C.; Sanchez, I.; Ortiz-Julien, A.; Sablayrolles, J.M.; Dequin, S.; Mouret, J.R. Combined Effects of Nutrients and Temperature on the Production of Fermentative Aromas by Saccharomyces Cerevisiae during Wine Fermentation. Appl. Microbiol. Biotechnol. 2015, 99, 2291–2304. [Google Scholar] [CrossRef]
- Edwards, C.G.; Beelman, R.B.; Bartley, C.E.; McConnell, A.L. Production of Decanoic Acid and other Volatile Compounds and the Growth of Yeast and Malolactic Bacteria during Vinification. Am. J. Enol. Vitic. 1990, 41, 48–56. [Google Scholar]
- Gómez, E.; Laencina, J.; Martinez, A. Vinification Effects on Changes in Volatile Compounds of Wine. J. Food Sci. 1994, 59, 406–409. [Google Scholar] [CrossRef]
- Kemp, B.; Alexandre, H.; Robillard, B.; Marchal, R. Effect of Production Phase on Bottle-Fermented Sparkling Wine Quality. J. Agric. Food Chem. 2015, 63, 19–38. [Google Scholar] [CrossRef]
- Zhang, S.; Petersen, M.; Liu, J.; Toldam-Andersen, T. Influence of Pre-Fermentation Treatments on Wine Volatile and Sensory Profile of the New Disease Tolerant Cultivar Solaris. Molecules 2015, 20, 9791. [Google Scholar] [CrossRef] [Green Version]
- Culbert, J.A.; McRae, J.M.; Condé, B.C.; Schmidtke, L.M.; Nicholson, E.L.; Smith, P.A.; Howell, K.S.; Boss, P.K.; Wilkinson, K.L. Influence of Production Method on the Chemical Composition, Foaming Properties, and Quality of Australian Carbonated and Sparkling White Wines. J. Agric. Food Chem. 2017, 65, 1378–1386. [Google Scholar] [CrossRef]
- Marais, J. The effect of pH on Esters and Quality of Colombar Wine during Maturation. VITIS-J. Grapevine Res. 2016, 17, 396. [Google Scholar]
- Daudt, C.E.; Ough, C.S. Variations in some volatile acetate esters formed during grape juice fermentation. Effects of fermentation temperature, SO2, yeast strain, and grape variety. Am. J. Enol. Vitic. 1973, 24, 130–135. [Google Scholar]
- Herraiz, T.; Ough, C.S. Formation of Ethyl esters of Amino Acids by Yeasts during the Alcoholic Fermentation of Grape Juice. Am. J. Enol. Vitic. 1993, 44, 41–48. [Google Scholar]
- Martínez-Lapuente, L.; Apolinar-Valiente, R.; Guadalupe, Z.; Ayestarán, B.; Pérez-Magariño, S.; Williams, P.; Doco, T. Polysaccharides, Oligosaccharides and Nitrogenous Compounds Change during the Ageing of Tempranillo and Verdejo Sparkling Wines. J. Sci. Food Agric. 2018, 98, 291–303. [Google Scholar] [CrossRef] [PubMed]
- Plata, M.C.; Mauricio, J.C.; Millán, C.; Ortega, J.M. Influence of Glucose and Oxygen on the Production of Ethyl Acetate and Isoamyl Acetate by a Saccharomyces Cerevisiae Strain during Alcoholic Fermentation. World J. Microbiol. Biotechnol. 2005, 21, 115–121. [Google Scholar] [CrossRef]
- Laurent, M.H.; Henick-Kling, T.; Acree, T.E. Changes in the Aroma and Odor of Chardonnay Wine Due to Malolactic Fermentation. Wein Wiss. 1994, 49, 3–10. [Google Scholar]
- Izquierdo-Cañas, P.M.; Mena-Morales, A.; García-Romero, E. Malolactic Fermentation before or during Wine Aging in Barrels. LWT Food Sci. Technol. 2016, 66, 468–474. [Google Scholar] [CrossRef]
- Nykänen, L.; Suomalainen, H. Aroma of Beer, Wine and Distilled Alcoholic Beverages. Springer Sci. Bus. Media 1983, 3, 3–16. [Google Scholar]
- Ubeda, C.; Kania-Zelada, I.; del Barrio-Galán, R.; Medel-Marabolí, M.; Gil, M.; Peña-Neira, Á. Study of the Changes in Volatile Compounds, Aroma and Sensory Attributes during the Production Process of Sparkling Wine by Traditional Method. Food Res. Int. 2019, 119, 554–563. [Google Scholar] [CrossRef]
- Verstrepen, K.J.; Derdelinckx, G.; Dufour, J.P.; Winderickx, J.; Thevelein, J.M.; Pretorius, I.S.; Delvaux, F.R. Flavor-Active Esters: Adding Fruitiness to Beer. J. Biosci. Bioeng. 2003, 96, 110–118. [Google Scholar] [CrossRef]
- Sumby, K.M.; Grbin, P.R.; Jiranek, V. Microbial Modulation of Aromatic Esters in Wine: Current Knowledge and Future Prospects. Food Chem. 2010, 121, 1–16. [Google Scholar] [CrossRef]
- Mauricio, J.C.; Moreno, J.J.; Valero, E.M.; Zea, L.; Medina, M.; Ortega, J.M. Ester Formation and Specific Activities of in Vitro Alcohol Acetyl Transferase and Esterase by Saccharomyces Cerevisiae during Grape Must Fermentation. J. Agric. Food Chem. 1993, 41, 2086–2091. [Google Scholar] [CrossRef]
- Martínez-García, R.; García-Martínez, T.; Puig-Pujol, A.; Mauricio, J.C.; Moreno, J. Changes in Sparkling Wine Aroma during the Second Fermentation Under CO2 Pressure in Sealed Bottle. Food Chem. 2017, 237, 1030–1040. [Google Scholar] [CrossRef] [PubMed]
- Martínez-García, R.; Roldán-Romero, Y.; Moreno, J.; Puig-Pujol, A.; Mauricio, J.C.; García-Martínez, T. Use of a Flor Yeast Strain for the Second Fermentation of Sparkling Wines: Effect of Endogenous CO2 Over-Pressure on the Volatilome. Food Chem. 2020, 308, 125555. [Google Scholar] [CrossRef]
- Garofalo, C.; Berbegal, C.; Grieco, F.; Tufariello, M.; Spano, G.; Capozzi, V. Selection of Indigenous Yeast Strains for the Production of Sparkling Wines from Native Apulian Grape Varieties. Int. J. Food Microbiol. 2018, 285, 7–17. [Google Scholar] [CrossRef] [PubMed]
- Ivit, N.N.; Kemp, B. The Impact of Non-Saccharomyces Yeast on Traditional Method Sparkling Wine. Fermentation 2018, 4, 73. [Google Scholar] [CrossRef] [Green Version]
- Vigentini, I.; Cardenas, S.B.; Valdetara, F.; Faccincani, M.; Panont, C.A.; Picozzi, C.; Foschino, R. Use of Native Yeast Strains for in-Bottle Fermentation to Face the Uniformity in Sparkling Wine Production. Front. Microbiol. 2017, 8, 1225. [Google Scholar] [CrossRef] [PubMed]
- Peinado, R.A.; Moreno, J.A.; Muñoz, D.; Medina, M.; Moreno, J. Gas Chromatographic Quantification of Major Volatile Compounds and Polyols in Wine by Direct Injection. J. Agric. Food Chem. 2004, 52, 6389–6393. [Google Scholar] [CrossRef]
- Tredoux, A.; Villiers, A.; Májek, P.; Lynen, F.; Crouch, A.; Sandra, P. Stir Bar Sorptive Extraction Combined with GC–MS Analysis and Chemometric Methods for the Classification of South African Wines According to the Volatile Composition. J. Agric. Food Chem. 2008, 56, 4286–4296. [Google Scholar] [CrossRef]
- Vararu, F.; Moreno-García, J.; Zamfir, C.I.; Cotea, V.V.; Moreno, J. Selection of Aroma Compounds for the Differentiation of Wines Obtained by Fermenting Musts with Starter Cultures of Commercial Yeast Strains. Food Chem. 2016, 197, 373–381. [Google Scholar] [CrossRef]
- Bradford, M.M. A Rapid and Sensitive Method for the Quantitation of Microgram Quantities of Protein Utilizing the Principle of Protein-Dye Binding. Anal. Biochem. 1976, 72, 248–254. [Google Scholar] [CrossRef]
- Moreno-García, J.; García-Martínez, T.; Moreno, J.; Mauricio, J.C. Proteins Involved in Flor Yeast Carbon Metabolism under Biofilm Formation Conditions. Food Microbiol. 2015, 46, 25–33. [Google Scholar] [CrossRef]
- Ishihama, Y.; Oda, Y.; Tabata, T.; Sato, T.; Nagasu, T.; Rappsilber, J.; Mann, M. Exponentially Modified Protein Abundance Index (emPAI) for Estimation of Absolute Protein Amount in Proteomics by the Number of Sequenced Peptides Per Protein. Mol. Cell. Proteom. 2005, 4, 1265–1272. [Google Scholar] [CrossRef] [PubMed] [Green Version]
- Seisonen, S.; Vene, K.; Koppel, K. The Current Practice in the Application of Chemometrics for Correlation of Sensory and Gas Chromatography Data. Food Chem. 2016, 210, 530–540. [Google Scholar] [CrossRef] [PubMed]
- Mason, A.B.; Dufour, J.P. Alcohol Acetyltransferases and the Significance of Ester Synthesis in Yeast. Yeast 2000, 16, 1287–1298. [Google Scholar] [CrossRef]
- Lilly, M.; Bauer, F.F.; Lambrechts, M.G.; Swiegers, J.H.; Cozzolino, D.; Pretorius, I.S. The Effect of Increased Yeast Alcohol Acetyltransferase and Esterase Activity on the Flavour Profiles of Wine and Distillates. Yeast 2006, 23, 641–659. [Google Scholar] [CrossRef] [Green Version]
- Saerens, S.M.G.; Verstrepen, K.J.; Van Laere, S.D.M.; Voet, A.R.D.; Van Dijck, P.; Delvaux, F.R.; Thevelein, J.M. The Saccharomyces Cerevisiae EHT1 and EEB1 Genes Encode Novel Enzymes with Medium-Chain Fatty Acid Ethyl Ester Synthesis and Hydrolysis Capacity. J. Biol. Chem. 2006, 281, 4446–4456. [Google Scholar] [CrossRef] [Green Version]
- Saerens, S.; Thevelein, J.; Delvaux, F. Ethyl Ester Production during Brewery Fermentation, A Review. Cerevisia 2008, 33, 82–90. [Google Scholar]
- Procopio, S.; Qian, F.; Becker, T. Function and Regulation of Yeast Genes Involved in Higher Alcohol and Ester Metabolism during Beverage Fermentation. Eur. Food Res. Technol. 2011, 233, 721. [Google Scholar] [CrossRef]
- Pires, E.J.; Teixeira, J.A.; Brányik, T.; Vicente, A.A. Yeast: The Soul of Beer’s Aroma-A Review of Flavour-Active Esters and Higher Alcohols Produced by the Brewing Yeast. Appl. Microbiol. Biotechnol. 2014, 98, 1937–1949. [Google Scholar] [CrossRef] [Green Version]
- Riu-Aumatell, M.; Bosch-Fusté, J.; López-Tamames, E.; Buxaderas, S. Development of Volatile Compounds of Cava (Spanish Sparkling Wine) during Long Ageing Time in Contact with Lees. Food Chem. 2006, 95, 237–242. [Google Scholar] [CrossRef]
- Lambrechts, M.G.; Pretorius, I.S. Yeast and its Importance to Wine Aroma-A Review. S. Afr. J. Enol. Vitic. 2000, 21, 97–129. [Google Scholar] [CrossRef] [Green Version]
- Francioli, S.; Torrens, J.; Riu-Aumatell, M.; López-Tamames, E.; Buxaderas, S. Volatile Compounds by SPME-GC as Age Markers of Sparkling Wines. Am. J. Enol. Vitic. 2003, 54, 158–162. [Google Scholar]
- Ruiz-Moreno, M.J.; Muñoz-Redondo, J.M.; Cuevas, F.J.; Marrufo-Curtido, A.; León, J.M.; Ramírez, P.; Moreno-Rojas, J.M. The Influence of Pre-Fermentative Maceration and Ageing Factors on Ester Profile and Marker Determination of Pedro Ximenez Sparkling Wines. Food Chem. 2017, 230, 697–704. [Google Scholar] [CrossRef] [PubMed] [Green Version]
- Torrens, J.; Urpí, P.; Riu-Aumatell, M.; Vichi, S.; López-Tamames, E.; Buxaderas, S. Different Commercial yeast Strains Affecting the Volatile and Sensory Profile of Cava Base Wine. Int. J. Food Microbiol. 2008, 124, 48–57. [Google Scholar] [CrossRef] [PubMed]
- López de Lerma, N.; Peinado, R.A.; Puig-Pujol, A.; Mauricio, J.C.; Moreno, J.; García-Martínez, T. Influence of Two Yeast Strains in Free, Bioimmobilized or Immobilized with Alginate Forms on the Aromatic Profile of Long Aged Sparkling Wines. Food Chem. 2018, 250, 22–29. [Google Scholar] [CrossRef] [PubMed] [Green Version]
- Ancín-Azpilicueta, C.; González-Marco, A.; Jiménez-Moreno, N. Evolution of Esters in Aged Chardonnay Wines Obtained with Different Vinification Methods. J. Sci. Food Agric. 2009, 89, 2446–2451. [Google Scholar] [CrossRef]


| BW | MFP (−) | EFP (−) | MFP (+) | EFP (+) | |
|---|---|---|---|---|---|
| G1 strain | 1.5 × 10⁶ ± 0 | 3.71 × 10⁶ ± 2.3x10⁵ | 7.12 × 10⁵ ± 1.2x10⁵ | 2.87 × 10⁶ ± 4.9x10⁵ | 3.5 × 10³ ± 7.07x10² |
| P29 strain | 1.5 × 10⁶ ± 0 | 5.53 × 10⁶ ± 2.1x10⁶ | 1.14 × 10⁶ ± 4.2x10⁵ | 8.02 × 10⁶ ± 1.4x10⁶ | 3.33 × 10⁴ ± 1.2x10⁴ |
| G1 Strain | P29 Strain | |||||||||
|---|---|---|---|---|---|---|---|---|---|---|
| Concentration (mg/L) | ||||||||||
| BW | MFP (−) | EFP (−) | MFP (+) | EFP (+) | BW | MFP (−) | EFP (−) | MFP (+) | EFP (+) | |
| Methyl acetate | 0.071a±0.008 | 0.132b±0.004 | 0.257d±0.006 | 0.140b±0.001 | 0.18c±0.03 | 0.071a±0.008 | 0.25b±0.09 | 0.22b±0.03 | 0.32b±0.05 | 0.30b±0.03 |
| Hexyl acetate | 0.256d±0.007 | 0.124ab±0.003 | 0.102a±0.004 | 0.144c±0.003 | 0.122bc±0.002 | 0.256c±0.007 | 0.23ab±0.02 | 0.23b±0.01 | 0.20a±0.04 | 0.22a±0.02 |
| Phenylethyl acetate | 0.76c±0.02 | 0.41a±0.03 | 0.411a±0.009 | 0.51b±0.04 | 0.49b±0.03 | 0.76ns±0.02 | 0.84ns±0.06 | 0.82ns±0.05 | 0.79ns±0.08 | 0.81ns±0.07 |
| Ethyl acetate | 19.9b±0.8 | 12a±3 | 20.2b±0.9 | 13.9a±0.4 | 14b±4 | 19.9ns±0.8 | 21ns±3 | 21.69ns±0.02 | 21.4ns±0.7 | 22ns±5 |
| Isoamyl acetate | 6.1c±0.7 | 2.50a±0.01 | 2.4ab±0.4 | 2.23a±0.02 | 2.2b±0.8 | 6.1b±0.7 | 5.8b±0.4 | 4.7b±0.4 | 5.1ab±0.3 | 5.1ab±0.5 |
| Isobutyl acetate | n.f. | n.f. | n.f. | n.f. | n.f. | n.f.a | 0.010b±0.002 | 0.011b±0.001 | 0.009b±0.001 | 0.009b±0.002 |
| Ethyl isobutanoate | 0.0032d±0.0004 | 0.0013b±0.0001 | 0.0010a±0.0004 | 0.0009a±0.0002 | 0.0026c±0.0001 | 0.0032c±0.0004 | 0.0015b±0.0002 | 0.0004a±0.0005 | 0.0014b±0.0001 | 0.0016b±0.0005 |
| Ethyl dodecanoate | 0.0005a±0.0001 | 0.0183c±0.0008 | 0.0017b±0.0003 | 0.021c±0.001 | 0.0004a±0.0002 | 0.0005a±0.0001 | 0.053e±0.002 | 0.031d±0.003 | 0.0061b±0.0006 | 0.008c±0.001 |
| Ethyl tetradecanoate | n.f.a | 0.00174d±0.0003 | n.f.a | 0.0003c±0.0006 | 0.0002b±0.0009 | n.f.a | 0.0012cd±0.0001 | 0.0013d±0.0001 | 0.0007b±0.0001 | 0.0012bc±0.0001 |
| Ethyl hexadecanoate | 0.0021a±0.0003 | 0.0077e±0.0002 | 0.0051b±0.0002 | 0.0065d±0.0002 | 0.0059c±0.0002 | 0.0021a±0.0003 | 0.0027b±0.0001 | 0.007c±0.004 | 0.0030b±0.0006 | 0.0035b±0.0006 |
| Ethyl heptanoate | n.f.a | 0.006c±0.001 | 0.006c±0.002 | 0.007d±0.001 | 0.002b±0.001 | n.f.a | 0.009b±0.002 | 0.008b±0.003 | 0.028c±0.003 | 0.0094b±0.00004 |
| Ethyl 2-methyl octanoate | 0.0031a±0.0002 | 0.0041b±0.0003 | 0.0035ab±0.0003 | 0.0048b±0.0004 | 0.0048b±0.0006 | 0.0031a±0.0002 | 0.0044b±0.0002 | 0.0045ab±0.0001 | 0.0046b±0.0003 | 0.00370a±0.00002 |
| Ethyl propanoate | 0.187c±0.005 | 0.129b±0.003 | 0.173c±0.004 | 0.0687a±0.0002 | 0.130b±0.001 | 0.187ns±0.005 | 0.17ns±0.03 | 0.19ns±0.01 | 0.21ns±0.06 | 0.20ns±0.01 |
| Ethyl decanoate | 0.66d±0.01 | 0.56c±0.03 | 0.35b±0.02 | 0.67d±0.02 | 0.23a±0.01 | 0.66ns±0.01 | 0.65ns±0.02 | 0.64ns±0.03 | 0.69ns±0.01 | 0.5ns±0.2 |
| Ethyl butanoate | 2.18d±0.01 | 0.201a±0.002 | 0.32b±0.01 | 0.202a±0.002 | 0.41c±0.01 | 2.18a±0.01 | 0.26b±0.01 | 0.25bc±0.02 | 0.30c±0.01 | 0.29bc±0.01 |
| Ethyl hexanoate | n.f.a | 0.771b±0.002 | 0.86c±0.03 | 0.78b±0.01 | 0.85c±0.03 | n.f. | n.f. | n.f. | n.f. | n.f. |
| Ethyl lactate | n.f.a | n.f.a | 45c±2 | n.f.a | 31b±5 | n.f. | n.f. | n.f. | n.f. | n.f. |
| Ethyl octanoate | 2.799d±0.001 | 1.621b±0.002 | 1.5b±0.01 | 1.99c±0.03 | 1.26a±0.04 | 2.799b±0.001 | 2.2a±0.2 | 2.45ab±0.03 | 2.6b±0.2 | 2.1a±0.1 |
| Ethyl 2-methyl butanoate | n.f | n.f. | n.f. | n.f. | n.f. | n.f.a | 0.0161b±0.0001 | 0.0158b±0.0001 | 0.0163b±0.001 | 0.0221c±0.0002 |
| Ethyl 3-methyl butanoate | n.f. | n.f. | n.f. | n.f. | n.f. | n.f.a | 0.028b±0.001 | 0.026b±0.002 | 0.034c±0.001 | 0.036c±0.002 |
| G1 Strain | P29 Strain | |||||||||
|---|---|---|---|---|---|---|---|---|---|---|
| Protein content (mol%) | ||||||||||
| BW | MFP (−) | EFP (−) | MFP (+) | EFP (+) | BW | MFP (−) | EFP (−) | MFP (+) | EFP (+) | |
| Atf1p | n.f.a | n.f.a | 0.032b±0.005 | n.f.a | n.f.a | n.f.a | 0.004b±0.002 | n.f.a | n.f.a | n.f.a |
| Atf2p | n.f.a | n.f.a | n.f.a | 0.011b±0.003 | n.f.a | n.f. | n.f. | n.f. | n.f. | n.f. |
| Eht1p | 0.007b±0.001 | n.f.a | n.f.a | n.f.a | n.f.a | n.f.a | 0.022b±0.001 | n.f.a | n.f.a | n.f.a |
| Eeb1p | n.f. | n.f. | n.f. | n.f. | n.f. | 0.012b±0.004 | n.f.a | n.f.a | n.f.a | n.f.a |
| Iah1p | 0.033d±0.003 | 0.009b±0.001 | n.f.a | 0.022c±0.003 | n.f.a | 0.021d±0.001 | 0.018b±0.001 | 0.025e±0.002 | 0.0195c±0.0002 | n.f.a |
| G1 Strain | P29 Strain | |||||||||
|---|---|---|---|---|---|---|---|---|---|---|
| Concentration (mg/L) | ||||||||||
| BW | MFP (−) | EFP (−) | MFP (+) | EFP (+) | BW | MFP (−) | EFP (−) | MFP (+) | EFP (+) | |
| Hexanoic acid | 0.137a±0.005 | 0.203b±0.006 | 0.20b±0.02 | 0.26c±0.03 | 0.26c±0.01 | 0.137a±0.005 | n.f. | n.f. | n.f. | n.f. |
| Octanoic acid | 12.67a±0.06 | 18b±2 | 28cd±1 | 26c±1 | 28.4d±0.2 | 12.67a±0.06 | 31b±2 | 32b±1 | 31b±3 | 35b±2 |
| Decanoic acid | 0.91a±0.03 | 2.02b±0.01 | 2.7c±0.3 | 3.2d±0.1 | 3.22d±0.06 | 0.91a±0.03 | 3.2b±0.4 | 3.3b±0.4 | 3.0b±0.1 | 3.6b±0.5 |
| Tetradecanoic acid | 0.814a±0.002 | 0.93c±0.01 | 0.86b±0.01 | 0.871b±0.006 | 0.863b±0.003 | 0.814a±0.002 | 0.11a±0.03 | 0.17b±0.01 | 0.119a±0.004 | 0.1a±0.1 |
| Dodecanoic acid | n.f.a | 0.149c±0.001 | 0.125b±0.002 | 0.169d±0.006 | 0.119b±0.007 | n.f. | n.f. | n.f. | n.f. | n.f. |
© 2020 by the authors. Licensee MDPI, Basel, Switzerland. This article is an open access article distributed under the terms and conditions of the Creative Commons Attribution (CC BY) license (http://creativecommons.org/licenses/by/4.0/).
Share and Cite
González-Jiménez, M.d.C.; Moreno-García, J.; García-Martínez, T.; Moreno, J.J.; Puig-Pujol, A.; Capdevilla, F.; Mauricio, J.C. Differential Analysis of Proteins Involved in Ester Metabolism in two Saccharomyces cerevisiae Strains during the Second Fermentation in Sparkling Wine Elaboration. Microorganisms 2020, 8, 403. https://0-doi-org.brum.beds.ac.uk/10.3390/microorganisms8030403
González-Jiménez MdC, Moreno-García J, García-Martínez T, Moreno JJ, Puig-Pujol A, Capdevilla F, Mauricio JC. Differential Analysis of Proteins Involved in Ester Metabolism in two Saccharomyces cerevisiae Strains during the Second Fermentation in Sparkling Wine Elaboration. Microorganisms. 2020; 8(3):403. https://0-doi-org.brum.beds.ac.uk/10.3390/microorganisms8030403
Chicago/Turabian StyleGonzález-Jiménez, Maria del Carmen, Jaime Moreno-García, Teresa García-Martínez, Juan José Moreno, Anna Puig-Pujol, Fina Capdevilla, and Juan Carlos Mauricio. 2020. "Differential Analysis of Proteins Involved in Ester Metabolism in two Saccharomyces cerevisiae Strains during the Second Fermentation in Sparkling Wine Elaboration" Microorganisms 8, no. 3: 403. https://0-doi-org.brum.beds.ac.uk/10.3390/microorganisms8030403