Article

Whole Genome Sequencing and Comparative Genomic Analyses of Lysinibacillus pakistanensis LZH-9, a Halotolerant Strain with Excellent COD Removal Capability

1
School of Minerals Processing and Bioengineering, Central South University, Changsha 410083, China
2
Key Laboratory of Biometallurgy of Ministry of Education, Central South University, Changsha 410083, China
*
Author to whom correspondence should be addressed.
Submission received: 14 April 2020 / Revised: 7 May 2020 / Accepted: 8 May 2020 / Published: 12 May 2020
(This article belongs to the Special Issue Wastewater Microbiology)

Abstract

:
Halotolerant microorganisms are promising in bio-treatment of hypersaline industrial wastewater. Four halotolerant bacteria strains were isolated from wastewater treatment plant, of which a strain LZH-9 could grow in the presence of up to 14% (w/v) NaCl, and it removed 81.9% chemical oxygen demand (COD) at 96 h after optimization. Whole genome sequencing of Lysinibacillus pakistanensis LZH-9 and comparative genomic analysis revealed metabolic versatility of different species of Lysinibacillus, and abundant genes involved in xenobiotics biodegradation, resistance to toxic compound, and salinity were found in all tested species of Lysinibacillus, in which Horizontal Gene Transfer (HGT) contributed to the acquisition of many important properties of Lysinibacillus spp. such as toxic compound resistance and osmotic stress resistance as revealed by phylogenetic analyses. Besides, genome wide positive selection analyses revealed seven genes that contained adaptive mutations in Lysinibacillus spp., most of which were multifunctional. Further expression assessment with Codon Adaption Index (CAI) also reflected the high metabolic rate of L. pakistanensis to digest potential carbon or nitrogen sources in organic contaminants, which was closely linked with efficient COD removal ability of strain LZH-9. The high COD removal efficiency and halotolerance as well as genomic evidences suggested that L. pakistanensis LZH-9 was promising in treating hypersaline industrial wastewater.

1. Introduction

Hypersaline industrial wastewaters generated from processes, such as food production, petroleum refining, pharmaceutical manufacturing, printing, and dyeing, often contain large amounts of toxic compounds [1,2,3,4,5], most of which were recalcitrant to conventional biological treatment due to inhibition of salt and generally required expensive physico-chemical treatments to remove the salts as well as the organic matter [6]. Under this background, halophilic and halotolerant microorganisms with high chemical oxygen demand (COD) removal efficiency and the capability to convert hazardous compounds to relatively simple compounds, such as H2O, CO2, CH4, and NH3 under hypersaline conditions are of increasing interest in industrial wastewater treatment, which is also considered as more environmentally friendly and cost-effective in comparison with physicochemical treatment [7,8].
Members of the genus Lysinibacillus belonging to family Bacillaceae. Strains of Lysinibacillus were found in diverse environments [9,10,11], and it was reported that some strains of Lysinibacillus harbored degradation abilities towards various contaminants [12,13,14,15,16,17,18], and some other strains harbored toxic metal resistance and remove ability, as well as desulfurization and extracellular electron transfer capacity, showing potential for applications in biogeochemical redox processes and waste treatment [19,20,21,22]. Regarding COD removal ability, Lysinibacillus sp. RGS applied to decolorize mixture of dyes and actual industrial effluent showed 87% decolorization efficiency with 69% COD reduction at 48 h [23]. These studies emphasized the applicability of Lysinibacillus in the treatment of industrial wastewater; however, little research has been conducted to optimize the contaminant removal efficiency as well as explored the salt tolerance limit of Lysinibacillus spp. Evolutionary drivers, such as horizontal gene transfer (HGT) and natural selection, may contribute to adaptive evolution of Lysinibacillus genomes, whereas their relative contributions were still unexplored.
In this study, we isolated and identified four halotolerant strains from activated sludge of a hypersaline wastewater treatment plant, and we further investigated the COD removal efficiency of the halotolerant strain L. pakistanensis LZH-9 under various incubation times, pH, and NaCl concentration. Whole genome sequencing of L. pakistanensis LZH-9 and comparative genomic analyses of eight strains of the Lysinibacillus from six species was further carried out in order to shed light on the diverse metabolic abilities and stresses resistance of Lysinibacillus, and the mechanisms that strains of Lysinibacillus employed to degrade organic matter, in an effort to lay the theoretical foundations for detailed characterization of Lysinibacillus spp., as well as optimal culturing and scale applications of Lysinibacillus species in the wastewater treatment and other bioremediation aspect in the future.

2. Materials and Methods

2.1. Chemicals, Sampling, and Media

All of the chemicals were purchased from Sinopharm Chemical Reagent Co. Ltd., Shanghai, China, which included tryptone, yeast extract, NaCl, glucose, potassium bichromate, silver sulfate, and sulfuric acid. The activated sludge sample was obtained from the hypersaline pharmaceutical wastewater treatment plant in Changsha, China. The average temperature and pH value of the sample in this study was 21 °C and about 6.2 [24,25]. The latitude and longitude of our sampling location were 28.1355 and 113.0355, respectively. LB medium contained the following (g/L): tryptone, 10; yeast extract, 5; NaCl, 10. The pH of LB medium was adjusted to 7.0–7.2 before autoclaving at 121 °C for 20 min. Synthetic wastewater similar to the concentration of natural sewage was prepared, which was composed of (g/L) glucose, 0.17; soluble starch, 0.16; tryptone, 0.158; beef extract 0.06; KH2PO4, 0.07; (NH4)2SO4, 0.0284; NH4Cl, 0.0255; CH3COONa, 0.233; and, Na2CO3, 0.06. The pH of synthetic wastewater was adjusted to 5.5–6.0 before autoclaving at 115 °C for 30 min. The COD concentration of synthetic wastewater was approximately 800 mg/L.

2.2. Enrichment, Isolation and Identification of Halotolerant Bacteria

We suspended 0.1 g above-mentioned activated sludge sample with 10 mL sterile water. Subsequently, one milliliter supernatant was added to the LB medium and the salinity was adjusted to 5% (w/v) NaCl. The mixed solution was incubated at 30 °C in a shaker at 150 rpm. After three days, 0.5 mL of the solution was inoculated into the LB medium containing 10% (w/v) NaCl and the other conditions remained unchanged, and then cultured for six days. The above procedures were repeated until the final concentration of NaCl reached 15%. After the enrichment, the solution was serially diluted from 10−1 to 10−9, and then 0.5 mL of each diluted solution was added to petri dishes and daub uniformly. Four colonies with different morphology were obtained after multiple purifications, and then separately inoculated into LB medium for cultivation. Only the isolate with high COD removal efficiency and salt tolerance was further analyzed. Finally, the isolated strains were identified through 16S rRNA sequence analysis. The bacterial growth under various salt concentrations was observed through the measurement of the absorbance at 600 nm (OD600). The sample was examined on a field emission scanning electron microscope (SEM; Nova NanoSEM230, FEI, Hillsboro, OR, USA) after glutaraldehyde solution fixation, phosphate buffer rinsing, gradient ethanol solution dehydration, vacum freeze drying, and gold spray treatment in order to observe microbial morphology.

2.3. COD Removal Efficiency Experiments

We studied the removal percentage of COD of Lysinibacillus pakistanensis LZH-9 under various culture times (i.e., 1, 2, …, 7, 8 day), initial pH values (i.e., 5.0, 6.0, 7.0, 8.0, 9.0), and salt concentrations (i.e., 0, 1%, 2%, 3%, 4%, 5%) in order to obtain the optimal conditions for Lysinibacillus pakistanensis LZH-9 to remove COD. In these experiments, the amount of each bottle of culture solution was 150 mL and the tests were done in triplicate. The method of optimization was referring to previous reports [26,27], and the concentrations of COD were measured by using potassium dichromate method [28]. LZH-9 culture solution was inoculated to LB medium. Subsequently, LZH-9 was cultured for about 24 h until the OD600 taking up to 1.0 and the solution was used as seed solution. We inoculated 5% seed solution to the synthetic wastewater and then placed it on a shaker at 30 °C, 150 rpm. The initial pH was 7.0 and the NaCl concentration was 1% during the culture time tests. During the different pH tests, the NaCl concentration was 1%. The final removal efficiencies of COD in pH and NaCl concentration tests were only measured at the 96 h.

2.4. DNA Extraction, Genome Sequencing, Assembly and Annotation

Genomic DNA of Lysinibacillus pakistanensis LZH-9 was extracted using the Qiagen Genomic DNA Extraction Kit. After the DNA sample quality test was passed, the large fragment was subjected to gelatinization recovery applying BluePippin automatic nucleic acid recovery instrument; the DNA was damaged and repaired; after purification, the DNA fragments were end-repaired and linked with adenine. After purification, the linkers in the kit LSK108 (Oxford Nanopore Technologies, Oxford, United Kingdom) were used to perform the ligation reaction and, finally, qubit [29] was used to accurately quantify the constructed DNA library. After the DNA library was built, a certain concentration and volume of the DNA library was added to a flow cell, and the flow cell was transferred to the Nanopore GridION sequencer for real-time single molecule sequencing (Nextomics Biosciences Institute, Wuhan, China). Cutoffs including mean_qscore_template (>= 7) and sequence length (>= 1000 bp) were applied in order to carry out quality control on the raw data. The reads were first corrected and assembled with the Canu version 1.7 [30]. Pilon version 1.2 [31] was further applied to correct the sequencing errors with default parameters. The corrected genome was tested for circularization by in-house script. Circlator (parameter: fixstart) [32] was used to move the starting point of the sequence to the replication starting site of the genome after removing the redundant parts. After sequencing, the sample yield a total of 1,415,478,110 bp raw data, and the amount of data passed through the quality control was 1,343,227,710 bp. After assembling, correcting, and optimizing, the final genome consisted of a circular chromosome (5,038,663 bp) and a plasmid (66,276 bp) with a total size of 5,104,939 bp. The 16S rRNA sequences of strains LZH-9, LZH-13, LZH-22, and LZH-24 have been deposited at NCBI database under the accession numbers MN121313, MN121312, MN121253, and MN121251, respectively. The whole genome sequence of strain LZH-9 has been deposited at JGI IMG-ER database under the IMG Taxon OID 2823662158 and NCBI database under accession number CP045835-CP045836. Lysinibacillus pakistanensis LZH-9 was deposited in China Center for Type Culture Collection (CCTCC) and the accession number was CCTCC AB 2019361.

2.5. Average Nucleotide Identity (ANI) and Whole Genome Alignments

Pyani (https://pypi.org/project/pyani/) was used to calculate the average nucleotide identity (ANI) [33] based on Blast algorithm with default parameters. BlastN-based whole genome comparison of strains L. pakistanensis LZH-9, L. pakistanensis JCM 18776, L. contaminans DSM 25560, L. xylanilyticus t26, Lysinibacillus sp. UBA7518, L. sphaericus OT4b.31, L. mangiferihumi M-GX18, and L. parviboronicapiens VT1065 were performed and represented with BRIG-0.95 [34], and these strains were used as reference, respectively.

2.6. Pan-Genome Analyses and Models Extrapolation of Lysinibacillus

Table 2 lists a summary of features for the eight Lysinibacillus genomes involved in this study and BUSCO [35] was used to estimate the completeness of each genome against a bacterial core gene set. Gene family clustering followed by genome wide comparisons of eight Lysinibacillus representative strains, including L. pakistanensis LZH-9, L. pakistanensis JCM 18776, L. contaminans DSM 25560, L. xylanilyticus t26, Lysinibacillus sp. UBA7518, L. sphaericus OT4b.31, L. mangiferihumi M-GX18, and L. parviboronicapiens VT1065 together with UniProt search, GO Slim annotation, and GO enrichment analyses (default cutoff p-value is 0.05), were performed via OrthoVenn [36] with default parameters. Bacterial Pan Genome Analyses tool (BPGA) pipeline [37] was further used to perform models extrapolation of the Lysinibacillus pan/core-genome applying default parameters. The size of Lysinibacillus pan-genome was fitted into an power law regression function Ps = κnγ with a built-in program of BPGA [37], in which Ps was the total number of gene families, n was the number of tested strains, and γ stood for free parameters. In case of exponent γ < 0, then the pan-genome of Lysinibacillus was suggested to be ‘closed’ because the size of the pan-genome is relatively constant as an additional genome involved. On the contrary, the pan-genome was suggested to be ‘‘open’’ in case of 0 < γ < 1. In addition, the size of the core-genome of Lysinibacillus was fitting into an exponential decay function Fc = κcexp(-n/τc) with a built-in program of BPGA pipeline [37], in which Fc represented the number of core gene families, whereas κc, τc were free parameters.

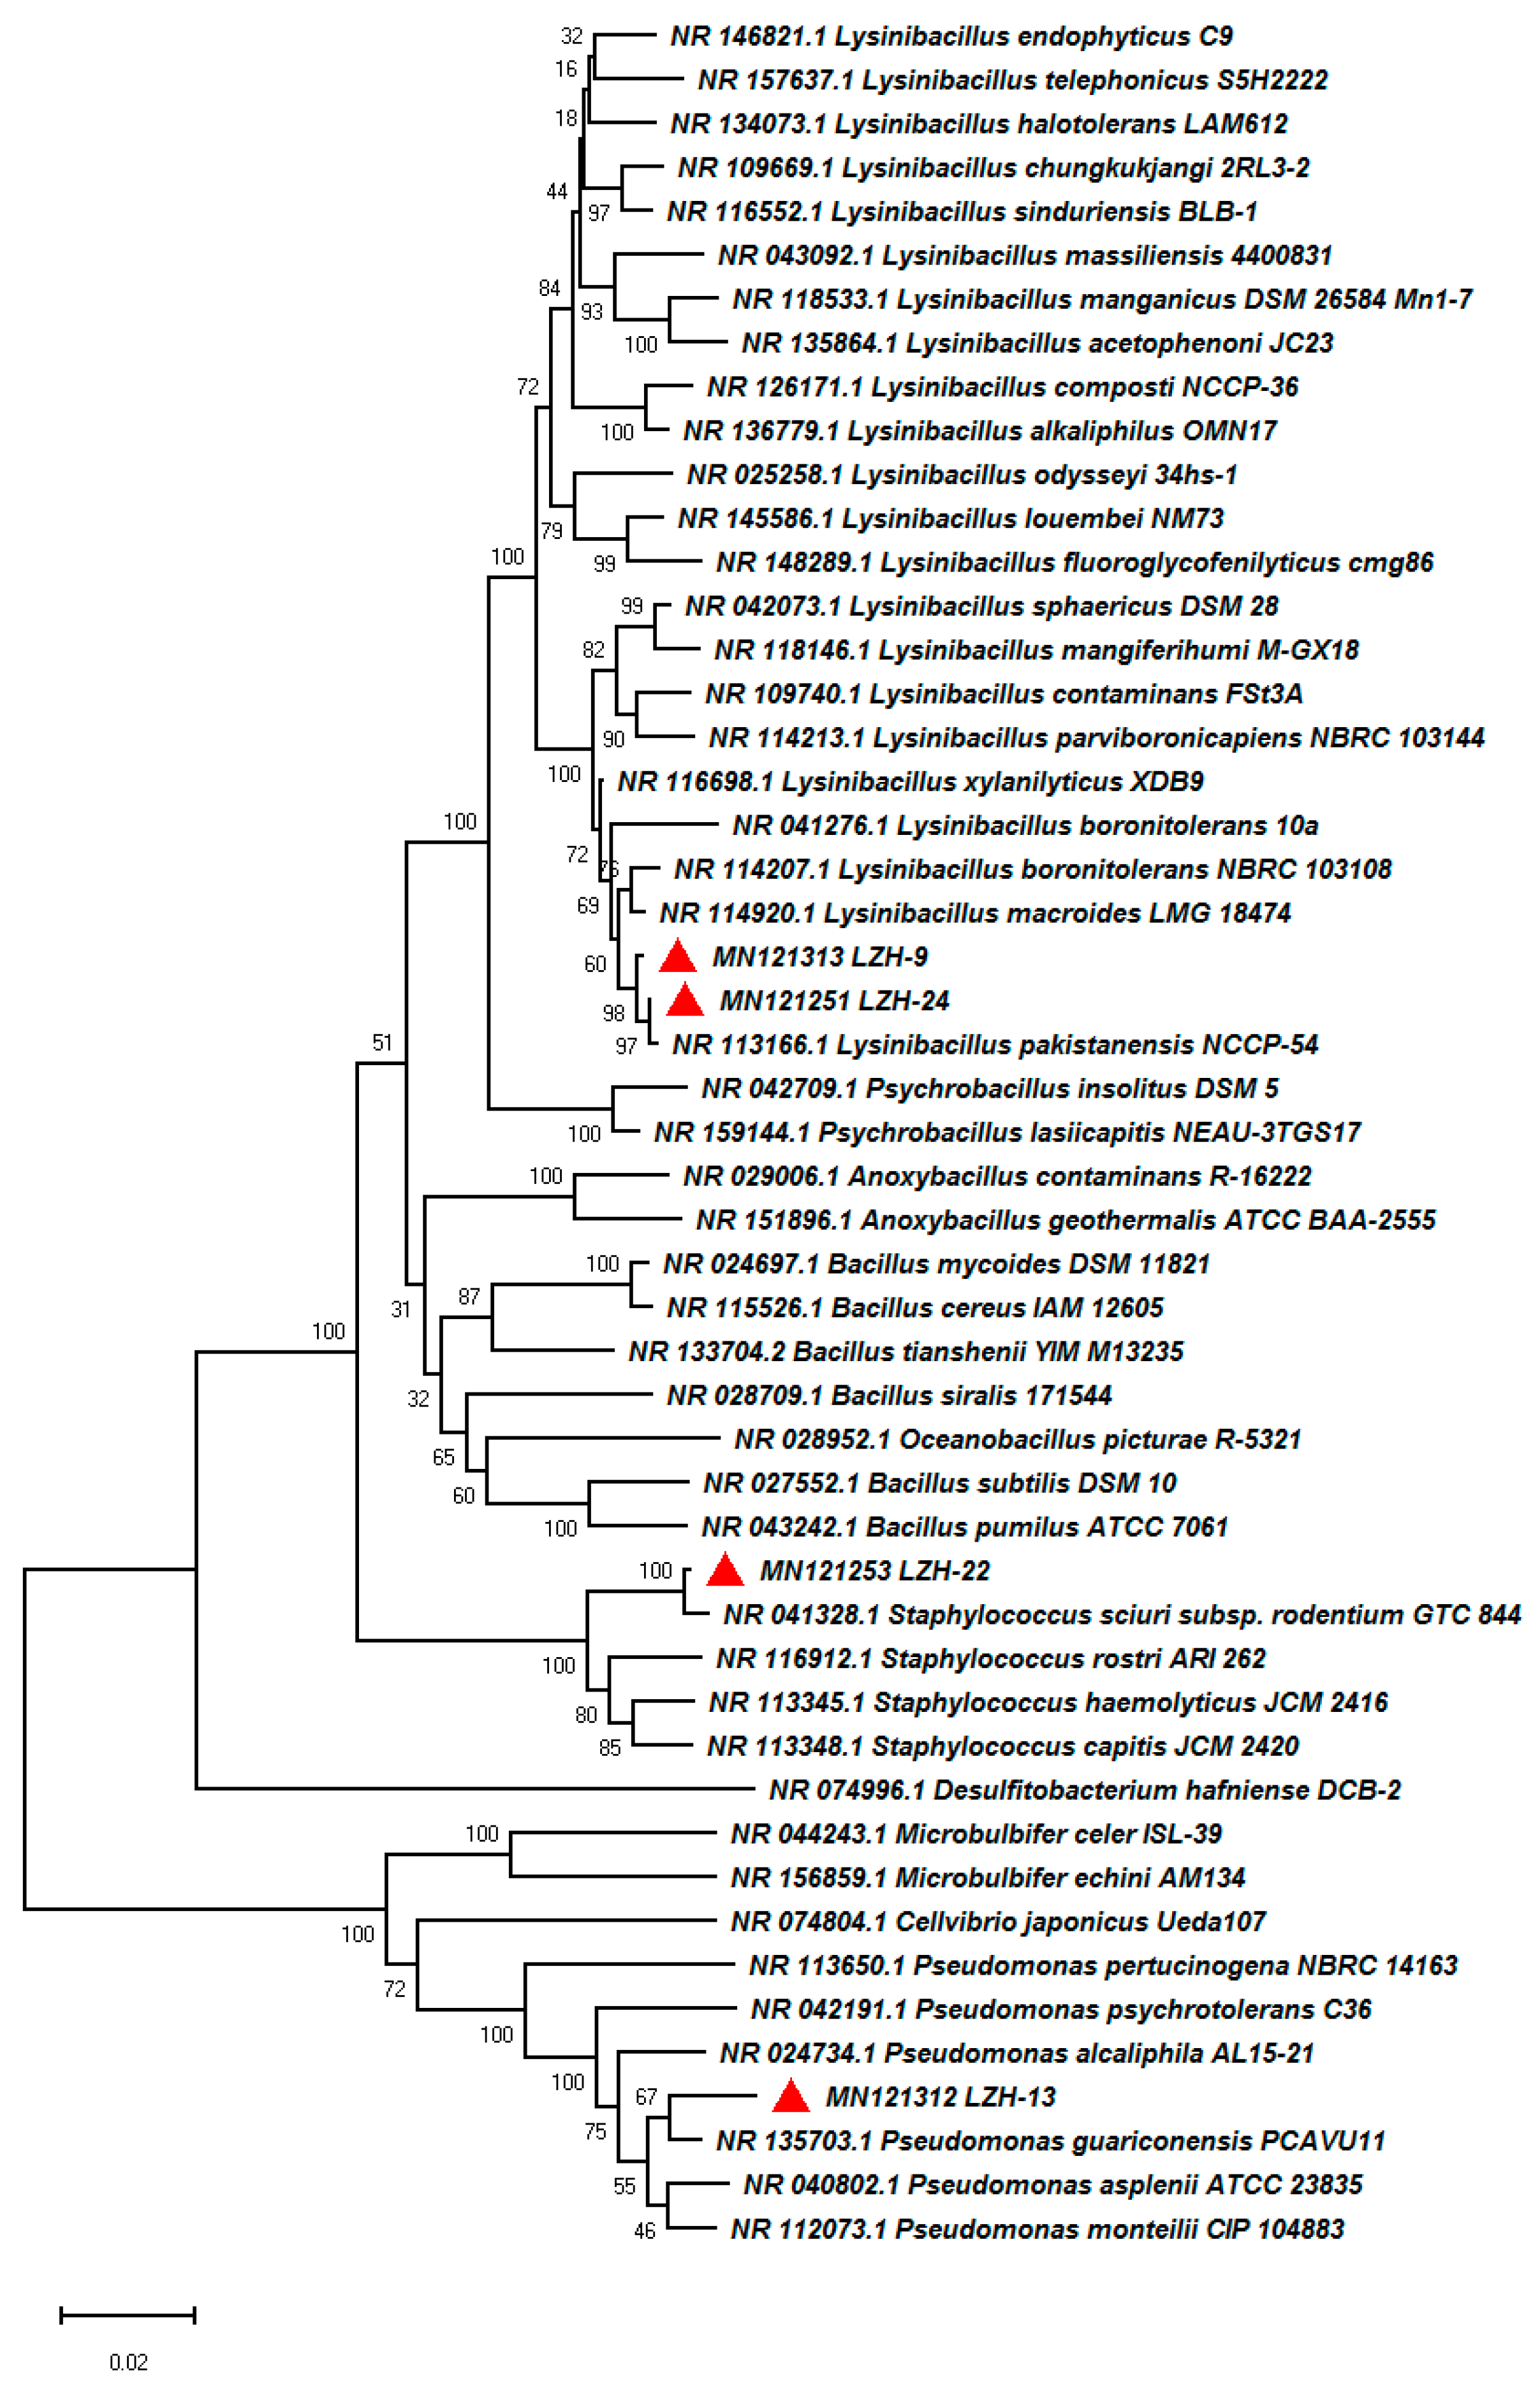
2.7. Phylogenic Analyses

Phylogenetic tree based on 16S rRNA sequences was constructed with the Neighbor-joining (NJ) method while using MEGA-X [38] with 1000 bootstrap replicates, and phylogenetic trees based on protein sequences of functional genes were constructed using PhyML [39] with the Maximum Likelihood (ML) method and 1000 bootstrap replicates, followed by visualization with iTOL [40], and the sequences were aligned with Muscle [41], and then trimmed with Gblocks [42] while applying a “less stringent” option before tree construction.

2.8. Genome Annotation

We applied Rapid Annotation using Subsystem Technology server (RAST) with the “ClassicRAST annotation” scheme [43] and IMG Annotation Pipeline v.5.0.1 [44] as well as KEGG [45] and COG [46] databases for genome annotation. We identified genes that were associated with carbohydrate activity (CAZymes), genes encoding cytochrome P450, and peptidases in Lysinibacillus genomes by performing Diamond BlastP [47] against the dbCAN database [48], cytochrome P450 Database [49], and MEROPS database [50], respectively, with cutoff e-value of 1e−5, identity 30%, and coverage 70%. Genome neighbor (context) visualization was conducted with EFI-GNT tool [51].

2.9. Prediction of Mobile Genetic Elements

We applied the ISFinder [52] to predict and classify insertion sequences (IS) and transposases within Lysinibacillus genomes with Blastp (cutoff e-value 1e−5). We applied the IslandViewer 4 [53] to detect putative genomic islands (GIs) that were distributed over Lysinibacillus genomes. We applied PHASTER (Phage Search Tool Enhanced Release) [54] for detection and annotation of prophage and prophage remnant sequences within Lysinibacillus genomes. We also applied CrisprCasFinder [55] for detection of CRISPRs and Cas genes within Lysinibacillus genomes. Correlation coefficients (Rs) and two-sided p values were obtained by applying Spearman rank correlation analysis (https://www.wessa.net/rwasp_spearman.wasp/).

2.10. Genome-wide Detection of Positively Selected Genes and Codon Adaption Index (CAI) Calculation

Comparisons of non-synonymous (dN) to synonymous (dS) substitution rate (as ω = dN/dS) have been widely applied in order to figure out whether the mutations that change the amino acid (dN) in a specific position are adaptive (ω > 1, positive selection), deleterious (ω < 1, negative selection) or neutral (ω = 1, neutral evolution), and we used PosiGene pipeline [56] for genome-wide detection of positively selected genes in above-mentioned genomes of Lysinibacillus spp. (Table 2), in which L. pakistanensis LZH-9 was used as the anchor, reference, and target species. Genes were considered to be PSGs if the branch-wide test resulted in a false discovery rate (FDR) of <0.05 and an adjusted p value of <0.05. We used CAI as a numerical estimator of gene expression level. We used CAIcal [57] in order to calculate CAI values of genes of above-mentioned strains. PCoA based on Bray-Curtis distance was performed with Origin Pro 2017 software (OriginLab, Northampton, MA, USA)

3. Results and Discussion

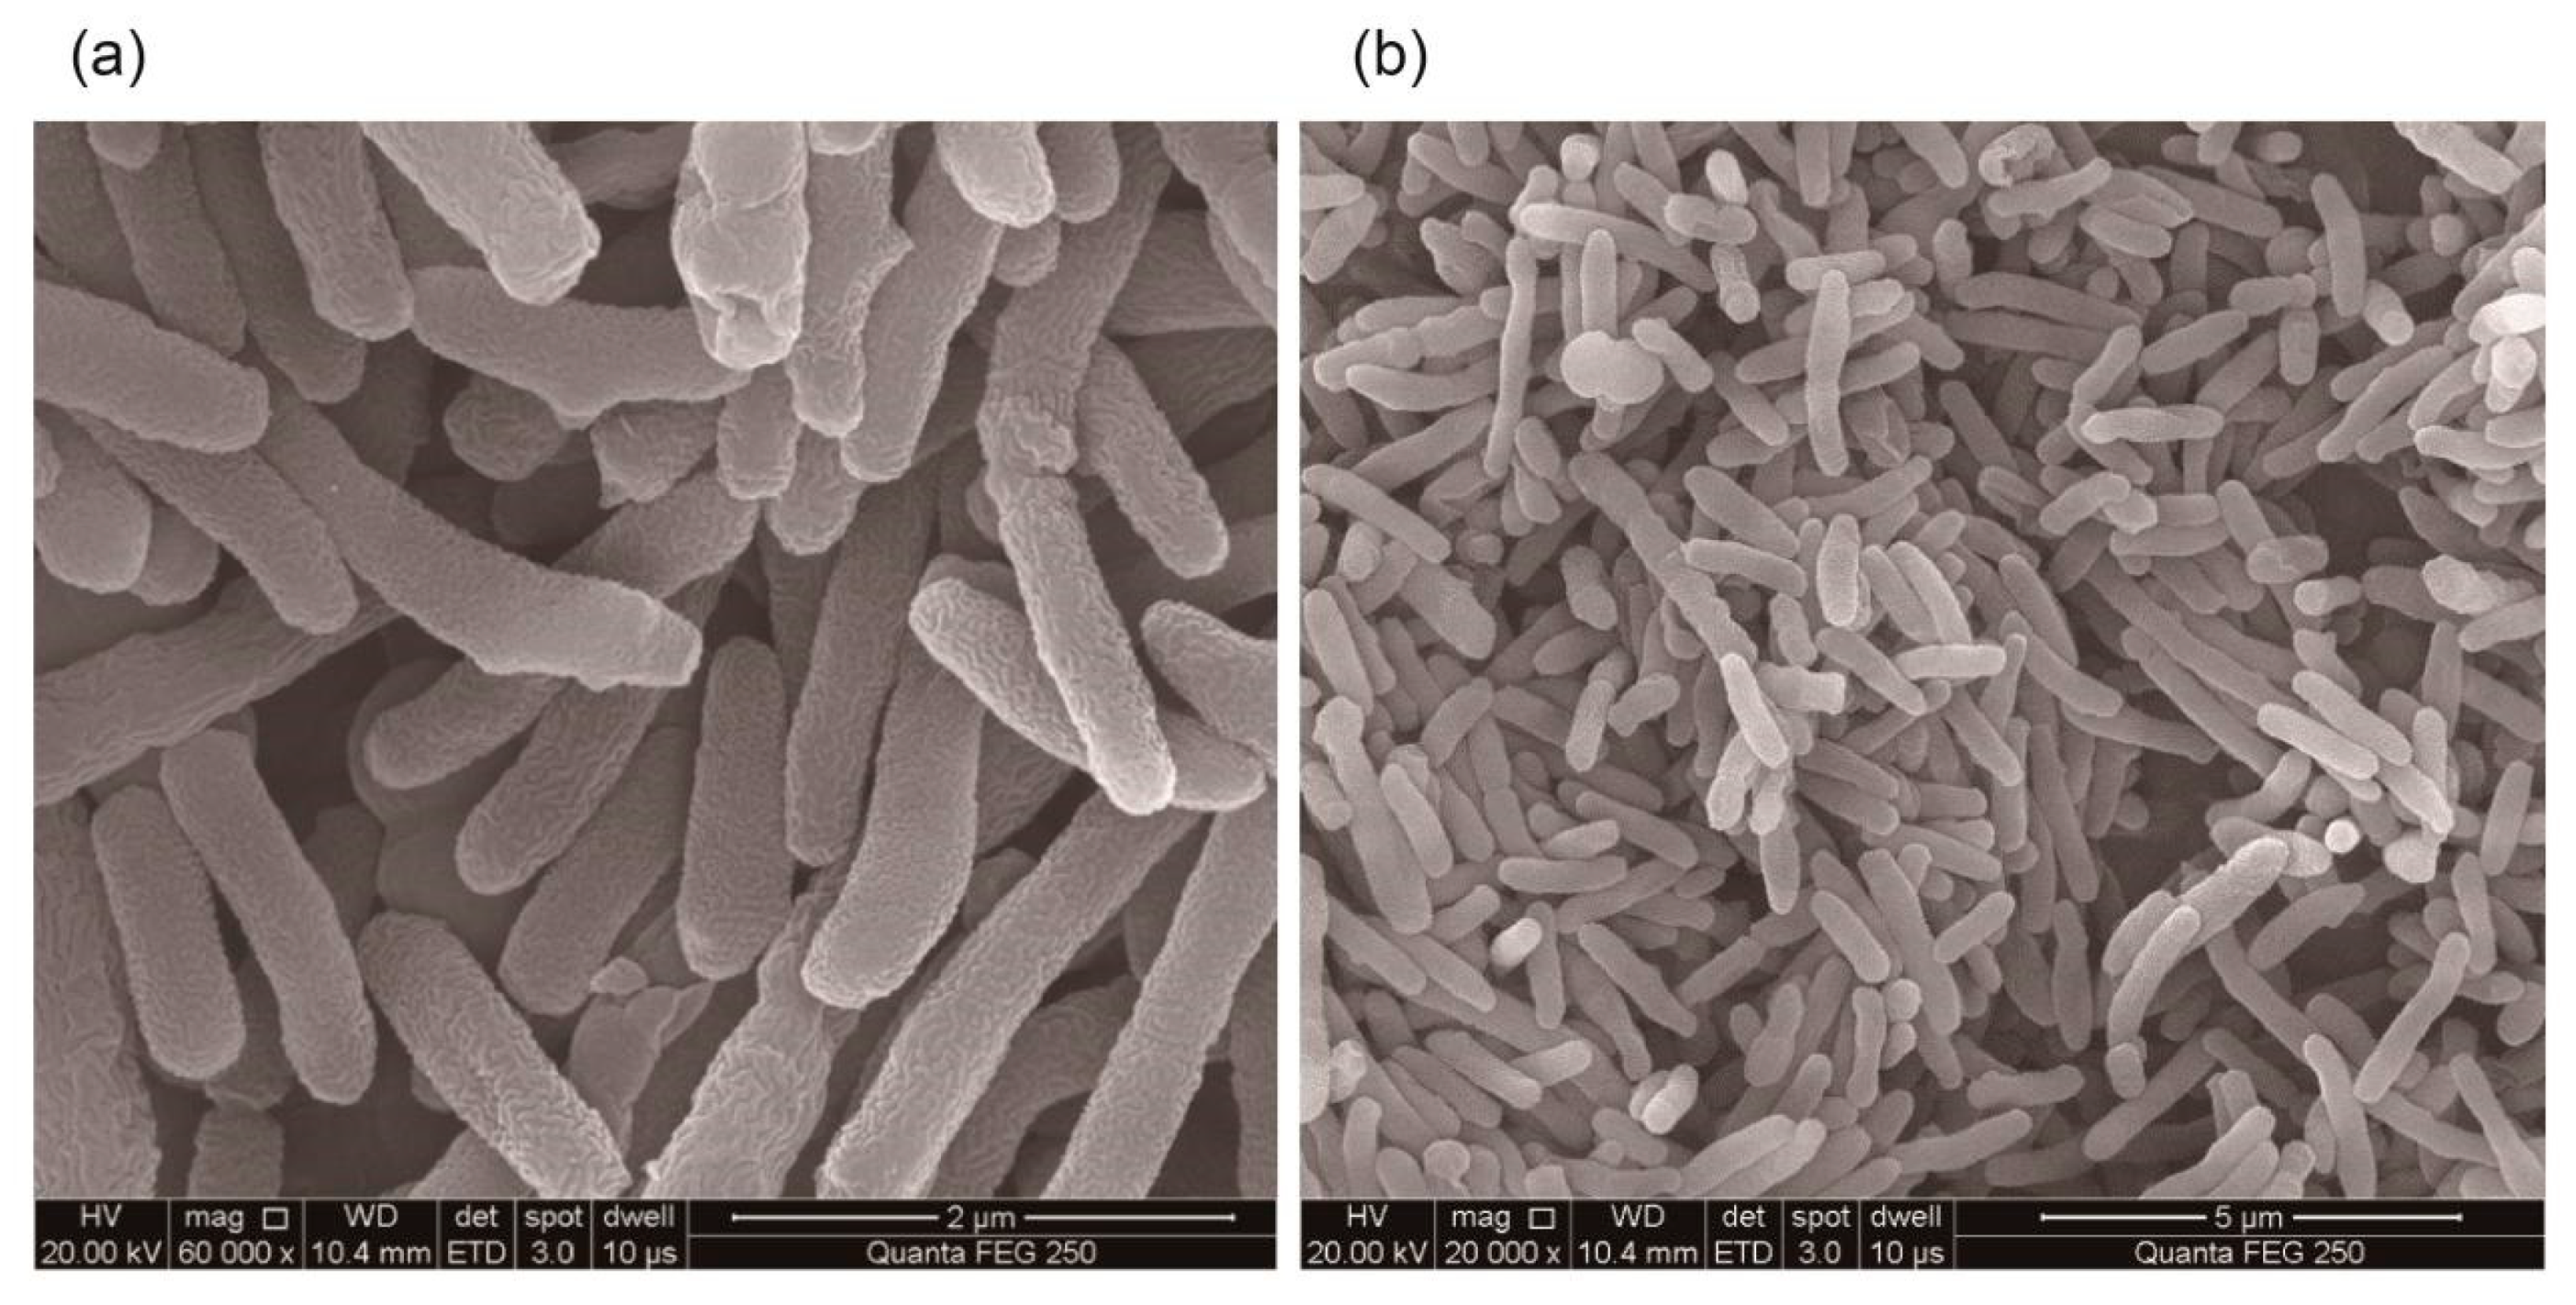
3.1. Isolation and Identification of Halotolerant Bacteria

After enrichment, isolation, and purification, four strains LZH-9, LZH-13, LZH-22, and LZH-24 were obtained and phylogenetic analysis based on 16S rRNA sequences was conducted (Figure 1). All of the strains were capable of removing COD, and strain LZH-9 was selected for further optimization and analyses, since it possessed the highest COD removal efficiency 69.8% (Table 1). The colony of strain LZH-9 on LB (Lysogeny broth) solid medium was light yellow, smooth, moist, with neat edges, and as seen under a scanning electron microscope, strain LZH-9 has rod shape and folded surface with a size of ~0.4 μm × (1.5–3) μm (Figure 2). Notably, strain LZH-9 could grow in the presence of up to 14% (w/v) NaCl (Figure 3a).

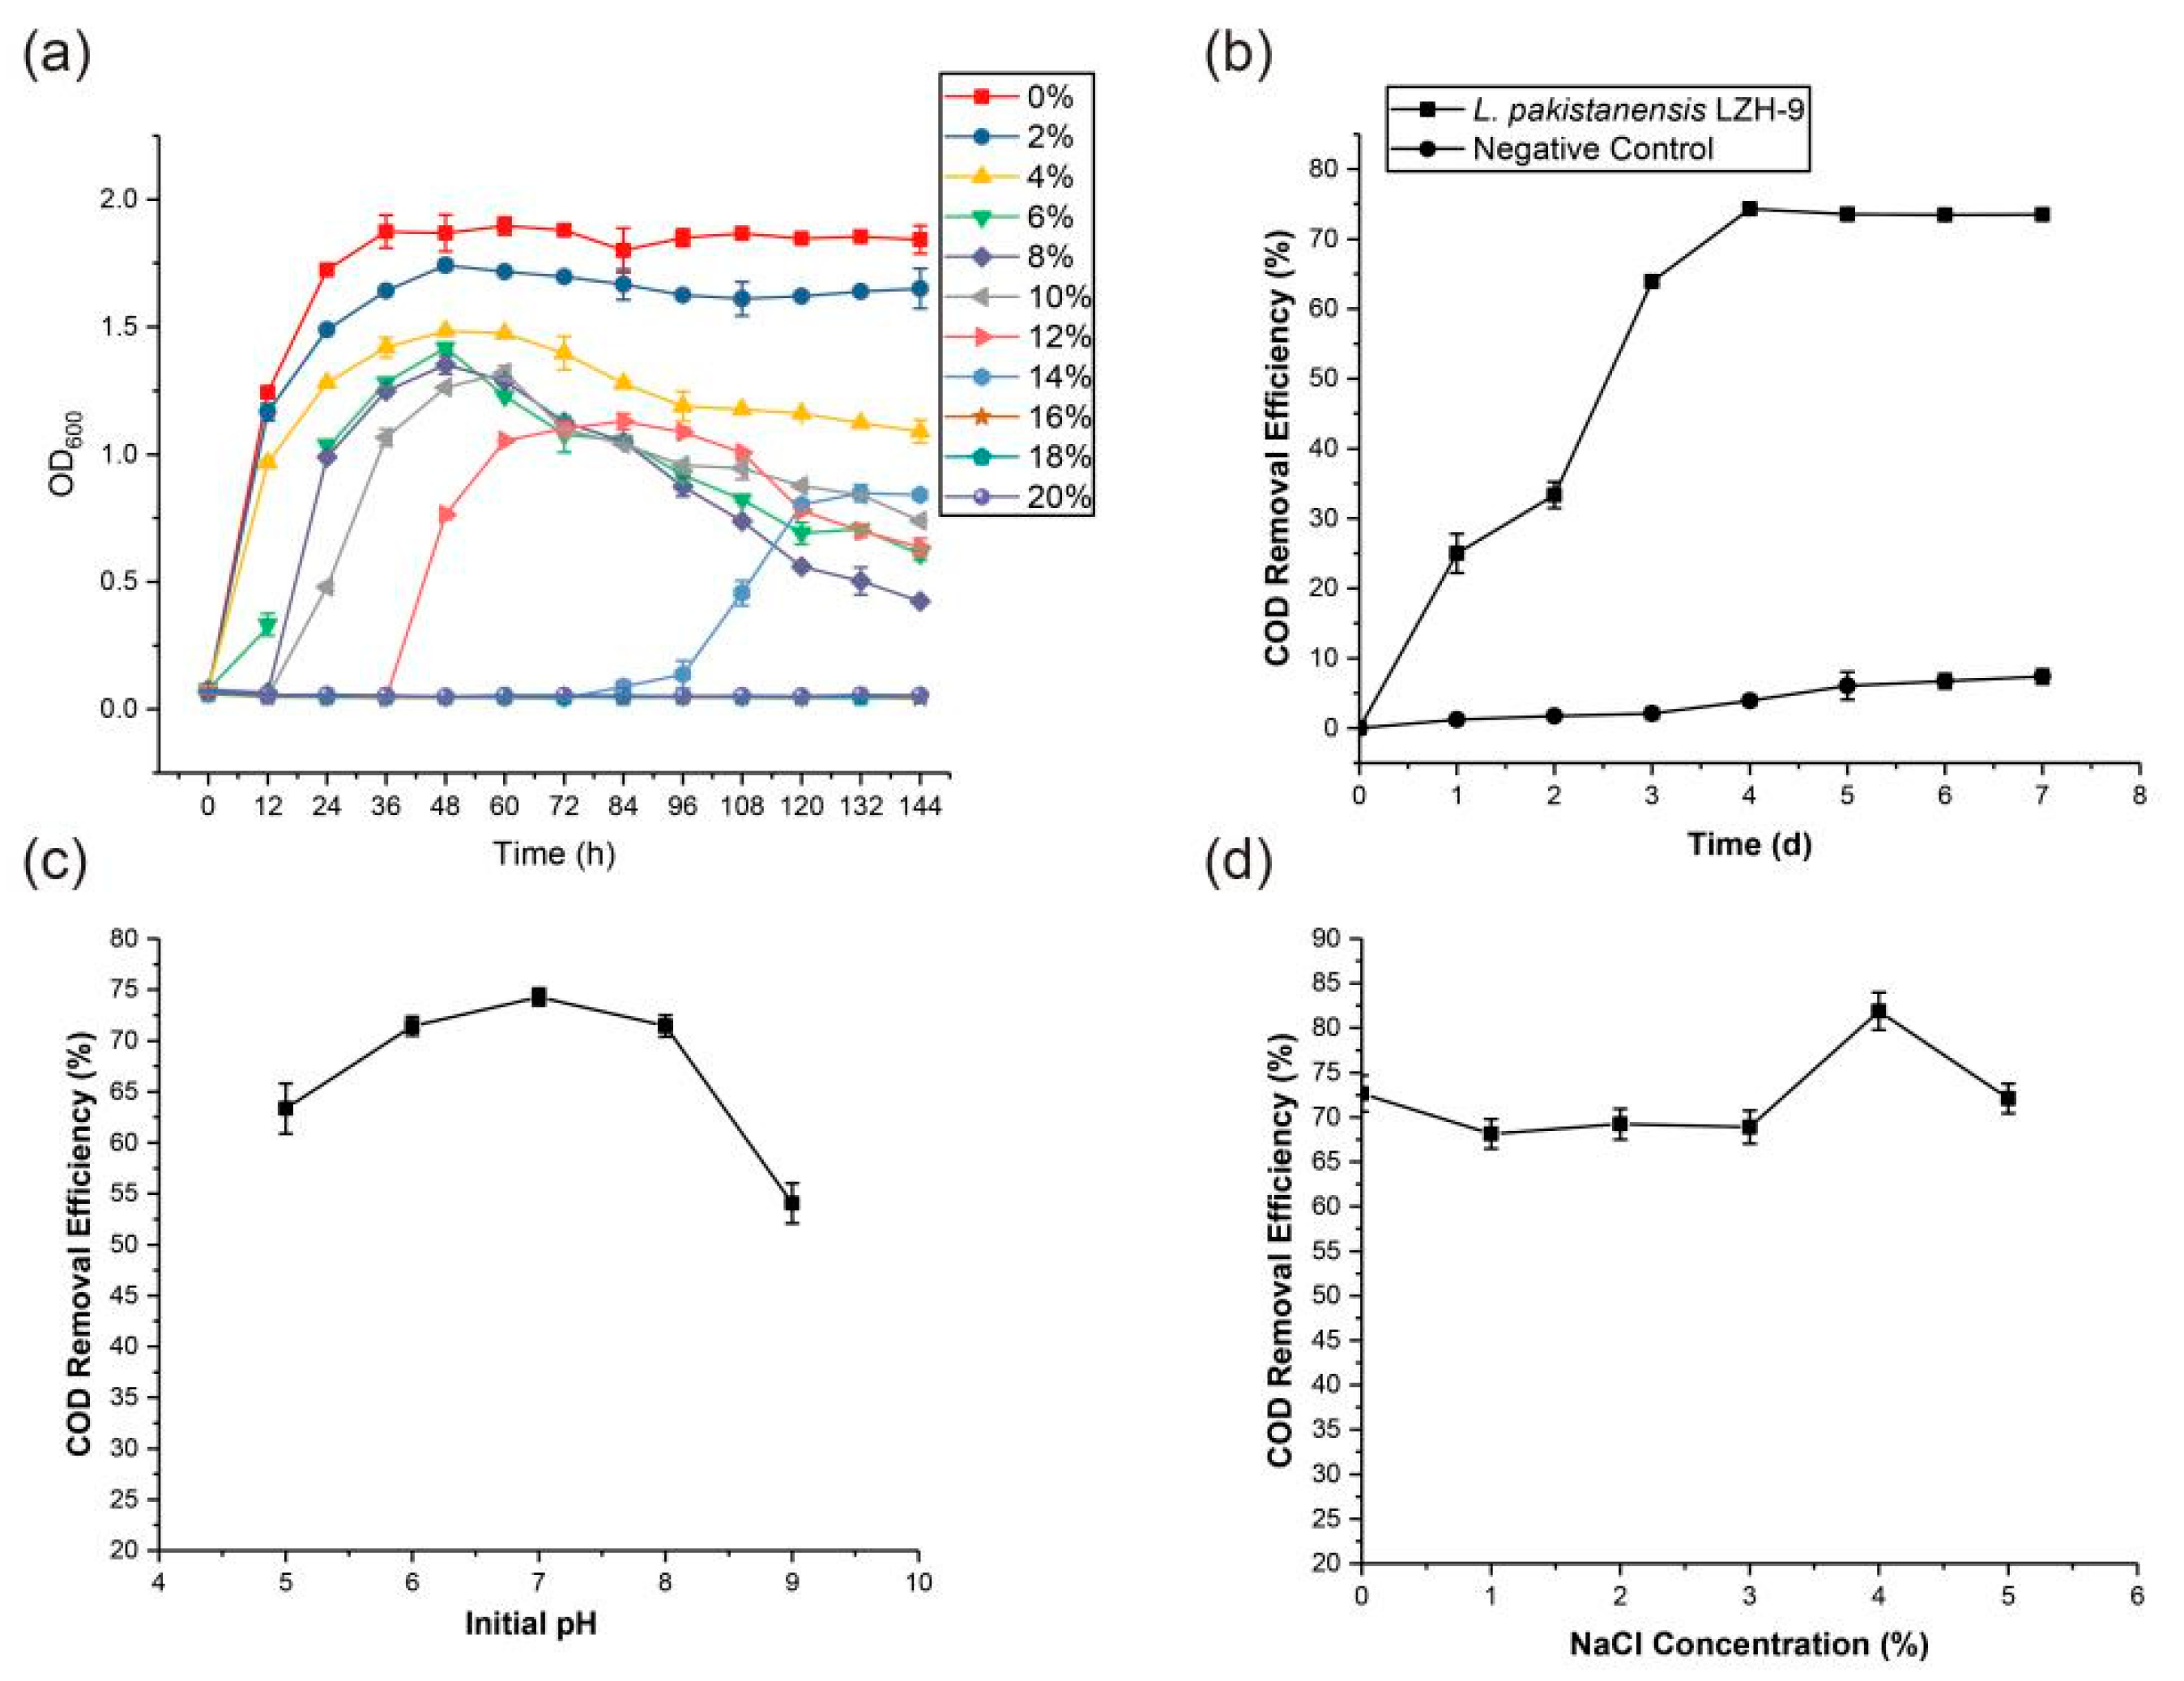
3.2. Optimization of COD Removal Efficiency with Strain LZH-9

The removal efficiency of COD increased largely during the first 96 h and it reached 74.3% at 96 h (Figure 3b). With the pH increasing from 5.0 to 7.0, the removal of COD consistently increased and reached the maximum value at pH 7.0 (Figure 3c), whereas, with initial pH increasing from 7.0 to 9.0, the COD removal percentage decreased from 74.3% to 54.1%. It was concluded that with increasing of initial pH, COD removal percentage showed a trend of first increase, followed by decrease.
Osmotic pressure that is caused by saline concentrations (>1% salt) would cause plasmolysis or loss of biological activity in microbes [58]. It was reported that the COD removal efficiency of wastewater with rotating biological disc system fell from 85% to 59% when salinity increased from 0 to 5%, and the COD removal efficiency would decrease to below 80% when the salt concentration was over 50 g/L in Fed-Batch Operation [58,59]. In this study, we found that strain LZH-9 had a maximal salt tolerance of 14% (w/v) NaCl, higher than that of L. halotolerans LAM612T, which could resist up to 10% (w/v) NaCl [18], and LZH-9 presented the highest salt tolerance amongst reported strains of genus Lysinibacillus thus far. Of synthetic wastewater with NaCl concentration lower than 5%, the COD removal efficiency varied from 68.1% to 81.9% at 96 h (Figure 3d), whereas with a NaCl concentration higher than 5%, the COD removal efficiency fell below 60.0%. These results suggested that the strain LZH-9 could remove COD in high salt conditions (1%–5% NaCl). Kubo at el. [3] isolated two salt-tolerant bacteria (resisted up to 15% NaCl), in a mixed culture with both strains the COD removal efficiency was approximately 70% for 72 h in a flask, and it increased to about 90% when they were applied in a pilot plant (working volume 1m3) for 7 d. Mehdi Ahmadi at el. [2] isolated three salt-tolerant bacteria and observed that the COD removal efficiency was 78.7%–61.5% in the treatment of real saline wastewater with a decreasing trend along with increasing of the organic loading rate. Comparatively, strain LZH-9 was among the most efficient COD removal bacteria, illustrating notable potential as a microorganism resource for the bio-treatment of hypersaline wastewater.

3.3. Genomic Features

The genome of LZH-9 consisted of a circular chromosome (5,038,663 bp) and a plasmid (66,276 bp) with a total size of 5,104,939 bp. A total of 5263 CDS including 108 tRNA and 34 rRNA were predicted in the complete genome of strain LZH-9 while using IMG Annotation Pipeline v.5.0.1 [44]. Whole genome BLASTN-based average nucleotide identity (ANI) analyses showed that strain LZH-9 had ANI values that were above the cutoff (96%) with strains L. pakistanensis JCM 18,776 (99.0%) and Lysinibacillus sp. UBA7518 (96.8%) (Figure S1), thus these three strains were classified into the specie L. pakistanensis. We also chose five other genome of Lysinibacillus spp. that were phylogenetically close with strain LZH-9 from public database, and a summary of features for the eight Lysinibacillus genomes involved in comparative study were listed in Table 2. The G+C contents of the 8 genomes ranged from 36.3% to 37.8%. These genomes varied in coding density from 71.5% to 83.7%. In addition, whole genome comparison of Lysinibacillus spp. while using BLAST Ring Image Generator (BRIG) revealed that genome of strain LZH-9 was rather conserved amongst the species L. pakistanensis showing high similarity, whereas many short non-common-shared genomic regions were also found in each Lysinibacillus genome, most of which harbored poorly characterized proteins (Figures S2 and S3).

3.4. Core and Pan-genome of Lysinibacillus

The pan-genome three strains of L. pakistanensis possessed 4427 gene families, whereas core genome possessed 2847 gene families accounting for 64.3% of all gene families (Figure 4). Clusters of Orthologous Groups (COG) annotation of the pan-genome of three L. pakistanensis strains revealed that the core genome had a higher proportion of genes in COG [J] [F] [O] [U] [E] [D] [C] [H] and [N] associating with basic biological function linking with ribosome, nucleotide, translation, amino acid, division, energy, and motility in comparison with accessory genome and strain-specific genes, whereas the accessory genome had a higher proportion of genes related to COG [T] [K] [V] [I] associating with transcription, signal transduction, defense, and lipid metabolism, and strain-specific genes had a higher proportion of genes that were categorized into COG [L], [M], [P], and [G] and [Q] (Figure S4). In addition, Gene Ontology (GO) enrichment analyses showed that functions significantly enriched (p-value < 0.05) in strain-specific gene families of L. pakistanensis LZH-9 were mostly related to metabolic process of sucrose and protein (Figure 4).
The pan-genome analyses of six strains from six different Lysinibacillus species showed that 2182 (41.4%) out of total 5272 genes families were shared by all tested strains (Figure 5). Additionally, L. pakistanensis LZH-9 had the most genes families (4097) in its genome. Mathematical modeling revealed a ‘‘open’’ pan genome fitted into a power law regression function [Ps (n) = 4276.74n0.444721] with a parameter (γ) of 0.444721 falling into the range 0 < γ < 1, whereas core genome was fitted into an exponential regression [Fc (n) = 4475.34e−0.177936n] (Figure S5). COG annotation showed that core genome had a higher proportion of genes that were involved in COG [J] [F] [O] [U] [E] [D] [C] [H] and [I], associating with central biological function than accessory genome and unique genes, whereas the accessory genome contained a higher proportion of genes related to COG [T] [P], and the unique genes had a higher proportion of genes categorized into COG [V] [Q] [M] [K] [L] [G] (Figure S6). GO enrichment analyses showed that the only GO term significantly enriched (p-value < 0.05) in core genome was glycolytic process (Table S1), reflecting the considerable catabolic capability of carbohydrate of Lysinibacillus. Additionally, functions significantly enriched (p-value < 0.05) in accessory genome and strain-specific gene families were mostly related to substrate transport, signal transduction and regulation, catabolic process of various carbon source, diverse nitrogen source, metabolic process of antibiotics and other toxic compounds, which in a way reflected that these Lysinibacillus strains harbored potential for biodegradation application, in consideration of the above-mentioned enriched catabolism related pathways.

3.5. Functional Potential and Phylogenetic Analyses

3.5.1. Carbon Metabolism

Central carbohydrate metabolism including the glycolysis and gluconeogenesis, oxidative tricarboxylic acid cycle (TCA), pentose phosphate pathway (PPP), glyoxylate bypass, acetogenesis, methylglyoxal metabolism, and genes involved in metabolism of organic acids glycerate and lactate were found in all tested genomes of Lysinibacillus. Genes that were involved in biosynthesis of butanol, butyrate, acetolactate, metabolism of acetoin, butanediol, glycerol, and utilization of chitin and N-acetylglucosamine were also present in all tested genomes, and genes related to ethanolamine metabolism were present in all of the tested genomes, except for L. contaminans DSM 25560. Genes that were related to metabolism of monosaccharides, such as D-ribose, deoxyribose, and deoxynucleoside, D-gluconate and ketogluconates were also detected in all of the tested genomes, and genes related to mannose metabolism were present in all tested genomes except for L. xylanilyticus t26. Phylogenetic analyses indicated that genes encoding mannose-6-phosphate isomerase, gluconate 2-dehydrogenase, ribokinase of Lysinibacillus spp. involved in the metabolism of mannose, D-gluconate, and ketogluconates, and PPP, respectively, were likely acquired via cross-family gene exchange or HGT events from Planococcaceae or Paenibacillaceae, and genes encoding glycerophosphodiester phosphodiesterase of Lysinibacillus involved in glycerol metabolism were likely acquired via cross-order HGT from Lactobacillales (Figures S7–S10). Annotation against dbCAN (database of carbohydrate-active enzyme) [48] also revealed that Lysinibacillus spp. harbored an abundant repertoire of carbohydrate active enzymes (CAZymes), including carbohydrate esterases (CEs), carbohydrate binding molecules (CBMs), glycosyltransferases (GTs), glycoside hydrolases (GHs), auxiliary activities (AAs), and a small number of polysaccharide lyases (PLs), of which GTs were most abundant, and strain L. pakistanensis JCM 18,776 possessed the most carbohydrate active enzymes (Figure 6). All of these enzymes involved in carbon metabolism are closely linked with the COD removal ability of Lysinibacillus, through which carbohydrate-containing contaminants can be consumed by microbes while supplying energy for microbes at the same time.

3.5.2. Nitrogen and Sulfur Metabolism

Nitrogen- and sulfur-containing contaminants also contribute to COD concentrations. We found in all tested genomes of Lysinibacillus genes encoding nitric oxide synthases that helped to oxidize L-arginine to nitric oxide (NO), which might protect the bacteria against oxidative stress [61,62], and nitric oxide dioxygenases encoded by hmp genes that oxidized nitric oxide to nitrate. Genes encoding nitrilase that catabolized organic nitrogen sources to produce ammonia were found in the genomes of L. contaminans DSM 25,560 and L. sphaericus OT4b.31. Gene clusters encoding urease composed of the functional subunits (ureAB and ureC) and accessory proteins (ureD, ureE, ureF, and ureG) that converted urea into molecule ammonia and carbon dioxide [63] were only found in L. parviboronicapiens VT1065 and L. sphaericus OT4b.31. Additionally, genes encoding ammonium transporter, glutamate dehydrogenase, glutamine synthetase, and carbamoyl-phosphate synthase were found in all of the tested genomes of Lysinibacillus, through which enzymes a series of important biosynthesis reactions were carried out with ammonia as entry. However, denitrifying reductase genes were missing in all the tested genomes of Lysinibacillus. Genes encoding sulfate and thiosulfate permease, sulfate adenylyltransferase, adenylyl-sulfate reductase, phosphoadenylyl-sulfate reductase, and assimilatory sulfite reductase involved in reversible assimilatory sulfate reduction or indirect sulfite oxidation were also found in all the tested genomes of Lysinibacillus. It seemed that utilizations of ammonia, organic nitrogen sources, and sulfate for growth were the main strategies of tested Lysinibacillus spp.

3.5.3. Energy Conservation and Transduction

All of the tested genomes of Lysinibacillus contained gene clusters qcrABC involved in the synthesis of menaquinone cytochrome c reductase complexes functioned preferentially under anaerobic to microaerobic conditions, which coupled the transfer of electrons from quinol in the membrane to c-type cytochrome [64,65]. The succinate:quinone oxidoreductase (complex II) that linked the TCA cycle to the quinone pool [66], cytochrome c oxidases (complex IV) that transferred electrons from cytochrome c to oxygen [67], and oxygen-reducing bd-type oxidase encoded by cydAB genes were also present in all of the tested genomes. In addition, genes encoding NADH:quinone oxidoreductase (complex I) were not detected.

3.6. Environmental Adaption

3.6.1. Resistance to Antibiotics and Toxic Metals

Genes that were involved in vancomycin resistance, such as vanW encoding vancomycin B-type resistance proteins, were present in all tested genomes of Lysinibacillus, acquired likely via cross-family HGT events (Figure S11), whereas vanRS encoding related two-component signal transduction systems [68,69] were found in all the tested genomes of Lysinibacillus, except for L. contaminans, and L. mangiferihumi, acquired likely via cross-class HGT events from members of Clostridiales (Figures S12 and S13). Genes fosB that encoding fosfomycin resistance protein [70], tetracycline resistance genes tet(M) and tet(O) encoding paralogs of the translational GTPase, the elongation factor EF-G were present in all of the tested genomes, through which tetracycline was actively removed from the ribosome of bacteria [71,72], and phylogenetic analyses suggested that fosB genes of Lysinibacillus were likely acquired via cross-family gene exchange or HGT events (Figure S14). Genes encoding aminoglycoside adenylyltransferases that adenylated streptomycin and spectinomycin [73] were present in all of the tested genomes, except for L. contaminans DSM 25,560 and L. sphaericus OT4b.31, whereas genes satA encoding N-acetyltransferases that inactivated streptothricin via acetyl-CoA-dependent lysine acetylation [74,75] were only found in strains of L. pakistanensis and strain L. xylanilyticus t26, likely acquired via cross-order HGT (Figure S15). Genes encoding beta-lactamases involved in resistance to beta-lactam antibiotics were present in all tested genomes, except for L. contaminans DSM 25560, acquired probably via cross-class HGT from members of Clostridiales or Tissierellales (Figure S16). Gene clusters bceRSAB and yvcSRQP encoding bacitracin export systems that are involved in responses and resistance to bacitracin [76,77,78] and genes cbrC encoding colicin E2 tolerance protein [79] were only present in the strains of L. pakistanensis and strains L. xylanilyticus t26, L. sphaericus OT4b.31, which were probably acquired via cross-order HGT from Clostridiales (Figure S17). As for resistance to heavy metals, we found that genes chrA encoding chromate transport proteins were present in all of the tested genomes, except for L. contaminans DSM 25560. Arsenic resistance genes arsC encoding arsenate reductases that converted arsenate to arsenite and arsM encoding arsenic methyltransferases that converted inorganic arsenic into volatile derivatives were present in all the tested genomes of Lysinibacillus. Arsenite can then be expelled from the cells by arsenite efflux pump encoded by acr3 or arsB of Lysinibacillus spp., which were probably acquired via cross-family HGT events (Figures S18–S20), and acr3 were present in all tested genomes of Lysinibacillus. Gene clusters which involved in efflux of divalent heavy metal cations including cadAC that encoded putative ATP-dependent efflux systems and genes czcD encoding cation diffusion facilitator (CDF) proteins were also present in all of the tested genomes of Lysinibacillus, both of which were acquired likely via cross-family HGT events (Figures S21–S23) [80,81]. Genes copA encoding copper-translocating P-type ATPase that transported Cu(I) ions from the cytosol to the periplasm were also present in all tested genomes. All of these genes may confer Lysinibacillus spp. resistance to toxic compound, such as antibiotics and heavy metal ions in polluted water, or other environmental contaminants, enhancing their environmental adaptivity and bioremediation ability.

3.6.2. Capsular and Extracellular Polysacchrides

Capsular and extracellular polysacchrides (EPS) play important roles in cell adhesion and biofilm formation, which is closely related to the colonization, biodegradation, desiccation, and toxic compound resistance of bacteria [82,83,84,85]. Gene clusters rfbABCD-wbbL encoding proteins that converted glucose-1-phosphate to the EPS precursor d-TDP-rhamnose were detected in the strains L. pakistanensis JCM 18,776 and L. contaminans DSM 25,560 [86,87], whereas gene clusters epsBCD and epsEF that were also involved in biosynthesis of EPS [88,89] were detected in all of the tested genomes, except for those of L. pakistanensis. In addition, genes hasA encoding hyaluronan synthases and hasC encoding UTP-glucose-1-phosphate uridylyltransferase involved in the biosynthesis of hyaluronic acid capsule [90] were found in strains L. mangiferihumi M-GX18, L. parviboronicapiens VT1065 and strains of L. pakistanensis. Genes pda encoding polysaccharide deacetylases and genes pgd encoding peptidoglycan N-acetylglucosamine deacetylase mediating peptidoglycan deacetylation in protection against lysozyme [91,92,93] were present in all of the tested genomes. We also found luxS genes encoding S-ribosylhomocysteinase present in all tested genomes, acquired via cross-family gene exchange or HGT events (Figure S24). Autoinducer-2 (AI-2) produced by the S-ribosylhomocysteinase (LuxS), formed a universal quorum sensing system that facilitated both inter- and intra-genomes communication and played important roles in growth regulation, EPS production, and biofilm formation [94,95,96,97], and induction of gene luxS under salt and chloride stress was also observed in a Bacillaceae member [98].

3.6.3. Halotolerance and Resistance to Osmotic Stress

Biological processes, including sodium efflux, potassium uptake, and compatible solute uptake and synthesis, are known to counteract osmotic stress [99]. Gene clusters kdpEDABC that enhanced resilience to salt stress by scavenging K+ [100,101,102,103], and genes kefA encoding mechanosensitive channel family proteins that regulated ion homeostasis and turgor pressure of bacteria upon growth at high osmolarity [104,105] were present in all of the tested strains except for L. contaminans DSM 25560, and phylogenetic analyses revealed that kdp gene clusters were clustering with those from Clostridiales and Planococcaceae, indicating that gene clusters kdp were likely acquired via HGT (Figures S25–S28). Another ATP-dependent transporters of monovalent cation (K+ and Na+) present in all of the tested strains contributed to salt resistance were KtrAB, composed of cytosolic octameric regulatory proteins (KtrA) and dimeric membrane proteins (KtrB) [100,106,107], acquired likely via cross-family gene exchanges or HGT events (Figure S29). The accumulation of small, uncharged compatible solute, such as glycine betaine in the cytoplasm, is also a common strategy of bacteria to counteract external salt stress, and previous reports also illustrated the possible additional functions of glycine betaine as cold and heat stress protectant [108,109,110]. Most bacteria uptake glycine betaine with different transporters or synthesize glycine betaine from choline. Choline dehydrogenase (BetA) induced by salt and/or choline, together with glycine betaine aldehyde dehydrogenase (BetB), catalyzed the two-step oxidation of choline to glycine betaine [111], and we found genes betA present in L. xylanilyticus t26 and strains of L. pakistanensis and betB present in L. xylanilyticus t26 and L. contaminans DSM 25560. Phylogenetic analyses showed that the genes betA of Lysinibacillus were clustering with those from Paenibacillaceae and Thermoactinomycetaceae suggesting cross-family gene exchanges (Figure S30). The OpuA system is the main ATP-binding cassette (ABC) transporter for glycine betaine consisting of three components: a hydrophilic polypeptide encoded by opuAC, which is a glycine betaine-binding protein (GBBP), an integral membrane protein encoded by opuAB, and an ATPase encoded by opuAA [110,112,113]. We found that genes opuAA, opuAB, and opuAC were present in all of the tested strains, being probably acquired from members of Lactobacillales via cross-order HGT (Figures S31–S33). We also found gene clusters proXV involved in transport of glycine betaine present in all tested strains [114,115]. In addition, genes proCBA that were involved in biosynthesis of proline, an effective osmolyte important in salt tolerance [116,117,118] were also present in all tested genomes.

3.6.4. Xenobiotics Biodegradation and Metabolism

KEGG (Kyoto Encyclopedia of Genes and Genomes) annotation revealed multiple genes involved in xenobiotics biodegradation and metabolism that closely correlated with contaminant removal ability in the tested genomes of Lysinibacillus spp. As for genes associated with benzoate degradation, genes encoding 3-hydroxybutyryl-CoA dehydrogenase (fadB), 4-oxalocrotonate tautomerase (xylH), acetyl-CoA C-acetyltransferase (atoB), acetyl-CoA acyltransferase (fadA), and catechol 2,3-dioxygenase (dmpB) were found in all of the tested genomes of Lysinibacillus, of which xylH was essential in the conversion of many aromatic compounds to intermediates of the TCA cycle [119], and the atoB and fadB genes were likely acquired via cross-family HGT events (Figures S34 and S35), and genes encoding 2-keto-4-pentenoate hydratase (mhpD), 2-oxo-3-hexenedioate decarboxylase (dmpH), and aminomuconate-semialdehyde/2-hydroxymuconate-6-semialdehyde dehydrogenase (dmpC) were only present in strains of L. pakistanensis. Genes encoding 3-hydroxyacyl-CoA dehydrogenase/enoyl-CoA hydratase (fadJ), and 4-carboxymuconolactone decarboxylase (pcaC) were missing in strain L. sphaericus OT4b.31, and fadJ genes were likely acquired via cross-class HGT events from members of Burkholderiales or Clostridiales (Figure S36). As for chloroalkene degradation, genes encoding 2-haloacid dehalogenase, alcohol dehydrogenase (adh), aldehyde dehydrogenase (NAD+) (aldh) were also present in all of the tested genomes of Lysinibacillus. Additionally, genes encoding 4-hydroxy 2-oxovalerate aldolase (mhpE), acetaldehyde dehydrogenase (mhpF) involved in xylene and dioxin degradation were only present in strains of L. pakistanensis. As for genes that associated with aminobenzoate degradation, genes encoding acylphosphatase and 4-nitrophenyl phosphatase that likely acquired via cross-family HGT events (Figure S37) were present in all the tested genomes of Lysinibacillus. As for aromatic amin catabolism, genes encoding 4-hydroxyphenylacetate 3-monooxygenase (hpaB) and nitrilotriacetate monooxygenase (ntaB/nmoB) that likely acquired via cross-family HGT events (Figure S38) were present in all of the tested genomes of Lysinibacillus. Gene clusters dmpR-hpaB-dmpB-pnpA-mhpD-dmpFGH-xylH-hpaE with identical arrangement involved in xenobiotics biodegradation and metabolism were present in genomes of Lysinibacillus, whose non-uniform gene contexts and deviant GC contents from that of genomes suggested that it was likely acquired via HGT after the speciation of Lysinibacillus (Figure S39). Annotation against the MEROPS database [50] showed numbers of peptidases that helped to hydrolyze proteinous contaminants in the genomes of Lysinibacillus, of which strain JCM 18,776 contained the most genes encoding peptidases (287), followed by strain LZH-9 (159), and both strains belonged to specie L. pakistanensis. Cytochrome P450 represent a super family of heme-containing monooxygenases that played critical roles in the adaptation of microbes to diverse environments by modifying harmful environmental chemicals, and annotation against cytochrome P450 Database [49] revealed that strain L. pakistanensis JCM 18,776 contained the most genes encoding cytochrome P450 (66), followed by strain L. xylanilyticus t26 (44) and strain L. pakistanensis LZH-9 (43) (Table S2).

3.6.5. Mobile Genetic Elements and CRISPR-Cas Systems

Mobile genetic elements (MGEs) are moveable genome segments, such as insertion sequences, transposases, genomic islands (GIs), and phages, and the amount of MGEs positively correlates with the frequency of HGT [120]. Results showed that an abundant repertoire of MGEs as well as CRISPR-Cas (clustered, regularly, interspaced, short, palindromic repeats -associated genes) systems existed in Lysinibacillus genomes. The number and the total length of transposon sequences per genome can reach 158 and 20.9 kb (L. pakistanensis LZH-9). The number and the total length of GIs related sequences per genome can reach 621 and 317.8 kb (L. mangiferihumi M-GX18), and the number and the total length of phage related sequences can reach 550 and 430.8 kb (L. mangiferihumi M-GX18) (Table S3). On the other hand, CRISPR-Cas systems are immune system of prokaryote against viral attack [121], and Type I-B CRISPR-Cas systems were founded in the tested genomes, in which L. pakistanensis LZH-9 contained the most (76) CRISPR-Cas related genes or spacers (Table S3). We found in the tested genomes that the numbers of identified transposons sequences correlated positively (rho = 0.881, p = 0.007) with the total length of transposons sequences, the same as the numbers of phage sequences with total length of phage region (rho = 0.922, p = 0.001) and the number of CRISPR-Cas sequences and total length of CRISPR-Cas sequences (rho = 0.878, p = 0.004). However, the number of genomic island sequences in tested genomes did not significantly correlate with the length of genomic island (rho = 0.476, p = 0.243) (Figure S40). The abundant MGEs present in tested genomes of Lysinibacillus indicated that HGT may contribute to the genomic evolution of Lysinibacillus genomes during niche adaption, and CRISPR-Cas system may also help to protect the genomes of Lysinibacillus and eliminate harmful genomic intrusions.

3.7. Positive Selection Analyses

Positive selection was also found to be an important driving force for evolution of Lysinibacillus. Genes can be changed by positive selection for fixation of beneficial gene variants in a population/specie over time if they increased fitness. Genome-scale positive selection analyses were performed on eight genomes of Lysinibacillus in this study (Table 2). Seven genes (Lp_411, Lp_718, Lp_1054, Lp_2135, Lp_3474, Lp_3540, Lp_4098) were identified as being under positive selection (Table S4), two (Lp_2135, Lp_3540) of which were annotated as hypothetical proteins. Gene Lp_1054 encoding an uncharacterized conserved protein was located in a known gene cluster related to flagellum biosythesis. Gene thiJ (Lp_411) encoded protein performing multiple functions including protease/amidase activity of broad specificity, acid resistance, oxidative stress resistance and holdase chaperone activity [122,123,124,125] and gene surA (Lp_4098) encoded a protein functioned as periplasmic chaperone and peptidyl-prolyl isomerase (PPIase) that is involved in cell envelope functions, biogenesis of β-barrel outer membrane proteins (OMPs) and virulence mediation [126,127,128,129], both of which may play important roles in maintaining cellular environment homeostasis. Gene fabB (Lp_718) encoding β-ketoacyl-ACP synthase capable of catalyzing the elongation of longer-chain-ACPs during fatty acid synthesis [130,131,132], and gene trpF (Lp_3474) encoding phosphoribosylanthranilate isomerase involved in tryptophan synthesis were also found containing adaptive changes. Taken together, those genes under positive selection in tested Lysinibacillus genomes were prone to playing a variety of functional roles with broad substrate specificity, of which even small adaptive changes in their coding sequences may bring considerable benefits in evolution.

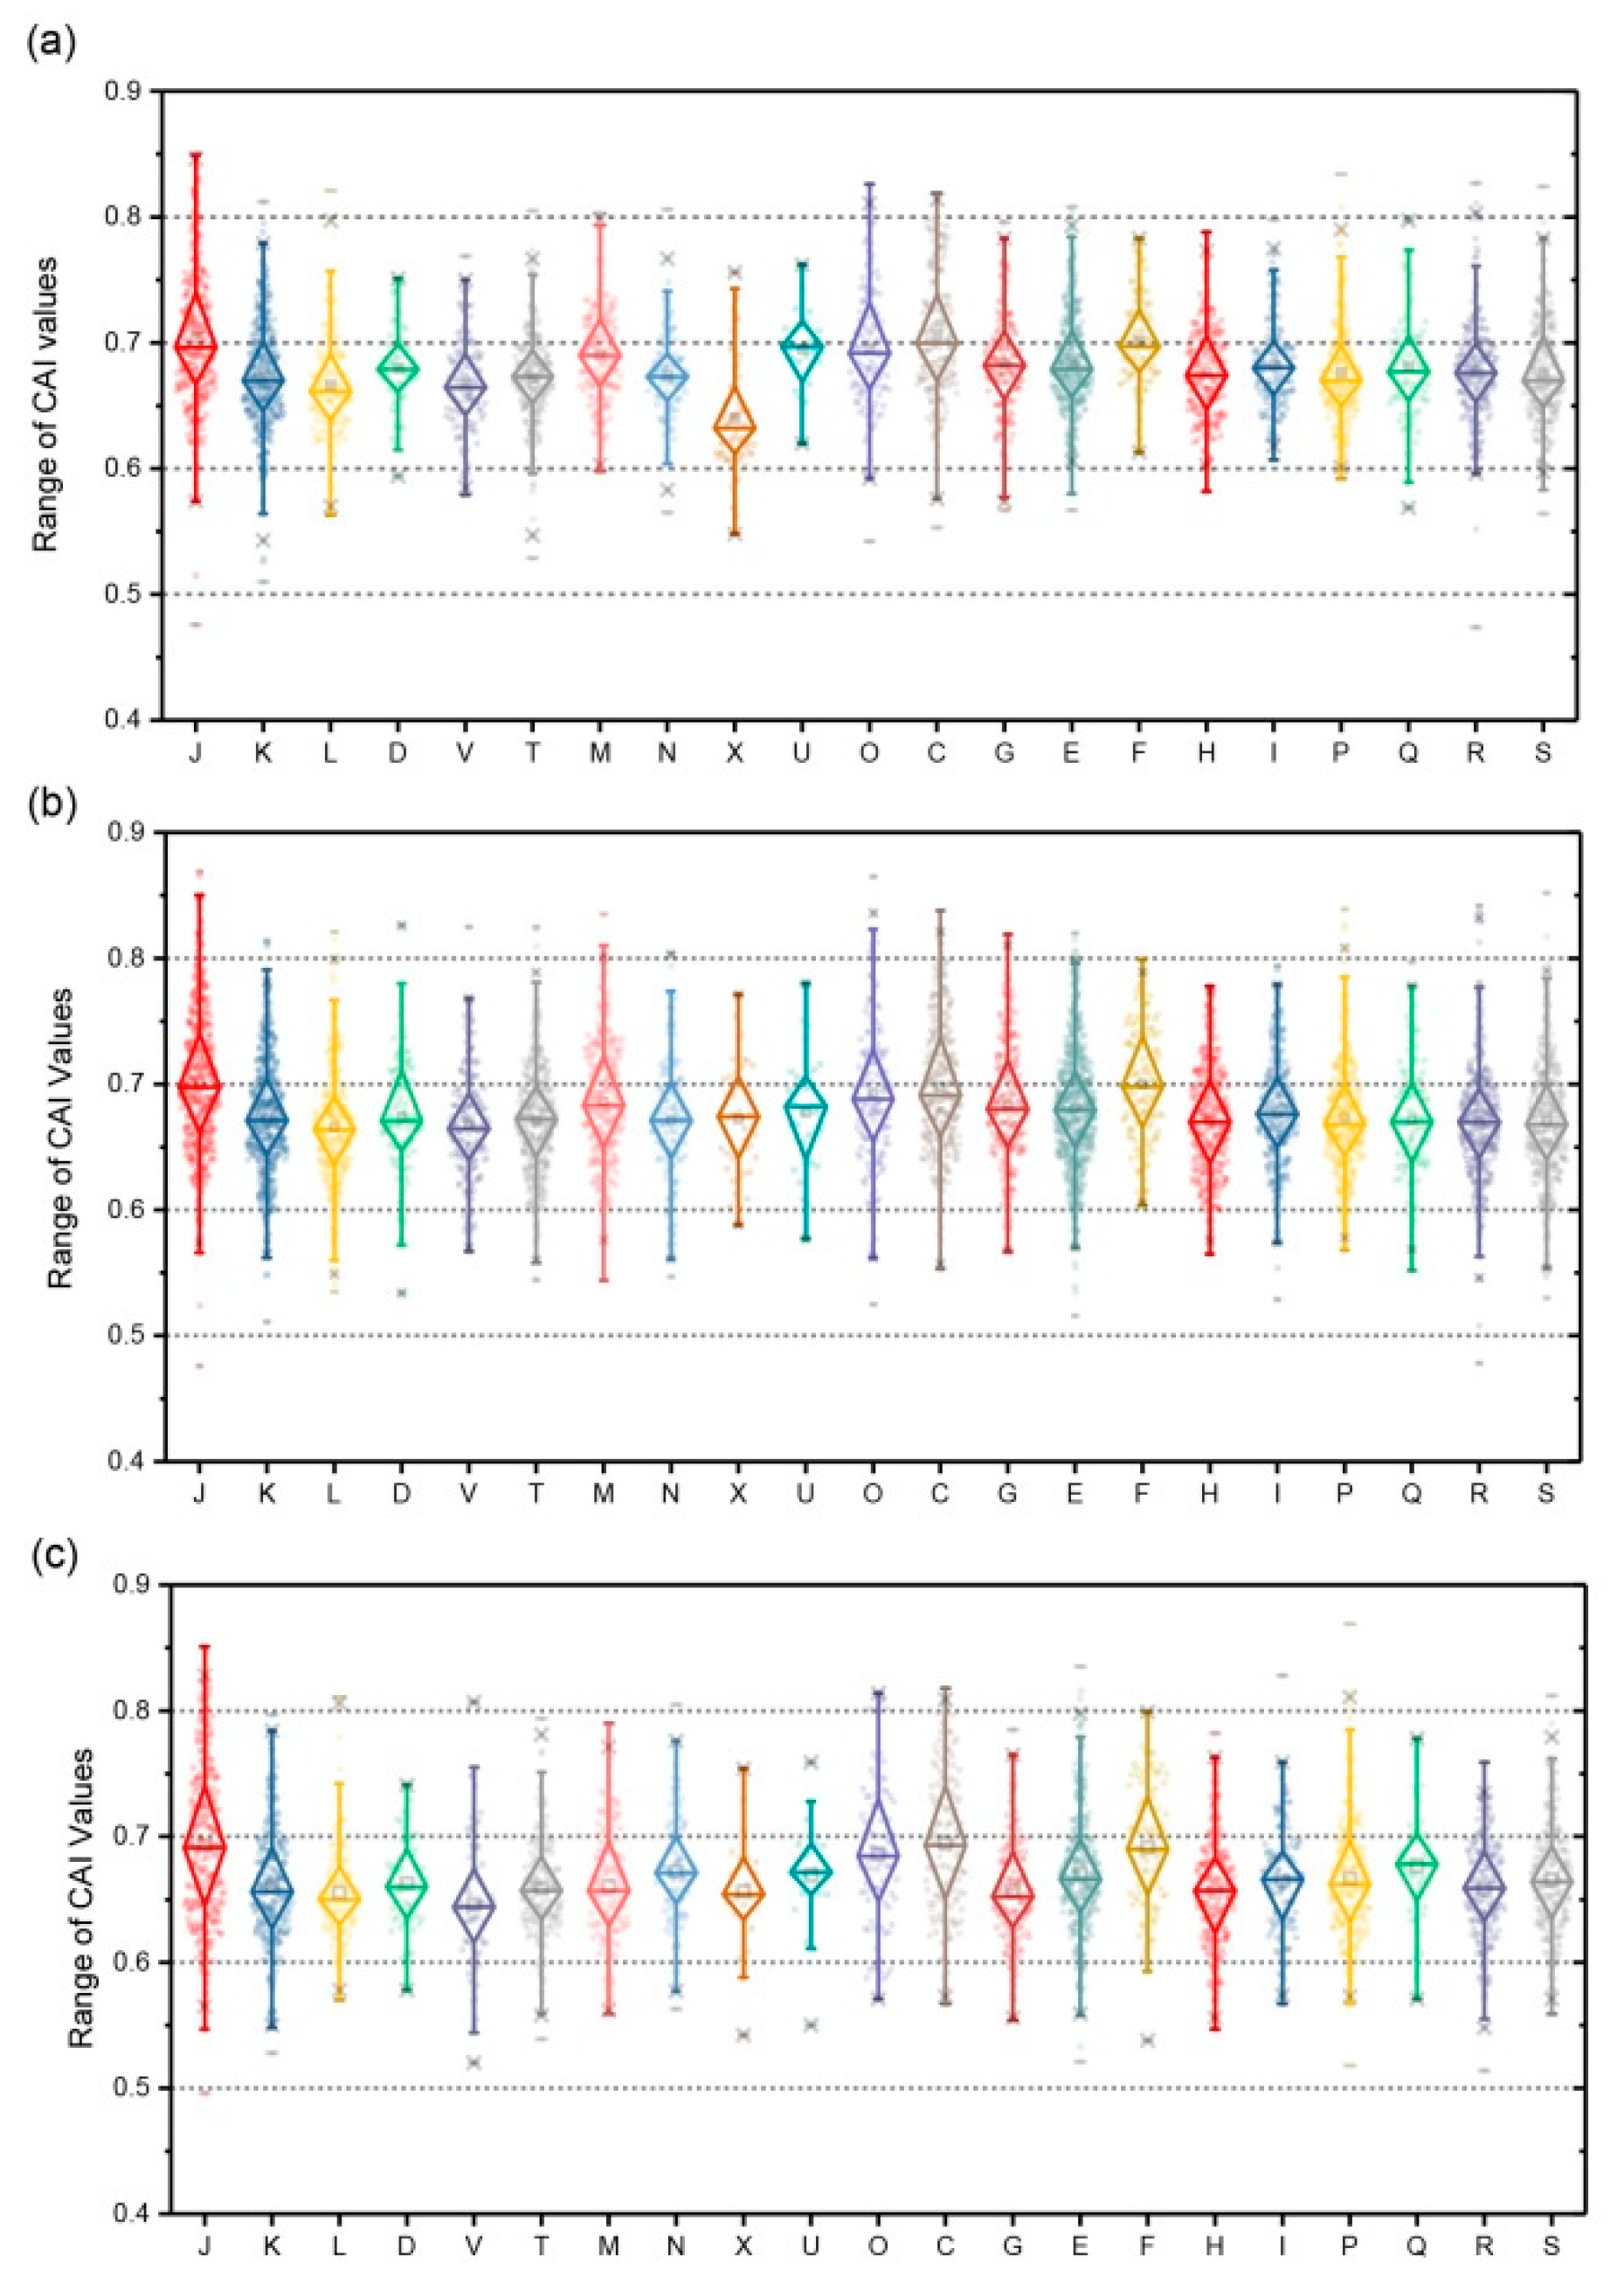
3.8. Expression Assessment with Codon Adaption Index (CAI)

In this study, the expression levels of all genes in the above-mentioned genomes of Lysinibacillus were assessed utilizing CAI (Codon Adaption Index) as a numerical estimator. The CAI developed by Sharp et al. [133] measured synonymous codon usage bias for between nucleic acid sequences and confirmed highly expressed reference gene sets, which has been widely applied in many aspects, including estimation of gene expressivity, prediction of highly expressed genes, predicting successful expression likelihood of heterologous gene [134,135,136,137,138,139], and depicting lifestyles of genomes [140]. The results showed that the top four highly expressed COG classes in L. pakistanensis LZH-9 based on average CAI values were COG [J] [F] [O] [C] associated with most essential biological processes including nucleotide metabolism, translation, and energy production, followed by COG [M] (cell wall/membrane/envelope biogenesis), [E] (amino acid transport and metabolism), [Q] (secondary metabolites biosynthesis), and [G] (carbohydrate transport and metabolism) reflecting high metabolic rate to digest potential carbon or nitrogen sources in potential contaminants, which closely linked with efficient COD removal ability of LZH-9, whereas genes that were related to COG [X] (mobilome: prophages, transposons) were predicted to be most inactively expressed (Figure 7a). The top four highly expressed COG classes in other strain were mostly consistent with L. pakistanensis LZH-9, whereas they differed in the expression levels of other COG classes. In the other two strains of L. pakistanensis, genes related to COG [L] (Replication, recombination and repair) in strain JCM 18,776 and genes that were related to COG [V] (Defense mechanisms) in strain UBA7518 were predicted to be most inactively expressed (Figure 7b,c; Figure S41). Principal coordinates analyses (PCoA) of average CAI values based on COG classes were further conducted in order to visualize the similarity or dissimilarity of expression pattern among different strains of the Lysinibacillus. Result showed genomes analyzed in this study were clustered into three groups by PCo2 (accounting for 73.4%) based on COG classes (Figure S42), in which strain L. pakistanensis LZH-9 were clustered with L. contaminans DSM 25560, L. mangiferihumi M-GX18 and L. pakistanensis JCM 18,776 indicating similar gene expression pattern among these strains, whereas strains L. parviboronicapiens VT1065, L. sphaericus OT4b.31, and L. pakistanensis UBA7518 formed another clusters, and both of the clusters were clearly separated with strain L. xylanilyticus t26. It is possible that divergent niches and environmental stresses these strains faced drive differentiation of general gene expression patterns; however, a larger scale examination is needed to support this point of view.

4. Conclusions

In this study, we isolated and identified four halotolerant strains from wastewater treatment plant, and found that strain LZH-9 could grow in the presence of up to 14% (w/v) NaCl, and remove 81.9% COD at 96 h after optimization. Whole genome sequencing of strain LZH-9 and comparative genomic analysis of eight strains of the Lysinibacillus revealed metabolic versatility of different genomes of Lysinibacillus, and we also found a multitude of genes that were involved in xenobiotics biodegradation, resistance to toxic compounds and salinity in all tested genomes of Lysinibacillus, pointing to promising application of Lysinibacillus in bioremediation. Genome-scale positive selection analyses showed that those genes under positive selection in Lysinibacillus spp. tended to be multifunctional. Additionally, genes that were related to COG [M] [E] [Q] [G] were relatively highly expressed in L. pakistanensis LZH-9 in addition to those related to basic biological functions, reflecting high metabolic rate of L. pakistanensis to digest potential carbon or nitrogen sources in potential contaminants, which closely linked with efficient COD removal ability of strain LZH-9. In all, the high COD removal efficiency and halotolerance as well as genomic evidences suggested that L. pakistanensis LZH-9 possessed great potential to be applied in the bio-treatment of hypersaline industrial wastewater.

Supplementary Materials

The following are available online at https://0-www-mdpi-com.brum.beds.ac.uk/2076-2607/8/5/716/s1, Table S1: GO enrichment analyses (p-value < 0.05) of gene families in six representative strains of Lysinibacillus. Table S2: Numbers of cytochrome P450 and peptidases in genomes of Lysinibacillus spp., Table S3: Statistics of Mobile genetic elements (MGEs) present in the genomes of Lysinibacillus spp. Table S4: Genes under positive selection of Lysinibacillus detected by posigene pipeline, Figure S1: Heat map of whole genome BLASTN-based average nucleotide identity (ANI) value of nine strains of genus Lysinibacillus, Figure S2: BlastN-based whole genome comparisons of eight representative strains of genus Lysinibacillus using BRIG and L. pakistanensis LZH-9 was used as reference, Figure S3: BlastN-based whole genome comparison of strains L. pakistanensis JCM 18776, L. contaminans DSM 25560, L. xylanilyticus t26, Lysinibacillus sp. UBA7518, L. sphaericus OT4b.31, L. mangiferihumi M-GX18 and L. parviboronicapiens VT1065, L. pakistanensis LZH-9, Figure S4: Bar chart showing proportions of COG classes of different part of 3 strains of L. pakistanensis (L. pakistanensis JCM 18776, Lysinibacillus sp. UBA7518, L. pakistanensis LZH-9) pan-genome (i.e., core, accessory, unique), Figure S5: Mathematical modeling of the pan-genome and core genome of 6 strains of Lysinibacillus type strains. L. contaminans DSM 25560, L. xylanilyticus t26, L. sphaericus OT4b.31, L. mangiferihumi M-GX18 and L. parviboronicapiens VT1065, L. pakistanensis LZH-9, Figure S6: Bar chart showing proportions of COG classes of different part of 6 strains of Lysinibacillus type strains pan-genome (i.e., core, accessory, unique), Figure S7: Maximum likelihood phylogenetic tree of mannose-6-phosphate isomerase protein sequences derived from Lysinibacillus spp. strains and other representative species, Figure S8: Maximum likelihood phylogenetic tree of gluconate 2-dehydrogenase protein sequences derived from Lysinibacillus spp. strains and other representative species, Figure S9: Maximum likelihood phylogenetic tree of ribokinase protein sequences derived from Lysinibacillus spp. strains and other representative species, Figure S10: Maximum likelihood phylogenetic tree of glycerophosphodiester phosphodiesterase protein sequences derived from Lysinibacillus spp. strains and other representative species, Figure S11: Maximum likelihood phylogenetic tree of vancomycin B-type resistance proteins VanW sequences derived from Lysinibacillus spp. strains and other representative species, Figure S12: Maximum likelihood phylogenetic tree of vancomycin response regulator VanR sequences derived from Lysinibacillus spp. strains and other representative species, Figure S13: Maximum likelihood phylogenetic tree of vancomycin sensor histidine kinase VanS sequences derived from Lysinibacillus spp. strains and other representative species, Figure S14: Maximum likelihood phylogenetic tree of fosmidomycin resistance protein FosB sequences derived from Lysinibacillus spp. strains and other representative species, Figure S15: Maximum likelihood phylogenetic tree of N-acetyltransferases SatA sequences derived from Lysinibacillus spp. strains and other representative species, Figure S16: Maximum likelihood phylogenetic tree of beta-lactamases sequences derived from Lysinibacillus spp. strains and other representative species, Figure S17: Maximum likelihood phylogenetic tree of Colicin E2 tolerance protein CbrC sequences derived from Lysinibacillus spp. strains and other representative species, Figure S18: Maximum likelihood phylogenetic tree of MATE (Multidrug and Toxic Compound Extrusion) family efflux protein sequences derived from Lysinibacillus spp. strains and other representative species, Figure S19: Maximum likelihood phylogenetic tree of arsenite efflux pump Acr3 sequences derived from Lysinibacillus spp. strains and other representative species, Figure S20: Maximum likelihood phylogenetic tree of arsenite efflux pump ArsB sequences derived from Lysinibacillus spp. strains and other representative species, Figure S21: Maximum likelihood phylogenetic tree of ATP-dependent efflux systems component CadA sequences derived from Lysinibacillus spp. strains and other representative species, Figure S22: Maximum likelihood phylogenetic tree of ATP-dependent efflux systems component CadC sequences derived from Lysinibacillus spp. strains and other representative species, Figure S23: Maximum likelihood phylogenetic tree of cation diffusion facilitator (CDF) protein CzcD sequences derived from Lysinibacillus spp. strains and other representative species, Figure S24: Maximum likelihood phylogenetic tree of S-ribosylhomocysteinase (LuxS) sequences derived from Lysinibacillus spp. strains and other representative species, Figure S25: Maximum likelihood phylogenetic tree of potassium transporting ATPase subunit A (KdpA) sequences derived from Lysinibacillus spp. strains and other representative species, Figure S26: Maximum likelihood phylogenetic tree of potassium transporting ATPase subunit B (KdpB) sequences derived from Lysinibacillus spp. strains and other representative species, Figure S27: Maximum likelihood phylogenetic tree of potassium transporting ATPase subunit C (KdpC) sequences derived from Lysinibacillus spp. strains and other representative species, Figure S28: Maximum likelihood phylogenetic tree of osmosensitive K+ channel histidine kinases KdpD sequences derived from Lysinibacillus spp. strains and other representative species, Figure S29: Maximum likelihood phylogenetic tree of cytosolic octameric regulatory protein (KtrA) sequences derived from Lysinibacillus spp. and other representative species, Figure S30: Maximum likelihood phylogenetic tree of choline dehydrogenase (BetA) sequences derived from Lysinibacillus spp. strains and other representative species, Figure S31: Maximum likelihood phylogenetic tree of ATP-binding cassette transporter component OpuAA sequences derived from Lysinibacillus spp. strains and other representative species, Figure S32: Maximum likelihood phylogenetic tree of ATP-binding cassette transporter component OpuAB sequences derived from Lysinibacillus spp. strains and other representative species, Figure S33: Maximum likelihood phylogenetic tree of ATP-binding cassette transporter component OpuAC sequences derived from Lysinibacillus spp. strains and other representative species, Figure S34: Maximum likelihood phylogenetic tree of Acetyl-CoA C-acetyltransferase (AtoB) sequences derived from Lysinibacillus spp. strains and other representative species, Figure S35: Maximum likelihood phylogenetic tree of 3-hydroxybutyryl-CoA dehydrogenase (FadB) sequences derived from Lysinibacillus spp. strains and other representative species, Figure S36: Maximum likelihood phylogenetic tree of 3-hydroxyacyl-CoA dehydrogenase/enoyl-CoA hydratase (FadJ) sequences derived from Lysinibacillus spp. strains and other representative species, Figure S37: Maximum likelihood phylogenetic tree of 4-nitrophenyl phosphatase sequences derived from Lysinibacillus spp. strains and other representative species, Figure S38: Maximum likelihood phylogenetic tree of nitrilotriacetate monooxygenase component B sequences derived from Lysinibacillus spp. strains and other representative species, Figure S39: Synteny analysis of a xenobiotics biodegradation and metabolism related gene cluster dmpR-hpaB-dmpB-pnpA-mhpD-dmpFGH-xylH-hpaE derived from L. pakistanensis LZH-9, and other representative species in Lysinibacillus and GC contents comparison against the genome of L. pakistanensis LZH-9, Figure S40: Scatterplots of the relationship between: (a) the numbers of transposons sequences and total length of transposons, (b) the numbers of genomic island sequences and total length of genomic island, (c) the numbers of phage sequences and total length of phage region, (d) the numbers of CRISPR-Cas sequences and total length of CRISPR-Cas sequences detected in genomes in Table 2, Figure S41: Ranges of CAI values of different genes in the genome of five strains belonged Lysinibacillus based on COG classification. (a) L. sphaericus OT4b.31; (b) L. contaminans DSM 25560; (c) L. parviboronicapiens VT1065; (d) L. mangiferihumi M-GX18; (e) L. xylanilyticus t26, Figure S42: Principal coordinates analyses (PCoA) of average CAI values based on COG classes were conducted to visualize the similarity or dissimilarity of expression pattern among different strains of the Lysinibacillus (1: L. sphaericus OT4b.31, 2: L. contaminans DSM 25560, 3: L. parviboronicapiens VT1065, 4: L. mangiferihumi M-GX18, 5: L. xylanilyticus t26, 6: L. pakistanensis JCM 18776, 7: Lysinibacillus sp. UBA7518, 8: L. pakistanensis LZH-9). Result showed strains in this study were clustered into three groups (ABC) by PCo2 (accounting for 73.4%) based on COG classes.

Author Contributions

Conceptualization, X.W. (Xueling Wu); Data curation, X.W. (Xueling Wu), H.Z. and E.W.; Formal analysis, H.Z. and X.Z.; Funding acquisition, W.Z.; Investigation, H.Z., L.L. and Y.G.; Methodology, L.L. and L.S.; Project administration, W.Z.; Resources, X.W. (Xiaoyan Wu); Software, H.Z.; Validation, L.L.; Visualization, L.L.; Writing—original draft, X.W. (Xueling Wu); Writing—review & editing, W.Z. All authors have read and agreed to the published version of the manuscript.

Funding

This work was supported by the National Natural Science Foundation of China (No. 31470230, 51320105006, 51604308), the Youth Talent Foundation of Hunan Province of China (No. 2017RS3003), Natural Science Foundation of Hunan Province of China (No.2018JJ2486), Key Research and Development Projects in Hunan Province (2018WK2012), Fundamental Research Funds for the Central Universities of Central South University (No. 2019zzts707).

Acknowledgments

The authors thank the NCBI database and IMG/ER database for providing the genome sequences of Lysinibacillus spp. And we appreciate the support of China Center for Type Culture Collection (CCTCC) and Nextomics Biosciences Institute.

Conflicts of Interest

The authors declare no conflict of interest. The funders had no role in study design, data collection, analysis and interpretation, decision to publish, or preparation of the manuscript.

References

  1. Jiang, Y.; Wei, L.; Zhang, H.; Yang, K.; Wang, H. Removal performance and microbial communities in a sequencing batch reactor treating hypersaline phenol-laden wastewater. Bioresour. Technol. 2016, 218, 146–152. [Google Scholar] [CrossRef] [PubMed]
  2. Ahmadi, M.; Jorfi, S.; Kujlu, R.; Ghafari, S.; Soltani, R.D.C.; Haghighifard, N.J. A novel salt-tolerant bacterial consortium for biodegradation of saline and recalcitrant petrochemical wastewater. J. Environ. Manag. 2017, 191, 198–208. [Google Scholar] [CrossRef] [PubMed]
  3. Kubo, M.; Hiroe, J.; Murakami, M.; Fukami, H.; Tachiki, T. Treament of hypersaline-containing wastewater with salt- tolerant microorganisms. J. Biosci. Bioeng. 2001, 91, 222–224. [Google Scholar] [CrossRef]
  4. Soltani, R.D.C.; Jorfi, S.; Ramezani, H.; Purfadakari, S. Ultrasonically induced ZnO–biosilica nanocomposite for degradation of a textile dye in aqueous phase. Ultrason. Sonochem. 2016, 28, 69–78. [Google Scholar] [CrossRef] [PubMed]
  5. Soltani, R.D.C.; Jorfi, S.; Safari, M.; Rajaei, M.S. Enhanced sonocatalysis of textile wastewater using bentonite-supported ZnO nanoparticles: Response surface methodological approach. J. Environ. Manag. 2016, 179, 47–57. [Google Scholar] [CrossRef] [PubMed]
  6. Lefebvre, O.; Moletta, R. Treatment of organic pollution in industrial saline wastewater: A literature review. Water Res. 2006, 40, 3671–3682. [Google Scholar] [CrossRef]
  7. Castillo-Carvajal, L.C.; Sanz-Martín, J.L.; Barragán-Huerta, B.E. Biodegradation of organic pollutants in saline wastewater by halophilic microorganisms: A review. Environ. Sci. Pollut. Res. 2014, 21, 9578–9588. [Google Scholar] [CrossRef]
  8. Chung, T.-P.; Tseng, H.-Y.; Juang, R.-S. Mass transfer effect and intermediate detection for phenol degradation in immobilized Pseudomonas putida systems. Process. Biochem. 2003, 38, 1497–1507. [Google Scholar] [CrossRef]
  9. Lee, C.S.; Jung, Y.-T.; Park, S.; Oh, T.-K.; Yoon, J.-H. Lysinibacillus xylanilyticus sp. nov., a xylan-degrading bacterium isolated from forest humus. Int. J. Syst. Evol. Microbiol. 2010, 60, 281–286. [Google Scholar] [CrossRef]
  10. Kämpfer, P.; Martin, K.; Glaeser, S.P. Lysinibacillus contaminans sp. nov., isolated from surface water. Int. J. Syst. Evol. Microbiol. 2013, 63, 3148–3153. [Google Scholar] [CrossRef] [Green Version]
  11. Sun, J.-Q.; Xu, L.; Wu, X.-L. Lysinibacillus alkalisoli sp. nov., isolated from saline–alkaline soil. Int. J. Syst. Evol. Microbiol. 2017, 67, 67–71. [Google Scholar] [CrossRef] [PubMed]
  12. Wan, S.; Li, G.; An, T.; Guo, B.; Sun, L.; Zu, L.; Ren, A. Biodegradation of ethanethiol in aqueous medium by a new Lysinibacillus sphaericus strain RG-1 isolated from activated sludge. Biogeochemistry 2010, 21, 1057–1066. [Google Scholar] [CrossRef] [PubMed]
  13. Wu, S.J.; Hu, Z.H.; Zhang, L.L.; Yu, X.; Chen, J. A novel dichloromethane-degrading Lysinibacillus sphaericus strain wh22 and its degradative plasmid. Appl. Microbiol. Biotechnol. 2009, 82, 731–740. [Google Scholar] [CrossRef] [PubMed]
  14. Yao, H.; Ren, Y.; Deng, X.; Wei, C. Dual substrates biodegradation kinetics of m-cresol and pyridine by Lysinibacillus cresolivorans. J. Hazard. Mater. 2011, 186, 1136–1140. [Google Scholar] [CrossRef]
  15. Liang, B.; Lu, P.; Li, H.; Li, R.; Li, S.; Huang, X. Biodegradation of fomesafen by strain Lysinibacillus sp. ZB-1 isolated from soil. Chemosphere 2009, 77, 1614–1619. [Google Scholar] [CrossRef]
  16. Esmaeili, A.; Pourbabaee, A.A.; Alikhani, H.A.; Shabani, F.; Esmaeili, E. Biodegradation of Low-Density Polyethylene (LDPE) by Mixed Culture of Lysinibacillus xylanilyticus and Aspergillus niger in Soil. PLoS ONE 2013, 8, e71720. [Google Scholar] [CrossRef] [Green Version]
  17. Saratale, R.G.; Saratale, G.D.; Govindwar, S.; Kim, D.S. Exploiting the efficacy ofLysinibacillussp. RGS for decolorization and detoxification of industrial dyes, textile effluent and bioreactor studies. J. Environ. Sci. Heal. Part A 2015, 50, 176–192. [Google Scholar] [CrossRef]
  18. Kong, D.; Wang, Y.; Li, Y.; Song, J.; Zhai, Y.; Zhang, C.; Wang, H.; Chen, X.; Zhao, B.; Ruan, Z. Lysinibacillus halotolerans sp. nov., isolated from saline-alkaline soil. Int. J. Syst. Evol. Microbiol. 2014, 64, 2593–2598. [Google Scholar] [CrossRef]
  19. He, M.; Li, X.; Liu, H.; Miller, S.J.; Wang, G.; Rensing, C. Characterization and genomic analysis of a highly chromate resistant and reducing bacterial strain Lysinibacillus fusiformis ZC1. J. Hazard. Mater. 2011, 185, 682–688. [Google Scholar] [CrossRef]
  20. Chaudhari, A.U.; Tapase, S.; Markad, V.L.; Kodam, K. Simultaneous decolorization of reactive Orange M2R dye and reduction of chromate by Lysinibacillus sp. KMK-A. J. Hazard. Mater. 2013, 262, 580–588. [Google Scholar] [CrossRef]
  21. Bahuguna, A.; Lily, M.K.; Munjal, A.; Singh, R.N.; Dangwal, K.; Lily, M.K. Desulfurization of dibenzothiophene (DBT) by a novel strain Lysinibacillus sphaericus DMT-7 isolated from diesel contaminated soil. J. Environ. Sci. 2011, 23, 975–982. [Google Scholar] [CrossRef]
  22. Rahman, A.; Nahar, N.; Nawani, N.; Jass, J.; Desale, P.; Kapadnis, B.; Hossain, K.; Saha, A.K.; Ghosh, S.; Olsson, B.; et al. Isolation and characterization of a Lysinibacillus strain B1-CDA showing potential for bioremediation of arsenics from contaminated water. J. Environ. Sci. Heal. Part A 2014, 49, 1349–1360. [Google Scholar] [CrossRef] [PubMed]
  23. Saratale, R.G.; Gandhi, S.S.; Purankar, M.V.; Kurade, M.B.; Govindwar, S.; Oh, S.E.; Saratale, G.D. Decolorization and detoxification of sulfonated azo dye C.I. Remazol Red and textile effluent by isolated Lysinibacillus sp. RGS. J. Biosci. Bioeng. 2013, 115, 658–667. [Google Scholar] [CrossRef] [PubMed]
  24. Peng, T.; Zhou, D.; Liu, Y.; Yu, R.; Qiu, G.; Zeng, W. Effects of pH value on the expression of key iron/sulfur oxidation genes during bioleaching of chalcopyrite on thermophilic condition. Ann. Microbiol. 2019, 69, 627–635. [Google Scholar] [CrossRef]
  25. Ai, C.; Yan, Z.; Chai, H.; Gu, T.; Wang, J.; Chai, L.; Qiu, G.; Zeng, W. Increased chalcopyrite bioleaching capabilities of extremely thermoacidophilic Metallosphaera sedula inocula by mixotrophic propagation. J. Ind. Microbiol. Biotechnol. 2019, 46, 1113–1127. [Google Scholar] [CrossRef] [PubMed]
  26. Wu, X.; Wu, X.; Shen, L.; Li, J.; Yu, R.; Liu, Y.; Qiu, G.; Zeng, W. Whole Genome Sequencing and Comparative Genomics Analyses of Pandoraea sp. XY-2, a New Species Capable of Biodegrade Tetracycline. Front. Microbiol. 2019, 10. [Google Scholar] [CrossRef]
  27. Duan, J.; Fang, H.; Su, B.; Chen, J.; Lin, J. Characterization of a halophilic heterotrophic nitrification–aerobic denitrification bacterium and its application on treatment of saline wastewater. Bioresour. Technol. 2015, 179, 421–428. [Google Scholar] [CrossRef]
  28. Ai, C.; Yan, Z.; Zhou, H.; Hou, S.; Chai, L.; Qiu, G.; Zeng, W. Metagenomic insights into the effects of seasonal temperature variation on functional potentials of activated sludge. Microorganisms 2019, 7, 713. [Google Scholar] [CrossRef] [Green Version]
  29. Mardis, E.; McCombie, W.R. Library Quantification: Fluorometric Quantitation of Double-Stranded or Single-Stranded DNA Samples Using the Qubit System. Cold Spring Harb. Protoc. 2016, 2017. [Google Scholar] [CrossRef]
  30. Koren, S.; Walenz, B.P.; Berlin, K.; Miller, J.; Bergman, N.H.; Phillippy, A. Canu: Scalable and accurate long-read assembly via adaptive k-mer weighting and repeat separation. Genome Res. 2017, 27, 722–736. [Google Scholar] [CrossRef] [Green Version]
  31. Walker, B.J.; Abeel, T.; Shea, T.; Priest, M.; Abouelliel, A.; Sakthikumar, S.; Cuomo, C.A.; Zeng, Q.; Wortman, J.; Young, S.K.; et al. Pilon: An Integrated Tool for Comprehensive Microbial Variant Detection and Genome Assembly Improvement. PLoS ONE 2014, 9, e112963. [Google Scholar] [CrossRef] [PubMed]
  32. Hunt, M.; De Silva, N.; Otto, T.D.; Parkhill, J.; Keane, J.A.; Harris, S.R. Circlator: Automated circularization of genome assemblies using long sequencing reads. Genome Boil. 2015, 16, 294. [Google Scholar] [CrossRef] [PubMed] [Green Version]
  33. Richter, M.; Rossello-Mora, R. Shifting the genomic gold standard for the prokaryotic species definition. Proc. Natl. Acad. Sci. USA 2009, 106, 19126–19131. [Google Scholar] [CrossRef] [PubMed] [Green Version]
  34. Alikhan, N.-F.; Petty, N.K.; Ben Zakour, N.; Beatson, S.A. BLAST Ring Image Generator (BRIG): Simple prokaryote genome comparisons. BMC Genom. 2011, 12, 402. [Google Scholar] [CrossRef] [PubMed] [Green Version]
  35. Simão, F.A.; Waterhouse, R.M.; Ioannidis, P.; Kriventseva, E.V.; Zdobnov, E.M. BUSCO: Assessing genome assembly and annotation completeness with single-copy orthologs. Bioinformatics 2015, 31, 3210–3212. [Google Scholar] [CrossRef] [Green Version]
  36. Wang, Y.; Coleman-Derr, D.; Chen, G.; Gu, Y.Q. OrthoVenn: A web server for genome wide comparison and annotation of orthologous clusters across multiple species. Nucleic Acids Res. 2015, 43, W78–W84. [Google Scholar] [CrossRef]
  37. Chaudhari, N.M.; Gupta, V.K.; Dutta, C. BPGA- an ultra-fast pan-genome analysis pipeline. Sci. Rep. 2016, 6, 24373. [Google Scholar] [CrossRef] [Green Version]
  38. Kumar, S.; Stecher, G.; Li, M.; Knyaz, C.; Tamura, K. MEGA X: Molecular Evolutionary Genetics Analysis across Computing Platforms. Mol. Boil. Evol. 2018, 35, 1547–1549. [Google Scholar] [CrossRef]
  39. Guindon, S.; Delsuc, F.; Dufayard, J.-F.; Gascuel, O. Estimating Maximum Likelihood Phylogenies with PhyML. Adv. Struct. Saf. Stud. 2009, 537, 113–137. [Google Scholar] [CrossRef] [Green Version]
  40. Letunic, I.; Bork, P. Interactive tree of life (iTOL) v3: An online tool for the display and annotation of phylogenetic and other trees. Nucleic Acids Res. 2016, 44, W242–W245. [Google Scholar] [CrossRef]
  41. Edgar, R.C. MUSCLE: A multiple sequence alignment method with reduced time and space complexity. BMC Bioinform. 2004, 5, 113. [Google Scholar] [CrossRef] [Green Version]
  42. Talavera, G.; Castresana, J. Improvement of Phylogenies after Removing Divergent and Ambiguously Aligned Blocks from Protein Sequence Alignments. Syst. Boil. 2007, 56, 564–577. [Google Scholar] [CrossRef] [Green Version]
  43. Aziz, R.K.; Bartels, D.; Best, A.A.; DeJongh, M.; Disz, T.; Edwards, R.A.; Formsma, K.; Gerdes, S.Y.; Glass, E.; Kubal, M.; et al. The RAST Server: Rapid Annotations using Subsystems Technology. BMC Genom. 2008, 9, 75. [Google Scholar] [CrossRef] [PubMed] [Green Version]
  44. Chen, I.-M.A.; Markowitz, V.M.; Chu, K.; Palaniappan, K.; Szeto, E.; Pillay, M.; Ratner, A.; Huang, J.; Andersen, E.; Huntemann, M.; et al. IMG/M: Integrated genome and metagenome comparative data analysis system. Nucleic Acids Res. 2016, 45, D507–D516. [Google Scholar] [CrossRef] [PubMed] [Green Version]
  45. Kanehisa, M.; Sato, Y.; Furumichi, M.; Morishima, K.; Tanabe, M. New approach for understanding genome variations in KEGG. Nucleic Acids Res. 2018, 47, D590–D595. [Google Scholar] [CrossRef] [PubMed] [Green Version]
  46. Tatusov, R.L. The COG database: A tool for genome-scale analysis of protein functions and evolution. Nucleic Acids Res. 2000, 28, 33–36. [Google Scholar] [CrossRef] [Green Version]
  47. Buchfink, B.; Xie, C.; Huson, D.H. Fast and sensitive protein alignment using DIAMOND. Nat. Methods 2014, 12, 59–60. [Google Scholar] [CrossRef] [PubMed]
  48. Huang, L.; Zhang, H.; Wu, P.; Entwistle, S.; Li, X.; Yohe, T.; Yi, H.; Yang, Z.; Yin, Y. dbCAN-seq: A database of carbohydrate-active enzyme (CAZyme) sequence and annotation. Nucleic Acids Res. 2017, 46, D516–D521. [Google Scholar] [CrossRef] [PubMed]
  49. Park, J.; Lee, S.; Choi, J.; Ahn, K.; Park, B.; Park, J.; Kang, S.; Lee, Y.-H. Fungal cytochrome P450 database. BMC Genom. 2008, 9, 402. [Google Scholar] [CrossRef] [Green Version]
  50. Rawlings, N.D.; Barrett, A.J.; Finn, R.D. Twenty years of the MEROPS database of proteolytic enzymes, their substrates and inhibitors. Nucleic Acids Res. 2015, 44, D343–D350. [Google Scholar] [CrossRef] [Green Version]
  51. Gerlt, J.A. Genomic Enzymology: Web Tools for Leveraging Protein Family Sequence–Function Space and Genome Context to Discover Novel Functions. Biochemistry 2017, 56, 4293–4308. [Google Scholar] [CrossRef] [Green Version]
  52. Siguier, P. ISfinder: The reference centre for bacterial insertion sequences. Nucleic Acids Res. 2006, 34. [Google Scholar] [CrossRef] [PubMed] [Green Version]
  53. Bertelli, C.; Laird, M.; Williams, K.P.; Lau, B.Y.; Hoad, G.; Winsor, G.L.; Brinkman, F. Simon Fraser University Research Computing Group IslandViewer 4: Expanded prediction of genomic islands for larger-scale datasets. Nucleic Acids Res. 2017, 45, W30–W35. [Google Scholar] [CrossRef] [PubMed]
  54. Arndt, D.; Grant, J.R.; Marcu, A.; Sajed, T.; Pon, A.; Liang, Y.; Wishart, D.S. PHASTER: A better, faster version of the PHAST phage search tool. Nucleic Acids Res. 2016, 44, W16–W21. [Google Scholar] [CrossRef] [PubMed] [Green Version]
  55. Couvin, D.; Bernheim, A.; Toffano-Nioche, C.; Touchon, M.; Michálik, J.; Néron, B.; Rocha, E.P.C.; Vergnaud, G.; Gautheret, D.; Pourcel, C. CRISPRCasFinder, an update of CRISRFinder, includes a portable version, enhanced performance and integrates search for Cas proteins. Nucleic Acids Res. 2018, 46, W246–W251. [Google Scholar] [CrossRef] [PubMed] [Green Version]
  56. Sahm, A.; Bens, M.; Platzer, M.; Szafranski, K. PosiGene: Automated and easy-to-use pipeline for genome-wide detection of positively selected genes. Nucleic Acids Res. 2017, 45, e100. [Google Scholar] [CrossRef] [PubMed] [Green Version]
  57. Puigbo, P.; Bravo, I.G.; Garcia-Vallve, S. CAIcal: A combined set of tools to assess codon usage adaptation. Boil. Direct 2008, 3, 38. [Google Scholar] [CrossRef] [Green Version]
  58. Kargi, F.; Dincer, A.R. Biological Treatment of Saline Wastewater by Fed-Batch Operation. J. Chem. Technol. Biotechnol. 1997, 69, 167–172. [Google Scholar] [CrossRef]
  59. Dinçer, A.; Kargı, F. Performance of rotating biological disc system treating saline wastewater. Process. Biochem. 2001, 36, 901–906. [Google Scholar] [CrossRef]
  60. Bomfim, N.; Nassar, N. Development of cassava periclinal chimera may boost production. Genet. Mol. Res. 2014, 13, 819–830. [Google Scholar] [CrossRef]
  61. Crane, B.R.; Sudhamsu, J.; Patel, B.A. Bacterial Nitric Oxide Synthases. Annu. Rev. Biochem. 2010, 79, 445–470. [Google Scholar] [CrossRef]
  62. Kers, J.A.; Wach, M.J.; Krasnoff, S.B.; Widom, J.; Cameron, K.D.; Bukhalid, R.A.; Gibson, D.M.; Crane, B.R.; Loria, R. Nitration of a peptide phytotoxin by bacterial nitric oxide synthase. Nature 2004, 429, 79–82. [Google Scholar] [CrossRef]
  63. Liu, Q.; Chen, Y.; Yuan, M.; Du, G.; Chen, J.; Kang, Z. A Bacillus paralicheniformis Iron-Containing Urease Reduces Urea Concentrations in Rice Wine. Appl. Environ. Microbiol. 2017, 83, e01258-17. [Google Scholar] [CrossRef] [Green Version]
  64. Yu, J.; Le Brun, N.E. Studies of the Cytochrome Subunits of Menaquinone:CytochromecReductase (bcComplex) ofBacillus subtilis. J. Boil. Chem. 1998, 273, 8860–8866. [Google Scholar] [CrossRef] [PubMed] [Green Version]
  65. Nitzschke, A.; Bettenbrock, K. All three quinone species play distinct roles in ensuring optimal growth under aerobic and fermentative conditions in E. coli K12. PLoS ONE 2018, 13, e0194699. [Google Scholar] [CrossRef] [PubMed] [Green Version]
  66. Pecsi, I.; Hards, K.; Ekanayaka, N.; Berney, M.; Hartman, T.E.; Jacobs, W.R.; Cook, G.M. Essentiality of Succinate Dehydrogenase in Mycobacterium smegmatis and Its Role in the Generation of the Membrane Potential Under Hypoxia. mBio 2014, 5, e01093-14. [Google Scholar] [CrossRef] [PubMed] [Green Version]
  67. Carsten, S.; Serdar, T.; Dong-Woo, L.; Fevzi, D. Cytochrome c biogenesis: The Ccm system. Trends Microbiol. 2010, 18, 266–274. [Google Scholar] [CrossRef] [Green Version]
  68. Hutchings, M.I.; Hong, H.-J.; Buttner, M.J. The vancomycin resistance VanRS two-component signal transduction system of Streptomyces coelicolor. Mol. Microbiol. 2006, 59, 923–935. [Google Scholar] [CrossRef]
  69. Bisicchia, P.; Bui, N.K.; Aldridge, C.; Vollmer, W.; Devine, K. Acquisition of VanB-type vancomycin resistance by Bacillus subtilis: The impact on gene expression, cell wall composition and morphology. Mol. Microbiol. 2011, 81, 157–178. [Google Scholar] [CrossRef]
  70. Thompson, M.K.; Keithly, M.E.; Goodman, M.C.; Hammer, N.D.; Cook, P.D.; Jagessar, K.L.; Harp, J.; Skaar, E.P.; Armstrong, R.N. Structure and Function of the Genomically Encoded Fosfomycin Resistance Enzyme, FosB, from Staphylococcus aureus. Biochemistry 2014, 53, 755–765. [Google Scholar] [CrossRef]
  71. Li, W.; Atkinson, G.C.; Thakor, N.V.; Allas, Ü.; Lu, C.-C.; Chan, K.-Y.; Tenson, T.; Schulten, K.; Wilson, K.S.; Hauryliuk, V.; et al. Mechanism of Tetracycline Resistance by Ribosomal Protection Protein Tet(O). Nat. Commun. 2013, 4, 1477. [Google Scholar] [CrossRef] [PubMed] [Green Version]
  72. Aires, J.; Doucet-Populaire, F.; Butel, M.J. Tetracycline Resistance Mediated by tet(W), tet(M), and tet(O) Genes of Bifidobacterium Isolates from Humans. Appl. Environ. Microbiol. 2007, 73, 2751–2754. [Google Scholar] [CrossRef] [PubMed] [Green Version]
  73. Stern, A.L.; Van Der Verren, S.; Näsvall, J.; Gutiérrez-De-Terán, H.; Selmer, M. Structural mechanism of AadA, a dual-specificity aminoglycoside adenylyltransferase from Salmonella enterica. J. Boil. Chem. 2018, 293, 11481–11490. [Google Scholar] [CrossRef] [PubMed] [Green Version]
  74. Burckhardt, R.M.; Escalante-Semerena, J.C. In Bacillus subtilis, the SatA (Formerly YyaR) Acetyltransferase Detoxifies Streptothricin via Lysine Acetylation. Appl. Environ. Microbiol. 2017, 83, e01590-17. [Google Scholar] [CrossRef] [PubMed] [Green Version]
  75. Burckhardt, R.M.; Escalante-Semerena, J.C. Insights into the Function of the N-Acetyltransferase SatA That Detoxifies Streptothricin in Bacillus subtilis and Bacillus anthracis. Appl. Environ. Microbiol. 2019, 85, 85. [Google Scholar] [CrossRef] [Green Version]
  76. Bernard, R.; Guiseppi, A.; Chippaux, M.; Foglino, M.; Denizot, F. Resistance to Bacitracin in Bacillus subtilis: Unexpected Requirement of the BceAB ABC Transporter in the Control of Expression of Its Own Structural Genes. J. Bacteriol. 2007, 189, 8636–8642. [Google Scholar] [CrossRef] [Green Version]
  77. Stéphanie, C.F.; Céline, B.A.; Annick, G.; Fran Ois, D.; Maryline, F. A new highly conserved antibiotic sensing/resistance pathway in firmicutes involves an ABC transporter interplaying with a signal transduction system. PLoS ONE 2011, 6, e15951. [Google Scholar] [CrossRef]
  78. Furuta, Y.; Harima, H.; Ito, E.; Maruyama, F.; Ohnishi, N.; Osaki, K.; Ogawa, H.; Squarre, D.; Hang’Ombe, B.M.; Higashi, H. Loss of Bacitracin Resistance Due to a Large Genomic Deletion among Bacillus anthracis Strains. mSystems 2018, 3, e00182-18. [Google Scholar] [CrossRef] [Green Version]
  79. Cariss, S.J.L.; Constantinidou, C.; Patel, M.D.; Takebayashi, Y.; Hobman, J.; Penn, C.W.; Avison, M.B. YieJ (CbrC) Mediates CreBC-Dependent Colicin E2 Tolerance in Escherichia coli. J. Bacteriol. 2010, 192, 3329–3336. [Google Scholar] [CrossRef] [Green Version]
  80. Lebrun, M.; Audurier, A.; Cossart, P. Plasmid-borne cadmium resistance genes in Listeria monocytogenes are similar to cadA and cadC of Staphylococcus aureus and are induced by cadmium. J. Bacteriol. 1994, 176, 3040–3048. [Google Scholar] [CrossRef] [Green Version]
  81. Anton, A.; Große, C.; Reißmann, J.; Pribyl, T.; Nies, D.H. CzcD Is a Heavy Metal Ion Transporter Involved in Regulation of Heavy Metal Resistance in Ralstonia sp. Strain CH34. J. Bacteriol. 1999, 181, 6876–6881. [Google Scholar] [CrossRef] [PubMed] [Green Version]
  82. Flemming, H.-C.; Wingender, J. The biofilm matrix. Nat. Rev. Genet. 2010, 8, 623–633. [Google Scholar] [CrossRef] [PubMed]
  83. Li, J.; Shimizu, K.; Maseda, H.; Lu, Z.; Utsumi, M.; Zhang, Z.; Sugiura, N. Investigations into the biodegradation of microcystin-LR mediated by the biofilm in wintertime from a biological treatment facility in a drinking-water treatment plant. Bioresour. Technol. 2012, 106, 27–35. [Google Scholar] [CrossRef] [PubMed]
  84. Sivan, A.; Szanto, M.; Pavlov, V. Biofilm development of the polyethylene-degrading bacterium Rhodococcus ruber. Appl. Microbiol. Biotechnol. 2006, 72, 346–352. [Google Scholar] [CrossRef]
  85. Radchenkova, N.; Boyadzhieva, I.; Atanasova, N.; Poli, A.; Finore, I.; Di Donato, P.; Nicolaus, B.; Panchev, I.; Kuncheva, M.; Kambourova, M. Extracellular polymer substance synthesized by a halophilic bacterium Chromohalobacter canadensis 28. Appl. Microbiol. Biotechnol. 2018, 102, 4937–4949. [Google Scholar] [CrossRef]
  86. Zivkovic, M.; Miljkovic, M.; Rúas-Madiedo, P.; Strahinic, I.; Tolinacki, M.; Golic, N.; Kojic, M. Exopolysaccharide Production and Ropy Phenotype Are Determined by Two Gene Clusters in Putative Probiotic Strain Lactobacillus paraplantarum BGCG11. Appl. Environ. Microbiol. 2015, 81, 1387–1396. [Google Scholar] [CrossRef] [Green Version]
  87. Boels, I.C.; Beerthuyzen, M.M.; Kosters, M.H.W.; Van Kaauwen, M.P.W.; Kleerebezem, M.; De Vos, W.M. Identification and Functional Characterization of the Lactococcus lactis rfb Operon, Required for dTDP-Rhamnose Biosynthesis. J. Bacteriol. 2004, 186, 1239–1248. [Google Scholar] [CrossRef] [Green Version]
  88. Huang, J.; Schell, M.A. Molecular characterization of the eps gene cluster of Pseudomonas solanacearum and its transcriptional regulation at a single promoter. Mol. Microbiol. 1995, 16, 977–989. [Google Scholar] [CrossRef]
  89. Minic, Z.; Marie, C.; Delorme, C.; Faurie, J.-M.; Mercier, G.; Ehrlich, D.; Renault, P. Control of EpsE, the Phosphoglycosyltransferase Initiating Exopolysaccharide Synthesis in Streptococcus thermophilus, by EpsD Tyrosine Kinase. J. Bacteriol. 2006, 189, 1351–1357. [Google Scholar] [CrossRef] [Green Version]
  90. Bhatt, M.; Rahayu, J.; Sterling, G. A General Framework Based on Dynamic Constraints for the Enrichment of a Topological Theory of Spatial Simulation. Comput. Vis. 2005, 3684, 366–373. [Google Scholar] [CrossRef]
  91. Benachour, A.; Ladjouzi, R.; Le Jeune, A.; Hébert, L.; Thorpe, S.; Courtin, P.; Chapot-Chartier, M.-P.; Prajsnar, T.K.; Foster, S.J.; Mesnage, S. The Lysozyme-Induced Peptidoglycan N-Acetylglucosamine Deacetylase PgdA (EF1843) Is Required for Enterococcus faecalis Virulence. J. Bacteriol. 2012, 194, 6066–6073. [Google Scholar] [CrossRef] [PubMed] [Green Version]
  92. Kobayashi, K.; Sudiarta, I.P.; Kodama, T.; Fukushima, T.; Ara, K.; Ozaki, K.; Sekiguchi, J. Identification and Characterization of a Novel Polysaccharide Deacetylase C (PdaC) from Bacillus subtilis. J. Boil. Chem. 2012, 287, 9765–9776. [Google Scholar] [CrossRef] [PubMed] [Green Version]
  93. Deng, D.; Urch, J.E.; Cate, J.M.T.; Rao, V.A.; Van Aalten, D.M.F.; Crielaard, W. Streptococcus mutans SMU.623c Codes for a Functional, Metal-Dependent Polysaccharide Deacetylase That Modulates Interactions with Salivary Agglutinin. J. Bacteriol. 2008, 191, 394–402. [Google Scholar] [CrossRef] [PubMed] [Green Version]
  94. Sweeney, E.G.; Nishida, A.; Weston, A.; Bañuelos, M.S.; Potter, K.; Conery, J.; Guillemin, K. Agent-Based Modeling Demonstrates How Local Chemotactic Behavior Can Shape Biofilm Architecture. mSphere 2019, 4, e00285-19. [Google Scholar] [CrossRef] [Green Version]
  95. Xavier, K.B.; Bassler, B.L. Interference with AI-2-mediated bacterial cell–cell communication. Nature 2005, 437, 750–753. [Google Scholar] [CrossRef] [Green Version]
  96. Laganenka, L.; Sourjik, V. Autoinducer 2-Dependent Escherichia coli Biofilm Formation Is Enhanced in a Dual-Species Coculture. Appl. Environ. Microbiol. 2018, 84, e02638-17. [Google Scholar] [CrossRef] [Green Version]
  97. Zhang, B.; Ku, X.; Zhang, X.; Zhang, Y.; Chen, G.; Chen, F.; Zeng, W.; Li, J.; Zhu, L.; He, Q. The AI-2/luxS Quorum Sensing System Affects the Growth Characteristics, Biofilm Formation, and Virulence of Haemophilus parasuis. Front. Microbiol. 2019, 9, 62. [Google Scholar] [CrossRef]
  98. Sewald, X.; Saum, S.H.; Palm, P.; Pfeiffer, F.; Oesterhelt, D.; Müller, V. Autoinducer-2-Producing Protein LuxS, a Novel Salt- and Chloride-Induced Protein in the Moderately Halophilic Bacterium Halobacillus halophilus. Appl. Environ. Microbiol. 2006, 73, 371–379. [Google Scholar] [CrossRef] [Green Version]
  99. Chen, Y.-H.; Lu, C.-W.; Shyu, Y.-T.; Lin, S.-S. Revealing the Saline Adaptation Strategies of the Halophilic Bacterium Halomonas beimenensis through High-throughput Omics and Transposon Mutagenesis Approaches. Sci. Rep. 2017, 7, 13037. [Google Scholar] [CrossRef]
  100. Price-Whelan, A.; Poon, C.K.; Benson, M.A.; Eidem, T.T.; Roux, C.M.; Boyd, J.M.; Dunman, P.M.; Torres, V.J.; Krulwich, T.A. Transcriptional Profiling of Staphylococcus aureus During Growth in 2 M NaCl Leads to Clarification of Physiological Roles for Kdp and Ktr K+ Uptake Systems. mBio 2013, 4, e00407-13. [Google Scholar] [CrossRef] [Green Version]
  101. Lang, E.; Guyot, S.; Alvarez-Martin, P.; Perrier-Cornet, J.-M.; Gervais, P. Caco-2 Invasion by Cronobacter sakazakii and Salmonella enterica Exposed to Drying and Heat Treatments in Dried State in Milk Powder. Front. Microbiol. 2017, 8, 1893. [Google Scholar] [CrossRef] [PubMed]
  102. Domiínguez-Ferreras, A.; Muñoz, S.; Olivares, J.; Soto, M.J.; Sanjuán, J. Role of Potassium Uptake Systems in Sinorhizobium meliloti Osmoadaptation and Symbiotic Performance. J. Bacteriol. 2009, 191, 2133–2143. [Google Scholar] [CrossRef] [PubMed] [Green Version]
  103. Laimins, L.A.; Rhoads, D.B.; Epstein, W. Osmotic control of kdp operon expression in Escherichia coli. Proc. Natl. Acad. Sci. USA 1981, 78, 464–468. [Google Scholar] [CrossRef] [PubMed] [Green Version]
  104. Levina, N.; Totemeyer, S.; Stokes, N.R.; Louis, P.; Jones, M.A.; Booth, I.R. Protection of Escherichia coli cells against extreme turgor by activation of MscS and MscL mechanosensitive channels: Identification of genes required for MscS activity. EMBO J. 1999, 18, 1730–1737. [Google Scholar] [CrossRef]
  105. McLaggan, D.; Jones, M.A.; Gouesbet, G.; Levina, N.; Lindey, S.; Epstein, W.; Booth, I.R. Analysis of the kefA2 mutation suggests that KefA is a cation-specific channel involved in osmotic adaptation in Escherichia coli. Mol. Microbiol. 2002, 43, 521–536. [Google Scholar] [CrossRef] [Green Version]
  106. Vieira-Pires, R.; Szollosi, A.; Cabral, J.H.M. The structure of the KtrAB potassium transporter. Nature 2013, 496, 323–328. [Google Scholar] [CrossRef] [Green Version]
  107. Szollosi, A.; Vieira-Pires, R.; Teixeira-Duarte, C.M.; Rocha, R.; Cabral, J.H.M. Dissecting the Molecular Mechanism of Nucleotide-Dependent Activation of the KtrAB K+ Transporter. PLoS Boil. 2016, 14, e1002356. [Google Scholar] [CrossRef]
  108. Tamara, H.; Erhard, B. Protection of Bacillus subtilis against cold stress via compatible-solute acquisition. J. Bacteriol. 2011, 193, 1552–1562. [Google Scholar] [CrossRef] [Green Version]
  109. Holtmann, G.J.; Bremer, E. Thermoprotection of Bacillus subtilis by Exogenously Provided Glycine Betaine and Structurally Related Compatible Solutes: Involvement of Opu Transporters. J. Bacteriol. 2004, 186, 1683–1693. [Google Scholar] [CrossRef] [Green Version]
  110. Bashir, A.; Hoffmann, T.; Smits, S.H.J.; Bremer, E. Dimethylglycine Provides Salt and Temperature Stress Protection to Bacillus subtilis. Appl. Environ. Microbiol. 2014, 80, 2773–2785. [Google Scholar] [CrossRef] [Green Version]
  111. Scholz, A.; Stahl, J.; Berardinis, V.; Müller, V.; Averhoff, B. Osmotic stress response in Acinetobacter baylyi: Identification of a glycine-betaine biosynthesis pathway and regulation of osmoadaptive choline uptake and glycine-betaine synthesis through a choline-responsive BetI repressor. Environ. Microbiol. Rep. 2016, 8, 316–322. [Google Scholar] [CrossRef] [PubMed]
  112. Hoffmann, T.; Bremer, E. Guardians in a stressful world: The Opu family of compatible solute transporters from Bacillus subtilis. Boil. Chem. 2017, 398, 193–214. [Google Scholar] [CrossRef] [PubMed]
  113. Hoffmann, T.; Wensing, A.; Brosius, M.; Steil, L.; Völker, U.; Bremer, E. Osmotic Control of opuA Expression in Bacillus subtilis and Its Modulation in Response to Intracellular Glycine Betaine and Proline Pools. J. Bacteriol. 2012, 195, 510–522. [Google Scholar] [CrossRef] [PubMed]
  114. André, S.; Jason, B.; Linda, B.S.; Susanne, K.; Jutta, G.; Gudrun, H.; Kay, D.; Wolfram, W.; Erhard, B. Cation-pi interactions as determinants for binding of the compatible solutes glycine betaine and proline betaine by the periplasmic ligand-binding protein ProX from Escherichia coli. J. Biol. Chem. 2004, 279, 5588–5596. [Google Scholar] [CrossRef] [Green Version]
  115. Thirunavukkarasu, A.; Kumar, V. Role of proP and proU in betaine uptake by Yersinia enterocolitica under cold and osmotic stress conditions. Appl. Environ. Microbiol. 2009, 75, 1471–1477. [Google Scholar] [CrossRef] [Green Version]
  116. Dandekar, A.M.; Uratsu, S.L. A single base pair change in proline biosynthesis genes causes osmotic stress tolerance. J. Bacteriol. 1988, 170, 5943–5945. [Google Scholar] [CrossRef] [Green Version]
  117. Sleator, R.D.; Gahan, C.G.; Hill, C. Mutations in the Listerial proB Gene Leading to Proline Overproduction: Effects on Salt Tolerance and Murine Infection. Appl. Environ. Microbiol. 2001, 67, 4560–4565. [Google Scholar] [CrossRef] [Green Version]
  118. Diehl, R.C.; Guinn, E.J.; Capp, M.W.; Tsodikov, O.V.; Record, M.T. Quantifying Additive Interactions of the Osmolyte Proline with Individual Functional Groups of Proteins: Comparisons with Urea and Glycine Betaine, Interpretation of m-Values. Biochemistry 2013, 52, 5997–6010. [Google Scholar] [CrossRef] [Green Version]
  119. Harayama, S.; Rekik, M.; Ngai, K.L.; Ornston, L.N. Physically associated enzymes produce and metabolize 2-hydroxy-2,4-dienoate, a chemically unstable intermediate formed in catechol metabolism via meta cleavage in Pseudomonas putida. J. Bacteriol. 1989, 171, 6251–6258. [Google Scholar] [CrossRef] [Green Version]
  120. Springael, D.; Top, E.M. Horizontal gene transfer and microbial adaptation to xenobiotics: New types of mobile genetic elements and lessons from ecological studies. Trends Microbiol. 2004, 12, 53–58. [Google Scholar] [CrossRef]
  121. Horvath, P.; Barrangou, R. CRISPR/Cas, the Immune System of Bacteria and Archaea. Science 2010, 327, 167–170. [Google Scholar] [CrossRef] [PubMed] [Green Version]
  122. Bankapalli, K.; Saladi, S.; Awadia, S.S.; Goswami, A.V.; Samaddar, M.; D’Silva, P. Robust Glyoxalase activity of Hsp31, a ThiJ/DJ-1/PfpI Family Member Protein, Is Critical for Oxidative Stress Resistance inSaccharomyces cerevisiae. J. Boil. Chem. 2015, 290, 26491–26507. [Google Scholar] [CrossRef] [PubMed] [Green Version]
  123. Subedi, K.P.; Choi, D.; Kim, I.; Min, B.; Park, C. Hsp31 of Escherichia coli K-12 is glyoxalase III. Mol. Microbiol. 2011, 81, 926–936. [Google Scholar] [CrossRef]
  124. Mujacic, M.; Bader, M.W.; Baneyx, F.; Baneyx, F. Escherichia coli Hsp31 functions as a holding chaperone that cooperates with the DnaK-DnaJ-GrpE system in the management of protein misfolding under severe stress conditions. Mol. Microbiol. 2003, 51, 849–859. [Google Scholar] [CrossRef] [PubMed]
  125. Mirna, M.; Fran Ois, B. Chaperone Hsp31 contributes to acid resistance in stationary-phase Escherichia coli. Appl. Environ. Microbiol. 2007, 73, 1014–1018. [Google Scholar] [CrossRef] [Green Version]
  126. Behrens-Kneip, S. The role of SurA factor in outer membrane protein transport and virulence. Int. J. Med Microbiol. 2010, 300, 421–428. [Google Scholar] [CrossRef] [PubMed]
  127. Soltes, G.R.; Schwalm, J.; Ricci, D.P.; Silhavy, T.J. The Activity of Escherichia coli Chaperone SurA Is Regulated by Conformational Changes Involving a Parvulin Domain. J. Bacteriol. 2016, 198, 921–929. [Google Scholar] [CrossRef] [Green Version]
  128. Ricci, D.P.; Schwalm, J.; Gonzales-Cope, M.; Silhavy, T.J. The Activity and Specificity of the Outer Membrane Protein Chaperone SurA Are Modulated by a Proline Isomerase Domain. mBio 2013, 4, e00540-13. [Google Scholar] [CrossRef] [Green Version]
  129. Hennecke, G.; Nolte, J.; Volkmer-Engert, R.; Schneider-Mergener, J.; Behrens, S. The Periplasmic Chaperone SurA Exploits Two Features Characteristic of Integral Outer Membrane Proteins for Selective Substrate Recognition. J. Boil. Chem. 2005, 280, 23540–23548. [Google Scholar] [CrossRef] [PubMed] [Green Version]
  130. Luo, Q.; Li, M.; Fu, H.; Meng, Q.; Gao, H. Shewanella oneidensis FabB: A β-ketoacyl-ACP Synthase That Works with C16:1-ACP. Front. Microbiol. 2016, 7, 2194. [Google Scholar] [CrossRef] [PubMed] [Green Version]
  131. Li, M.; Meng, Q.; Fu, H.; Luo, Q.; Gao, H. Suppression of fabB Mutation by fabF1 Is Mediated by Transcription Read-through in Shewanella oneidensis. J. Bacteriol. 2016, 198, 3060–3069. [Google Scholar] [CrossRef] [PubMed] [Green Version]
  132. Zhu, K.; Zhang, Y.-M.; Rock, C.O. Transcriptional Regulation of Membrane Lipid Homeostasis in Escherichia coli. J. Boil. Chem. 2009, 284, 34880–34888. [Google Scholar] [CrossRef] [PubMed] [Green Version]
  133. Sharp, P.M.; Li, W.-H. The codon adaptation index-a measure of directional synonymous codon usage bias, and its potential applications. Nucleic Acids Res. 1987, 15, 1281–1295. [Google Scholar] [CrossRef] [PubMed] [Green Version]
  134. Li, L.; Liu, Z.; Meng, D.; Liu, X.; Li, X.; Zhang, M.; Tao, J.; Gu, Y.; Zhong, S.; Yin, H. Comparative Genomic Analysis Reveals the Distribution, Organization, and Evolution of Metal Resistance Genes in the Genus Acidithiobacillus. Appl. Environ. Microbiol. 2018, 85. [Google Scholar] [CrossRef] [Green Version]
  135. Wu, G.; Culley, D.E.; Zhang, W. Predicted highly expressed genes in the genomes of Streptomyces coelicolor and Streptomyces avermitilis and the implications for their metabolism. Microbiology 2005, 151, 2175–2187. [Google Scholar] [CrossRef] [Green Version]
  136. Wu, G.; Nie, L.; Zhang, W. Predicted highly expressed genes in Nocardia farcinica and the implication for its primary metabolism and nocardial virulence. Antonie van Leeuwenhoek 2006, 89, 135–146. [Google Scholar] [CrossRef]
  137. Pere, P.; Eduard, G.; Antoni, R.; Santiago, G. OPTIMIZER: A web server for optimizing the codon usage of DNA sequences. Nucleic Acids Res. 2007, 35, W126–W131. [Google Scholar] [CrossRef] [Green Version]
  138. Ramazzotti, M.; Brilli, M.; Fani, R.; Manao, G.; Degl’Innocenti, D. The CAI Analyser Package: Inferring gene expressivity from raw genomic data. Silico Boil. 2007, 7, 507. [Google Scholar]
  139. Pere, P.; Antoni, R.; Santiago, G. HEG-DB: A database of predicted highly expressed genes in prokaryotic complete genomes under translational selection. Nucleic Acids Res. 2008, 36, D524–D527. [Google Scholar] [CrossRef] [Green Version]
  140. Willenbrock, H.; Friis, C.; Friis, A.S.; Ussery, D. An environmental signature for 323 microbial genomes based on codon adaptation indices. Genome Boil. 2006, 7, R114. [Google Scholar] [CrossRef] [Green Version]
Figure 1. Phylogenetic tree based on 16S rRNA sequences with the Neighbor-joining (NJ) method of LZH-9, LZH-13, LZH-22, LZH-24, and other representative species. Bootstrap values are indicated at each node based on a total of 1000 bootstrap replicates.
Microorganisms 08 00716 g001
Figure 2. Scanning electron micrographs of strain Lysinibacillus pakistanensis LZH-9: (a) with magnification of 60,000; and (b) with magnification of 20,000.
Microorganisms 08 00716 g002
Figure 3. (a) Growth curves of strain Lysinibacillus pakistanensis LZH-9 under different NaCl concentrations, tested in triplicate. (b) Effects of incubation time on the COD removal efficiency percentage in synthetic wastewater. The initial concentration of NaCl was 1%, inoculum concentration was 5% and strain LZH-9 was cultured with an initial pH 7.0. (c) Effects of initial pH on the COD removal efficiency percentage in synthetic wastewater. The effect of initial pH was tested at the 4th day. The initial concentration of NaCl was 1%. (d) The effects of initial NaCl concentration on the COD removal efficiency in synthetic wastewater. The effect of initial NaCl concentration was tested at the 96 h.
Microorganisms 08 00716 g003
Figure 4. (a) Venn diagram showing the numbers of orthogroup including the core genome (shared by three strains of L. pakistanensis), the accessory genome (shared by some but not at all of these strains) and strain-specific gene families in individual genomes; enriched Gene ontology (GO) terms (p < 0.05) in respective orthogroups are shown in the tables. (b) Bar chart showing the total numbers of orthogroup identified in each genome of the three strains of L. pakistanensis. (c) The total numbers of orthogroups of strain-specific gene families (=1) or the accessory genome (shared by two, three strains) and core genome of three strains of L. pakistanensis.
Microorganisms 08 00716 g004
Figure 5. (a) Venn diagram showing the numbers of orthogroup including the core genome (shared by six representative strains of Lysinibacillus), the accessory genome (shared by some but not at all of these strains) and strain-specific gene families in individual genomes; enriched Gene ontology (GO) terms (p < 0.05) in respective orthogroups are shown in the tables. (b) Bar chart showing the total numbers of orthogroup identified in each genome of six representative strains of Lysinibacillus. (c) The total numbers of orthogroups of strain-specific gene families (=1) or the accessory genome (shared by two, three, four, five, six strains) and core genome of six representative strains of Lysinibacillus.
Microorganisms 08 00716 g005
Figure 6. Heat map showing the distribution and numbers of genes encoding carbohydrate active enzymes (CAZymes) in eight different Lysinibacillus strains in this study. Abbreviations in the chart: AA, auxiliary activities; CBM, carbohydrate-binding molecules; CE, carbohydrate esterases; GH, glycoside hydrolases; GT, glycosyltransferases; PL, polysaccharide lyases.
Microorganisms 08 00716 g006
Figure 7. (a) Ranges of Codon Adaption Index (CAI) values of different genes in the genome of L. pakistanensis LZH-9 based on COG classification. (b) Ranges of CAI values of different genes in the genome of L. pakistanensis JCM 18,776 based on COG classification. (c) Ranges of CAI values of different genes in the genome of Lysinibacillus sp. UBA7518 based on COG classification. (COG categories description J: Translation, ribosomal structure and biogenesis; K: Transcription; L: Replication, recombination and repair; D: Cell cycle control, cell division, chromosome partitioning; V: Defense mechanisms; T: Signal transduction mechanisms; M: Cell wall/membrane/envelope biogenesis; N: Cell motility; U: Intracellular trafficking, secretion, and vesicular transport; O: Posttranslational modification, protein turnover, chaperones; C: Energy production and conversion; G: Carbohydrate transport and metabolism; E: Amino acid transport and metabolism; F: Nucleotide transport and metabolism; H: Coenzyme transport and metabolism; I: Lipid transport and metabolism; P: Inorganic ion transport and metabolism; Q: Secondary metabolites biosynthesis, transport and catabolism; X: Mobilome: prophages, transposons; R: General function prediction only; S: Function unknown).
Microorganisms 08 00716 g007
Table 1. Based on 16S rRNA and chemical oxygen demand (COD) removal efficiency of four halotolerant bacteria.
StrainOriginPhylumClosest Type StrainSimilarity (%)Salt Tolerance (%)COD Removal Percentage (%)
LZH-9Activated sludgeFirmicutesLysinibacillus pakistanensis JCM 18776T100.001469.8
LZH-13Activated sludge FirmicutesPseudomonas hunanensis
LVT
98.871257.35
LZH-22Activated sludge FirmicutesStaphylococcus sciuri
DSM 20345T
99.932054.6
LZH-24Activated sludge FirmicutesLysinibacillus pakistanensis JCM 18776T100.001265.43
Table 2. For features of the eight Lysinibacillus genomes involved in this study.
Organism/NameStrainGenbank or IMG Acc. no.LevelCompleteness (%)Size (Mb)Coding Density (%)GC (%)GeneProteinSourceReference
Lysinibacillus pakistanensisJCM
18776
GCA_001312325.1
/2728369720
Draft99.15.0177.736.383288216rhizospheric soil of legume[60]
Lysinibacillus contaminansDSM
25560
GCA_001278945.1
/2648501842
Draft98.14.182.237.338793666Surface water[10]
Lysinibacillus xylanilyticust26GCA_002803495.1Draft99.45.6979.936.860455584//
Lysinibacillus sp.UBA7518GCA_002478295.1Draft88.64.0671.537.839693915//
Lysinibacillus sphaericusOT4b.31GCA_000392615.1
/2524614537
Draft99.24.8681.537.546874441Beetle larvae[10]
Lysinibacillus mangiferihumiM-GX18GCA_003049665.1
/2791355086
Draft99.45.3182.636.755905187//
Lysinibacillus pakistanensisLZH-9GCA_009649975.1
/2823662158
Complete1004.9983.736.652634990Activated sludgeThis study.
Lysinibacillus parviboronicapiensVT1065GCA_003049605.1
/2802429645
Draft98.34.748237.546764351//

