Microbiome Signatures in a Fast- and Slow-Progressing Gastric Cancer Murine Model and Their Contribution to Gastric Carcinogenesis

 , and
, and 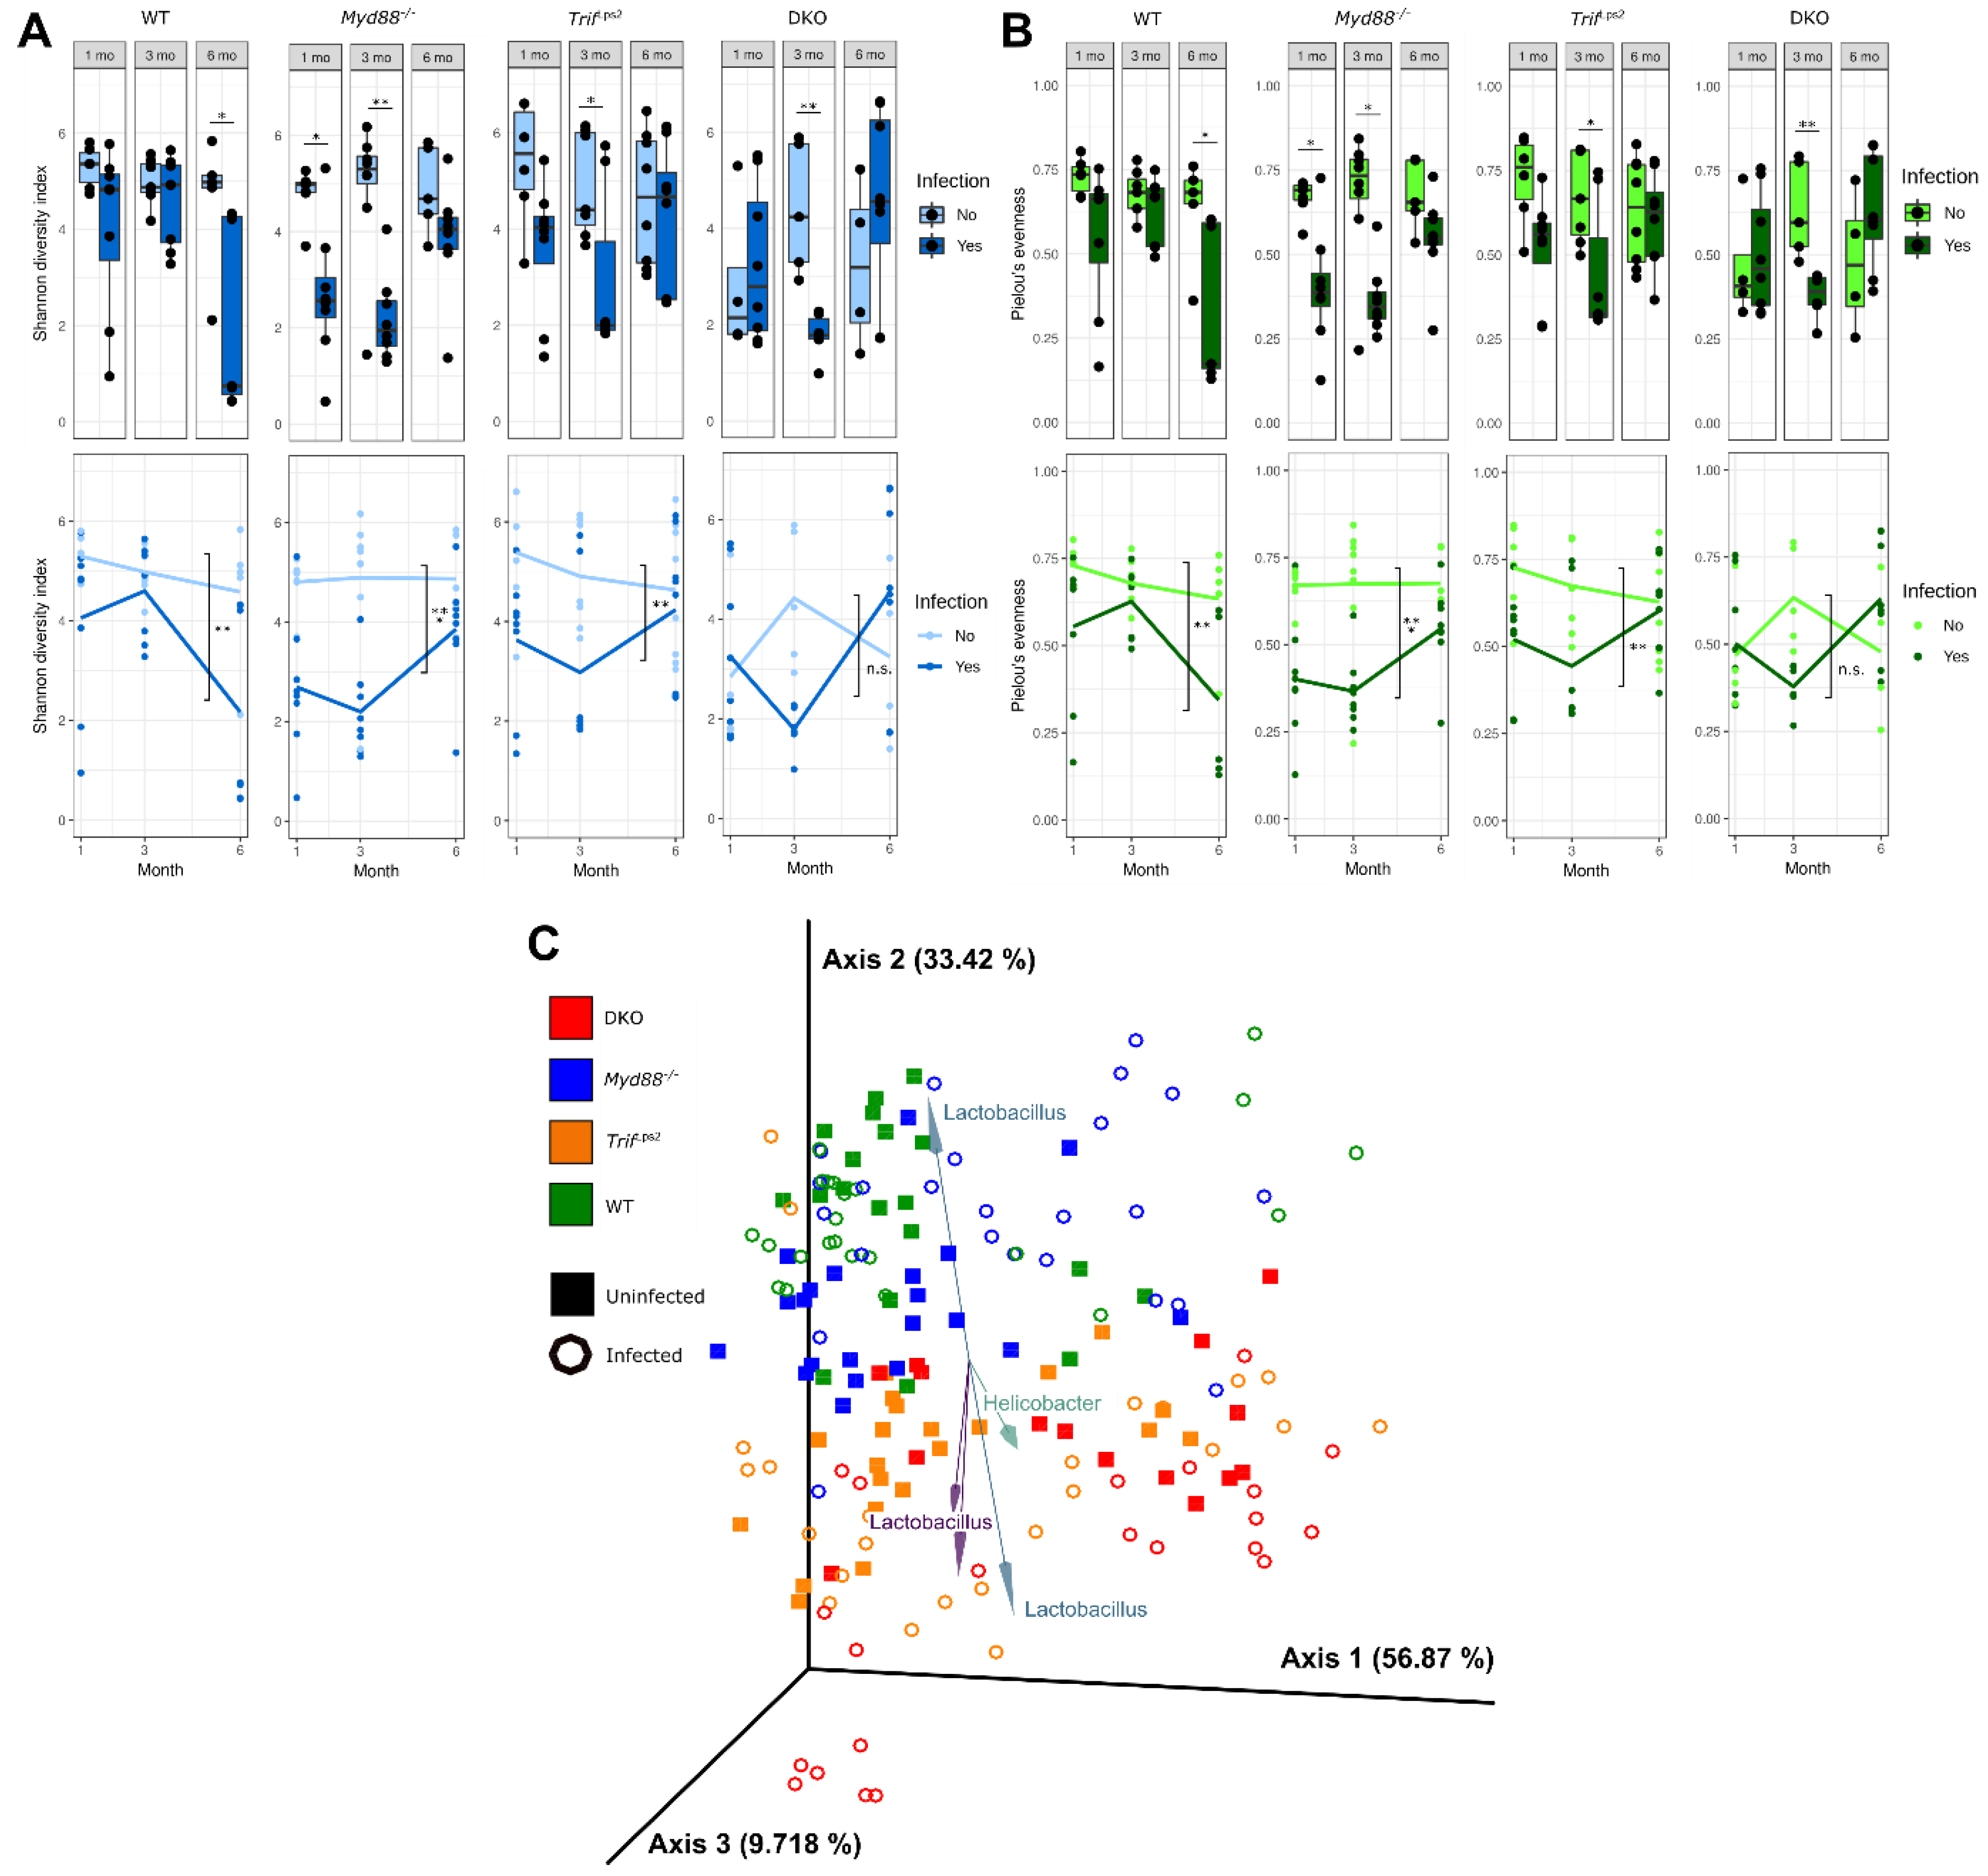
Abstract
:1. Introduction
2. Material and Methods
2.1. Animals
2.2. Bacterial Growth Conditions
2.3. Mouse Infections
2.4. Histology
2.5. DNA Extraction
2.6. 16. S rRNA Gene Sequencing
2.7. Bioinformatics Processing
2.8. Statistics
3. Results
3.1. Gastric Mucosal Microbial Diversity Varies with Infection Status and Genotype
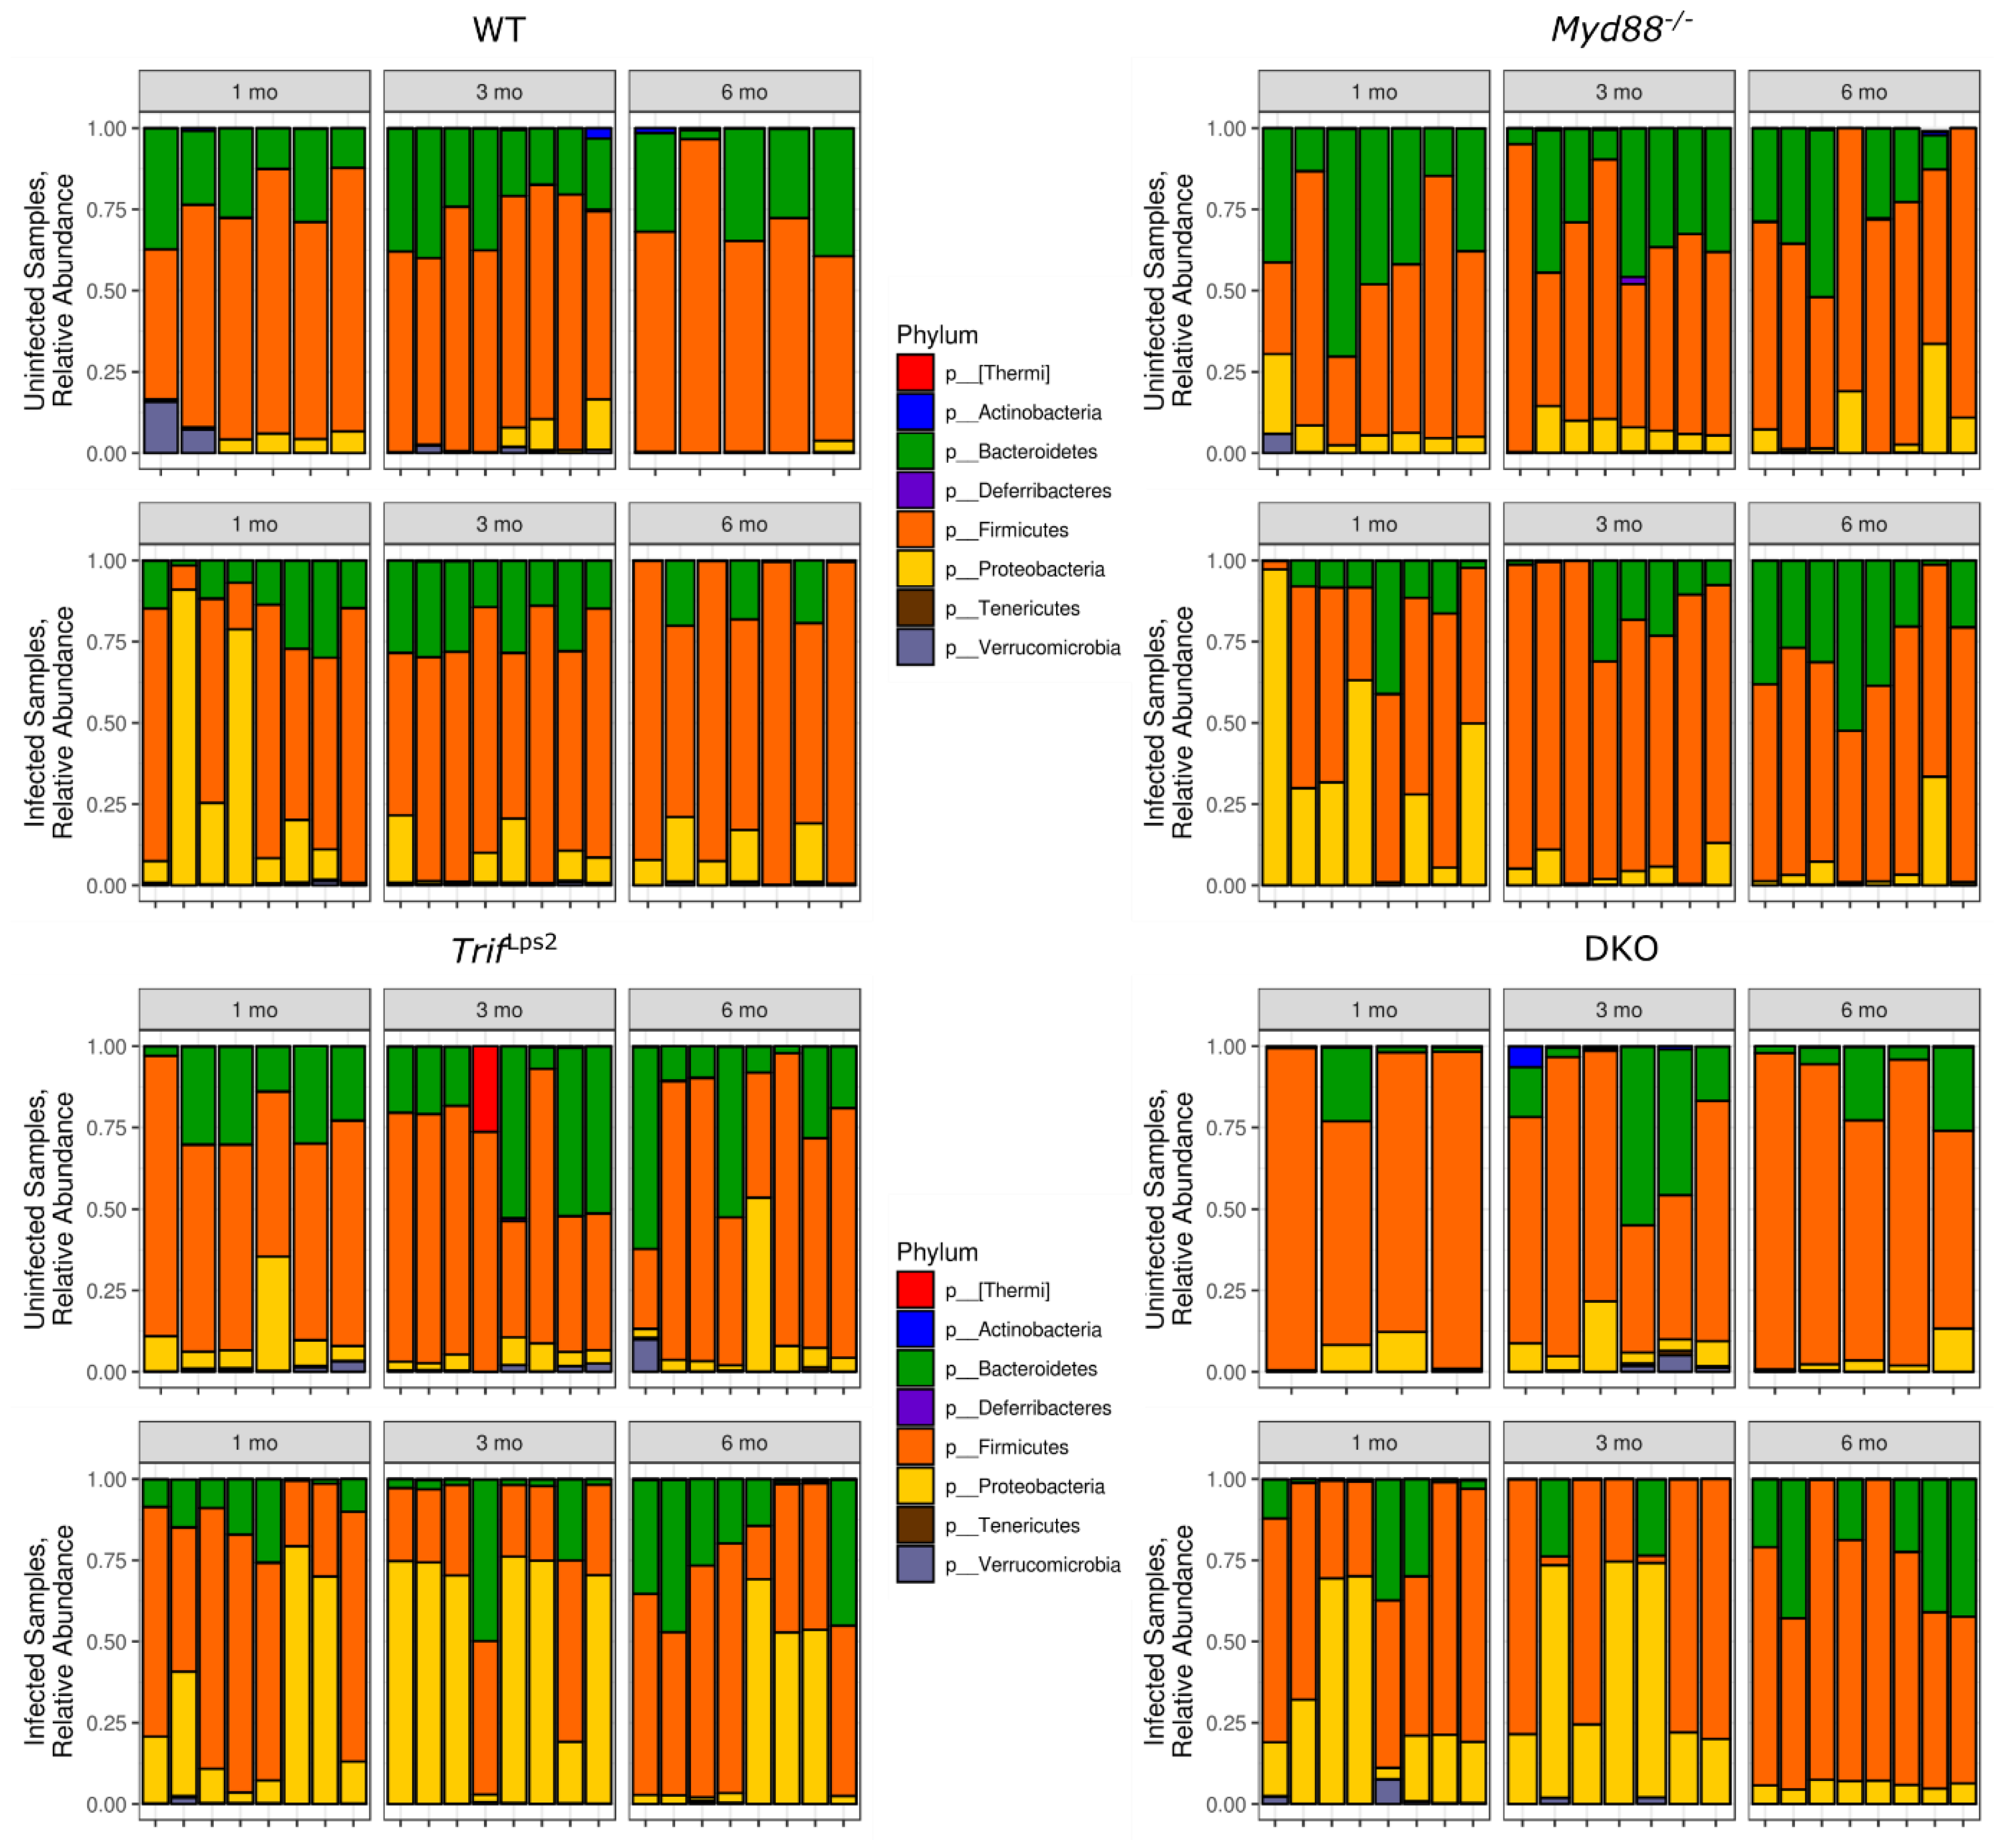
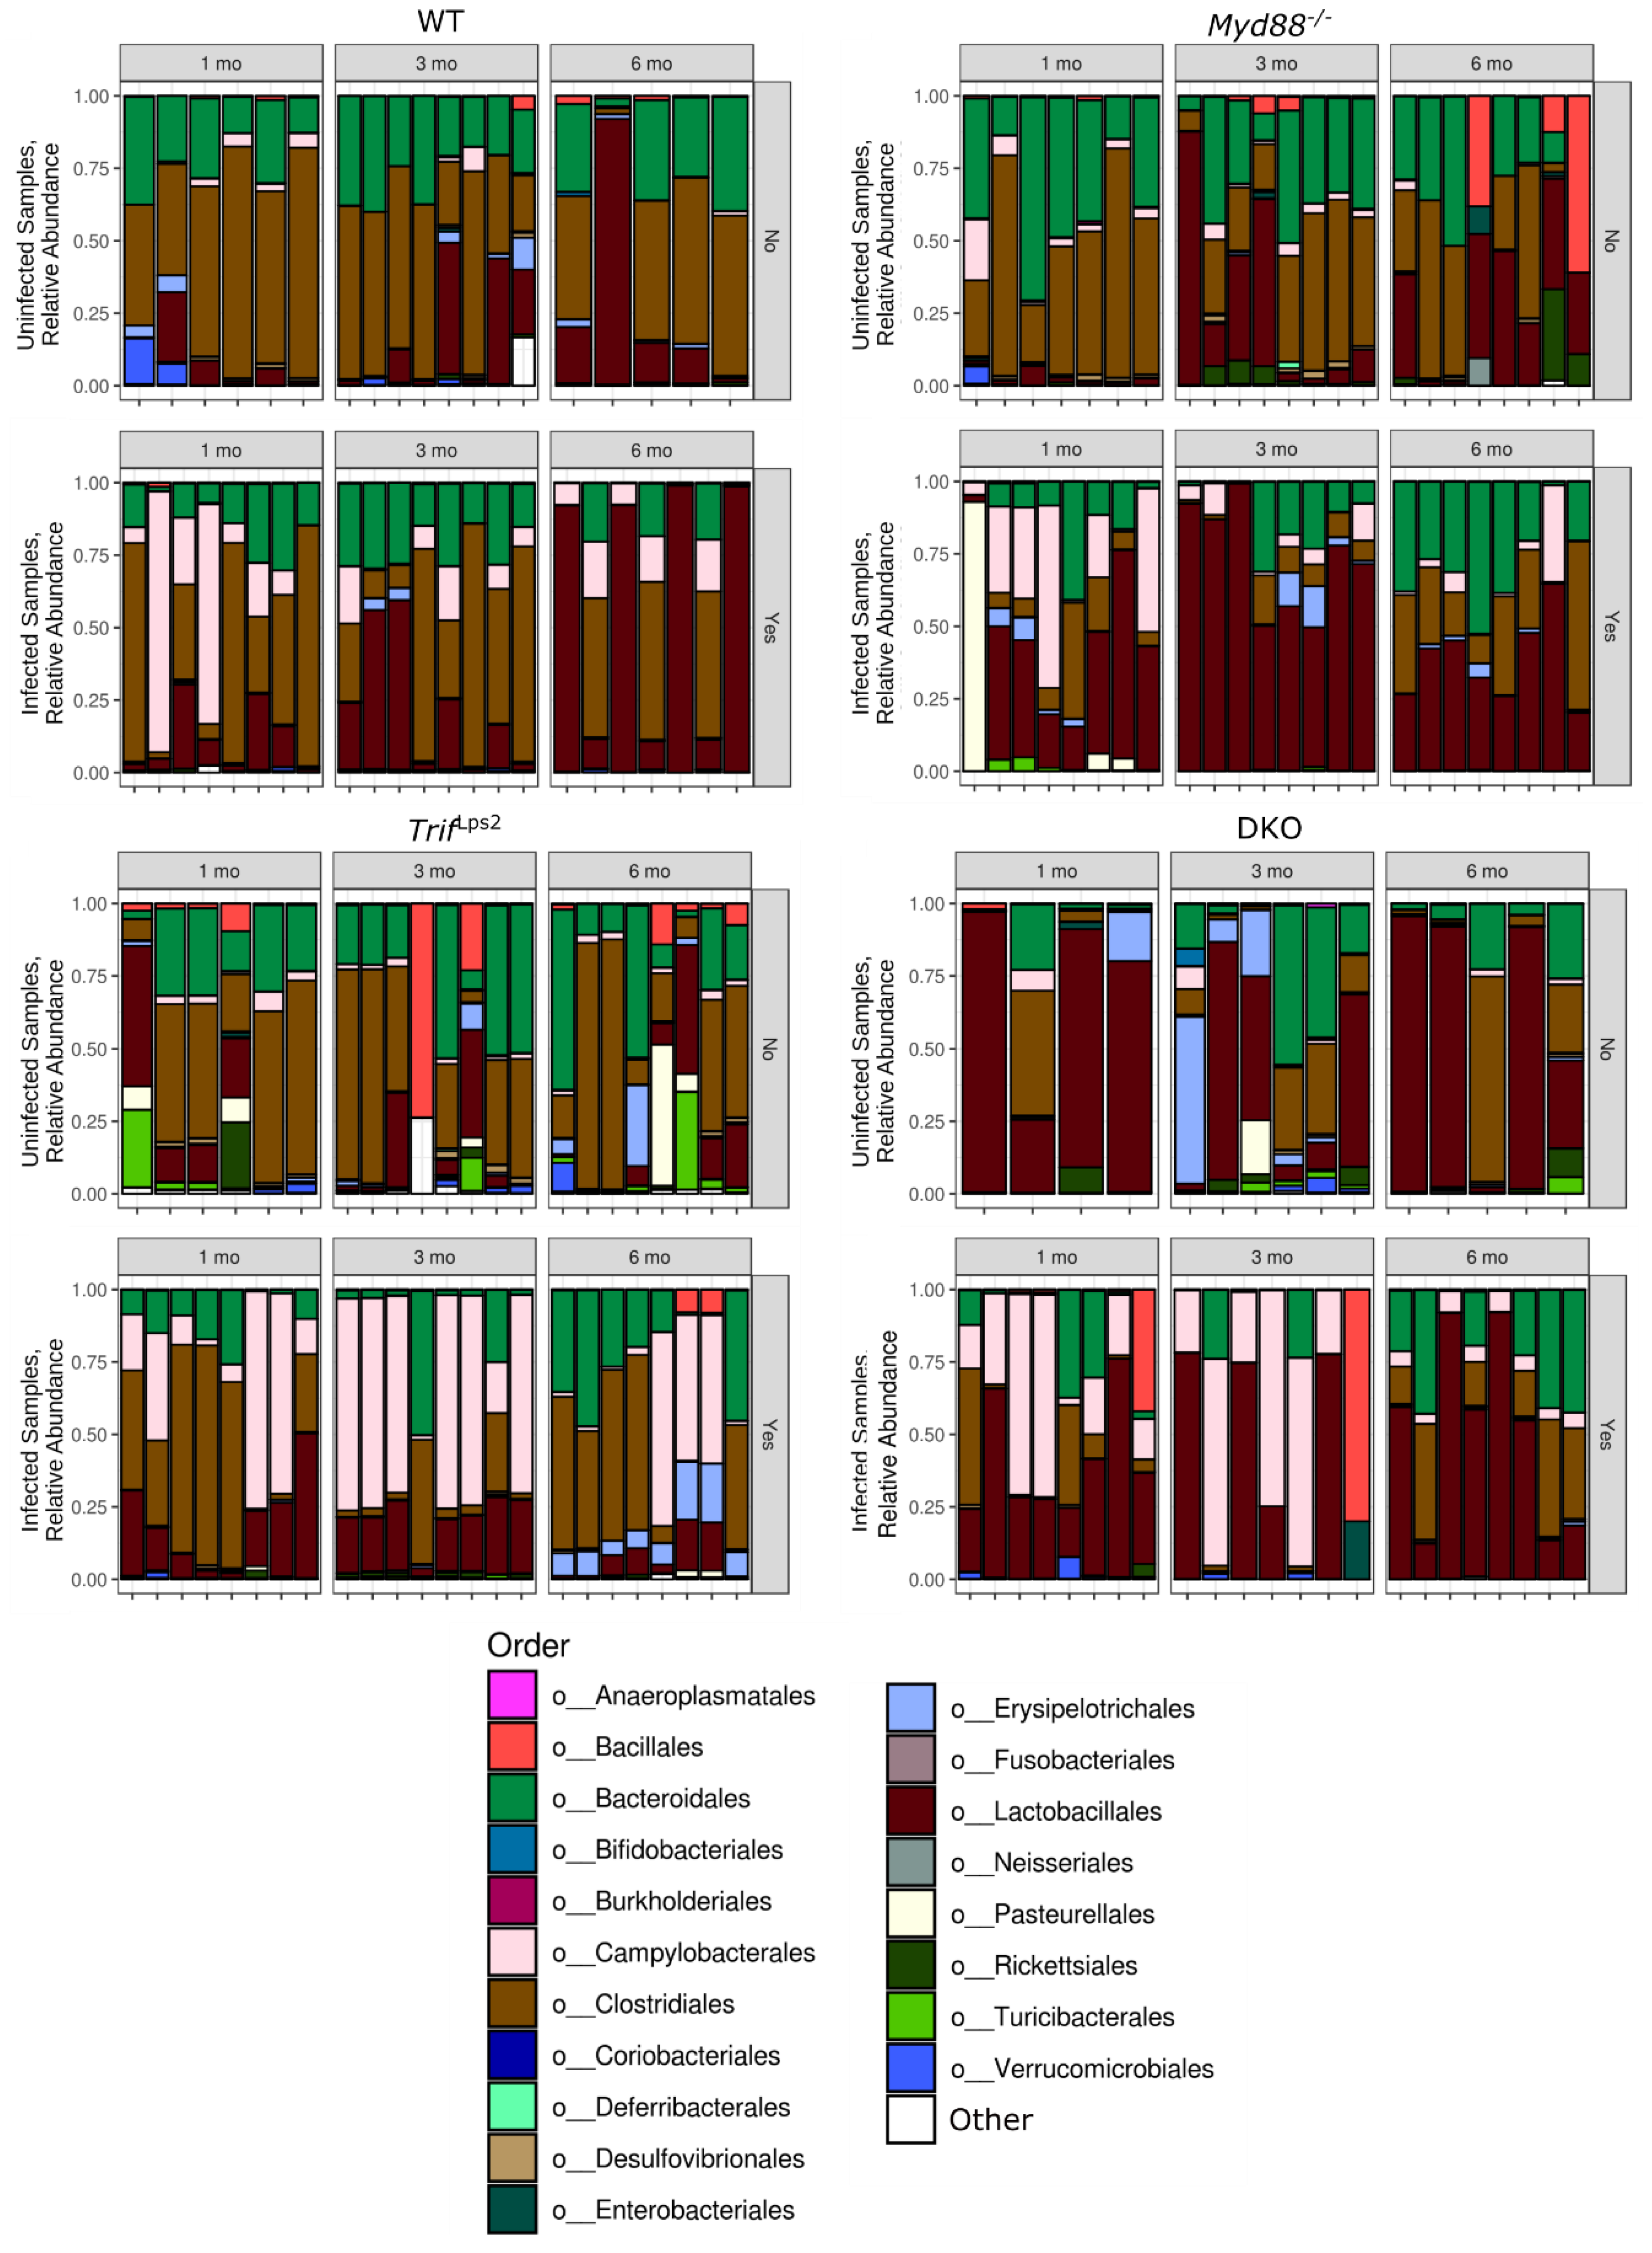
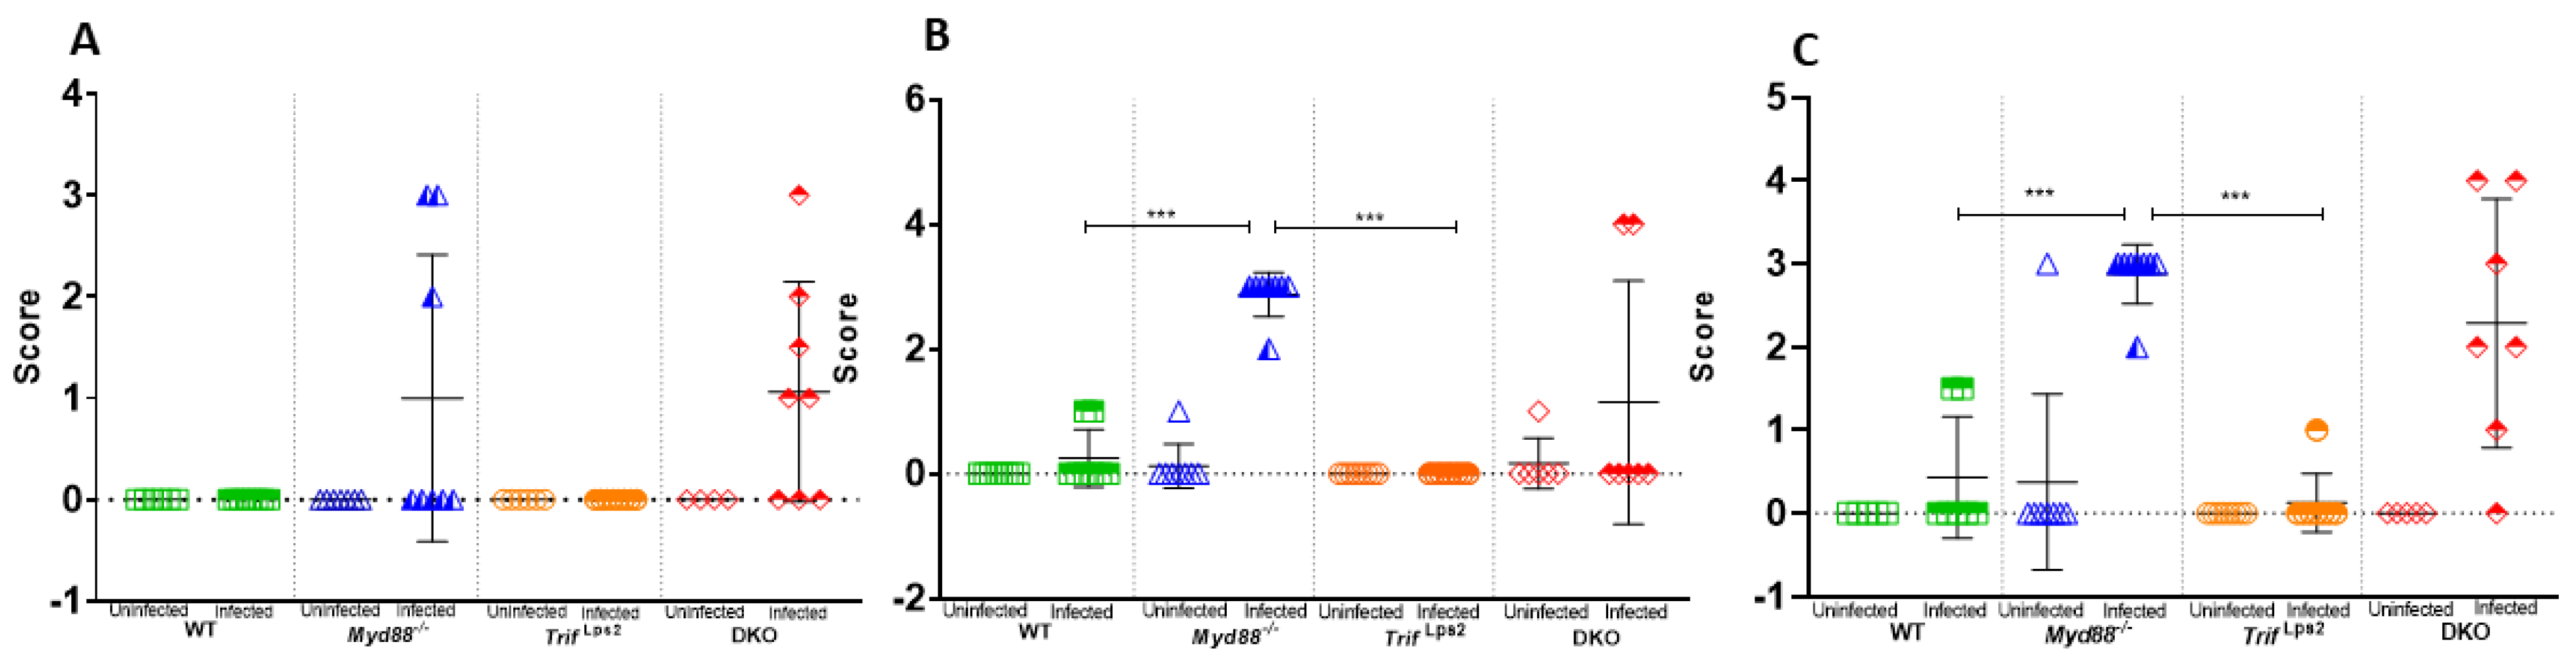
3.2. Variation in Abundance of Microbial Taxa in Different Genotypes over Time and after H. Felis Infections
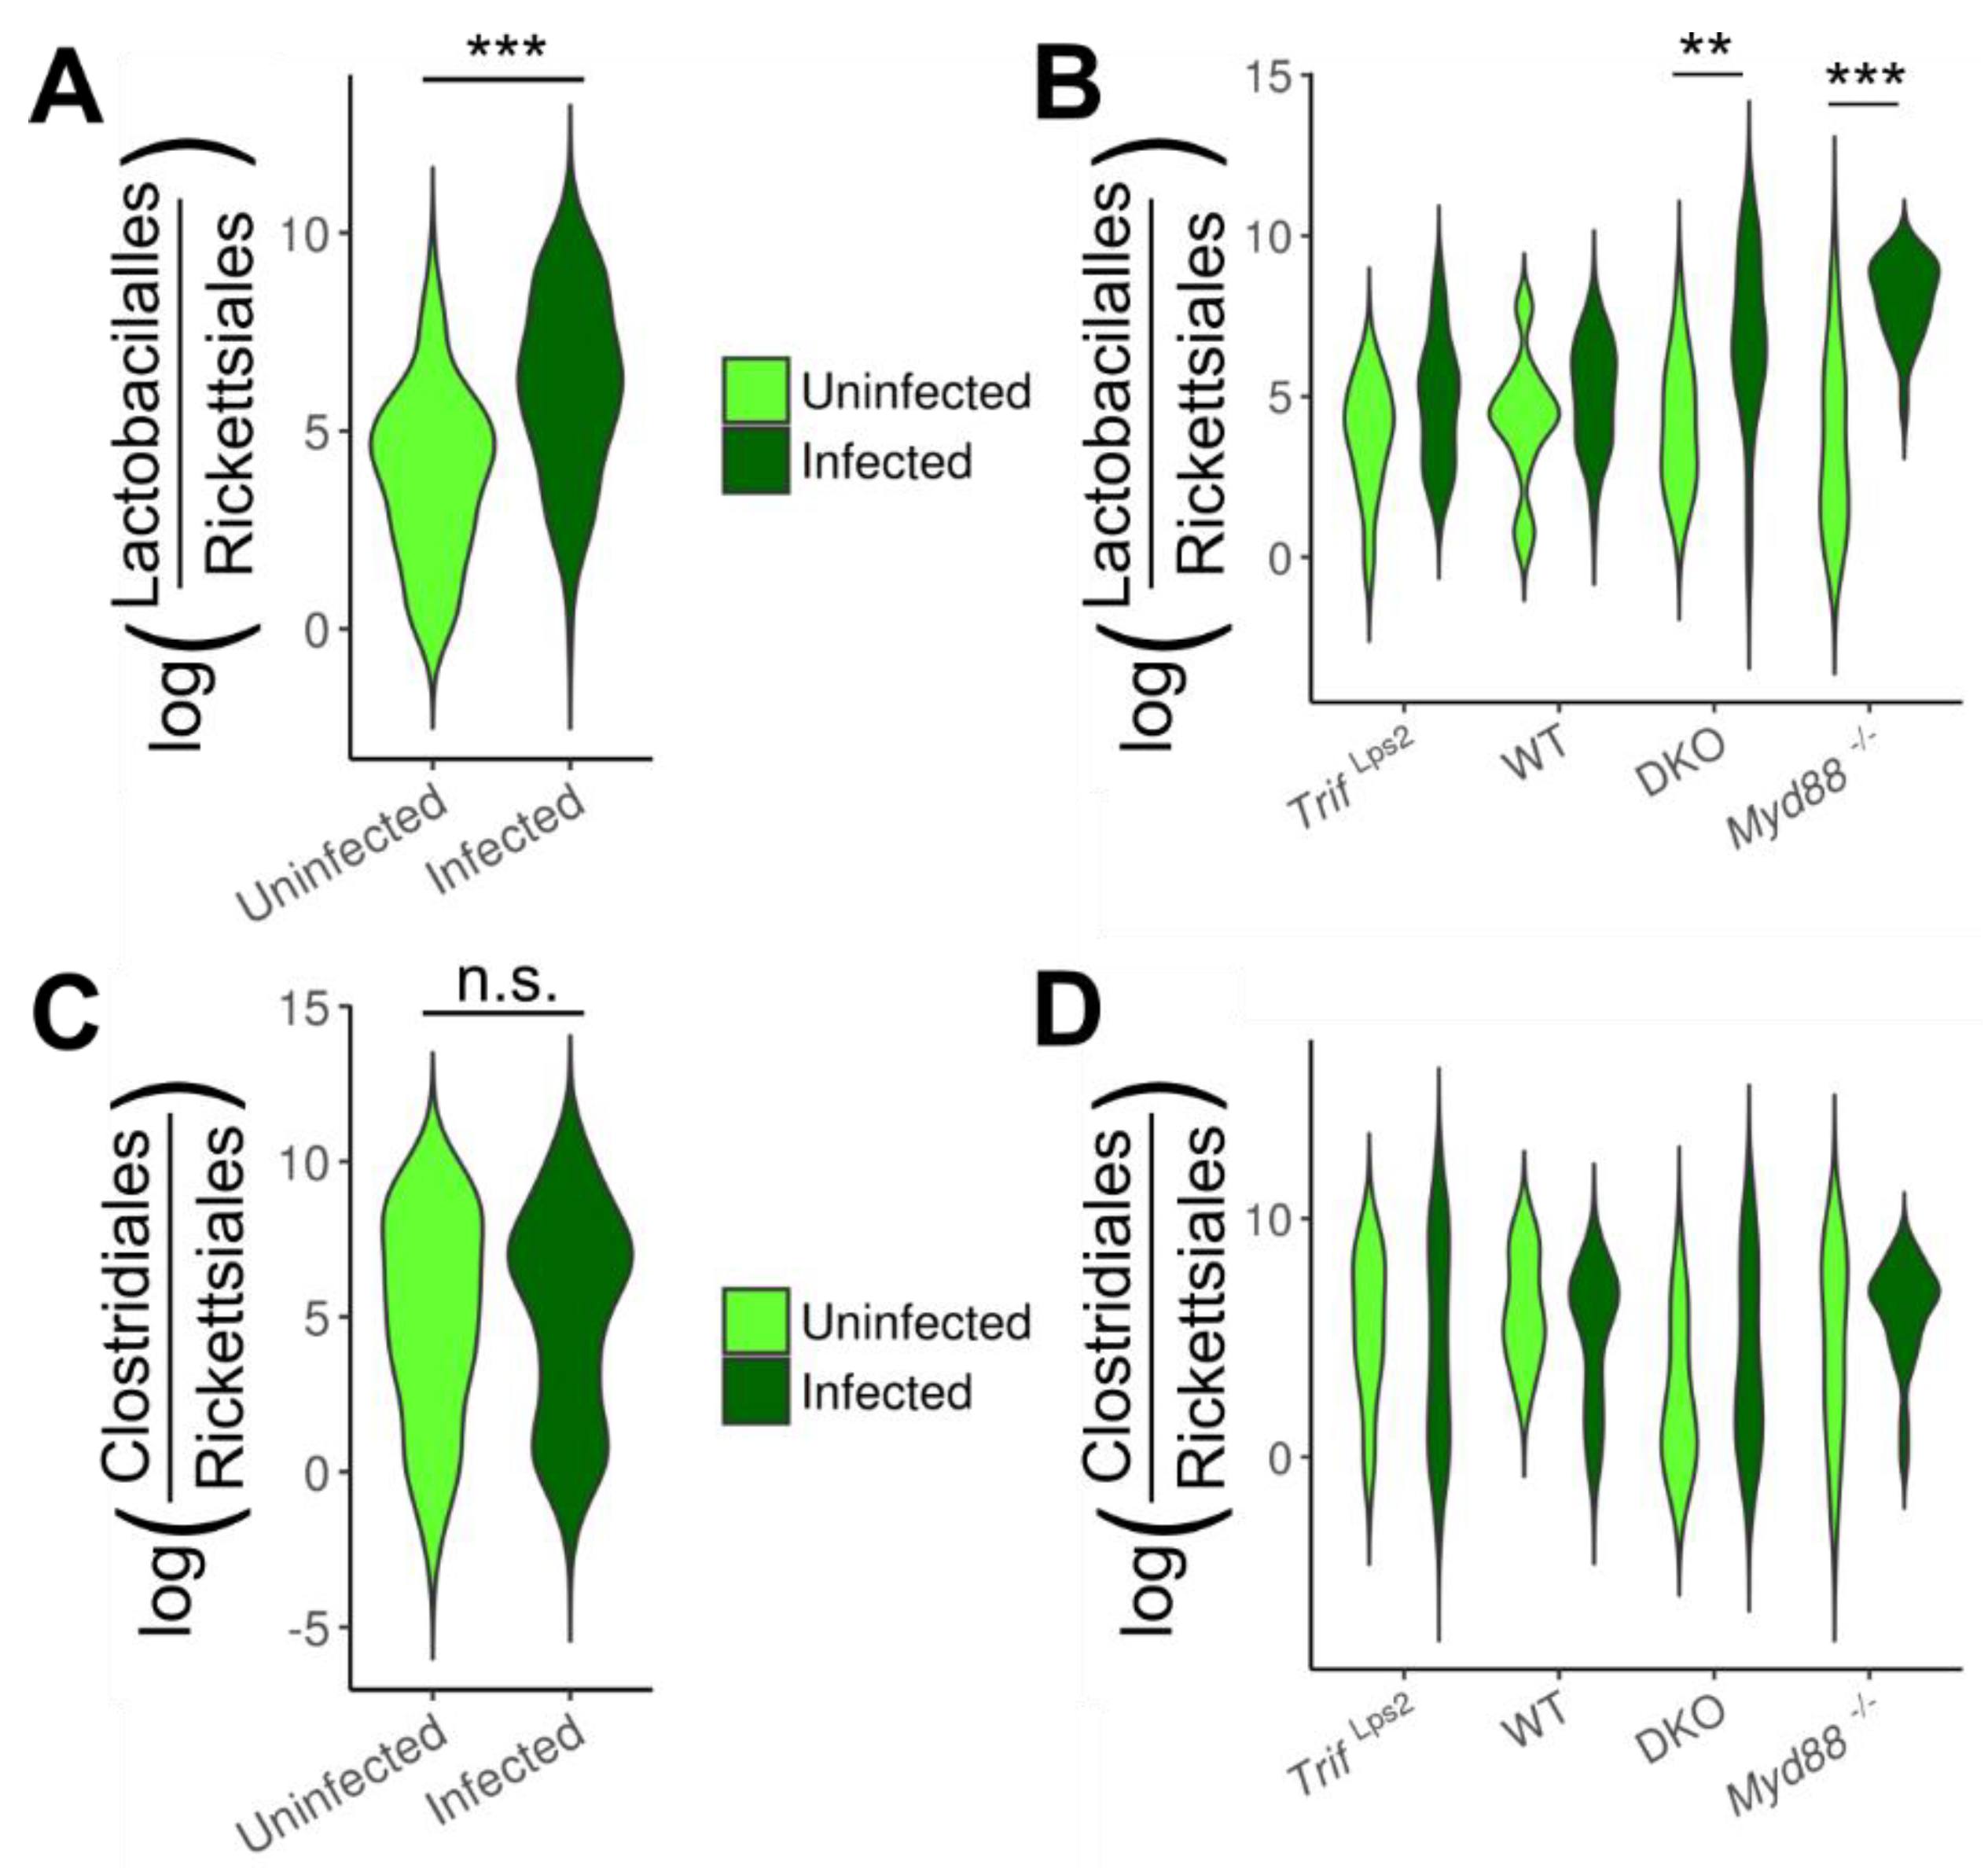
3.3. Association of Lactobacillales with Infection and Mouse Genotype
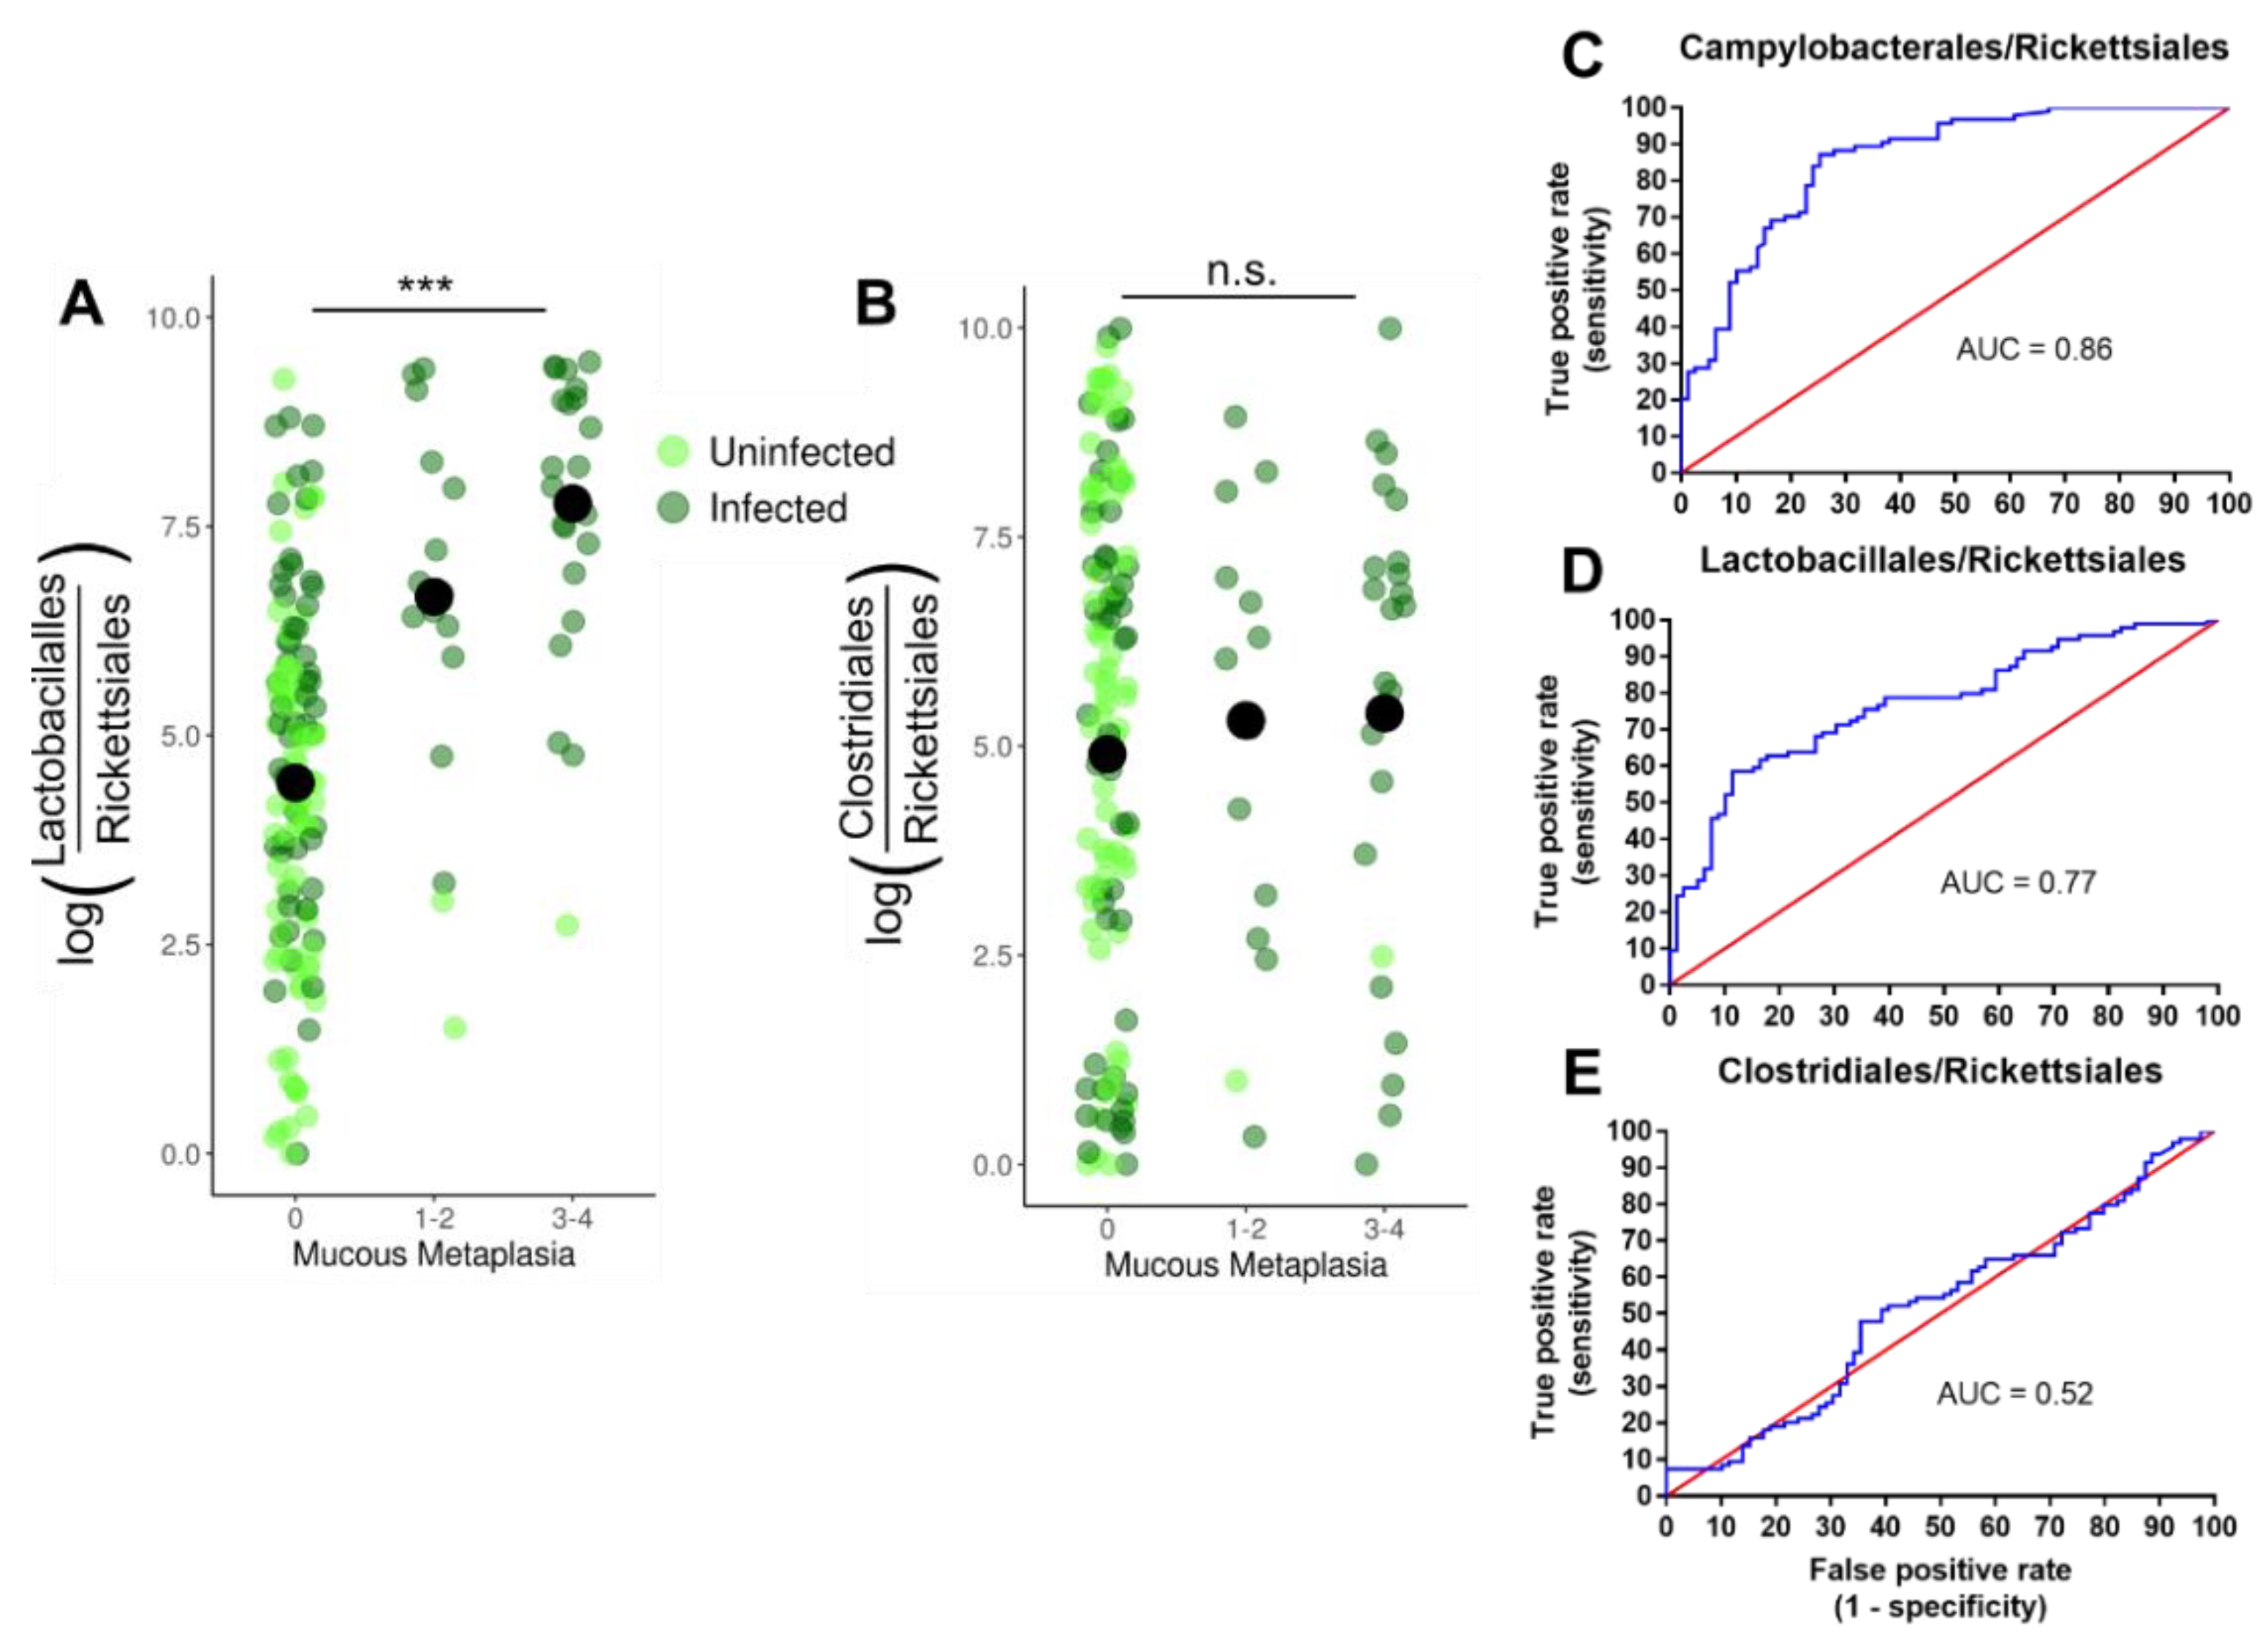
3.4. Lactobacillales Are Associated with Gastric Cancer Progression
4. Discussion
5. Conclusions
Supplementary Materials
Author Contributions
Funding
Institutional Review Board Statement
Informed Consent Statement
Data Availability Statement
Acknowledgments
Conflicts of Interest
Abbreviations
| H. pylori | Helicobacter pylori |
| WHO | World Health Organization |
| Myd88−/− | Myeloid differentiation primary response 88- deficient |
| H. felis | Helicobacter felis |
| TRIF | Toll/IL-1R (TIR) domain-containing adaptor-inducing interferon-β |
| TrifLps2 | TRIF deficient |
| WT | Wild Type |
| DKO | double knockout |
| BHI | Brain Heart Infusion |
| QIIME2 | Quantitative Insights into Microbial Ecology |
| TIR | Toll/interleukin-1 receptor |
| SEPP | SATé-enabled phylogenetic placement |
| OTU | Operational taxonomic unit |
| ROC | Receiver operating characteristic |
| FDR | False-discovery rate |
| INS-GAS | insulin-gastrin |
| IFN | interferon |
References
- World Health Organization. Cancer. WHO. Available online: https://www.who.int/news-room/fact-sheets/detail/cancer (accessed on 12 September 2018).
- Schistosomes, liver flukes and Helicobacter pylori. IARC Working Group on the Evaluation of Carcinogenic Risks to Humans. Lyon, 7–14 June 1994. IARC Monogr. Eval. Carcinog. Risks Hum. 1994, 61, 1–241. Available online: https://0-www-ncbi-nlm-nih-gov.brum.beds.ac.uk/books/NBK487782/ (accessed on 15 January 2021).
- Noto, J.M.; Peek, R.M., Jr. The gastric microbiome, its interaction with Helicobacter pylori, and its potential role in the progression to stomach cancer. PLoS Pathog. 2017, 13, e1006573. [Google Scholar] [CrossRef] [PubMed] [Green Version]
- Aziz, F.; Chakarobaty, A.; Liu, K.; Yoshitomi, H.; Li, X.; Monts, J.; Xu, G.; Li, Y.; Bai, R.; Bode, A.M.; et al. Gastric tumorigenesis induced either by Helicobacter pylori infection or chronic alcohol consumption through IL-10 inhibition. Res. Sq. 2020. [Google Scholar] [CrossRef] [Green Version]
- Majmudar, K.; Golemi, I.; Tafur, A.J.; Toro, J.D.; Visonà, A.; Falgá, C.; Sahuquillo, J.C.; Lorente, M.A.; Tufano, A.; Weinberg, I.; et al. RIETE Investigators. Outcomes after venous thromboembolism in patients with gastric cancer: Analysis of the RIETE Registry. Vasc. Med. 2020, 25, 210–217. [Google Scholar] [CrossRef] [PubMed]
- Petra, C.V.; Rus, A.; Dumitraşcu, D.L. Gastric microbiota: Tracing the culprit. Clujul Med. 2017, 90, 369–376. [Google Scholar] [CrossRef] [Green Version]
- Delgado, S.; Cabrera-Rubio, R.; Mira, A.; Suárez, A.; Mayo, B. Microbiological Survey of the Human Gastric Ecosystem Using Culturing and Pyrosequencing. Methods Microb. Ecol. 2013, 65, 763–772. [Google Scholar] [CrossRef]
- Banerjee, A.; Thamphiwatana, S.; Carmona, E.M.; Rickman, B.; Doran, K.S.; Obonyo, M. Deficiency of the myeloid differentiation primary response molecule MyD88 leads to an early and rapid development of Helicobacter-induced gastric malignancy. Infect. Immun. 2014, 82, 356–363. [Google Scholar] [CrossRef] [Green Version]
- Zhang, S.; Moss, S.F. Rodent models of Helicobacter infection, inflammation, and disease. Methods Mol. Biol. 2012, 921, 89–98. [Google Scholar]
- Cai, X.; Carlson, J.; Stoicov, C.; Li, H.; Wang, T.C.; Houghton, J. Helicobacter felis eradication restores normal architecture and inhibits gastric cancer progression in C57BL/6 mice. Gastroenterology 2005, 128, 1937–1952. [Google Scholar] [CrossRef]
- Correa, P.; Haenszel, W.; Cuello, C.; Tannenbaum, S.; Archer, M. A model for gastric cancer epidemiology. Lancet 1975, 2, 58–60. [Google Scholar] [CrossRef]
- Obonyo, M.; Rickman, B.; Guiney, D.G. Effects of myeloid differentiation primary response gene 88 (MyD88) activation on Helicobacter infection in vivo and induction of a Th17 response. Helicobacter 2011, 16, 398–404. [Google Scholar] [CrossRef] [PubMed] [Green Version]
- Mejias-Luque, R.; Lozano-Pope, I.; Wanisch, A.; Heikenwalder, M.; Gerhard, M.; Obonyo, M. Increased LIGHT expression and activation of non-canonical NF-kappaB are observed in gastric lesions of MyD88-deficient mice upon Helicobacter felis infection. Sci. Rep. 2019, 9, 1–9. [Google Scholar] [CrossRef] [PubMed] [Green Version]
- Rogers, A.B.; Taylor, N.S.; Whary, M.T.; Stefanich, E.D.; Wang, T.C.; Fox, J.G. Helicobacter pylori but not high salt induces gastric intraepithelial neoplasia in B6129 mice. Cancer Res. 2005, 65, 10709–10715. [Google Scholar] [CrossRef] [PubMed] [Green Version]
- Bolyen, E.; Rideout, J.R.; Dillon, M.R.; Bokulich, N.A.; Abnet, C.C.; Al-Ghalith, G.A.; Alexander, H.; Alm, E.J.; Arumugam, M.; Asnicar, F.; et al. Reproducible, interactive, scalable and extensible microbiome data science using QIIME 2. Nat. Biotechnol. 2019, 37, 852–857. [Google Scholar] [CrossRef] [PubMed]
- Amir, A.; McDonald, D.; Navas-Molina, J.A.; Kopylova, E.; Morton, J.T.; Zech Xu, Z.; Kightley, E.P.; Thompson, L.R.; Hyde, E.R.; Gonzalez, A.; et al. Deblur Rapidly Resolves Single-Nucleotide Community Sequence Patterns. mSystems 2017, 2, e00191-16. [Google Scholar] [CrossRef] [Green Version]
- Janssen, S.; McDonald, D.; Gonzalez, A.; Navas-Molina, J.A.; Jiang, L.; Zech Xu, Z.; Winker, K.; Kado, M.D.; Orwoll, E.; Manary, M.; et al. Phylogenetic Placement of Exact Amplicon Sequences Improves Associations with Clinical Information. mSystems 2018, 3, e00021-18. [Google Scholar] [CrossRef] [Green Version]
- McMurdie, P.J.; Holmes, S. Phyloseq: An R Package for Reproducible Interactive Analysis and Graphics of Microbiome Census Data. PLoS ONE 2013, 8, e61217. [Google Scholar] [CrossRef] [Green Version]
- Martino, C.; Morton, J.T.; Marotz, C.A.; Thompson, L.R.; Tripathi, A.; Knight, R.; Zengler, K. A novel sparse compositional technique reveals microbial perturbations. mSystems 2019, 4, 1–13. [Google Scholar] [CrossRef] [Green Version]
- Morton, J.T.; Marot, C.; Washburne, A.; Silverman, J.; Zaramela, L.S.; Edlund, A.; Zengler, K.; Knight, R. Establishing microbial composition measurement standards with reference frames. Nat. Commun. 2019, 10, 1–11. [Google Scholar] [CrossRef] [Green Version]
- Fedarko, M.W.; Martino, C.; Morton, J.T.; Gonzalez, A.; Rahman, G.; Marotz, C.A.; Minich, J.J.; Allen, E.E.; Knight, R. Visualizing ’omic feature rankings and log-ratios using Qurro. NAR Genom. Bioinform. 2020, 2, lqaa023. [Google Scholar] [CrossRef]
- Gloor, G.B.; Macklaim, J.M.; Pawlowsky-Glahn, V.; Egozcue, J.J. Microbiome Datasets Are Compositional: And This Is Not Optional. Front. Microbiol. 2017, 8, 2224. [Google Scholar] [CrossRef] [PubMed] [Green Version]
- Human Microbiome Project Consortium. Structure, function and diversity of the healthy human microbiome. Nature 2012, 486, 207–214. [Google Scholar] [CrossRef] [PubMed] [Green Version]
- Nicholson, J.K.; Holmes, E.; Kinross, J.; Burcelin, R.; Gibson, G.; Jia, W.; Pettersson, S. Host-gut microbiota metabolic interactions. Science 2012, 336, 1262–1267. [Google Scholar] [CrossRef] [PubMed] [Green Version]
- Lozupone, C.A.; Stombaugh, J.I.; Gordon, J.I.; Jansson, J.K.; Knight, R. Diversity, stability and resilience of the human gut microbiota. Nature 2012, 489, 220–230. [Google Scholar] [CrossRef] [PubMed] [Green Version]
- Lofgren, J.L.; Whary, M.T.; Ge, Z.; Muthupalani, S.; Taylor, N.S.; Mobley, M.; Potter, A.; Varro, A.; Eibach, D.; Suerbaum, S.; et al. Lack of commensal flora in Helicobacter pylori-infected INS-GAS mice reduces gastritis and delays intraepithelial neoplasia. Gastroenterology 2011, 140, 210–220. [Google Scholar] [CrossRef] [PubMed] [Green Version]
- Dicksved, J.; Lindberg, M.; Rosenquist, M.; Enroth, H.; Jansson, J.K.; Engstrand, L. Molecular characterization of the stomach microbiota in patients with gastric cancer and in controls. J. Med. Microbiol. 2009, 58, 509–516. [Google Scholar] [CrossRef] [PubMed]
- Houben, G.M.; Stockbrügger, R.W. Bacteria in the aetio-pathogenesis of gastric cancer: A review. Scand. J. Gastroenterol. Suppl. 1995, 212, 13–18. [Google Scholar] [CrossRef]
- Basir, H.R.G.; Ghobakhlou, M.; Akbari, P.; Dehghan, A.; Rabiei, M.A.S. Correlation between the intensity of Helicobacter pylori colonization and severity of gastritis. Gastroenterol. Res. Pract. 2017, 10, 1155–1159. [Google Scholar]
- Sayin, S. The Relation between Helicobacter Pylori Density and Gastritis Severity. Int. Arch. Intern. Med. 2019, 3, 019. [Google Scholar]
- Yakoob, M.Y.; Hussainy, A.S. Chronic gastritis and Helicobacter pylori: A histopathological study of gastric mucosal biopsies. J. Coll. Physicians Surg. Pak. 2010, 20, 773–775. [Google Scholar]
- Ardakani, A.; Mohammadizadeh, F. The study of relationship between Helicobacter pylori density in gastric mucosa and the severity and activity of chronic gastritis. JRMS 2006, 11, 282. [Google Scholar]
- Eun, C.S.; Kim, B.K.; Han, D.S.; Kim, S.Y.; Kim, K.M.; Choi, B.Y.; Song, K.S.; Kim, Y.S.; Kim, J.F. Differences in gastric mucosal microbiota profiling in patients with chronic gastritis, intestinal metaplasia, and gastric cancer using pyrosequencing methods. Helicobacter 2014, 19, 407–416. [Google Scholar] [CrossRef] [PubMed]
- Castaño-Rodríguez, N.; Goh, K.H.; Fock, M.K.; Mitchell, H.M.; Kaakoush, N.O. Dysbiosis of the microbiome in gastric carcinogenesis. Nat. Sci. Rep. 2017, 7, 1–9. [Google Scholar]
- Doherty, J.R.; Cleveland, J.L. Targeting lactate metabolism for cancer therapeutics. J. Clin. Investig. 2013, 123, 3685–3692. [Google Scholar] [CrossRef] [PubMed]
- Kennedy, K.M.; Scarbrough, P.M.; Ribeiro, A.; Richardson, R.; Yuan, H.; Sonveaux, P.; Landon, C.D.; Chi, J.-T.; Pizzo, S.; Schroeder, T.; et al. Catabolism of exogenous lactate reveals it as a legitimate metabolic substrate in breast cancer. PLoS ONE 2013, 8, e75154. [Google Scholar] [CrossRef] [PubMed] [Green Version]
- Sonveaux, P.; Copetti, T.; Saedeleer, C.J.D.; Végran, F.; Verrax, J.; Kennedy, K.M.; Moon, E.J.; Dhup, S.; Danhier, P.; Frérart, F.; et al. Targeting the lactate transporter MCT1 in endothelial cells inhibits lactate-induced HIF-1 activation and tumor angiogenesis. PLoS ONE 2013, 7, e33418. [Google Scholar] [CrossRef]
- Sonveaux, P.; Végran, F.; Schroeder, T.; Wergin, M.C.; Verrax, J.; Rabbani, Z.N.; Saedeleer, C.J.D.; Kennedy, K.M.; Diepart, C.; Jordan, B.F.; et al. Targeting lactate-fueled respiration selectively kills hypoxic tumor cells in mice. J. Clin. Investig. 2008, 118, 3930–3942. [Google Scholar] [CrossRef] [Green Version]
- Hsieh, Y.; Tung, S.; Pan, H.; Yen, C.-W.; Xu, H.-W.; Lin, Y.-J.; Deng, Y.-F.; Hsu, W.-T.; Wu, C.-S.; Li, C. Increased Abundance of Clostridium and Fusobacterium in Gastric Microbiota of Patients with Gastric Cancer in Taiwan. Sci. Rep. 2018, 8, 1–11. [Google Scholar] [CrossRef]


Publisher’s Note: MDPI stays neutral with regard to jurisdictional claims in published maps and institutional affiliations. |
© 2021 by the authors. Licensee MDPI, Basel, Switzerland. This article is an open access article distributed under the terms and conditions of the Creative Commons Attribution (CC BY) license (http://creativecommons.org/licenses/by/4.0/).
Share and Cite
Bali, P.; Coker, J.; Lozano-Pope, I.; Zengler, K.; Obonyo, M. Microbiome Signatures in a Fast- and Slow-Progressing Gastric Cancer Murine Model and Their Contribution to Gastric Carcinogenesis. Microorganisms 2021, 9, 189. https://0-doi-org.brum.beds.ac.uk/10.3390/microorganisms9010189
Bali P, Coker J, Lozano-Pope I, Zengler K, Obonyo M. Microbiome Signatures in a Fast- and Slow-Progressing Gastric Cancer Murine Model and Their Contribution to Gastric Carcinogenesis. Microorganisms. 2021; 9(1):189. https://0-doi-org.brum.beds.ac.uk/10.3390/microorganisms9010189
Chicago/Turabian StyleBali, Prerna, Joanna Coker, Ivonne Lozano-Pope, Karsten Zengler, and Marygorret Obonyo. 2021. "Microbiome Signatures in a Fast- and Slow-Progressing Gastric Cancer Murine Model and Their Contribution to Gastric Carcinogenesis" Microorganisms 9, no. 1: 189. https://0-doi-org.brum.beds.ac.uk/10.3390/microorganisms9010189