
Genetic Diversity and Phylogeny of the Genus Euplotes (Protozoa, Ciliophora) Revealed by the Mitochondrial CO1 and Nuclear Ribosomal Genes

Abstract
:1. Introduction
2. Materials and Methods
2.1. Ciliate Culture and Identification
2.2. DNA Extraction
2.3. Amplification and Sequencing
2.4. Sequence and Pairwise Genetic Distances Analyses
2.5. Phylogenetic Analyses
3. Results
3.1. SSU rDNA Sequence Analysis
3.2. CO1 Sequence Analysis
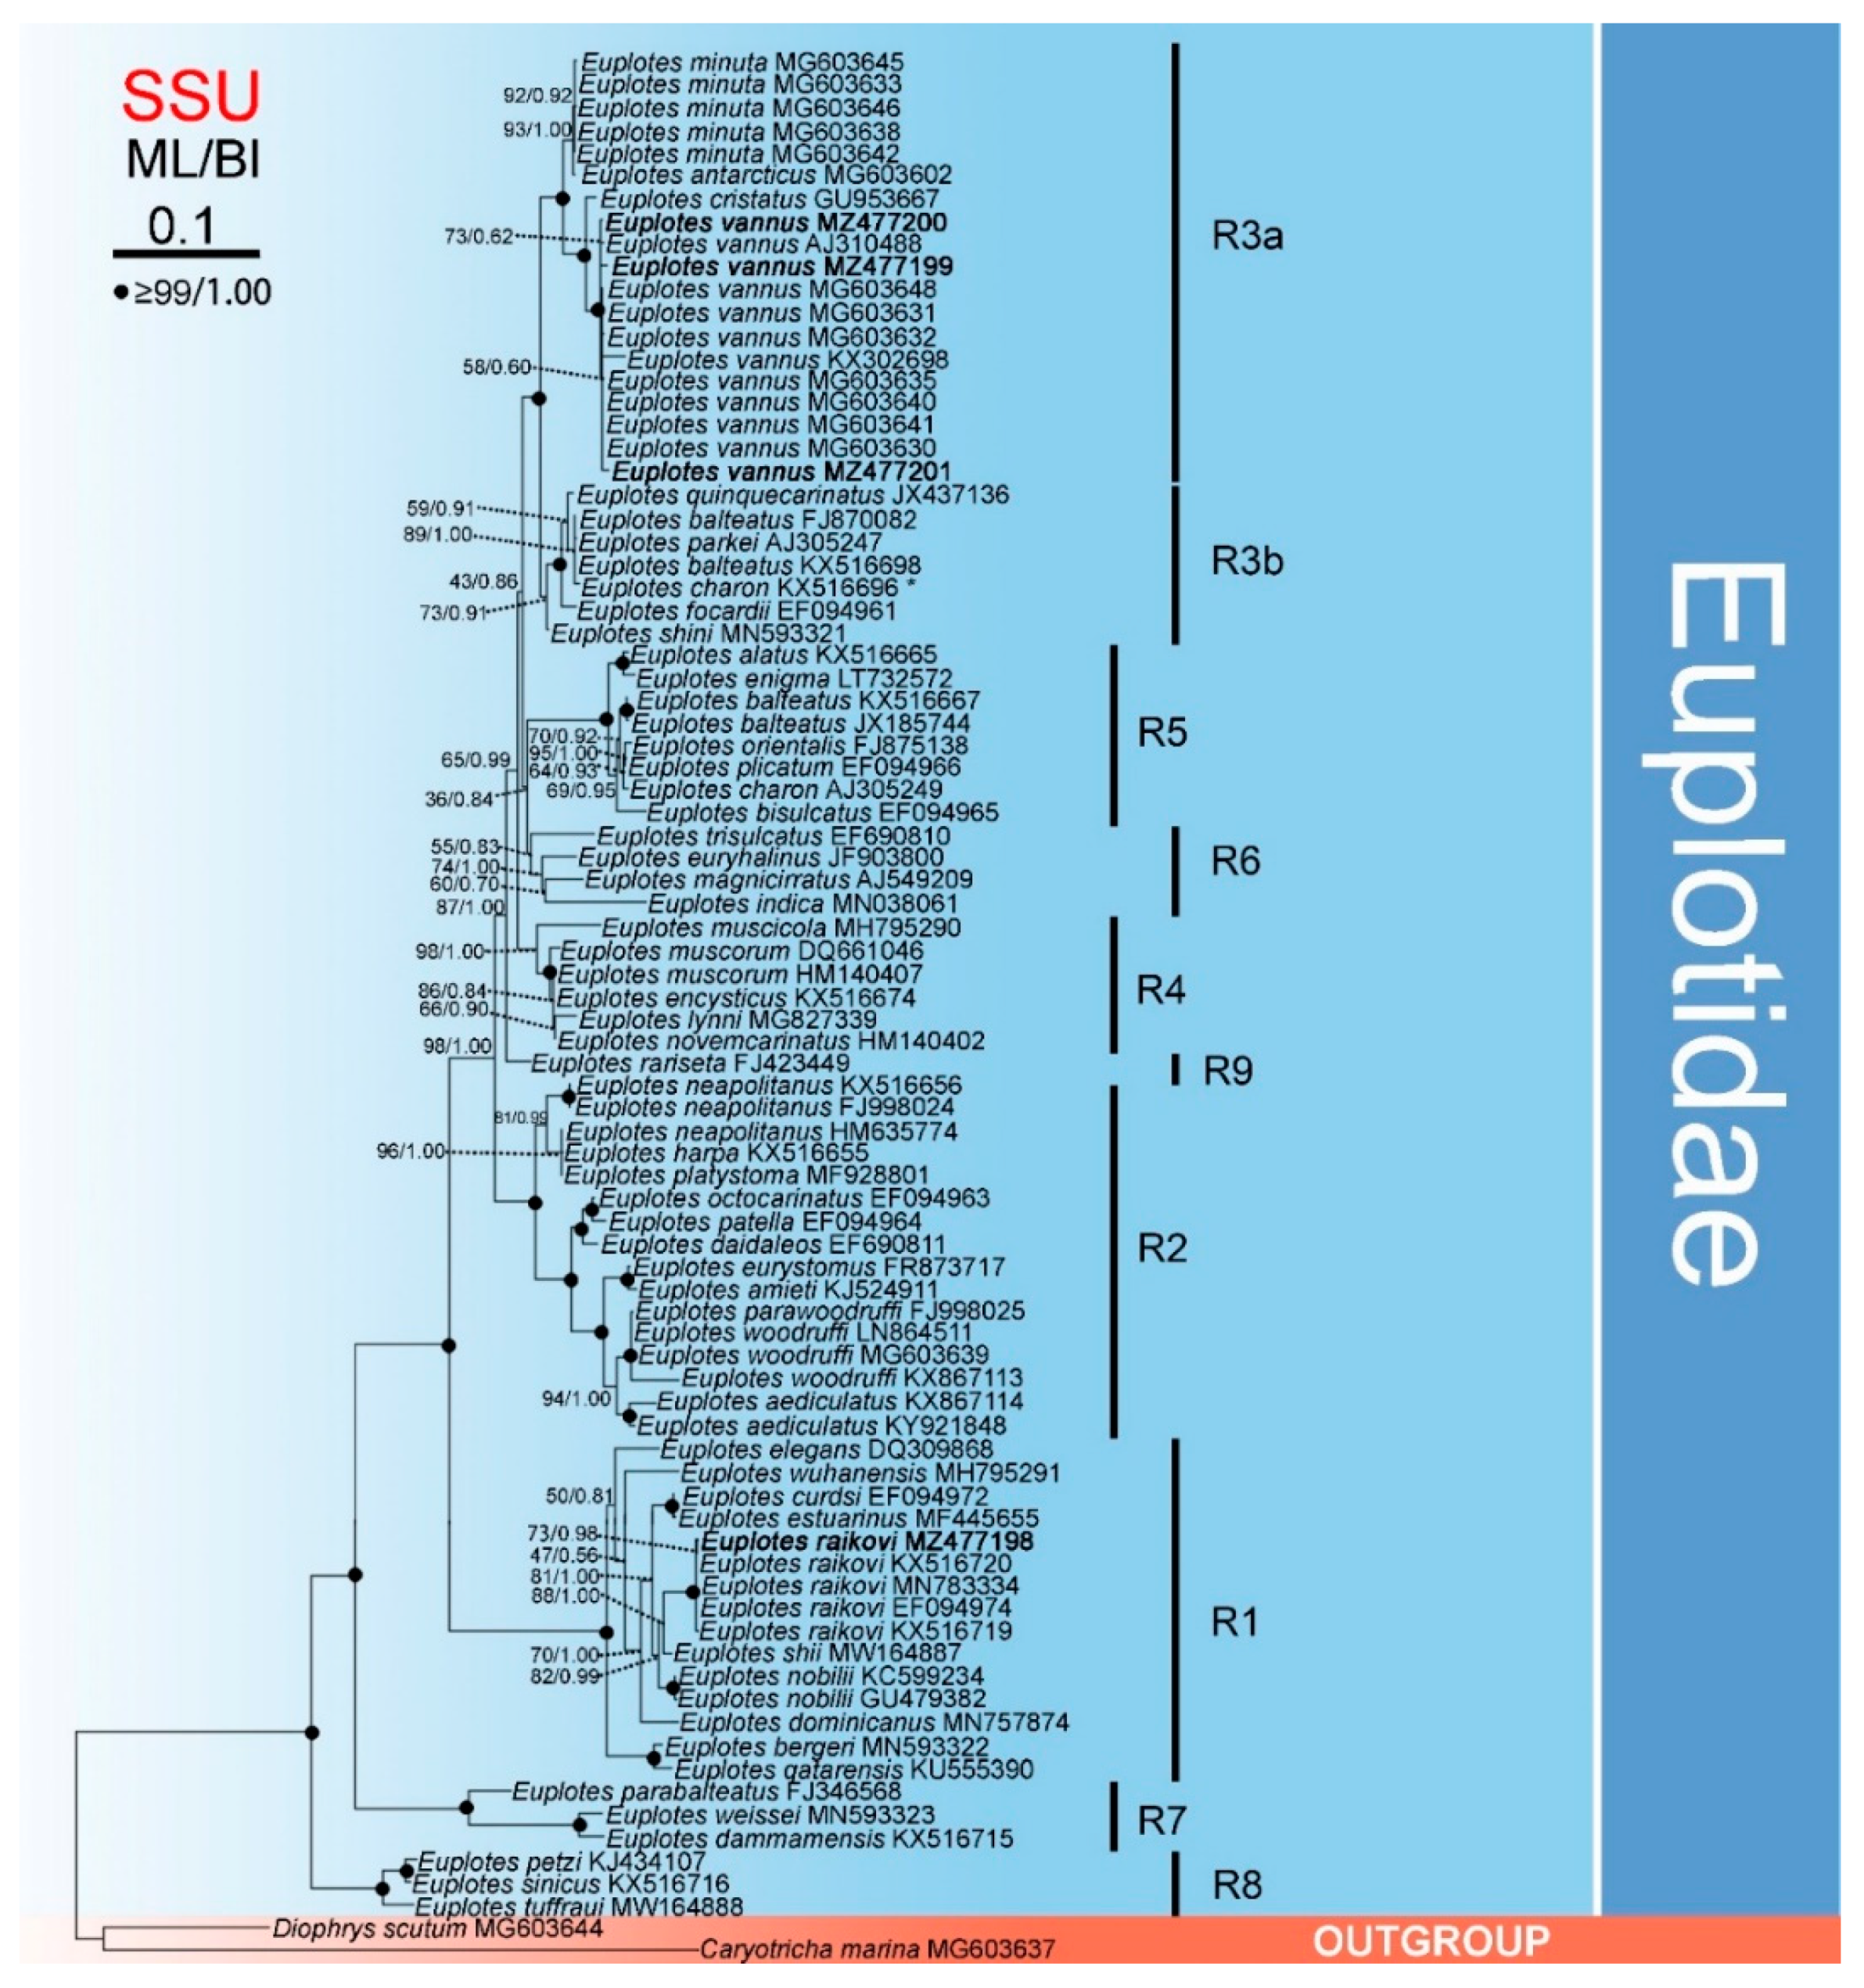
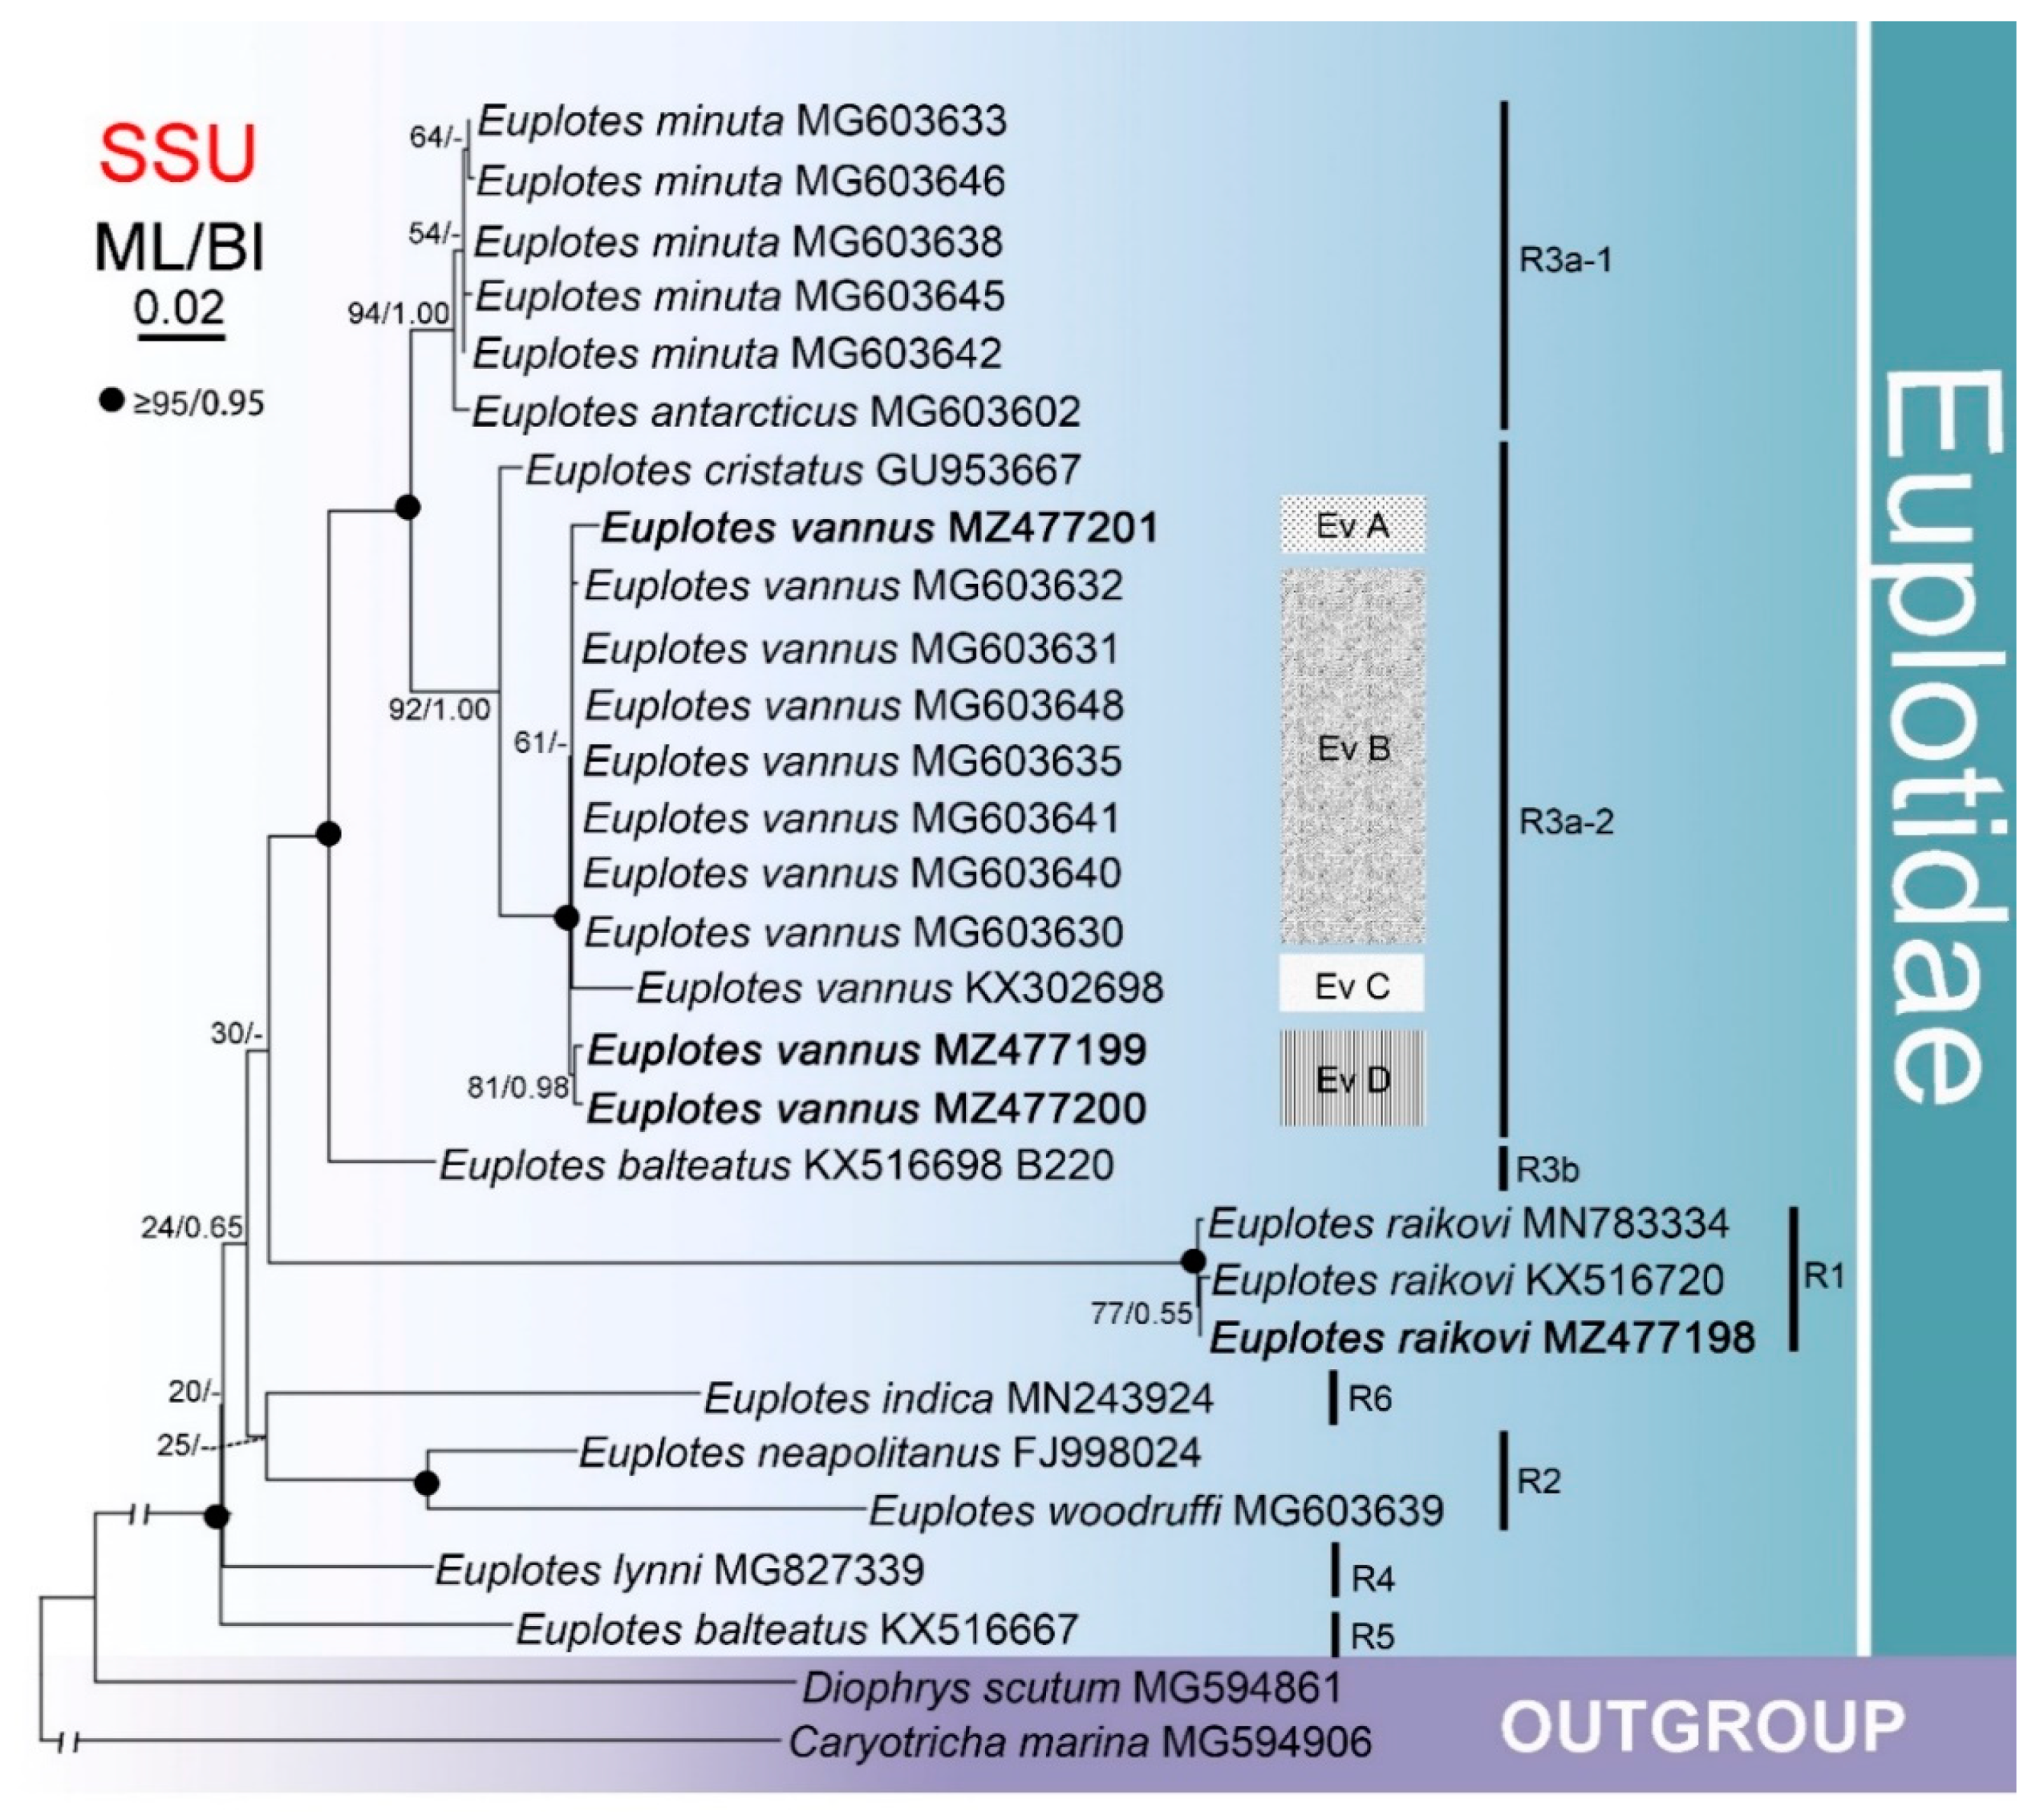
3.3. Phylogenetic Analysis Based on Comparison of SSU rDNA Sequences
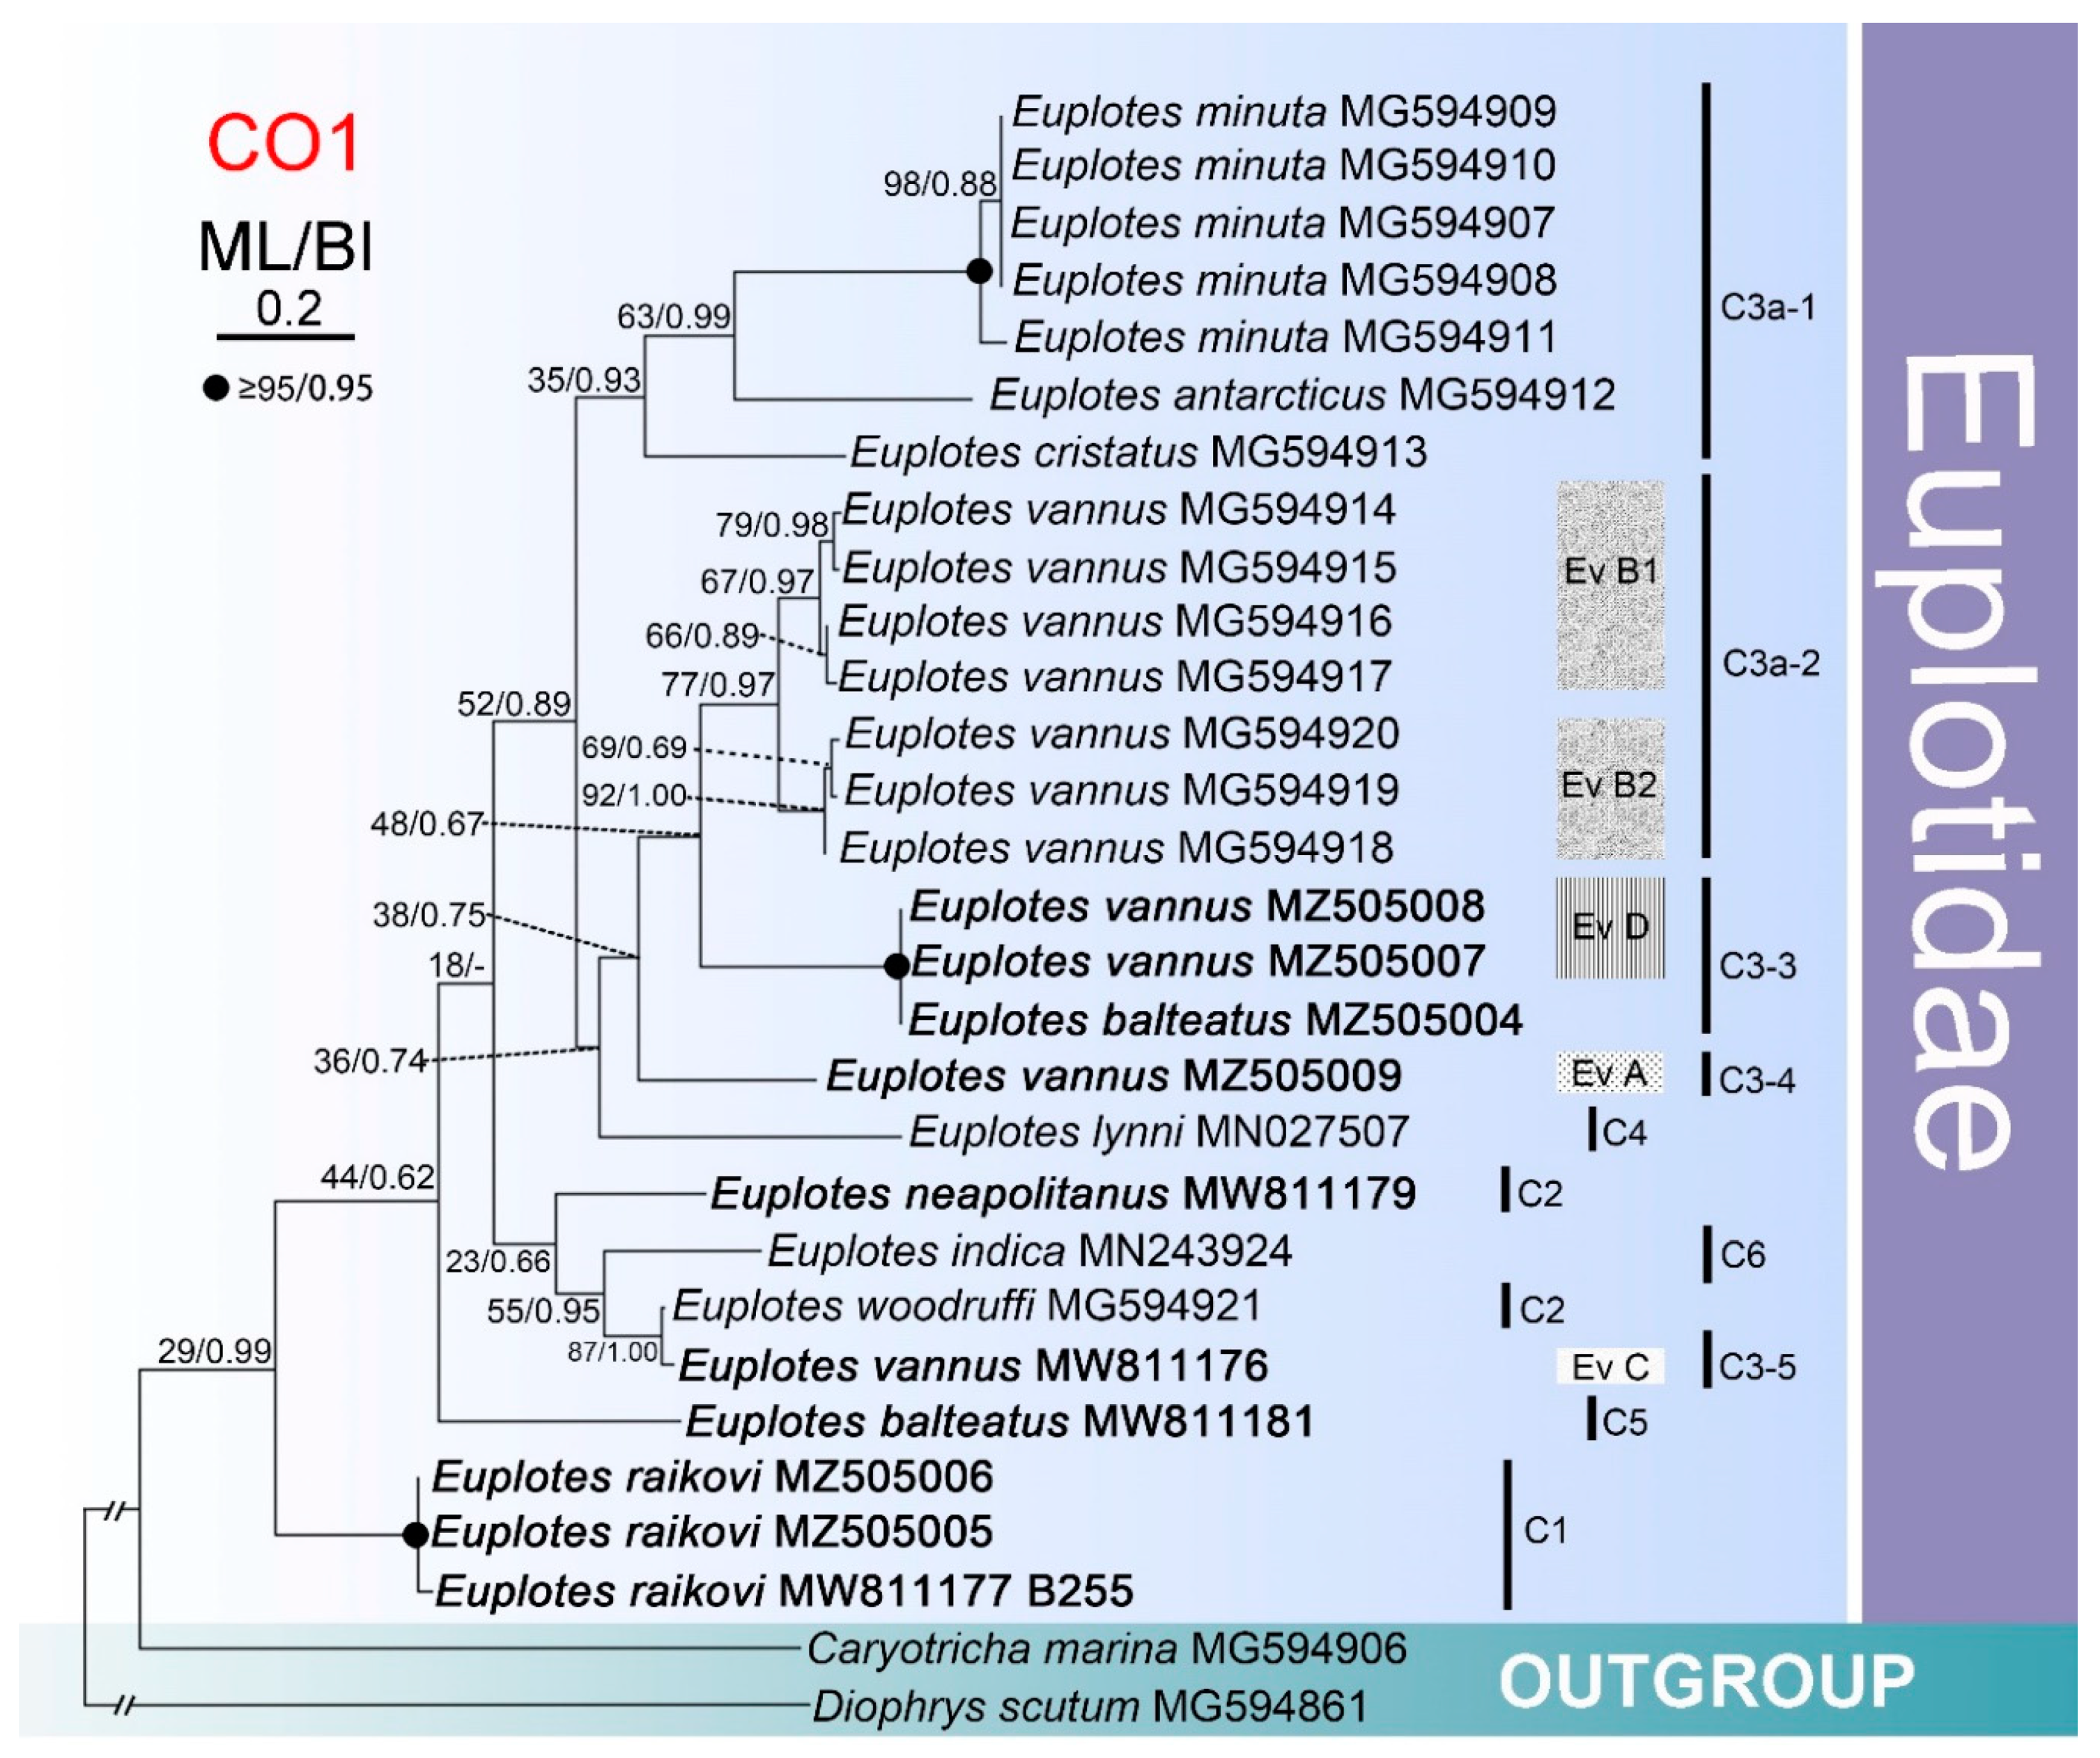
3.4. Phylogenetic Analysis Based on Comparison of Partial CO1 Sequences
4. Discussion
4.1. Genetic Variability within Euplotes in Comparison with Certain Other Genera
4.2. The Genus Euplotes Contains Both Polyphyletic and Monophyletic Species
4.3. Utility of SSU rDNA and CO1 as Biodiversity Markers
4.4. Biogeography of Certain Species within Euplotes
5. Conclusions
Supplementary Materials
Author Contributions
Funding
Institutional Review Board Statement
Informed Consent Statement
Data Availability Statement
Acknowledgments
Conflicts of Interest
References
- Hausmann, K.; Hülsmann, N.; Radek, R. Protistology, 3rd ed.; E. Schweizerbart’sche Verlagsbuchhandlung: Berlin, Germany, 2003. [Google Scholar]
- Godfray, H.C.J. Challenges for taxonomy. Nature 2002, 417, 17–19. [Google Scholar] [CrossRef] [PubMed]
- Lynn, D.H. The Ciliated Protozoa: Characterization, Classification and Guide to the Literature, 3rd ed.; Springer: Dordrecht, Germany, 2008. [Google Scholar]
- Sherr, E.; Sherr, B. High rates of consumption of bacteria by planktonic ciliates. Nature 1987, 325, 710–711. [Google Scholar] [CrossRef]
- Sherr, E.; Sherr, B.; Paffenhöfer, G. Phagotrophic protozoa as food for metazoans: A ‘‘missing’’ trophic link in marine pelagic food webs? Mar. Microbiol. Food Webs 1986, 1, 61–80. [Google Scholar]
- Elwood, H.J.; Olsen, G.J.; Sogin, M.L. The small-subunit ribosomal RNA gene sequences from the hypotrichous ciliates Oxytricha nova and Stylonychia pustulata. Mol. Biol. Evol. 1985, 2, 399–410. [Google Scholar] [PubMed] [Green Version]
- Wang, C.; Gao, Y.; Lu, B.; Chi, Y.; Zhang, T.; El-Serehy, H.A.; Al-Farraj, S.A.; Li, L.; Song, W.; Gao, F. Large-scale phylogenomic analysis provides new insights into the phylogeny of the class Oligohymenophorea (Protista, Ciliophora) with establishment of a new subclass Urocentria nov. subcl. Mol. Phylogenet. Evol. 2021, 159, 107112. [Google Scholar] [CrossRef]
- Chi, Y.; Chen, X.; Li, Y.; Wang, C.; Zhang, T.; Ayoub, A.; Warren, A.; Song, W.; Wang, Y. New contributions to the phylogeny of the ciliate class Heterotrichea (Protista, Ciliophora): Analyses at family-genus level and new evolutionary hypotheses. Sci. China Life Sci. 2020, 64, 606–620. [Google Scholar] [CrossRef] [PubMed]
- Gao, F.; Huang, J.; Zhao, Y.; Li, L.; Liu, W.; Miao, M.; Zhang, Q.; Li, J.; Yi, Z.; El-Serehy, H.A.; et al. Systematic studies on ciliates (Alveolata, Ciliophora) in China: Progress and achievements based on molecular information. Eur. J. Protistol. 2017, 61, 409–423. [Google Scholar] [CrossRef]
- Jiang, L.; Wang, C.; Zhuang, W.; Li, S.; Hu, X. Taxonomy and phylogeny of little-known Helicoprorodon multinucleatum Dragesco, 1960 (Ciliophora, Haptorida), with notes on geographical distribution and identification key to species within the genus. Eur. J. Protistol. 2021, 78, 125769. [Google Scholar] [CrossRef] [PubMed]
- Jiang, L.; Zhuang, W.; El-Serehy, H.; Al-Farraj, S.A.; Warren, A.; Hu, X. Taxonomy and molecular phylogeny of two new species of prostomatean ciliates with establishment of Foissnerophrys gen. n. (Alveolata, Ciliophora). Front. Microbiol. 2021, 12, 686929. [Google Scholar] [CrossRef]
- Li, S.; Zhuang, W.; Pérez-Uz, B.; Zhang, Q.; Hu, X. Two anaerobic ciliates (Ciliophora, Armophorea) from China: Morphology and SSU rDNA sequence, with report of a new species, Metopus paravestitus nov. spec. J. Eukaryot. Microbiol. 2021, 68, e12822. [Google Scholar] [CrossRef] [PubMed]
- Wang, C.; Jiang, L.; Qu, Z.; Al-Farraj, S.A.; Warren, A.; Hu, X. Taxonomy and phylogeny of three species of Dysteria (Ciliophora, Phyllopharyngea) including the description of Dysteria ozakii nom. nov. Protist 2021, 712, 125831. [Google Scholar] [CrossRef] [PubMed]
- Wu, T.; Li, Y.; Lu, B.; Shen, Z.; Song, W.; Warren, A. Morphology, taxonomy and molecular phylogeny of three marine peritrich ciliates, including two new species: Zoothamnium apoarbuscula n. sp. and Z. apohentscheli n. sp. (Protozoa, Ciliophora, Peritrichia). Mar. Life. Sci. Technol. 2020, 2, 334–348. [Google Scholar] [CrossRef]
- Jung, J.H.; Park, K.M.; Min, G.S. Morphology, morphogenesis, and molecular phylogeny of a new brackish water ciliate, Pseudourostyla cristatoides n. sp., from Songjiho lagoon on the coast of East Sea, South Korea. Zootaxa 2012, 3334, 42–54. [Google Scholar] [CrossRef]
- Jung, J.H.; Park, K.M.; Min, G.S. Morphology and molecular phylogeny of Pseudouroleptus jejuensis nov. spec., a new soil ciliate (Ciliophora, Spirotrichea) from South Korea. Acta Protozool. 2014, 53, 195–206. [Google Scholar]
- Lynn, D.H.; Strüder-Kypke, M.C. Species of Tetrahymena identical by small subunit rRNA. gene sequences are discriminated by mitochondrial cytochrome c oxidase I gene sequences. J. Eukaryot. Microbiol. 2006, 53, 385–387. [Google Scholar] [CrossRef] [PubMed]
- Yi, Z.; Chen, Z.; Warren, A.; Roberts, D.; Al-Rasheid, K.A.S.; Miao, M.; Gao, S.; Shao, C.; Song, W. Molecular phylogeny of Pseudokeronopsis (Protozoa, Ciliophora, Urostylida), with reconsideration of three closely related species at inter- and intra-specific levels inferred from the small subunit ribosomal RNA gene and the ITS1-5.8 S-ITS2 region sequences. J. Zool. 2008, 275, 268–275. [Google Scholar]
- Cox, A.J.; Hebert, P.D.N. Colonization, extinction and phylogeographic patterning in a freshwater crustacean. Mol. Ecol. 2001, 10, 371–386. [Google Scholar] [CrossRef] [PubMed]
- Folmer, O.; Black, M.; Hoeh, W.; Lutz, R.; Vrijenhoek, R. DNA primers for amplification of mitochondrial cytochrome c oxidase subunit I from diverse metazoan invertebrates. Mol. Mar. Biol. Biotech. 1994, 3, 294–299. [Google Scholar]
- Hajibabaei, M.; Janzen, D.H.; Burns, J.M.; Hallwachs, W.; Hebert, P.D.N. DNA barcodes distinguish species of tropical Lepidoptera. Proc. Natl. Acad. Sci. USA 2006, 103, 968–971. [Google Scholar] [CrossRef] [PubMed] [Green Version]
- Hebert, P.D.N.; Ratnasingham, S.; de Waard, J.R. Barcoding animal life: Cytochrome c oxidase subunit 1 divergences among closely related species. Proc. R. Soc. Lond. B 2003, 270, S96–S99. [Google Scholar] [CrossRef] [PubMed] [Green Version]
- Hebert, P.D.N.; Stoeckle, M.Y.; Zemlak, T.S.; Francis, C.M. Identification of birds through DNA barcodes. PLoS Biol. 2004, 2, e312. [Google Scholar] [CrossRef] [PubMed] [Green Version]
- Barth, D.; Krenek, S.; Fokin, S.I.; Berendonk, T.U. Intraspecific genetic variation in Paramecium revealed by mitochondrial cytochrome c oxidase I sequences. J. Eukaryot. Microbiol. 2006, 53, 20–25. [Google Scholar] [CrossRef] [PubMed]
- Chantangsi, C.; Lynn, D.H. Phylogenetic relationships within the genus Tetrahymena inferred from the cytochrome c oxidase subunit 1 and the small subunit ribosomal RNA genes. Mol. Phylogenet. Evol. 2008, 49, 979–987. [Google Scholar] [CrossRef]
- Chantangsi, C.; Lynn, D.H.; Brandl, M.T.; Cole, J.C.; Hetrick, N.; Ikonomi, P. Barcoding ciliates: A comprehensive study of 75 isolates of the genus Tetrahymena. Inter. J. Syst. Evol. Microbiol. 2007, 57, 2412–2425. [Google Scholar] [CrossRef] [Green Version]
- Gentekaki, E.; Lynn, D.H. High-level genetic diversity but no population structure inferred from nuclear and mitochondrial markers of the peritrichous ciliate Carchesium polypinum in the Grand River Basin (North America). Appl. Environ. Microbiol. 2009, 75, 3187–3195. [Google Scholar] [CrossRef] [Green Version]
- Jung, S.J.; Im, E.Y.; Strüder-Kypke, M.C.; Kitamura, S.I.; Woo, P.T.K. Small sub-unit ribosomal RNA and mitochondrial cytochrome c oxidase subunit 1 gene sequences of 21 strains of the parasitic scuticociliate Miamiensis avidus (Ciliophora, Scuticociliatia). Parasitol. Res. 2011, 108, 1153–1161. [Google Scholar] [CrossRef]
- Kher, C.P.; Doerder, F.P.; Cooper, J.; Ikonomi, P.; Achilles-Day, U.; Kupper, F.C.; Lynn, D.H. Barcoding Tetrahymena: Discriminating species and identifying unknowns using the cytochrome c oxidase subunit I (cox1) barcode. Protist 2011, 162, 2–13. [Google Scholar] [CrossRef] [PubMed]
- Tarcz, S.; Potekhin, A.; Rautian, M.; Przybos, E. Variation in ribosomal and mitochondrial DNA sequences demonstrates the existence of intraspecific groups in Paramecium multimicronucleatum (Ciliophora, Oligohymenophorea). Mol. Phylogenet. Evol. 2012, 63, 500–509. [Google Scholar] [CrossRef]
- Tarcz, S.; Przybos, E.; Surmacz, M. An assessment of haplotype variation in ribosomal and mitochondrial DNA fragments suggests incomplete lineage sorting in some species of the Paramecium aurelia complex (Ciliophora, Protozoa). Mol. Phylogenet. Evol. 2013, 67, 255–265. [Google Scholar] [CrossRef]
- Tarcz, S.; Rautian, M.; Potekhin, A.; Sawka, N.; Beliavskaya, A.; Kiselev, A.; Nekrasova, I.; Przybos, E. Paramecium putrinum (Ciliophora, Protozoa): The first insight into the variation of two DNA fragments—Molecular support for the existence of cryptic species. Mol. Phylogenet. Evol. 2014, 73, 140–145. [Google Scholar] [CrossRef]
- Zhao, Y.; Gentekaki, E.; Yi, Z.; Lin, X. Genetic differentiation of the mitochondrial cytochrome oxidase c subunit I gene in genus Paramecium (Protista, Ciliophora). PLoS ONE 2013, 8, e77044. [Google Scholar] [CrossRef] [PubMed] [Green Version]
- Zhao, Y.; Yi, Z.; Gentekaki, E.; Zhan, A.; Al-Farraj, S.A.; Song, W. Utility of combining morphological characters, nuclear and mitochondrial genes: An attempt to resolve the conflicts of species identification for ciliated protists. Mol. Phylogenet. Evol. 2016, 94, 718–729. [Google Scholar] [CrossRef] [PubMed]
- Park, M.H.; Jung, J.H.; Jo, E.; Park, K.M.; Baek, Y.S.; Kim, S.J.; Min, G.S. Utility of mitochondrial CO1 sequences for species discrimination of Spirotrichea ciliates (Protozoa, Ciliophora). Mitochon. DNA Part A 2019, 30, 148–155. [Google Scholar] [CrossRef] [PubMed]
- Strüder-Kypke, M.C.; Lynn, D.H. Comparative analysis of the mitochondrial cytochrome c oxidase subunit I (COI) gene in ciliates (Alveolata, Ciliophora) and evaluation of its suitability as a biodiversity marker. Syst. Biodivers. 2010, 8, 131–148. [Google Scholar] [CrossRef]
- Agamaliev, F.G. New species of psammobiotic ciliates of the western coast of the Caspian Sea. Acta Protozool. 1966, 4, 169–183. [Google Scholar]
- Curds, C.R. Guide to the species of the genus Euplotes (Hypotrichida, Ciliatea). Bull. Bri. Mus. Nat. Hist. 1975, 28, 3–61. [Google Scholar]
- Di Giuseppe, G.; Erra, F.; Frontini, F.P.; Dini, F.; Vallesi, A.; Luporini, P. Improved description of the bipolar ciliate, Euplotes petzi, and definition of its basal position in the Euplotes phylogenetic tree. Eur. J. Protistol. 2014, 50, 402–411. [Google Scholar] [CrossRef]
- Gao, Y.; Gong, R.; Jiang, Y.; Pan, B.; Li, Y.; Warren, A.; Jiang, J.; Gao, F. Morphogenetic characters of the model ciliate Euplotes vannus (Ciliophora, Spirotrichea): Notes on cortical pattern formation during conjugational and postconjugational reorganization. Eur. J. Protistol. 2020, 73, 125675. [Google Scholar] [CrossRef]
- Hu, X.; Lin, X.; Song, W.B. Ciliate Atlas: Species Found in the South China Sea; Science Press: Beijing, China, 2019. [Google Scholar]
- Kahl, A. Urtiere oder Protozoa I: Wimpertiere oder Ciliata (Infusoria) 3. Spirotricha. Tierwelt Dtl. 1932, 25, 399–650. [Google Scholar]
- Lian, C.; Zhang, T.; Al-Rasheid, K.A.S.; Yu, Y.; Jiang, J.; Huang, J. Morphology and SSU rDNA-based phylogeny of two Euplotes species from China: E. wuhanensis sp. n. and E. muscicola Kahl, 1932 (Ciliophora, Euplotida). Eur. J. Protistol. 2019, 67, 1–14. [Google Scholar] [CrossRef]
- Valbonesi, A.; Luporini, P. Description of two new species of Euplotes and Euplotes rariseta from Antarctica. Polar Biol. 1990, 11, 47–53. [Google Scholar] [CrossRef]
- Williams, R.A.J.; Owens, H.L.; Clamp, J.; Peterson, A.T.; Warren, A.; Martín-Cereceda, M. Endemicity and climatic niche differentiation in three marine ciliated protists. Limnol. Oceanogr. 2018, 63, 2727–2736. [Google Scholar] [CrossRef] [Green Version]
- Abraham, J.S.; Somasundaram, S.; Maurya, S.; Gupta, R.; Makhija, S.; Toteja, R. Characterization of Euplotes lynni nov. spec., E. indica nov. spec. and description of E. aediculatus and E. woodruffi (Ciliophora, Euplotidae) using an integrative approach. Eur. J. Protistol. 2021, 79, 125779. [Google Scholar] [CrossRef] [PubMed]
- Jiang, J.; Zhang, Q.; Warren, A.; Al-Rasheid, K.A.S.; Song, W. Morphology and SSU rRNA gene-based phylogeny of two marine Euplotes species, E. orientalis spec. nov. and E. raikovi Agamaliev, 1966 (Ciliophora, Euplotida). Eur. J. Protistol. 2010, 46, 121–132. [Google Scholar] [CrossRef] [PubMed]
- Lian, C.; Wang, Y.; Li, L.; Al-Rasheid, K.A.S.; Jiang, J.; Song, W. Taxonomy and SSU rDNA-based phylogeny of three new Euplotes species (Protozoa, Ciliophora) from China seas. J. King Saud Univ. Sci. 2020, 32, 1286–1292. [Google Scholar] [CrossRef]
- Lian, C.; Wang, Y.; Jiang, J.; Yuan, Q.; Al-Farraj, S.A.; El-Serehy, H.A.; Song, W.; Stoeck, T.; Shao, C. Systematic positions and taxonomy of two new ciliates found in China: Euplotes tuffraui sp. nov. and E. shii sp. nov. (Alveolata, Ciliophora, Euplotida). Syst. Biodivers. 2021, 19, 359–374. [Google Scholar] [CrossRef]
- Zhao, Y.; Yi, Z.; Warren, A.; Song, W. Species delimitation for the molecular taxonomy and ecology of a widely distributed microbial eukaryotes genus Euplotes (Alveolata, Ciliophora). Proceed. Roy. Soc. B 2018, 285, 20172159. [Google Scholar] [CrossRef] [PubMed] [Green Version]
- Dunthorn, M.; Foissner, W.; Katz, L.A. Expanding character sampling for ciliate phylogenetic inference using mitochondrial SSU-rDNA as a molecular marker. Protist 2011, 162, 85–99. [Google Scholar] [CrossRef] [PubMed] [Green Version]
- Foissner, W. An update of ‘basic light and scanning electron microscopic methods for taxonomic studies of ciliated protozoa’. Int. J. Syst. Evol. Microbiol. 2014, 64, 271–292. [Google Scholar] [CrossRef] [PubMed] [Green Version]
- Medlin, L.; Elwood, H.J.; Stickel, S.; Sogin, M.L. The characterization of enzymatically amplified eukaryotic 16S-like rRNA-coding regions. Gene 1988, 71, 491–499. [Google Scholar] [CrossRef] [Green Version]
- Hall, T.A. BioEdit: A user-friendly biological sequence alignment editor an analysis program for Windows 95/98/ NT. Nucleic Acids Symp. Ser. 1999, 41, 95–98. [Google Scholar]
- Librado, P.; Rozas, J. DnaSP v5: A software for comprehensive analysis of DNA polymorphism data. Bioinformatics 2009, 25, 1451–1452. [Google Scholar] [CrossRef] [PubMed] [Green Version]
- Miller, M.A.; Pfeiffer, W.; Schwartz, T. Creating the CIPRES Science Gateway for inference of large phylogenetic trees. In Proceedings of the 2010 Gateway Computing Environments Workshop (GCE), New Orleans, LA, USA, 14 November 2010; pp. 1–8. [Google Scholar]
- Stamatakis, A. RAxML version 8: A tool for phylogenetic analysis and post-analysis of large phylogenies. Bioinformatics 2014, 30, 1312–1313. [Google Scholar] [CrossRef] [PubMed]
- Ronquist, F.; Teslenko, M.; van Der Mark, P.; Ayres, D.L.; Darling, A.; Höhna, S.; Larget, B.; Liu, L.; Suchard, M.A.; Huelsenbeck, J.P. MrBayes 3.2: Efficient Bayesian phylogenetic inference and model choice across a large model space. Syst. Biol. 2012, 61, 539–542. [Google Scholar] [CrossRef] [Green Version]
- Nylander, J. MrModeltest, a Program to Evaluate the Fit of Several Models of Evolution to a Given Data and Unrooted Tree (Version 2.2). Program Distributed by the Author. Evolutionary Biology Centre, Uppsala University, Sweden. 2004. Available online: http://www.abc.se/~nylander (accessed on 10 August 2021).
- Tamura, K.; Peterson, D.; Peterson, N.; Stecher, G.; Nei, M.; Kumar, S. MEGA5: Molecular evolutionary genetics analysis using maximum likelihood, evolutionary distance, and maximum parsimony methods. Mol. Phylogenet. Evol. 2011, 28, 2731–2739. [Google Scholar] [CrossRef] [Green Version]
- Chen, X.; Zhao, Y.; Al-Farraj, S.A.; Al-Quraishy, S.A.; El-Serehy, H.A.; Shao, C.; Al-Rasheid, K.A.S. Taxonomic descriptions of two marine ciliates, Euplotes dammamensis n. sp. and Euplotes balteatus (Dujardin, 1841) Kahl, 1932 (Ciliophora, Spirotrichea, Euplotida), collected from the Arabian Gulf, Saudi Arabia. Acta Protozool. 2013, 52, 73–89. [Google Scholar]
- Petroni, G.; Dini, F.; Verni, F.; Rosati, G. A molecular approach to the tangled intrageneric relationships underlying phylogeny in Euplotes (Ciliophora, Spirotrichea). Mol. Phylo. Evol. 2002, 22, 118–130. [Google Scholar] [CrossRef]
- Yi, Z.; Song, W.; Clamp, J.C.; Chen, Z.; Gao, S.; Zhang, Q. Reconsideration of systematic relationships within the order Euplotida (Protista, Ciliophora) using new sequences of the gene coding for small-subunit rRNA and testing the use of combined data sets to construct phylogenies of the Diophrys-complex. Mol. Phylogenet. Evol. 2009, 50, 599–607. [Google Scholar] [CrossRef]
- Di Giuseppe, G.; Barbieri, M.; Vallesi, A.; Luporini, P.; Dini, F. Phylogeographical pattern of Euplotes nobilii, a protist ciliate with a bipolar biogeographical distribution. Mol. Ecol. 2013, 22, 4029–4037. [Google Scholar] [CrossRef]
- Fokin, S.I.; Przybos, E.; Chivilev, S.M.; Beier, C.L.; Horn, M.; Skotarczak, B.; Wodecka, B.; Fujishima, M. Morphological and molecular investigations of Paramecium schewiakoffi sp. nov. (Ciliophora, Oligohymenophorea) and current status of distribution and taxonomy of Paramecium spp. Eur. J. Protistol. 2004, 40, 225–243. [Google Scholar] [CrossRef]
- Rand, D.M. The units of selection on mitochondrial DNA. Ann. Rev. Ecol. Syst. 2001, 32, 415–448. [Google Scholar] [CrossRef]
- Beijerinck, M.W. De Infusies en de Ontdekking der Backteriën; Müller: Amsterdam, The Netherlands, 1913. [Google Scholar]
- Finlay, B.J.; Corliss, J.O.; Esteban, G.; Fenchel, T. Biodiversity at the microbial level: The number of free-living ciliates in the biosphere. Q. Rev. Biol. 1996, 71, 221–237. [Google Scholar] [CrossRef]
- Foissner, W. Protist diversity: Estimates of the near-imponderable. Protist 1999, 150, 363–368. [Google Scholar] [CrossRef]
- Fontaneto, D.; Barraclough, T.G.; Chen, K.; Ricci, C.; Herniou, E.A. Molecular evidence for broadscale distributions in bdelloid rotifers: Everything is not everywhere but most things are very widespread. Mol. Ecol. 2008, 17, 3136–3146. [Google Scholar] [CrossRef] [PubMed]


| Species | Geographic Origin | Isolate ID | Abbreviation | GenBank Accession Numbers | GC% of CO1 | GC% of SSU | |
|---|---|---|---|---|---|---|---|
| CO1 | SSU | ||||||
| Euplotes antarcticus | King George Island, Antarctic | INHC065 | Ea | MG594912 | MG603602 | 39.54% | 43.59% |
| Euplotes cristatus | Incheon, South Korea | KS008 | Ecr | MG594913 | GU953667 | 41.00% | 43.75% |
| Euplotes indica | Raj Ghatpond, India | OBS2 | Ei | MN243924 | MN038061 | 32.53% | 43.50% |
| Euplotes lynni | the Sanjay Lake, India | SLS1 | El | MN027507 | MG827339 | 37.16% | 43.90% |
| Euplotes vannus | Incheon, South Korea | KS106 | Ev1 | MG594914 | MG603630 | 36.82% | 43.85% |
| Euplotes vannus | Incheon, South Korea | KS107 | Ev2 | MG594915 | MG603631 | 36.61% | 43.87% |
| Euplotes vannus | Jeju-do Island, South Korea | KS012 | Ev3 | MG594916 | MG603635 | 35.77% | 43.83% |
| Euplotes vannus | East River, New York, USA | WS052 | Ev4 | MG594917 | MG603648 | 36.36% | 43.85% |
| Euplotes vannus | Incheon, South Korea | KS006 | Ev5 | MG594918 | MG603640 | 37.45% | 43.85% |
| Euplotes vannus | Incheon, South Korea | KS074 | Ev6 | MG594919 | MG603641 | 38.08% | 43.85% |
| Euplotes vannus | Incheon, South Korea | KS109 | Ev7 | MG594920 | MG603632 | 37.66% | 43.85% |
| Euplotes vannus | Qingdao, China | A764 | Ev8 | MW811176 | KX302698 | 34.10% | 43.38% |
| Euplotes vannus | Qingdao, China | A940 | Ev9 | MZ505008 | MZ477200 | 34.73% | 43.91% |
| Euplotes vannus | Qingdao, China | A844 | Ev10 | MZ505007 | MZ477199 | 34.73% | 44.20% |
| Euplotes vannus | Shenzhen, China | C102 | Ev11 | MZ505009 | MZ477201 | 34.38% | 43.78% |
| Euplotes woodruffi | Songjiho Lagoon, Gangwon-do, South Korea | KS056 | Ew | MG594921 | MG603639 | 33.68% | 44.81% |
| Euplotes minuta | Jeju-do Island, South Korea | KS011 | Em1 | MG594907 | MG603633 | 41.21% | 43.61% |
| Euplotes minuta | Busan, South Korea | KS044 | Em2 | MG594908 | MG603638 | 41.21% | 43.61% |
| Euplotes minuta | Laguna Beach, California, USA | WS038 | Em3 | MG594909 | MG603645 | 41.21% | 43.61% |
| Euplotes minuta | Laguna Beach, California, USA | WS039 | Em4 | MG594910 | MG603646 | 41.21% | 43.61% |
| Euplotes minuta | Chungcheongnam-do, South Korea | KS082 | Em5 | MG594911 | MG603642 | 39.33% | 43.61% |
| Euplotes raikovi | Zhanjiang, China | B255 | Er1 | MW811177 | KX516720 | 32.85% | 46.15% |
| Euplotes raikovi | Qingdao, China | A714 | Er2 | MZ505005 | MN783334 | 32.64% | 45.51% |
| Euplotes raikovi | Adriatic Coast, Italy | A841 | Er3 | MZ505006 | MZ477198 | 32.64% | 45.81% |
| Euplotes balteatus | Hong Kong, China | B220 | Eb1 | MZ505004 | KX516698 | 34.73% | 44.85% |
| Euplotes balteatus | Daya Bay, Huizhou, China | L20 | Eb2 | MW811181 | KX516667 | 34.31% | 45.79% |
| Euplotes neapolitanus | Shenzhen, China | L10 | En | MW811179 | FJ998024 | 30.13% | 43.31% |
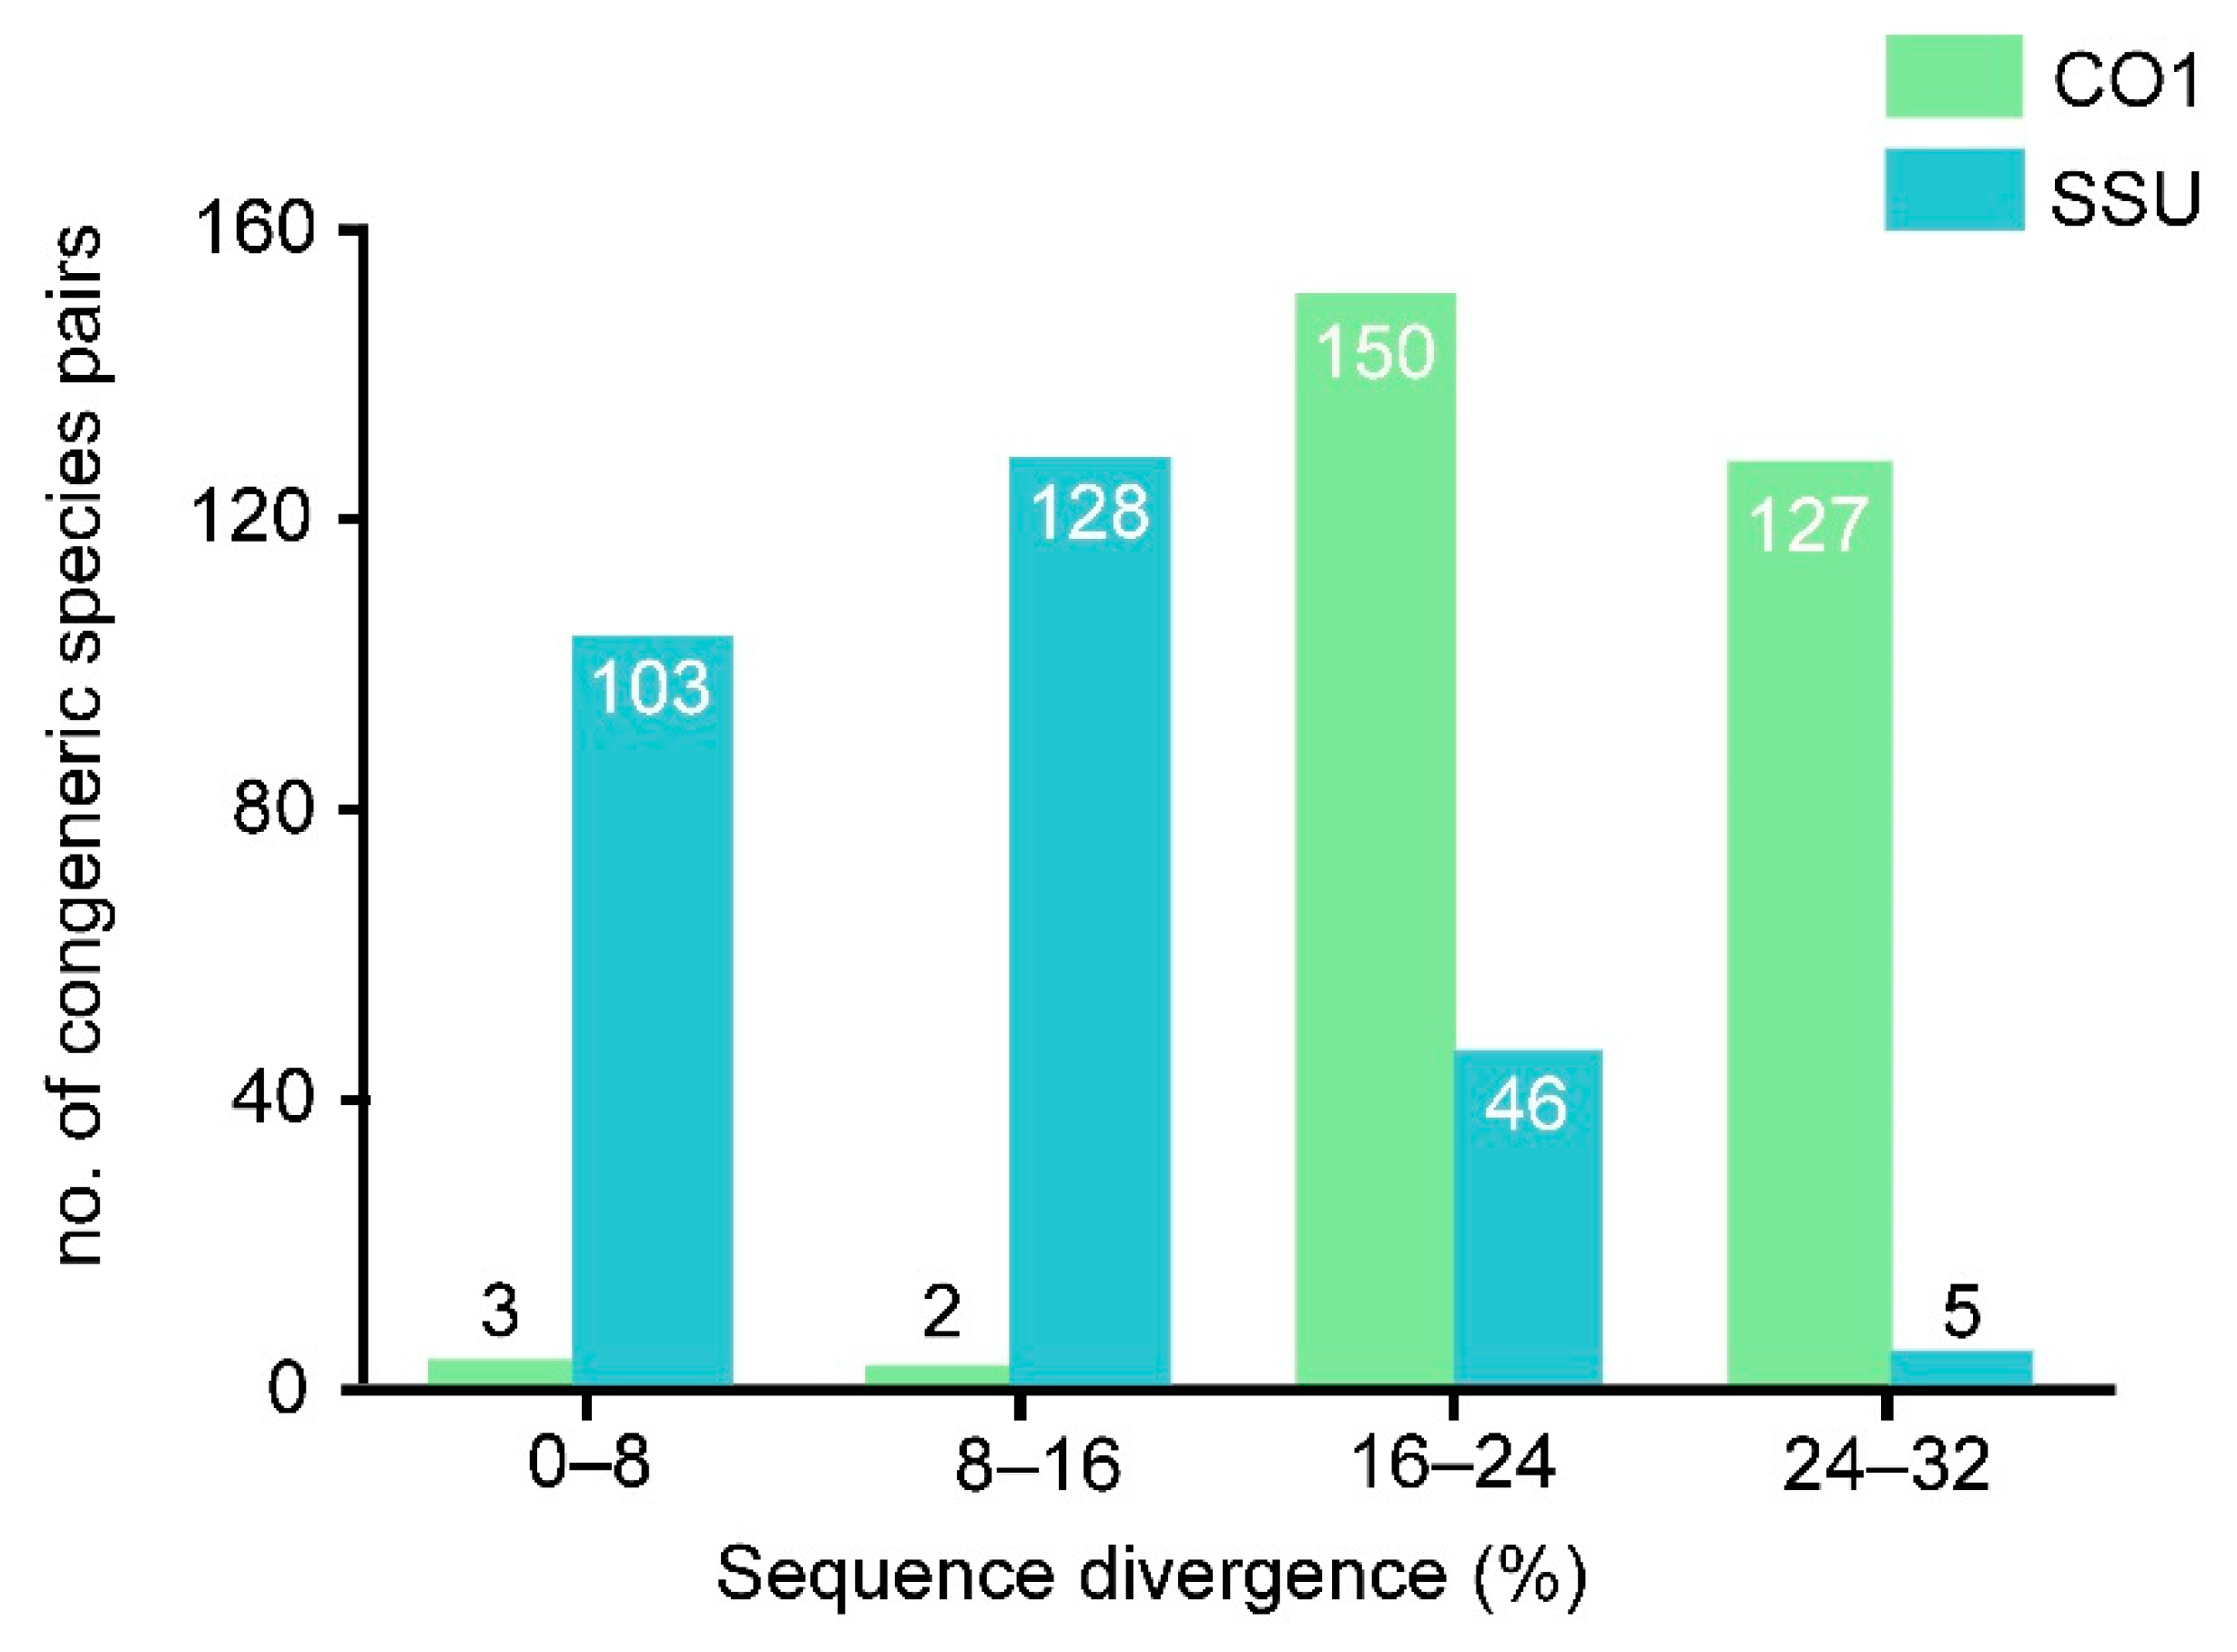
| Genus | Gene | n | Mean | s.d. | Sequence Divergence (%) | |||
|---|---|---|---|---|---|---|---|---|
| 0–8 | 8–16 | 16–24 | 24–32 | |||||
| Euplotes | CO1 | 282 | 23.1 | 3.4 | 1.1% | 0.7% | 53.2% | 45.0% |
| SSU | 282 | 10.6 | 5.7 | 36.5% | 45.4% | 16.3% | 1.8% | |
| Diophrys | CO1 | 21 | 18.8 | 0.4 | 0 | 0 | 100.0% | 0 |
| Uronychia | CO1 | 1 | n/a | n/a | 0 | 0 | 100.0% | 0 |
| Species | SSU rDNA | CO1 mtDNA | ||||||
|---|---|---|---|---|---|---|---|---|
| Number of Sequences | Number of Haplotypes | Haplotype Diversity (SD) | Nucleotide Diversity | Number of Sequences | Number of Haplotypes | Haplotype Diversity (SD) | Nucleotide Diversity | |
| Euplotes vannus | 11 | 5 | 0.618 (0.164) | 0.00177 | 11 | 10 | 0.982 (0.046) | 0.13551 |
| Euplotes minuta | 5 | 3 | 0.700 (0.218) | 0.00044 | 5 | 2 | 0.400 (0.237) | 0.02176 |
| Euplotes raikovi | 3 | 2 | 0.667 (0.314) | 0.00038 | 3 | 2 | 0.667 (0.314) | 0.00976 |
| Euplotes balteatus | 2 | 2 | 1.000 (0.500) | 0.05039 | 2 | 2 | 1.000 (0.500) | 0.22803 |
Publisher’s Note: MDPI stays neutral with regard to jurisdictional claims in published maps and institutional affiliations. |
© 2021 by the authors. Licensee MDPI, Basel, Switzerland. This article is an open access article distributed under the terms and conditions of the Creative Commons Attribution (CC BY) license (https://creativecommons.org/licenses/by/4.0/).
Share and Cite
Wang, C.; Hu, Y.; Warren, A.; Hu, X. Genetic Diversity and Phylogeny of the Genus Euplotes (Protozoa, Ciliophora) Revealed by the Mitochondrial CO1 and Nuclear Ribosomal Genes. Microorganisms 2021, 9, 2204. https://0-doi-org.brum.beds.ac.uk/10.3390/microorganisms9112204
Wang C, Hu Y, Warren A, Hu X. Genetic Diversity and Phylogeny of the Genus Euplotes (Protozoa, Ciliophora) Revealed by the Mitochondrial CO1 and Nuclear Ribosomal Genes. Microorganisms. 2021; 9(11):2204. https://0-doi-org.brum.beds.ac.uk/10.3390/microorganisms9112204
Chicago/Turabian StyleWang, Congcong, Yue Hu, Alan Warren, and Xiaozhong Hu. 2021. "Genetic Diversity and Phylogeny of the Genus Euplotes (Protozoa, Ciliophora) Revealed by the Mitochondrial CO1 and Nuclear Ribosomal Genes" Microorganisms 9, no. 11: 2204. https://0-doi-org.brum.beds.ac.uk/10.3390/microorganisms9112204