
Cellular Proteo-Transcriptomic Changes in the Immediate Early-Phase of Lentiviral Transduction


 , , , ,
  , and
, and 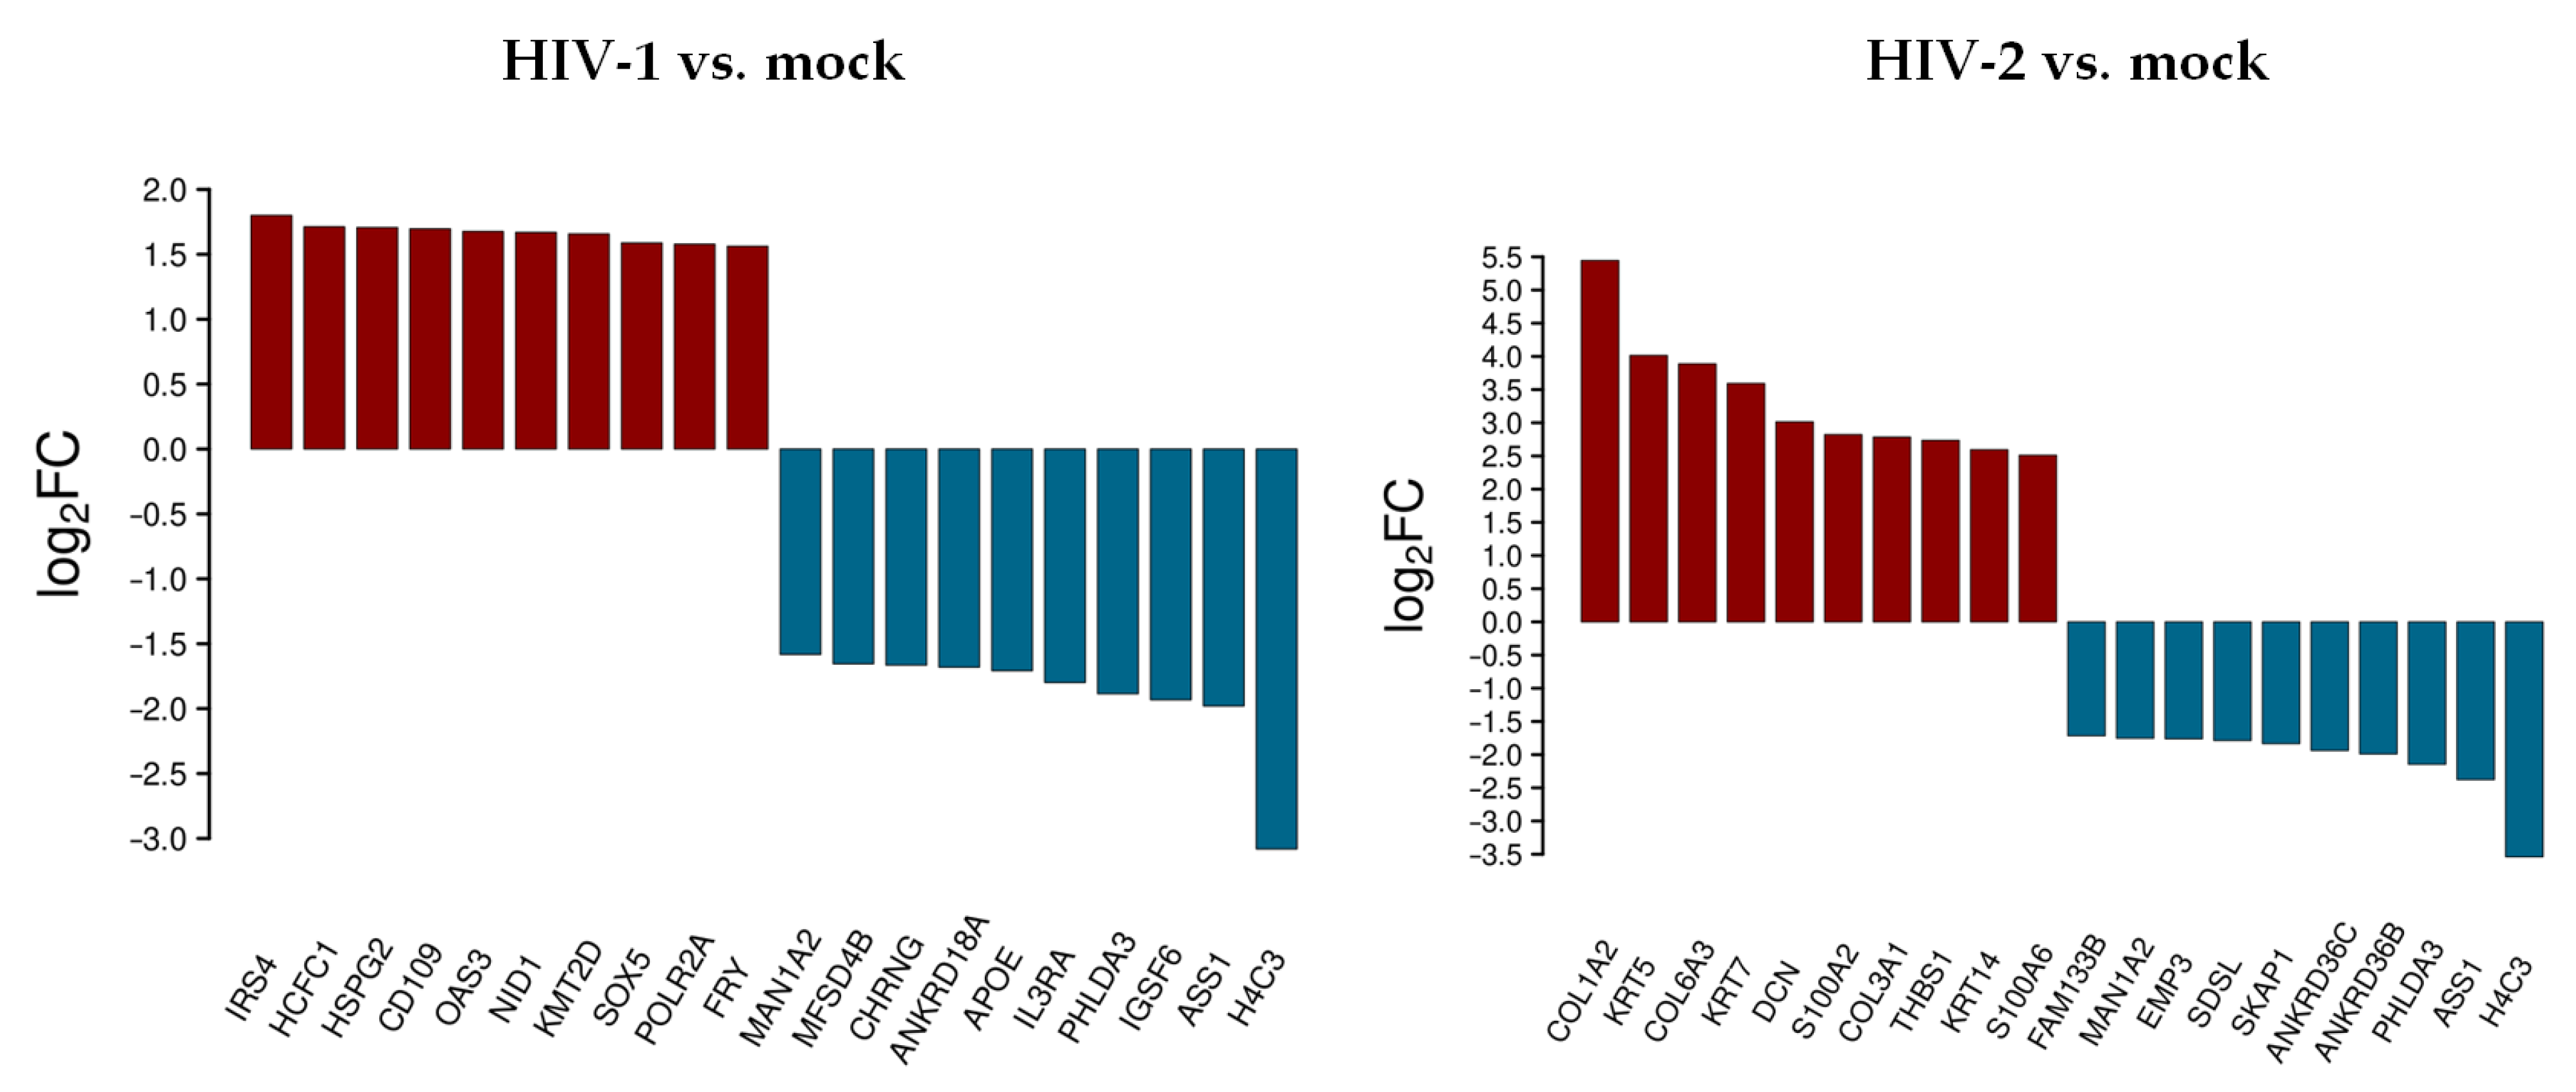
Abstract
:1. Introduction
2. Materials and Methods
2.1. Plasmids and Vectors
2.2. Production of HIV-1, HIV-2, and Mock Pseudovirions
2.3. Transduction of HEK-293T Cells for Transcriptomic Analysis
2.4. Transduction of HEK-293T Cells for Proteomic Analysis
2.5. Transcriptomic Data Analysis
2.6. GeLC-MS/MS Analysis
2.7. Data Analysis of Mass Spectrometry
3. Results
3.1. Analysis of Transcriptomic Changes in the First 2 h of HIV-1 and 2 Transduction
3.1.1. Differentially Expressed Genes at 0 h Post-Transduction
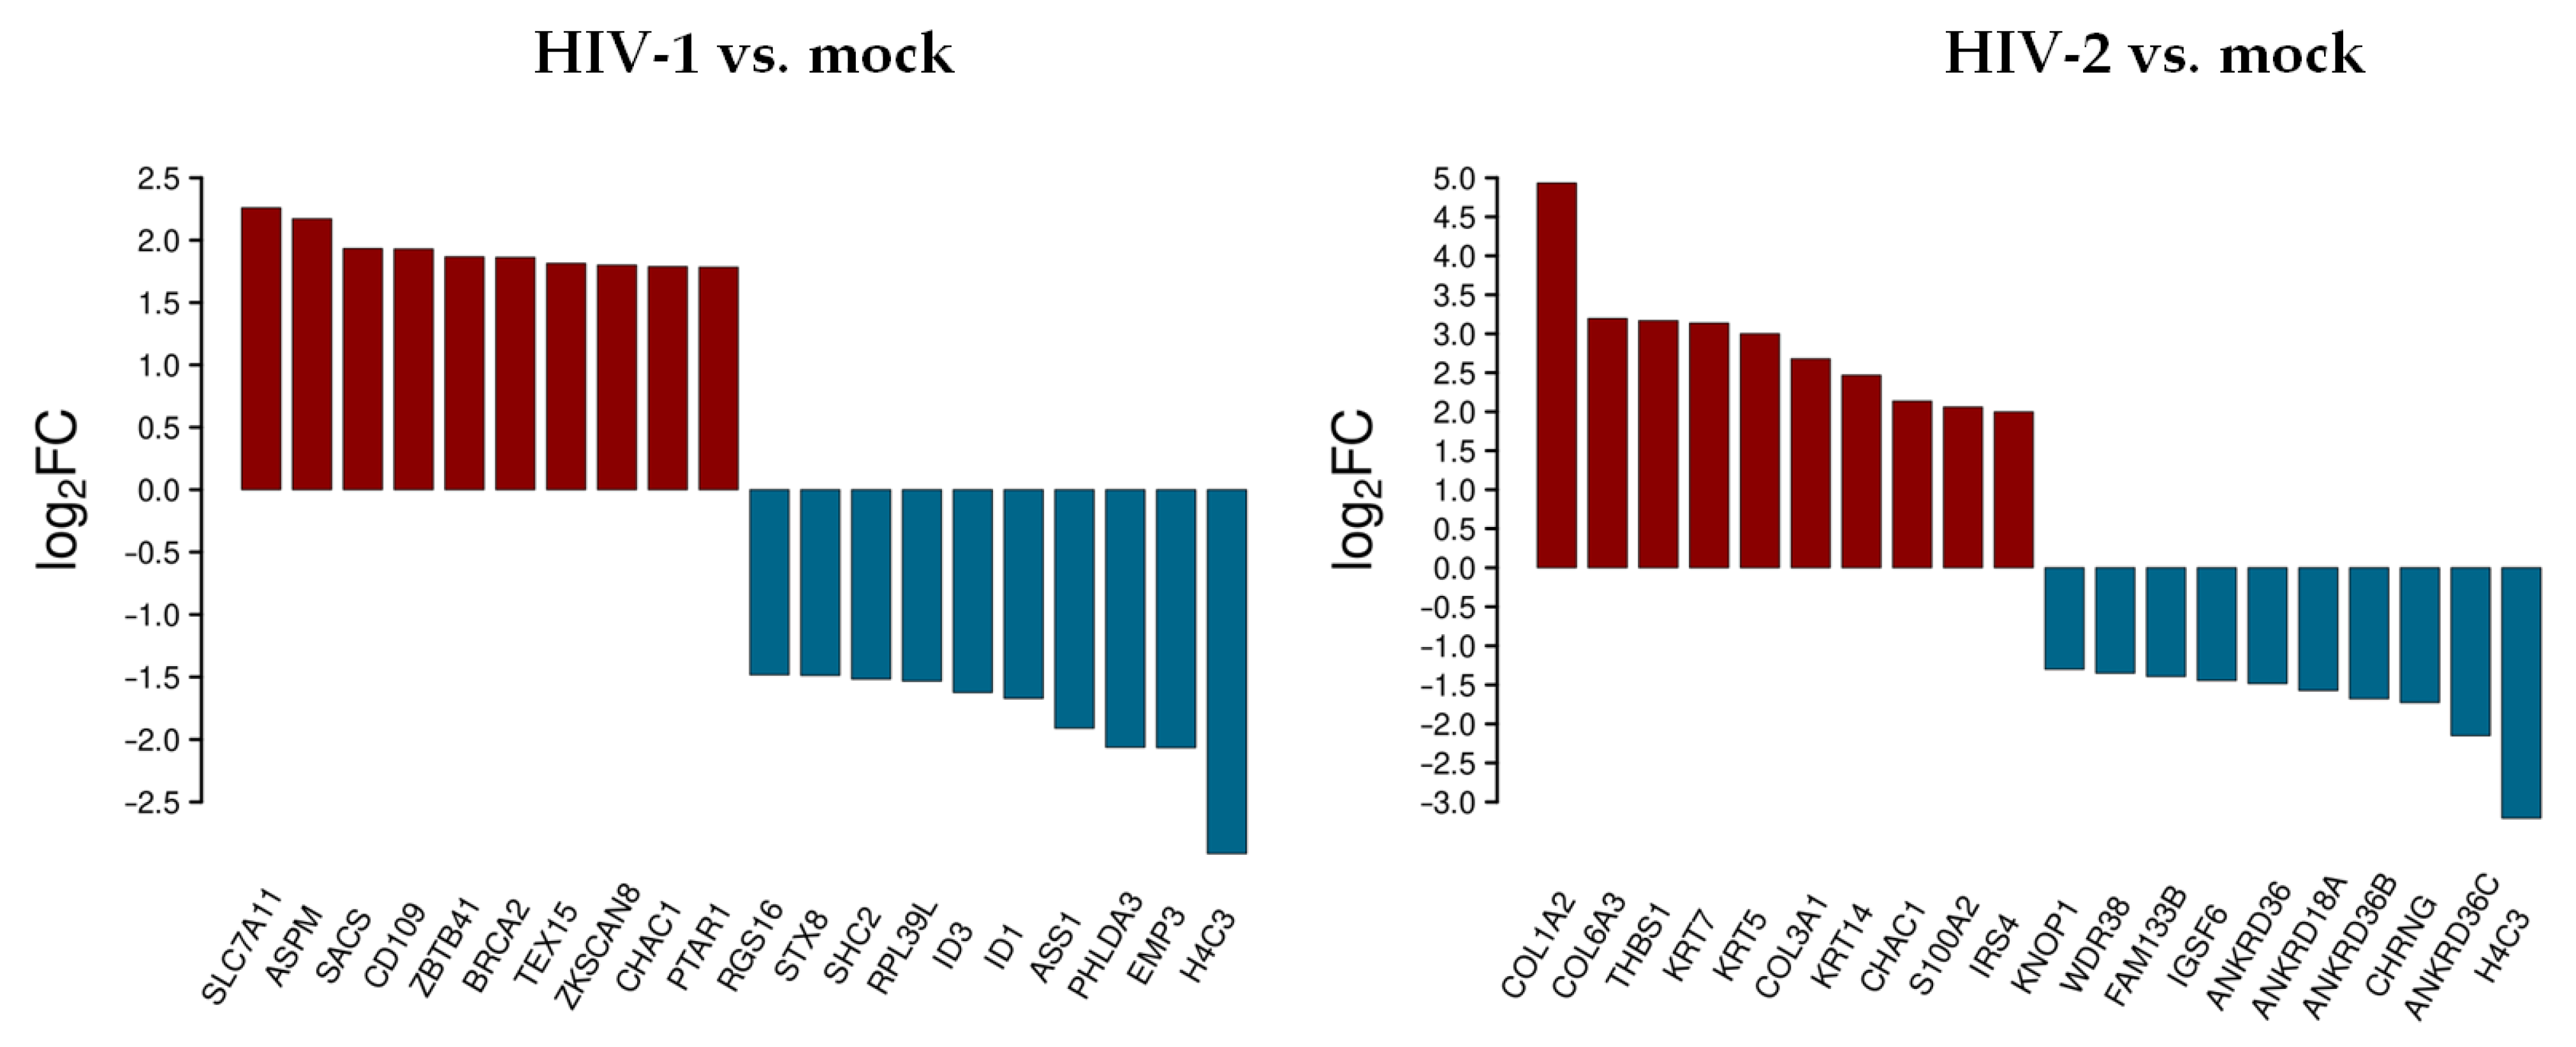
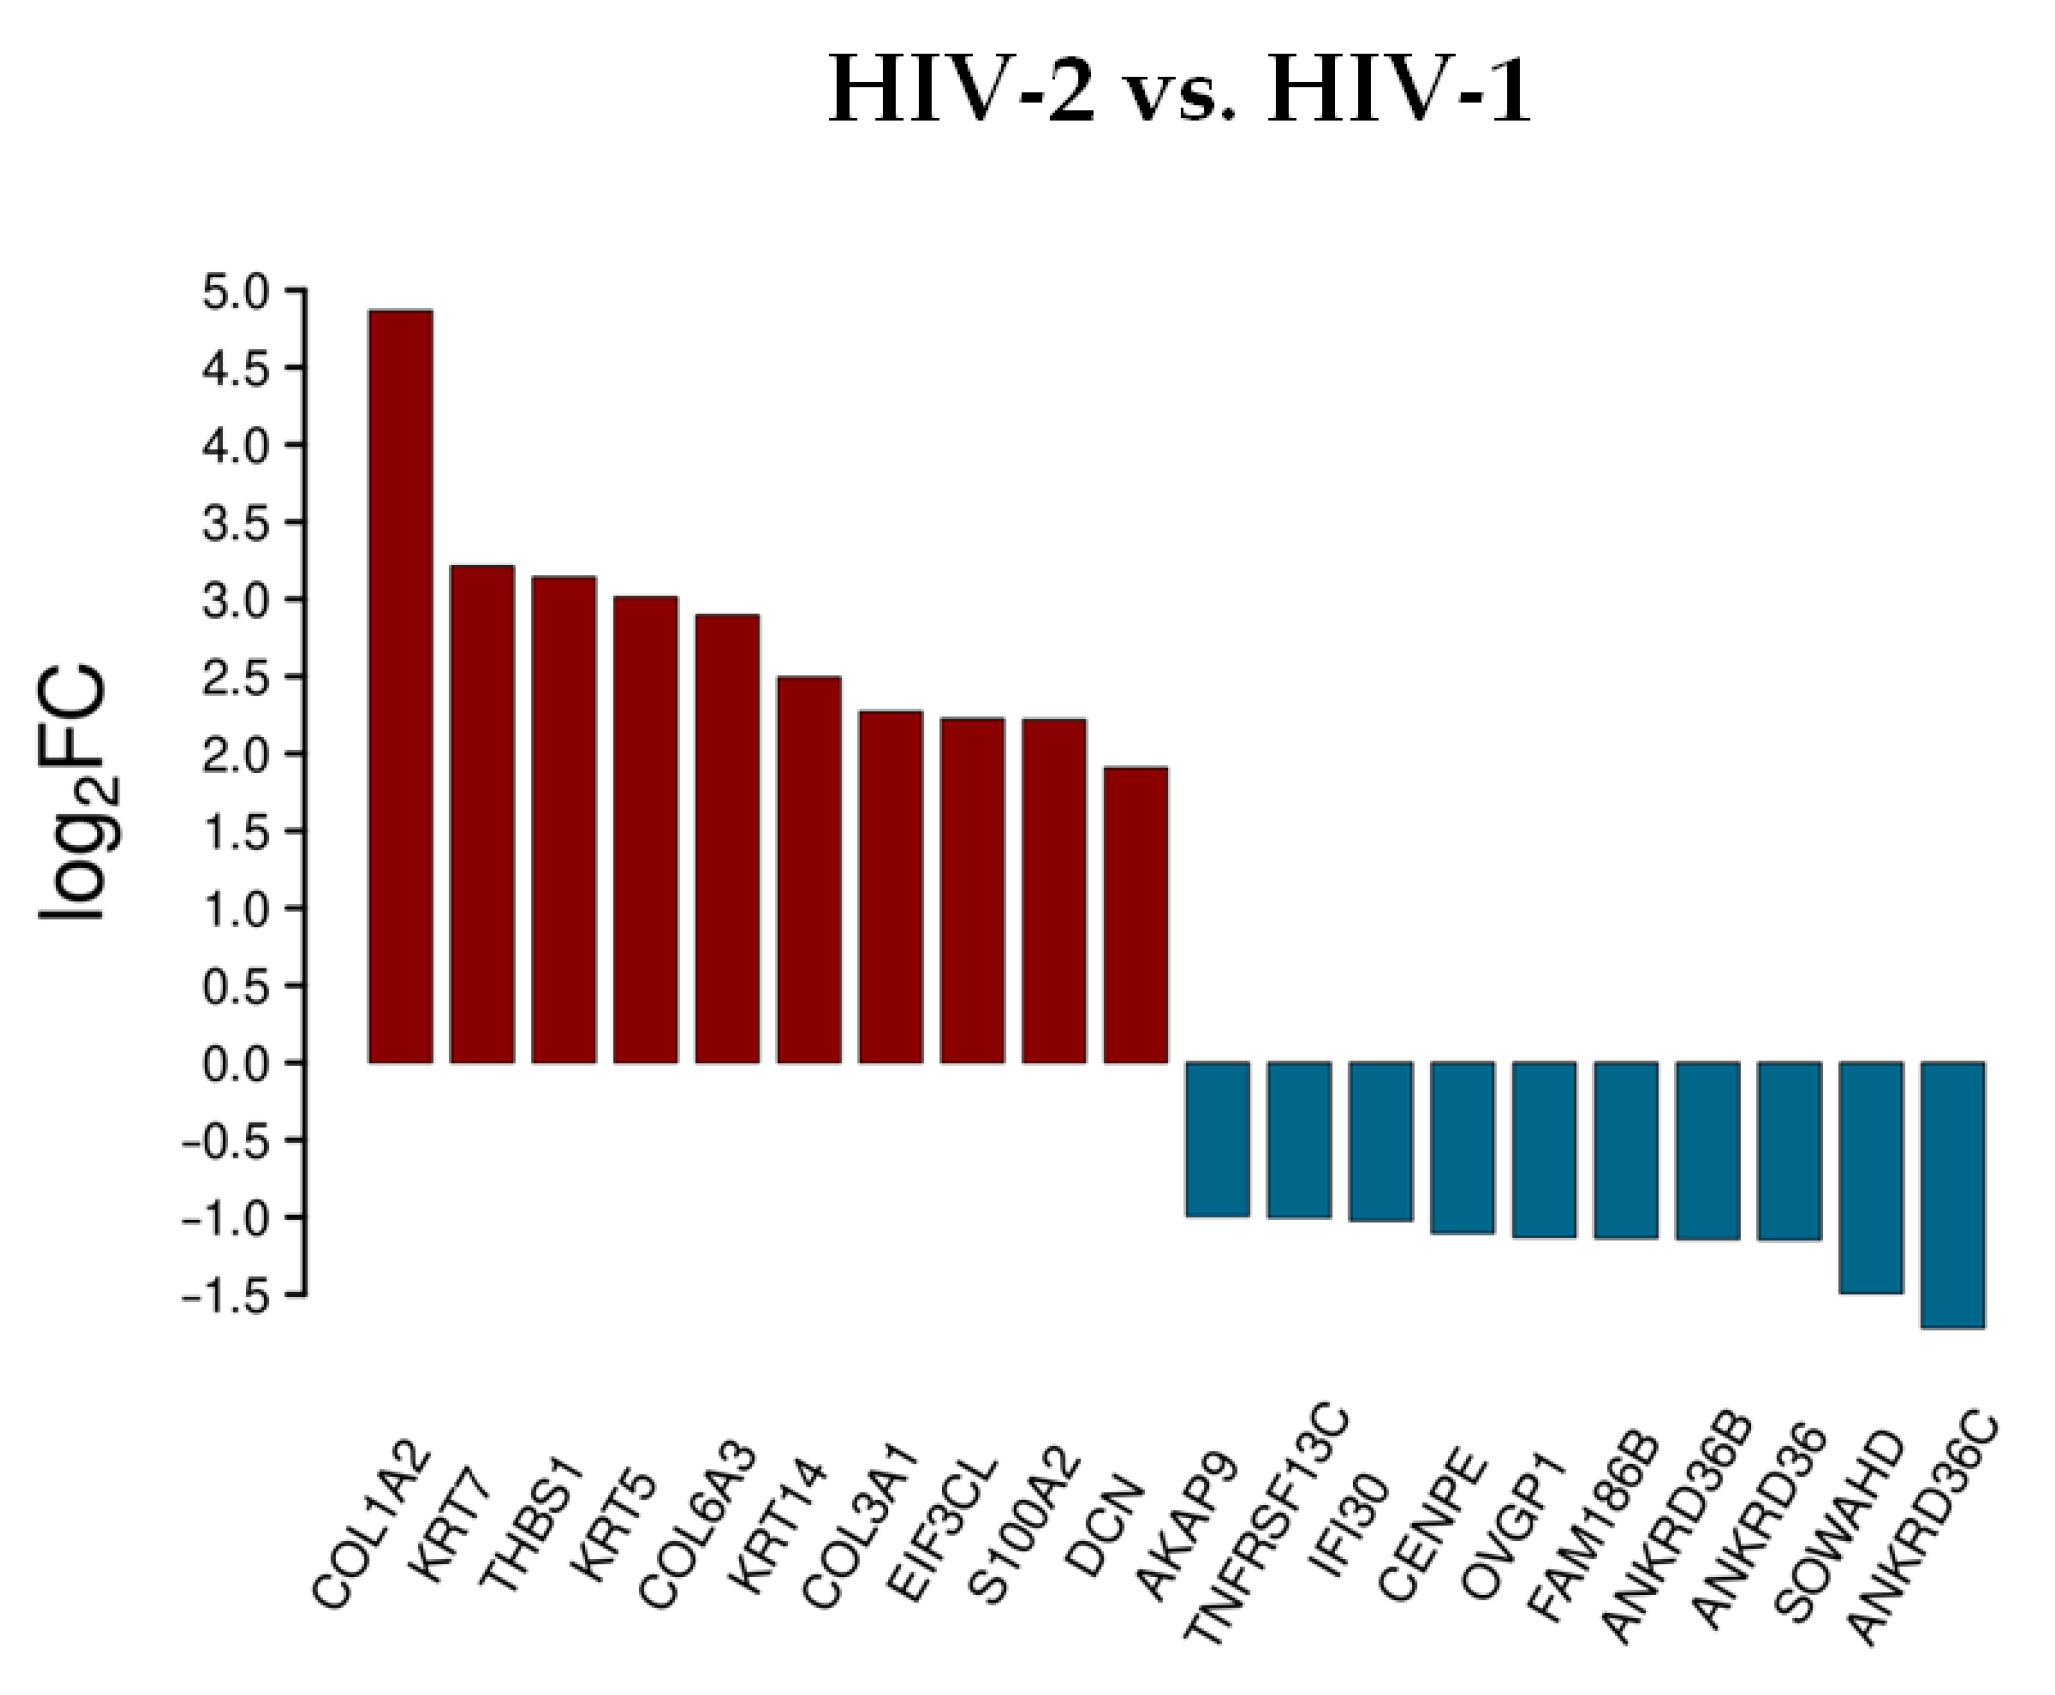
3.1.2. Differentially Expressed Genes at 2 h Post-Transduction
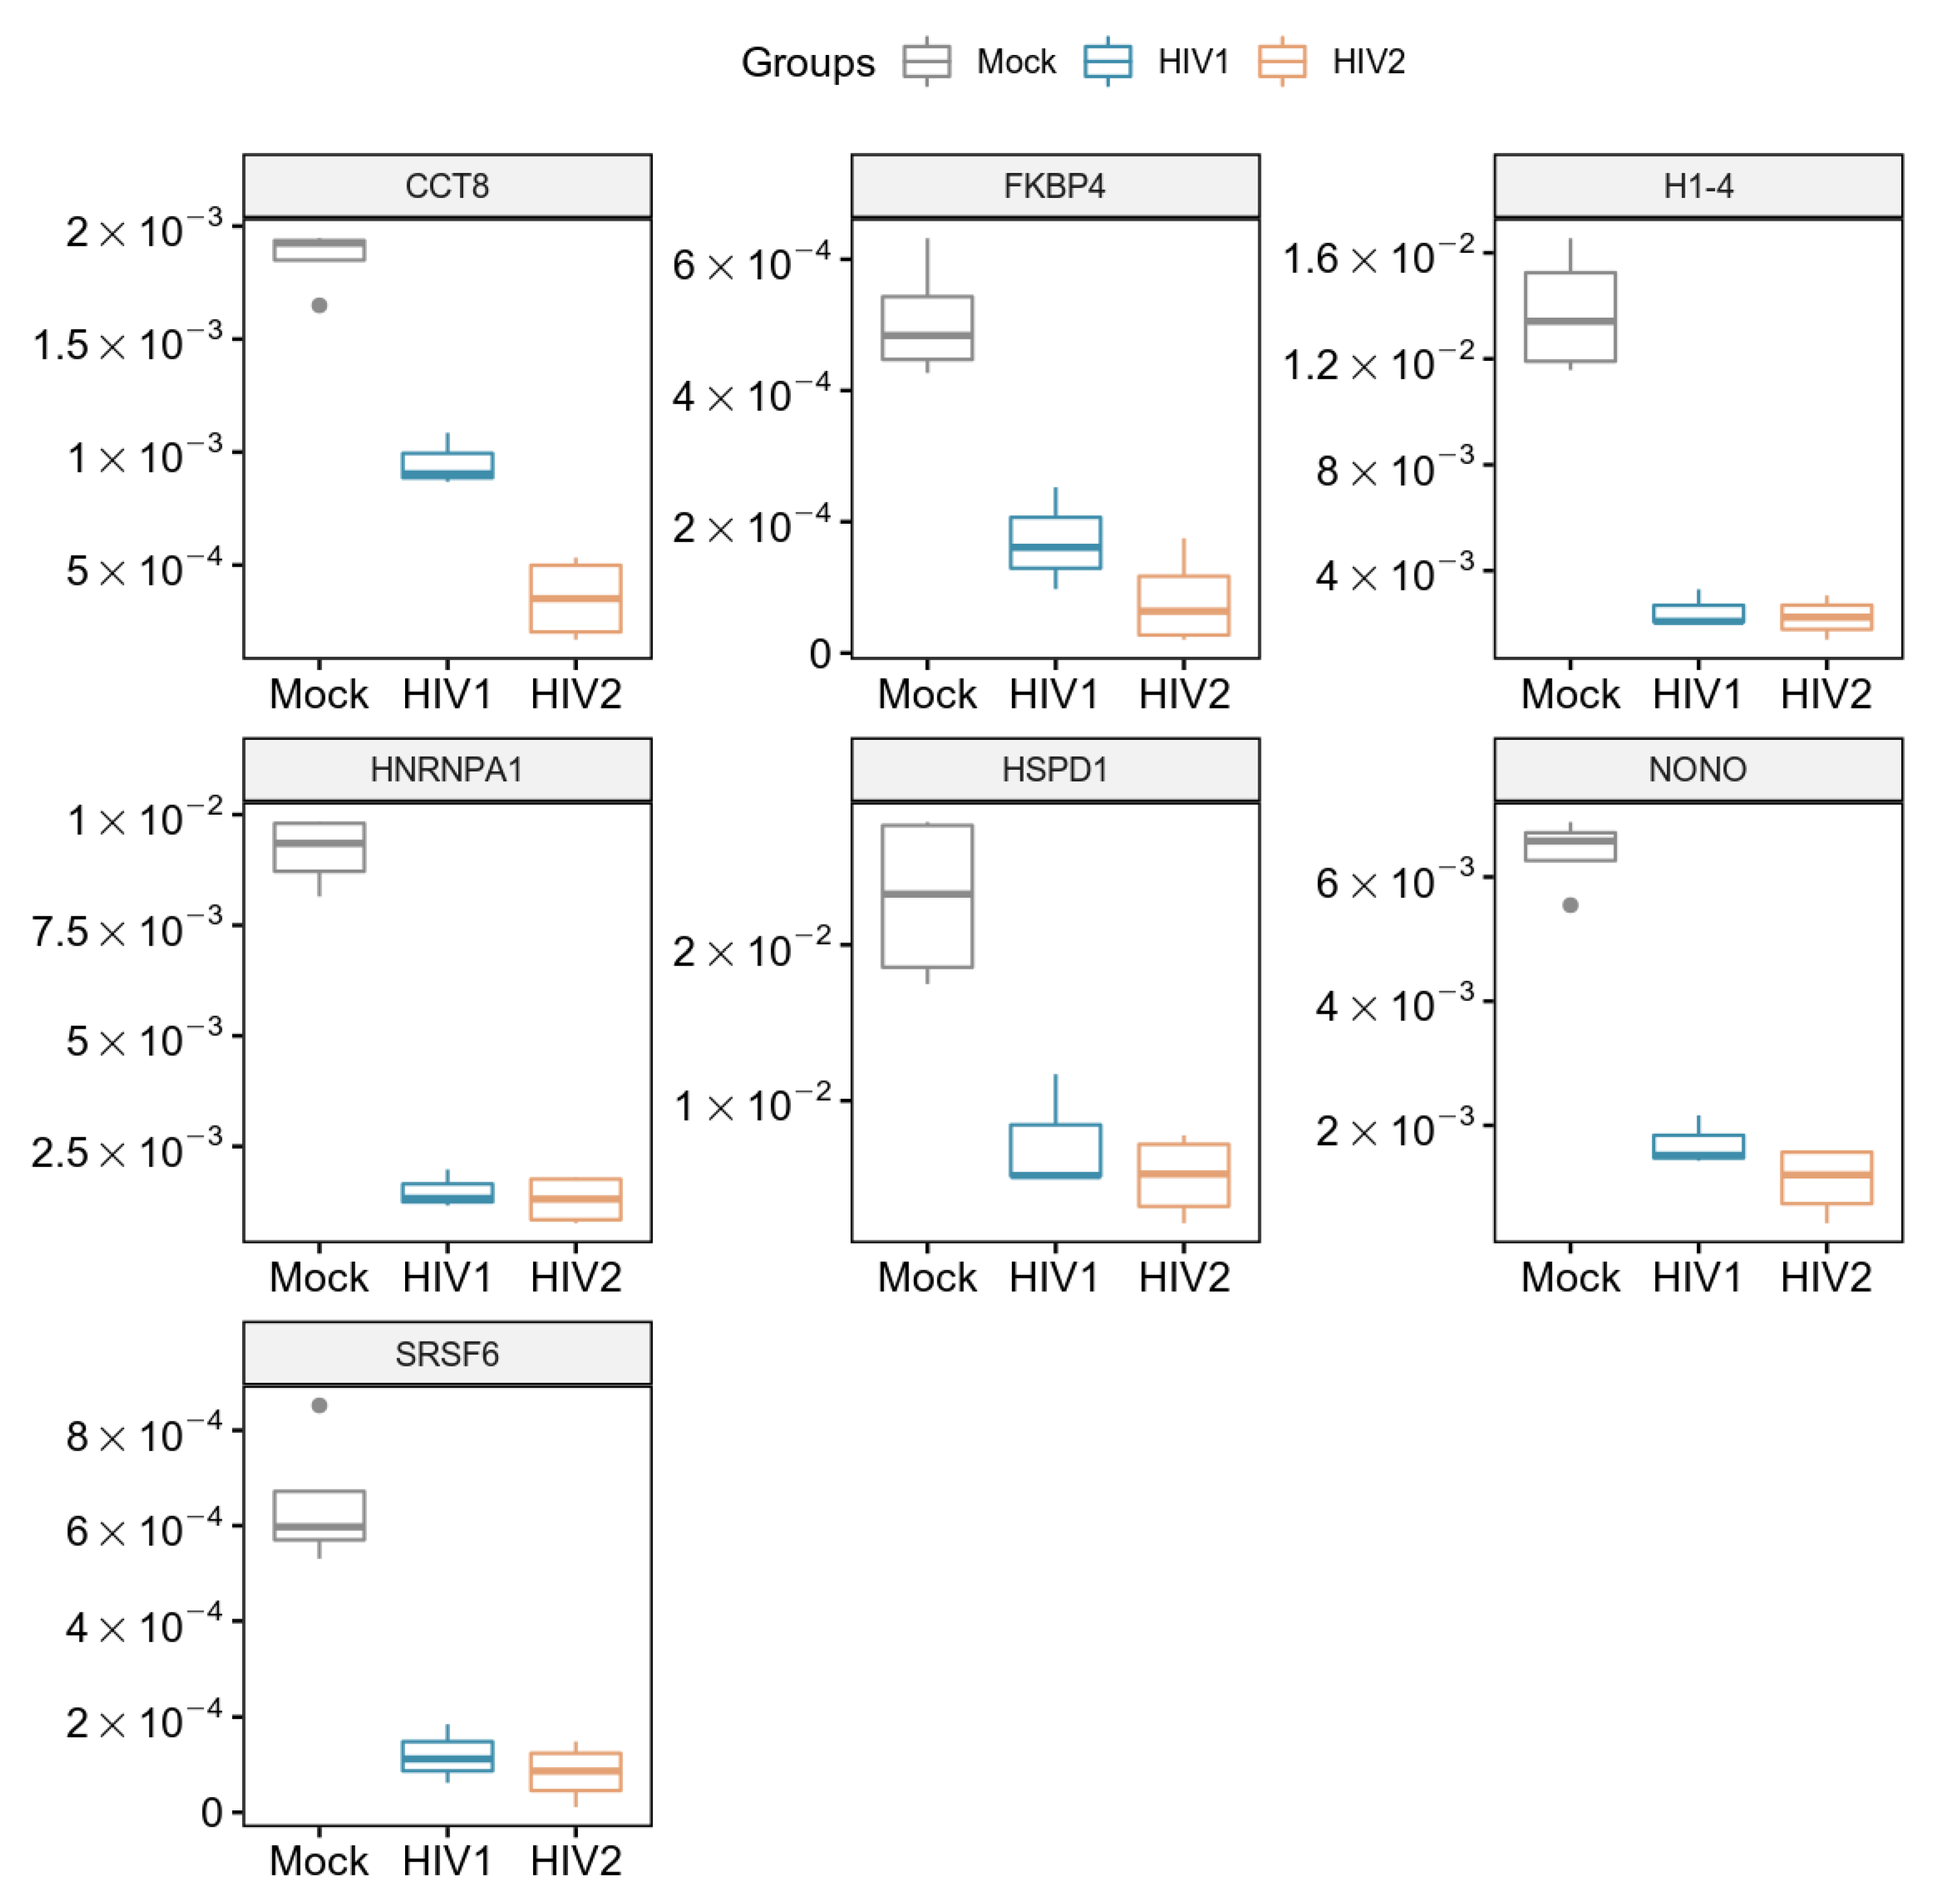
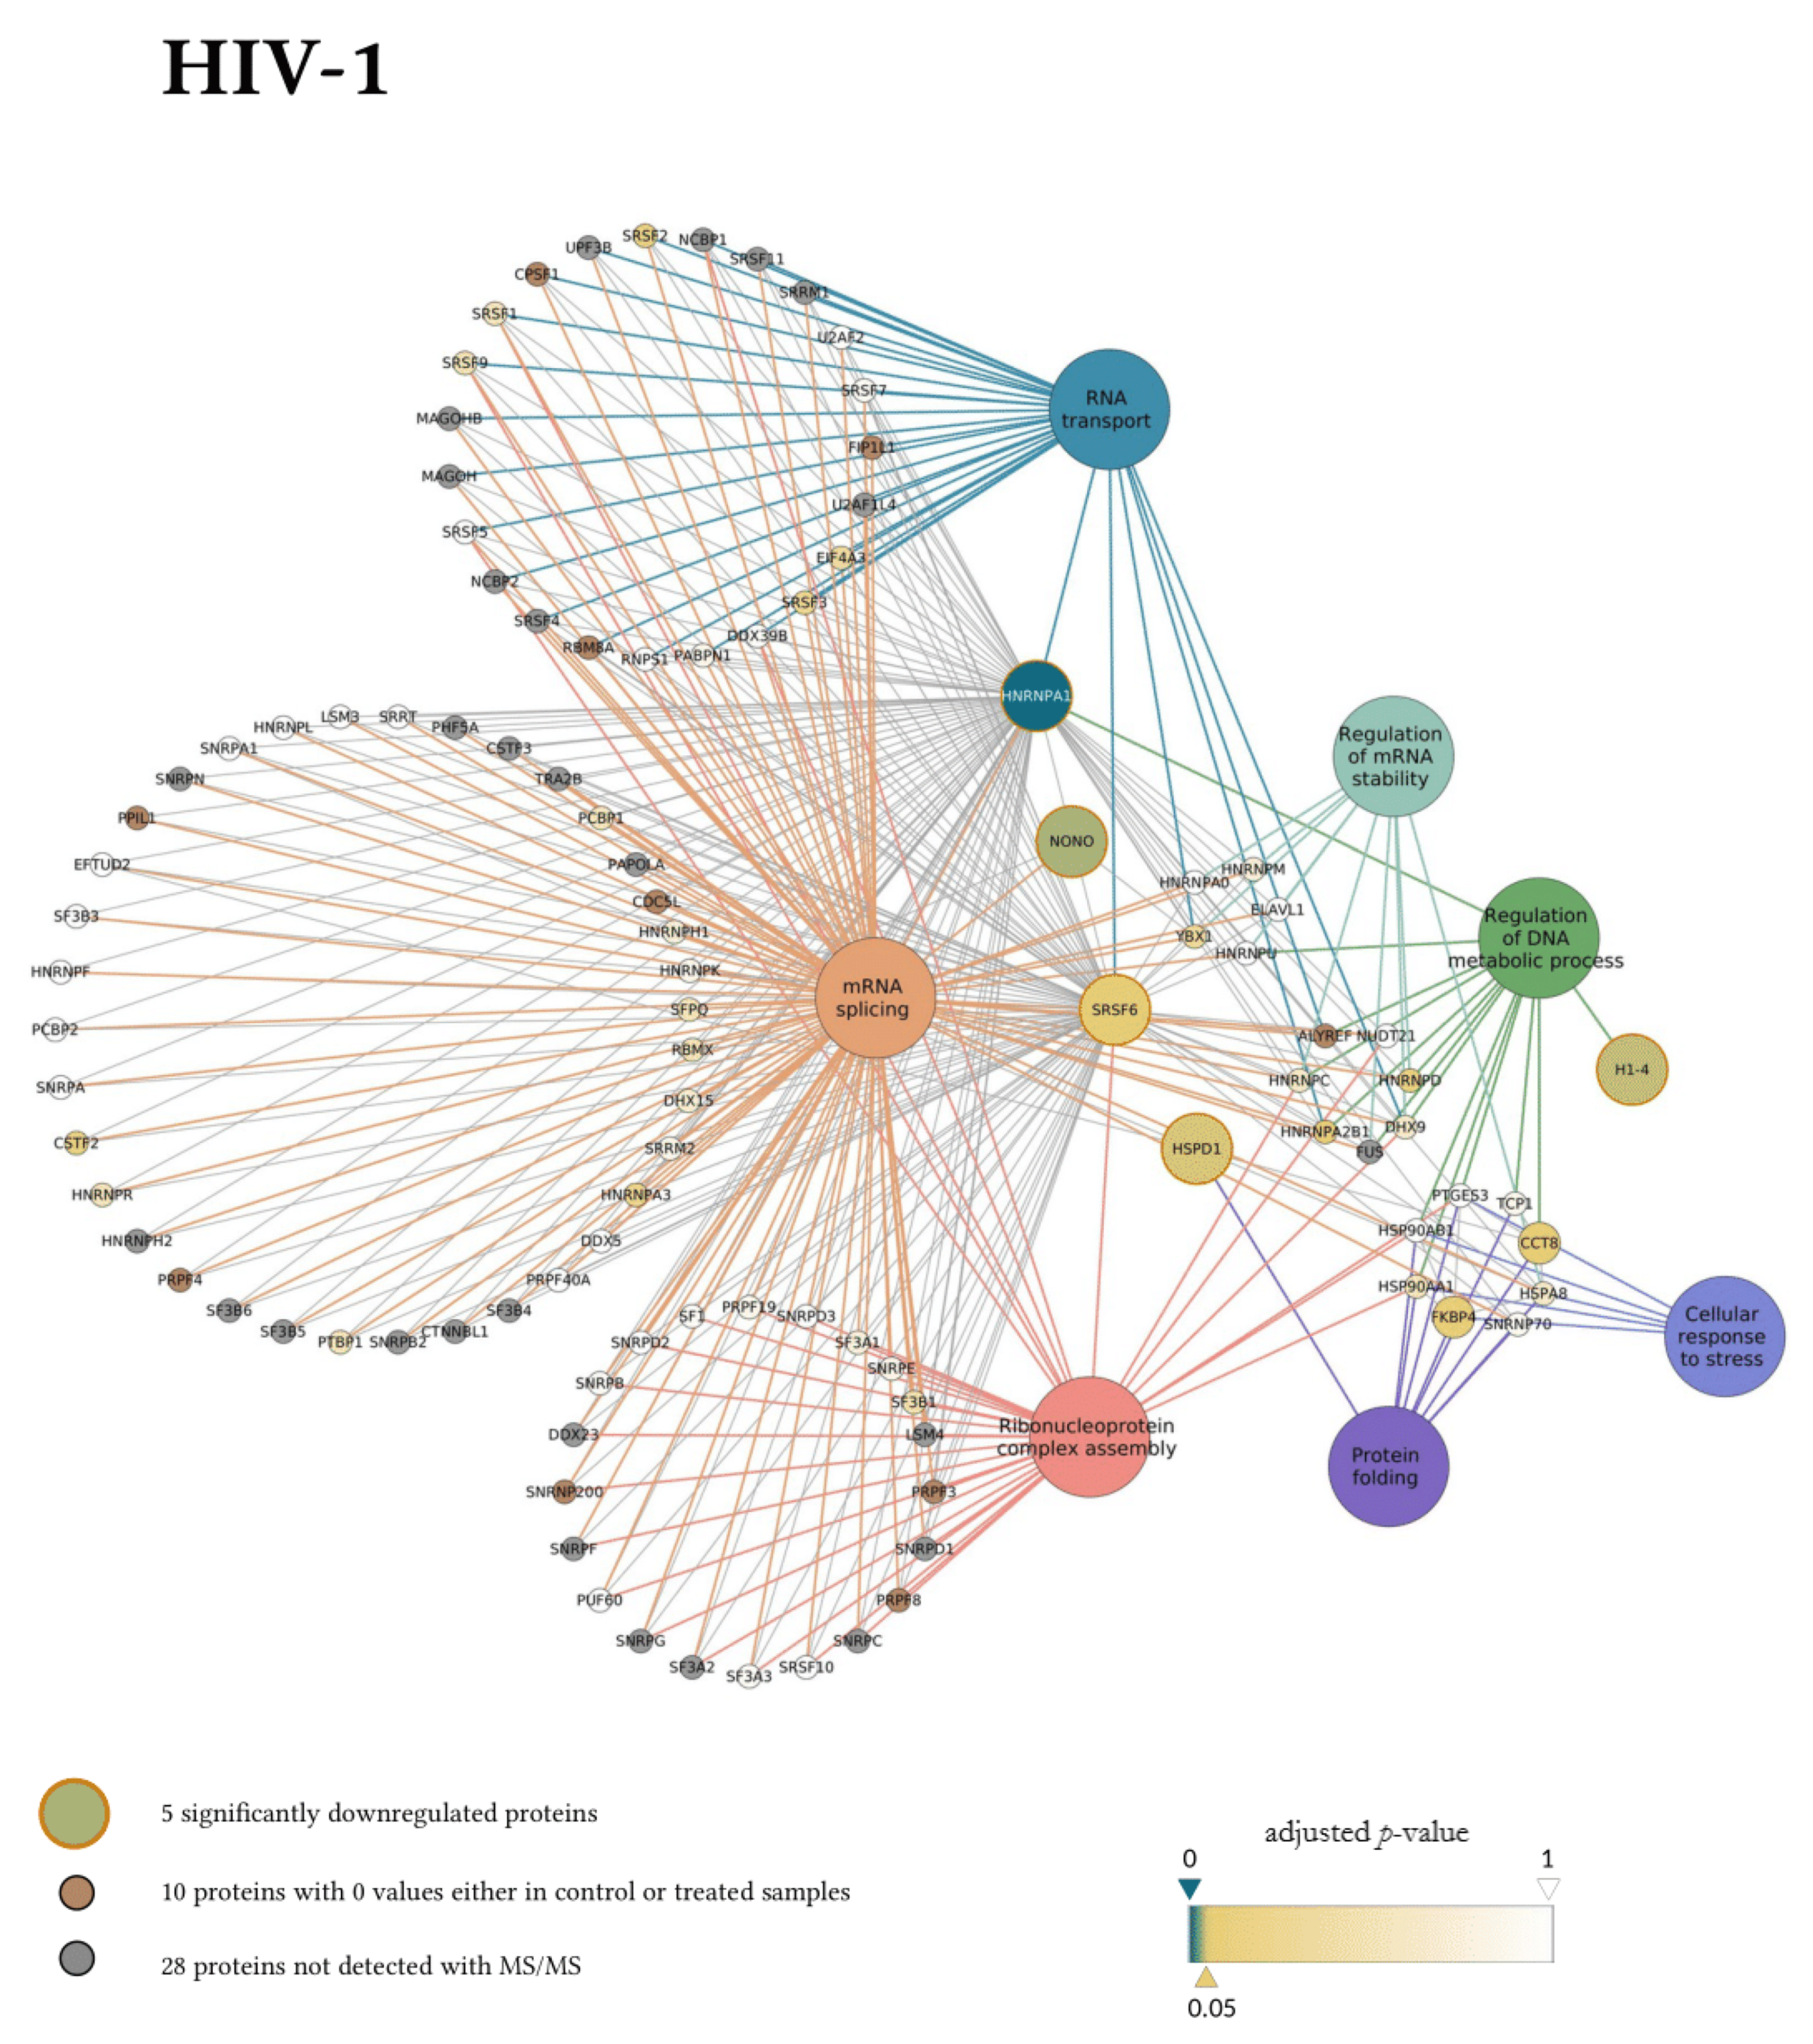
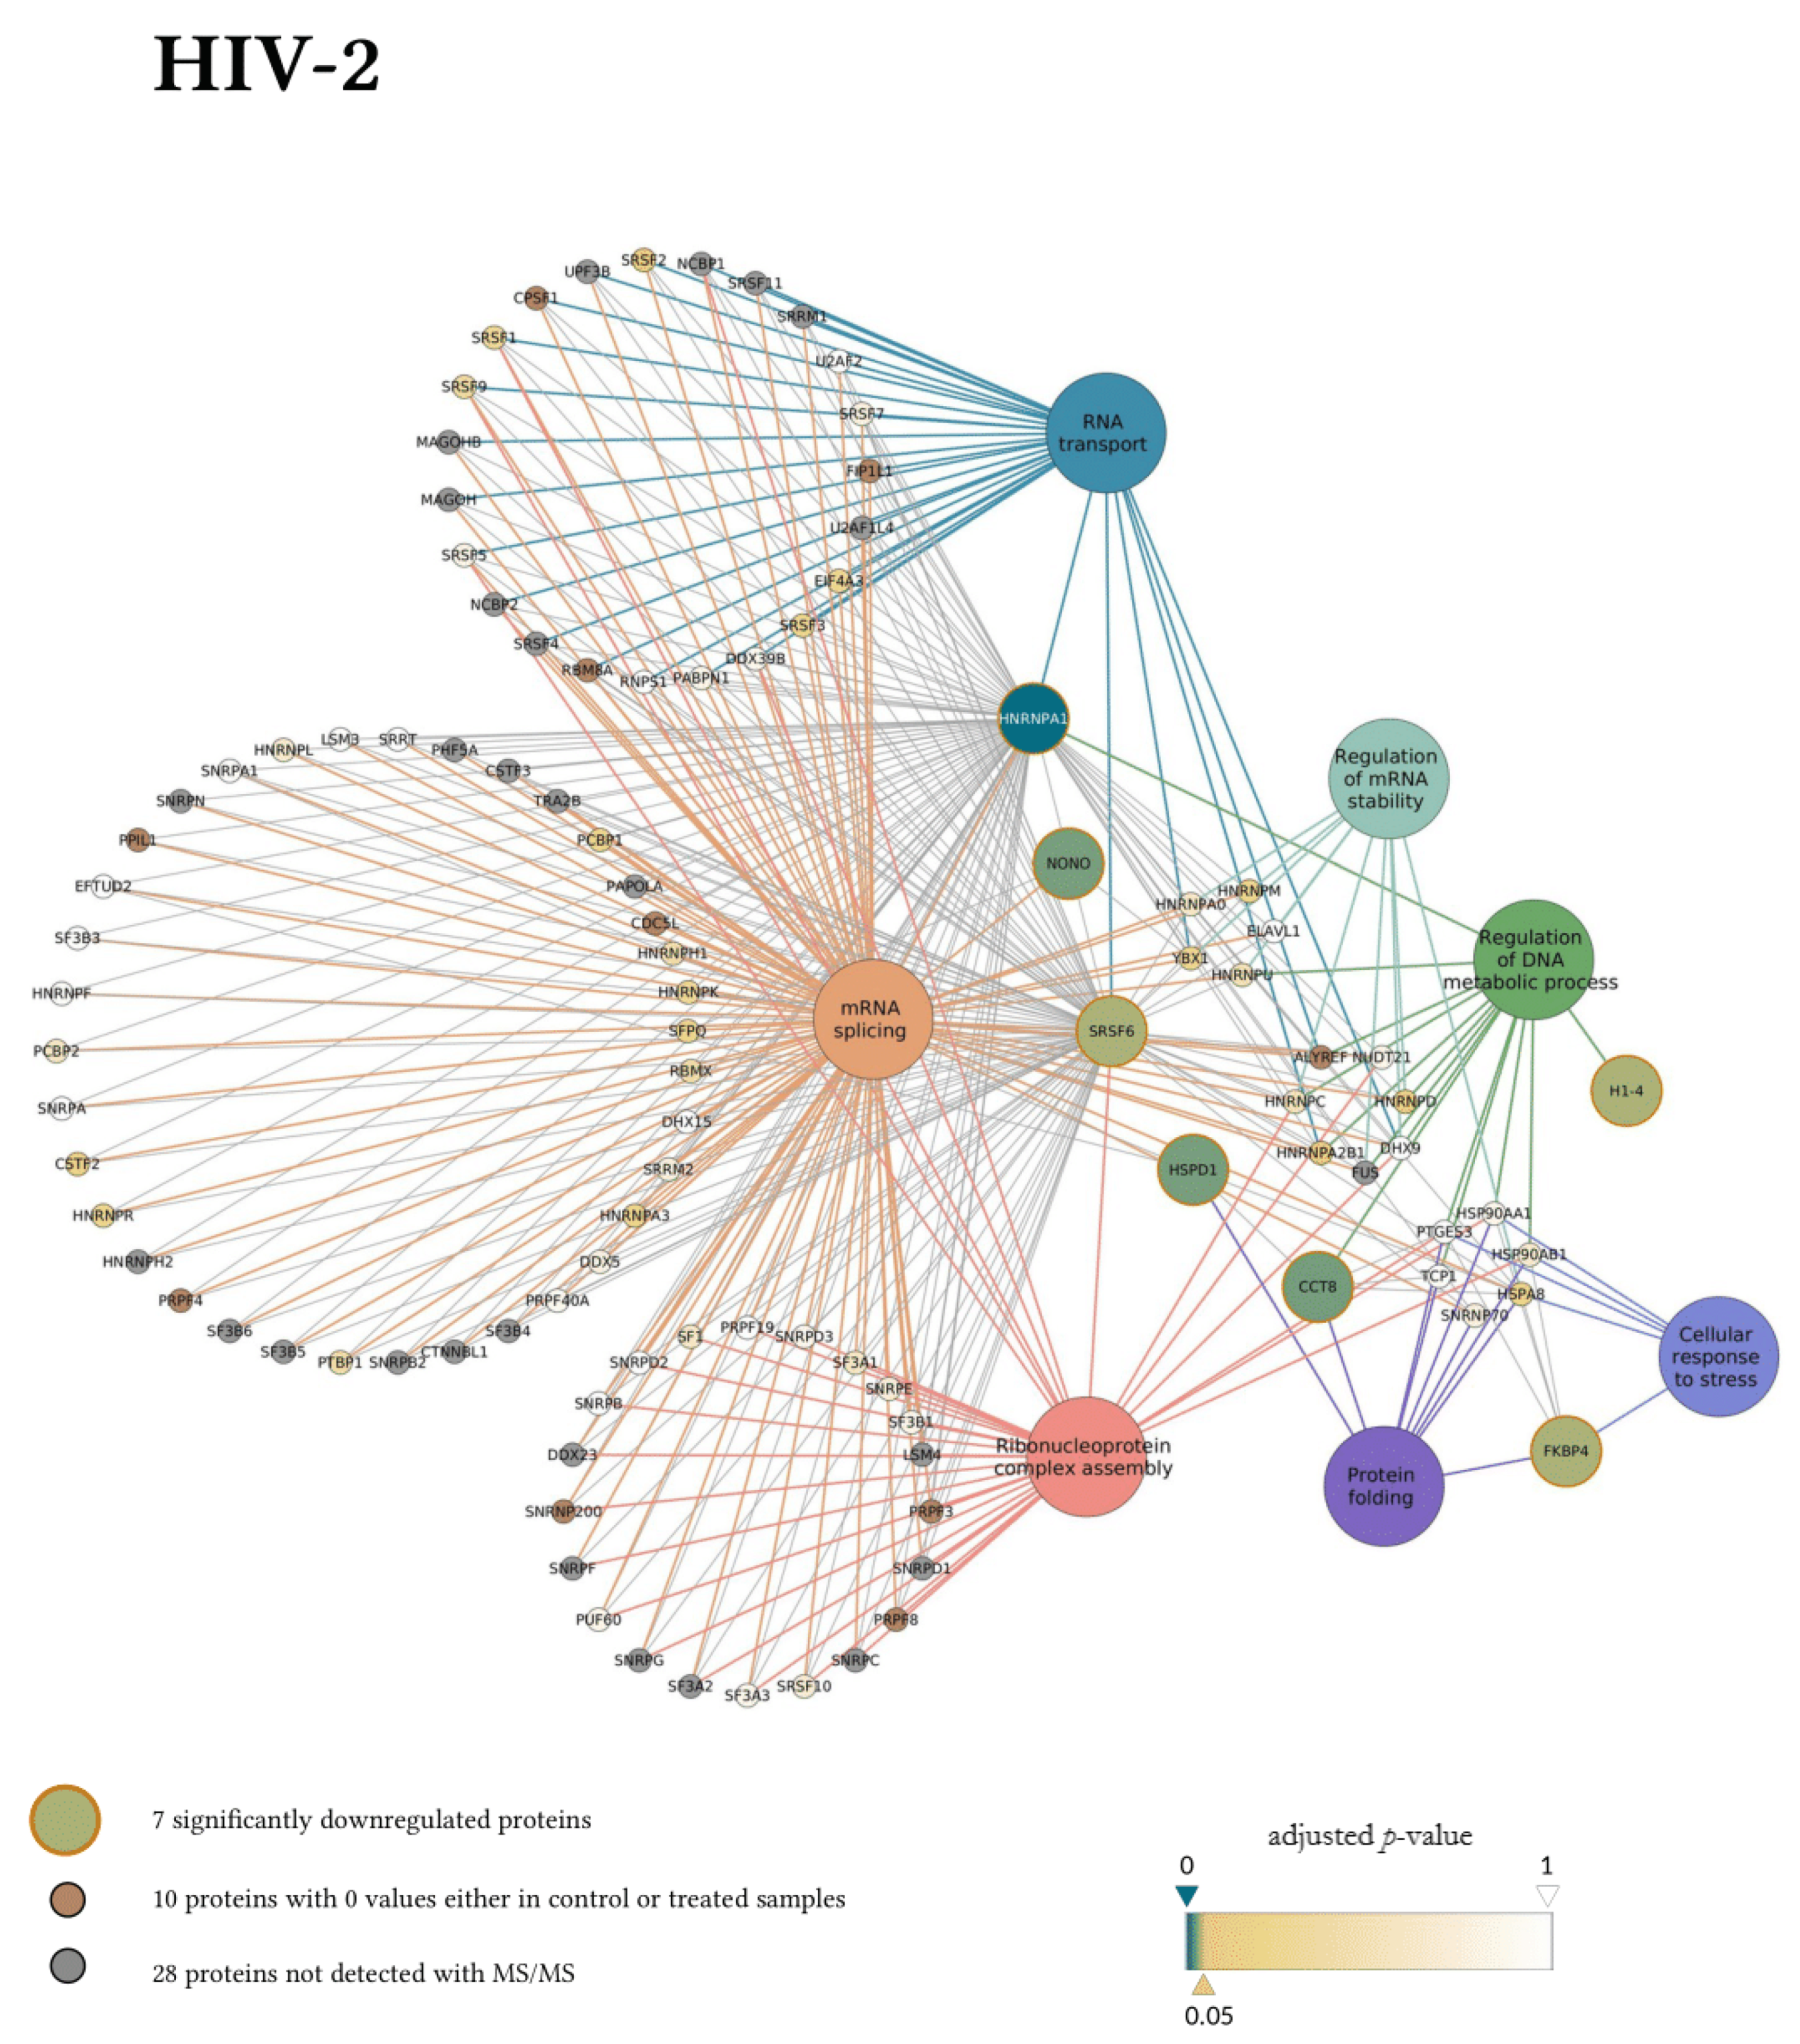
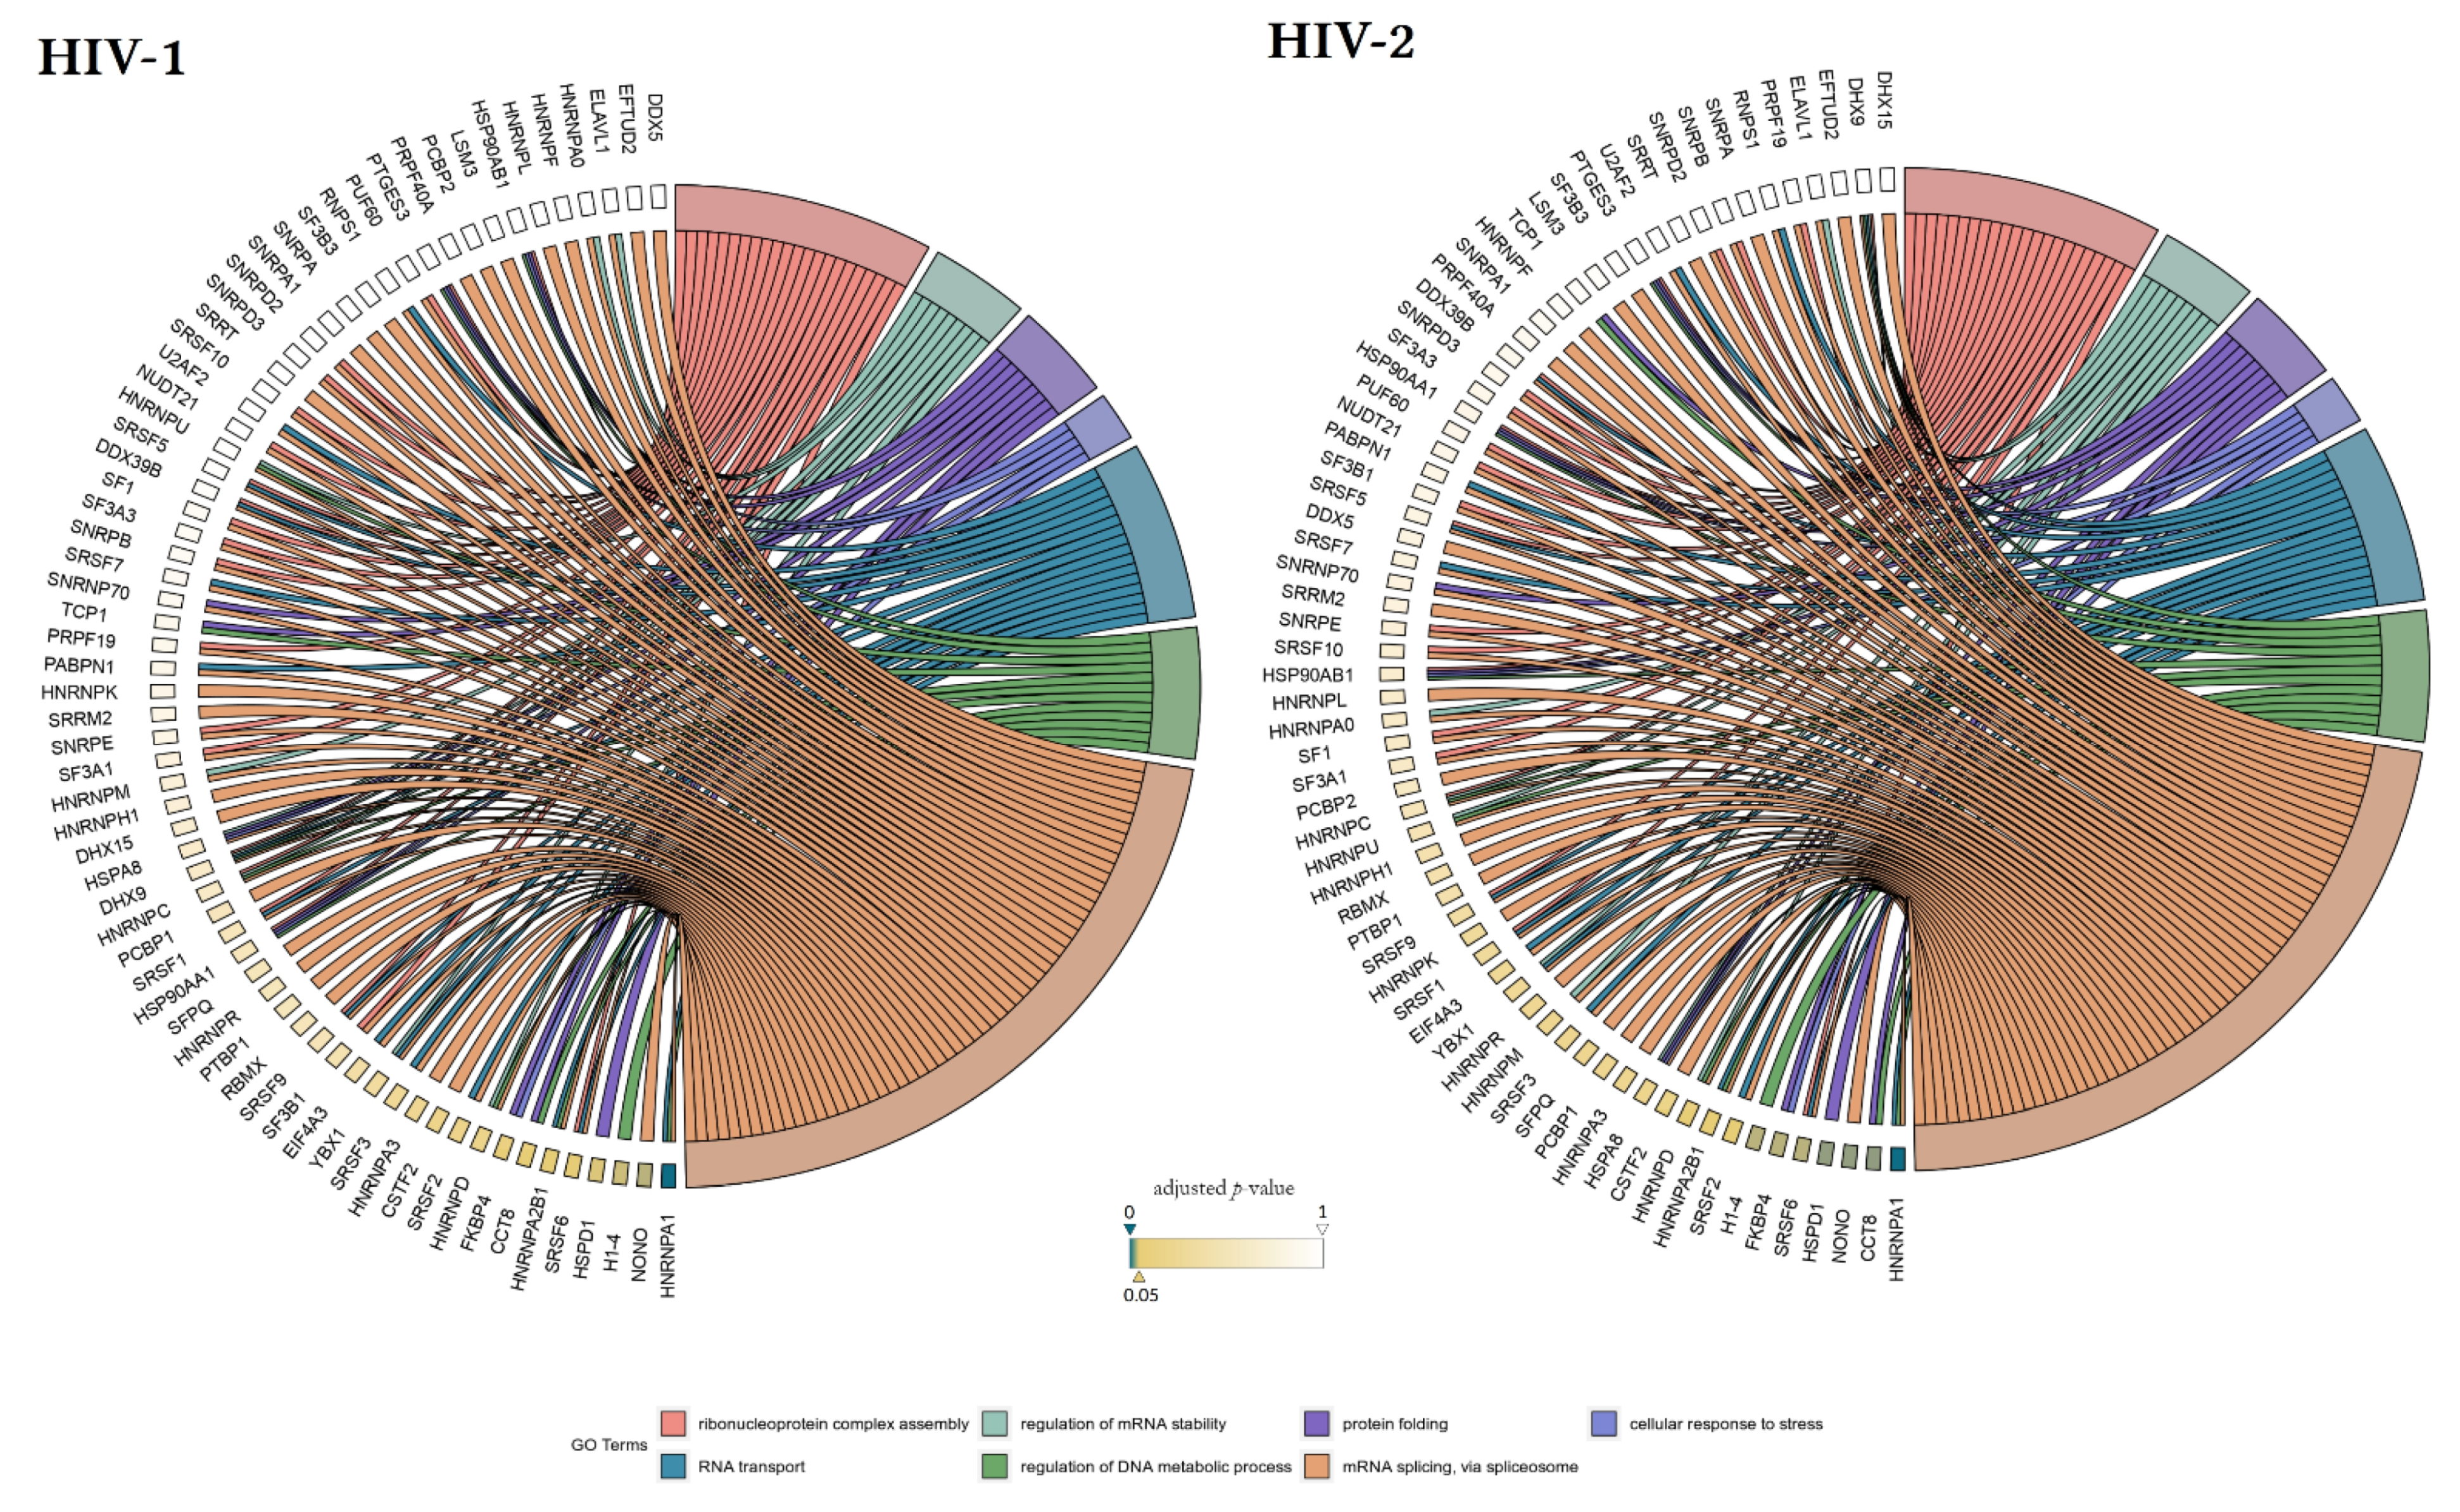
3.2. Early Proteomic Changes upon HIV-1 and HIV-2 Transduction
4. Discussion
Supplementary Materials
Author Contributions
Funding
Institutional Review Board Statement
Informed Consent Statement
Data Availability Statement
Acknowledgments
Conflicts of Interest
References
- Milone, M.C.; O’Doherty, U. Clinical use of lentiviral vectors. Leukemia 2018, 32, 1529–1541. [Google Scholar] [CrossRef] [PubMed]
- Cantore, A.; Ranzani, M.; Bartholomae, C.C.; Volpin, M.; Valle, P.D.; Sanvito, F.; Sergi, L.S.; Gallina, P.; Benedicenti, F.; Bellinger, D.; et al. Liver-directed lentiviral gene therapy in a dog model of hemophilia b. Sci. Transl. Med. 2015, 7, 277ra228. [Google Scholar] [CrossRef] [PubMed] [Green Version]
- Campochiaro, P.A.; Lauer, A.K.; Sohn, E.H.; Mir, T.A.; Naylor, S.; Anderton, M.C.; Kelleher, M.; Harrop, R.; Ellis, S.; Mitrophanous, K.A. Lentiviral vector gene transfer of endostatin/angiostatin for macular degeneration (gem) study. Hum. Gene Ther. 2017, 28, 99–111. [Google Scholar] [CrossRef] [PubMed]
- Bear, A.S.; Morgan, R.A.; Cornetta, K.; June, C.H.; Binder-Scholl, G.; Dudley, M.E.; Feldman, S.A.; Rosenberg, S.A.; Shurtleff, S.A.; Rooney, C.M.; et al. Replication-competent retroviruses in gene-modified t cells used in clinical trials: Is it time to revise the testing requirements? Mol. Ther. J. Am. Soc. Gene Ther. 2012, 20, 246–249. [Google Scholar] [CrossRef] [Green Version]
- Coffin, J.M.; Hughes, S.H.; Varmus, H.E. The interactions of retroviruses and their hosts. In Retroviruses; Coffin, J.M., Hughes, S.H., Varmus, H.E., Eds.; Cold Spring Harbor: New York, NY, USA, 1997. [Google Scholar]
- Bukrinsky, M.I.; Haggerty, S.; Dempsey, M.P.; Sharova, N.; Adzhubel, A.; Spitz, L.; Lewis, P.; Goldfarb, D.; Emerman, M.; Stevenson, M. A nuclear localization signal within hiv-1 matrix protein that governs infection of non-dividing cells. Nature 1993, 365, 666–669. [Google Scholar] [CrossRef]
- Heinzinger, N.K.; Bukrinsky, M.I.; Haggerty, S.A.; Ragland, A.M.; Kewalramani, V.; Lee, M.A.; Gendelman, H.E.; Ratner, L.; Stevenson, M.; Emerman, M. The vpr protein of human immunodeficiency virus type 1 influences nuclear localization of viral nucleic acids in nondividing host cells. Proc. Natl. Acad. Sci. USA 1994, 91, 7311–7315. [Google Scholar] [CrossRef] [Green Version]
- Cherepanov, P.; Maertens, G.; Proost, P.; Devreese, B.; Van Beeumen, J.; Engelborghs, Y.; De Clercq, E.; Debyser, Z. Hiv-1 integrase forms stable tetramers and associates with ledgf/p75 protein in human cells. J. Biol. Chem. 2003, 278, 372–381. [Google Scholar] [CrossRef] [Green Version]
- De Rijck, J.; de Kogel, C.; Demeulemeester, J.; Vets, S.; El Ashkar, S.; Malani, N.; Bushman, F.D.; Landuyt, B.; Husson, S.J.; Busschots, K.; et al. The bet family of proteins targets moloney murine leukemia virus integration near transcription start sites. Cell Rep. 2013, 5, 886–894. [Google Scholar] [CrossRef] [Green Version]
- Konig, R.; Zhou, Y.; Elleder, D.; Diamond, T.L.; Bonamy, G.M.; Irelan, J.T.; Chiang, C.Y.; Tu, B.P.; De Jesus, P.D.; Lilley, C.E.; et al. Global analysis of host-pathogen interactions that regulate early-stage hiv-1 replication. Cell 2008, 135, 49–60. [Google Scholar] [CrossRef] [Green Version]
- Jager, S.; Cimermancic, P.; Gulbahce, N.; Johnson, J.R.; McGovern, K.E.; Clarke, S.C.; Shales, M.; Mercenne, G.; Pache, L.; Li, K.; et al. Global landscape of hiv-human protein complexes. Nature 2011, 481, 365–370. [Google Scholar] [CrossRef]
- Navare, A.T.; Sova, P.; Purdy, D.E.; Weiss, J.M.; Wolf-Yadlin, A.; Korth, M.J.; Chang, S.T.; Proll, S.C.; Jahan, T.A.; Krasnoselsky, A.L.; et al. Quantitative proteomic analysis of hiv-1 infected cd4+ t cells reveals an early host response in important biological pathways: Protein synthesis, cell proliferation, and t-cell activation. Virology 2012, 429, 37–46. [Google Scholar] [CrossRef] [PubMed] [Green Version]
- Bushman, F.D.; Malani, N.; Fernandes, J.; D’Orso, I.; Cagney, G.; Diamond, T.L.; Zhou, H.; Hazuda, D.J.; Espeseth, A.S.; Konig, R.; et al. Host cell factors in hiv replication: Meta-analysis of genome-wide studies. PLoS Pathog. 2009, 5, e1000437. [Google Scholar] [CrossRef] [PubMed]
- Ivanov, S.; Lagunin, A.; Filimonov, D.; Tarasova, O. Network-based analysis of omics data to understand the hiv-host interaction. Front. Microbiol. 2020, 11, 1314. [Google Scholar] [CrossRef]
- Csermely, P.; Korcsmaros, T.; Kiss, H.J.; London, G.; Nussinov, R. Structure and dynamics of molecular networks: A novel paradigm of drug discovery: A comprehensive review. Pharmacol. Ther. 2013, 138, 333–408. [Google Scholar] [CrossRef] [PubMed] [Green Version]
- Marchant, D.; Neil, S.J.D.; McKnight, A. Human immunodeficiency virus types 1 and 2 have different replication kinetics in human primary macrophage culture. J. Gen. Virol. 2006, 87, 411–418. [Google Scholar] [CrossRef]
- Bock, P.J.; Markovitz, D.M. Infection with hiv-2. Aids 2001, 15 (Suppl. 5), S35–S45. [Google Scholar] [CrossRef]
- Miklossy, G.; Tozser, J.; Kadas, J.; Ishima, R.; Louis, J.M.; Bagossi, P. Novel macromolecular inhibitors of human immunodeficiency virus-1 protease. Protein Eng. Des. Sel. 2008, 21, 453–461. [Google Scholar] [CrossRef] [Green Version]
- Chang, L.J.; Urlacher, V.; Iwakuma, T.; Cui, Y.; Zucali, J. Efficacy and safety analyses of a recombinant human immunodeficiency virus type 1 derived vector system. Gene Ther. 1999, 6, 715–728. [Google Scholar] [CrossRef] [Green Version]
- Mukherjee, S.; Lee, H.L.; Pacchia, A.L.; Ron, Y.; Dougherty, J.P. A hiv-2-based self-inactivating vector for enhanced gene transduction. J. Biotechnol. 2007, 127, 745–757. [Google Scholar] [CrossRef]
- Mahdi, M.; Matuz, K.; Toth, F.; Tozser, J. A modular system to evaluate the efficacy of protease inhibitors against hiv-2. PLoS ONE 2014, 9, e113221. [Google Scholar] [CrossRef] [Green Version]
- Bolger, A.M.; Lohse, M.; Usadel, B. Trimmomatic: A flexible trimmer for illumina sequence data. Bioinformatics 2014, 30, 2114–2120. [Google Scholar] [CrossRef] [Green Version]
- Kim, D.; Langmead, B.; Salzberg, S.L. Hisat: A fast spliced aligner with low memory requirements. Nat. Methods 2015, 12, 357–360. [Google Scholar] [CrossRef] [PubMed] [Green Version]
- Langmead, B.; Trapnell, C.; Pop, M.; Salzberg, S.L. Ultrafast and memory-efficient alignment of short DNA sequences to the human genome. Genome Biol. 2009, 10, R25. [Google Scholar] [CrossRef] [PubMed] [Green Version]
- Liao, Y.; Smyth, G.K.; Shi, W. Featurecounts: An efficient general purpose program for assigning sequence reads to genomic features. Bioinformatics 2014, 30, 923–930. [Google Scholar] [CrossRef] [Green Version]
- Yates, A.; Akanni, W.; Amode, M.R.; Barrell, D.; Billis, K.; Carvalho-Silva, D.; Cummins, C.; Clapham, P.; Fitzgerald, S.; Gil, L.; et al. Ensembl 2016. Nucleic Acids Res. 2016, 44, D710–D716. [Google Scholar] [CrossRef] [PubMed]
- Love, M.I.; Huber, W.; Anders, S. Moderated estimation of fold change and dispersion for rna-seq data with deseq2. Genome Biol. 2014, 15, 550. [Google Scholar] [CrossRef] [Green Version]
- Yu, G.; Wang, L.G.; Han, Y.; He, Q.Y. Clusterprofiler: An r package for comparing biological themes among gene clusters. Omics A J. Integr. Biol. 2012, 16, 284–287. [Google Scholar] [CrossRef]
- Dzieciatkowska, M.; Hill, R.; Hansen, K.C. GeLC-MS/MS analysis of complex protein mixtures. Methods Mol. Biol. 2014, 1156, 53–66. [Google Scholar]
- Cox, J.; Mann, M. MaxQuant enables high peptide identification rates, individualized p.p.b.-range mass accuracies and proteome-wide protein quantification. Nat. Biotechnol. 2008, 26, 1367–1372. [Google Scholar] [CrossRef]
- Oberg, A.L.; Vitek, O. Statistical design of quantitative mass spectrometry-based proteomic experiments. J. Proteome Res. 2009, 8, 2144–2156. [Google Scholar] [CrossRef]
- Shannon, P.; Markiel, A.; Ozier, O.; Baliga, N.S.; Wang, J.T.; Ramage, D.; Amin, N.; Schwikowsky, B.; Ideker, T. Cytoscape: A software enviroment for itnegrated models of biomolecular interaction networks. Genome Res. 2003, 13, 2498–2504. [Google Scholar] [CrossRef]
- Bindea, G.; Mlecnik, B.; Hackl, H.; Charoentong, P.; Tosolini, M.; Kirilovsky, A.; Fridman, W.H.; Pagès, F.; Trajanoski, Z.; Galon, J. ClueGO: A Cytoscape plug-in to decipher functionally grouped gene ontology and pathway annotation networks. Bioinformatics 2009, 25, 1091–1093. [Google Scholar] [CrossRef] [Green Version]
- Morchikh, M.; Cribier, A.; Raffel, R.; Amraoui, S.; Cau, J.; Severac, D.; Dubois, E.; Schwartz, O.; Bennasser, Y.; Benkirane, M. Hexim1 and neat1 long non-coding rna form a multi-subunit complex that regulates DNA-mediated innate immune response. Mol. Cell 2017, 67, 387–399.e385. [Google Scholar] [CrossRef]
- Kaur, R.; Lal, S.K. The multifarious roles of heterogeneous ribonucleoprotein a1 in viral infections. Rev. Med Virol. 2020, 30, e2097. [Google Scholar] [CrossRef]
- Haas, J.G.; Weber, J.; Gonzalez, O.; Zimmer, R.; Griffiths, S.J. Antiviral activity of the mineralocorticoid receptor nr3c2 against herpes simplex virus type 1 (hsv-1) infection. Sci. Rep. 2018, 8, 15876. [Google Scholar] [CrossRef] [PubMed] [Green Version]
- Wyzewski, Z.; Gregorczyk, K.P.; Szczepanowska, J.; Szulc-Dabrowska, L. Functional role of hsp60 as a positive regulator of human viral infection progression. Acta Virol. 2018, 62, 33–40. [Google Scholar] [CrossRef] [PubMed]
- Walter, W.; Sánchez-Cabo, F.; Ricote, M. GOplot: An R package for visually combining expression data with functional analysis. Bioinformatics 2015, 31, 2912–2914. [Google Scholar] [CrossRef]
- Campbell-Yesufu, O.T.; Gandhi, R.T. Update on human immunodeficiency virus (hiv)-2 infection. Clin. Infect. Dis. Off. Publ. Infect. Dis. Soc. Am. 2011, 52, 780–787. [Google Scholar] [CrossRef] [Green Version]
- MacNeil, A.; Sarr, A.D.; Sankale, J.L.; Meloni, S.T.; Mboup, S.; Kanki, P. Direct evidence of lower viral replication rates in vivo in human immunodeficiency virus type 2 (hiv-2) infection than in hiv-1 infection. J. Virol. 2007, 81, 5325–5330. [Google Scholar] [CrossRef] [PubMed] [Green Version]
- Burns, J.C.; Friedmann, T.; Driever, W.; Burrascano, M.; Yee, J.K. Vesicular stomatitis virus G glycoprotein pseudotyped retroviral vectors: Concentration to very high titer and efficient gene transfer into mammalian and nonmammalian cells. Proc. Natl. Acad. Sci. USA 1993, 90, 8033–8037. [Google Scholar] [CrossRef] [Green Version]
- Wojcechowskyj, J.A.; Didigu, C.A.; Lee, J.Y.; Parrish, N.F.; Sinha, R.; Hahn, B.H.; Bushman, F.D.; Jensen, S.T.; Seeholzer, S.H.; Doms, R.W. Quantitative phosphoproteomics reveals extensive cellular reprogramming during HIV-1 entry. Cell Host Microbe 2013, 13, 613–623. [Google Scholar] [CrossRef] [Green Version]
- Perfettini, J.L.; Castedo, M.; Roumier, T.; Andreau, K.; Nardacci, R.; Piacentini, M.; Kroemer, G. Mechanisms of apoptosis induction by the HIV-1 envelope. Cell Death Differ. 2005, 12, 916–923. [Google Scholar] [CrossRef] [Green Version]
- Merten, O.W.; Hebben, M.; Bovolenta, C. Production of lentiviral vectors. Mol. Ther. Methods Clin. Dev. 2016, 3, 16017. [Google Scholar] [CrossRef]
- Liu, A.; Yang, Y.; Liu, L.; Meng, Z.; Li, L.; Qiu, C.; Xu, J.; Zhang, X. Differential compartmentalization of HIV-targeting immune cells in inner and outer foreskin tissue. PLoS ONE 2014, 9, e85176. [Google Scholar] [CrossRef] [PubMed] [Green Version]
- Devadoss, D.; Singh, S.P.; Acharya, A.; Do, K.C.; Periyasamy, P.; Manevski, M.; Mishra, N.; Tellez, C.S.; Ramakrishnan, S.; Belinsky, S.A.; et al. HIV-1 Productively Infects and Integrates in Bronchial Epithelial Cells. Front. Cell. Infect. Microbiol. 2021, 10, 927. [Google Scholar] [CrossRef] [PubMed]
- Herrera, R.; Morris, M.; Rosbe, K.; Feng, Z.; Weinberg, A.; Tugizov, S. Human beta-defensins 2 and-3 cointernalize with human immunodeficiency virus via heparan sulfate proteoglycans and reduce infectivity of intracellular virions in tonsil epithelial cells. Virology 2016, 487, 172–187. [Google Scholar] [CrossRef] [Green Version]
- Gupta, S.; Knight, A.G.; Gupta, S.; Knapp, P.E.; Hauser, K.F.; Keller, J.N.; Bruce-Keller, A.J. Hiv-tat elicits microglial glutamate release: Role of napdh oxidase and the cystine-glutamate antiporter. Neurosci. Lett. 2010, 485, 233–236. [Google Scholar] [CrossRef] [Green Version]
- D’Angelo, J.A.; Dehlink, E.; Platzer, B.; Dwyer, P.; Circu, M.L.; Garay, J.; Aw, T.Y.; Fiebiger, E.; Dickinson, B.L. The cystine/glutamate antiporter regulates dendritic cell differentiation and antigen presentation. J. Immunol. 2010, 185, 3217–3226. [Google Scholar] [CrossRef] [PubMed] [Green Version]
- McArthur, C.P.; Wang, Y.; Heruth, D.; Gustafson, S. Amplification of extracellular matrix and oncogenes in tat-transfected human salivary gland cell lines with expression of laminin, fibronectin, collagens i, iii, iv, c-myc and p53. Arch. Oral Biol. 2001, 46, 545–555. [Google Scholar] [CrossRef]
- Cornaglia-Ferraris, P.; De Maria, A.; Cirillo, C.; Cara, A.; Alessandri, G. Adhesion of human neuroblasts to hiv-1 tat. Pediatric Res. 1995, 38, 792–796. [Google Scholar] [CrossRef] [Green Version]
- Nittayananta, W.; Mitarnun, W.; Talungchit, S.; Sriplung, H. Changes in oral cytokeratin expression in hiv-infected subjects with long-term use of haart. Oral Dis. 2012, 18, 793–801. [Google Scholar] [CrossRef] [Green Version]
- Kellokoski, J.; Syrjanen, S.; Tosi, P.; Cintorino, M.; Leoncini, P.; Syrjanen, K. Cytokeratin pattern in normal and hpv infected oral mucosa in women with genital hpv infections. J. Oral Pathol. Med. Off. Publ. Int. Assoc. Oral Pathol. Am. Acad. Oral Pathol. 1991, 20, 26–31. [Google Scholar] [CrossRef]
- Tomlin, H.; Piccinini, A.M. A complex interplay between the extracellular matrix and the innate immune response to microbial pathogens. Immunology 2018, 155, 186–201. [Google Scholar] [CrossRef]
- Rusnati, M.; Taraboletti, G.; Urbinati, C.; Tulipano, G.; Giuliani, R.; Molinari-Tosatti, M.P.; Sennino, B.; Giacca, M.; Tyagi, M.; Albini, A.; et al. Thrombospondin-1/hiv-1 tat protein interaction: Modulation of the biological activity of extracellular tat. FASEB J. Off. Publ. Fed. Am. Soc. Exp. Biol. 2000, 14, 1917–1930. [Google Scholar] [CrossRef] [Green Version]
- Crombie, R.; Silverstein, R.L.; MacLow, C.; Pearce, S.F.; Nachman, R.L.; Laurence, J. Identification of a cd36-related thrombospondin 1-binding domain in hiv-1 envelope glycoprotein gp120: Relationship to hiv-1-specific inhibitory factors in human saliva. J. Exp. Med. 1998, 187, 25–35. [Google Scholar] [CrossRef] [PubMed] [Green Version]
- Pagano, M.A.; Tibaldi, E.; Palu, G.; Brunati, A.M. Viral proteins and src family kinases: Mechanisms of pathogenicity from a “liaison dangereuse”. World J. Virol. 2013, 2, 71–78. [Google Scholar] [CrossRef] [PubMed]
- Keating, J.A.; Striker, R. Phosphorylation events during viral infections provide potential therapeutic targets. Rev. Med Virol. 2012, 22, 166–181. [Google Scholar] [CrossRef]
- Francis, A.C.; Di Primio, C.; Allouch, A.; Cereseto, A. Role of phosphorylation in the nuclear biology of hiv-1. Curr. Med. Chem. 2011, 18, 2904–2912. [Google Scholar] [CrossRef]
- Spearman, P. Viral interactions with host cell rab gtpases. Small Gtpases 2018, 9, 192–201. [Google Scholar] [CrossRef] [PubMed] [Green Version]
- Davis, M.E.; Gack, M.U. Ubiquitination in the antiviral immune response. Virology 2015, 479–480, 52–65. [Google Scholar] [CrossRef] [Green Version]
- Calistri, A.; Munegato, D.; Carli, I.; Parolin, C.; Palu, G. The ubiquitin-conjugating system: Multiple roles in viral replication and infection. Cells 2014, 3, 386–417. [Google Scholar] [CrossRef] [PubMed] [Green Version]
- Strebel, K. Hiv accessory proteins versus host restriction factors. Curr. Opin. Virol. 2013, 3, 692–699. [Google Scholar] [CrossRef] [PubMed] [Green Version]
- Tange, T.O.; Damgaard, C.K.; Guth, S.; Valcarcel, J.; Kjems, J. The hnrnp a1 protein regulates hiv-1 tat splicing via a novel intron silencer element. EMBO J. 2001, 20, 5748–5758. [Google Scholar]
- Hallay, H.; Locker, N.; Ayadi, L.; Ropers, D.; Guittet, E.; Branlant, C. Biochemical and nmr study on the competition between proteins sc35, srp40, and heterogeneous nuclear ribonucleoprotein a1 at the hiv-1 tat exon 2 splicing site. J. Biol. Chem. 2006, 281, 37159–37174. [Google Scholar] [CrossRef] [PubMed] [Green Version]
- Monette, A.; Ajamian, L.; Lopez-Lastra, M.; Mouland, A.J. Human immunodeficiency virus type 1 (hiv-1) induces the cytoplasmic retention of heterogeneous nuclear ribonucleoprotein a1 by disrupting nuclear import: Implications for hiv-1 gene expression. J. Biol. Chem. 2009, 284, 31350–31362. [Google Scholar] [CrossRef] [Green Version]
- Schweitzer, C.J.; Jagadish, T.; Haverland, N.; Ciborowski, P.; Belshan, M. Proteomic analysis of early hiv-1 nucleoprotein complexes. J. Proteome Res. 2013, 12, 559–572. [Google Scholar] [CrossRef] [Green Version]
- St Gelais, C.; Roger, J.; Wu, L. Non-pou domain-containing octamer-binding protein negatively regulates hiv-1 infection in cd4(+) t cells. Aids Res. Hum. Retrovir. 2015, 31, 806–816. [Google Scholar] [CrossRef] [Green Version]
- Erkelenz, S.; Hillebrand, F.; Widera, M.; Theiss, S.; Fayyaz, A.; Degrandi, D.; Pfeffer, K.; Schaal, H. Balanced splicing at the tat-specific hiv-1 3′ss a3 is critical for hiv-1 replication. Retrovirology 2015, 12, 29. [Google Scholar] [CrossRef] [Green Version]
- Speth, C.; Prohaszka, Z.; Mair, M.; Stockl, G.; Zhu, X.; Jobstl, B.; Fust, G.; Dierich, M.P. A 60 kd heat-shock protein-like molecule interacts with the hiv transmembrane glycoprotein gp41. Mol. Immunol. 1999, 36, 619–628. [Google Scholar] [CrossRef]
- Parissi, V.; Calmels, C.; De Soultrait, V.R.; Caumont, A.; Fournier, M.; Chaignepain, S.; Litvak, S. Functional interactions of human immunodeficiency virus type 1 integrase with human and yeast hsp60. J. Virol. 2001, 75, 11344–11353. [Google Scholar] [CrossRef] [Green Version]
- Anraku, I.; Rajasuriar, R.; Dobbin, C.; Brown, R.; Lewin, S.R.; Suhrbier, A. Circulating heat shock protein 60 levels are elevated in hiv patients and are reduced by anti-retroviral therapy. PLoS ONE 2012, 7, e45291. [Google Scholar] [CrossRef] [Green Version]
- Park, S.G.; Lee, S.M.; Jung, G. Antisense oligodeoxynucleotides targeted against molecular chaperonin hsp60 block human hepatitis b virus replication. J. Biol. Chem. 2003, 278, 39851–39857. [Google Scholar] [CrossRef] [Green Version]
- Turner, A.W.; Margolis, D.M. Chromatin regulation and the histone code in hiv latency. Yale J. Biol. Med. 2017, 90, 229–243. [Google Scholar]
- Tatro, E.T.; Everall, I.P.; Masliah, E.; Hult, B.J.; Lucero, G.; Chana, G.; Soontornniyomkij, V.; Achim, C.L.; Center, H.I.V.N.R. Differential expression of immunophilins fkbp51 and fkbp52 in the frontal cortex of hiv-infected patients with major depressive disorder. J. Neuroimmune Pharmacol. Off. J. Soc. Neuroimmune Pharmacol. 2009, 4, 218–226. [Google Scholar] [CrossRef] [PubMed] [Green Version]
- Jarboui, M.A.; Bidoia, C.; Woods, E.; Roe, B.; Wynne, K.; Elia, G.; Hall, W.W.; Gautier, V.W. Nucleolar protein trafficking in response to hiv-1 tat: Rewiring the nucleolus. PLoS ONE 2012, 7, e48702. [Google Scholar] [CrossRef] [PubMed]
- Spadoni, J.L.; Rucart, P.; Le Clerc, S.; van Manen, D.; Coulonges, C.; Ulveling, D.; Laville, V.; Labib, T.; Taing, L.; Delaneau, O.; et al. Identification of genes whose expression profile is associated with non-progression towards aids using eqtls. PLoS ONE 2015, 10, e0136989. [Google Scholar] [CrossRef] [PubMed]
- Luo, Y.; Jacobs, E.Y.; Greco, T.M.; Mohammed, K.D.; Tong, T.; Keegan, S.; Binley, J.M.; Cristea, I.M.; Fenyo, D.; Rout, M.P.; et al. Hiv-host interactome revealed directly from infected cells. Nat. Microbiol. 2016, 1, 16068. [Google Scholar] [CrossRef]
- Impens, F.; Timmerman, E.; Staes, A.; Moens, K.; Arien, K.K.; Verhasselt, B.; Vandekerckhove, J.; Gevaert, K. A catalogue of putative hiv-1 protease host cell substrates. Biol. Chem. 2012, 393, 915–931. [Google Scholar] [CrossRef]
- Zapalska-Sozoniuk, M.; Chrobak, L.; Kowalczyk, K.; Kankofer, M. Is it useful to use several “omics” for obtaining valuable results? Mol. Biol. Rep. 2019, 46, 3597–3606. [Google Scholar] [CrossRef] [Green Version]


Publisher’s Note: MDPI stays neutral with regard to jurisdictional claims in published maps and institutional affiliations. |
© 2021 by the authors. Licensee MDPI, Basel, Switzerland. This article is an open access article distributed under the terms and conditions of the Creative Commons Attribution (CC BY) license (https://creativecommons.org/licenses/by/4.0/).
Share and Cite
Linkner, T.R.; Ambrus, V.; Kunkli, B.; Szojka, Z.I.; Kalló, G.; Csősz, É.; Kumar, A.; Emri, M.; Tőzsér, J.; Mahdi, M. Cellular Proteo-Transcriptomic Changes in the Immediate Early-Phase of Lentiviral Transduction. Microorganisms 2021, 9, 2207. https://0-doi-org.brum.beds.ac.uk/10.3390/microorganisms9112207
Linkner TR, Ambrus V, Kunkli B, Szojka ZI, Kalló G, Csősz É, Kumar A, Emri M, Tőzsér J, Mahdi M. Cellular Proteo-Transcriptomic Changes in the Immediate Early-Phase of Lentiviral Transduction. Microorganisms. 2021; 9(11):2207. https://0-doi-org.brum.beds.ac.uk/10.3390/microorganisms9112207
Chicago/Turabian StyleLinkner, Tamás Richárd, Viktor Ambrus, Balázs Kunkli, Zsófia Ilona Szojka, Gergő Kalló, Éva Csősz, Ajneesh Kumar, Miklós Emri, József Tőzsér, and Mohamed Mahdi. 2021. "Cellular Proteo-Transcriptomic Changes in the Immediate Early-Phase of Lentiviral Transduction" Microorganisms 9, no. 11: 2207. https://0-doi-org.brum.beds.ac.uk/10.3390/microorganisms9112207