
Modelling the Radial Growth of Geotrichum candidum: Effects of Temperature and Water Activity


Department of Nutrition and Food Quality Assessment, Institute of Food Science and Nutrition, Faculty of Chemical and Food Technology, Slovak University of Technology in Bratislava, Radlinskeho 9, SK-812 37 Bratislava, Slovakia
*
Author to whom correspondence should be addressed.
Microorganisms 2021, 9(3), 532; https://0-doi-org.brum.beds.ac.uk/10.3390/microorganisms9030532
Submission received: 8 February 2021
/
Revised: 24 February 2021
/
Accepted: 2 March 2021
/
Published: 5 March 2021
(This article belongs to the Special Issue Microorganisms in Food – Two Sides of One Story)
Abstract
:Modelling the growth of microorganisms in relation to environmental factors provides quantitative knowledge that can be used to predict their behaviour in foods. For this reason, the effects of temperature and water activity (aw) adjusted with NaCl on the surface growth of two isolates and one culture strain of Geotrichum candidum were studied. A dataset of growth parameters obtained from almost 600 growth curves was employed for secondary modelling with cardinal models (CMs). The theoretical minimal temperature resulting from the modelling of the mycelium proliferation rate ranged from −5.2 to −0.4 °C. Optimal and maximal temperatures were calculated and found to have narrow ranges of 25.4 to 28.0 °C and 34.2 to 37.6 °C, respectively. Cardinal aw values associated with radial growth (aw min from 0.948–0.960 and aw opt from 0.992–0.993) confirmed the salt sensitivity of the species. Model goodness-of-fit was evaluated by the coefficient of determination R2, which ranged from 0.954 to 0.985, and RMSE, which ranged from 0.28 to 0.42. Substantially higher variability accompanied the lag time for growth modelling than the radial growth rate modelling despite the square root transformation of the reciprocal lag phase data (R2 = 0.685 to 0.808). Nevertheless, the findings demonstrate that the outputs of growth modelling can be applied to the quantitative evaluation of the roles of G. candidum in fresh cheese spoilage as well as the ripening of Camembert-type cheeses or various artisanal cheeses. Along with validation, the interactions with lactic acid bacteria can be included to improve the predictions of G. candidum in the future.
1. Introduction
Food-associated microscopic fungi and cheese-contaminating mycobiota are generally known as agents of spoilage associated with mycotoxin production. Fungal spoilage of foods usually manifests as visible mycelium, a wide variety of metabolic by-products that cause off-odours and flavours and visible changes in colour or texture [1].
Species associated with the deterioration of dairy products in the agro-food industry include Geotrichum species [2,3,4]. Geotrichum candidum can contaminate processed foods and adversely affect their nutritional quality through physical, chemical, and sensorial changes. Having mouldy and yeasty properties, G. candidum significantly affects the flavour, aroma, colour and texture of fresh cheeses, butter, fermented milk, cream, poultry meat, fruit juices and vegetables [4,5,6,7,8].
However, another main aspect of G. candidum presence in foods is considered. This microscopic fungus plays positive roles in certain dairy products as it is involved in the fermentation and ripening of both industrially and artisanally produced cheeses, thus contributing to their final characteristics. For example, in some Camembert types and various Slovakian soft cheeses (ewes’ lump and bryndza), G. candidum strains exist in commensal relationships with other fermentation or ripening microbiota. G. candidum assimilates lactic acid, increases pH and enables the growth of other surface microorganisms. In Camembert-type cheese, it undergoes mycelial growth, thus supporting Penicillium camemberti, protects food surfaces against contamination and produces enzymes, all of which contribute to proper ripening [9,10]. G. candidum is frequently used during the maturation and flavouring of mould-ripened cheeses (Camembert, Brie, St. Marcellin), blue-veined cheeses (Danablu, Roquefort, Stilton, Gorgonzola) and smear-ripened cheeses (Limburger, Münster, Livarot, Tilsit, Reblochon, Pont-l’Évêque cheese) [6,11,12,13,14,15]. In the Scandinavian drink Viili, it is one of the components of the starter culture used for the fermentation of this dairy product [16]. Moreover, G. candidum can be found at the early stages of kefir production as it covers the kefir grain surface [17] as well as in home-made and industrial products [18].
Cheese ripening is a complex biochemical process and for G. candidum, it is desirable that it only participates to some extent and contributes to commensal growth and metabolic equilibrium relationships with other members of the cheese microbiota. Fungi exhibit tolerance to a wide range of pH values; the principal factors affecting fungi development are water activity (aw) and temperature [19,20]. Therefore, we aimed to quantify the surface growth of G. candidum as influenced by temperature and aw adjusted with NaCl to provide models suitable for either the prediction of microbial spoilage of fresh cheeses or the optimization of ripening processes in dairy practice.
2. Materials and Methods
2.1. Fungal Strains and Culture Conditions
Two representative food-isolated strains and one culture strain of G. candidum were selected from a set of 18 isolates and 6 culture collection strains that had been evaluated with respect to growth rate variability in a previous study by Koňuchová and Valík [21]. Strains G. candidum G and G. candidum I, belonging to the collection of the Institute of Food Science and Nutrition (Slovak University of Technology in Bratislava, Slovakia), were isolated from cottage cheese and artisanal ewes’ lump cheese, respectively, and G. candidum CBS 557.83 was obtained from the Westerdijk Fungal Biodiversity Institute (Utrecht, the Netherlands). All strains were refrigerated (5 ± 1 °C) on plate count skim milk agar (SMA; Merck, Darmstadt, Germany) slants and periodically cultured in diluted SMA agar. For long-term storage, the cultures were frozen at −70 °C in tubes containing yeast malt broth (Sigma-Aldrich, St. Louis, MO, USA) supplemented with 20% glycerol.
2.2. Experimental Design
A complete factorial design was set up to study the effects of NaCl and temperature. Growth trials with four replicates of each G. candidum strain were performed with fifty combinations of experimental conditions according to the following factor levels:
Storage temperature (°C): 6, 8, 12, 15, 18, 21, 25, 30, 34, 37
NaCl (%): 0, 1, 3, 5, 7 (w/v)
Standard growth SMA medium, which was acidified with 10 mL/L lactic acid (Sigma-Aldrich, St. Louis, MO, USA) to pH 5.5, was used in the experiments. The aw of the medium was adjusted with 1, 3, 5 or 7% sodium chloride (Sigma-Aldrich, St. Louis, MO, USA) and measured after sterilization with Novasina LabMaster-aw (Novasina, Lachen, Switzerland). The inoculum was prepared, and the growth experiments were carried out according to Koňuchová and Valík [21].
The diameters of G. candidum colonies (d) were measured using a Vernier calliper (150 × 0.02 mm, Sinochem Jiangsu, Nanjing, China) in two orthogonal directions per plate without opening the dishes, and the final values were calculated according to previous work.
2.3. Model Description
2.3.1. Primary Model
Colony growth data were fitted using the primary growth model of Baranyi and Roberts [22] included in the in-house Excel 365 (Microsoft, Redmond, WD, USA) Add-in package ‘DMFit’ version 3.5 (ComBase, University of Tasmania Food Safety Centre, Hobart, Australia). In total, 600 growth curves were evaluated (representing two isolates and one culture collection strain cultured in quadruplicate at ten incubation temperatures and five NaCl concentrations).
2.3.2. Secondary Modelling
The cardinal model by Rosso et al. [23] describes the effects of food environmental factors on microbial growth parameters, e.g., growth rate and lag time for growth. This model is associated with the gamma concept [24] and characterized by high “goodness of fit”; moreover, it provides four parameters that all have physiological meaning [20,25]. For G. candidum, the following models were used for radial growth rate (RGR) and lag time for growth (λ) modelling against temperature and aw:
where
Based on the experimental data, the cardinal temperatures (Tmin, Tmax, Topt) and aw-values (aw min, aw max, aw opt) as well as optimal radial growth rate (RGRopt) and lag phase duration (λ) were calculated with non-linear regression using the Excel Solver tool.
2.3.3. Time Required to Achieve Visible Colonies
The time values for G. candidum to form visible 3 mm colonies (t3; d = 3 mm) at specific combinations of T and aw were calculated using the following equation:
The CM models Equations (1) and (2) with the model parameters summarized in Tables 1 and 2 were used for λ and RGR, respectively. For the calculation of the t3-value ranges, the CM models’ coefficients were reduced or increased by the error estimated.
2.4. Statistical Analysis and Model Evaluation
Analysis of variance of medians was used to assess the significance of the growth conditions, colony diameter and intraspecific differences in the monitored isolates and collection strain. The results are presented as means and standard deviations. Statistical analyses were carried out using Excel.
To evaluate the goodness of fit of the predictive models, i.e., their ability to describe the observed experimental data, we used the following mathematical and statistical indices: coefficient of determination R2, root mean square error (RMSE), mean relative error (%MRE), standard error of prediction (%SEP) and sum of squared residuals (RSS). These indices were calculated as follows:
where Yobs and Ypred are the observed and predicated RGR or lag time data, respectively; n is the number of experimental observations; and p is the number of model parameters [26,27].
3. Results and Discussion
The main advantage of the cardinal model (CM) described by Rosso et al. [23] is that it provides estimates of the cardinal values of the environmental factors affecting growth (in our case, Τmin, Topt, Tmax, aw min, aw opt, and aw max), which are not easy to determine experimentally because fungal growth can occur several months after initial incubation [28]. Moreover, the CMs were successfully used as a predictor of the lag phase duration and/or RGR [25,29,30,31,32,33,34,35,36,37,38]. This work is based on hundreds of growth curves and provides outputs of lag time and RGR from secondary modelling. In preliminary experiments, the microscopic fungus G. candidum did not grow on the surface of skim milk agar at 5 °C or 38 °C over a period of more than 30 days, which is in accordance with Eliskases-Lechner et al. [8]. Thus, the mycelium growth of the two tested isolates and one collection strain was monitored at temperatures from 6 to 37 °C at intervals of 2–5 °C.
3.1. Primary Surface Growth Modelling
Independently of the tested factor, the growth of G. candidum typically followed log-linear sigmoidal curves. The high individual coefficients of determination (with average value of R2 = 0.987 ± 0.024; CV = 2.4%) indicated the suitability of the Baranyi model used to fit the growth curves and determine the growth parameters. Generally, slightly higher variability among R2 values was observed within quadruplicates at lower values of temperature and aw. On the other hand, as expected for the growth parameters, significantly lower variability was recorded among growth rates than among lag phase durations, as has been reported by various authors [21,28,39,40,41]. The estimated values of lag phase duration (λ, days) and maximum RGR (mm/d) for the strains under all of the experimental conditions are summarized in Supplementary Material Table S1.
3.2. Secondary Modelling
3.2.1. Combined Effects of aw Adjusted with NaCl and Temperature on Lag Time
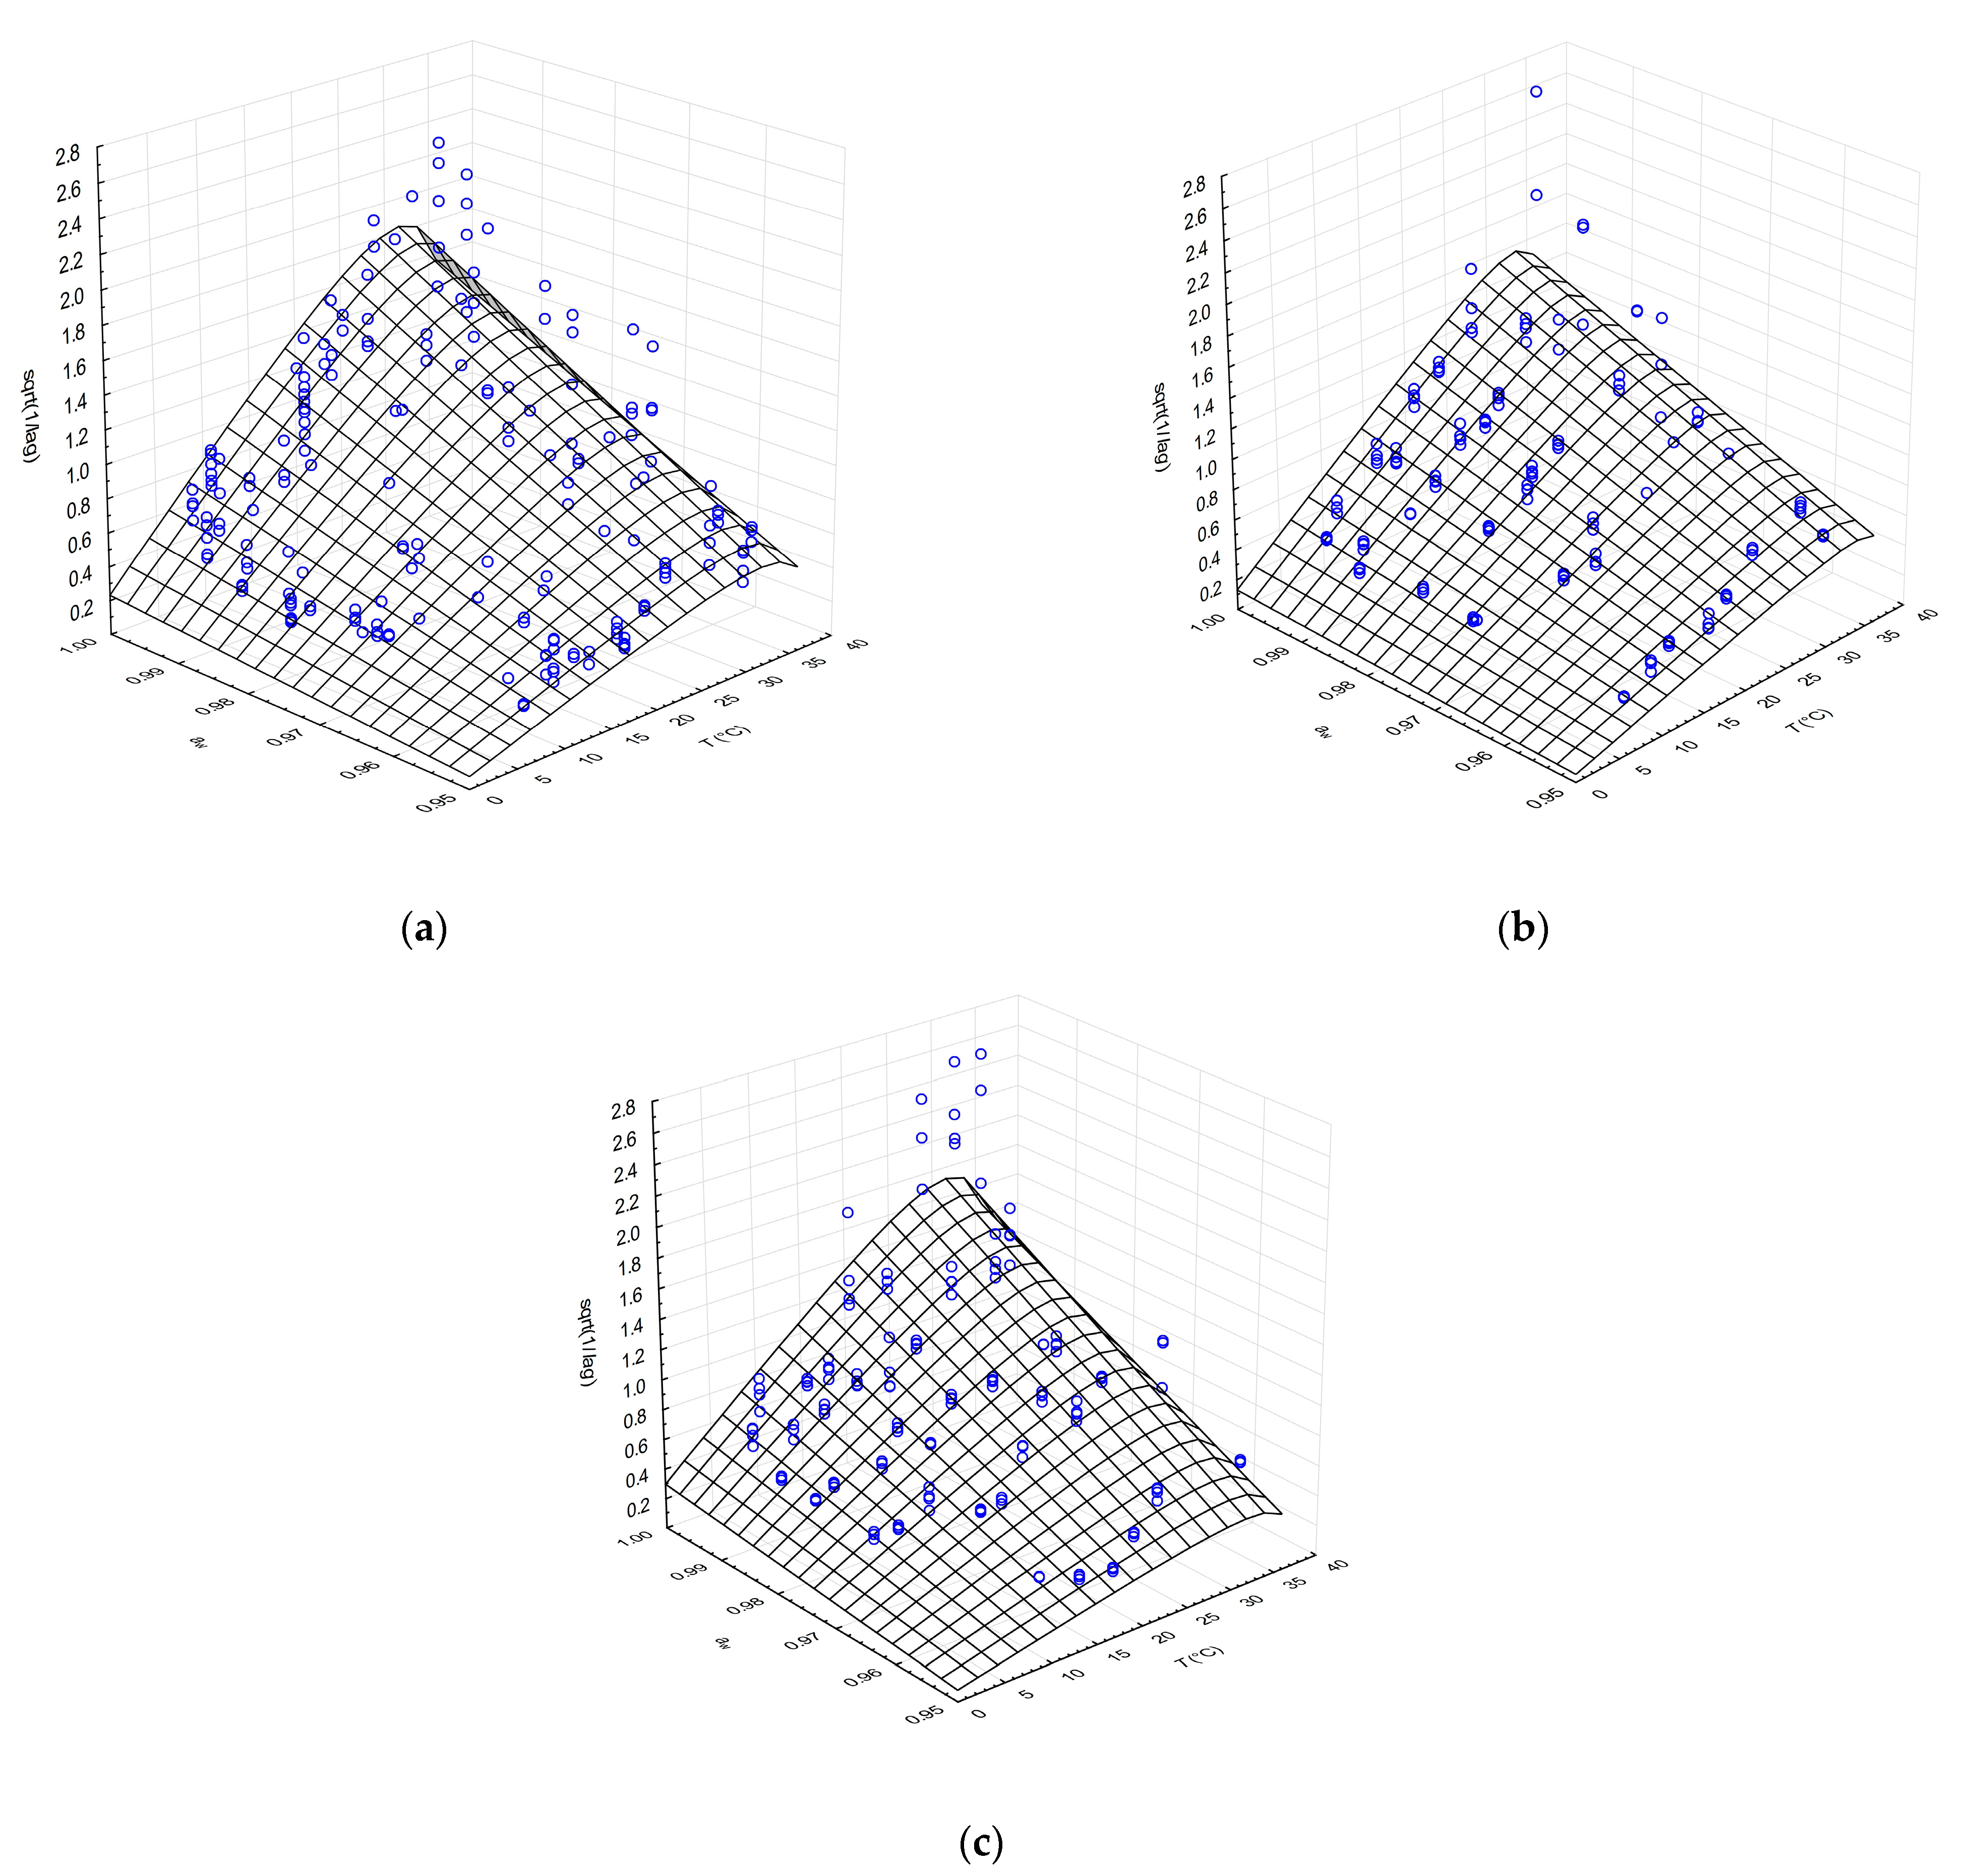
Despite the high variability of the lag time data, particularly in the optimal temperature range and higher temperatures approaching the maximal growth temperature, the CM with square root transformation of reciprocal lag values was able to describe the effects of aw and temperature. The outputs of lag phase modelling for the cheese-isolated and CBS culture strains showed similar patterns of behaviour, as shown in Figure 1. Lag phase decreased with increasing aw and temperature and slightly increased in the area beyond the optima, towards the maximal values of these factors (Figure 1a–c). Several qualitative radial growth studies of Aspergillus species, Penicillium species, Fusarium oxysporum, Mucor circinelloides, Rhizopus oryzae and Cladosporium cladosporioides demonstrated similar pattern of response to temperature and/or aw on lag phase duration [28,30,42,43].
All of the parameter estimates of the CM of the lag phase were consistent across the G. candidum strains, except for 1/λopt, which was accompanied by higher but acceptable errors (Table 1). Similar standard deviations of CM parameters in lag time secondary modelling were reported by Marín et al. [43] for aw effect on A. flavus isolates and by Dagnas et al. [44] for temperature and aw effect on various bakery product spoilage moulds.
The statistical indices of the lag phase secondary modelling revealed variability around the estimated model data, with coefficient of determination (R2) values ranging from 0.685 to 0.808. These values are acceptable considering the many influencing factors during the population adjustment period. Relative error estimates for the individual strains were calculated as %SEP and %MRE (using the range Ymax–Ymin in the denominator) and ranged between 23.3 and 32.4% and from 4.9% to 9.5%, respectively.
3.2.2. Combined Effects of aw and Temperature on the Growth of G. candidum
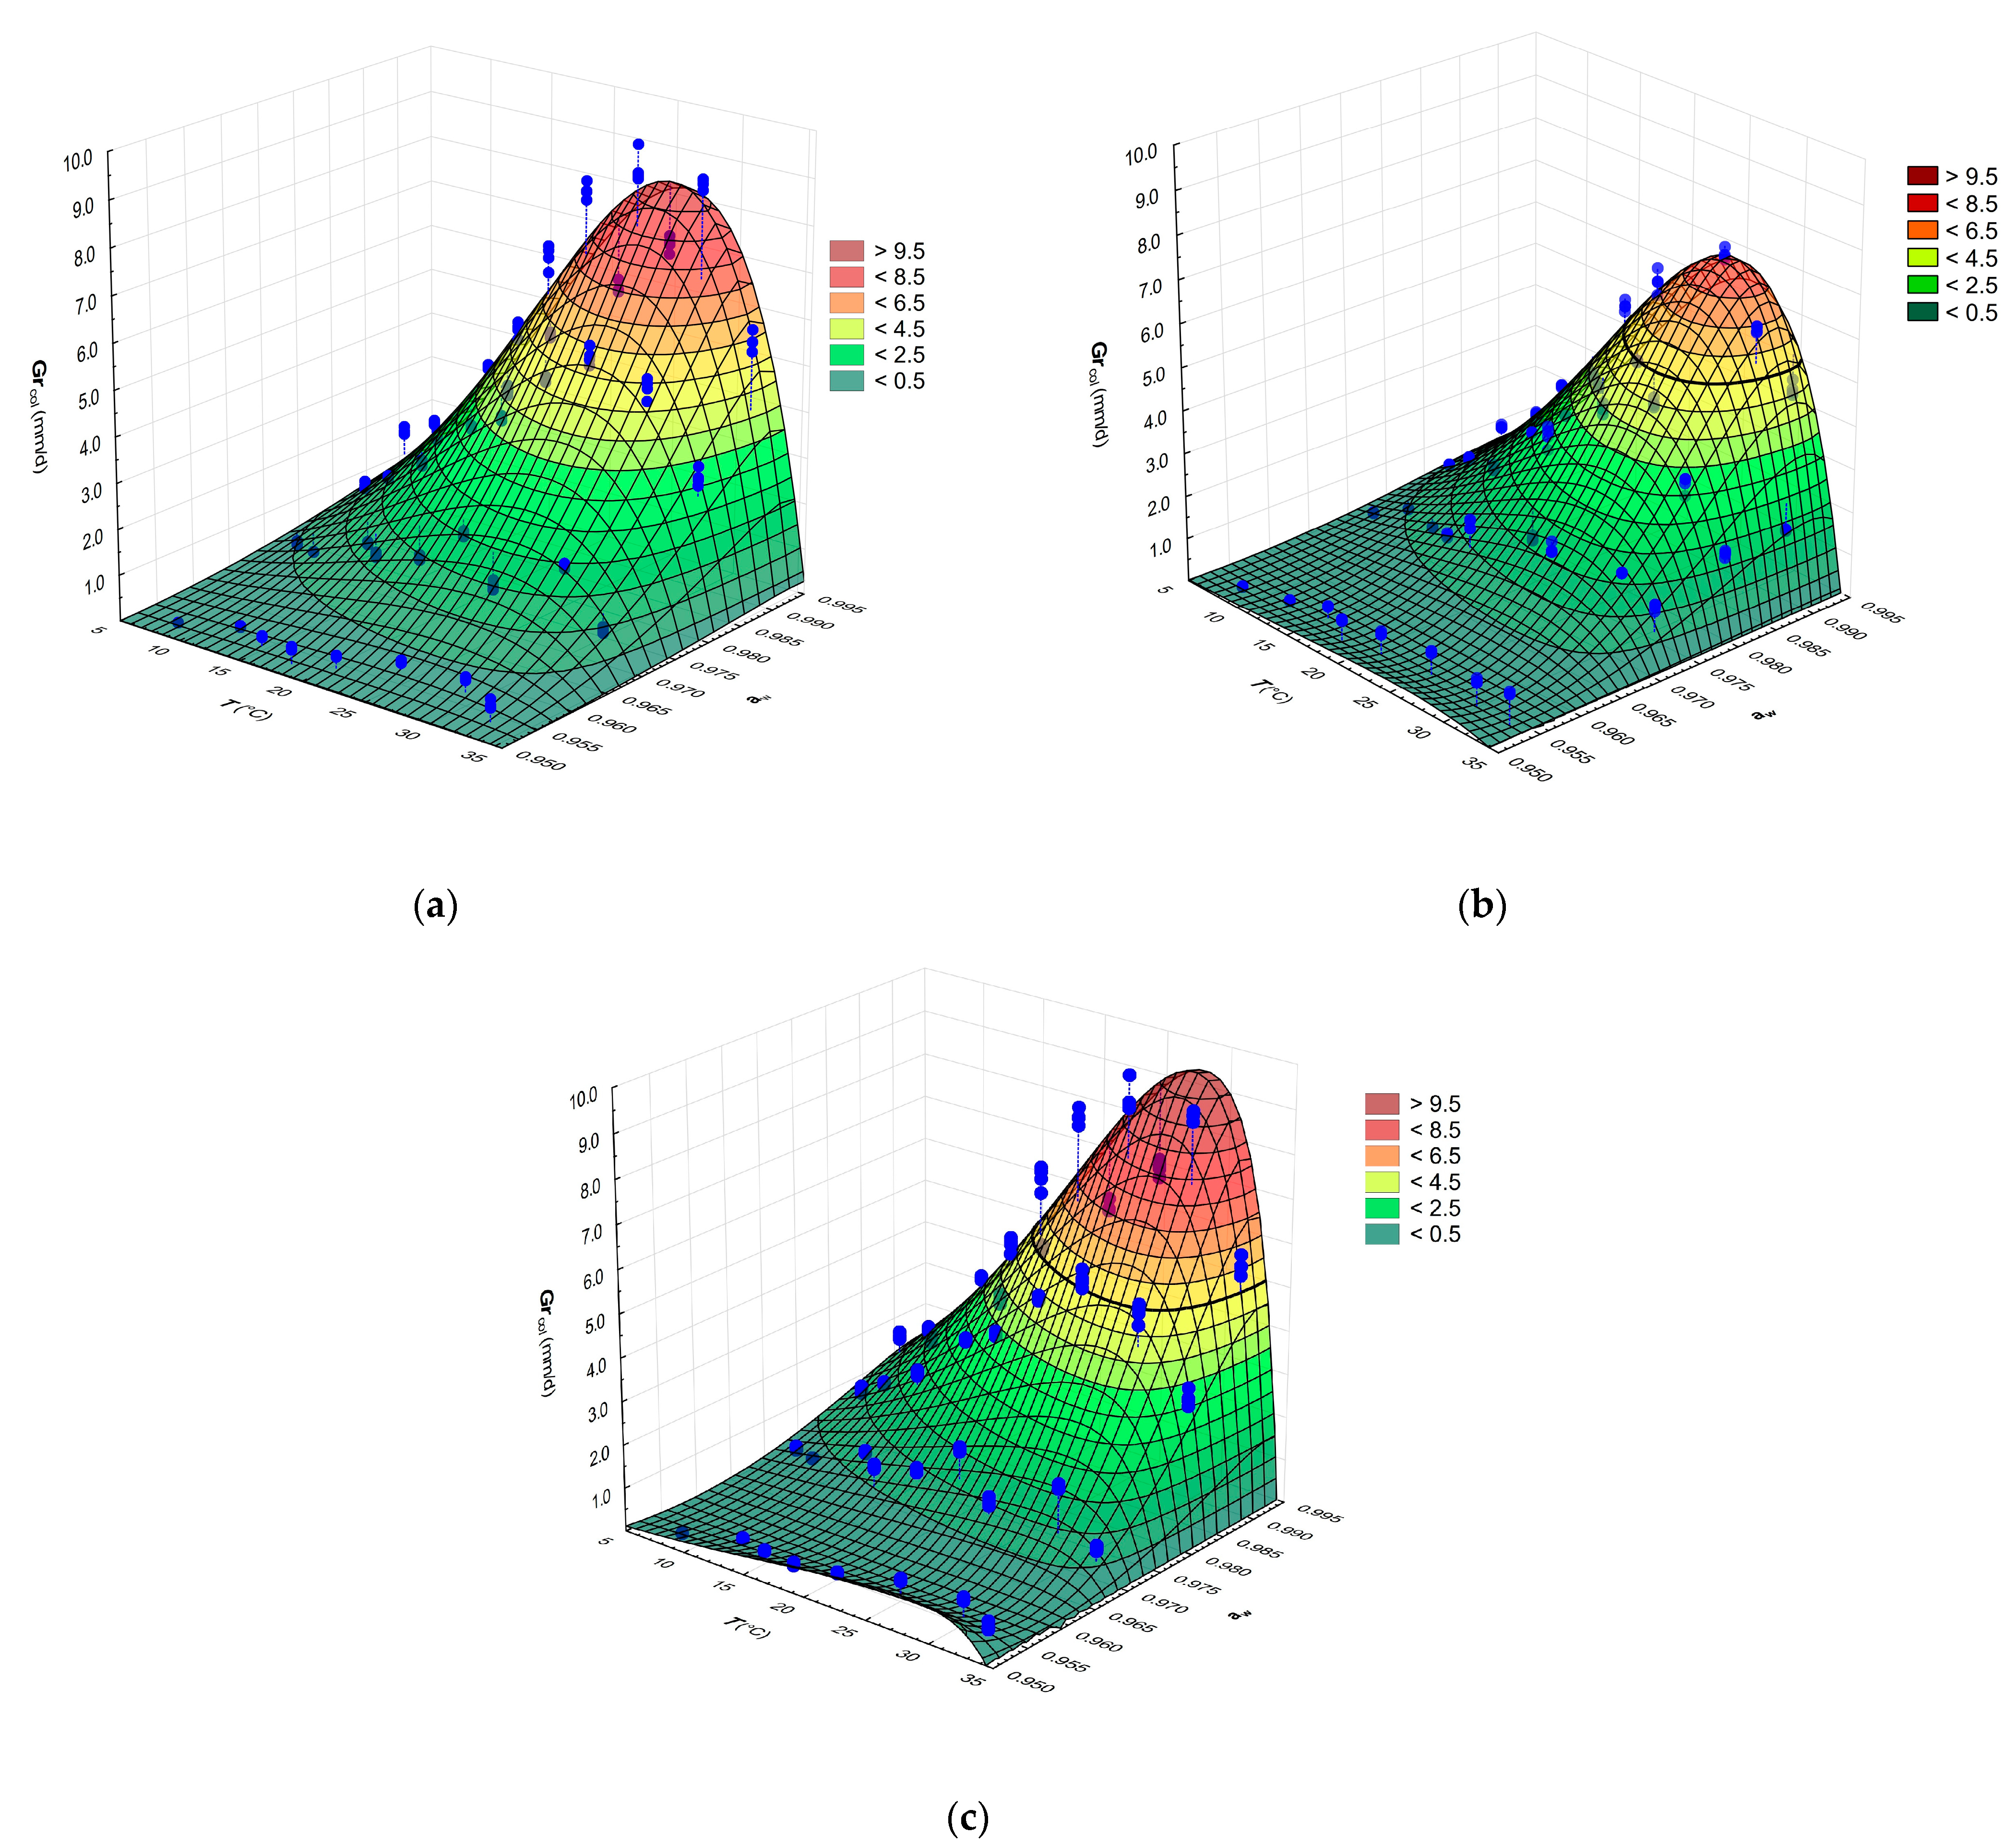
The CM was used to estimate relationships between the RGR values of the three cultures of G. candidum and temperature and aw as independent variables. Figure 2a–c show that RGR initially increased with both increasing temperature and increasing aw and the optimal range was 25–28 °C, with maximal values between 7.85 to 9.13 mm/d and a gradual decrease beyond 10 °C.
The CM parameter values (Table 2) and 3D surface plots indicate that the two G. candidum cheese isolates behaved almost identically. The collection strain CBS 577.83 showed differences from the isolates, mainly in having higher values of Topt, Tmax and RGRopt. On the other hand, the mentioned collection strain was more drastically affected by reduction of aw represented by 3% of NaCl than tested isolates of G. candidum at 25 °C. Decreasing the aw level from a 0% to 7% NaCl content in the medium involved more than 14-fold reduction in RGR of collection strain G. candidum CBS 557.83 (Supplementary Material Table S1).
With some variation among the strains, the secondary models exhibited moderately good fit to the experimental data, as measured by the indices, e.g., RMSE = 0.278–0.415 and R2 = 0.954–0.985. Several studies have observed that the statistical indices for effect of temperature and aw on fungal growth were also very similar [32,45,46].
The CM values of Tmin, Topt and Tmax estimated for G. candidum growth are consistent with published data by Hudecová et al. [47,48], Domsch et al. [49], Pitt and Hocking [1] and Šípková et al. [50] regarding only the effect of temperature. However, the RGRopt values estimated in our study are higher than the value of 5.98 mm/d reported by Hudecová et al. [48]. The study differences in estimated growth rate can be attributed to differences in the strains, models and number of independent variables investigated.
Regarding our cardinal aw parameters, the estimation of each (minimal, optimal, maximal) from the RGR data was consistent across all three strains in the study. Moreover, the aw min are consistent with those of previously published works [1,48,51] that report the ability of G. candidum to grow well on the surface of artificial growth medium or cheese with 5% NaCl (approximately aw 0.97). Plaza et al. [52] observed growth of G. candidum isolate from decayed citrus fruits at aw 0.95 (approximately 7% NaCl). However, these authors reported almost two times slower growth rates (3.5 mm/d) compared with growth of monitored G. candidum isolates G and I and strain CBS 557.83 at 30 °C at 0.995 aw level (unmodified aw). Other studies have also confirmed the salt sensitivity of G. candidum. Growth of G. candidum strains was slowed at 1–2% of NaCl on the surface growth medium [53,54,55]. Medium containing more than 4% [53,54] or 5–6% concentrations of salt [55] showed an inhibitory effect. These findings are in agreement with Hudecová et al. [14] and Marcellino and Benson [53] that salt sensitivity of G. candidum is strain dependent.
3.3. Prediction of the Time Required to Achieve Visible Colonies
The outputs of the growth modelling of G. candidum presented above can be used for several types of predictions in dairy practice. Regarding microscopic fungi, it is often of interest to estimate the time required to yield a visible (usually 3 mm) colony (t3; Table 3) under a set of specific environmental conditions for several purposes [31,42,56,57,58], such as evaluating microbial loads of contaminants that can detrimentally affect food before the “use by” date, identifying intrinsic or extrinsic factors that prevent the surface growth of mycelia on food for a certain period and determining growth/no growth zones. For such purposes, CM parameters for rapidly growing strains or typical strains could be used. In this work, which was aimed at “machinery mould” species, i.e., indicators of the efficacy of cleaning and sanitation procedures in dairies, six sets of CM parameters (representing three strains, λ and RGR) were developed and are available for prediction.
Having the lowest growth rate and the longest lag durations among the strains, strain I could be excluded from consideration, but the question of which growth phase is crucial for achieving the shortest t3 remained for the other two strains. To obtain answers, we calculated time data for all strains and conditions tested, which supported the exclusion of strain I from the evaluation. Strain CBS 557.83 needed less or almost equal time to form visible colonies than isolate G at low temperatures and higher aw, whereas aw = 0.97 favoured isolate G. Because of its shorter lag phase duration, strain G also yielded shorter or similar t3 data to the culture strain CBS 557.83 at moderate and higher temperatures (14–34 °C). The results indicated that the t3 is minimized when G. candidum displays higher growth rates, which are closely related to optimal temperature and aw range. Other studies have also confirmed these findings [31,42,57,58].
The differences in t3 data gradually increased at aw ≤ 0.97, with lower t3 values obtained for isolate G. However, data are available for the whole ranges of temperature and aw values (Supplementary material Figure S1). Table 3 presents the lowest t3 values for G. candidum that can be used for prediction in fresh dairy products in the temperature range 4–10 °C, at aw > 0.97 and at pH close to 5.5. As G. candidum can assimilate lactic acid and increase pH, e.g., by an average of 0.2 during the culture periods in this work, we speculate that data for a broad range of pH values are relevant.
4. Conclusions
The present work provides useful data for understanding the growth behaviour of G. candidum by considering the food environmental factors, temperature and aw. The inclusion of multiple strains of G. candidum, a “machinery mould”, in this study provided information on the variability of the model outputs that are essential for specific applications in food practice. Regarding surface growth, the time necessary to achieve visible colonies can be predicted for various values throughout the temperature and aw ranges. This prediction can be applied to various dairy products from pasteurized milk but is mainly applicable to artisanal or traditional soft or short-ripened cheeses produced from raw milk. The sensitivity of the strains to NaCl (lowering aw) seems to be the key element resulting from this work that can be applied to control growth of G. candidum at the cheese surface. Thus, for example, further experiments with controlled dry salting of cheese curd are needed to provide a validation study for cheese practice in the future.
On the other hand, for industrial fresh cheese practice, the prediction models incorporated in the Monte Carlo simulation may assist in development of spoilage-prevention strategies and product shelf-life estimations. Taking the mould prevalence in the cheese packaging during production into account, together with input model data distributions, the probability as well as uncertainty of visible contaminated production can be quantified during the storage (or period of shelf life).
Another challenge is the application of other lactic acid bacteria starters or adjunct protection cultures and incorporating their interactions with G. candidum into stochastic simulations. This would be necessarily associated with the further studies on activity and design of protection LAB cultures suitable for the mould(s) control.
Supplementary Materials
The following are available online at https://0-www-mdpi-com.brum.beds.ac.uk/2076-2607/9/3/532/s1, Figure S1: Effects of temperature and aw on the time needed for G. candidum to create 3 mm colonies, Table S1: The average surface growth parameters of the G. candidum isolates G and I and strain CBS 557.83 on SMA agar.
Author Contributions
Conceptualization, M.K. and Ľ.V.; methodology, M.K. and Ľ.V.; validation, Ľ.V.; formal analysis, M.K.; investigation, M.K.; writing—original draft preparation, M.K.; writing—review and editing, Ľ.V.; visualization, Ľ.V.; supervision, Ľ.V.; funding acquisition, Ľ.V. All authors have read and agreed to the published version of the manuscript.
Funding
This research was funded by the Slovak Research and Development Agency, grant number APVV-19-0031 and the Scientific Grant Agency of the Ministry of Education, Science, Research and Sports of the Slovak Republic and Slovak Academy of Sciences, grant number VEGA 1/0532/18.
Institutional Review Board Statement
Not applicable.
Informed Consent Statement
Not applicable.
Data Availability Statement
The data presented in this study are available upon reasonable request from the corresponding author.
Conflicts of Interest
The authors declare no conflict of interest.
References
- Pitt, J.I.; Hocking, A.D. Fungi and Food Spoilage, 3rd ed.; Springer Science+Business Media: New York, NY, USA, 2009; pp. 53–142. [Google Scholar]
- Deák, T. Handbook of Food Spoilage Yeast, 2nd ed.; CRC Press: Boca Raton, FL, USA, 2008; pp. 2–13. [Google Scholar]
- Hudecová, A.; Valík, Ľ.; Liptáková, D. Effect of lactic acid bacteria on growth dynamics of Geotrichum candidum during co-culture in milk. Slovak J. Food Sci. 2010, 4, 387–395. [Google Scholar]
- Laurenčík, M.; Sulo, P.; Sláviková, E.; Piecková, E.; Seman, M.; Ebringer, L. The diversity of eukaryotic microbiota in the traditional Slovak sheep cheese—Bryndza. Int. J. Food Microbiol. 2008, 127, 176–179. [Google Scholar] [CrossRef] [PubMed]
- Boutrou, R.; Guéguen, M. Interests in Geotrichum candidum for cheese technology. Int. J. Food Microbiol. 2005, 102, 1–20. [Google Scholar] [CrossRef] [PubMed]
- Koňuchová, M.; Lehotová, V.; Šípková, A.; Piecková, E.; Valík, Ľ. Biodiversity Evaluation of Geotrichum candidum Link. Is arthrosporic nucleus number in Geotrichum candidum related to the fungus biodiversity? Sci. Agric. Bohemica 2016, 47, 181–186. [Google Scholar] [CrossRef] [Green Version]
- Kornacki, J.L.; Flowers, R.S.; Bradley, R.L. Microbiology of butter and related products. In Applied Dairy Microbiology, 2nd ed.; Marth, E.H., Steele, J.L., Eds.; Marcel Dekker: New York, NY, USA, 2001; pp. 127–150. [Google Scholar]
- Eliskases-Lechner, F.; Guéguen, M.; Panoff, J.M. Geotrichum candidum. In Encyclopedia of Dairy Sciences, 2nd ed.; Fuquay, J.W., Fox, P.F., Mcsweeney, P.L.H., Eds.; Academic Press: London, UK, 2011; Volume 4, pp. 765–771. [Google Scholar]
- Aziza, M.; Couriol, C.; Amrane, A.; Boutrou, R. Evidences for synergistic effects of Geotrichum candidum on Penicillium camembertii growing on cheese juice. Enzym. Microb. Technol. 2005, 37, 218–224. [Google Scholar] [CrossRef]
- Boutrou, R.; Kerriou, L.; Gassi, J.-Y. Contribution of Geotrichum candidum to the proteolysis of soft cheese. Int. Dairy J. 2006, 16, 775–783. [Google Scholar] [CrossRef]
- Cogan, T.M.; Goerges, S.; Gelsomino, R.; Larpin, S.; Hohenegger, M.; Bora, N.; Jamet, E.; Rea, M.C.; Mounier, J.; Vancanneyt, M.; et al. Biodiversity of the surface microbial consortia from Limburger, Reblochon, Livarot, Tilsit, and Gubbeen cheeses. Microbiol. Spectrum. 2014, 2, 1–28. [Google Scholar]
- Desmasures, N. Mold-Ripened Varieties. In Encyclopedia of Food Microbiology, 2nd ed.; Batt, C.A., Tortello, M.-R., Eds.; Academic Press: Cambridge, UK, 2014; pp. 409–416. [Google Scholar]
- Grygier, A.; Majcher, M.; Myszka, K. Galactomyces geotrichum–moulds from dairy products with high biotechnological potential. Acta Sci. Pol. Technol. Aliment. 2017, 16, 5–16. [Google Scholar] [CrossRef]
- Hudecová, A.; Valík, Ľ.; Liptáková, D. Quantification of Geotrichum candidum growth in co-culture with lactic acid bacteria. Czech J. Food Sci. 2009, 27, 18–27. [Google Scholar] [CrossRef] [Green Version]
- Šipošová, P.; Koňuchová, M.; Valík, Ľ.; Medveďová, A. Growth dynamics of lactic acid bacteria and dairy microscopic fungus Geotrichum candidum during their co-cultivation in milk. Food Sci. Technol. Int. 2020, in press. [Google Scholar]
- Bakry, A.M.; Campelo, P.H. Mini-review on functional characteristics of viili and manufacturing process. J. Food Biotechnol. Res. 2018, 2, 1–6. [Google Scholar]
- Witthuhn, R.C.; Schoeman, T.; Britz, T.J. Characterisation of the microbial population at different stages of Kefir production and Kefir grain mass cultivation. Int. Dairy J. 2005, 15, 383–389. [Google Scholar] [CrossRef]
- Kazou, M.; Grafakou, A.; Tsakalidou, E.; Georgalaki, M. Zooming into the microbiota of home-made and industrial kefir produced in Greece using classical microbiological and amplicon-based metagenomics analyses. Front. Microbiol. 2021, 12, 621069. [Google Scholar] [CrossRef] [PubMed]
- Dantigny, P.; Marín, S.; Beyer, M.; Magan, N. Mould germination: Data treatment and modelling. Int. J. Food Microbiol. 2007, 114, 17–24. [Google Scholar] [CrossRef] [PubMed]
- Garcia, D.; Ramos, A.J.; Sanchis, V.; Marín, S. Predicting mycotoxins in foods: A review. Food Microbiol. 2009, 26, 757–769. [Google Scholar] [CrossRef]
- Koňuchová, M.; Valík, Ľ. Evaluation of radial growth dynamics variability of Geotrichum candidum: A quantitative approach. J. Food Nutr. Res. 2017, 56, 155–166. [Google Scholar]
- Baranyi, J.; Roberts, T.A. Mathematics of predictive food microbiology. Int. J. Food Microbiol. 1995, 26, 199–218. [Google Scholar] [CrossRef] [Green Version]
- Rosso, L.; Lobry, J.R.; Flandrois, J.P. An unexpected correlation between cardinal temperatures of microbial growth highlighted by a new model. J. Theor. Biol. 1993, 162, 447–463. [Google Scholar] [CrossRef]
- Zwietering, M.H.; Wijtzes, T.; De Wit, J.C.; van’T Riet, K. A decision support system for prediction of the microbial spoilage in foods. J. Food Protect. 1992, 55, 973–979. [Google Scholar] [CrossRef]
- Rosso, L.; Robinson, T.P. A cardinal model to describe the effect of water activity on the growth of moulds. Int. J. Food Microbiol. 2001, 63, 265–273. [Google Scholar] [CrossRef]
- Pérez-Rodríguez, F.; Valero, A. Predictive Microbiology in Foods, 5th ed.; Springer Science+Business Media: New York, NY, USA, 2013; pp. 25–55. [Google Scholar]
- Rosso, L.; Lobry, J.R.; Bajard, S.; Flandrois, J.P. Convenient model to describe the combined effects of temperature and pH on microbial growth. Appl. Environ. Microbiol. 1995, 61, 610–616. [Google Scholar] [CrossRef] [Green Version]
- Gougouli, M.; Koutsoumanis, K.P. Modelling growth of Penicillium expansum and Aspergillus niger at constant and fluctuating temperature conditions. Int. J. Food Microbiol. 2010, 140, 254–262. [Google Scholar] [CrossRef] [PubMed]
- Greco, M.; Pardo, A.; Pose, G.; Patriarca, A. Effect of water activity and temperature on the growth of Eurotium species isolated from animal feeds. Rev. Iberoam. Micol. 2018, 35, 39–48. [Google Scholar] [CrossRef]
- Dagnas, S.; Gougouli, M.; Onno, B.; Koutsoumanis, K.P.; Membré, J.-M. Quantifying the effect of water activity and storage temperature on single spore lag times of three moulds isolated from spoiled bakery products. Int. J. Food Microbiol. 2017, 240, 75–84. [Google Scholar] [CrossRef] [PubMed]
- Huchet, V.; Pavan, S.; Lochardet, A.; Divanac’h, M.L.; Postollec, F.; Thuault, D. Development and application of a predictive model of Aspergillus candidus growth as a tool to improve shelf life of bakery products. Food Microbiol. 2013, 36, 254–259. [Google Scholar] [CrossRef] [PubMed]
- Astoreca, A.; Vaamonde, G.; Dalcero, A.; Ramos, A.J.; Marín, S. Modelling the effect of temperature and water activity of Aspergillus flavus isolates from corn. Int. J. Food Microbiol. 2012, 156, 60–67. [Google Scholar] [CrossRef]
- Samapundo, S.; Devlieghere, F.; Geeraerd, A.H.; De Meulenaer, B.; Van Impe, J.F.; Debevere, J. Modelling of the individual and combined effects of water activity and temperature on the radial growth of Aspergillus flavus and A. parasiticus on corn. Food Microbiol. 2007, 24, 517–529. [Google Scholar] [CrossRef] [PubMed]
- Panagou, E.Z.; Chelonas, S.; Chatzipavlidis, I.; Nychas, G.-J.E. Modelling the effect of temperature and water activity on the growth rate and growth/no growth interface of Byssochlamys fulva and Byssochlamys nivea. Food Microbiol. 2010, 27, 618–627. [Google Scholar] [CrossRef] [PubMed]
- Nevarez, L.; Vasseur, V.; Le Madec, A.; Le Bras, M.; Coroller, L.; Leguérinel, I.; Barbier, G. Physiological traits of Penicillium glabrum strain LCP 08.5568, a filamentous fungus isolated from bottled aromatised mineral water. Int. J. Food Microbiol. 2009, 130, 166–171. [Google Scholar] [CrossRef] [Green Version]
- Baert, K.; Valero, A.; De Meulenaer, B.; Samapundo, S.; Ahmed, M.M.; Bo, L.; Debevere, J.; Devlieghere, F. Modelling the effect of temperature on the growth rate and lag phase of Penicillium expansum in apples. Int. J. Food Microbiol. 2007, 118, 139–150. [Google Scholar] [CrossRef] [PubMed]
- Parra, R.; Magan, N. Modelling the effect of temperature and water activity on growth of Aspergillus niger strains and applications for food spoilage moulds. J. Appl. Microbiol. 2004, 97, 429–438. [Google Scholar] [CrossRef]
- Sautour, M.; Rouget, A.; Dantigny, P.; Divies, C.; Bensoussan, M. Application of Doehlert design to determine the combined effects of temperature, water activity and pH on conidial germination of Penicillium chrysogenum. Int. J. Food Microbiol. 2001, 91, 900–906. [Google Scholar] [CrossRef] [Green Version]
- Marín, S.; Cuevas, D.; Ramos, A.J.; Sanchis, V. Fitting of colony diameter and ergosterol as indicators of food borne mould growth to known growth models in solid medium. Int. J. Food Microbiol. 2008, 121, 139–149. [Google Scholar] [CrossRef]
- Sant’ana, A.; Franco, B.D.G.M.; Schaffner, D.W. Modeling the growth rate and lag time of different strains of Salmonella enterica and Listeria monocytogenes in ready-to-eat lettuce. Food Microbiol. 2012, 30, 267–273. [Google Scholar] [CrossRef]
- Valík, Ľ.; Medveďová, A.; Liptáková, D. Characterization of the growth of Lactobacillus rhamnosus GG in milk at suboptimal temperatures. J. Food Nutr. Res. 2008, 47, 60–67. [Google Scholar]
- Gougouli, M.; Kalantzi, K.; Beletsiotis, E.; Koutsoumanis, K.P. Development and application of predictive models for fungal growth as tools to improve quality control in yogurt production. Food Microbiol. 2011, 28, 1453–1462. [Google Scholar] [CrossRef]
- Marín, S.; Colom, C.; Sanchis, V.; Ramos, A.J. Modelling of growth of aflatoxigenic A. flavus isolates from red chilli powder as a function of water availability. Int. J. Food Microbiol. 2009, 128, 491–496. [Google Scholar] [CrossRef]
- Dagnas, S.; Onno, B.; Membré, J.M. Modeling growth of three bakery product spoilage molds as a function of water activity, temperature and pH. Int. J. Food Microbiol. 2014, 186, 95–104. [Google Scholar] [CrossRef] [PubMed]
- Belbahi, A.; Leguerinel, I.; Méot, J.-M.; Loiseau, G.; Madani, K.; Bohuon, P. Modelling the effect of temperature, water activity and carbon dioxide on the growth of Aspergillus niger and Alternaria alternata isolated from fresh date fruit. J. Appl. Microbiol. 2016, 121, 1685–1698. [Google Scholar] [CrossRef] [PubMed]
- Samapundo, S.; Devlieghere, F.; De Meulenaer, B.; Debevere, J. Growth kinetics of cultures from single spores of Aspergillus flavus and Fusarium verticillioides on yellow dent corn meal. Food Microbiol. 2007, 24, 336–345. [Google Scholar] [CrossRef] [PubMed]
- Hudecová, A.; Valík, Ľ.; Liptáková, D. Influence of temperature on the surface growth of Geotrichum candidum. Acta Chim. Slovaca. 2009, 2, 75–87. [Google Scholar]
- Hudecová, A.; Valík, Ľ.; Liptáková, D. Surface growth of Geotrichum candidum: Effect of the environmental factors on its dynamics. Slovak J. Food Sci. 2011, 5, 17–22. [Google Scholar] [CrossRef]
- Domsch, K.H.; Gams, W.; Anderson, T.-H. Compendium of Soil Fungi, 1st ed.; Academic Press: London, UK, 1980; Volume 2, pp. 1–859. [Google Scholar]
- Šípková, A.; Valík, L.; Čižniar, M.; Liptáková, D. Characterization of mutual relations between Geotrichum candidum and Lactobacillus rhamnosus GG in milk: A quantitative approach. Food Sci. Technol. Int. 2014, 20, 23–31. [Google Scholar] [CrossRef] [PubMed]
- Tornadijo, M.E.; Fresno, J.M.; Sarmiento, R.M.; Carballo, J. Study of the yeasts during the ripening process of Armada cheeses from raw goat’s milk. Le Lait 1998, 78, 647–659. [Google Scholar] [CrossRef] [Green Version]
- Plaza, P.; Usall, J.; Teixidó, N.; Vièas, I. Effect of water activity and temperature on germination and growth of Penicillium digitatum, P. italicum and Geotrichum candidum. J. Appl. Microbiol. 2003, 94, 549–554. [Google Scholar] [CrossRef] [PubMed]
- Marcellino, S.N.; Benson, D.R. The good, the bad, and the ugly: Tales of mold-ripened cheese. In Cheese and Microbes, 1st ed.; Donnelly, C.W., Ed.; ASM Press: Washington, DC, USA, 2014; pp. 95–132. [Google Scholar]
- Tempel, T.; Nielsen, M.S. Effects of atmospheric conditions, NaCl and pH on growth and interactions between moulds and yeasts related to blue cheese production. Int. J. Food Microbiol. 2000, 57, 193–199. [Google Scholar] [CrossRef]
- Uraz, T.; Özer, B.H. Molds Employed in Food Processing. In Encyclopedia of Food Microbiology, 2nd ed.; Batt, C.A., Tortello, M.-R., Eds.; Academic Press: Cambridge, UK, 2014; pp. 522–528. [Google Scholar]
- Dantigny, P. Applications of predictive modeling techniques to fungal growth in foods. Curr. Opin. Food Sci. 2021, 38, 86–90. [Google Scholar] [CrossRef]
- Aldars-García, L.; Sanchis, V.; Ramos, A.J.; Marín, S. Time-course of germination, initiation of mycelium proliferation and probability of visible growth and detectable AFB1 production of an isolate of Aspergillus flavus on pistachio extract agar. Food Microbiol. 2017, 64, 104–111. [Google Scholar] [CrossRef]
- Burgain, A.; Bensoussan, M.; Dantigny, P. Effect of inoculum size and water activity on the time to visible growth of Penicillium chrysogenum colony. Int. J. Food Microbiol. 2013, 163, 180–183. [Google Scholar] [CrossRef]
Figure 1.
Effects of temperature and aw on the lag time (λ) of isolate G (a), isolate I (b) and collection strain CBS 557.83 of G. candidum (c) fitted with CM. Points (○) represent observed values of lag phase.
Figure 1.
Effects of temperature and aw on the lag time (λ) of isolate G (a), isolate I (b) and collection strain CBS 557.83 of G. candidum (c) fitted with CM. Points (○) represent observed values of lag phase.

Figure 2.
Effects of temperature and aw on the RGR of isolate G (a), isolate I (b) and collection strain CBS 557.83 of G. candidum (c) fitted with CM. Points (●) represent observed values of RGR.
Figure 2.
Effects of temperature and aw on the RGR of isolate G (a), isolate I (b) and collection strain CBS 557.83 of G. candidum (c) fitted with CM. Points (●) represent observed values of RGR.


Table 1.
Estimated cardinal model (CM) parameters and statistical indices for lag time modelling of G. candidum against temperature and aw.
Table 1.
Estimated cardinal model (CM) parameters and statistical indices for lag time modelling of G. candidum against temperature and aw.
| Parameters | Isolate G | Isolate I | Strain CBS 577.83 |
|---|---|---|---|
| 1/λopt (1/d) | 3.30 ± 0.25 | 3.64 ± 0.68 | 2.97 ± 1.06 |
| Tmin (°C) * | −5.15 ± 0.10 | −5.45 ± 0.14 | −1.95 ± 0.03 |
| Topt (°C) | 33.13 ± 0.32 | 34.56 ± 0.70 | 35.83 ± 0.94 |
| Tmax (°C) | 37.35 ± 0.09 | 37.09 ± 0.11 | 37.06 ± 0.27 |
| awmin | 0.927 ± 0.003 | 0.938 ± 0.003 | 0.925 ± 0.003 |
| awopt | 0.998 (fixed value) | 0.998 (fixed value) | 0.997 (fixed value) |
| awmax | 0.999 (fixed value) | 0.999 (fixed value) | 1 (fixed value) |
| RMSE | 0.268 | 0.280 | 0.173 |
| %MRE | 9.5 | 7.6 | 4.9 |
| %SEP | 32.0 | 32.4 | 23.3 |
| n | 187 | 159 | 152 |
| R2 | 0.707 | 0.685 | 0.808 |
± (standard deviation); RMSE—root mean square error; %MRE—mean relative error; %SEP—standard error of prediction; n—number of data points; R2—coefficient of determination; * Tmin means only theoretical Tmin value.
Table 2.
Estimated CM parameters and statistical indices for radial growth rate (RGR) modelling of G. candidum against temperature and aw.
Table 2.
Estimated CM parameters and statistical indices for radial growth rate (RGR) modelling of G. candidum against temperature and aw.
| Parameters | Isolate G | Isolate I | Strain CBS 577.83 |
|---|---|---|---|
| RGRopt (mm/d) | 7.85 ± 0.15 | 6.87 ± 0.15 | 9.13 ± 0.20 |
| Tmin (°C) * | −1.46 ± 0.01 | −0.43 ± 0.01 | −5.17 ± 0.05 |
| Topt (°C) | 25.92 ± 0.04 | 25.41 ± 0.04 | 28.03 ± 0.37 |
| Tmax (°C) | 35.63 ± 0.07 | 34.17 ± 0.38 | 37.57 ± 0.06 |
| awmin | 0.9479 ± 0.0014 | 0.9557 ± 0.0016 | 0.9591 ± 0.0012 |
| awopt | 0.9934 ± 0.0003 | 0.9919 ± 0.0003 | 0.9916 ± 0.0002 |
| awmax | 0.9977 ± 0.0010 | 0.9988 ± 0.0011 | 0.9991 ± 0.0001 |
| RMSE | 0.415 | 0.405 | 0.278 |
| %MRE | 4.2 | 4.3 | 4.4 |
| %SEP | 16.4 | 20.0 | 19.7 |
| n | 192 | 184 | 188 |
| R2 | 0.985 | 0.954 | 0.980 |
± (standard deviation); RMSE—root mean square error; %MRE—mean relative error; %SEP—standard error of prediction; n—number of data points; R2—coefficient of determination; * Tmin means only theoretical Tmin value.
Table 3.
Comparison of the time needed for G. candidum to create 3 mm colonies.
| Temperature (°C) | % NaCl | t3 (d) | RMSE for the t3 Predictions Based on Both Cultures Data (n = 6) | |
|---|---|---|---|---|
| Strain CBS 557.83 | Isolate G | |||
| 4 | 0.995 | 8.1 ± 0.3 | 9.6 ± 0.4 | 0.9 |
| 0.99 | 8.6 ± 0.5 | 10.6 ± 0.2 | 1.1 | |
| 0.98 | 13.8 ± 0.6 | 15.9 ± 0.05 | 1.2 | |
| 0.97 | 32.3 ± 1.9 | 28.9 ± 0.9 | 2.4 | |
| 5 | 0.995 | 6.6 ± 0.3 | 7.4 ± 0.3 | 0.5 |
| 0.99 | 7.1 ± 0.4 | 8.0 ± 0.1 | 0.6 | |
| 0.98 | 11.3 ± 0.5 | 12.9 ± 0.04 | 0.6 | |
| 0.97 | 26.4 ± 1.5 | 21.9 ± 0.7 | 2.8 | |
| 6 | 0.995 | 5.5 ± 0.2 | 5.9 ± 0.2 | 0.3 |
| 0.99 | 5.9 ± 0.3 | 6.5 ± 0.1 | 0.4 | |
| 0.98 | 9.4 ± 0.4 | 9.7 ± 0.04 | 0.3 | |
| 0.97 | 22.0 ± 1.3 | 17.3 ± 0.5 | 2.8 | |
| 7 | 0.995 | 4.7 ± 0.2 | 4.8 ± 0.2 | 0.2 |
| 0.99 | 5.0 ± 0.3 | 5.3 ± 0.1 | 0.2 | |
| 0.98 | 7.9 ± 0.4 | 7.9 ± 0.4 | 0.2 | |
| 0.97 | 18.6 ± 1.1 | 14.1 ± 0.4 | 2.7 | |
| 8 | 0.995 | 4.0 ± 0.2 | 4.0 ± 0.2 | 0.1 |
| 0.99 | 4.3 ± 0.3 | 4.4 ± 0.1 | 0.2 | |
| 0.98 | 6.8 ± 0.3 | 6.6 ± 0.04 | 0.2 | |
| 0.97 | 15.9 ± 1.0 | 11.7 ± 0.3 | 2.5 | |
| 9 | 0.995 | 3.5 ± 0.1 | 3.4 ± 0.1 | 0.1 |
| 0.99 | 3.7 ± 0.2 | 3.8 ± 0.1 | 0.2 | |
| 0.98 | 5.9 ± 0.3 | 5.6 ± 0.04 | 0.2 | |
| 0.97 | 13.8 ± 0.8 | 9.9 ± 0.3 | 2.3 | |
| 10 | 0.995 | 3.0 ± 0.1 | 2.9 ± 0.1 | 0.1 |
| 0.99 | 3.2 ± 0.2 | 3.3 ± 0.1 | 0.1 | |
| 0.98 | 5.2 ± 0.2 | 4.9 ± 0.04 | 0.2 | |
| 0.97 | 12.1 ± 0.7 | 8.6 ± 0.2 | 2.1 | |
Publisher’s Note: MDPI stays neutral with regard to jurisdictional claims in published maps and institutional affiliations. |
© 2021 by the authors. Licensee MDPI, Basel, Switzerland. This article is an open access article distributed under the terms and conditions of the Creative Commons Attribution (CC BY) license (http://creativecommons.org/licenses/by/4.0/).
Share and Cite
MDPI and ACS Style
Koňuchová, M.; Valík, Ľ. Modelling the Radial Growth of Geotrichum candidum: Effects of Temperature and Water Activity. Microorganisms 2021, 9, 532. https://0-doi-org.brum.beds.ac.uk/10.3390/microorganisms9030532
AMA Style
Koňuchová M, Valík Ľ. Modelling the Radial Growth of Geotrichum candidum: Effects of Temperature and Water Activity. Microorganisms. 2021; 9(3):532. https://0-doi-org.brum.beds.ac.uk/10.3390/microorganisms9030532
Chicago/Turabian StyleKoňuchová, Martina, and Ľubomír Valík. 2021. "Modelling the Radial Growth of Geotrichum candidum: Effects of Temperature and Water Activity" Microorganisms 9, no. 3: 532. https://0-doi-org.brum.beds.ac.uk/10.3390/microorganisms9030532
Note that from the first issue of 2016, this journal uses article numbers instead of page numbers. See further details here.