
Microbial Hotspots in Lithic Microhabitats Inferred from DNA Fractionation and Metagenomics in the Atacama Desert


 , , , , , , , add
Show full author list
, , , , , , , add
Show full author list
Abstract
:1. Introduction
2. Methods
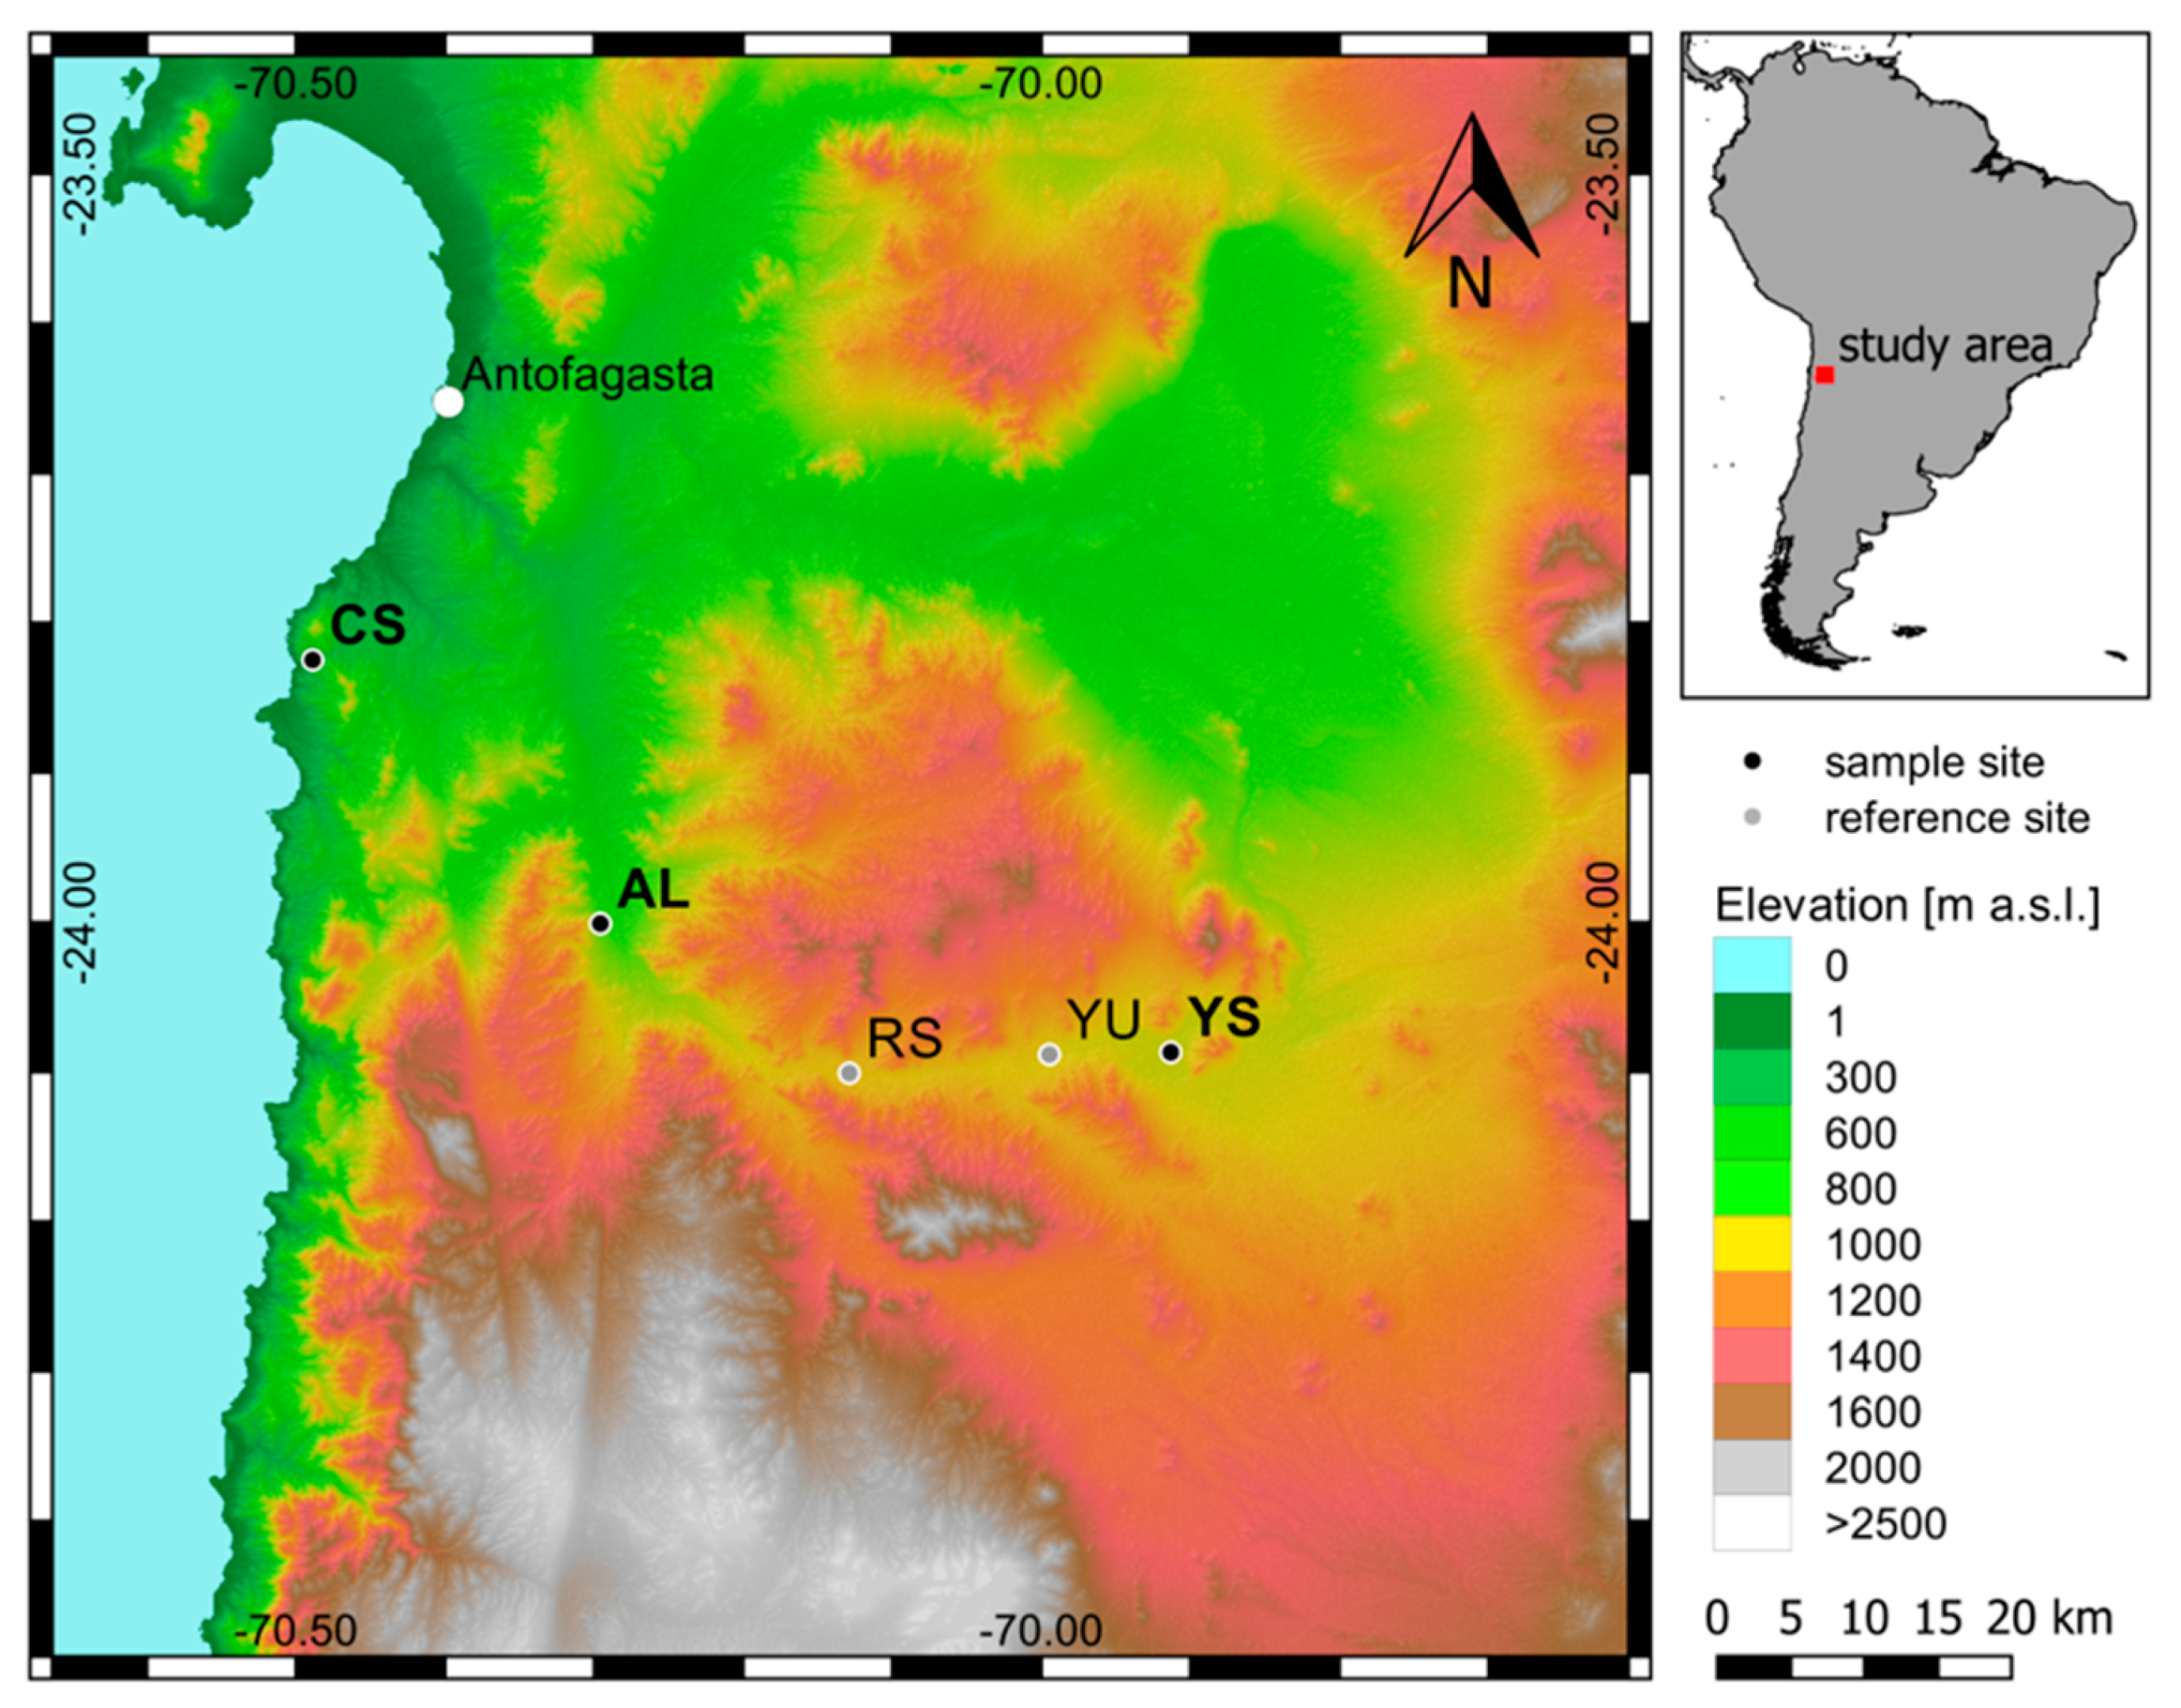
2.1. Study Sites and Sampling Procedure
2.2. Sample Preparation
2.3. Mineralogy
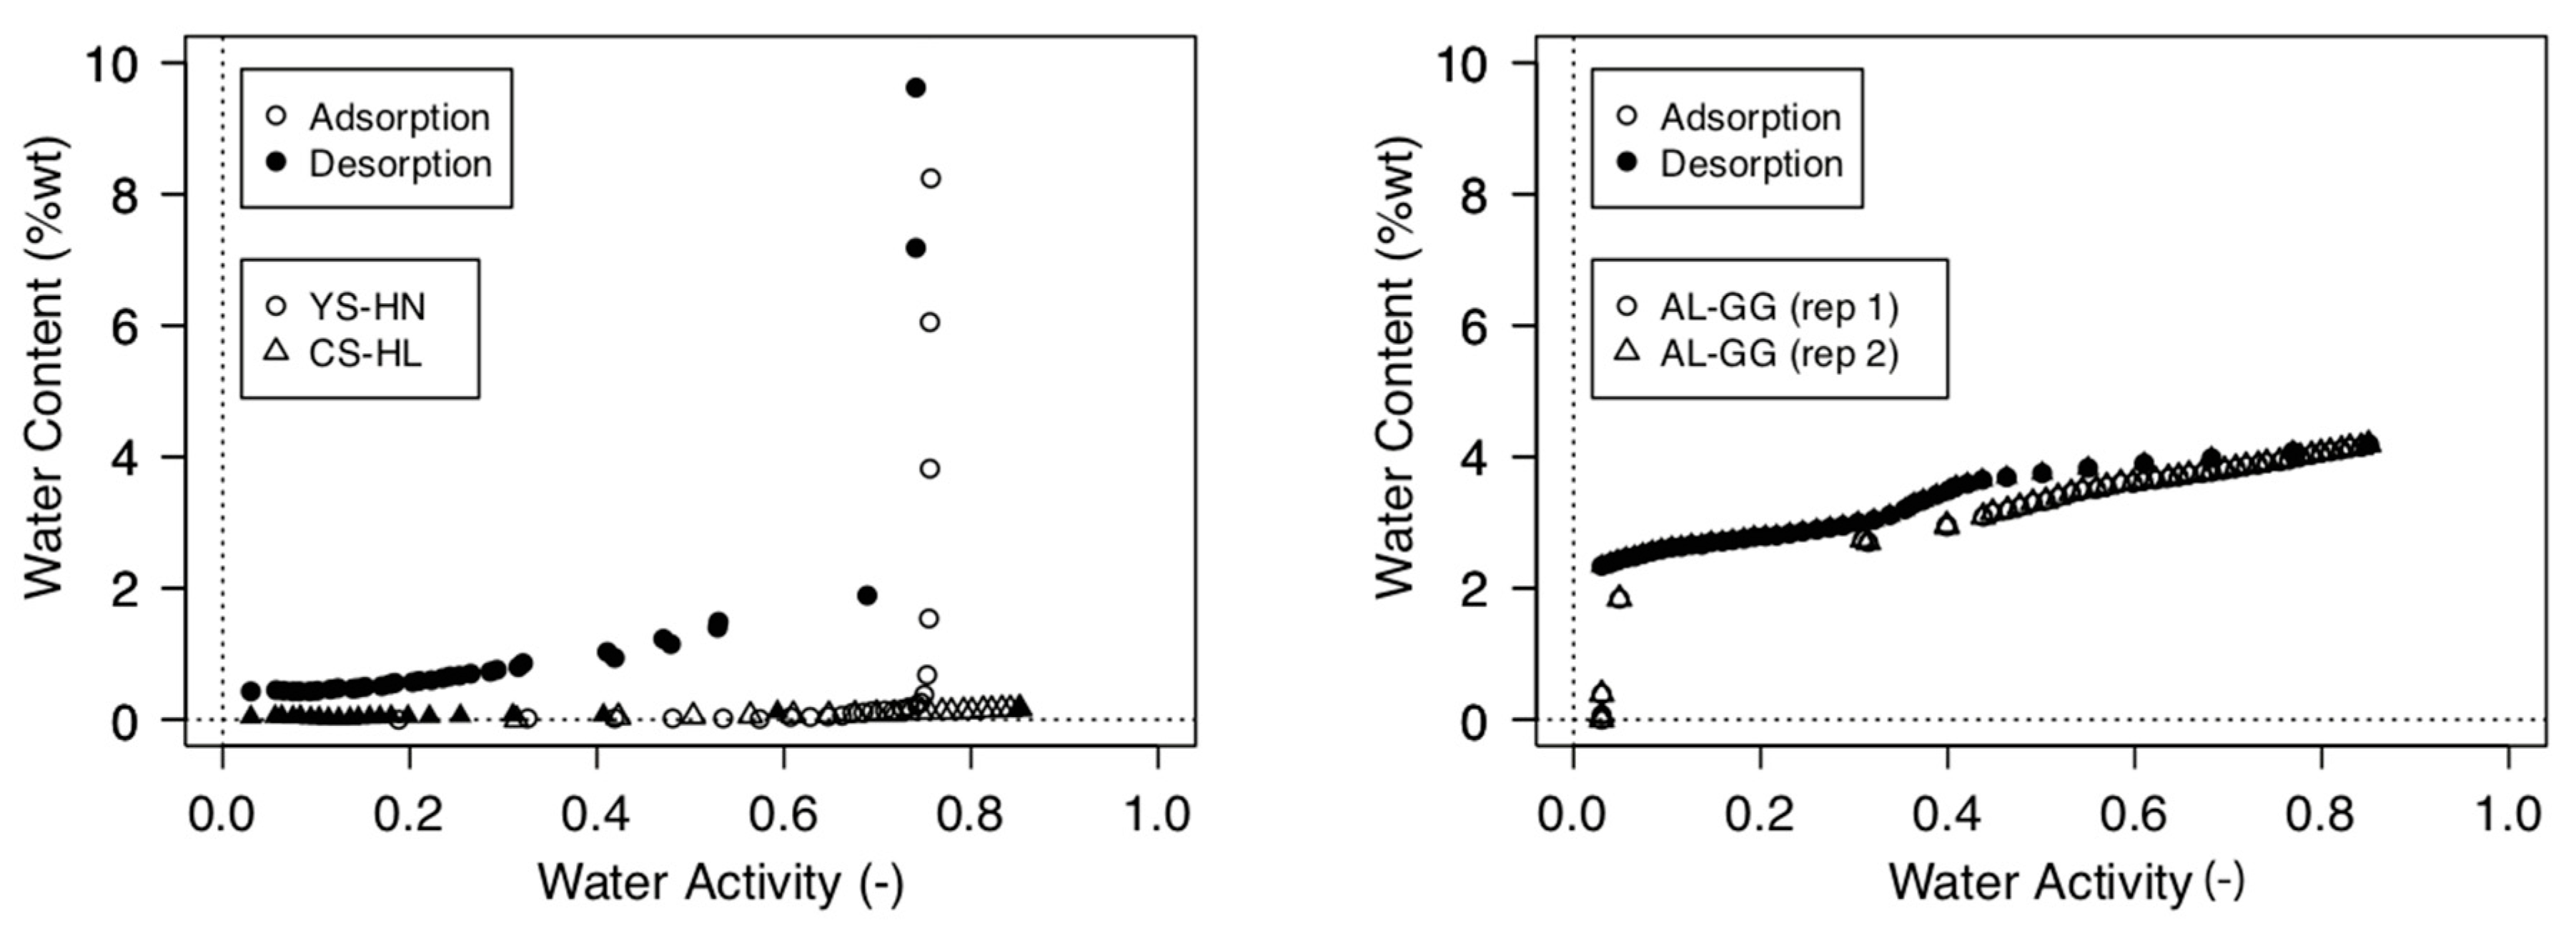
2.4. Moisture Sorption Isotherms and Water Activity
2.5. DNA Isolation and Sequencing
2.5.1. Extraction of Extracellular (e) and Intracellular (i) DNA
2.5.2. Quantitative PCR Analysis (qPCR) and Amplicon Sequencing
2.5.3. 16S rRNA Gene Amplicon Pool Preparation for Illumina MiSeq Sequencing
2.5.4. Diversity and Statistical Analyses
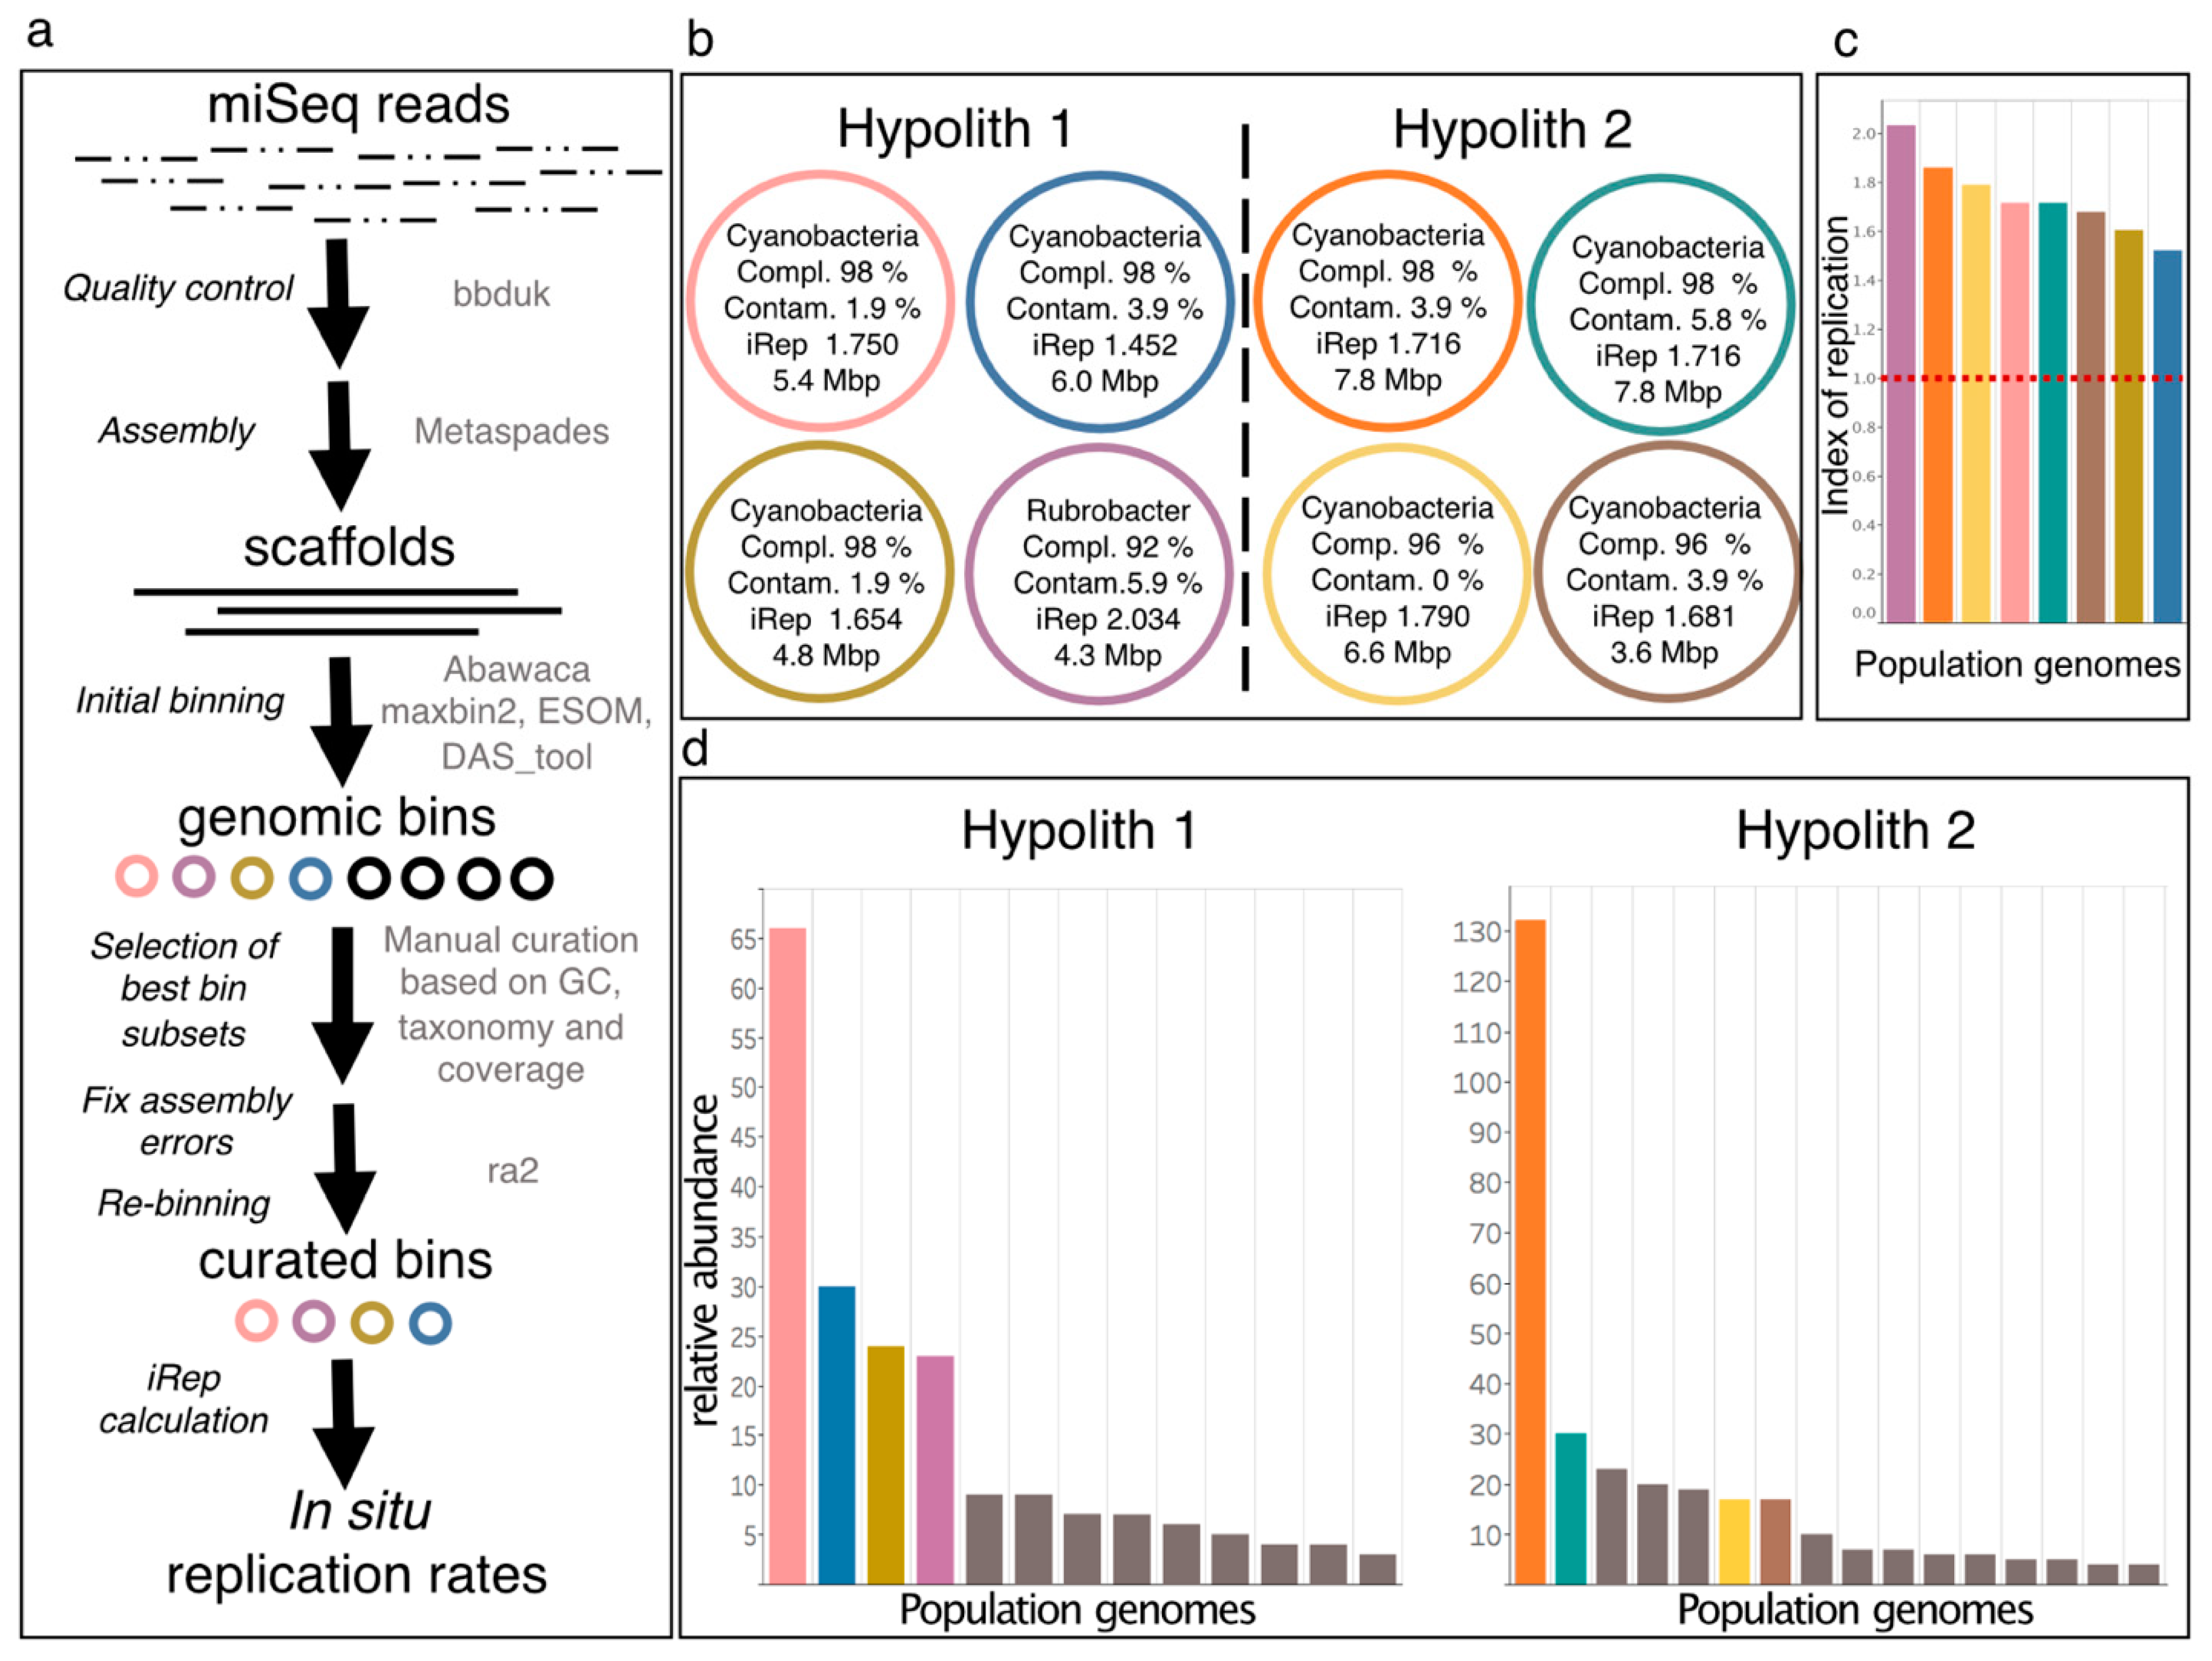
2.5.5. Read-Based Metagenomics, Genome-Resolved Metagenomics, and In Situ Replication Rates
2.6. ATP Analyses
2.7. Phospholipids/Phospholipid Fatty Acids Analysis (PLFA)
2.7.1. Extraction and Column Separation
2.7.2. Detection of Phospholipid Fatty Acids (PLFA)
2.8. Metabolites
2.8.1. Soil and Rock Extraction
2.8.2. ESI(−) FT-ICR-MS Analysis
3. Results
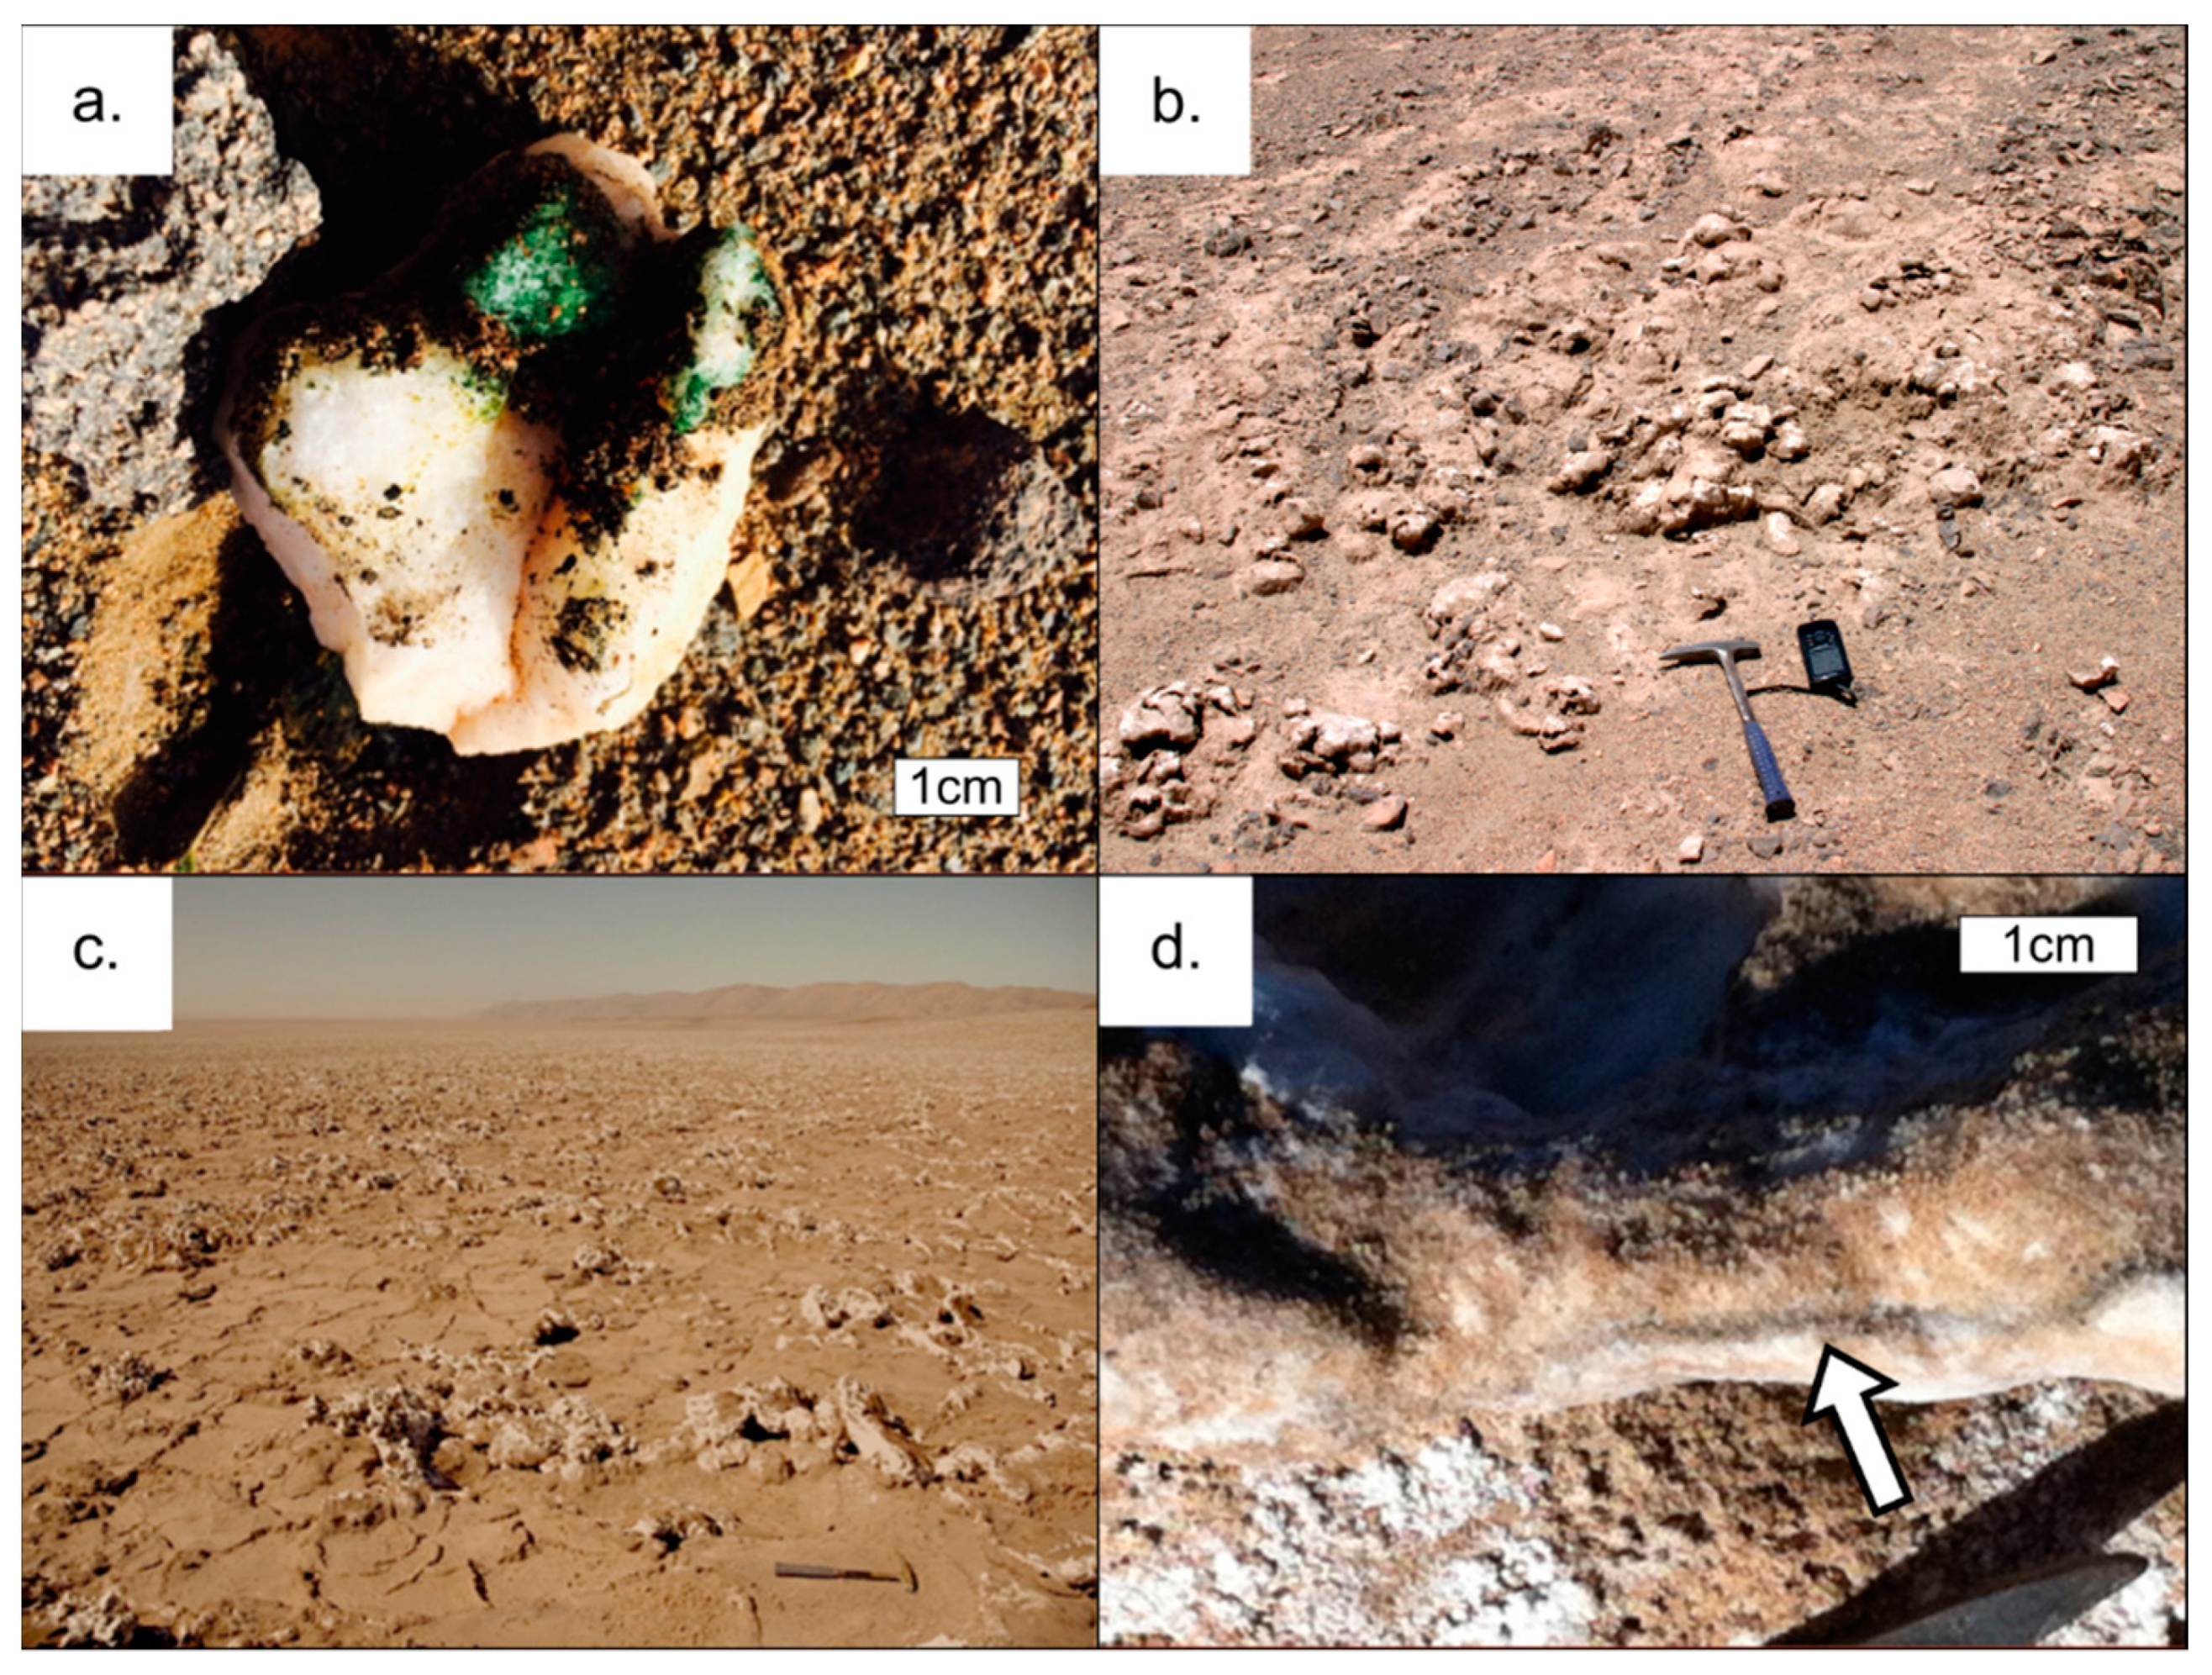
3.1. Field Scanning and Mineralogical Results of Sampling Sites
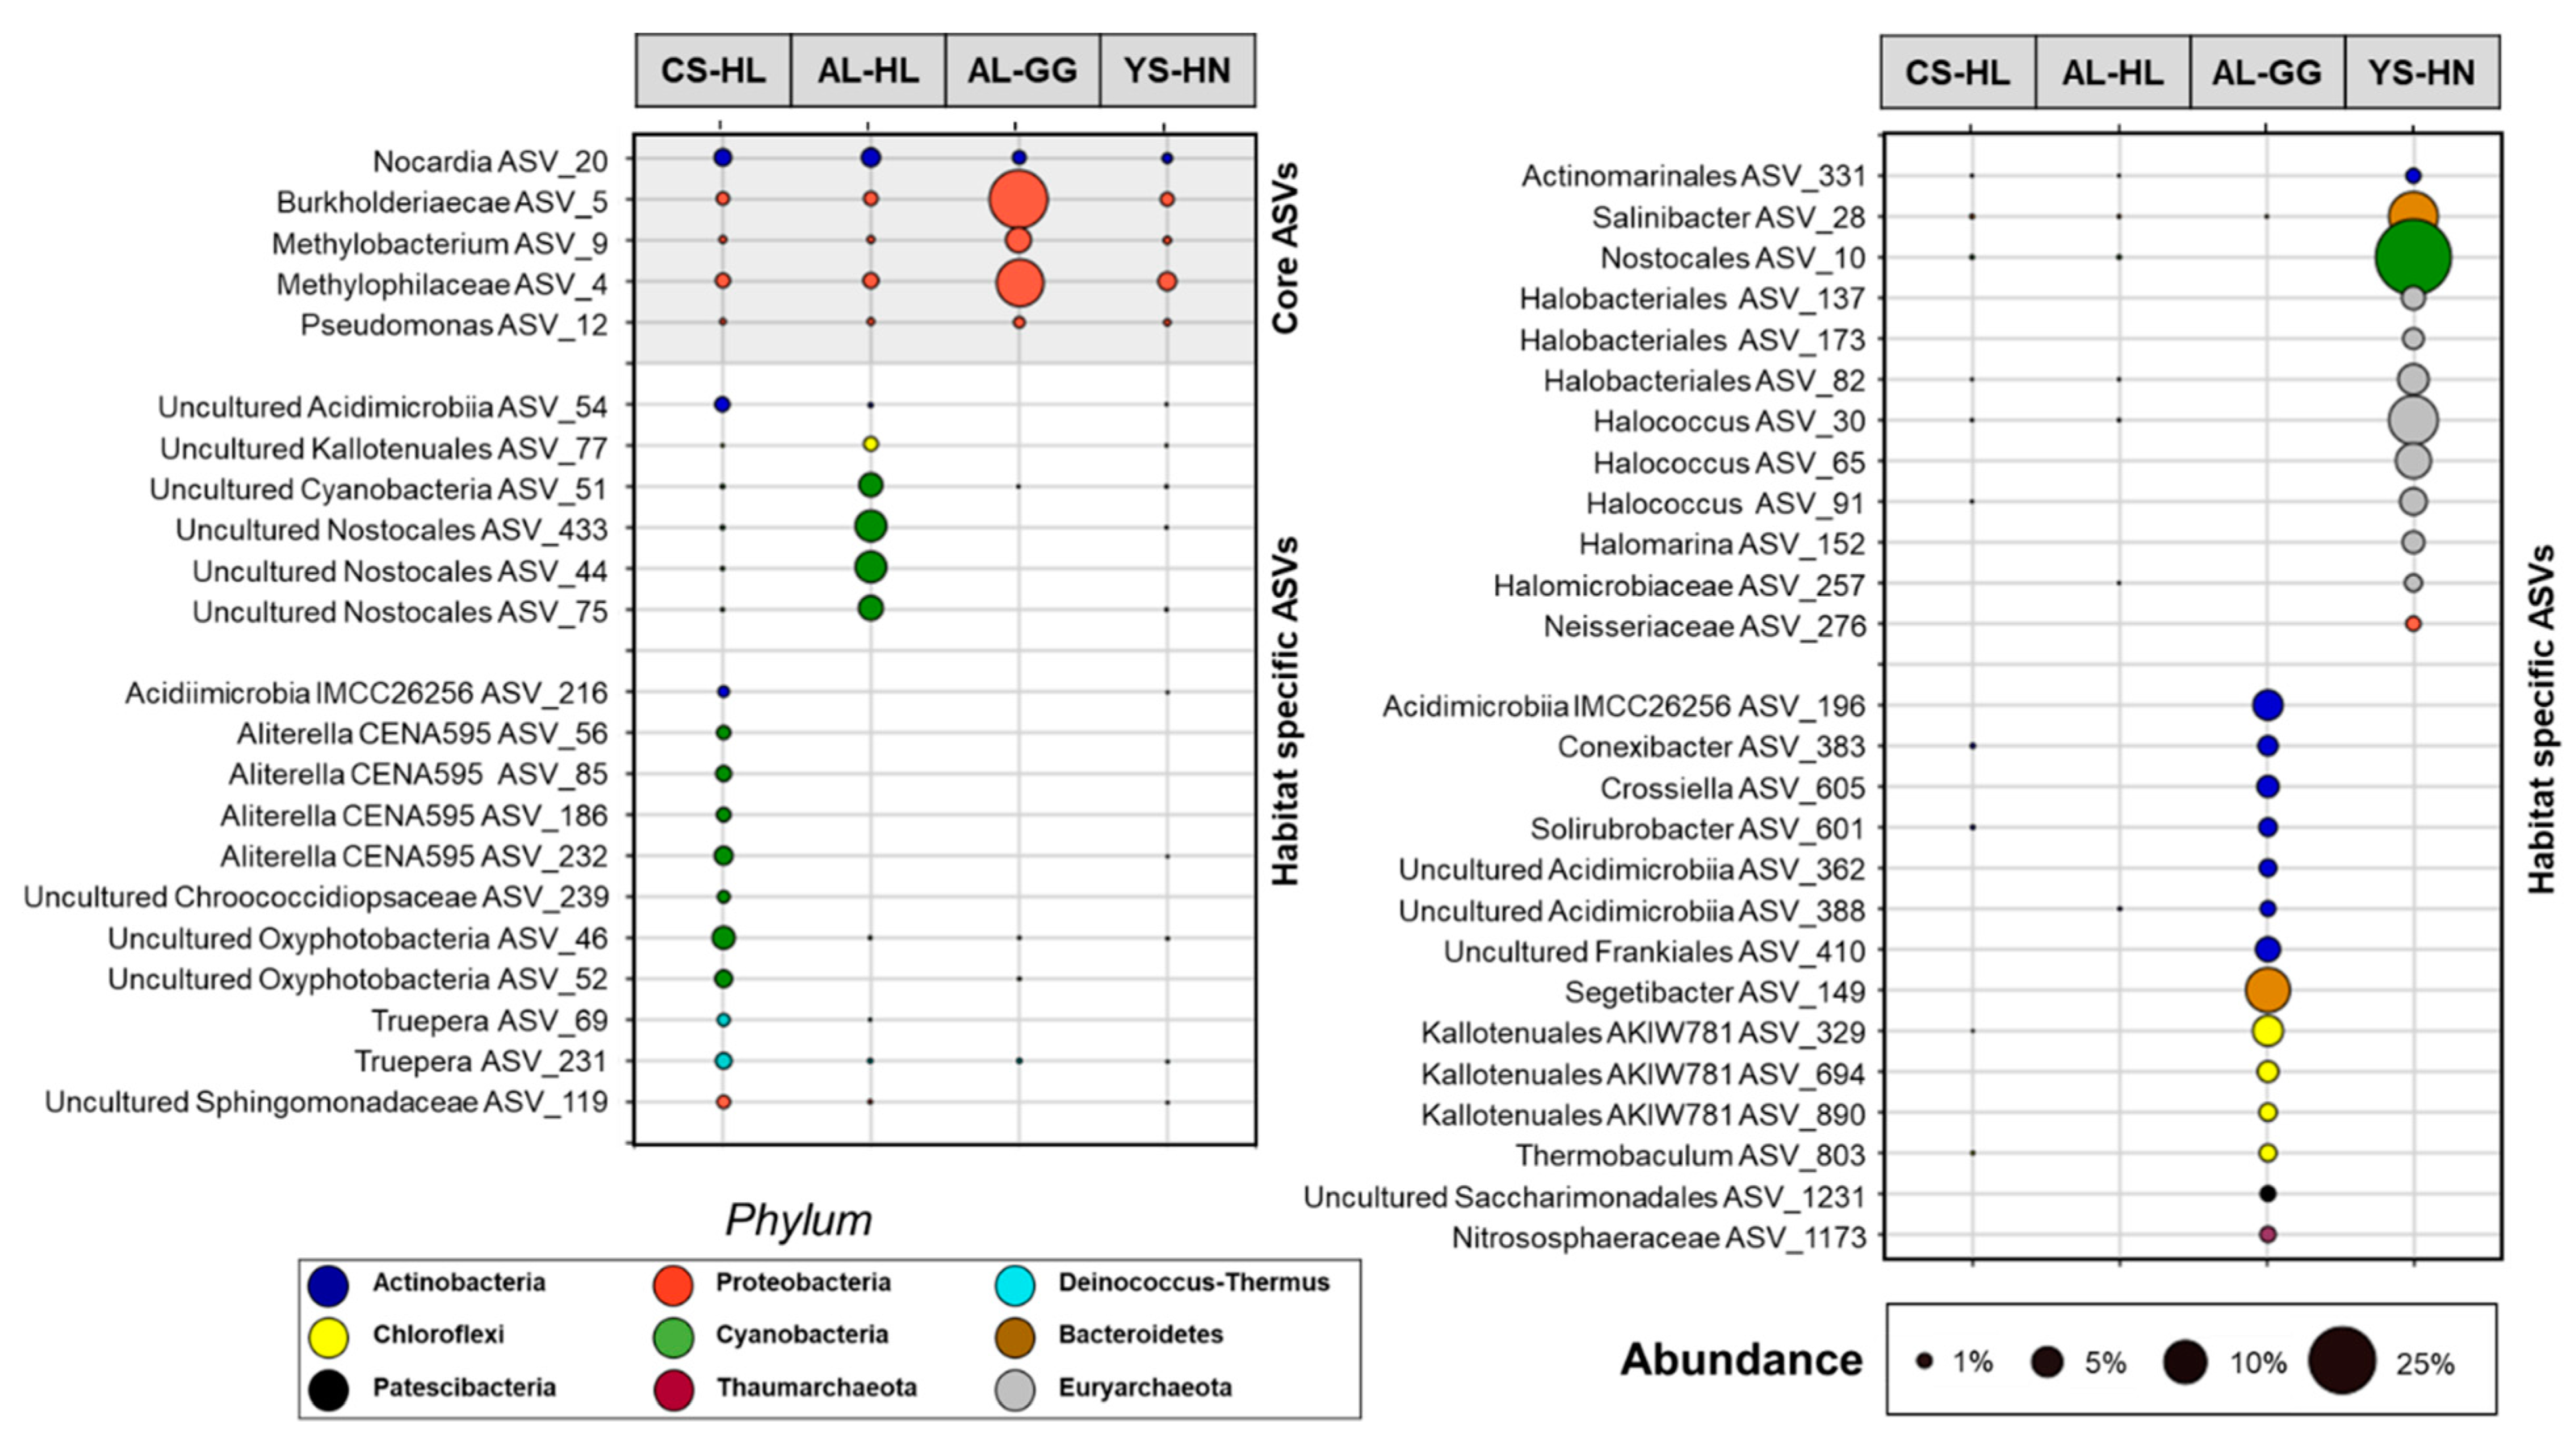
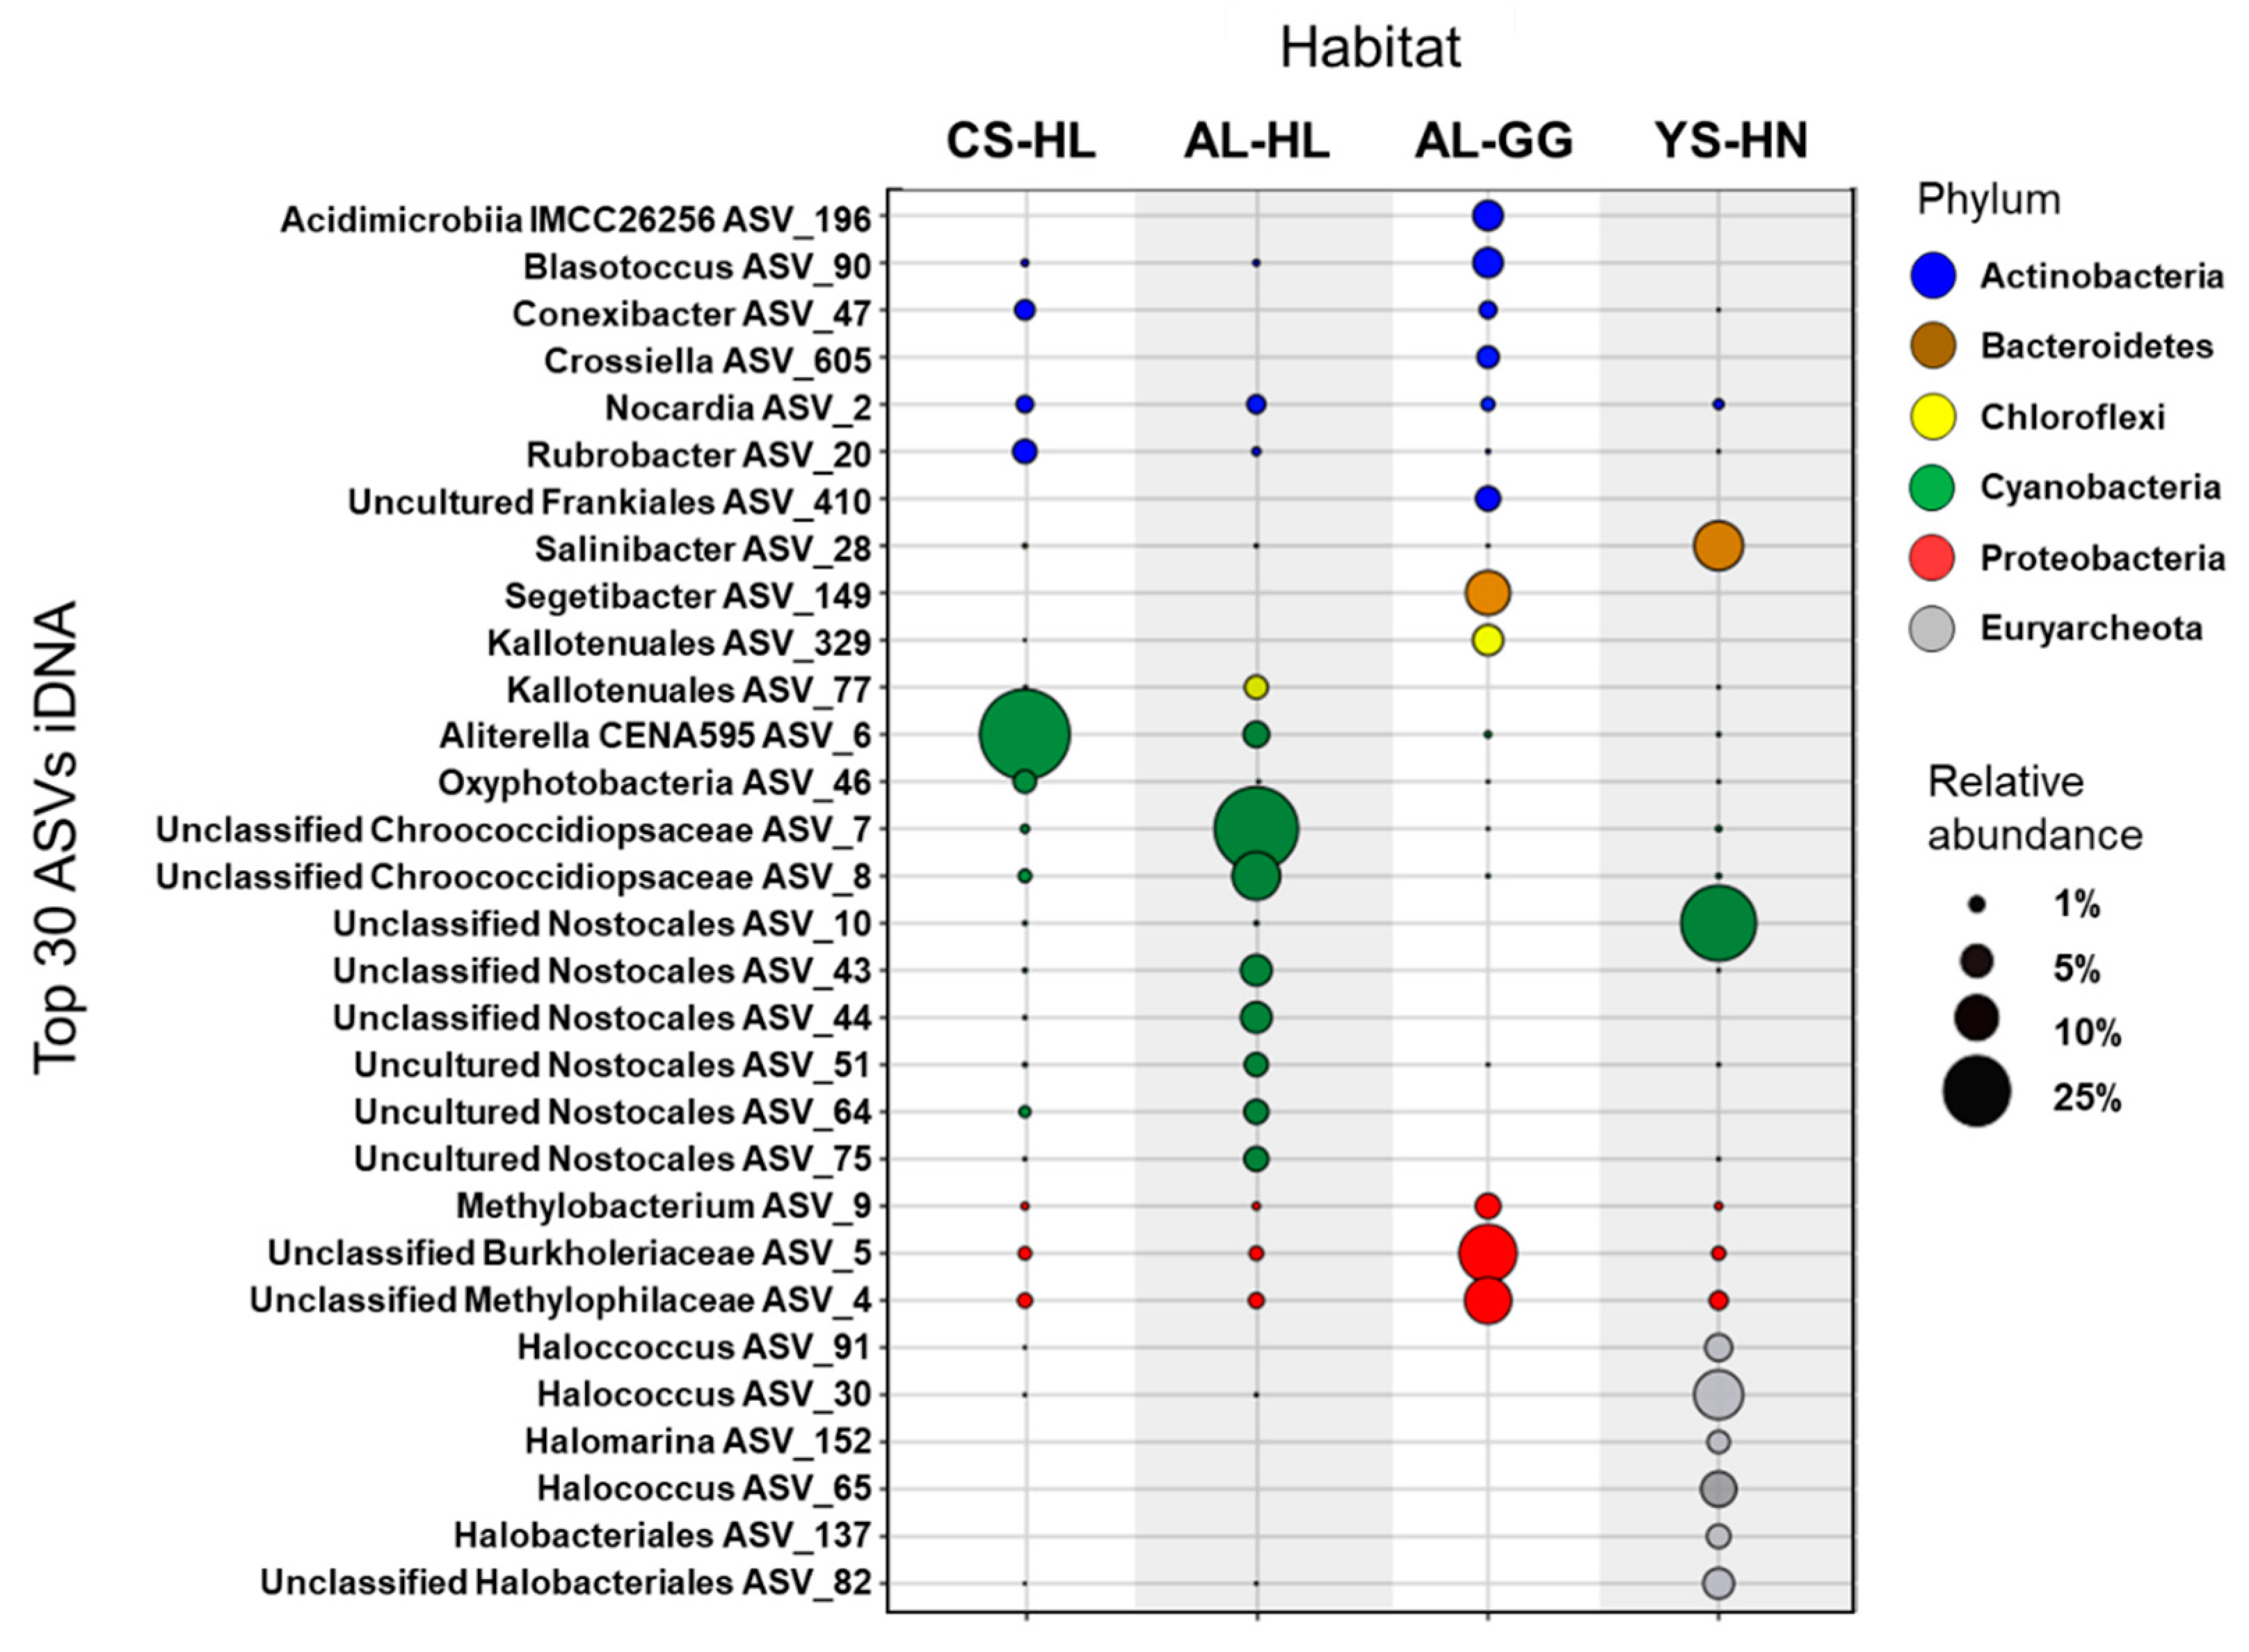
3.2. Composition of the Microbial Community Based on e- and iDNA Analyses
3.3. Active Microbial Community Based on iDNA Pool Evaluation
3.4. Genome-Resolved Metagenomics
3.5. ATP
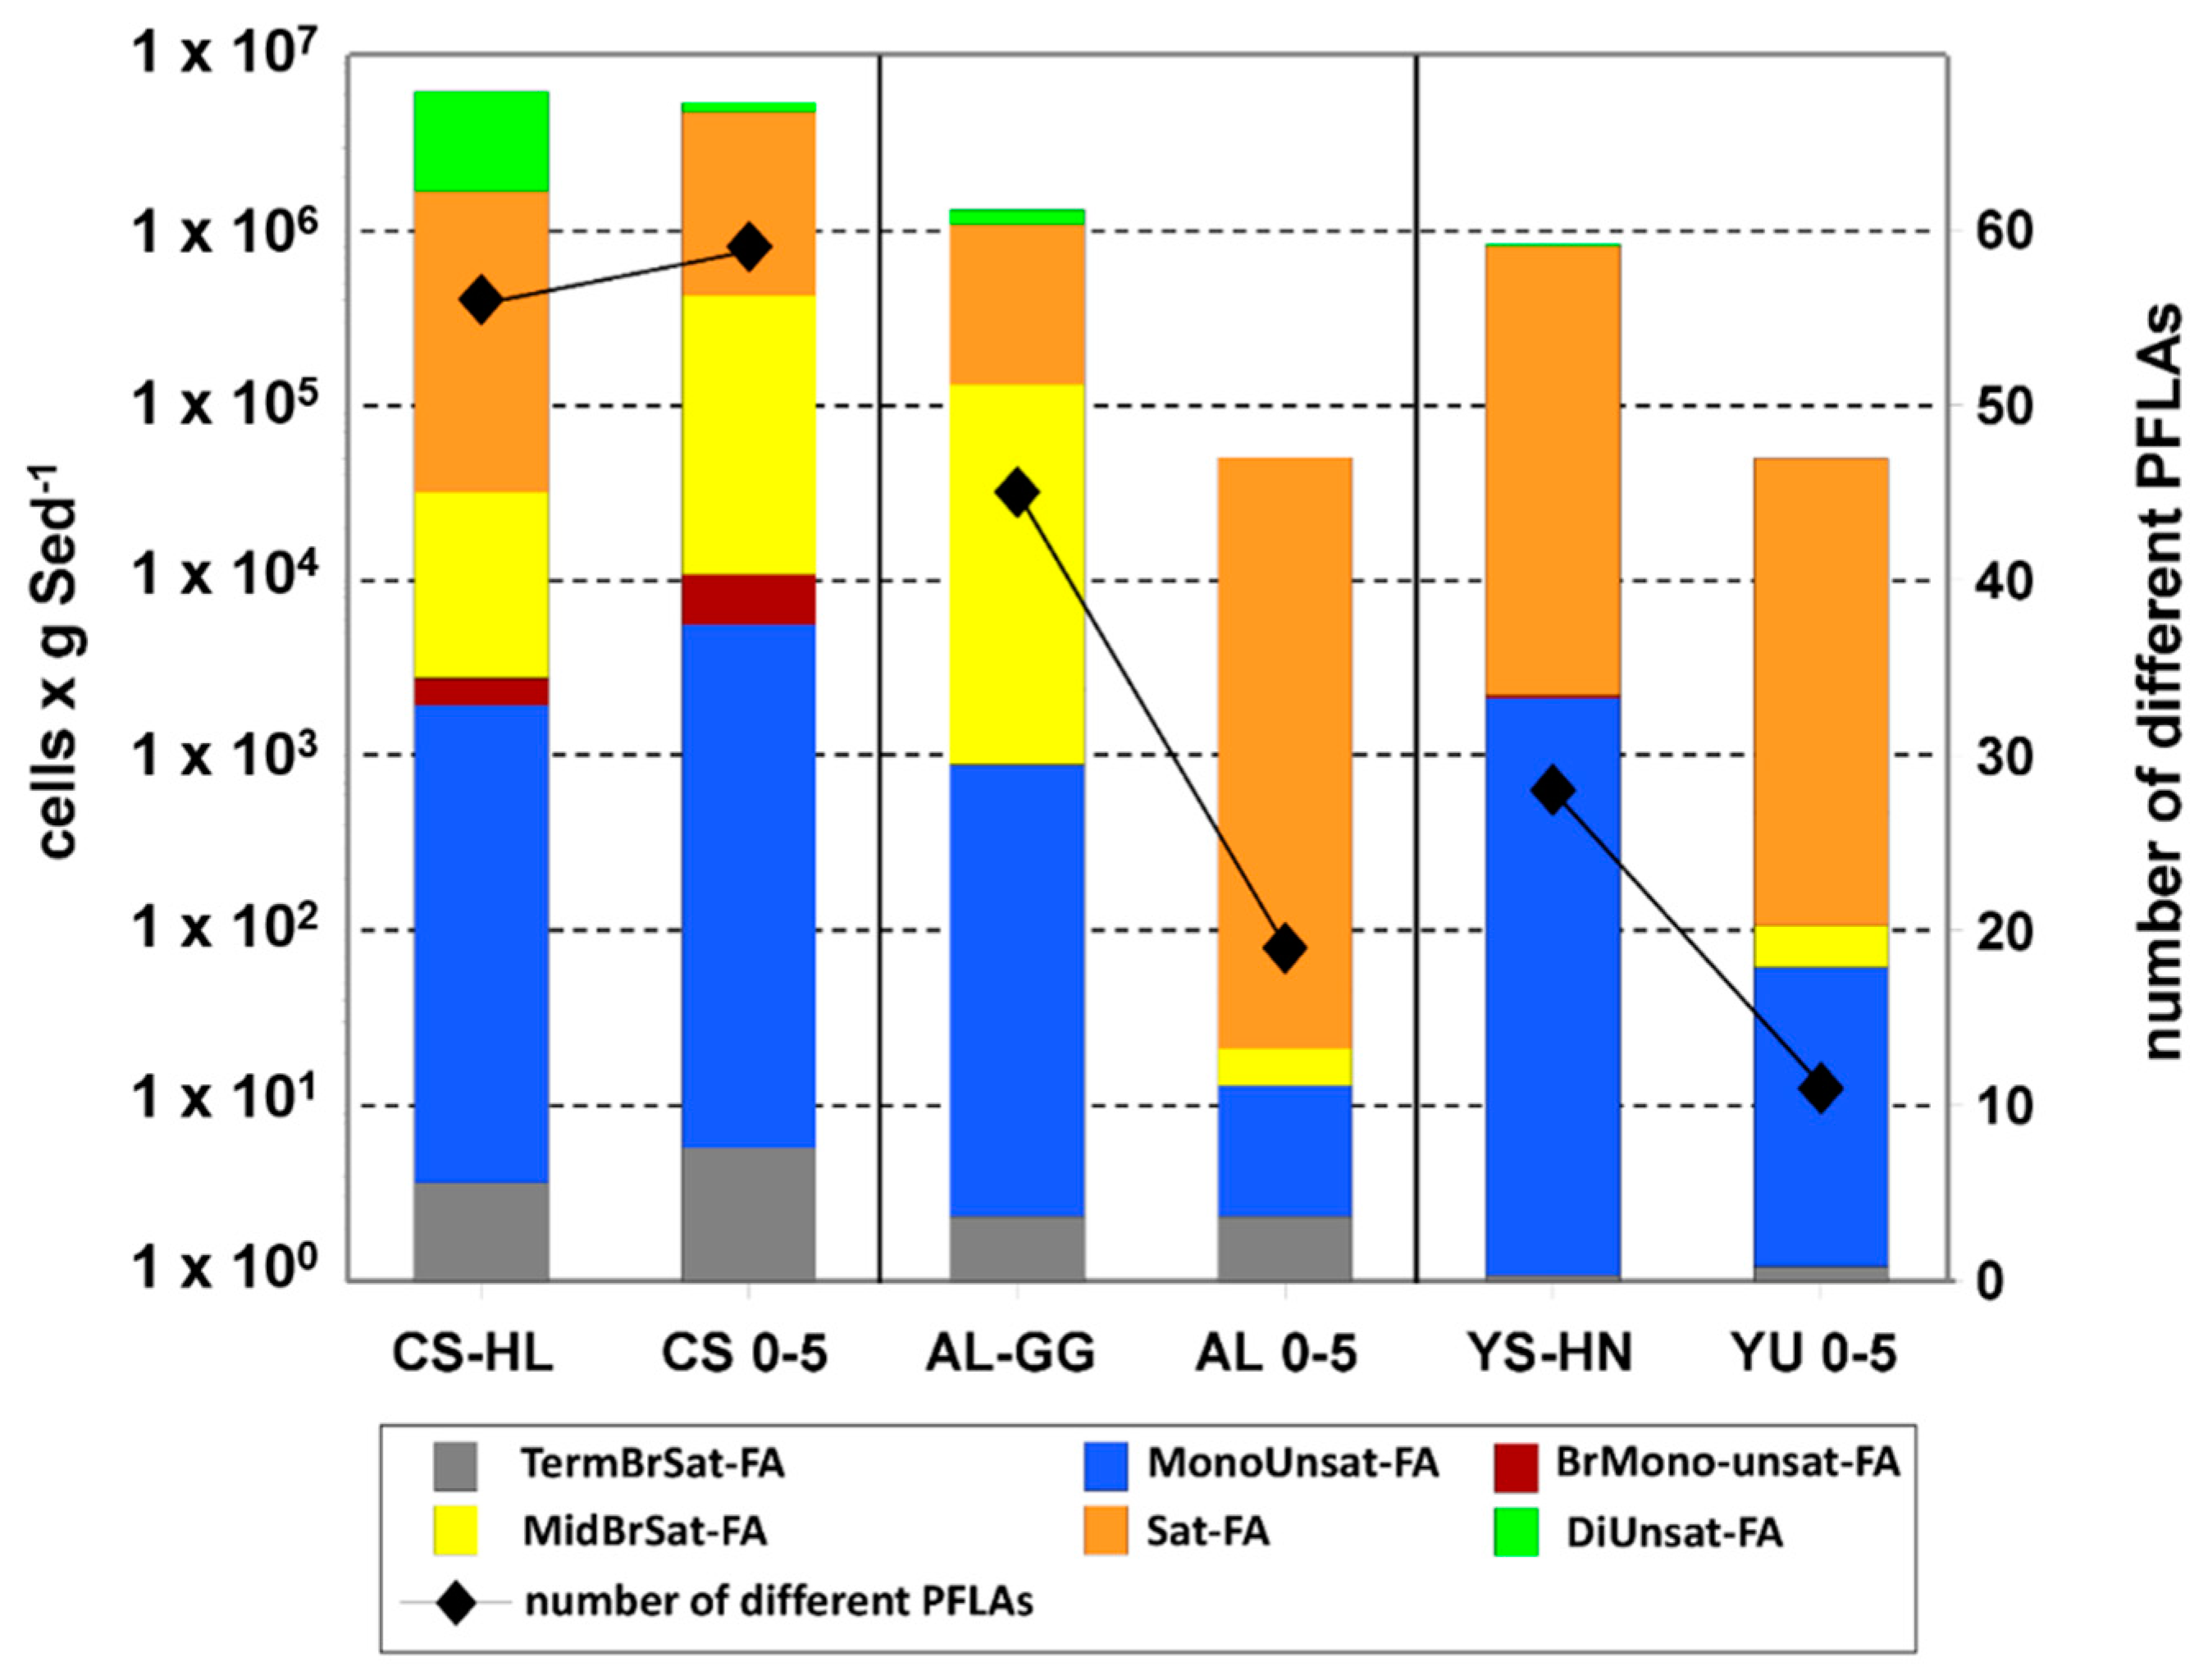
3.6. PLFA
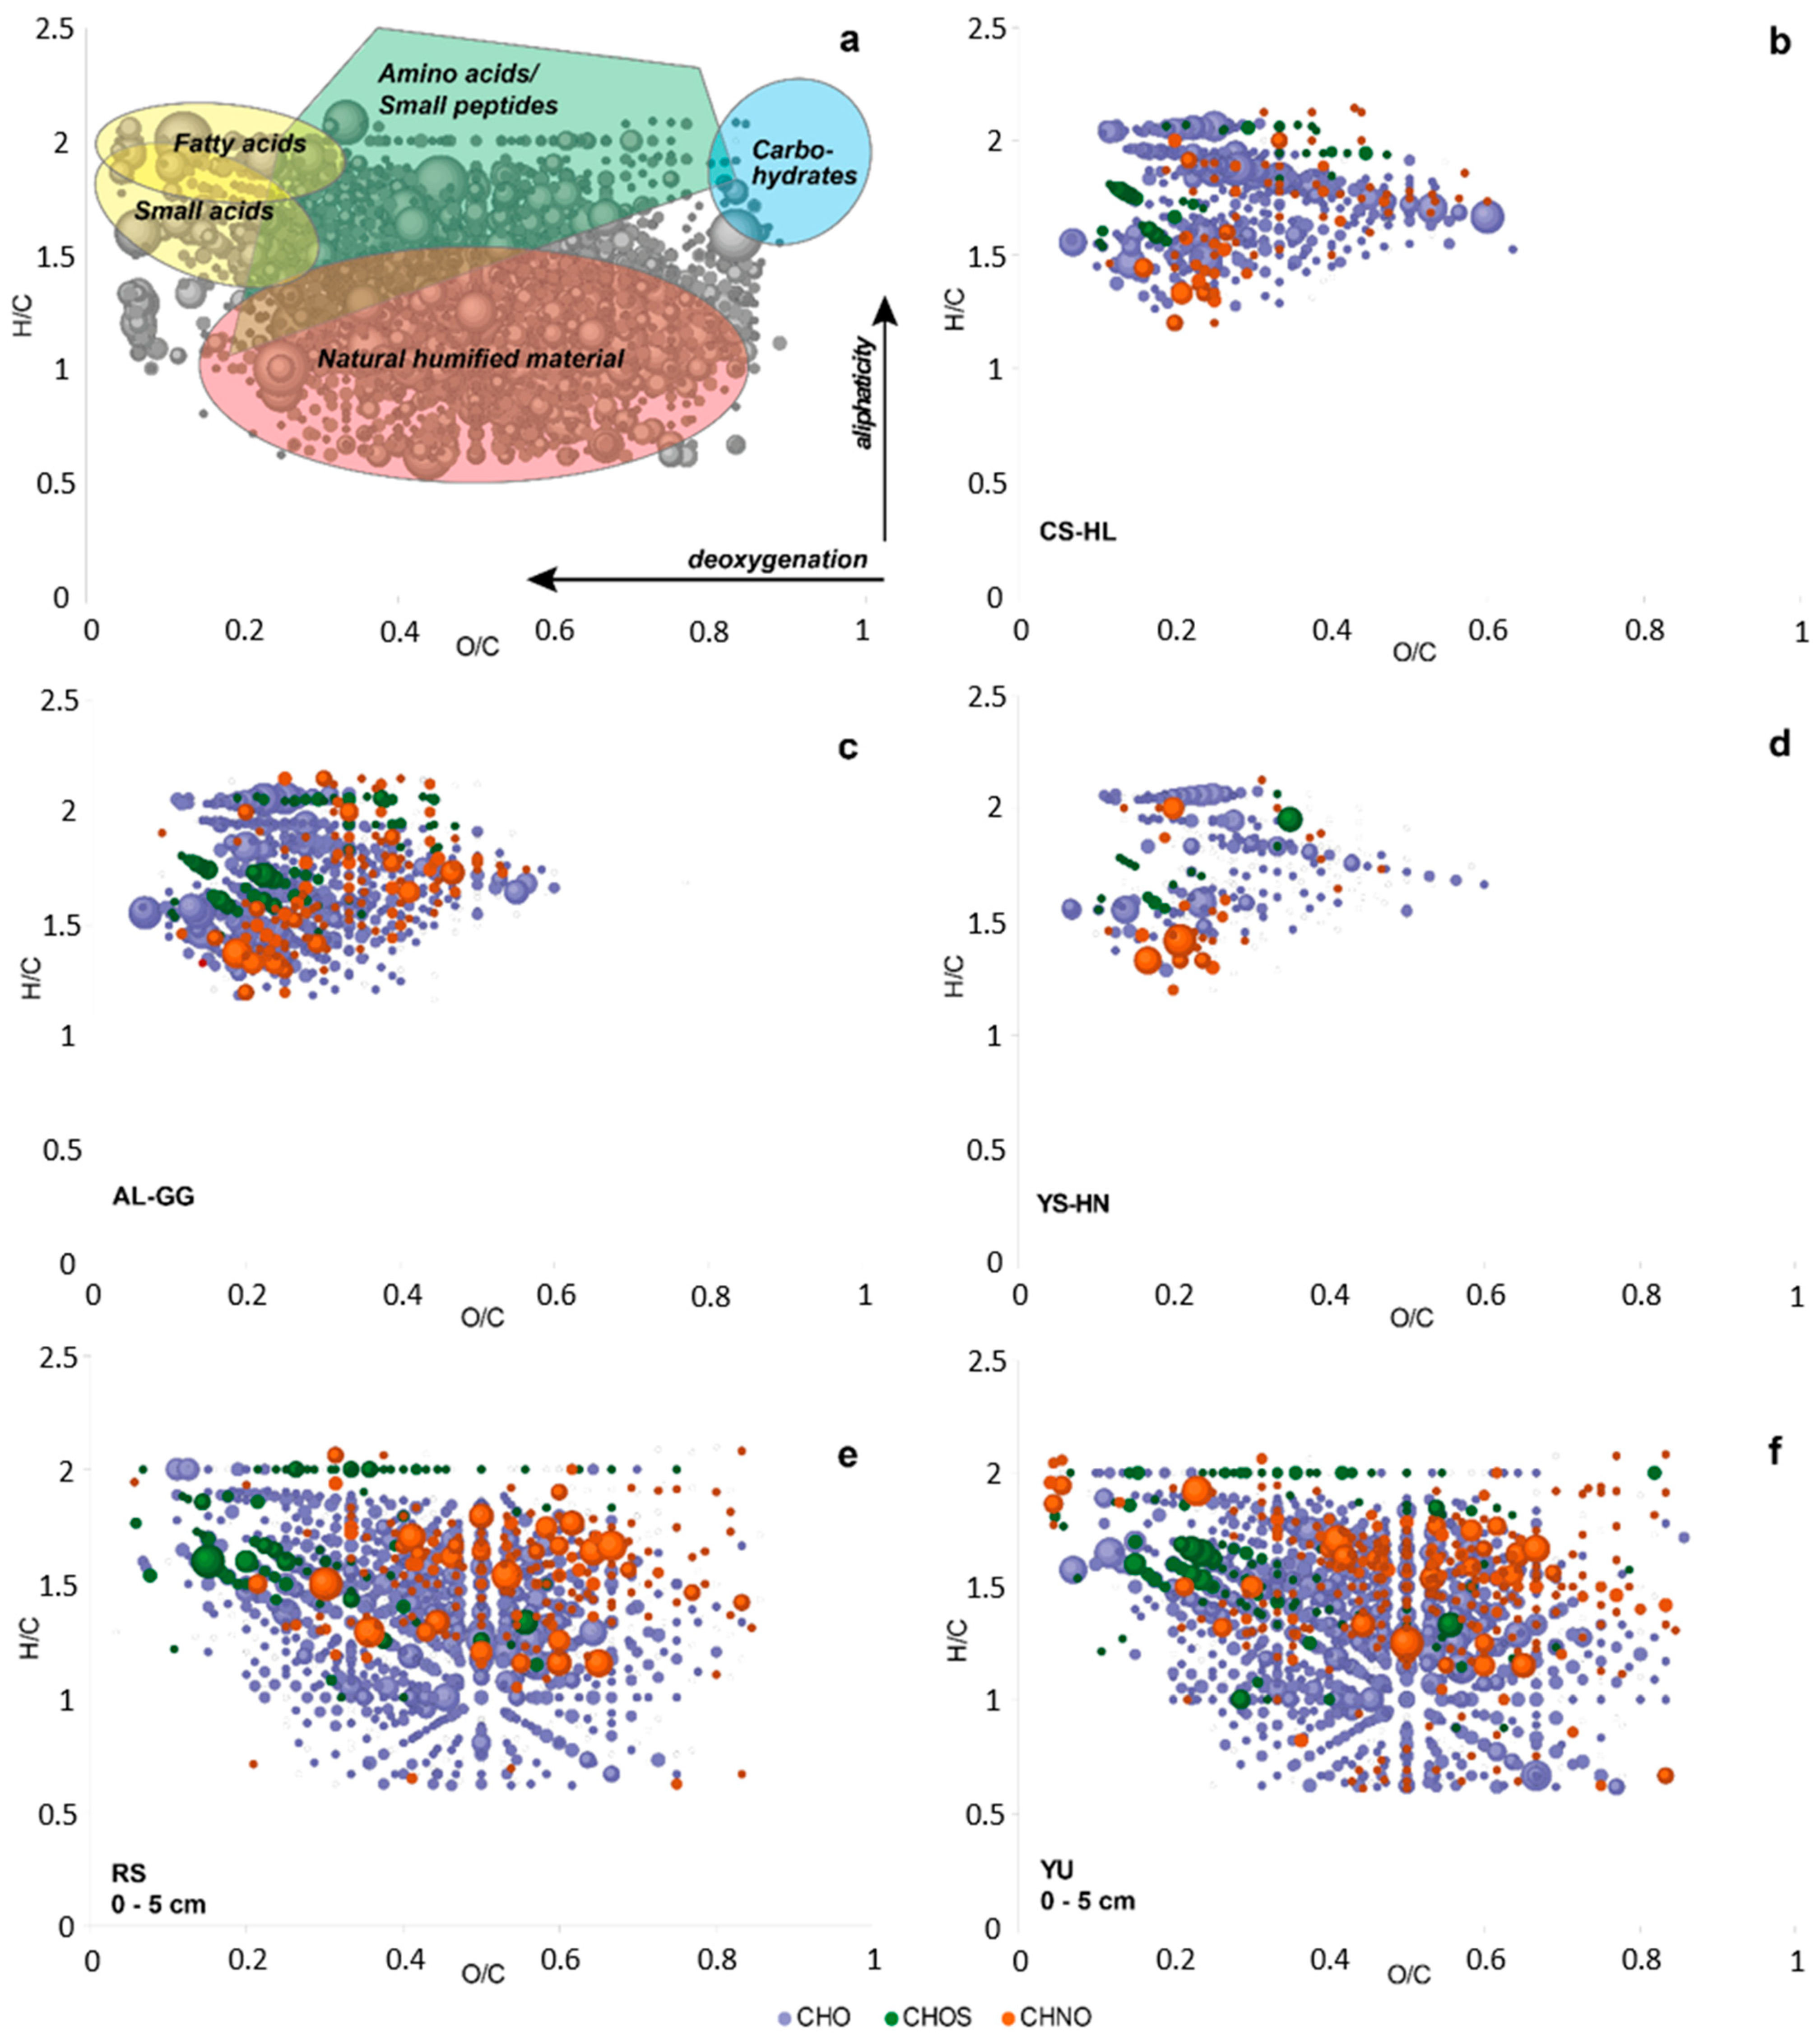
3.7. Metabolites
4. Discussion
4.1. Aridity and Habitat Type Drive Microbial Ecology and Biomass Turnover
4.2. Cyanobacteria, Particularly Chroococcidiopsis, Play an Important Role as Primary Producers in the Atacama Desert Ecosystem
4.3. The Atacama Desert Harbors Unique Hotspots of Microbial Life
5. Conclusions
Supplementary Materials
Author Contributions
Funding
Institutional Review Board Statement
Informed Consent Statement
Data Availability Statement
Acknowledgments
Conflicts of Interest
References
- Shi, A.; Chakrawal, A.; Manzoni, S.; Fischer, B.M.C.; Nunan, N.; Herrmann, A.M. Substrate spatial heterogeneity reduces soil microbial activity. Soil Biol. Biochem. 2021, 152, 108068. [Google Scholar] [CrossRef]
- Leon, E.; Vargas, R.; Bullock, S.; Lopez, E.; Panosso, A.R.; La Scala, N. Hot spots, hot moments, and spatio-temporal controls on soil CO2 efflux in a water-limited ecosystem. Soil Biol. Biochem. 2014, 77, 12–21. [Google Scholar] [CrossRef]
- Vidon, P.; Allan, C.; Burns, D.; Duval, T.P.; Gurwick, N.; Inamdar, S.; Lowrance, R.; Okay, J.; Scott, D.; Sebestyen, S. Hot spots and hot moments in riparian zones: Potential for improved water quality management 1. Jawra J. Am. Water Resour. Assoc. 2010, 46, 278–298. [Google Scholar] [CrossRef]
- Kuzyakov, Y.; Blagodatskaya, E. Microbial hotspots and hot moments in soil: Concept & review. Soil Biol. Biochem. 2015, 83, 184–199. [Google Scholar]
- Wierzchos, J.; Casero, M.C.; Artieda, O.; Ascaso, C. Endolithic microbial habitats as refuges for life in polyextreme environment of the Atacama Desert. Curr. Opin. Microbiol. 2018, 43, 124–131. [Google Scholar] [CrossRef]
- Azua-Bustos, A.; Caro-Lara, L.; Vicuña, R. Discovery and microbial content of the driest site of the hyperarid Atacama Desert, Chile. Environ. Microbiol. Rep. 2015, 7, 388–394. [Google Scholar] [CrossRef]
- Parro, V.; de Diego-Castilla, G.; Moreno-Paz, M.; Blanco, Y.; Cruz-Gil, P.; Rodríguez-Manfredi, J.A.; Fernández-Remolar, D.; Gómez, F.; Gómez, M.J.; Rivas, L.A.; et al. A microbial oasis in the hypersaline Atacama subsurface discovered by a life detector chip: Implications for the search for life on Mars. Astrobiology 2011, 11, 969–996. [Google Scholar] [CrossRef] [PubMed]
- Quade, J.; Rech, J.A.; Latorre, C.; Betancourt, J.L.; Gleeson, E.; Kalin, M.T.K. Soils at the hyperarid margin: The isotopic composition of soil carbonate from the Atacama Desert, Northern Chile. Geochim. Cosmochim. Acta 2007, 71, 3772–3795. [Google Scholar] [CrossRef]
- Navarro-González, R.; Rainey, F.A.; Molina, P.; Bagaley, D.R.; Hollen, B.J.; de La Rosa, J.; Small, A.M.; Quinn, R.C.; Grunthaner, F.J.; Cáceres, L.; et al. Mars-like soils in the Atacama Desert, Chile, and the dry limit of microbial life. Science 2003, 302, 1018–1021. [Google Scholar] [CrossRef] [Green Version]
- Genderjahn, S.; Lewin, S.; Horn, F.; Schleicher, A.M.; Mangelsdorf, K.; Wagner, D. Living Lithic and Sublithic Bacterial Communities in Namibian Drylands. Microorganisms 2021, 9. [Google Scholar] [CrossRef]
- Crits-Christoph, A.; Robinson, C.K.; Ma, B.; Ravel, J.; Wierzchos, J.; Ascaso, C.; Artieda, O.; Souza-Egipsy, V.; Casero, M.C.; DiRuggiero, J. Phylogenetic and functional substrate specificity for endolithic microbial communities in hyper-arid environments. Front. Microbiol. 2016, 7, 301. [Google Scholar] [CrossRef] [Green Version]
- Crits-Christoph, A.; Gelsinger, D.R.; Ma, B.; Wierzchos, J.; Ravel, J.; Davila, A.; Casero, M.C.; DiRuggiero, J. Functional interactions of archaea, bacteria and viruses in a hypersaline endolithic community. Environ. Microbiol. 2016, 18, 2064–2077. [Google Scholar] [CrossRef] [PubMed]
- Meslier, V.; Casero, M.C.; Dailey, M.; Wierzchos, J.; Ascaso, C.; Artieda, O.; McCullough, P.R.; DiRuggiero, J. Fundamental drivers for endolithic microbial community assemblies in the hyperarid Atacama Desert. Environ. Microbiol. 2018, 20, 1765–1781. [Google Scholar] [CrossRef] [Green Version]
- Connon, S.A.; Lester, E.D.; Shafaat, H.S.; Obenhuber, D.C.; Ponce, A. Bacterial diversity in hyperarid Atacama Desert soils. J. Geophys. Res. 2007, 112. [Google Scholar] [CrossRef]
- Wierzchos, J.; Ascaso, C.; McKay, C.P. Endolithic cyanobacteria in halite rocks from the hyperarid core of the Atacama Desert. Astrobiology 2006, 6, 415–422. [Google Scholar] [CrossRef] [PubMed]
- Drees, K.P.; Neilson, J.W.; Betancourt, J.L.; Quade, J.; Henderson, D.A.; Pryor, B.M.; Maier, R.M. Bacterial community structure in the hyperarid core of the Atacama Desert, Chile. Appl. Environ. Microbiol. 2006, 72, 7902–7908. [Google Scholar] [CrossRef] [Green Version]
- Walker, J.J.; Pace, N.R. Endolithic microbial ecosystems. Annu. Rev. Microbiol. 2007, 61, 331–347. [Google Scholar] [CrossRef]
- Pointing, S.B.; Belnap, J. Microbial colonization and controls in dryland systems. Nat. Rev. Microbiol. 2012, 10, 551–562. [Google Scholar] [CrossRef]
- Azua-Bustos, A.; Fairén, A.G.; Silva, C.G.; Carrizo, D.; Fernández-Martínez, M.Á.; Arenas-Fajardo, C.; Fernández-Sampedro, M.; Gil-Lozano, C.; Sánchez-García, L.; Ascaso, C.; et al. Inhabited subsurface wet smectites in the hyperarid core of the Atacama Desert as an analog for the search for life on Mars. Sci. Rep. 2020, 10, 19183. [Google Scholar] [CrossRef]
- Mörchen, R.; Lehndorff, E.; Diaz, F.A.; Moradi, G.; Bol, R.; Fuentes, B.; Klumpp, E.; Amelung, W. Carbon accrual in the Atacama Desert. Glob. Planet. Chang. 2019, 181, 102993. [Google Scholar] [CrossRef]
- DiRuggiero, J.; Wierzchos, J.; Robinson, C.K.; Souterre, T.; Ravel, J.; Artieda, O.; Souza-Egipsy, V.; Ascaso, C. Microbial colonisation of chasmoendolithic habitats in the hyper-arid zone of the Atacama Desert. Biogeosciences 2013, 10, 2439–2450. [Google Scholar] [CrossRef] [Green Version]
- Orlando, J.; Carú, M.; Pommerenke, B.; Braker, G. Diversity and activity of denitrifiers of Chilean arid soil ecosystems. Front. Microbiol. 2012, 3, 101. [Google Scholar] [CrossRef] [PubMed] [Green Version]
- Costello, E.K.; Halloy, S.R.P.; Reed, S.C.; Sowell, P.; Schmidt, S.K. Fumarole-supported islands of biodiversity within a hyperarid, high-elevation landscape on Socompa Volcano, Puna de Atacama, Andes. Appl. Environ. Microbiol. 2009, 75, 735–747. [Google Scholar] [CrossRef] [PubMed] [Green Version]
- Warren-Rhodes, K.A.; Dungan, J.L.; Piatek, J.; Stubbs, K.; Gómez-Silva, B.; Chen, Y.; McKay, C.P. Ecology and spatial pattern of cyanobacterial community island patches in the Atacama Desert, Chile. J. Geophys. Res. 2007, 112. [Google Scholar] [CrossRef] [Green Version]
- Warren-Rhodes, K.A.; Rhodes, K.L.; Pointing, S.B.; Ewing, S.A.; Lacap, D.C.; Gómez-Silva, B.; Amundson, R.; Friedmann, E.I.; McKay, C.P. Hypolithic cyanobacteria, dry limit of photosynthesis, and microbial ecology in the hyperarid Atacama Desert. Microb. Ecol. 2006, 52, 389–398. [Google Scholar] [CrossRef] [PubMed]
- Schulze-Makuch, D.; Wagner, D.; Kounaves, S.P.; Mangelsdorf, K.; Devine, K.G.; de Vera, J.-P.; Schmitt-Kopplin, P.; Grossart, H.-P.; Parro, V.; Kaupenjohann, M.; et al. Transitory microbial habitat in the hyperarid Atacama Desert. Proc. Natl. Acad. Sci. USA 2018, 115, 2670–2675. [Google Scholar] [CrossRef] [Green Version]
- Lehnert, L.; Jung, P.; Obermeier, W.; Büdel, B.; Bendix, J. Estimating net photosynthesis of biological soil crusts in the atacama using hyperspectral remote sensing. Remote Sens. 2018, 10, 891. [Google Scholar] [CrossRef] [Green Version]
- Vítek, P.; Ascaso, C.; Artieda, O.; Wierzchos, J. Raman imaging in geomicrobiology: Endolithic phototrophic microorganisms in gypsum from the extreme sun irradiation area in the Atacama Desert. Anal. Bioanal. Chem. 2016, 408, 4083–4092. [Google Scholar] [CrossRef]
- Lacap, D.C.; Warren-Rhodes, K.A.; McKay, C.P.; Pointing, S.B. Cyanobacteria and chloroflexi-dominated hypolithic colonization of quartz at the hyper-arid core of the Atacama Desert, Chile. Extremophiles 2011, 15, 31–38. [Google Scholar] [CrossRef] [Green Version]
- Davila, A.F.; Hawes, I.; Ascaso, C.; Wierzchos, J. Salt deliquescence drives photosynthesis in the hyperarid A tacama D esert. Environ. Microbiol. Rep. 2013, 5, 583–587. [Google Scholar] [CrossRef]
- Huang, W.; Ertekin, E.; Wang, T.; Cruz, L.; Dailey, M.; DiRuggiero, J.; Kisailus, D. Mechanism of water extraction from gypsum rock by desert colonizing microorganisms. Proc. Natl. Acad. Sci. USA 2020, 117, 10681–10687. [Google Scholar] [CrossRef]
- Wierzchos, J.; DiRuggiero, J.; Vítek, P.; Artieda, O.; Souza-Egipsy, V.; Škaloud, P.; Tisza, M.; Davila, A.F.; Vílchez, C.; Garbayo, I.; et al. Adaptation strategies of endolithic chlorophototrophs to survive the hyperarid and extreme solar radiation environment of the Atacama Desert. Front. Microbiol. 2015, 6, 934. [Google Scholar] [CrossRef] [PubMed] [Green Version]
- Wierzchos, J.; de los Ríos, A.; Ascaso, C. Microorganisms in desert rocks: The edge of life on Earth. Int. Microbiol. 2012, 15, 173–183. [Google Scholar] [CrossRef] [PubMed] [Green Version]
- Dong, H.; Rech, J.A.; Jiang, H.; Sun, H.; Buck, B.J. Endolithic cyanobacteria in soil gypsum: Occurrences in Atacama (Chile), Mojave (United States), and Al-Jafr Basin (Jordan) Deserts. J. Geophys. Res. 2007. [Google Scholar] [CrossRef] [Green Version]
- Garcia-Pichel, F.; López-Cortés, A.; Nübel, U. Phylogenetic and morphological diversity of cyanobacteria in soil desert crusts from the Colorado plateau. Appl. Environ. Microbiol. 2001, 67, 1902–1910. [Google Scholar] [CrossRef] [Green Version]
- Alawi, M.; Schneider, B.; Kallmeyer, J. A procedure for separate recovery of extra- and intracellular DNA from a single marine sediment sample. J. Microbiol. Methods 2014, 104, 36–42. [Google Scholar] [CrossRef]
- Vuillemin, A.; Horn, F.; Alawi, M.; Henny, C.; Wagner, D.; Crowe, S.A.; Kallmeyer, J. Preservation and significance of extracellular DNA in ferruginous sediments from Lake Towuti, Indonesia. Front. Microbiol. 2017, 8, 1440. [Google Scholar] [CrossRef] [PubMed] [Green Version]
- De Vera, J.-P.; Schulze-Makuch, D.; Khan, A.; Lorek, A.; Koncz, A.; Möhlmann, D.; Spohn, T. Adaptation of an Antarctic lichen to Martian niche conditions can occur within 34 days. Planet. Space Sci. 2014, 98, 182–190. [Google Scholar] [CrossRef] [Green Version]
- De La Torre, R.; Sancho, L.G.; Horneck, G.; de los Rios, A.; Wierzchos, J.; Olsson-Francis, K.; Cockell, C.S.; Rettberg, P.; Berger, T.; de Vera, J.-P.P.; et al. Survival of lichens and bacteria exposed to outer space conditions-results of the Lithopanspermia experiments. Icarus 2010, 208, 735–748. [Google Scholar] [CrossRef]
- Ben-Haim, Y.; Banim, E.; Kushmaro, A.; Loya, Y.; Rosenberg, E. Inhibition of photosynthesis and bleaching of zooxanthellae by the coral pathogen Vibrio shiloi. Environ. Microbiol. 1999, 1, 223–229. [Google Scholar] [CrossRef]
- Nadkarni, M.A.; Martin, F.E.; Jacques, N.A.; Hunter, N. Determination of bacterial load by real-time PCR using a broad-range (universal) probe and primers set. Microbiology 2002, 148, 257–266. [Google Scholar] [CrossRef] [PubMed] [Green Version]
- Martin, M. Cutadapt removes adapter sequences from high-throughput sequencing reads. Embnet. J. 2011, 17, 10–12. [Google Scholar] [CrossRef]
- Callahan, B.J.; McMurdie, P.J.; Rosen, M.J.; Han, A.W.; Johnson, A.J.A.; Holmes, S.P. DADA2: High-resolution sample inference from Illumina amplicon data. Nat. Methods 2016, 13, 581–583. [Google Scholar] [CrossRef] [Green Version]
- Quast, C.; Pruesse, E.; Yilmaz, P.; Gerken, J.; Schweer, T.; Yarza, P.; Peplies, J.; Glöckner, F.O. The SILVA ribosomal RNA gene database project: Improved data processing and web-based tools. Nucl. Res. 2012, 41, D590–D596. [Google Scholar] [CrossRef] [PubMed]
- Rognes, T.; Flouri, T.; Nichols, B.; Quince, C.; Mahé, F. VSEARCH: A versatile open source tool for metagenomics. PeerJ 2016, 4, e2584. [Google Scholar] [CrossRef]
- Bolyen, E.; Rideout, J.R.; Dillon, M.R.; Bokulich, N.A.; Abnet, C.; Al-Ghalith, G.A.; Alexander, H.; Alm, E.J.; Arumugam, M.; Asnicar, F. QIIME 2: Reproducible, interactive, scalable, and extensible microbiome data science. PeerJ 2018, 37, 852–857. [Google Scholar] [CrossRef] [PubMed]
- Saary, P.; Forslund, K.; Bork, P.; Hildebrand, F. RTK: Efficient rarefaction analysis of large datasets. Bioinformatics 2017, 33, 2594–2595. [Google Scholar] [CrossRef] [Green Version]
- Oksanen, J.; Kindt, R.; Legendre, P.; O’Hara, B.; Stevens, M.H.H.; Oksanen, M.J.; Suggests, M. The vegan package. Commun. Ecol. Package 2007, 10, 719. [Google Scholar]
- Hammer, Ø.; Harper, D.; Ryan, P. PAST—PAlaeontological STatistics, v. 1.81. Software Documentation; Paleontological Association: London, UK, 2008. Available online: http://www.snvs.msal.gov.ar/descargas/Past/past.pdf (accessed on 15 March 2021).
- R Core Team. R: A Language and Environment for Statistical Computing; R Core Team: Copenhagen, Denmark, 2013. [Google Scholar]
- Gu, Z.; Eils, R.; Schlesner, M. Complex heatmaps reveal patterns and correlations in multidimensional genomic data. Bioinformatics 2016, 32, 2847–2849. [Google Scholar] [CrossRef] [Green Version]
- Moskwa, L.-M.; Oses, R.; Wagner, D. Distribution of Microbial Generalists and Habitat Specialists in Soils along a Climate Gradient in the Chilean Coastal Cordillera; Preprint at Research Square: Durham, NC, USA, 2020. [Google Scholar]
- Töwe, S.; Wallisch, S.; Bannert, A.; Fischer, D.; Hai, B.; Haesler, F.; Kleineidam, K.; Schloter, M. Improved protocol for the simultaneous extraction and column-based separation of DNA and RNA from different soils. J. Microbiol. Methods 2011, 84, 406–412. [Google Scholar] [CrossRef]
- Nurk, S.; Meleshko, D.; Korobeynikov, A.; Pevzner, P.A. metaSPAdes: A new versatile metagenomic assembler. Genome Res. 2017, 27, 824–834. [Google Scholar] [CrossRef] [PubMed] [Green Version]
- UniProt Consortium. The universal protein resource (UniProt) in 2010. Nucl. Acids Res. 2010, 38, D142–D148. [Google Scholar] [CrossRef] [Green Version]
- Langdon, W.B. Performance of genetic programming optimised Bowtie2 on genome comparison and analytic testing (GCAT) benchmarks. Biodata Min. 2015, 8, 1. [Google Scholar] [CrossRef] [Green Version]
- Dick, G.J.; Andersson, A.F.; Baker, B.J.; Simmons, S.L.; Thomas, B.C.; Yelton, A.P.; Banfield, J.F. Community-wide analysis of microbial genome sequence signatures. Genome Biol. 2009, 10, R85. [Google Scholar] [CrossRef] [Green Version]
- Wu, Y.-W.; Simmons, B.A.; Singer, S.W. MaxBin 2.0: An automated binning algorithm to recover genomes from multiple metagenomic datasets. Bioinformatics 2016, 32, 605–607. [Google Scholar] [CrossRef] [PubMed]
- Sieber, C.M.K.; Probst, A.J.; Sharrar, A.; Thomas, B.C.; Hess, M.; Tringe, S.G.; Banfield, J.F. Recovery of genomes from metagenomes via a dereplication, aggregation and scoring strategy. Nat. Microbiol. 2018, 3, 836–843. [Google Scholar] [CrossRef] [PubMed] [Green Version]
- Brown, C.T.; Hug, L.A.; Thomas, B.C.; Sharon, I.; Castelle, C.J.; Singh, A.; Wilkins, M.J.; Wrighton, K.C.; Williams, K.H.; Banfield, J.F. Unusual biology across a group comprising more than 15% of domain Bacteria. Nature 2015, 523, 208–211. [Google Scholar] [CrossRef] [PubMed]
- Brown, C.T.; Olm, M.R.; Thomas, B.C.; Banfield, J.F. Measurement of bacterial replication rates in microbial communities. Nat. Biotechnol. 2016, 34, 1256–1263. [Google Scholar] [CrossRef] [PubMed] [Green Version]
- Parks, D.H.; Imelfort, M.; Skennerton, C.T.; Hugenholtz, P.; Tyson, G.W. CheckM: Assessing the quality of microbial genomes recovered from isolates, single cells, and metagenomes. Genome Res. 2015, 25, 1043–1055. [Google Scholar] [CrossRef] [Green Version]
- Buchfink, B.; Xie, C.; Huson, D.H. Fast and sensitive protein alignment using DIAMOND. Nat. Methods 2015, 12, 59–60. [Google Scholar] [CrossRef]
- Feldbauer, R.; Schulz, F.; Horn, M.; Rattei, T. Prediction of microbial phenotypes based on comparative genomics. BMC Bioinform. 2015, 16, S1. [Google Scholar] [CrossRef] [Green Version]
- Anantharaman, K.; Brown, C.T.; Hug, L.A.; Sharon, I.; Castelle, C.J.; Probst, A.J.; Thomas, B.C.; Singh, A.; Wilkins, M.J.; Karaoz, U.; et al. Thousands of microbial genomes shed light on interconnected biogeochemical processes in an aquifer system. Nat. Commun. 2016, 7, 1–11. [Google Scholar] [CrossRef] [PubMed]
- Couvin, D.; Bernheim, A.; Toffano-Nioche, C.; Touchon, M.; Michalik, J.; Néron, B.; Rocha, E.P.C.; Vergnaud, G.; Gautheret, D.; Pourcel, C. CRISPRCasFinder, an update of CRISRFinder, includes a portable version, enhanced performance and integrates search for Cas proteins. Nucleic Acids Res. 2018, 46, W246–W251. [Google Scholar] [CrossRef] [Green Version]
- Moller, A.G.; Liang, C. MetaCRAST: Reference-guided extraction of CRISPR spacers from unassembled metagenomes. PeerJ 2017, 5, e3788. [Google Scholar] [CrossRef] [PubMed]
- Altschul, S.F.; Gish, W.; Miller, W.; Myers, E.W.; Lipman, D.J. Basic local alignment search tool. J. Mol. Biol. 1990, 215, 403–410. [Google Scholar] [CrossRef]
- Hyatt, D.; Chen, G.-L.; Locascio, P.F.; Land, M.L.; Larimer, F.W.; Hauser, L.J. Prodigal: Prokaryotic gene recognition and translation initiation site identification. BMC Bioinform. 2010, 11, 119. [Google Scholar] [CrossRef] [Green Version]
- Jensen, S.K. Improved bligh and dyer extraction procedure. Lipid Technol. 2008, 20, 280–281. [Google Scholar] [CrossRef]
- Zink, K.-G.; Mangelsdorf, K. Efficient and rapid method for extraction of intact phospholipids from sediments combined with molecular structure elucidation using LC-ESI-MS-MS analysis. Anal. Bioanal. Chem. 2004, 380, 798–812. [Google Scholar] [CrossRef] [PubMed]
- Müller, K.D.; Husmann, H.; Nalik, H.P. A new and rapid method for the assay of bacterial fatty acids using high resolution capillary gas chromatography and trimethylsulfonium hydroxide. Zentralbl. Bakteriol. 1990, 274, 174–182. [Google Scholar] [CrossRef]
- Balkwill, D.L.; Leach, F.R.; Wilson, J.T.; McNabb, J.F.; White, D.C. Equivalence of microbial biomass measures based on membrane lipid and cell wall components, adenosine triphosphate, and direct counts in subsurface aquifer sediments. Microb. Ecol. 1988, 16, 73–84. [Google Scholar] [CrossRef]
- Tziotis, D.; Hertkorn, N.; Schmitt-Kopplin, P. Kendrick-analogous network visualisation of ion cyclotron resonance Fourier transform mass spectra: Improved options for the assignment of elemental compositions and the classification of organic molecular complexity. Eur. J. Mass Spectrom. 2011, 17, 415–421. [Google Scholar] [CrossRef]
- Pandit, S.N.; Kolasa, J.; Cottenie, K. Contrasts between habitat generalists and specialists: An empirical extension to the basic metacommunity framework. Ecology 2009, 90, 2253–2262. [Google Scholar] [CrossRef] [Green Version]
- Egas, C.; Barroso, C.; Froufe, H.J.C.; Pacheco, J.; Albuquerque, L.; da Costa, M.S. Complete genome sequence of the Radiation-Resistant bacterium Rubrobacter radiotolerans RSPS-4. Stand. Genom. Sci. 2014, 9, 1062–1075. [Google Scholar] [CrossRef] [PubMed] [Green Version]
- Le, P.T.; Makhalanyane, T.P.; Guerrero, L.D.; Vikram, S.; van de Peer, Y.; Cowan, D.A. Comparative metagenomic analysis reveals mechanisms for stress response in hypoliths from extreme hyperarid deserts. Genom. Biol. Evol. 2016, 8, 2737–2747. [Google Scholar] [CrossRef] [PubMed] [Green Version]
- Adriaenssens, E.M.; van Zyl, L.; de Maayer, P.; Rubagotti, E.; Rybicki, E.; Tuffin, M.; Cowan, D.A. Metagenomic analysis of the viral community in Namib Desert hypoliths. Environ. Microbiol. 2015, 17, 480–495. [Google Scholar] [CrossRef] [PubMed] [Green Version]
- Bahl, J.; Lau, M.C.Y.; Smith, G.J.D.; Vijaykrishna, D.; Cary, S.C.; Lacap, D.C.; Lee, C.K.; Papke, R.T.; Warren-Rhodes, K.A.; Wong, F.K.Y.; et al. Ancient origins determine global biogeography of hot and cold desert cyanobacteria. Nat. Commun. 2011, 2, 163. [Google Scholar] [CrossRef] [PubMed]
- Verseux, C.; Baqué, M.; Cifariello, R.; Fagliarone, C.; Raguse, M.; Moeller, R.; Billi, D. Evaluation of the Resistance of Chroococcidiopsis spp. to Sparsely and Densely Ionizing Irradiation. Astrobiology 2017, 17, 118–125. [Google Scholar] [CrossRef] [PubMed]
- Billi, D.; Friedmann, E.I.; Hofer, K.G.; Caiola, M.G.; Ocampo-Friedmann, R. Ionizing-radiation resistance in the desiccation-tolerant cyanobacteriumChroococcidiopsis. Appl. Environ. Microbiol. 2000, 66, 1489–1492. [Google Scholar] [CrossRef] [Green Version]
- Vikram, S.; Guerrero, L.D.; Makhalanyane, T.P.; Le, P.T.; Seely, M.; Cowan, D.A. Metagenomic analysis provides insights into functional capacity in a hyperarid desert soil niche community. Environ. Microbiol. 2016, 18, 1875–1888. [Google Scholar] [CrossRef]
- Uritskiy, G.; Getsin, S.; Munn, A.; Gomez-Silva, B.; Davila, A.; Glass, B.; Taylor, J.; DiRuggiero, J. Halophilic microbial community compositional shift after a rare rainfall in the Atacama Desert. ISME J. 2019, 13, 2737–2749. [Google Scholar] [CrossRef] [Green Version]
- Finstad, K.M.; Probst, A.J.; Thomas, B.C.; Andersen, G.L.; Demergasso, C.; Echeverría, A.; Amundson, R.G.; Banfield, J.F. Microbial community structure and the persistence of cyanobacterial populations in salt crusts of the hyperarid Atacama Desert from genome-resolved metagenomics. Front. Microbiol. 2017, 8, 1435. [Google Scholar] [CrossRef] [PubMed]
- Shimura, Y.; Hirose, Y.; Misawa, N.; Osana, Y.; Katoh, H.; Yamaguchi, H.; Kwachi, M. Comparison of the terrestrial cyanobacterium Leptolyngbya sp. NIES-2104 and the freshwater Leptolyngbya boryana PCC 6306 genomes. DNA Res. 2015, 22, 403–412. [Google Scholar] [CrossRef] [PubMed] [Green Version]
- Roux, S.; Enault, F.; Hurwitz, B.L.; Sullivan, M.B. VirSorter: Mining viral signal from microbial genomic data. PeerJ 2015, 3, e985. [Google Scholar] [CrossRef] [PubMed]
- Nayfach, S.; Camargo, A.P.; Eloe-Fadrosh, E.; Roux, S.; Kyrpides, N. CheckV: Assessing the quality of metagenome-assembled viral genomes. Nat. Biotechnol. 2020, 1–8. [Google Scholar] [CrossRef]
- White, D.C.; Davis, W.M.; Nickels, J.S.; King, J.D.; Bobbie, R.J. Determination of the sedimentary microbial biomass by extractible lipid phosphate. Oecologia 1979, 40, 51–62. [Google Scholar] [CrossRef]
- Logemann, J.; Graue, J.; Köster, J.; Engelen, B.; Rullkötter, J.; Cypionka, H. A laboratory experiment of intact polar lipid degradation in sandy sediments. Biogeosciences 2011, 8, 2547–2560. [Google Scholar] [CrossRef] [Green Version]
- Rezanka, T.; Víden, I.; Go, J.V.; Dor, I.; Dembitsky, V.M. Polar lipids and fatty acids of three wild cyanobacterial strains of the genus Chroococcidiopsis. Folia Microbiol. 2003, 48, 781–786. [Google Scholar] [CrossRef] [PubMed]
- Carreto, L.; Moore, E.; Fernanda Nobre, M.; Wait, R.; Riley, P.W.; Sharp, R.J.; da Costa, M.S. Rubrobacter xylanophilus sp- nov., a new thermophilic species isolated from a thermally polluted effluent. Int. J. Syst. Bacteriol. 1996, 46, 460–465. [Google Scholar] [CrossRef]
- Jones, S.E.; Lennon, J.T. Dormancy contributes to the maintenance of microbial diversity. Proc. Natl. Acad. Sci. USA 2010, 107, 5881–5886. [Google Scholar] [CrossRef] [Green Version]
- Kolter, R.; Siegele, D.A.; Tormo, A. The stationary phase of the bacterial life cycle. Annu. Rev. Microbiol. 1993, 47, 855–874. [Google Scholar] [CrossRef]
- Islam, M.R.; Schulze-Makuch, D. Adaptations to environmental extremes by multicellular organisms. Int. J. Astrobiol. 2007, 6, 199–215. [Google Scholar] [CrossRef]
- McSorley, R. Adaptations of nematodes to environmental extremes. Fla. Entomol. 2003, 86, 138–142. [Google Scholar] [CrossRef]
- Rigonato, J.; Gama, W.A.; Alvarenga, D.O.; Branco, L.H.Z.; Brandini, F.P.; Genuario, D.B.; Fiore, M.F. Aliterella atlantica gen. nov., sp. nov., and Aliterella antarctica sp. nov., novel members of coccoid Cyanobacteria. Int. J. Syst. Evol. Microbiol. 2016, 66, 2853–2861. [Google Scholar] [CrossRef] [Green Version]
- Chan, Y.; Lacap, D.C.; Lau, M.C.Y.; Ha, K.Y.; Warren-Rhodes, K.A.; Cockell, C.S.; Cowan, D.A.; McKay, C.P.; Pointing, S.B. Hypolithic microbial communities: Between a rock and a hard place. Environ. Microbiol. 2012, 14, 2272–2282. [Google Scholar] [CrossRef] [PubMed]
- Azúa-Bustos, A.; González-Silva, C.; Mancilla, R.A.; Salas, L.; Gómez-Silva, B.; McKay, C.P.; Vicuña, R. Hypolithic cyanobacteria supported mainly by fog in the coastal range of the Atacama Desert. Microb. Ecol. 2011, 61, 568–581. [Google Scholar] [CrossRef] [PubMed]
- Zinger, L.; Chave, J.; Coissac, E.; Iribar, A.; Louisanna, E.; Manzi, S.; Schilling, V.; Schimann, H.; Sommeria-Klein, G.; Taberlet, P. Extracellular DNA extraction is a fast, cheap and reliable alternative for multi-taxa surveys based on soil DNA. Soil Biol. Biochem. 2016, 96, 16–19. [Google Scholar] [CrossRef]
- Levy-Booth, D.J.; Campbell, R.G.; Gulden, R.H.; Hart, M.M.; Powell, J.R.; Klironomos, J.N.; Pauls, K.P.; Swanton, C.J.; Trevors, J.T.; Dunfield, K.E. Cycling of extracellular DNA in the soil environment. Soil Biol. Biochem. 2007, 39, 2977–2991. [Google Scholar] [CrossRef]
- Millet, D.B.; Jacob, D.J.; Custer, T.G.; de Gouw, J.A.; Goldstein, A.H.; Karl, T.; Singh, H.B.; Sive, B.C.; Talbot, R.W.; Warneke, C.; et al. New constraints on terrestrial and oceanic sources of atmospheric methanol. Atmos. Chem. Phys. 2008, 8, 6887–6905. [Google Scholar] [CrossRef] [Green Version]
- Robinson, C.K.; Wierzchos, J.; Black, C.; Crits-Christoph, A.; Ma, B.; Ravel, J.; Ascaso, C.; Artieda, O.; Valea, S.; Roldán, M.; et al. Microbial diversity and the presence of algae in halite endolithic communities are correlated to atmospheric moisture in the hyper-arid zone of the A tacama D esert. Environ. Microbiol. 2015, 17, 299–315. [Google Scholar] [CrossRef]
- Davila, A.F.; Hawes, I.; Araya, J.G.; Gelsinger, D.R.; DiRuggiero, J.; Ascaso, C.; Osano, A.; Wierzchos, J. In situ metabolism in halite endolithic microbial communities of the hyperarid Atacama Desert. Front. Microbiol. 2015, 6, 101. [Google Scholar] [CrossRef] [Green Version]
- Oren, A. The order halobacteriales. Prokaryotes 2006, 3, 113–164. [Google Scholar]
- Oren, A.; Heldal, M.; Norland, S.; Galinski, E.A. Intracellular ion and organic solute concentrations of the extremely halophilic bacterium Salinibacter ruber. Extremophiles 2002, 6, 491–498. [Google Scholar] [CrossRef] [PubMed]
- Antón, J.; Oren, A.; Benlloch, S.; Rodríguez-Valera, F.; Amann, R.; Rosselló-Mora, R. Salinibacter ruber gen. nov., sp. nov., a novel, extremely halophilic member of the Bacteria from saltern crystallizer ponds. Int. J. Syst. Evol. Microbiol. 2002, 52, 485–491. [Google Scholar] [CrossRef]
- Maus, D.; Heinz, J.; Schirmack, J.; Airo, A.; Kounaves, S.P.; Wagner, D.; Schulze-Makuch, D. Methanogenic Archaea can produce methane in deliquescence-driven Mars analog environments. Sci. Rep. 2020, 10, 6. [Google Scholar] [CrossRef] [PubMed]
- Ziolkowski, L.; Mykytczuk, N.; Omelon, C.R.; Johnson, H.; Whyte, L.; Slater, G. Arctic Gypsum Endoliths: A Biogeochemical Characterization of a Viable and Active Microbial Community; Copernicus GmbH: Göttingen, Germany, 2013. [Google Scholar]
- Tabita, F.R.; Satagopan, S.; Hanson, T.E.; Kreel, N.E.; Scott, S.S. Distinct form I, II, III, and IV Rubisco proteins from the three kingdoms of life provide clues about Rubisco evolution and structure/function relationships. J. Exp. Bot. 2007, 59, 1515–1524. [Google Scholar] [CrossRef]
- Bothe, H.; Schmitz, O.; Yates, M.G.; Newton, W.E. Nitrogen fixation and hydrogen metabolism in cyanobacteria. Microbiol. Mol. Biol. Rev. 2010, 74, 529–551. [Google Scholar] [CrossRef] [PubMed] [Green Version]
- Billi, D. and Caiola, M.G. Effects of nitrogen limitation and starvation on Chroococcidiopsis sp. (Chroococcales). New Phytol. 1996, 133, 563–571. [Google Scholar] [CrossRef]
- Michalski, G.; Böhlke, J.K.; Thiemens, M. Long term atmospheric deposition as the source of nitrate and other salts in the Atacama Desert, Chile: New evidence from mass-independent oxygen isotopic compositions. Geochim. Cosmochim. Acta 2004, 68, 4023–4038. [Google Scholar] [CrossRef]
- Crits-Christoph, A.; Robinson, C.K.; Barnum, T.; Fricke, W.F.; Davila, A.F.; Jedynak, B.; McKay, C.P.; DiRuggiero, J. Colonization patterns of soil microbial communities in the Atacama Desert. Microbiome 2013, 1, 28. [Google Scholar] [CrossRef] [Green Version]
- Meslier, V.; DiRuggiero, J. Endolithic microbial communities as model systems for ecology and astrobiology. In Model Ecosystems in Extreme Environments; Elsevier: Amsterdam, The Netherlands, 2019; pp. 145–168. [Google Scholar]
- Davila, A.F.; Schulze-Makuch, D. The last possible outposts for life on Mars. Astrobiology 2016, 16, 159–168. [Google Scholar] [CrossRef]


| Habitat | 16S rRNA Gene Copies | Shannon Index | ||
|---|---|---|---|---|
| iDNA | eDNA | iDNA | eDNA | |
| Coastal Soil-HL | 4.1 × 10⁸ | 2.3 × 10⁹ | 3.09 | 4.27 |
| ±3.9 × 10⁸ | ±1.9 × 10⁹ | ±0.83 | ±0.86 | |
| Alluvial Fan-HL | 1.8 × 10⁹ | 1.0 × 10¹⁰ | 2.89 | 3.51 |
| ±2.2 × 10⁸ | ±9.6 × 10⁸ | ±0.53 | ±0.08 | |
| Alluvial Fan-GG | 1.4 × 10³ | 2.1 × 10³ | 3.45 * | 3.02 * |
| ±8.4 × 10² | ±6.5 × 10² | |||
| Yungay Salar-HN | 3.8 × 10⁴ | 6.2 × 10³ | 2.43 | 2.91 |
| ±2.9 × 10⁴ | ±2.3 × 10³ | ±0.39 | ±0.93 | |
| Coastal Soil 0–5 | 6.6 × 10⁵ | 3.9 × 10⁷ | 6.42 | 6.36 |
| ±4.9 × 10⁵ | ±1.7 × 10⁷ | ±0.06 | ±0.05 | |
| Alluvial Fan 0–5 | 1.5 × 10³ | NA | 4.12 | 4.25 |
| ±3.1 × 10² | ±0.19 | ±0.52 | ||
| Red Sands 0–5 | 2.8 × 10³ | NA | 3.84 | 3.72 |
| ±1.2 × 10³ | ±0.27 | ±0.53 | ||
| Yungay Salar 0–5 | 1.0 × 10⁴ | NA | 4.01 | 4.29 |
| ±3.3 × 10² | ±0.32 | ±0.13 | ||
Publisher’s Note: MDPI stays neutral with regard to jurisdictional claims in published maps and institutional affiliations. |
© 2021 by the authors. Licensee MDPI, Basel, Switzerland. This article is an open access article distributed under the terms and conditions of the Creative Commons Attribution (CC BY) license (https://creativecommons.org/licenses/by/4.0/).
Share and Cite
Schulze-Makuch, D.; Lipus, D.; Arens, F.L.; Baqué, M.; Bornemann, T.L.V.; de Vera, J.-P.; Flury, M.; Frösler, J.; Heinz, J.; Hwang, Y.; et al. Microbial Hotspots in Lithic Microhabitats Inferred from DNA Fractionation and Metagenomics in the Atacama Desert. Microorganisms 2021, 9, 1038. https://0-doi-org.brum.beds.ac.uk/10.3390/microorganisms9051038
Schulze-Makuch D, Lipus D, Arens FL, Baqué M, Bornemann TLV, de Vera J-P, Flury M, Frösler J, Heinz J, Hwang Y, et al. Microbial Hotspots in Lithic Microhabitats Inferred from DNA Fractionation and Metagenomics in the Atacama Desert. Microorganisms. 2021; 9(5):1038. https://0-doi-org.brum.beds.ac.uk/10.3390/microorganisms9051038
Chicago/Turabian StyleSchulze-Makuch, Dirk, Daniel Lipus, Felix L. Arens, Mickael Baqué, Till L. V. Bornemann, Jean-Pierre de Vera, Markus Flury, Jan Frösler, Jacob Heinz, Yunha Hwang, and et al. 2021. "Microbial Hotspots in Lithic Microhabitats Inferred from DNA Fractionation and Metagenomics in the Atacama Desert" Microorganisms 9, no. 5: 1038. https://0-doi-org.brum.beds.ac.uk/10.3390/microorganisms9051038