
Effects of Diet and Phytogenic Inclusion on the Antioxidant Capacity of the Broiler Chicken Gut


Laboratory of Nutritional Physiology and Feeding, Department of Animal Science, Agricultural University of Athens, Iera Odos 75, Athens 11855, Greece
*
Author to whom correspondence should be addressed.
Animals 2021, 11(3), 739; https://0-doi-org.brum.beds.ac.uk/10.3390/ani11030739
Submission received: 8 February 2021
/
Revised: 25 February 2021
/
Accepted: 3 March 2021
/
Published: 8 March 2021
(This article belongs to the Special Issue Gut Health in Poultry)
Abstract
:Simple Summary
Triggering of poultry capacity to resist challenge stressors could be vital for animal performance and health. Diet may serve as a tool for modulating animal response to oxidative stress. Within the context of a balanced diet, certain feed additives of plant origin, such as phytogenics, may confer additional cytoprotective effects. As gut health is a prerequisite for animal performance, this work delved into advancing our knowledge on dietary and phytogenic effects on the capacity of the poultry gut to counteract oxidative stress. Study findings showed that a reduction in dietary energy and protein intake by 5% primed important antioxidant responses especially upon phytogenic addition. The new knowledge could assist in devising nutritional management strategies for counteracting oxidative stress.
Abstract
The reduction in energy and protein dietary levels, whilst preserving the gut health of broilers, is warranted in modern poultry production. Phytogenic feed additives (PFAs) are purported to enhance performance and antioxidant capacity in broilers. However, few studies have assessed PFA effects on a molecular level related to antioxidant response. The aim of this study was to investigate the effects of administering two dietary types differing in energy and protein levels (L: 95% and H: 100% of hybrid optimal recommendations) supplemented with or without PFA (−, +) on gene expressions relevant for antioxidant response along the broiler gut. Interactions of diet type with PFA (i.e., treatments L−, L+, H−, H+) were determined for critical antioxidant and cyto-protective genes (i.e., nuclear factor erythroid 2-like 2 (Nrf2) pathway) and for the total antioxidant capacity (TAC) in the proximal gut. In particular, the overall antioxidant response along the broiler gut was increased upon reduced dietary energy and protein intake (diet type L) and consistently up-regulated by PFA addition. The study results provide a new mechanistic insight of diet and PFA functions with respect to the overall broiler gut antioxidant capacity.
Keywords:
antioxidant response; Nrf2; phytogenics; diet type; broilers; gut health; animal nutrition1. Introduction
Gut health biomarkers associated with the regulation of the antioxidant response and inflammation currently attract a lot of scientific attention [1,2,3]. In particular, one of the most important regulators of antioxidant response and inflammation is the transcription factor nuclear factor erythroid 2-like 2 (Nrf2) [4]. Transcription factor Nrf2 is a basic leucine zipper-containing transcription factor that is regulated by Kelch-like ECH-associated protein-1 (Keap1) and activates phase II/detoxifying enzymes and more than 100 genes through the antioxidant response element (ARE). These genes include NAD(P)H:quinone oxidoreductase 1 (NQO1), glutathione S-transferase (GST), heme oxigenase-1 (HO-1), glutathione peroxidase (GSH-Px), catalase (CAT), superoxide dismutase 1 (SOD1), glutamate cysteine ligase (GCL), glutathione-disulfide reductase (GSR) and the thioredoxin/peroxiredoxin system [5,6,7,8].
In particular, Keap1 binding with various inducers (e.g., phytogenic compounds) leads to transcription of many cyto-protective genes [9,10]. Briefly, CAT and SOD1 are antioxidant enzymes that directly react with radical species, whereas GPX and GSR regenerate oxidized antioxidants [11]. In addition, NQO1 engages a two-electron transfer to diminish quinones to hydroquinones preventing the production of free radical oxygen intermediates [12]. Moreover, GST catalyzes the conjugation of GSH with xenobiotics and protects cells against reactive oxygen metabolites [13]. On the other hand, PRDX1 is proven to be a functional enzyme adjusting cell growth, differentiation and apoptosis [14]. Finally, TXN operates along with PRDX1 as reductase in redox control, preserves proteins from oxidative aggregation and inactivation, supports the cells confront various environmental stresses (e.g., ROS, peroxynitrite, arsenate) and regulates programmed cell death via denitrosylation [15].
Research evidence highlights that activation of the Nrf2/ARE signaling pathway could be regarded as beneficial for effectively counteracting oxidative stress in animals and humans. In this respect, contemporary research tries to elucidate the role of dietary components for animal and human health and well-being [16]. In particular, while there is evidence that reduced energy and protein intake could be beneficial for adult humans [17,18], yet the role of energy and protein intake in the activation of the Nfr2 pathway [19] is still limited. On the other hand, accumulating evidence demonstrates that inclusion of various phytogenic feed additives (PFAs) may regulate the Nrf2/ARE pathway in a manner perceived as beneficial for human and animal health [3,6,20,21,22].
The aim of this study was to generate new knowledge on the effects of dietary energy and protein levels with or without PFA addition on the modulation of the Nrf2/ARE signaling pathway in the broiler gut mucosa. For the purpose of the study, the expression of critical genes belonging to the Nrf2/ARE pathway was profiled along the chicken broiler gut. In addition to the gene expressions, the antioxidant capacity of the intestinal mucosa was assessed biochemically.
2. Materials and Methods
2.1. Animals and Experimental Treatments
For the purpose of the experiment, 540 one-day-old male Cobb 500 broilers vaccinated at hatch for Marek, Infectious Bronchitis and Newcastle Disease were obtained from a commercial hatchery. Birds were allocated to 4 experimental treatments for 6 weeks. Each treatment had 9 floor replicate cages of 15 broilers each. Each replicate was assigned to a clean floor cage (1 m2), and the birds were raised on rice hulls litter. The temperature program was set at 32 °C at week 1 and gradually reduced to 23 °C by week 6. Heat was provided with a heating lamp per cage. Except for day 1, an 18 h light to 6 h dark lighting program was applied during the experiment to ensure adequate access to feed and water.
A 2 × 2 factorial design was used with diet specifications and PFA addition as the main factors. A three-phase feeding program with starter (1 to 10 d), grower (11 to 22 d) and finisher (23 to 42 d) diets was followed. In particular, for each growth phase, two diet types () were formulated to meet 95% and 100% of optimal Cobb 500 metabolizable energy (ME) and protein (CP) specifications, stated as L and H, respectively. The PFA used contained a blend of compounds such as carvacrol, thymol, carvone, methyl salicylate and menthol (Digestarom® Biomin Phytogenics GmbH, Stadtoldendorf, Germany). Diets were in mash form, based on maize and soybean meal and were supplemented with coccidiostat. Throughout the experiment, feed and water were available ad libitum.
The calculated chemical composition per kg of the basal diets (L vs. H) was as follows. For the starter diet: AMEn (11.97 vs. 12.60) MJ; crude protein (204.3 vs. 215.0) g; lysine (12.5 vs. 13.2) g; methionine + cysteine (9.4 vs. 9.9) g; threonine (8.2 vs. 8.6) g; calcium 9 g; available phosphorus 4.5 g. For the grower diet: AMEn (12.27 vs. 12.92) MJ; crude protein (185.3 vs. 195) g; lysine (11.3 vs. 11.9) g; methionine + cysteine (8.6 vs. 9.0) g; threonine (7.5 vs. 7.9) g; calcium 8.4 g; available phosphorus 4.2 g. For the finisher diet: AMEn (12.59 vs. 13.26) MJ; crude protein (175.8 vs. 185.0) g; lysine (10.0 vs. 10.5) g; methionine + cysteine (7.8 vs. 8.2) g; threonine (6.8 vs. 7.1) g; calcium 7.6 g; available phosphorus 3.8 g.
Depending on diet type (L and H) and PFA supplementation (0 and 150 mg/kg of diet), the four experimental treatments were: L− (95% of optimal ME and CP requirements with no PFA supplementation), L+ (95% of optimal ME and CP requirements with PFA supplementation), H− (100% of optimal ME and CP requirements with no PFA supplementation) and H+ (100% of optimal ME and CP requirements with PFA supplementation).
The experimental protocol was in compliance with the current European Union Directive on the protection of animals used for scientific purposes [23,24] and was approved by the relevant national authority (Department of Agriculture and Veterinary Policy, General Directorate of Agriculture, Economy, Veterinary and Fisheries). Birds were euthanized via electrical stunning prior to slaughter.
2.2. Broiler Growth Performance Responses
Broiler performance parameters such as body weight gain (BWG), feed intake (FI), and feed conversion ratio (FCR) were evaluated for the entire duration of the experiment (42 days) (Table 2).
2.3. Organ Sampling
At 42 d of age, 9 broilers per treatment were randomly selected and the duodenum, jejunum, ileum and ceca samples were excised carefully and immediately snap frozen in liquid nitrogen and subsequently stored at −80 °C for further analyses.
2.4. Molecular Analyses
2.4.1. RNA Isolation and Reverse-Transcription PCR
Τhe central section of duodenum, jejunum, ileum and the whole ceca were exposed and the luminal digesta was ejected. Then, the segments without digesta were washed completely in 30 mL cold phosphate buffered saline (PBS)–ethylene diamine tetra-acetic acid (EDTA; 10 mmol/L) solution (pH = 7.2), and the mucosal epithelium was taken off with a micro-slide to a sterile Eppendorf type tube. Eventually, the total RNA from the duodenal, jejunal, ileal and caecal mucosa was obtained as reported by the manufacturer’s protocol from Macherey-Nagel GmbH & Co. KG, Duren, Germany, by handling NucleoZOL Reagent. RNA quantity and quality were ascertained by spectrophotometry with the use of NanoDrop-1000 by Thermo Fisher Scientific, Waltham, United Kingdom.
DNAse treatment was exercised due to the removal of contaminating genomic DNA from the RNA samples. Ten micrograms of RNA was diluted with 1 U of DNase I (M0303, New England Biolabs Inc, Ipswich, UK) and 10 μL of 10x DNAse buffer to a final volume of 100 µL upon the inclusion of DEPC water, for 15–20 min at 37 °C. Before the DNAse inactivation at 75 °C for 10 min, EDTA should be added to a final concentration of 5 mM to protect RNA from being degraded during enzyme inactivation. RNA integrity was examined by agarose gel electrophoresis
From each sample, 500 ng of total RNA was reverse transcribed to cDNA by PrimeScript RT Reagent Kit (Perfect Real Time, Takara Bio Inc., Shiga-Ken, Japan) according to the manufacturer’s recommendations. All cDNAs were afterwards stored at −20 °C.
2.4.2. Quantitative Real-Time PCR
The following Gallus gallus genes were examined: nuclear factor erythroid 2-like 2 (Nrf2), kelch-like ECH associated protein 1 (Keap1), catalase (CAT), superoxide dismutase 1 (SOD1), xanthine oxidoreductase (XOR), glutathione peroxidase 2, 7 (GPX2, GPX7), heme oxygenase 1 (HMOX1), NAD(P)H quinone dehydrogenase 1 (NQO1), glutathione S-transferase alpha 2 (GSTA2), glutathione-disulfide reductase (GSR), peroxiredoxin-1 (PRDX1), thioredoxin (TXN), glyceraldehyde 3-phosphate dehydrogenase (GAPDH) and actin beta (ACTB). Suitable primers were designed using the GenBank sequences deposited on the National Center for Biotechnology Information and US National Library of Medicine (NCBI) shown in Table 1. Primers were checked using the PRIMER BLAST algorithm for Gallus gallus mRNA databases to ensure that there was a unique amplicon.
Real-time PCR was accomplished in 96-well microplates with a SaCycler-96 Real-Time PCR System (Sacace Biotechnologies s.r.l.,Como, Italy) and FastGene IC Green 2x qPCR universal mix (Nippon Genetics, Tokyo, Japan). Every reaction included 12.5 ng RNA equivalents along with 200 nmol/L of forward and reverse primers for each gene. The reactions were incubated at 95 °C for 3 min, accompanied by 40 cycles of 95 °C for 5 s, 59.5 to 62 °C (depending on the target gene) for 20 s, 72 °C for 33 s. This was tailed by a melt curve analysis to check the reaction specificity. Each sample was determined in duplicates. Relative expression ratios of target genes were calculated according to [25] adapted for the multi-reference genes normalization procedure according to [26] using GAPDH and ACTB as reference genes.
2.5. Biochemical Analyses
Total Antioxidant Capacity of Intestinal Mucosa
Total antioxidant capacity (TAC) was determined using the oxygen radical absorbance (ORAC) assay [27] to evaluate the hydrophilic antioxidants [28]. Appropriately diluted mucosal samples from duodenum, jejunum, ileum and caecum in phosphate-buffered saline (PBS) were used, and the ability to delay the decay of phycoerythrin fluorescence under the presence of 2,2′-azobis (2-methylpropionamidine) dihydrochloride (APPH) used as oxidant was compared with that of trolox (6-hydroxy-2,5,7,8 tetramethylchroman-2-carboxylic acid) used as an anti-oxidant standard. Data were expressed as concentration of trolox equivalents (TE) (mmol/L of serum).
2.6. Statistical Analysis
Experimental data were tested for normality using the Kolmogorov–Smirnov test and found to be normally distributed. Data were analyzed with the general linear model (GLM)–general factorial ANOVA procedure using diet type (L, H) and PFA addition (NO and YES) as fixed factors. Statistically significant effects were further analyzed, and means were compared using Tukey’s honestly significant difference multiple comparison procedure. Statistical significance was determined at p ≤ 0.05. All statistical analyses were performed using the SPSS for Windows Statistical Package Program (SPSS 17.0, Inc., Chicago, IL, USA).
3. Results
3.1. Growth Performance Responses
Significant interactions between diet type and PFA were found for BWG (PD×P = 0.001) and FCR (PD×P = 0.024). In particular, broilers of treatments H- and H+ had higher BWG and lower FCR values compared to treatments L− and L+, while broilers of treatment L+ had better BWG and FCR compared to treatment L−. Moreover, broilers fed diet type H showed higher (PD < 0.001) BWG, FI (PD = 0.046) and lower FCR (PD < 0.001) compared to broilers fed diet type L. In addition, PFA inclusion significantly increased BWG (PP = 0.002) and improved FCR (PP = 0.043) for the whole experiment (Table 2).
3.2. Profile of Selected Gene Expression along the Intestine
3.2.1. Duodenum
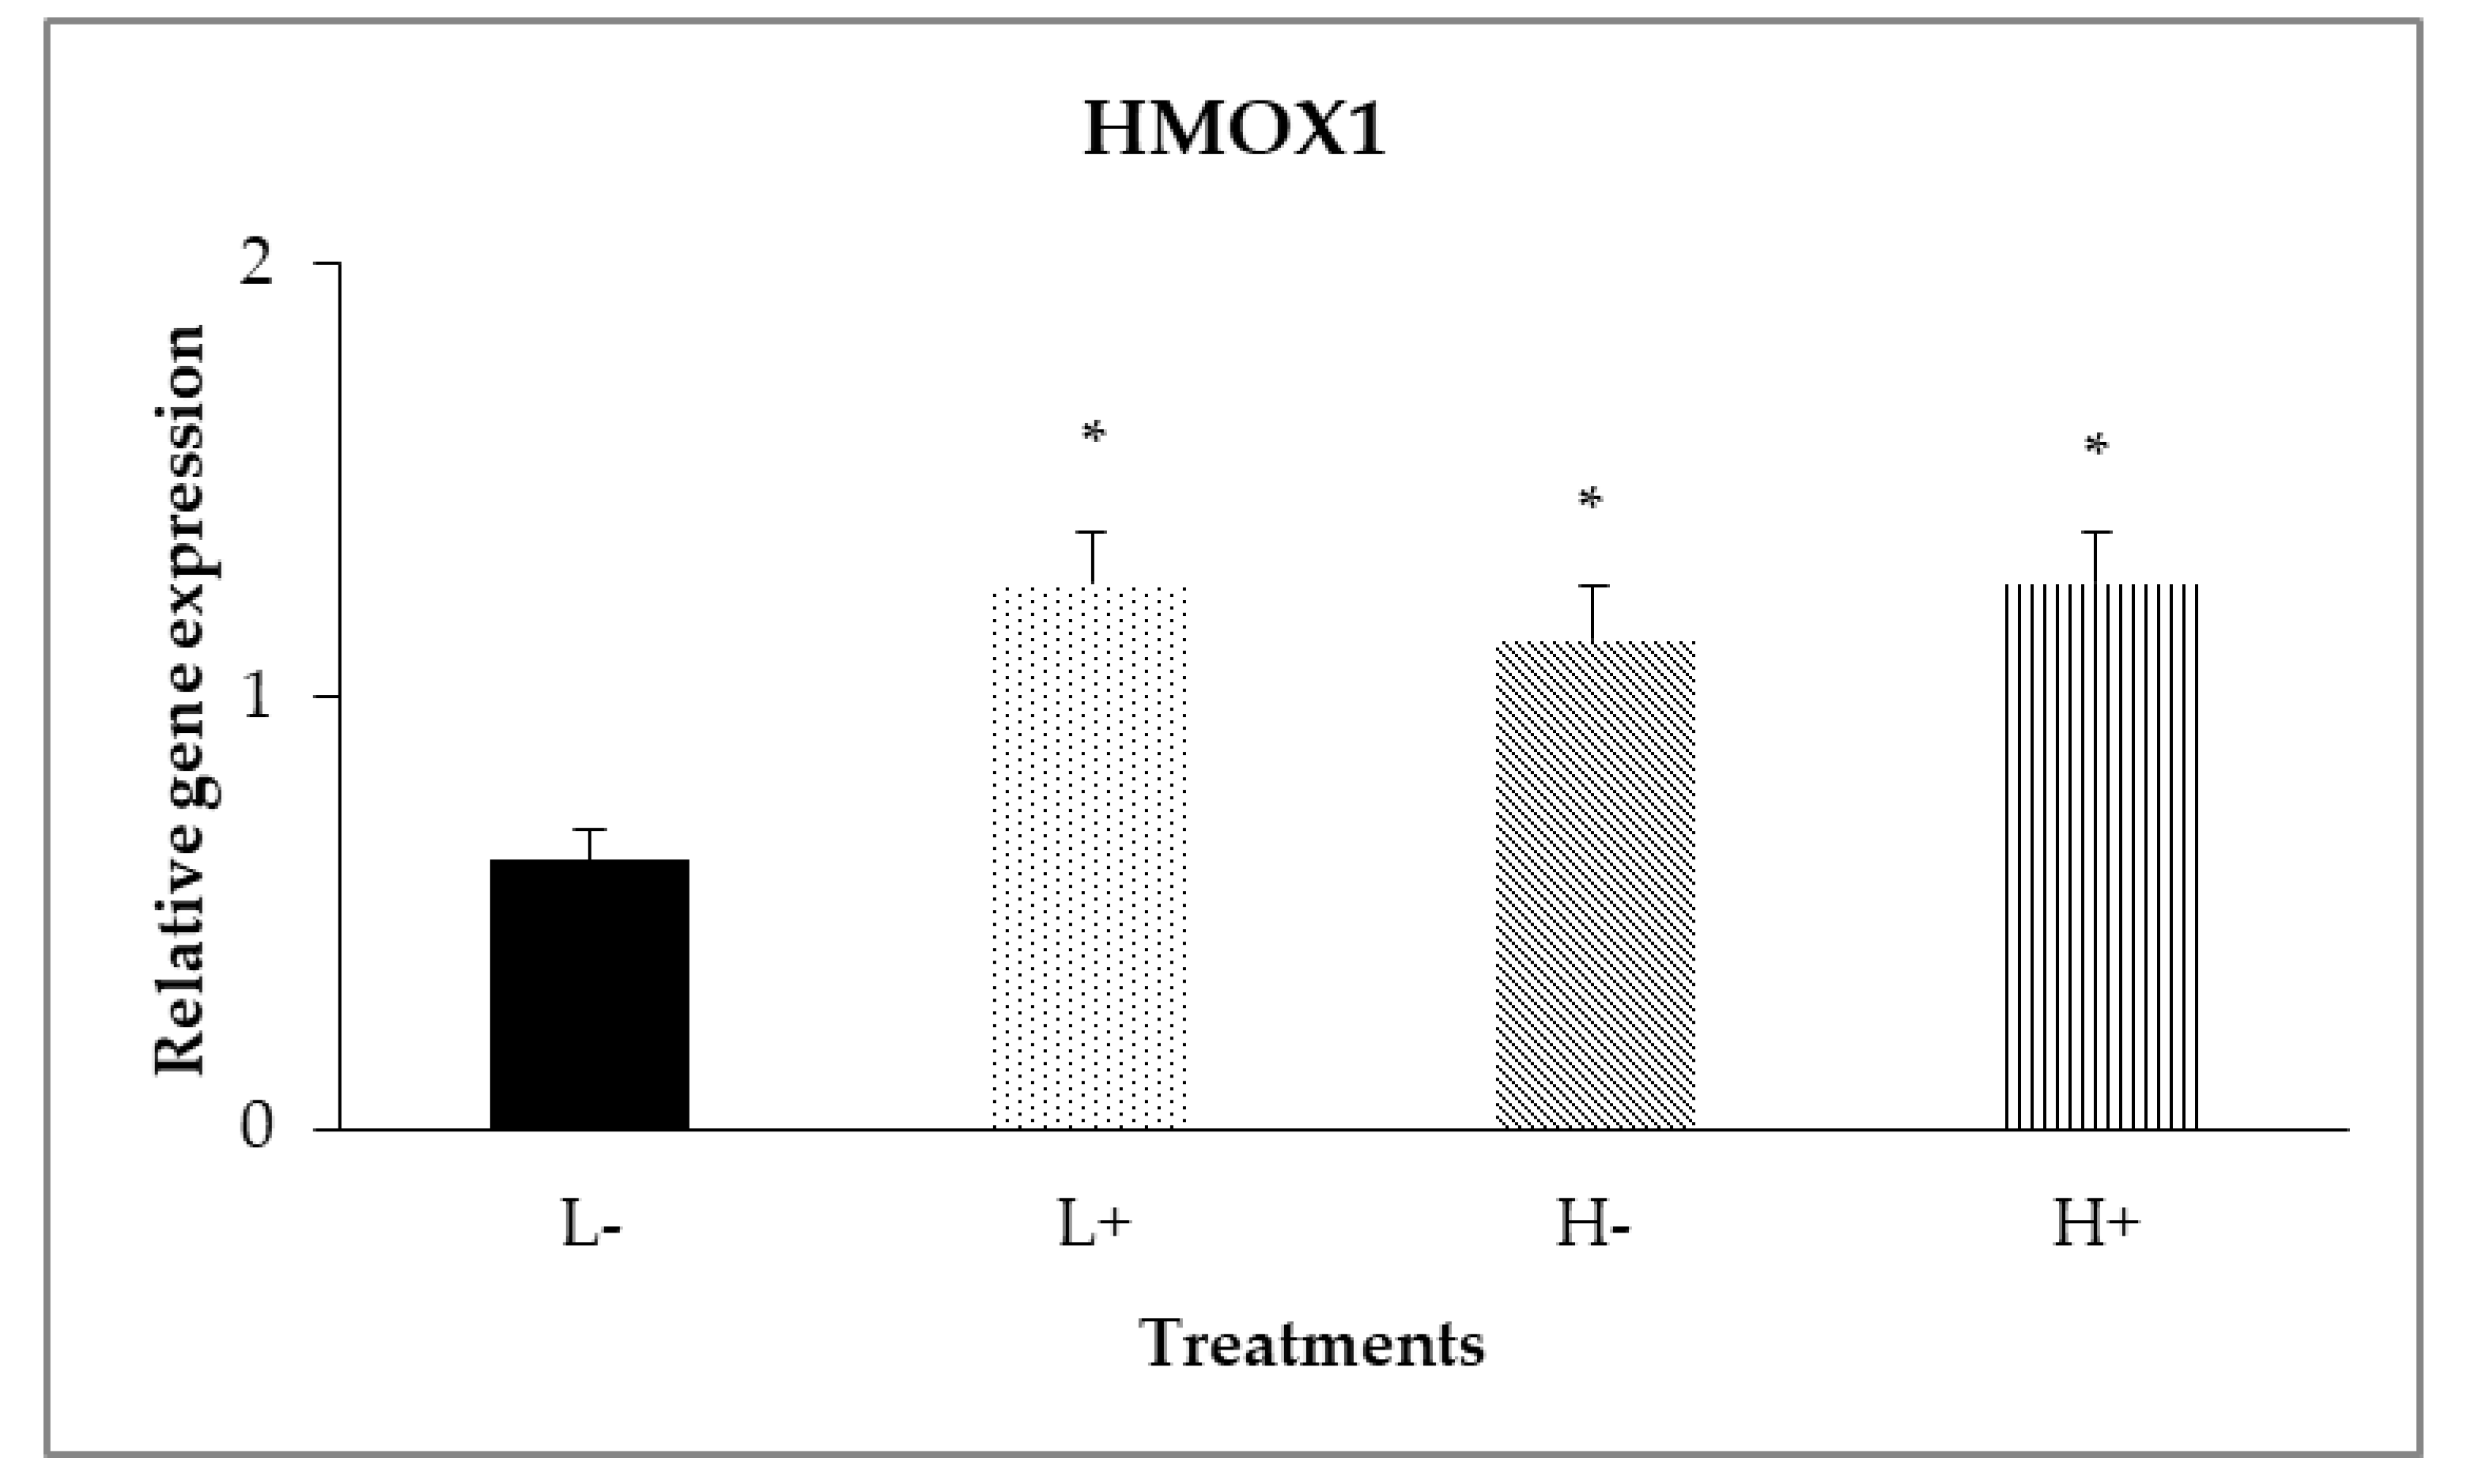
In the duodenal mucosa, significant interaction (PD×P = 0.017) was shown (Figure 1) between diet type and PFA inclusion for HMOX1 gene expression levels, with broilers of treatment (L−) having lower relative gene expression compared to the other treatments.
Moreover, as shown in Table 3, diet type significantly affected (P < 0.05) relative gene expression of GPX2 (PD = 0.043) and HMOX1 (PD = 0.017) with broilers fed diet type L showing higher expression compared to broilers on diet type H. In addition, diet type affected the relative gene expression of TXN (PD = 0.017) with broilers fed diet type H showing higher expression levels compared to broilers fed diet type L. In addition, PFA inclusion significantly (P < 0.05) up-regulated relative expression levels of Keap1 (PP = 0.001), CAT (PP = 0.035), SOD1 (Pp = 0.019), HMOX1 (Pp = 0.001), NQO1 (Pp = 0.001), GSR (Pp = 0.041), PRDX1 (Pp = 0.019) and TXN (Pp = 0.035). Gene expression of Nrf2, XOR, GPX7 and GST was not significantly affected (P > 0.05) by PFA inclusion of diet type
3.2.2. Jejunum
In the jejunal mucosa, diet type significantly affected GPX2 (PD = 0.005) and PRDX1 (PD = 0.002), with broilers fed diet type L showing higher expression levels compared to broilers fed diet type H, as presented in Table 4. On the other hand, relative gene expression of Nrf2, Keap1, CAT, SOD1, XOR, GPX7, HMOX1, NQO1, GST, GSR and TXN was not significantly affected (P > 0.05) neither by diet type nor PFA inclusion
3.2.3. Ileum
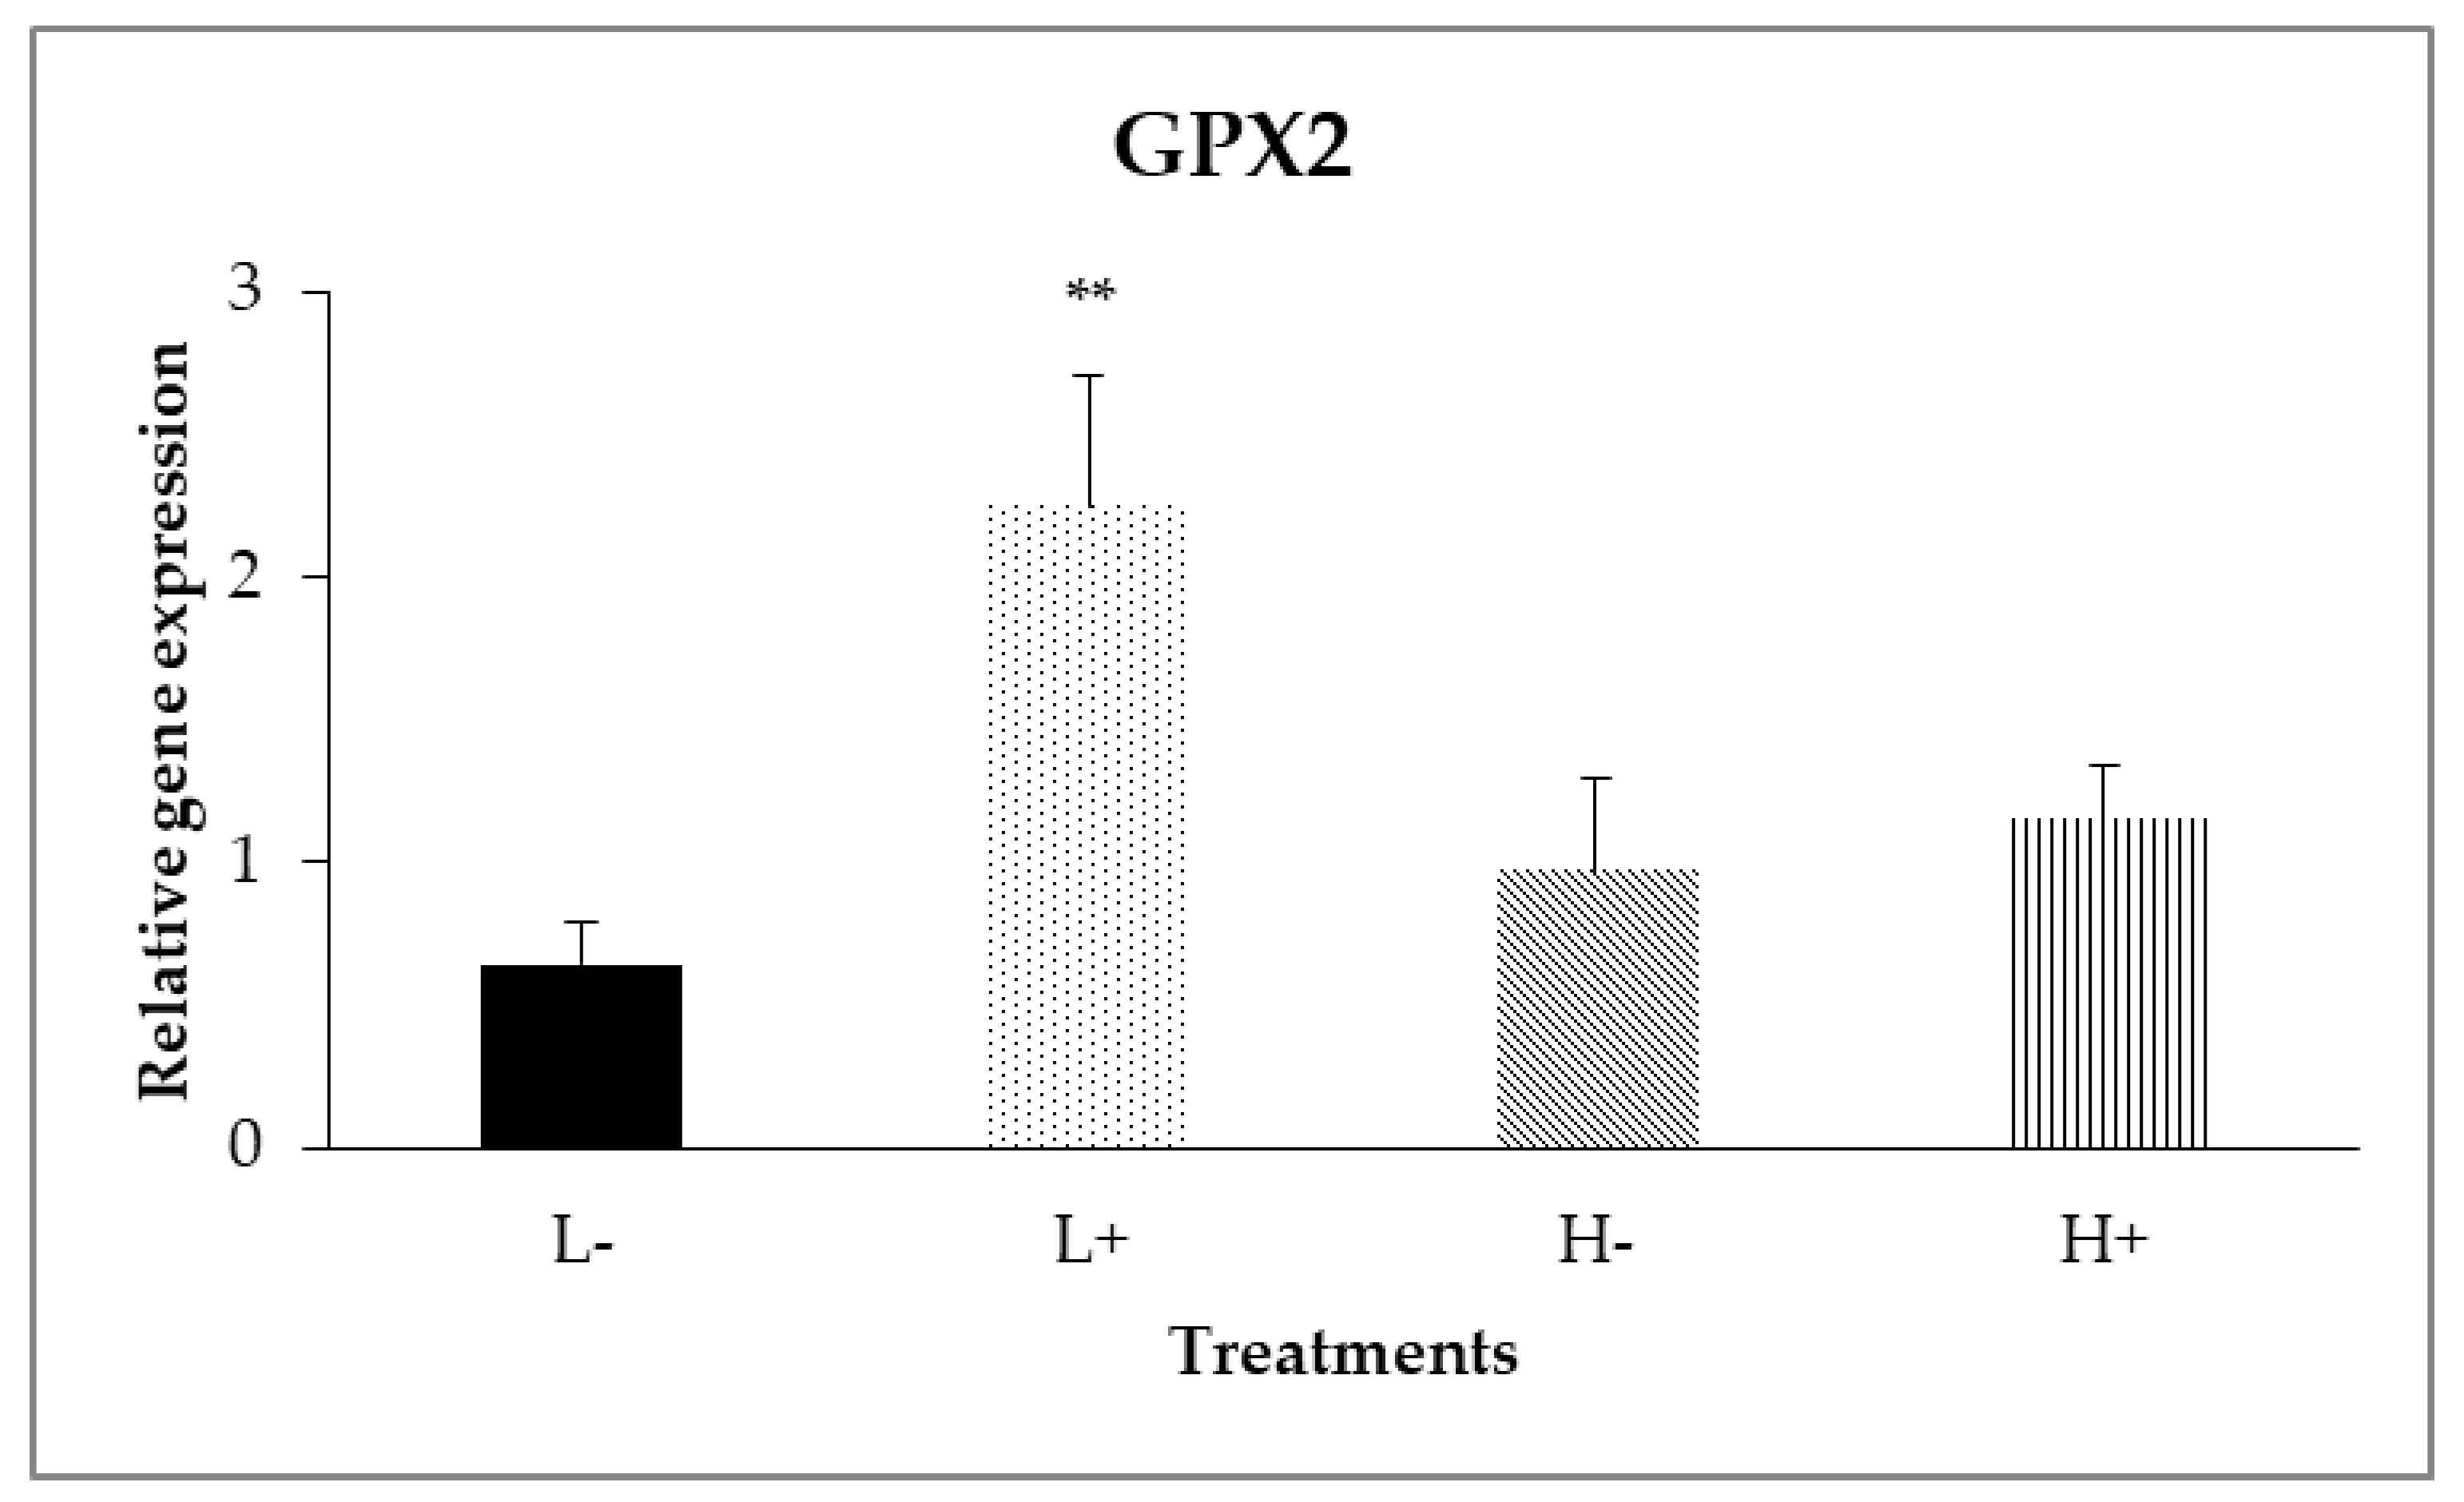
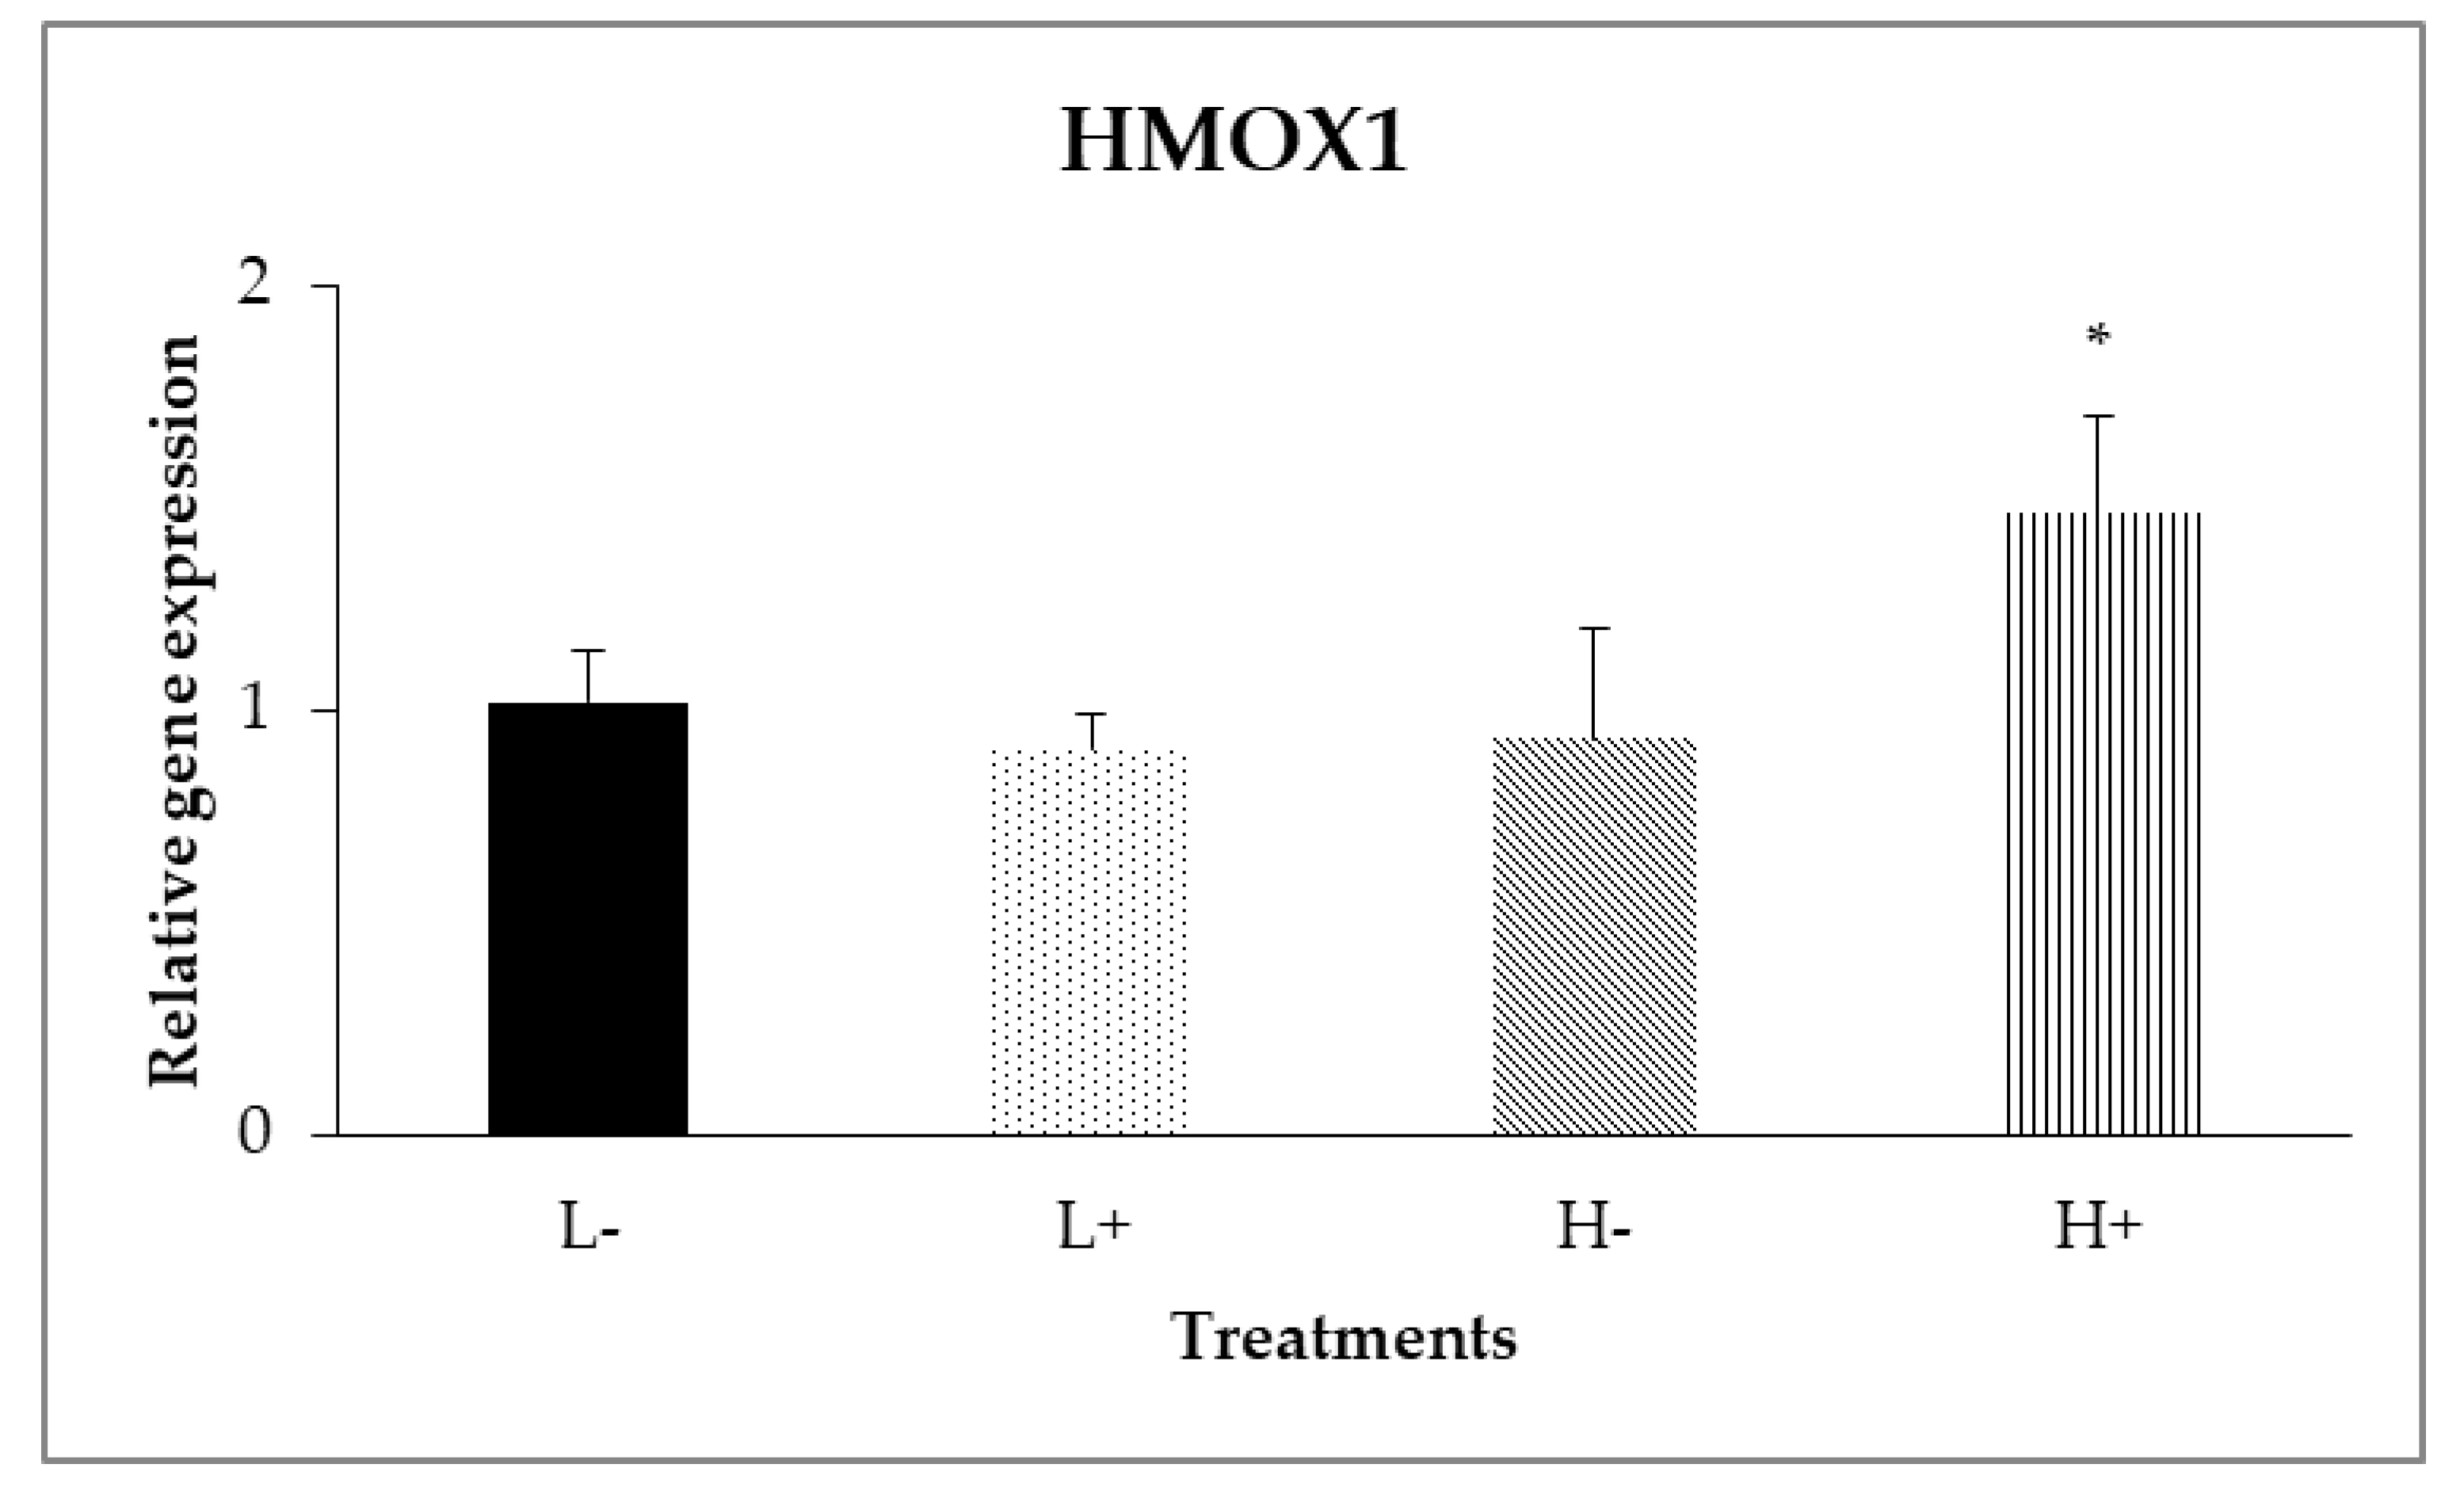
In the ileal mucosa, significant interactions between diet type and PFA inclusion were noted for GPX2 (PD×P = 0.007) and HMOX1 (PD×P = 0.024) as shown in Figure 2 and Figure 3. In particular, the highest relative expression level of GPX2 was found on the L+ treatment, whereas on HMOX1, treatment H+ had the higher gene expression level compared to the other treatments.
In addition, diet type significantly affected (PD = 0.006) the expression of CAT, with broilers fed diet type L showing higher expression levels compared to broilers fed diet type H. Moreover, as displayed in Table 5, PFA inclusion, significantly up-regulated (PP < 0.001) the relative gene expression of GPX2. Finally, relative gene expression of Nrf2, Keap1, SOD1, XOR, GPX7, NQO1, GST, GSR, PRDX1 and TXN was not significantly affected (P > 0.05) neither by diet type nor PFA inclusion
3.2.4. Ceca
In the cecal mucosa, as shown in Table 6, diet type significantly affected (P < 0.05) the gene expression levels of Keap1 (PD = 0.014), GPX2 (PD = 0.003), GPX7 (PD = 0.032) and PRDX1 (PD = 0.006), with broilers fed diet type L showing higher expression levels compared to broilers fed diet type H. Moreover, PFA inclusion significantly up-regulated (PP = 0.041) relative gene expression level of GST. However, relative gene expression of Nrf2, Keap1, CAT, SOD1, XOR, HMOX1, NQO1, GSR and TXN was not significantly affected (P > 0.05) neither by diet type nor PFA inclusion
3.3. Total Antioxidant Capacity (TAC) along the Intestine
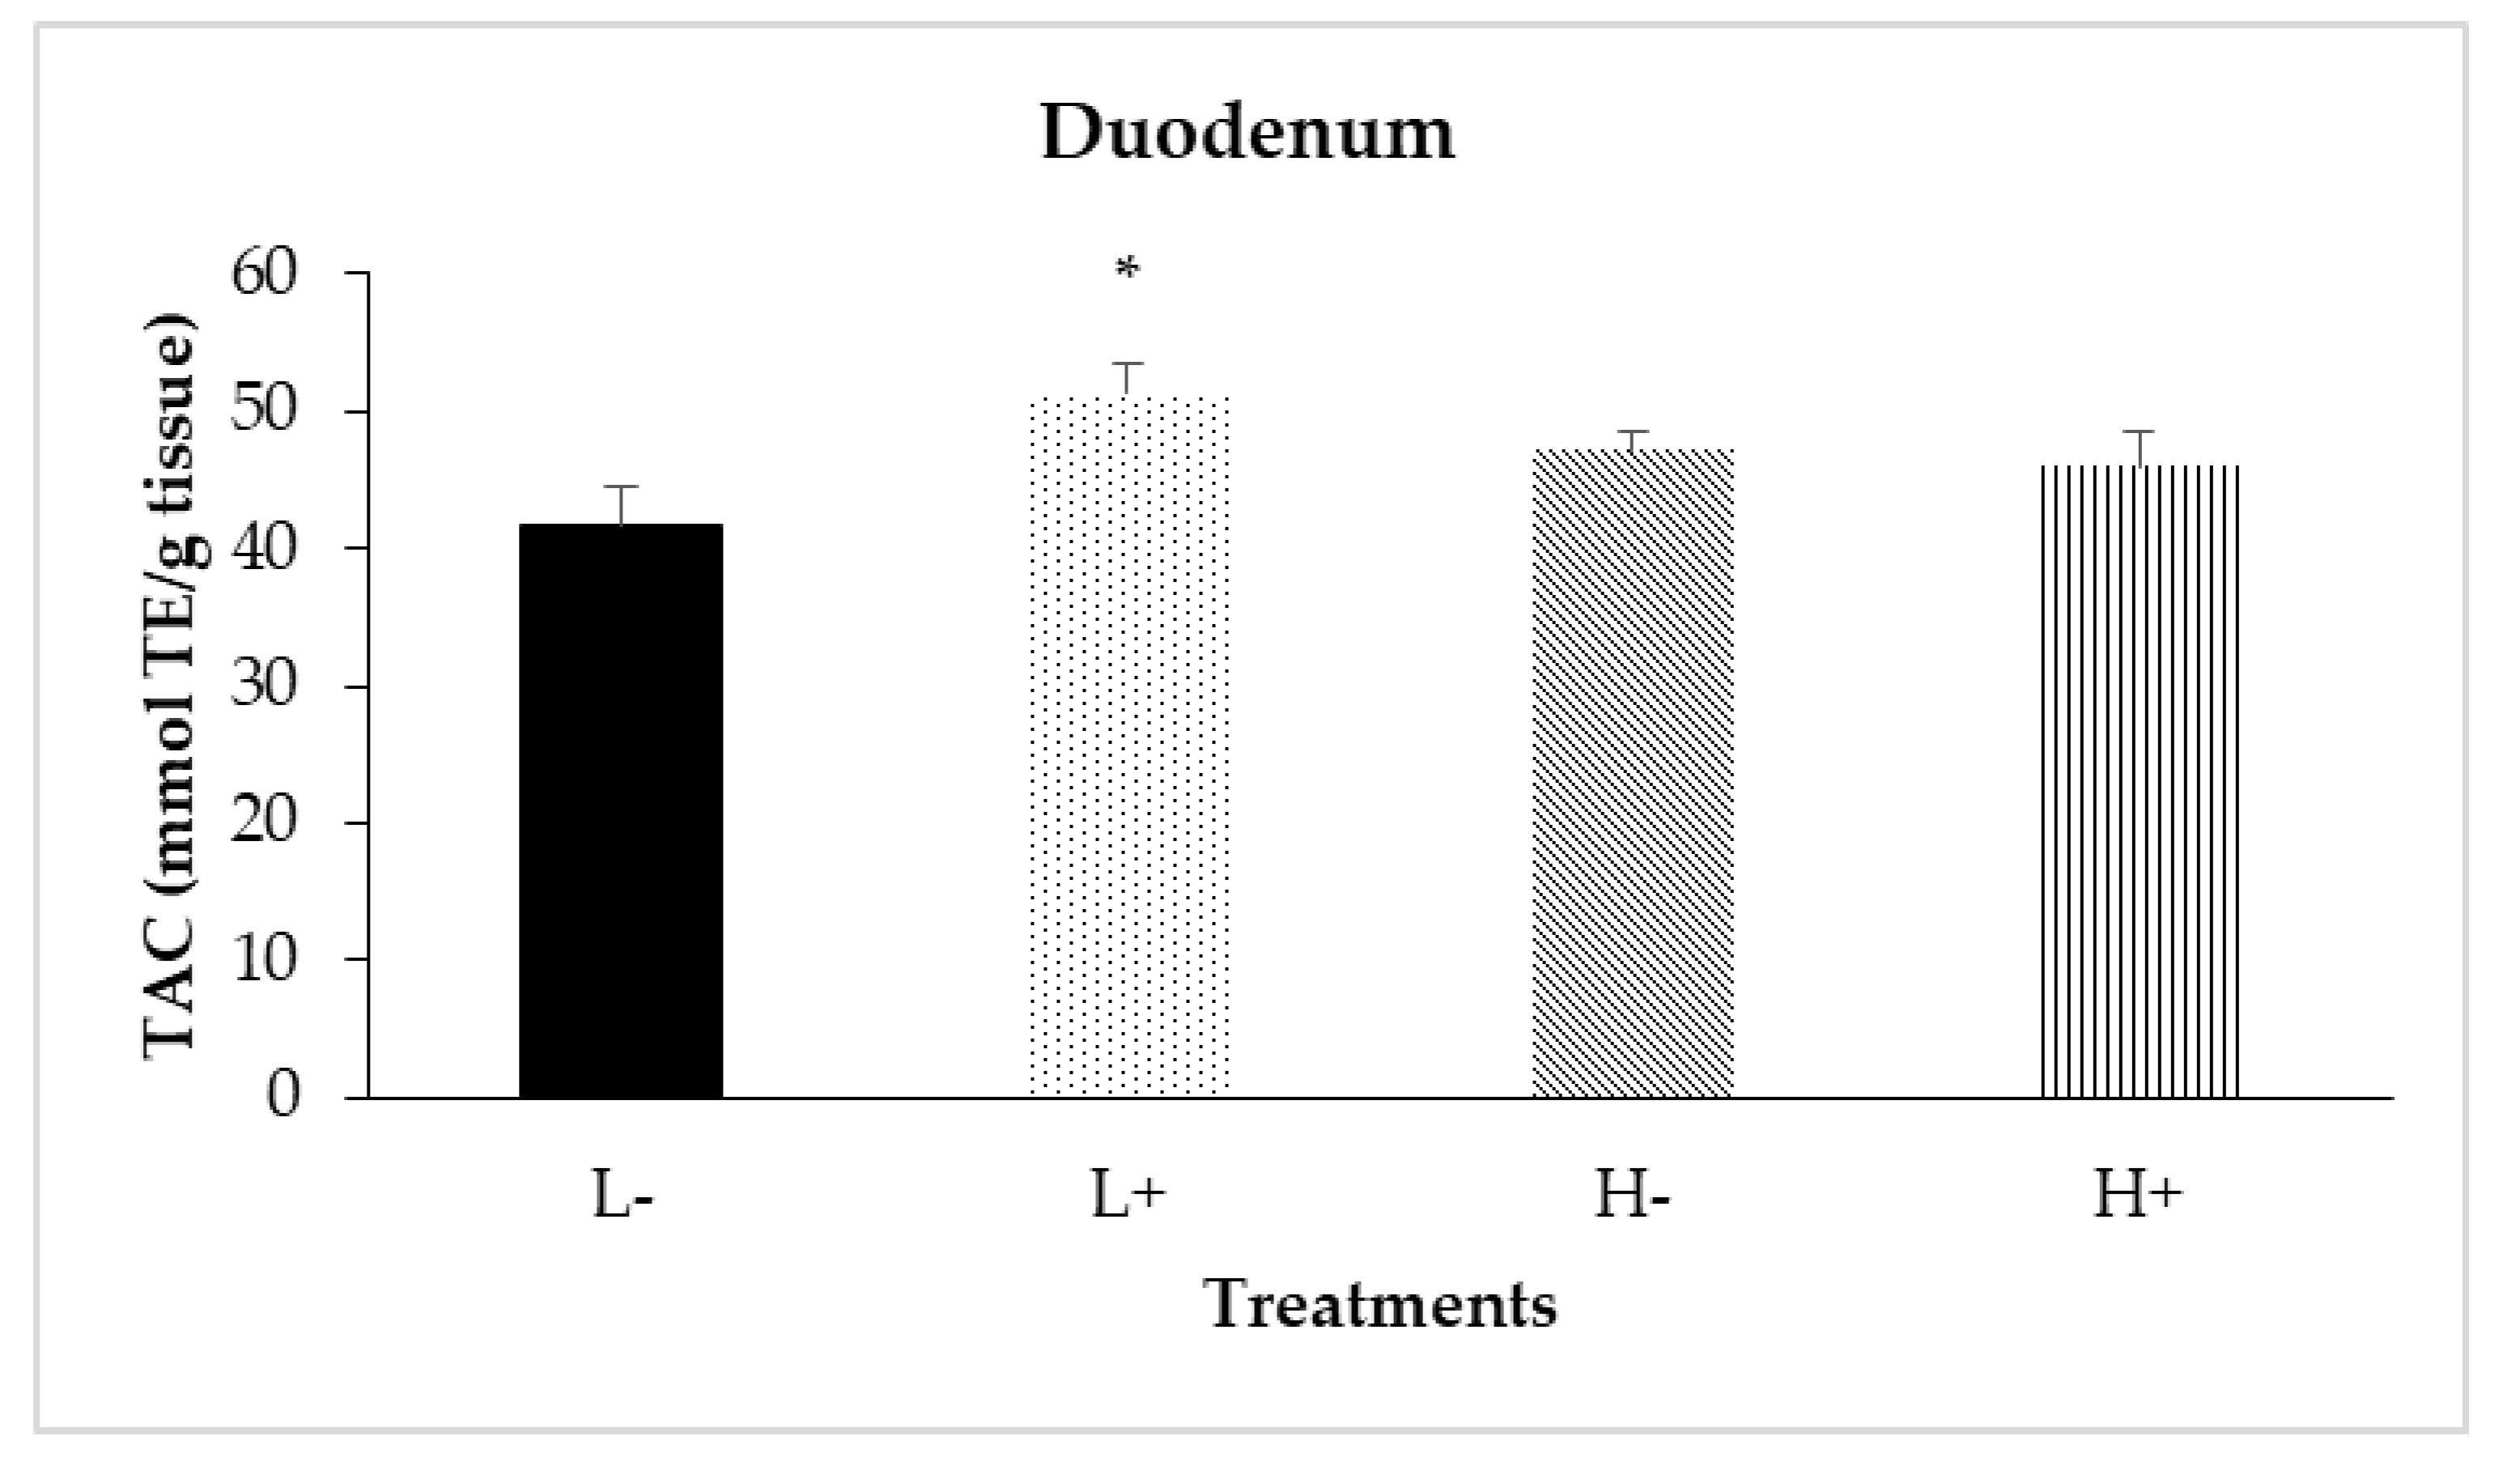
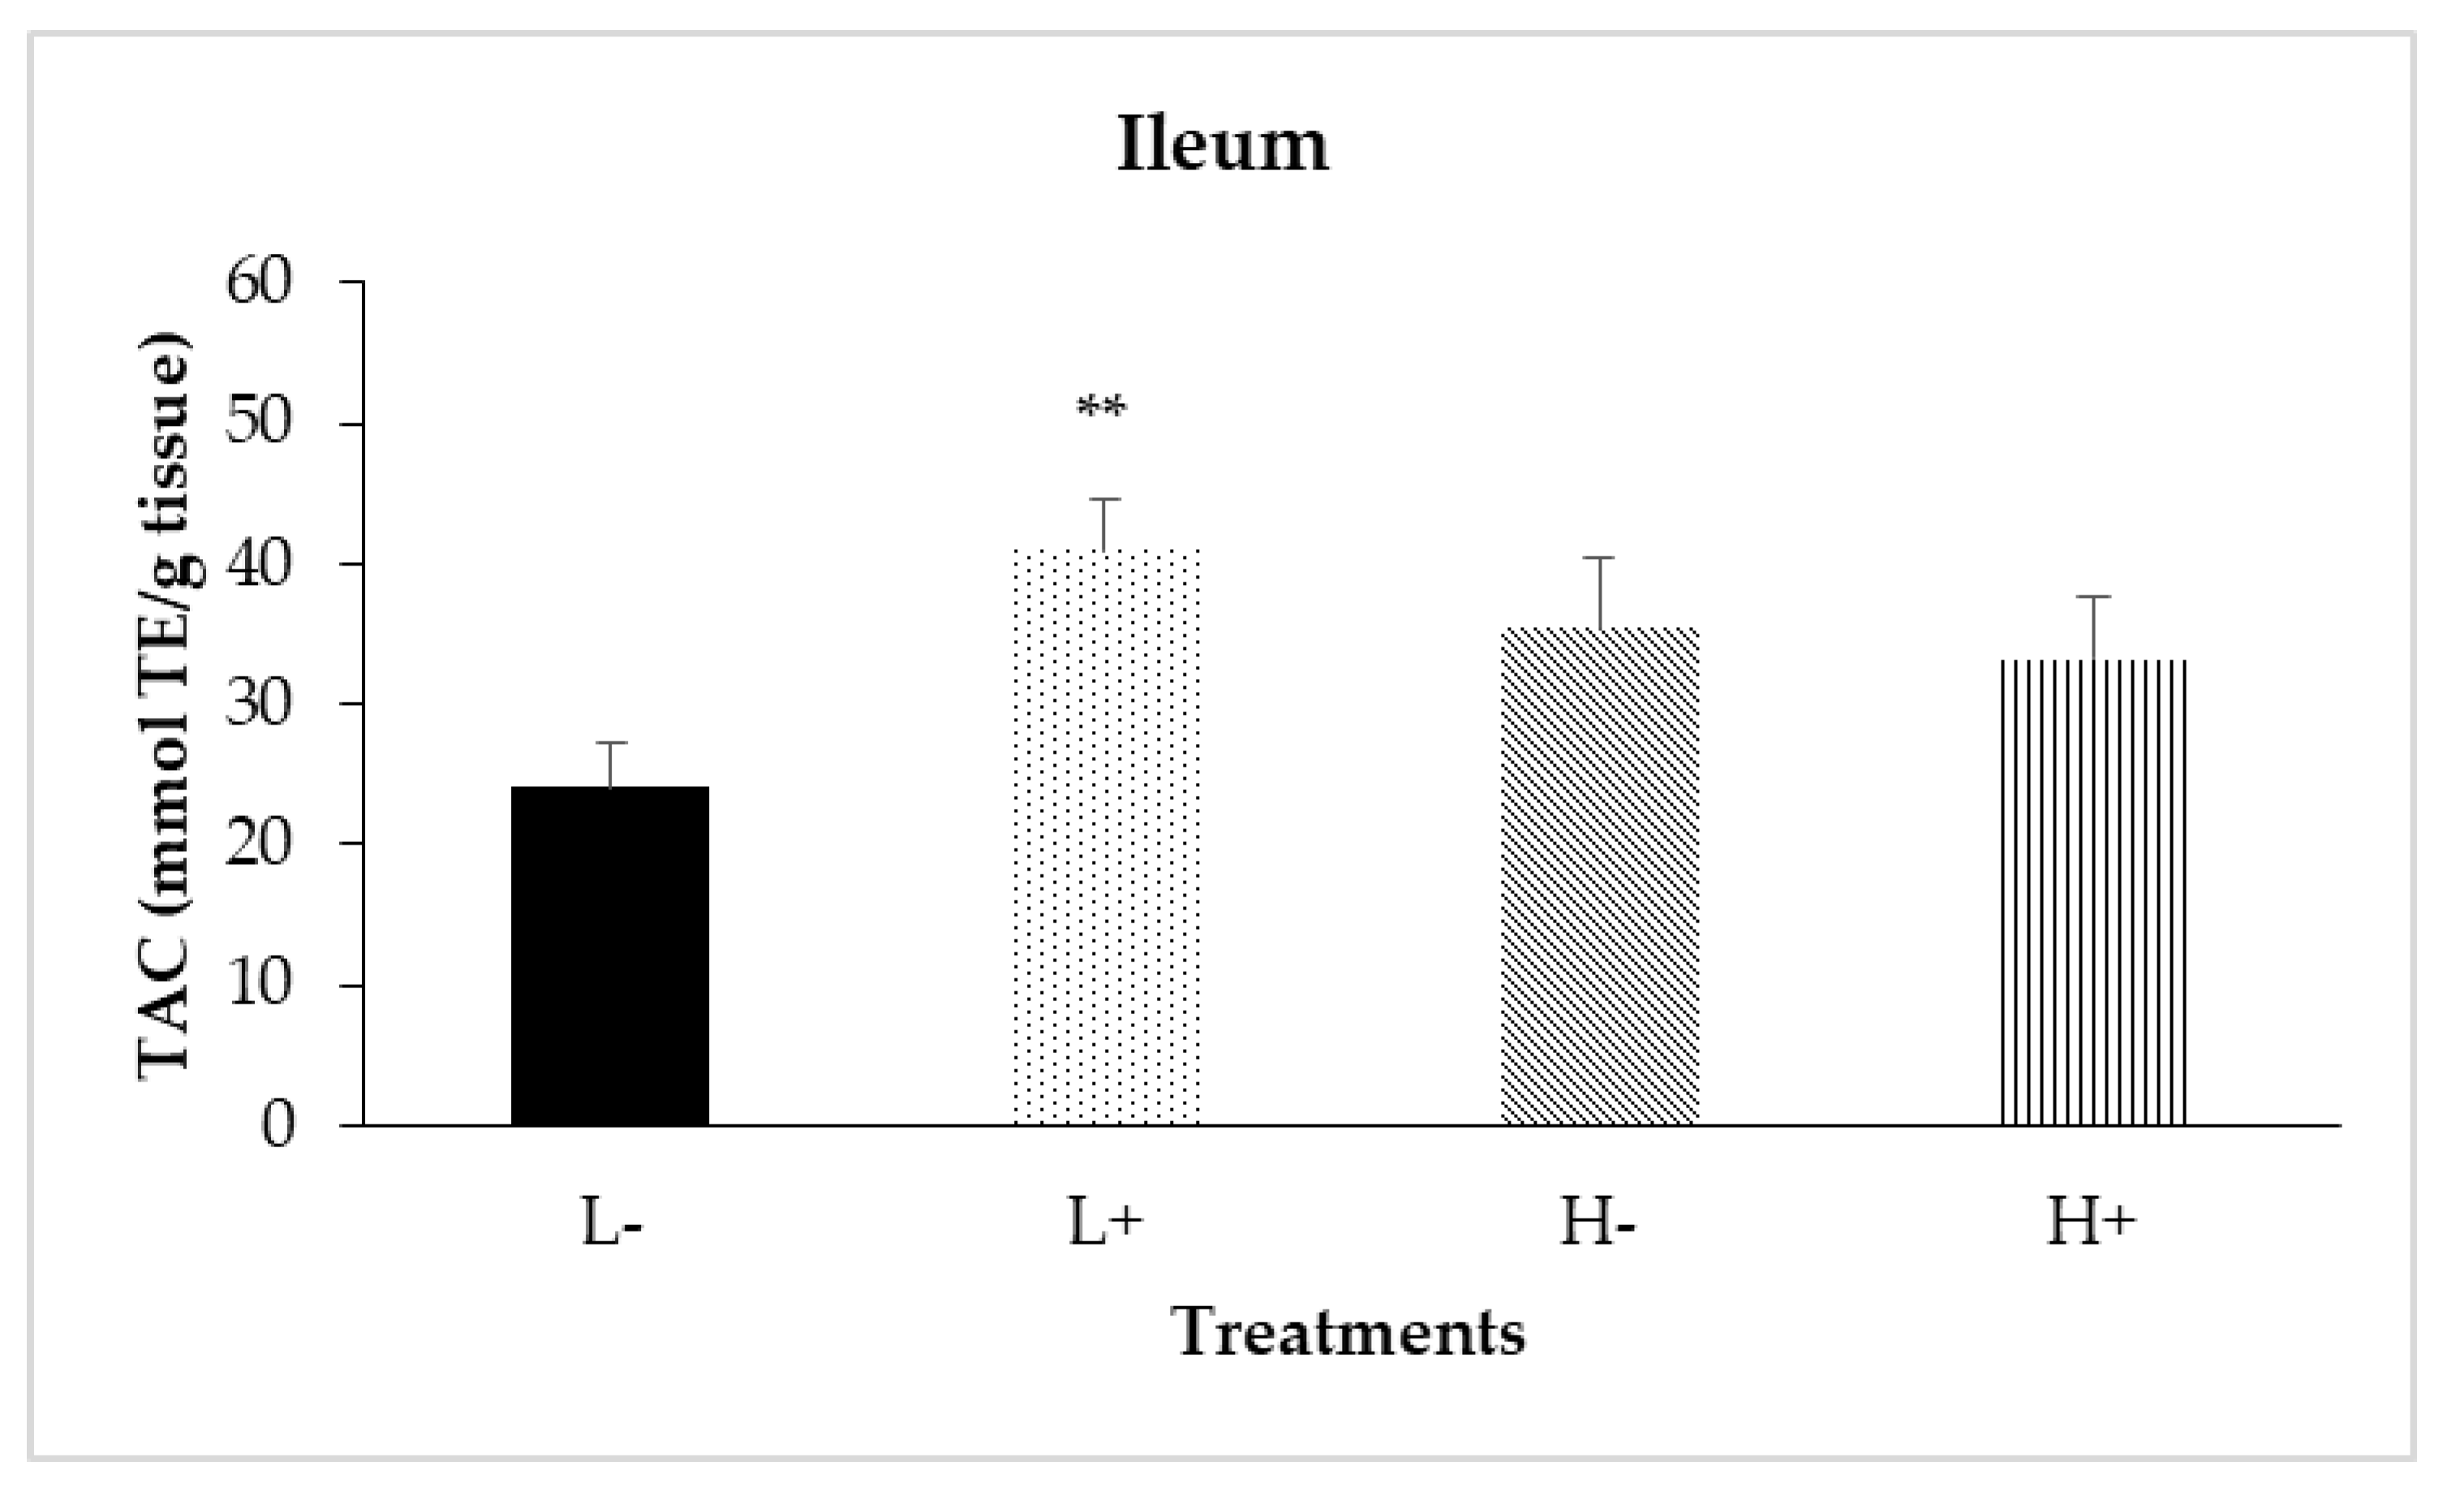
Significant interactions between diet type and PFA inclusion for TAC were noted in the duodenal (PD×P = 0.024) and ileal (PD×P = 0.007) mucosa as shown in Figure 4 and Figure 5, respectively. In particular, treatment L+ had higher TAC compared to the other treatments. In addition, diet type significantly affected TAC in jejunal mucosa (PD = 0.001) with broilers fed diet type H having higher TAC compared to broilers fed diet type L.
Finally, as presented in Table 7, PFA inclusion significantly increased TAC in the jejunal (PP < 0.001), ileal (PP = 0.033) and cecal (PP = 0.032) mucosa.
4. Discussion
A deeper understanding of the effects of dietary energy and protein levels on broiler gut function and health is still warranted. In this study, overall BWG and FCR were better in chickens receiving diet type H compared to diet type L (Table 2). These results were in line with previous studies regarding effects on performance and relevant biological responses [29,30,31,32]. However, the topic of energy and protein reduction on metabolic pathways related to cyto-protection via the Nrf2/ARE pathway is still scarce in broilers. On the other hand, there are indications for beneficial effects of dietary energy and protein reductions on the Nrf2/ARE pathway for adult humans [10,11].
In this study, overall body weight gain and FCR were improved in chickens receiving PFA, especially in the case of diet type L, whereas chickens in treatment L+ were better compared to L− (Table 2). Similar results have been previously reported [1,29,31]. Phytogenic compounds beyond their benefits for growth performance, nutrient digestibility and meat antioxidant capacity in broilers [1,29,31,33] are currently gaining attention for their functional role on critical elements of gut barrier integrity and inflammation [34,35,36]. Interestingly, emerging evidence reveals that PFA may modulate beneficially the Nrf2/ARE pathway in the broiler gut [3,37].
Therefore, the present study aimed to generate new knowledge regarding the effects of dietary energy and protein levels in conjunction or not with PFA supplementation on the stimulation of antioxidant and cyto-protective enzymes, via the activation of Nrf2/ARE pathway. For this reason, this study has employed a powerful analytical palette of gene coding for cytoprotective factors and enzymes in order to profile diet and PFA effects along the broiler gut. The genes and factors studied include a number of phase-2 proteins and antioxidant gene components of the Nrf2 signaling pathway (i.e., Nrf2, Keap1, CAT, SOD1, XOR, GPX2, GPX7, HMOX1, NQO1, GST, GSR, PRDX1 and TXN).
In this study, the overall feed intake did not differ significantly between the experimental treatments. Therefore, according to diet specifications, birds on the low specification diet (i.e., treatments L and L+) had indeed lower overall ME and CP intake by approximately 5%, compared to birds on the high dietary specification (i.e., treatments H and H+).
Data analysis revealed interactions between diet type and PFA inclusion for HMOX1 and GPX2. In particular, the low diet specs in combination with PFA supplementation up-regulated the GPX2 gene in the ileal intestinal segment. Meanwhile, HMOX1 in duodenum had shown a significant up-regulation in all treatments compared to L−. However, in ileum relative gene expression of HMOX1 was increased only in H+ treatment. Regarding the interactions between diet and PFA, the biological significance of a single gene changes (HMOX1) by its own is questionable and could be considered with the findings about GPX2 gene and TAC results in ileum (Table 5) that indicate PFA role in improving antioxidant capacity. Concerning the segment dependence for gene responses, PFA constituents had been shown to be mainly absorbed in the proximal gut (e.g., stomach and duodenum) [38]. As it was observed in this study, the examined genes that were up-regulated in duodenum upon PFA addition were above 60% (8/13 genes).
Moreover, reduced energy intake has been shown to intensify the repairment of DNA systems, advocate the elimination of damaged proteins and oxidized lipids and increase antioxidative defense mechanisms in humans [16], rats and monkeys [39,40]. The results of the present study support the modulatory effects of lower ME and CP intake towards an improved broiler anti-oxidative status. In particular, the low diet specs up-regulated the expression of genes relevant for cyto-protection (i.e., Keap1, GPX2, GPX7 and PRDX1) mainly at the cecal level. In addition, benefits of reduced ME and CP diet specs for other gut health biomarkers (i.e., TLR, tight junctions) have also been shown previously in broiler ceca [36].
In this study, PFA supplementation resulted in Keap1 up-regulation in the duodenum. This could be considered relevant for overall gut inflammation management since Keap1, besides its active participation in the Nrf2 pathway [41], also inhibits NF-κΒ via binding to its activator protein Ikkb [42]. Up-regulation of Keap1 and down-regulation of NF-κΒ have recently been shown in the case of a PFA dose response study in broilers [3].
The PFA inclusion in this study up-regulated CAT and SOD1 expressions in the duodenal mucosa. Increased CAT and SOD1 activity have been shown in broiler blood following PFA addition [43], whereas [44] observed a significant up-regulation in these two enzymes with oregano essential oil (carvacrol) addition in porcine small intestinal epithelial cells. Furthermore, a significant up-regulation of SOD1 expression in duodenal, jejunal and cecal mucosa has been shown in a PFA dose response study in broilers [3].
Irrespective of diet type, the administration of PFA up-regulated NQO1 in the duodenal mucosa. In another study, an up-regulated NQO1 expression in the duodenum was also shown following PFA supplementation [3]. NQO1, as mentioned earlier, catalyzes the two-electron mediated reduction of quinones to hydroquinones, which is commonly proposed as a mechanism of detoxification [12].
Furthermore, in this study, PFA inclusion resulted in increased GSR, PRDX1 and TXN expressions in duodenal mucosa. Although there are no other relevant studies to compare directly, PRDX1 up-regulation has also been reported in the case of other gut function modulating additives such as mannan-oligosaccharides in young broilers chickens [45].
From all the above, it appears that there are differences regarding the intensity and intestinal site specificity of PFA modulation of the Nrf2 pathway components, between various studies [3,36,37]. It is possible that phytogenic composition and inclusion level, as well as the absorption and metabolism kinetics of phytogenic active components within the birds, could possibly account for the differences between studies. However, the required knowledge on these topics is still rather limited.
The effects of PFA on the broiler intestine at a molecular level have been recently shown to correlate with increased intestinal mucosa TAC [3]. Similarly, in this study, PFA inclusion resulted in increased TAC in the jejunum, ileum and ceca. Overall, both studies above provide evidence for PFA cytoprotective and anti-oxidative potential at the broiler intestine.
5. Conclusions
In conclusion, this study has confirmed our previous findings on performance [1,31] and provided new knowledge for the effects of diet ME and CP specs on host antioxidant response. We found that a more intense priming of host antioxidant response was seen in birds fed the diets with ME and CP reduced by 5% of the recommended optimal dietary specifications for the broiler genetic line used. Moreover, beyond the known PFA benefits for performance [1,31], the study results have highlighted the PFA potential for host antioxidant protection, detoxification and inflammation management at intestinal level. Interestingly, it was shown that when PFA was used in conjunction with the low specifications diet, the cyto-protection potential at the intestine was maximized. From a human perspective, and given the higher than 60% homology between the Gallus gallus and the human genome [46], study findings could also be relevant for human gut health as contemporary dietary recommendations for reduced food intake and use of plant bioactive compounds increase in popularity.
Author Contributions
Conceptualization, K.C.M. and E.G.; methodology, E.G.; software, E.G. and V.P.; validation, K.C.M., V.P. and E.G.; formal analysis, E.G. and V.P.; investigation, E.G. and V.P.; resources, K.C.M.; data curation, K.C.M. and E.G.; writing—original draft preparation, K.C.M., E.G., V.P.; writing—review and editing, K.C.M. and E.G.; visualization, K.C.M. and E.G.; supervision, K.C.M.; project administration, K.C.M.; funding acquisition, K.C.M. All authors have read and agreed to the published version of the manuscript.
Funding
This research was funded by Biomin Holding GmbH, grant number AUA 06.0047.
Institutional Review Board Statement
The study was conducted according to the guidelines of the current European Union Directive on the protection of animals used for scientific purposes EC 2007 and EU 2010 and was approved by the relevant national authority. Author(s) warrant that this manuscript contains no violation of any existing copyright or other third-party right or any material of an obscene, indecent, libelous, or otherwise unlawful nature and that to the best of their knowledge the manuscript does not infringe the rights of others.
Informed Consent Statement
Not applicable.
Data Availability Statement
The data analyzed during the current study are available from the corresponding author on reasonable request.
Acknowledgments
Authors would like to thank Anagnostopoulos for his assistance during the animal trial.
Conflicts of Interest
The authors declare no conflict of interest.
References
- Mountzouris, K.; Paraskevas, V.; Tsirtsikos, P.; Palamidi, I.; Steiner, T.; Schatzmayr, G.; Fegeros, K. Assessment of a phytogenic feed additive effect on broiler growth performance, nutrient digestibility and caecal microflora composition. Anim. Feed Sci. Technol. 2011, 168, 223–231. [Google Scholar] [CrossRef]
- Amad, A.; Manner, K.; Wendler, K.; Neumann, K.; Zentek, J. Effects of a phytogenic feed additive on growth performance and ileal nutrient digestibility in broiler chickens. Poult. Sci. 2011, 90, 2811–2816. [Google Scholar] [CrossRef]
- Mountzouris, K.C.; Paraskeuas, V.; Fegeros, K. Priming of intestinal cytoprotective genes and antioxidant capacity by dietary phytogenic inclusion in broilers. Anim. Nutr. 2020, 6, 305–312. [Google Scholar] [CrossRef]
- Vomund, S.; Schäfer, A.; Parnham, M.J.; Brüne, B.; Knethen, A. Nrf2, the master regulator of anti-oxidative responses. Int. J. Mol. Sci. 2017, 18, 2772. [Google Scholar] [CrossRef] [Green Version]
- Sahin, K.; Orhan, C.; Tuzcu, M.; Ali, S.; Sahin, N.; Hayirli, A. Epigallocatechin-3-gallate prevents lipid peroxidation and enhances antioxidant defense system via modulating hepatic nuclear transcription factors in heat-stressed quails. Poult. Sci. 2010, 89, 2251–2258. [Google Scholar] [CrossRef]
- Stefanson, A.; Bakovic, M. Dietary Regulation of Keap1/Nrf2/ARE Pathway: Focus on Plant-Derived Compounds and Trace Minerals. Nutrients 2014, 6, 3777–3801. [Google Scholar] [CrossRef] [Green Version]
- Chen, X.; Li, R.; Geng, Z. Cold stress initiates the Nrf2/UGT1A1/L-FABP signaling pathway in chickens. Poult. Sci. 2015, 94, 2597–2603. [Google Scholar] [CrossRef]
- Lu, M.; Ji, J.; Jiang, Z.; You, Q. The Keap1-Nrf2-ARE pathway as a potential preventive and therapeutic target: An update. Med. Res. Rev. 2016, 36, 924–963. [Google Scholar] [CrossRef]
- Baird, L.; Dinkova-Kostova, A. The cytoprotective role of the Keap1–Nrf2 pathway. Arch. Toxicol. 2011, 85, 241–272. [Google Scholar] [CrossRef]
- Lee, M.; Lin, W.; Yu, B.; Lee, T. Antioxidant capacity of phytochemicals and their potential effects on oxidative status in animals—A review. Asian-Australas. J. Anim. Sci. 2016, 30, 299–308. [Google Scholar] [CrossRef]
- Delles, R.; Xiong, Y.; True, A.; Ao, T.; Dawson, K. Dietary antioxidant supplementation enhances lipid and protein oxidative stability of chicken broiler meat through promotion of antioxidant enzyme activity1. Poult. Sci. 2014, 93, 1561–1570. [Google Scholar] [CrossRef]
- Dinkova-Kostova, A.; Talalay, P. NAD(P)H quinone acceptor oxidoreductase 1 (NQO1), a multifunctional antioxidant enzyme and exceptionally versatile cytoprotector. Arch. Biochem. Biophys. 2010, 501, 116–123. [Google Scholar] [CrossRef] [Green Version]
- Zhang, G.; Yang, Z.; Wang, Y.; Yang, W. Effects of Astragalus membranaceus root processed to different particle sizes on growth performance, antioxidant status, and serum metabolites of broiler chickens1. Poult. Sci. 2012, 92, 178–183. [Google Scholar] [CrossRef]
- Ding, C.; Fan, X.; Wu, G. Peroxiredoxin 1—An antioxidant enzyme in cancer. J. Cell. Mol. Med. 2016, 21, 193–202. [Google Scholar] [CrossRef]
- Collet, J.F.; Messens, J. Structure, function and mechanism of thioredoxin proteins. Antioxid. Redox Signal. 2010, 13, 1205–1216. [Google Scholar] [CrossRef]
- Fontana, L. The scientific basis of caloric restriction leading to longer life. Curr. Opin. Gastroenterol. 2009, 25, 144–150. [Google Scholar] [CrossRef]
- Roth, G.S.; Ingram, D.K.; Black, A.; Lane, M.A. Effects of reduced energy intake on the biology of aging: The primate model. Eur. J. Clin. Nutr. 2000, 54, S15–S20. [Google Scholar] [CrossRef]
- Bocci, V.; Valacchi, G. Nrf2 activation as target to implement therapeutic treatments. Front. Chem. 2015, 3, 4. [Google Scholar] [CrossRef] [Green Version]
- Li, Y.R.; Li, G.H.; Zhou, M.X.; Xiang, L.; Ren, D.M.; Lou, H.X.; Wang, X.N.; Shen, T. Discovery of natural flavonoids as activators of Nrf2-mediated defense system. Structure-activity relationship and inhibition of intracellular oxidative insults. Biorg. Med. Chem. 2018, 26, 5140–5150. [Google Scholar] [CrossRef]
- Qin, S.; Hou, D.X. The biofunctions of phytochemicals and their applications in farm animals: The Nrf2/Keap1 system as a target. Engineering 2017, 3, 738–752. [Google Scholar] [CrossRef]
- Kaschubek, T.; Mayer, E.; Rzesnik, S.; Grenier, B.; Bachinger, D.; Schieder, C.; Konig, J.; Teichmann, K. Effects of phytogenic feed additives on cellular oxidative stress and inflammatory reactions in intestinal porcine epithelial cells. J. Anim. Sci. 2018, 96, 3657–3669. [Google Scholar] [CrossRef]
- Surai, P.F.; Kochish, I.I.; Fisinin, V.I.; Kidd, M.T. Antioxidant defense systems and oxidative stress in poultry biology: An update. Antioxidants 2019, 8, 235. [Google Scholar] [CrossRef] [Green Version]
- EC. 43. Council directive of June 2007 laying down minimum rules for the protection of chickens kept for meat production. Off. J. Eur. Union 2007, 182, 19–28.
- EU. 63. Directive of the European Parliament and of the Council of 22 Spetember 2010 on the protection of animals used for scientific purposes. Off. J. Eur. Union 2010, 276, 33–79.
- Pfaffl, M. A new mathematical model for relative quantification in real-time RT-PCR. Nucleic Acids Res. 2001, 29, e45. [Google Scholar] [CrossRef]
- Hellemans, J.; Mortier, G.; Paepe, A.D.; Speleman, F.; Vandesompele, J. qBase relative quantification framework and software for management and automated analysis of real-time quantitative PCR data. Genome Biol. 2007, 8, R19. [Google Scholar] [CrossRef] [Green Version]
- Cao, G.; Prior, R. Measurement of oxygen radical absorbance capacity in biological samples. Methods Enzymol. 1999, 299, 50–62. [Google Scholar]
- Prior, R.; Hoang, H.; Gu, L.; Wu, X.; Bacchiocca, M.; Howard, L.; Hampsch-Woodill, M.; Huang, D.; Ou, B.; Jacob, R. Assays for Hydrophilic and Lipophilic Antioxidant Capacity (oxygen radical absorbance capacity (ORACFL)) of Plasma and Other Biological and Food Samples. J. Agric. Food Chem. 2003, 51, 3273–3279. [Google Scholar] [CrossRef]
- Bravo, D.; Pirgozliev, V.; Rose, S. A mixture of carvacrol, cinnamaldehyde, and capsicum oleoresin improves energy utilization and growth performance of broiler chickens fed maize-based diet. J. Anim. Sci. 2014, 92, 1531–1536. [Google Scholar] [CrossRef] [Green Version]
- Yang, J.; Liu, L.; Sheikhahmadi, A.; Wang, Y.; Li, C.; Jiao, H.; Lin, H.; Song, Z. Effects of Corticosterone and dietary energy on immune function of broiler chickens. PLoS ONE 2015, 10, e0119750. [Google Scholar] [CrossRef] [Green Version]
- Paraskeuas, V.; Fegeros, K.; Palamidi, I.; Theodoropoulos, G.; Mountzouris, K.C. Phytogenic administration and reduction of dietary energy and protein levels affects growth performance, nutrient digestibility and antioxidant status of broilers. J. Poult. Sci. 2016, 53, 264–273. [Google Scholar] [CrossRef] [Green Version]
- Taleb, Z.; Sadeghi1, A.A.; Shawrang, P.; Chamani, M.; Aminafshar, M. Effect of energy levels and sources on the blood attributes and immune response in broiler chickens exposed to heat stress. J. Livest. Sci. 2017, 8, 52–58. [Google Scholar]
- Hafeez, A.; Männer, K.; Schieder, C.; Zentek, J. Effect of supplementation of phytogenic feed additives (powdered vs. encapsulated) on performance and nutrient digestibility in broiler chickens. Poult. Sci. 2015, 95, 622–629. [Google Scholar] [CrossRef]
- Du, E.; Wang, W.; Gan, L.; Li, Z.; Guo, S.; Guo, Y. Effects of thymol and carvacrol supplementation on intestinal integrity and immune responses of broiler chickens challenged with Clostridium perfrngens. J. Anim. Sci. Biotechnol. 2016, 7, 2–10. [Google Scholar] [CrossRef] [Green Version]
- Paraskeuas, V.; Mountzouris, K.C. Broiler gut microbiota and expression of gut barrier genes affected by cereal type and phytogenic inclusion. Anim. Nutr. 2019, 5, 22–31. [Google Scholar] [CrossRef]
- Paraskeuas, V.; Mountzouris, K.C. Modulation of broiler gut microbiota and gene expression of Toll-like receptors and tight junction proteins by diet type and inclusion of phytogenics. Poult. Sci. 2019, 98, 2220–2230. [Google Scholar] [CrossRef] [PubMed]
- Mueller, K.; Blum, N.; Kluge, H.; Mueller, A. Influence of broccoli extract and various essential oils on performance and expression of xenobiotic- and antioxidant enzymes in broiler chickens. Br. J. Nutr. 2011, 108, 588–602. [Google Scholar] [CrossRef] [Green Version]
- Michiels, J.; Missotten, J.; Dierick, N.; Fremaut, D.; Maene, P.; De Smet, S. In vitro degradation and in vivo passage kinetics of carvacrol, thymol, eugenol and trans-cinnamaldehyde along the gastrointestinal tract of piglets. J. Sci. Food Agric. 2008, 88, 2371–2381. [Google Scholar] [CrossRef]
- Zainal, T.; Oberley, T.; Allison, D.; Szweda, L.; Weindruch, R. Caloric restriction of rhesus monkeys lowers oxidative damage in skeletal muscle. FASEB J. 2000, 14, 1825–1836. [Google Scholar] [CrossRef] [Green Version]
- Cho, C. Modulation of glutathione and thioredoxin systems by calorie restriction during the aging process. Exp. Gerontol. 2003, 38, 539–548. [Google Scholar] [CrossRef]
- Jung, K.; Kwak, M. The Nrf2 system as a potential target for the development of indirect antioxidants. Molecules 2010, 15, 7266–7291. [Google Scholar] [CrossRef] [PubMed] [Green Version]
- Kostyuk, S.; Porokhovnik, L.; Ershova, E.; Malinovskaya, E.; Konkova, M.; Kameneva, L.; Dolgikh, O.; Veiko, V.; Pisarev, V.; Martynov, A.; et al. Changes of KEAP1/NRF2 and IKB/NF-κB Expression Levels Induced by Cell-Free DNA in Different Cell Types. Oxid. Med. Cell. Longev. 2018, 2018, 1–17. [Google Scholar] [CrossRef] [Green Version]
- Ahmadi, F. Effect of turmeric powder on performance, oxidative stress state and some of blood parameters in broiler fed on diets containing aflatoxin. Glob. Vet. 2010, 5, 312–317. [Google Scholar]
- Zou, Y.; Wang, J.; Peng, J.; Wei, H. Oregano essential oil induces SOD1 and GSH expression through Nrf2 activation and alleviates hydrogen peroxide—Induced oxidative damage in JPEC-J2 cells. Oxid. Med. Cell. Longev. 2016, 2016, 1–13. [Google Scholar]
- Xiao, R.; Power, R.; Mallonee, D.; Routt, K.; Spangler, L.; Pescatore, A.; Cantor, A.; Ao, T.; Pierce, J.; Dawson, K. Effects of yeast cell wall-derived mannan-oligosaccharides on jejunal gene expression in young broiler chickens. Poult. Sci. 2012, 91, 1660–1669. [Google Scholar] [CrossRef]
- Lagerstrom, M.C.; Hellstrom, A.R.; Gloriam, D.E.; Larsson, T.P.; Schioth, H.B.; Fredriksson, R. The G Protein-Coupled receptor subset of the chicken genome. PLoS Comput. Biol. 2006, 6, 493–507. [Google Scholar] [CrossRef] [Green Version]
Figure 1.
Interaction effects of diet type and phytogenic feed additive (PFA) supplementation on relative gene expression of HMOX1 in the duodenal mucosa of 42-day-old broilers. Columns indicate treatments means + SD and the asterisks denotes statistical difference (PD×P = 0.017).
Figure 1.
Interaction effects of diet type and phytogenic feed additive (PFA) supplementation on relative gene expression of HMOX1 in the duodenal mucosa of 42-day-old broilers. Columns indicate treatments means + SD and the asterisks denotes statistical difference (PD×P = 0.017).

Figure 2.
Interaction effects of diet type and phytogenic feed additive (PFA) supplementation on relative gene expression of GPX2 in ileal mucosa of 42-day-old broilers. Columns indicate treatments means + SD, and the asterisk(s) denotes statistical difference (PD×P = 0.007).
Figure 2.
Interaction effects of diet type and phytogenic feed additive (PFA) supplementation on relative gene expression of GPX2 in ileal mucosa of 42-day-old broilers. Columns indicate treatments means + SD, and the asterisk(s) denotes statistical difference (PD×P = 0.007).

Figure 3.
Interaction effects of diet type and phytogenic feed additive (PFA) supplementation on relative gene expression of HMOX1 in ileal mucosa of 42-day-old broilers. Columns indicate treatments means + SD, and the asterisk denotes statistical difference (PD×P = 0.024).
Figure 3.
Interaction effects of diet type and phytogenic feed additive (PFA) supplementation on relative gene expression of HMOX1 in ileal mucosa of 42-day-old broilers. Columns indicate treatments means + SD, and the asterisk denotes statistical difference (PD×P = 0.024).

Figure 4.
Interaction effects of diet type and phytogenic feed additive (PFA) supplementation on total antioxidant capacity (TAC) of duodenal mucosa of 42-day-old broilers. Columns indicate treatments means + SD, and the asterisk denotes statistical difference (PD×P = 0.024).
Figure 4.
Interaction effects of diet type and phytogenic feed additive (PFA) supplementation on total antioxidant capacity (TAC) of duodenal mucosa of 42-day-old broilers. Columns indicate treatments means + SD, and the asterisk denotes statistical difference (PD×P = 0.024).

Figure 5.
Interaction effects of diet type and phytogenic feed additive (PFA) supplementation on total antioxidant capacity of ileal mucosa of 42-day-old broilers. Columns indicate treatments means + SD, and the asterisk(s) denotes statistical difference (PD×P = 0.007).
Figure 5.
Interaction effects of diet type and phytogenic feed additive (PFA) supplementation on total antioxidant capacity of ileal mucosa of 42-day-old broilers. Columns indicate treatments means + SD, and the asterisk(s) denotes statistical difference (PD×P = 0.007).


Table 1.
Oligonucleotide primers used for gene expression of selected targets by quantitative real time PCR.
Table 1.
Oligonucleotide primers used for gene expression of selected targets by quantitative real time PCR.
| Target | Primer Sequence (5′-3′) | Annealing Temperature (°C) | PCR Product Size (bp) | GenBank (NCBI Reference Sequence) |
|---|---|---|---|---|
| GAPDH | F: ACTTTGGCATTGTGGAGGGT R: GGACGCTGGGATGATGTTCT | 59.5 | 131 | NM_204305.1 |
| ACTB | F: CACAGATCATGTTTGAGACCTT R: CATCACAATACCAGTGGTACG | 60 | 101 | NM_205518.1 |
| Nrf2 | F: AGACGCTTTCTTCAGGGGTAG R: AAAAACTTCACGCCTTGCCC | 60 | 285 | NM_205117.1 |
| Keap1 | F: GGTTACGATGGGACGGATCA R: CACGTAGATCTTGCCCTGGT | 62 | 135 | XM_025145847.1 |
| CAT | F: ACCAAGTACTGCAAGGCGAA R: TGAGGGTTCCTCTTCTGGCT | 60 | 245 | NM_001031215 |
| SOD1 | F: AGGGGGTCATCCACTTCC R: CCCATTTGTGTTGTCTCCAA | 60 | 122 | NM_205064.1 |
| XOR | F:GTGTCGGTGTACAGGATACAGAC R:CCTTACTATGACAGCATCCAGTG | 61 | 110 | NM_205127.1 |
| GPX2 | F: GAGCCCAACTTCACCCTGTT R: CTTCAGGTAGGCGAAGACGG | 62 | 75 | NM_001277854.1 |
| GPX | F: GGCTCGGTGTCGTTAGTTGT R: GCCCAAACTGATTGCATGGG | 60 | 139 | NM_001163245.1 |
| HMOX1 | F: ACACCCGCTATTTGGGAGAC R: GAACTTGGTGGCGTTGGAGA | 62 | 134 | NM_205344.1 |
| NQO1 | F: GAGCGAAGTTCAGCCCAGT R: ATGGCGTGGTTGAAAGAGGT | 60.5 | 150 | NM_001277619.1 |
| GST | F: GCCTGACTTCAGTCCTTGGT R: CCACCGAATTGACTCCATCT | 60 | 138 | NM_001001776.1 |
| GSR | F: GTGGATCCCCACAACCATGT R: CAGACATCACCGATGGCGTA | 62 | 80 | XM_015276627.1 |
| PRDX1 | F: CTGCTGGAGTGCGGATTGT R: GCTGTGGCAGTAAAATCAGGG | 61 | 105 | NM_001271932.1 |
| TXN | F:ACGGAAAGAAGGTGCAGGAAT R: GATCCAGACATGCTCCGATGT | 60 | 110 | NM_205453.1 |
F—Forward; R—Reverse; GAPDH—glyceraldehyde 3-phosphate dehydrogenase; ACTB—actin beta; Nrf2—nuclear factor; erythroid 2-like 2; KEAP1—kelch-like ECH-associated protein 1; CAT—catalase; SOD1—superoxide dismutase 1; XOR —xanthine oxidoreductase; GPX 2, 7—glutathione peroxidase 2, 7; HMOX1—heme oxygenase 1; NQO1—NAD(P)H quinone dehydrogenase 1; GST—glutathione S-transferase; GSR—glutathione-disulfide reductase; PRDX1—peroxiredoxin-1; TXN—thioredoxin.
Table 2.
Overall broiler growth performance responses.
| Overall BWG (g) | Overall FI (g) | Overall FCR (g FI/g BWG) | |
|---|---|---|---|
| Diet type 1 | |||
| L | 2411.7 A | 4114.9 A | 1.71 B |
| H | 2692.1 B | 4194.3 B | 1.56 A |
| PFA addition 2 | |||
| No | 2523.1 X | 4138.2 | 1.65 Y |
| Yes | 2580.7 Y | 4171.1 | 1.62 X |
| Treatments (Interactions) | |||
| L− | 2353.3 a | 4086.3 | 1.74 c |
| L+ | 2470.1 b | 4143.6 | 1.68 b |
| H− | 2692.8 c | 4190.1 | 1.56 a |
| H+ | 2691.3 c | 4198.6 | 1.56 a |
| SEM 4 | 16.78 | 38.20 | 0.013 |
| PD3 | <0.001 | 0.046 | <0.001 |
| PP3 | 0.002 | 0.395 | 0.043 |
| PD×P3 | 0.001 | 0.528 | 0.024 |
1 Diet type: L (i.e., 95% of recommended ME and CP specs) and H (i.e., 100% of recommended ME and CP specs). 2 Phytogenic feed additive (PFA) supplementation (No = 0 mg/kg diet and Yes = 150 mg/kg diet). 3 Means within the same column with different superscripts per diet type (A, B), PFA addition (X,Y) and their interactions (a, b, c) differ significantly (P < 0.05). 4 Pooled standard error of means.
Table 3.
Relative expression of the Nrf2/ARE pathway genes in the duodenal mucosa of 42-day-old broilers.
Table 3.
Relative expression of the Nrf2/ARE pathway genes in the duodenal mucosa of 42-day-old broilers.
| Item | Type of Diet 2 | PFA Supplementation 3 | p-Values 4 | |||||
|---|---|---|---|---|---|---|---|---|
| Duodenum | L | H | No | Yes | SEM 5 | Diet (D) | PFA (P) | D × P |
| Genes 1 | ||||||||
| Nrf2 | 1.01 | 1.29 | 1.17 | 1.13 | 0.222 | 0.224 | 0.836 | 0.794 |
| KEAP1 | 1.08 | 1.05 | 0.89 X | 1.25 Y | 0.096 | 0.753 | 0.001 | 0.125 |
| CAT | 2.22 | 2.15 | 1.78 X | 2.59 Y | 0.366 | 0.842 | 0.035 | 0.491 |
| SOD1 | 1.02 | 1.14 | 0.92 X | 1.24 Y | 0.131 | 0.385 | 0.019 | 0.063 |
| XOR | 1.16 | 1.04 | 0.97 | 1.23 | 0.184 | 0.513 | 0.171 | 0.475 |
| GPX2 | 1.69 B | 1.03 A | 1.06 | 1.66 | 0.313 | 0.043 | 0.063 | 0.170 |
| GPX7 | 1.33 | 1.23 | 1.49 | 1.07 | 0.367 | 0.791 | 0.262 | 0.862 |
| HMOX1 | 0.94 A | 1.19 B | 0.87 X | 1.26 Y | 0.101 | 0.017 | 0.001 | 0.017 |
| NQO1 | 1.11 | 1.01 | 0.86 X | 1.25 Y | 0.109 | 0.368 | 0.001 | 0.183 |
| GST | 1.48 | 1.15 | 1.03 | 1.60 | 0.327 | 0.271 | 0.071 | 0.934 |
| GSR | 1.10 | 1.18 | 0.93 X | 1.34 Y | 0.194 | 0.664 | 0.041 | 0.062 |
| PRDX1 | 1.77 | 1.62 | 1.38 X | 2.00 Y | 0.249 | 0.557 | 0.019 | 0.794 |
| TXN | 0.92 B | 1.26 A | 0.94 X | 1.24 Y | 0.136 | 0.019 | 0.035 | 0.120 |
1 Relative expression ratios of target genes was calculated according to [25] adapted for the multi-reference genes normalization procedure according to [26] using glyceraldehyde 3-phosphate dehydrogenase (GAPDH) and actin beta (ACTB) as reference genes. 2 Diet type: L (i.e., 95% of recommended ME and CP specs) and H (i.e., 100% of recommended ME and CP specs). Data shown per diet type represent treatment means from n = 18 broilers (e.g., for L diet, 9 from treatment L− and 9 from treatment L+). 3 Phytogenic feed additive (PFA) supplementation (No = 0 mg/kg diet and Yes = 150 mg/kg diet). Data shown for PFA represent means from n = 18 broilers (e.g., for No PFA supplementation, 9 from treatment L and 9 from treatment H). 4 Means within the same row with different superscripts per diet type (A, B) and PFA (X, Y) differ significantly (P < 0.05).5 Pooled standard error of means.
Table 4.
Relative expression of the Nrf2/ARE pathway genes in the jejunal mucosa of 42-day-old broilers.
Table 4.
Relative expression of the Nrf2/ARE pathway genes in the jejunal mucosa of 42-day-old broilers.
| Item | Type of Diet 2 | PFA Supplementation 3 | p-Values 4 | |||||
|---|---|---|---|---|---|---|---|---|
| Jejunum | L | H | No | Yes | SEM 5 | Diet (D) | PFA (P) | D × P |
| Genes 1 | ||||||||
| Nrf2 | 1.28 | 1.20 | 1.26 | 1.22 | 0.330 | 0.849 | 0.829 | 0.743 |
| Keap1 | 1.09 | 1.07 | 1.07 | 1.09 | 0.109 | 0.926 | 0.886 | 0.430 |
| CAT | 1.17 | 1.00 | 1.08 | 1.09 | 0.126 | 0.180 | 0.951 | 0.719 |
| SOD1 | 1.10 | 1.06 | 1.03 | 1.13 | 0.137 | 0.734 | 0.480 | 0.066 |
| XOR | 1.15 | 1.05 | 1.08 | 1.12 | 0.158 | 0.492 | 0.831 | 0.953 |
| GPX2 | 1.46 B | 0.87 A | 1.00 | 1.33 | 0.138 | 0.005 | 0.108 | 0.294 |
| GPX7 | 1.13 | 1.10 | 1.12 | 1.11 | 0.175 | 0.850 | 0.960 | 0.930 |
| HMOX1 | 0.96 | 1.22 | 1.01 | 1.16 | 0.095 | 0.064 | 0.285 | 0.375 |
| NQO1 | 1.04 | 1.08 | 1.09 | 1.03 | 0.088 | 0.766 | 0.628 | 0.793 |
| GST | 0.91 | 1.34 | 1.00 | 1.24 | 0.148 | 0.050 | 0.260 | 0.245 |
| GSR | 0.95 | 1.12 | 1.05 | 1.01 | 0.110 | 0.130 | 0.749 | 0.206 |
| PRDX1 | 2.39 B | 1.63 A | 1.99 | 2.01 | 0.225 | 0.002 | 0.908 | 0.654 |
| TXN | 1.06 | 1.09 | 1.11 | 1.04 | 0.136 | 0.818 | 0.637 | 0.824 |
1 Relative expression ratios of target genes was calculated according to [25] adapted for the multi-reference genes normalization procedure according to [26] using glyceraldehyde 3-phosphate dehydrogenase (GAPDH) and actin beta (ACTB) as reference genes. 2 Diet type: L (i.e., 95% of recommended ME and CP specs) and H (i.e., 100% of recommended ME and CP specs). Data shown per diet type represent treatment means from n = 18 broilers (e.g., for L diet, 9 from treatment L− and 9 from treatment L+). 3 Phytogenic feed additive (PFA) supplementation (No = 0 mg/kg diet and Yes = 150 mg/kg diet). Data shown for PFA represent means from n = 18 broilers (e.g., for No PFA supplementation, 9 from treatment L and 9 from treatment H).4 Means within the same row with different superscripts per diet type (A, B) differ significantly (P < 0.05). 5 Pooled standard error of means.
Table 5.
Relative expression of the Nrf2/ARE pathway genes in the ileal mucosa of 42-day-old broilers.
Table 5.
Relative expression of the Nrf2/ARE pathway genes in the ileal mucosa of 42-day-old broilers.
| Item | Type of Diet 2 | PFA Supplementation 3 | p-Values 4 | |||||
|---|---|---|---|---|---|---|---|---|
| Ileum | L | H | No | Yes | SEM 5 | Diet (D) | PFA (P) | D × P |
| Genes 1 | ||||||||
| Nrf2 | 1.33 | 1.05 | 1.35 | 1.03 | 0.226 | 0.220 | 0.166 | 0.114 |
| Keap1 | 1.11 | 1.03 | 1.02 | 1.12 | 0.126 | 0.553 | 0.438 | 0.433 |
| CAT | 1.26 B | 0.91 A | 1.00 | 1.17 | 0.120 | 0.006 | 0.149 | 0.151 |
| SOD1 | 1.11 | 1.00 | 1.06 | 1.05 | 0.113 | 0.336 | 0.903 | 0.981 |
| XOR | 1.05 | 1.08 | 1.04 | 1.08 | 0.128 | 0.836 | 0.757 | 0.724 |
| GPX2 | 1.45 | 1.06 | 0.81 X | 1.70 Y | 0.251 | 0.657 | <0.001 | 0.007 |
| GPX7 | 1.10 | 1.21 | 1.23 | 1.08 | 0.224 | 0.633 | 0.507 | 0.779 |
| HMOX1 | 0.96 | 1.20 | 0.97 | 1.19 | 0.134 | 0.096 | 0.115 | 0.024 |
| NQO1 | 1.18 | 0.95 | 1.05 | 1.08 | 0.119 | 0.058 | 0.845 | 0.184 |
| GST | 1.08 | 1.42 | 0.98 | 1.51 | 0.347 | 0.477 | 0.629 | 0.333 |
| GSR | 1.22 | 0.94 | 1.01 | 1.15 | 0.153 | 0.078 | 0.375 | 0.994 |
| PRDX1 | 1.65 | 2.06 | 1.57 | 2.14 | 0.289 | 0.163 | 0.060 | 0.125 |
| TXN | 1.03 | 1.13 | 1.08 | 1.08 | 0.155 | 0.528 | 0.994 | 0.599 |
1 Relative expression ratios of target genes were calculated according to [25] adapted for the multi-reference genes normalization procedure according to [26] using glyceraldehyde 3-phosphate dehydrogenase (GAPDH) and actin beta (ACTB) as reference genes. 2 Diet type: L (i.e., 95% of recommended ME and CP specs) and H (i.e., 100% of recommended ME and CP specs). Data shown per diet type represent treatment means from n = 18 broilers (e.g., for L diet, 9 from treatment L− and 9 from treatment L+). 3 Phytogenic feed additive (PFA) supplementation (No = 0 mg/kg diet and Yes = 150 mg/kg diet). Data shown for PFA represent means from n = 18 broilers (e.g., for No PFA supplementation, 9 from treatment L and 9 from treatment H). 4 Means within the same row with different superscripts per diet type (A, B) and PFA (X, Y) differ significantly (P < 0.05). 5 Pooled standard error of means.
Table 6.
Relative expression of the Nrf2/ARE pathway genes in cecal mucosa of 42-day-old broilers.
| Item | Type of Diet 2 | PFA Supplementation 3 | p-Values 4 | |||||
|---|---|---|---|---|---|---|---|---|
| Ceca | L | H | No | Yes | SEM 5 | Diet (D) | PFA (P) | D × P |
| Genes 1 | ||||||||
| Nrf2 | 1.16 | 1.14 | 1.18 | 1.13 | 0.204 | 0.910 | 0.787 | 0.718 |
| Keap1 | 1.31 B | 0.93 A | 1.01 | 1.24 | 0.147 | 0.014 | 0.133 | 0.077 |
| CAT | 1.05 | 1.24 | 0.91 | 1.38 | 0.255 | 0.454 | 0.077 | 0.202 |
| SOD1 | 1.13 | 1.11 | 1.04 | 1.20 | 0.172 | 0.926 | 0.352 | 0.135 |
| XOR | 1.21 | 1.07 | 1.00 | 1.28 | 0.262 | 0.402 | 0.393 | 0.359 |
| GPX2 | 1.40 B | 0.86 A | 1.02 | 1.24 | 0.166 | 0.003 | 0.198 | 0.102 |
| GPX7 | 1.39 B | 0.94 A | 1.08 | 1.25 | 0.201 | 0.032 | 0.406 | 0.144 |
| HMOX1 | 1.22 | 1.04 | 1.12 | 1.15 | 0.152 | 0.247 | 0.865 | 0.991 |
| NQO1 | 1.11 | 1.09 | 1.17 | 1.03 | 0.148 | 0.911 | 0.359 | 0.454 |
| GST | 1.34 | 0.99 | 0.98 X | 1.35 Y | 0.175 | 0.058 | 0.041 | 0.461 |
| GSR | 1.10 | 1.23 | 1.24 | 1.10 | 0.207 | 0.522 | 0.505 | 0.191 |
| PRDX1 | 1.94 B | 1.29 A | 1.44 | 1.79 | 0.221 | 0.006 | 0.127 | 0.962 |
| TXN | 1.21 | 1.05 | 0.99 | 1.27 | 0.199 | 0.445 | 0.167 | 0.560 |
1 Relative expression ratios of target genes were calculated according to [25] adapted for the multi-reference genes normalization procedure according to [26] using glyceraldehyde 3-phosphate dehydrogenase (GAPDH) and actin beta (ACTB) as reference genes. 2 Diet type: L (i.e., 95% of recommended ME and CP specs) and H (i.e., 100% of recommended ME and CP specs). Data shown per diet type represent treatment means from n = 18 broilers (e.g., for L diet, 9 from treatment L− and 9 from treatment L+). 3 Phytogenic feed additive (PFA) supplementation (No = 0 mg/kg diet and Yes = 150 mg/kg diet). Data shown for PFA represent means from n = 18 broilers (e.g., for No PFA supplementation, 9 from treatment L and 9 from treatment H). 4 Means within the same row with different superscripts per diet type (A, B) and PFA (X, Y) differ significantly (P < 0.05). 5 Pooled standard error of means.
Table 7.
Total antioxidant capacity (TAC) along the intestinal mucosa of 42-day-old broilers.
| TAC 1 (mmol TE/g Tissue) | Type of Diet 2 | PFA Supplementation 3 | SEM 4 | p-Values 5 | ||||
|---|---|---|---|---|---|---|---|---|
| Item | L | H | No | Yes | Diet (D) | PFA (P) | D × P | |
| Duodenum | 46.46 | 46.53 | 44.38 | 48.60 | 2.279 | 0.976 | 0.073 | 0.024 |
| Jejunum | 39.22 A | 52.38 B | 38.32 X | 53.29 Y | 3.748 | 0.001 | <0.001 | 0.250 |
| Ileum | 32.53 | 34.31 | 29.73 X | 37.11 Y | 3.316 | 0.594 | 0.033 | 0.007 |
| Ceca | 33.94 | 39.03 | 32.49 X | 40.48 Y | 3.564 | 0.163 | 0.032 | 0.300 |
TE = trolox equivalents. 1 Data represent treatment means from n = 9 replicate floor pens per treatment (L, L+, H, H+). 2 Diet type: L (i.e., 95% of recommended ME and CP specs) and H (i.e., 100% of recommended ME and CP specs). Data shown per diet type represent treatment means from n = 18 broilers (e.g., for diet type L, 9 from treatment L− and 9 from treatment L+). 3 Phytogenic feed additive (PFA) supplementation (No = 0 mg/kg diet and Yes = 150 mg/kg diet). Data shown for PFA represent means from n = 18 broilers (e.g., for No PFA supplementation, 9 from treatment L and 9 from treatment H). 4 Pooled standard error of means. 5 Means within the same row with different superscripts per diet type (A, B) and phytogenic feed additives (X, Y) differ significantly (P < 0.05).
Publisher’s Note: MDPI stays neutral with regard to jurisdictional claims in published maps and institutional affiliations. |
© 2021 by the authors. Licensee MDPI, Basel, Switzerland. This article is an open access article distributed under the terms and conditions of the Creative Commons Attribution (CC BY) license (http://creativecommons.org/licenses/by/4.0/).
Share and Cite
MDPI and ACS Style
Griela, E.; Paraskeuas, V.; Mountzouris, K.C. Effects of Diet and Phytogenic Inclusion on the Antioxidant Capacity of the Broiler Chicken Gut. Animals 2021, 11, 739. https://0-doi-org.brum.beds.ac.uk/10.3390/ani11030739
AMA Style
Griela E, Paraskeuas V, Mountzouris KC. Effects of Diet and Phytogenic Inclusion on the Antioxidant Capacity of the Broiler Chicken Gut. Animals. 2021; 11(3):739. https://0-doi-org.brum.beds.ac.uk/10.3390/ani11030739
Chicago/Turabian StyleGriela, Eirini, Vasileios Paraskeuas, and Konstantinos C. Mountzouris. 2021. "Effects of Diet and Phytogenic Inclusion on the Antioxidant Capacity of the Broiler Chicken Gut" Animals 11, no. 3: 739. https://0-doi-org.brum.beds.ac.uk/10.3390/ani11030739
Note that from the first issue of 2016, this journal uses article numbers instead of page numbers. See further details here.