Terrestrial Laser Scanner for the Formal Assessment of a Roman-Medieval Structure—The Cloister of the Cathedral of Tarragona (Spain)

 , , ,
, , ,
Abstract
:
1. Introduction
2. Materials and Methods
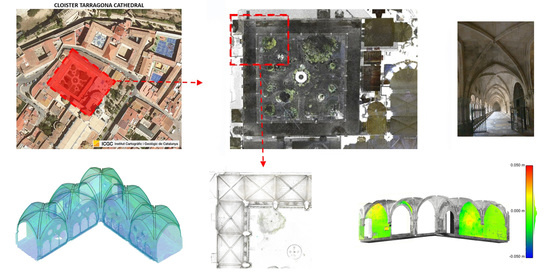
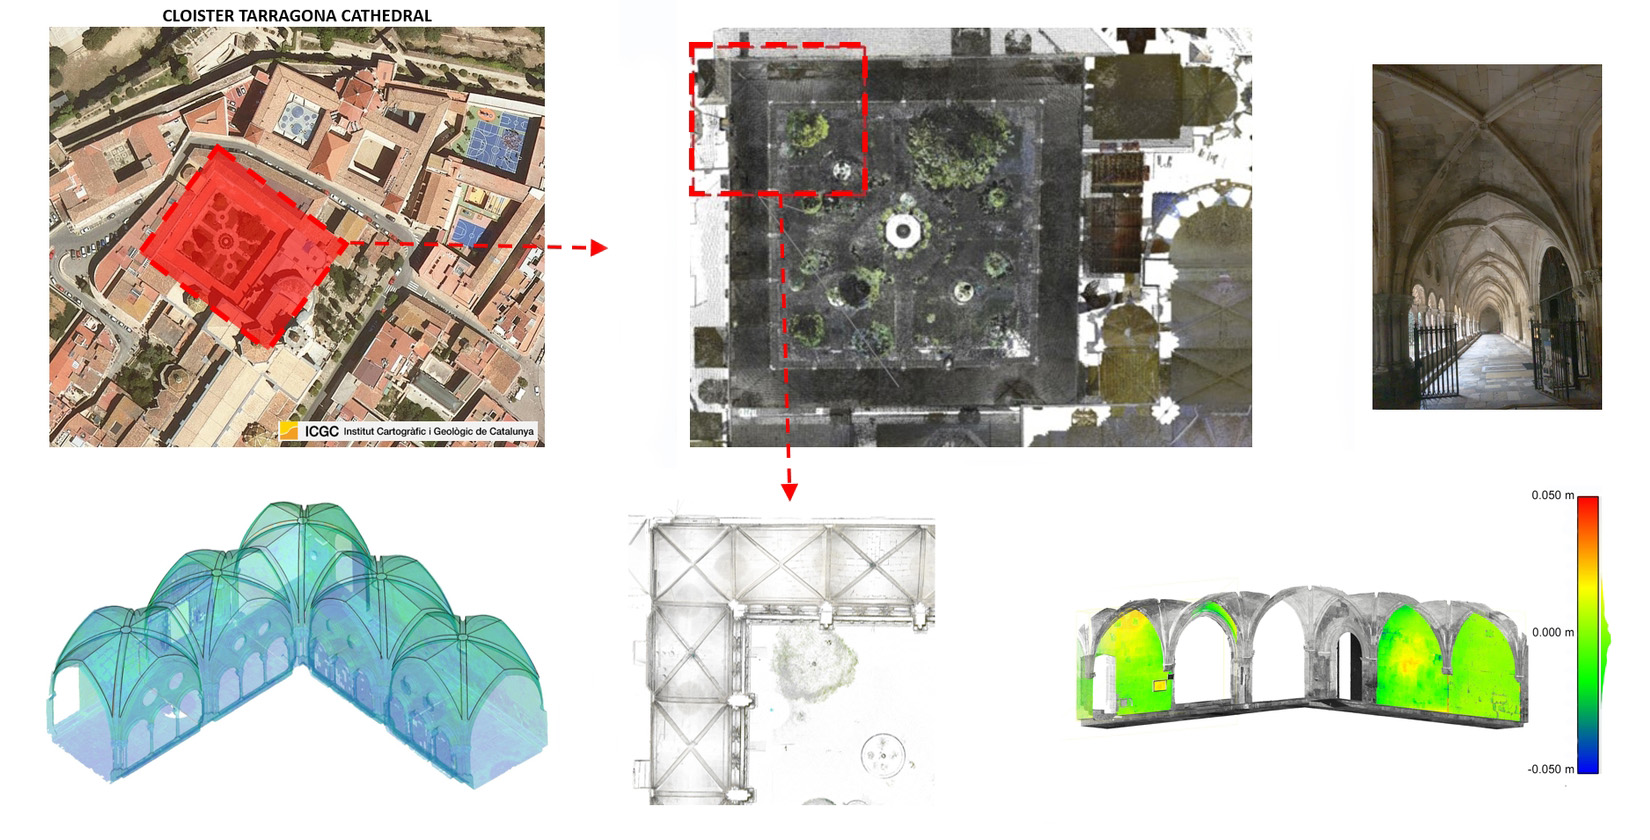
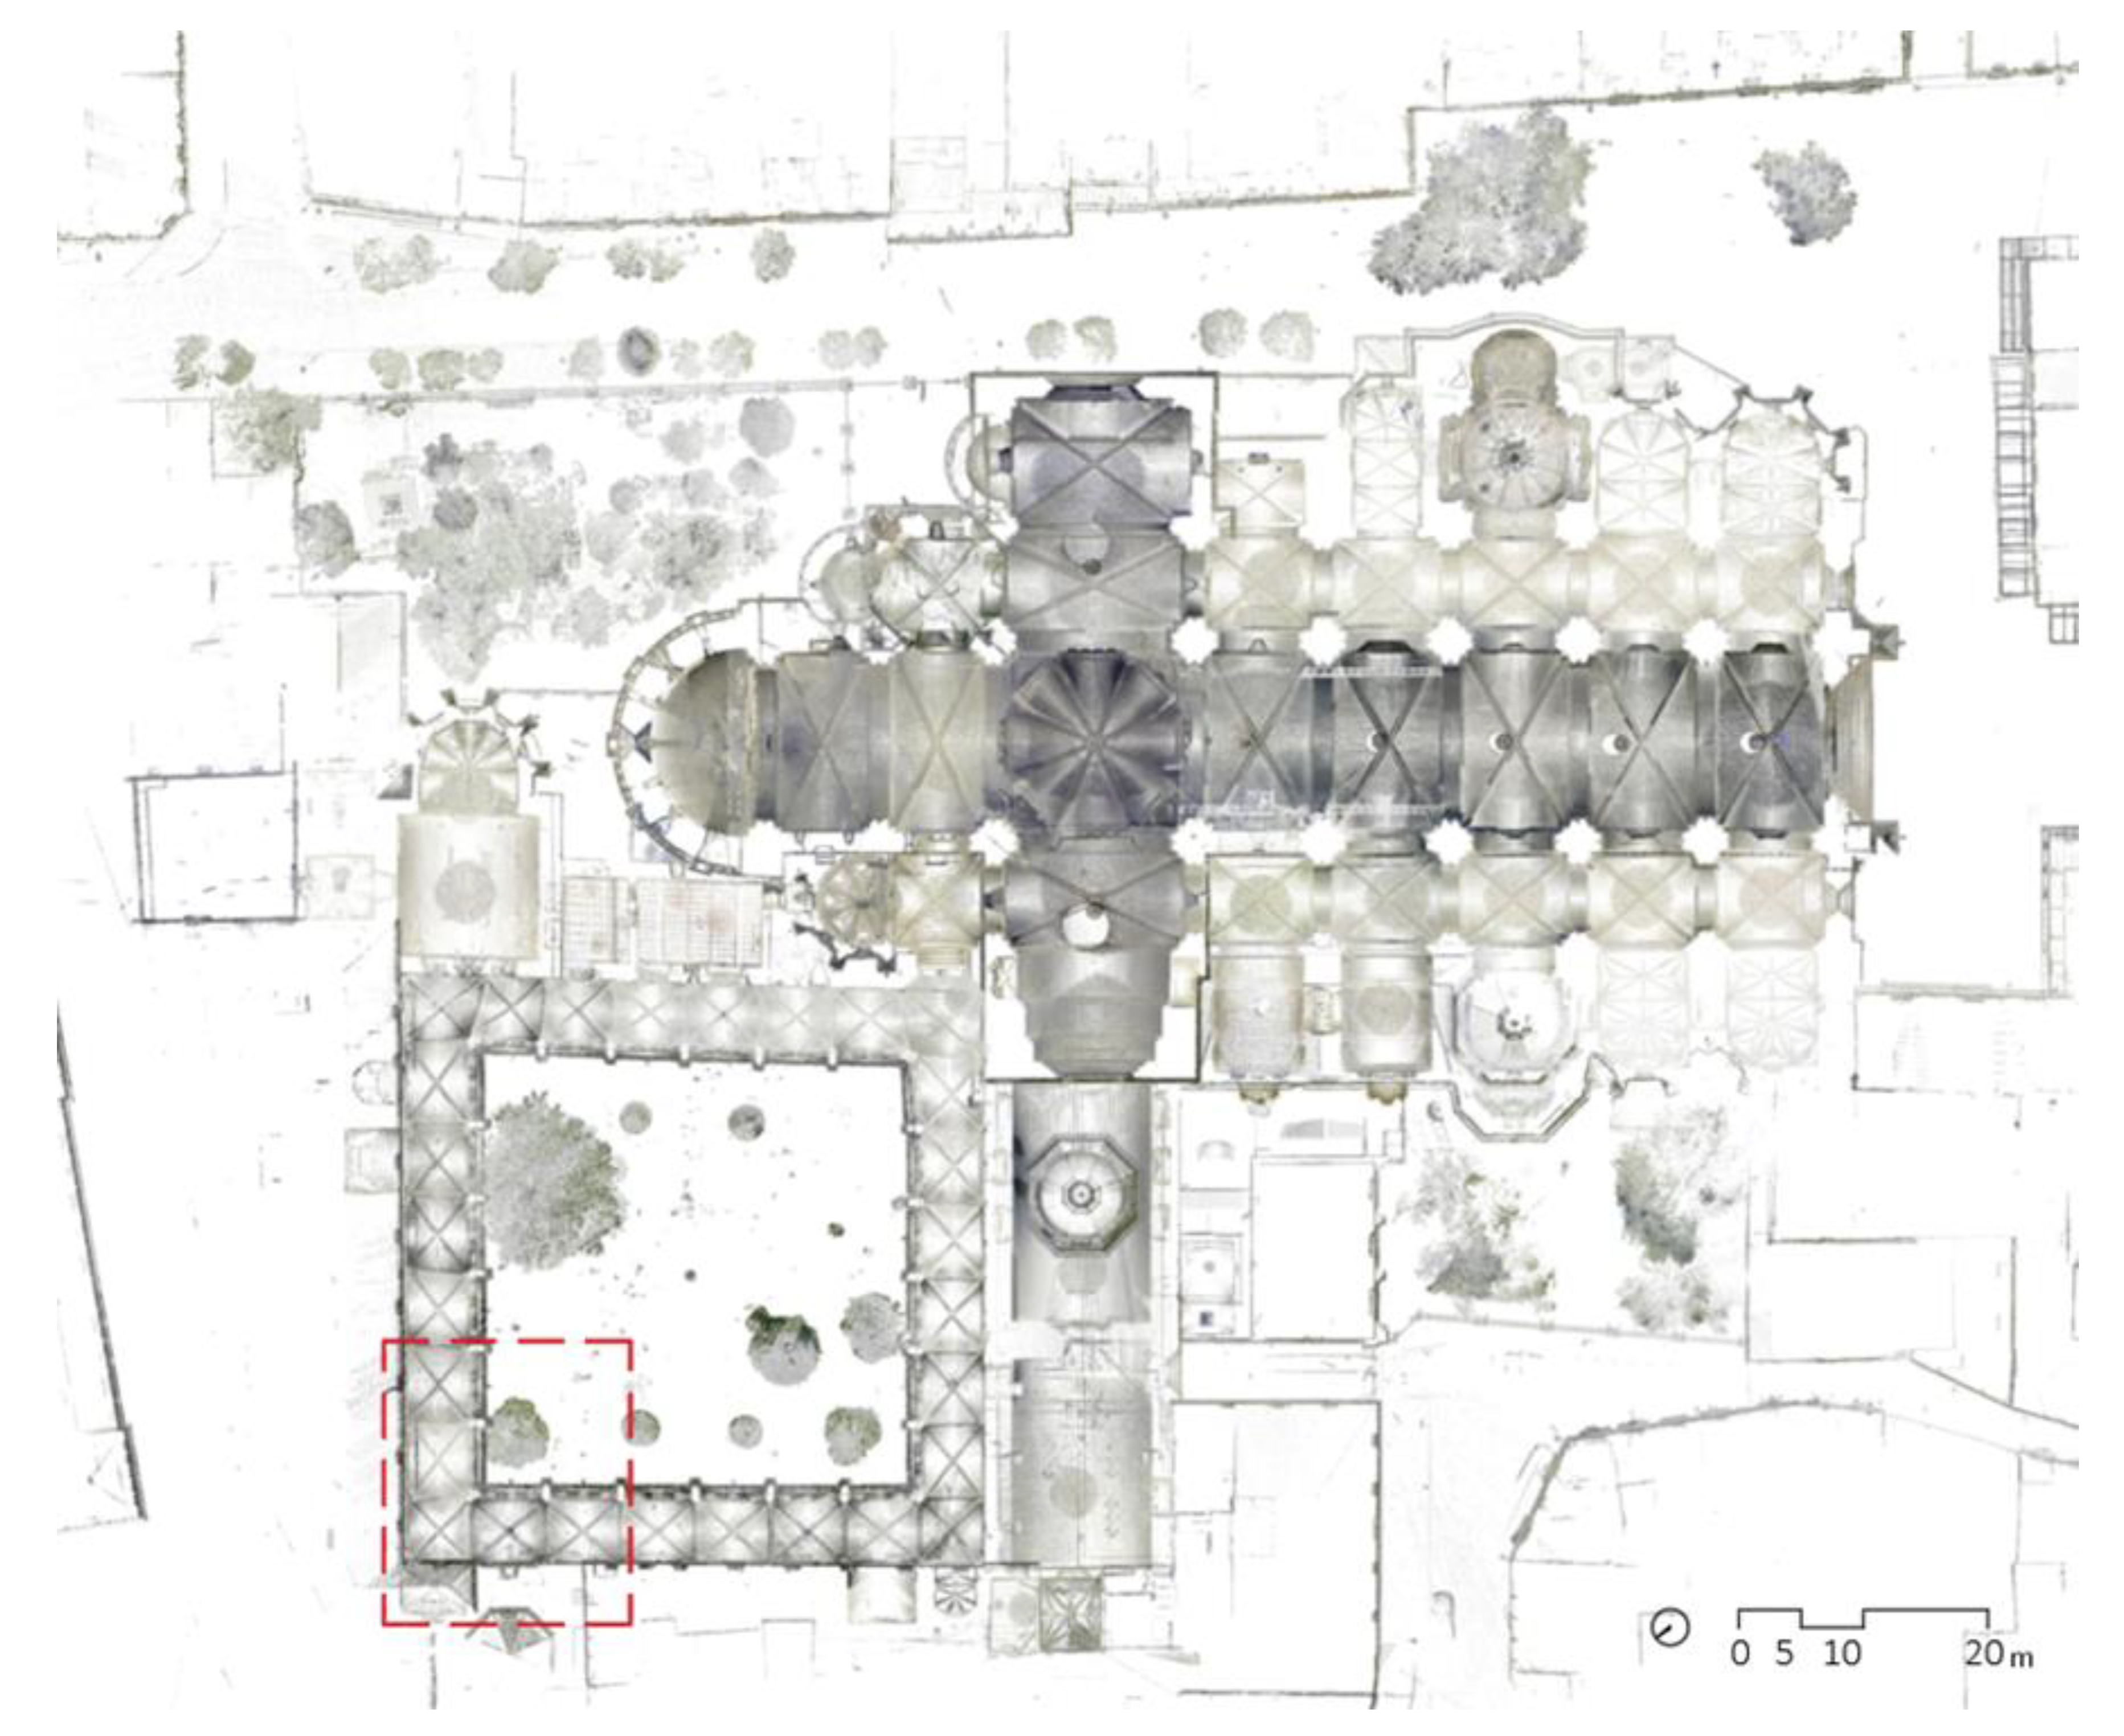
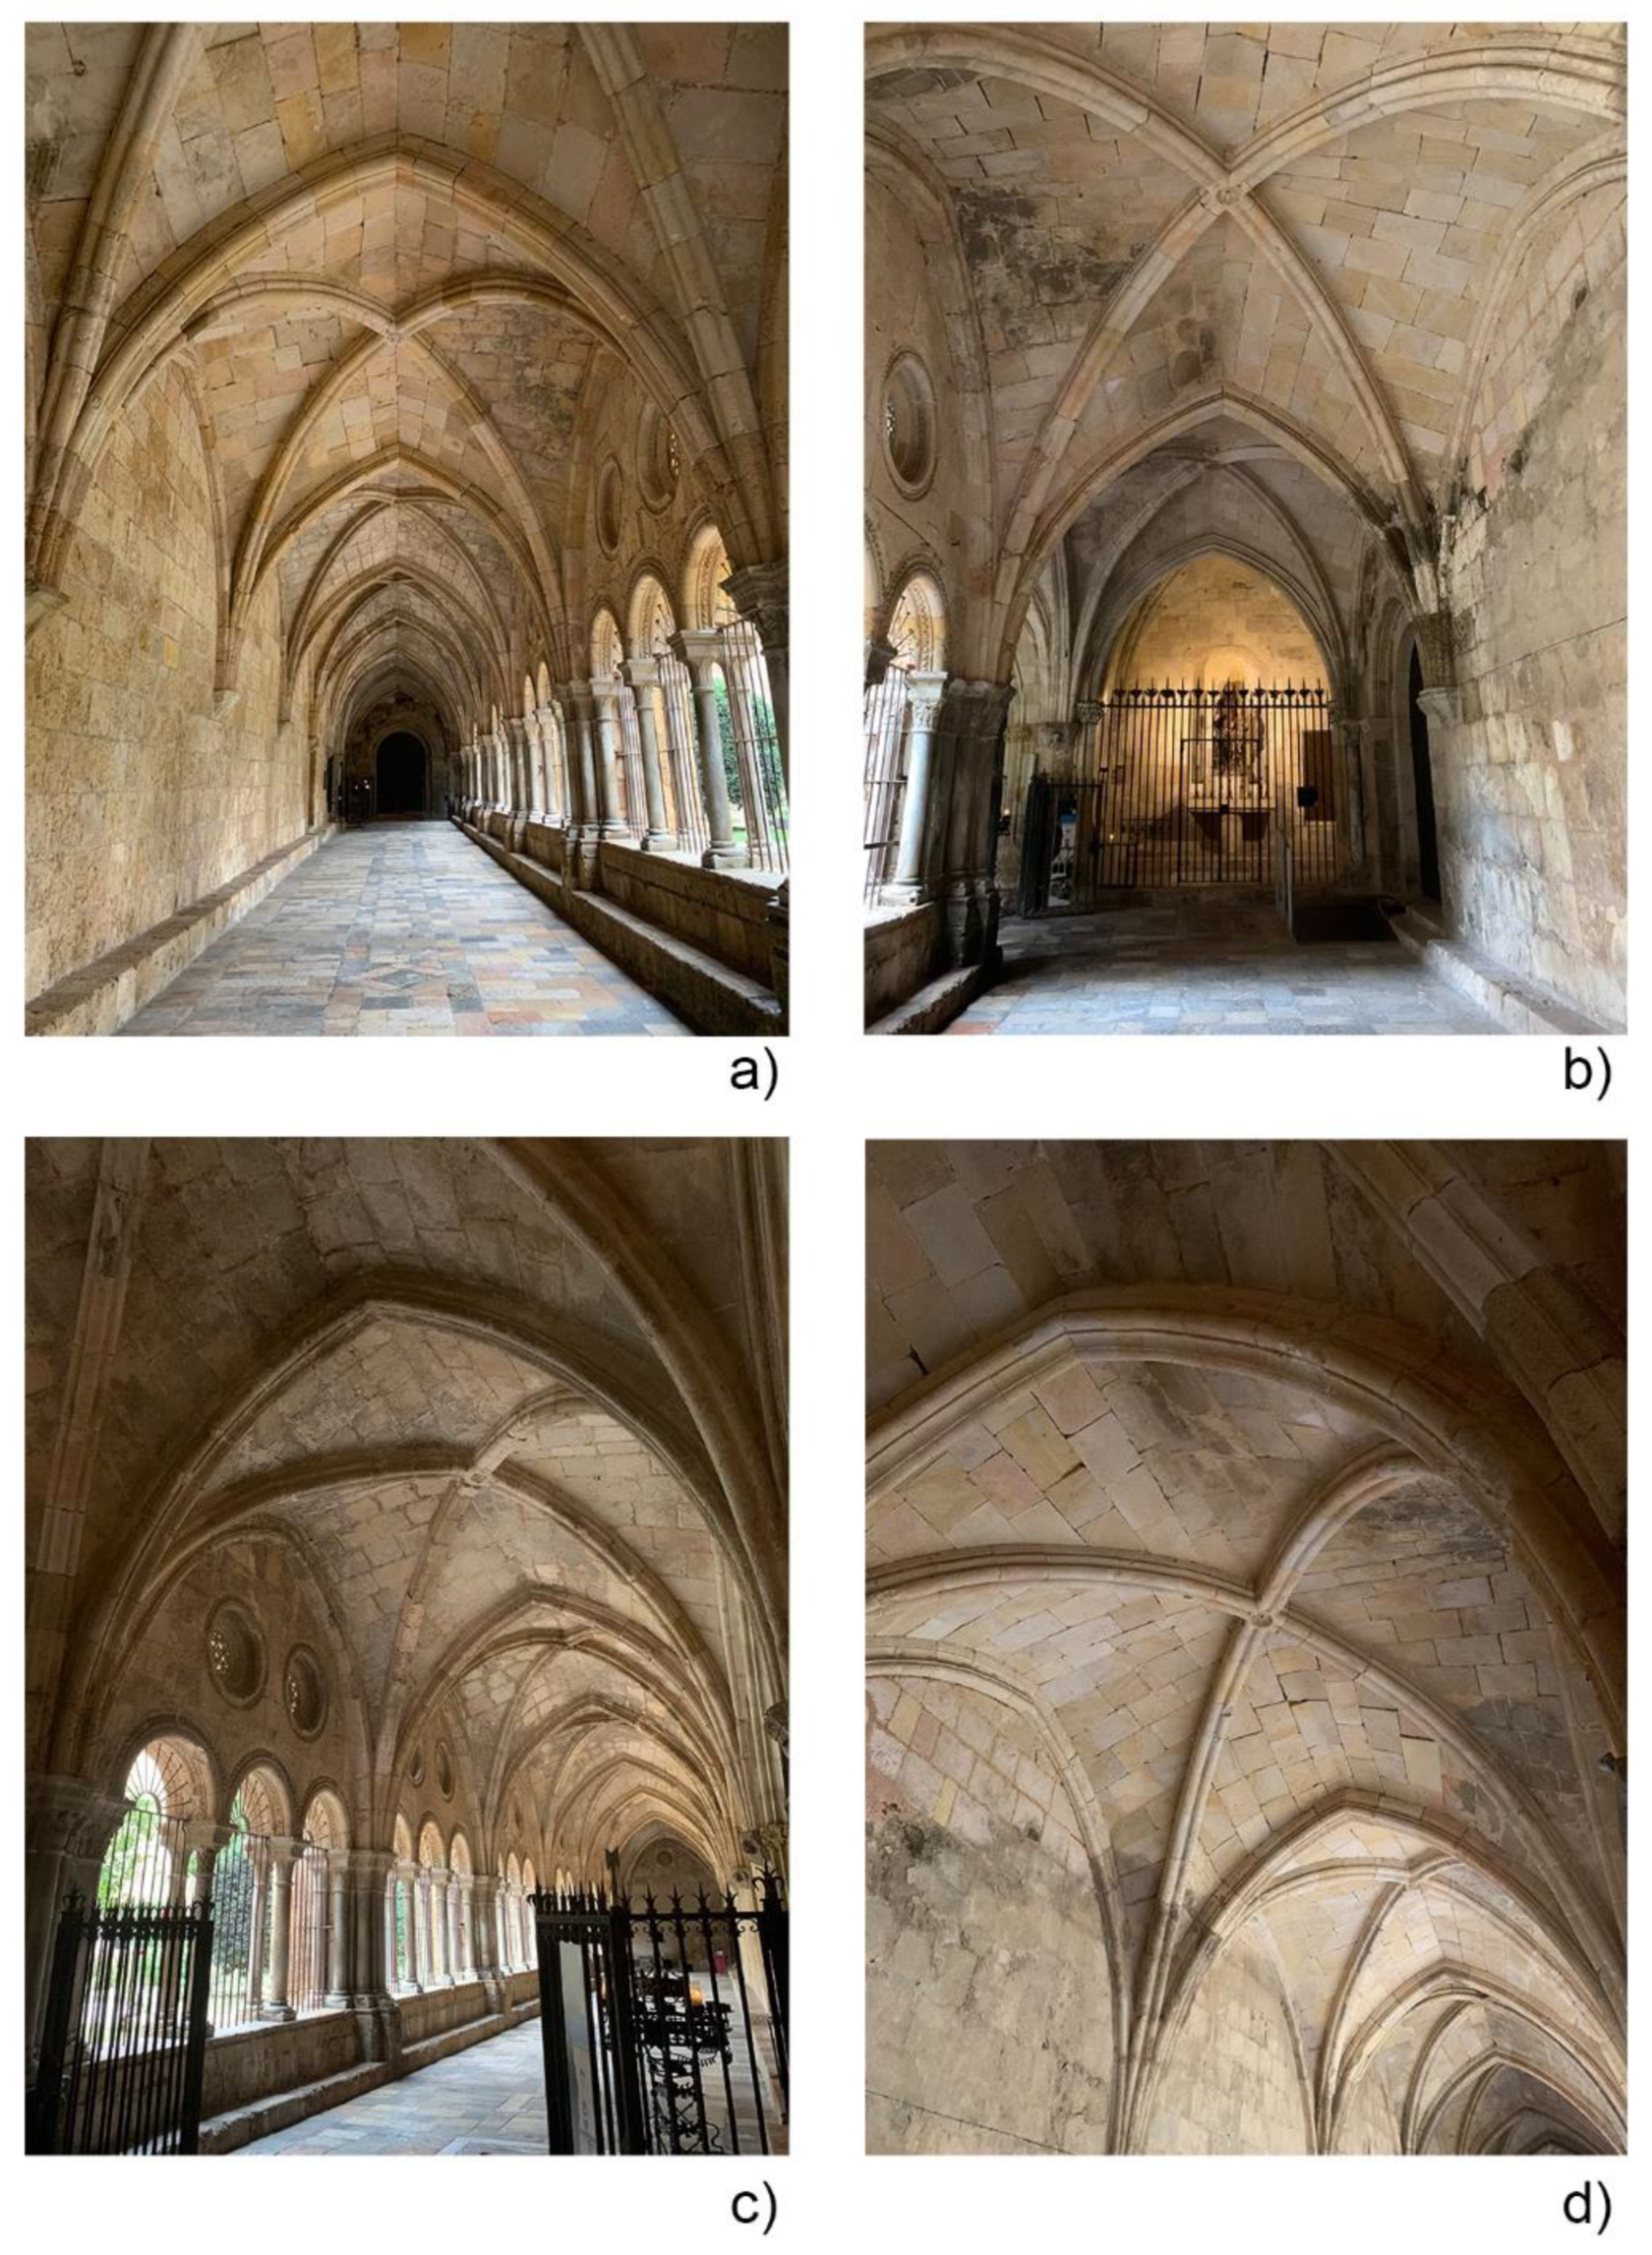
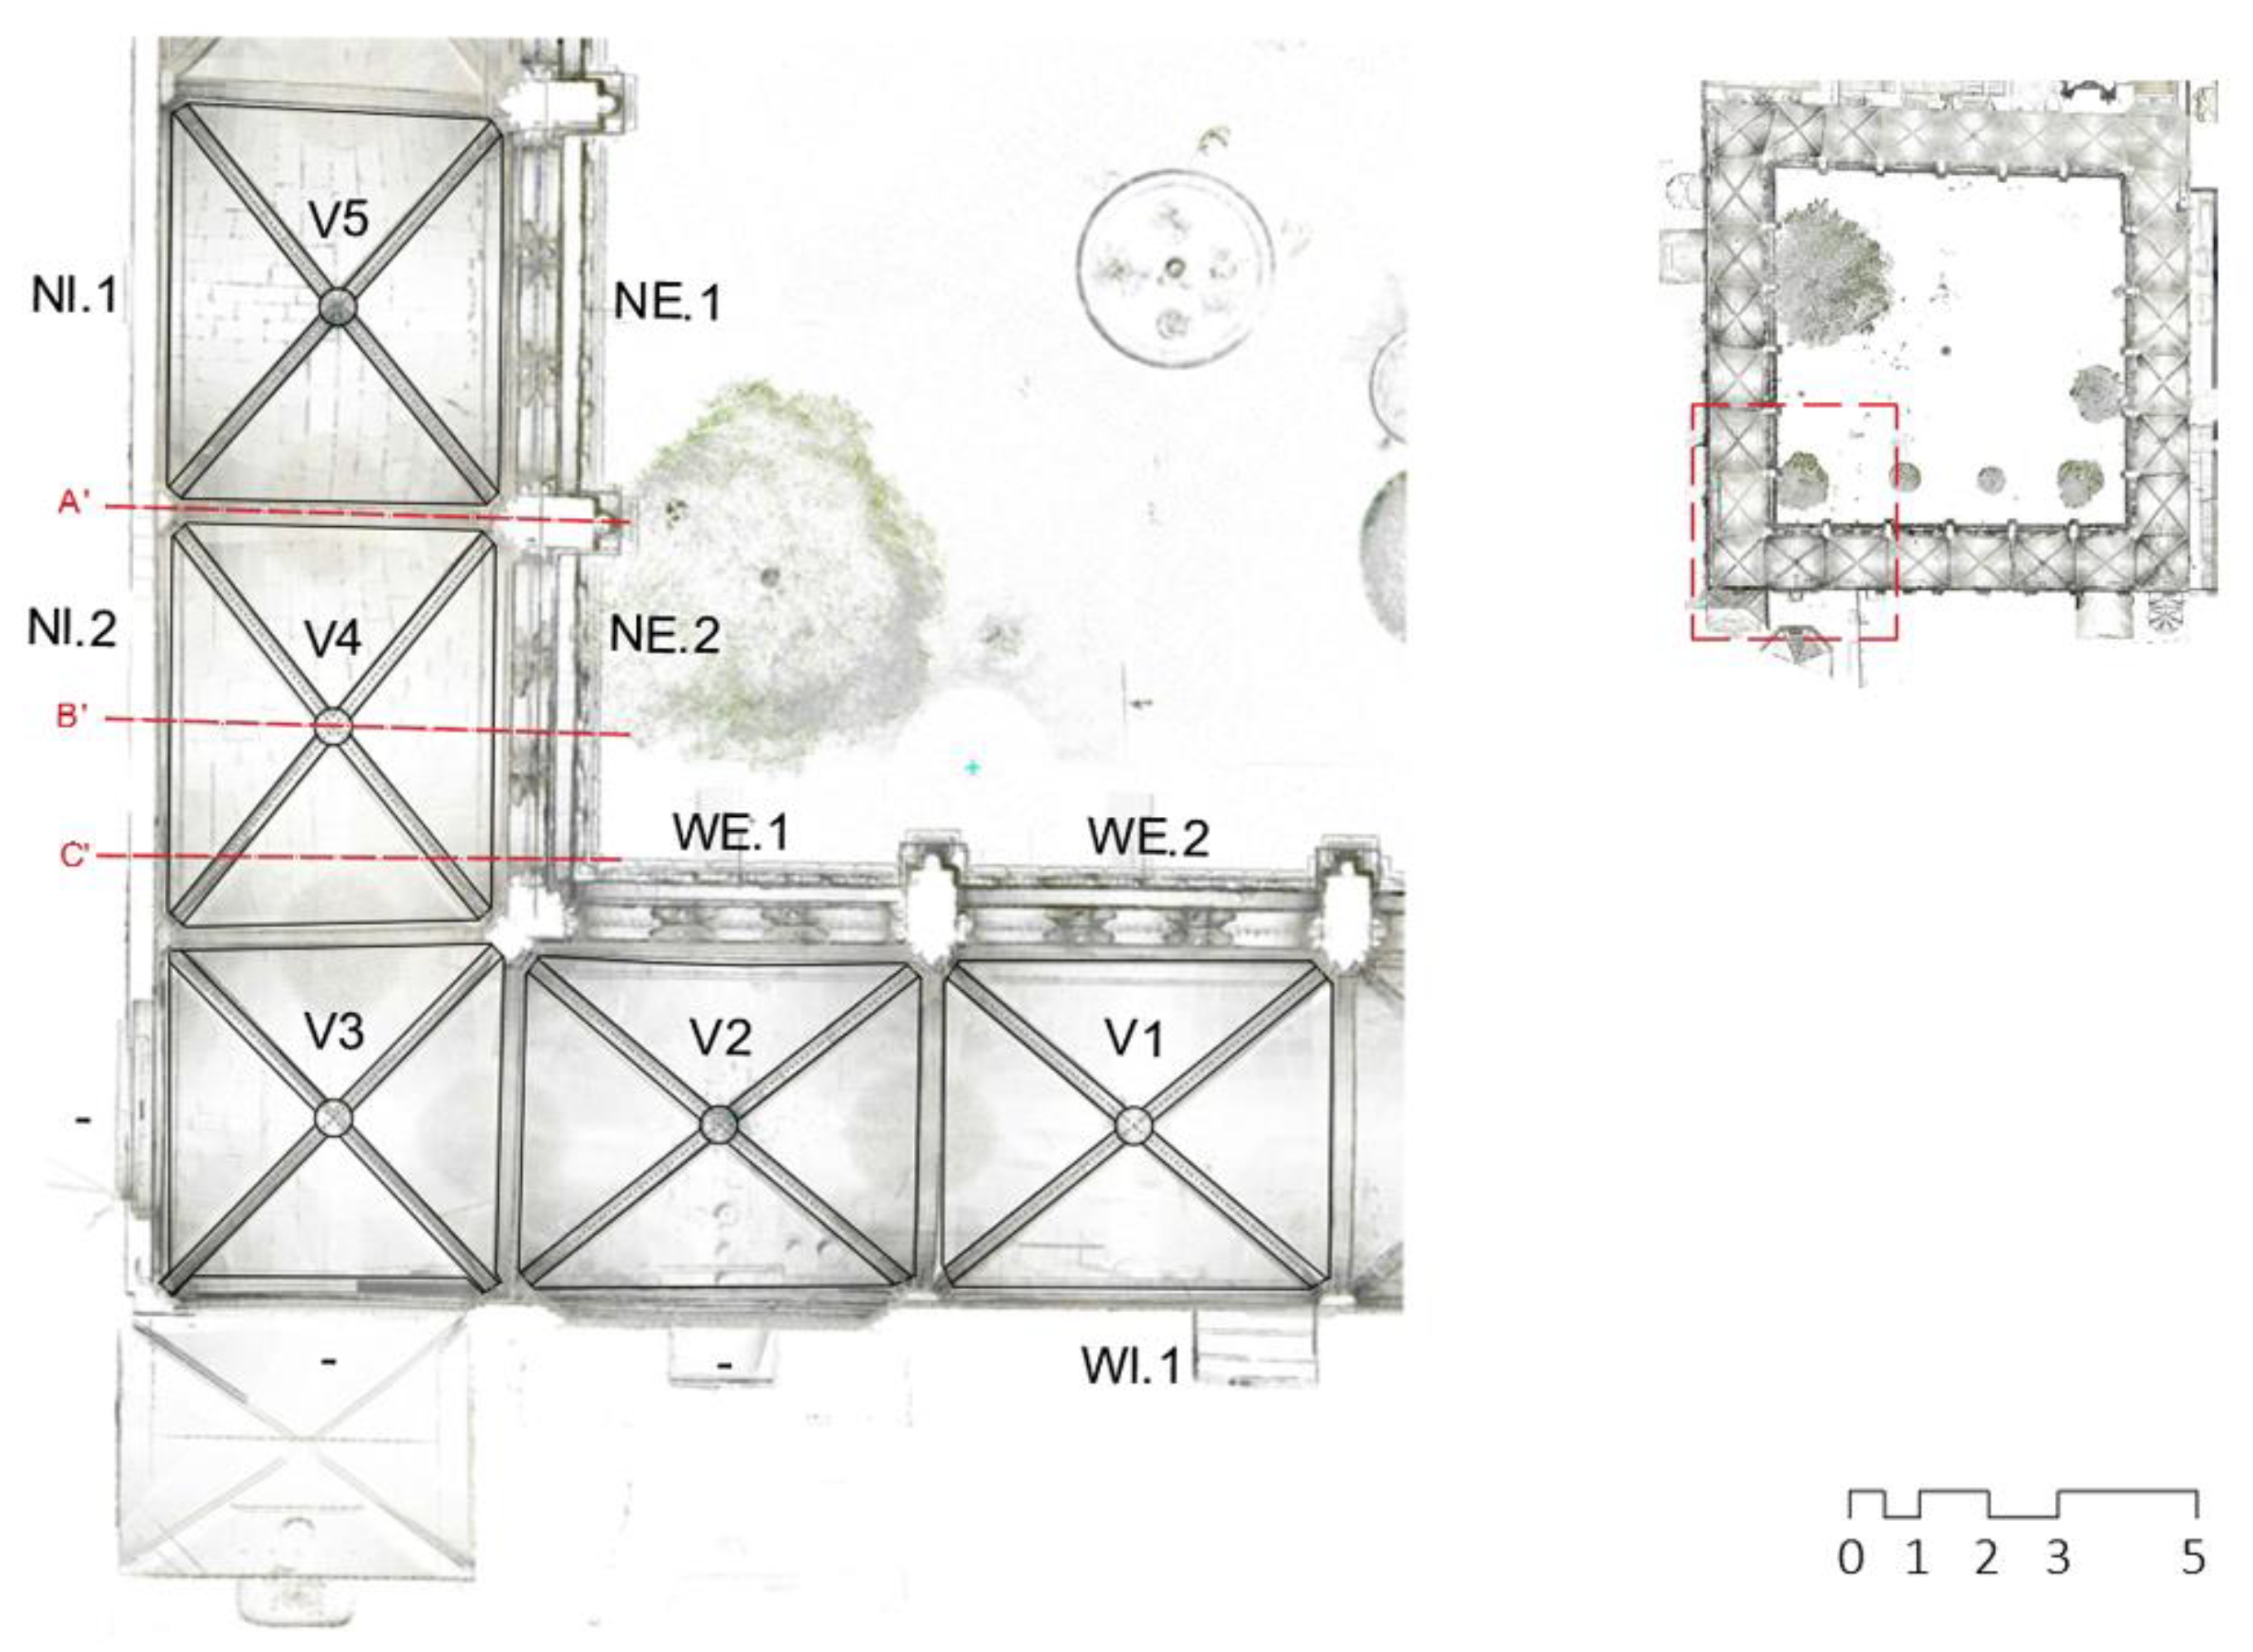
2.1. Case Study
2.2. Methodology
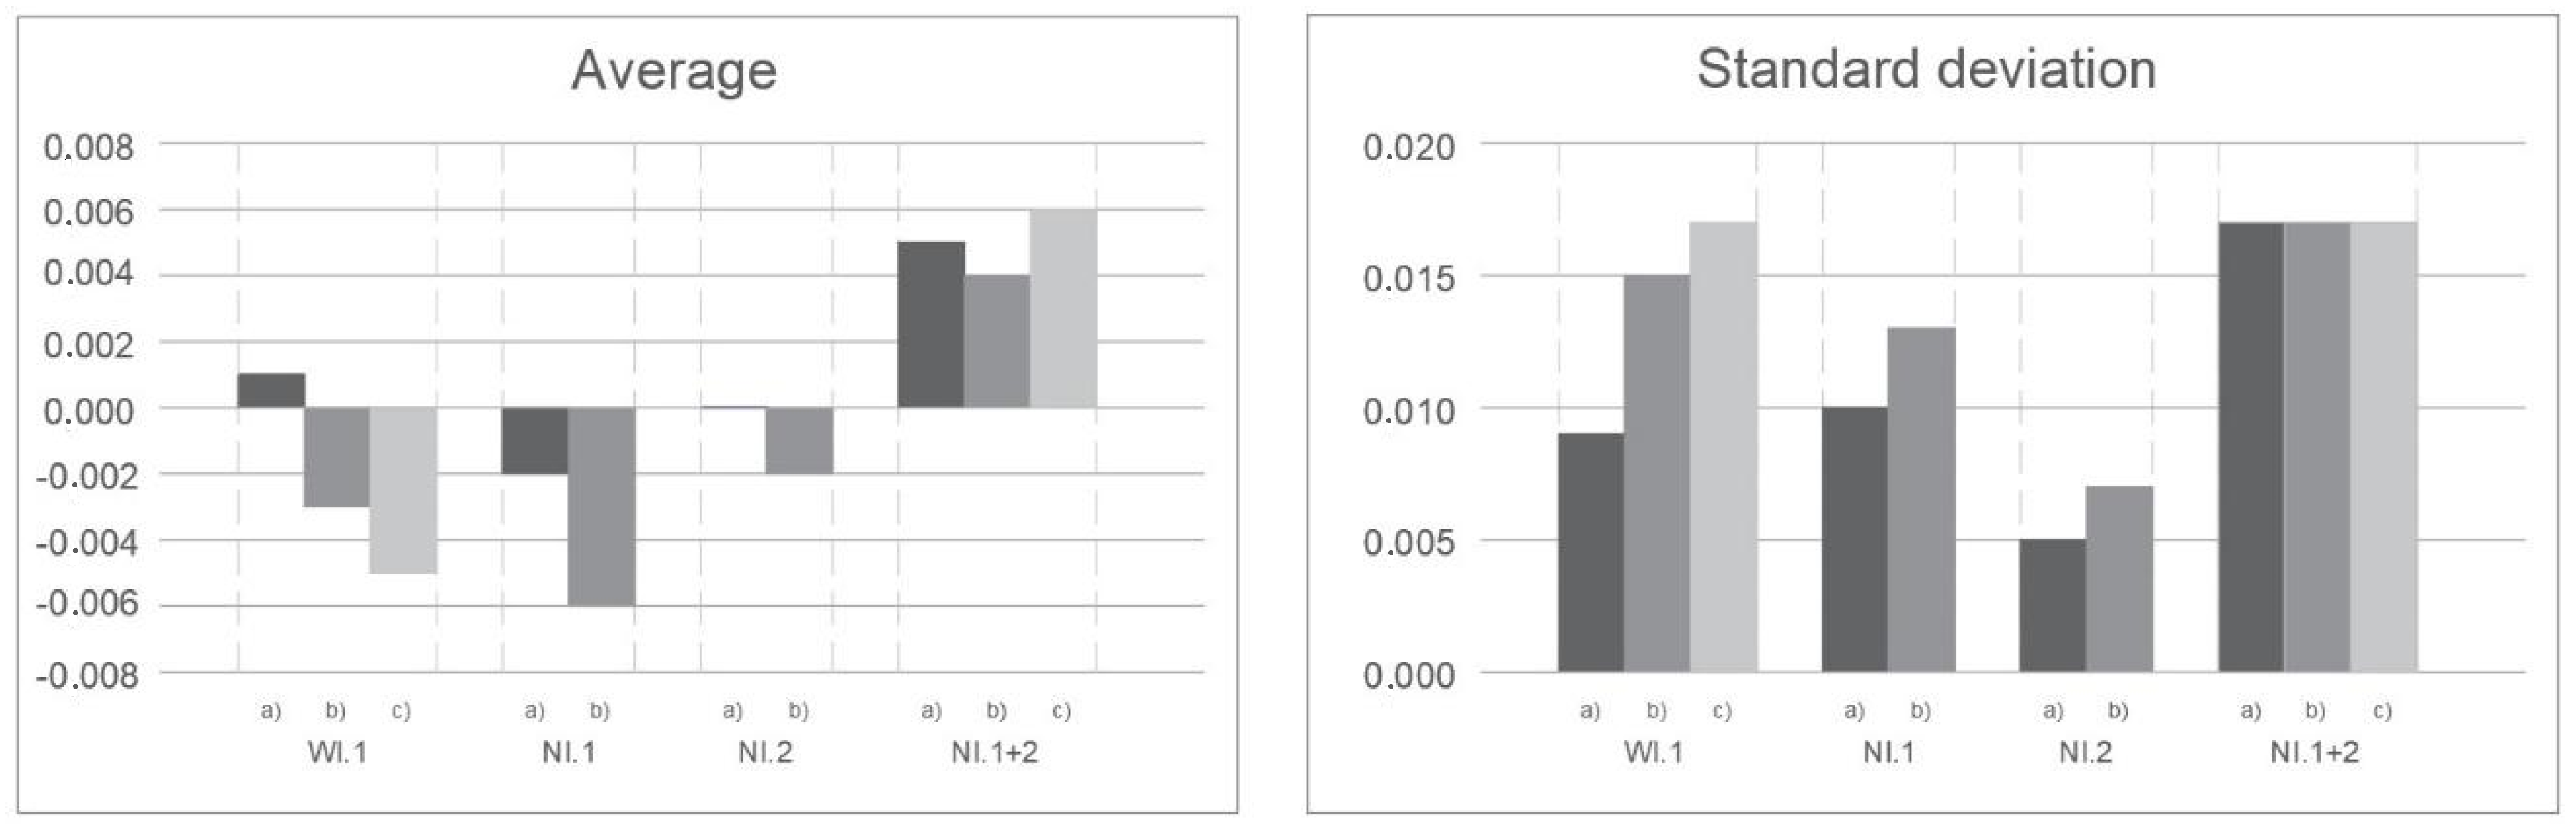
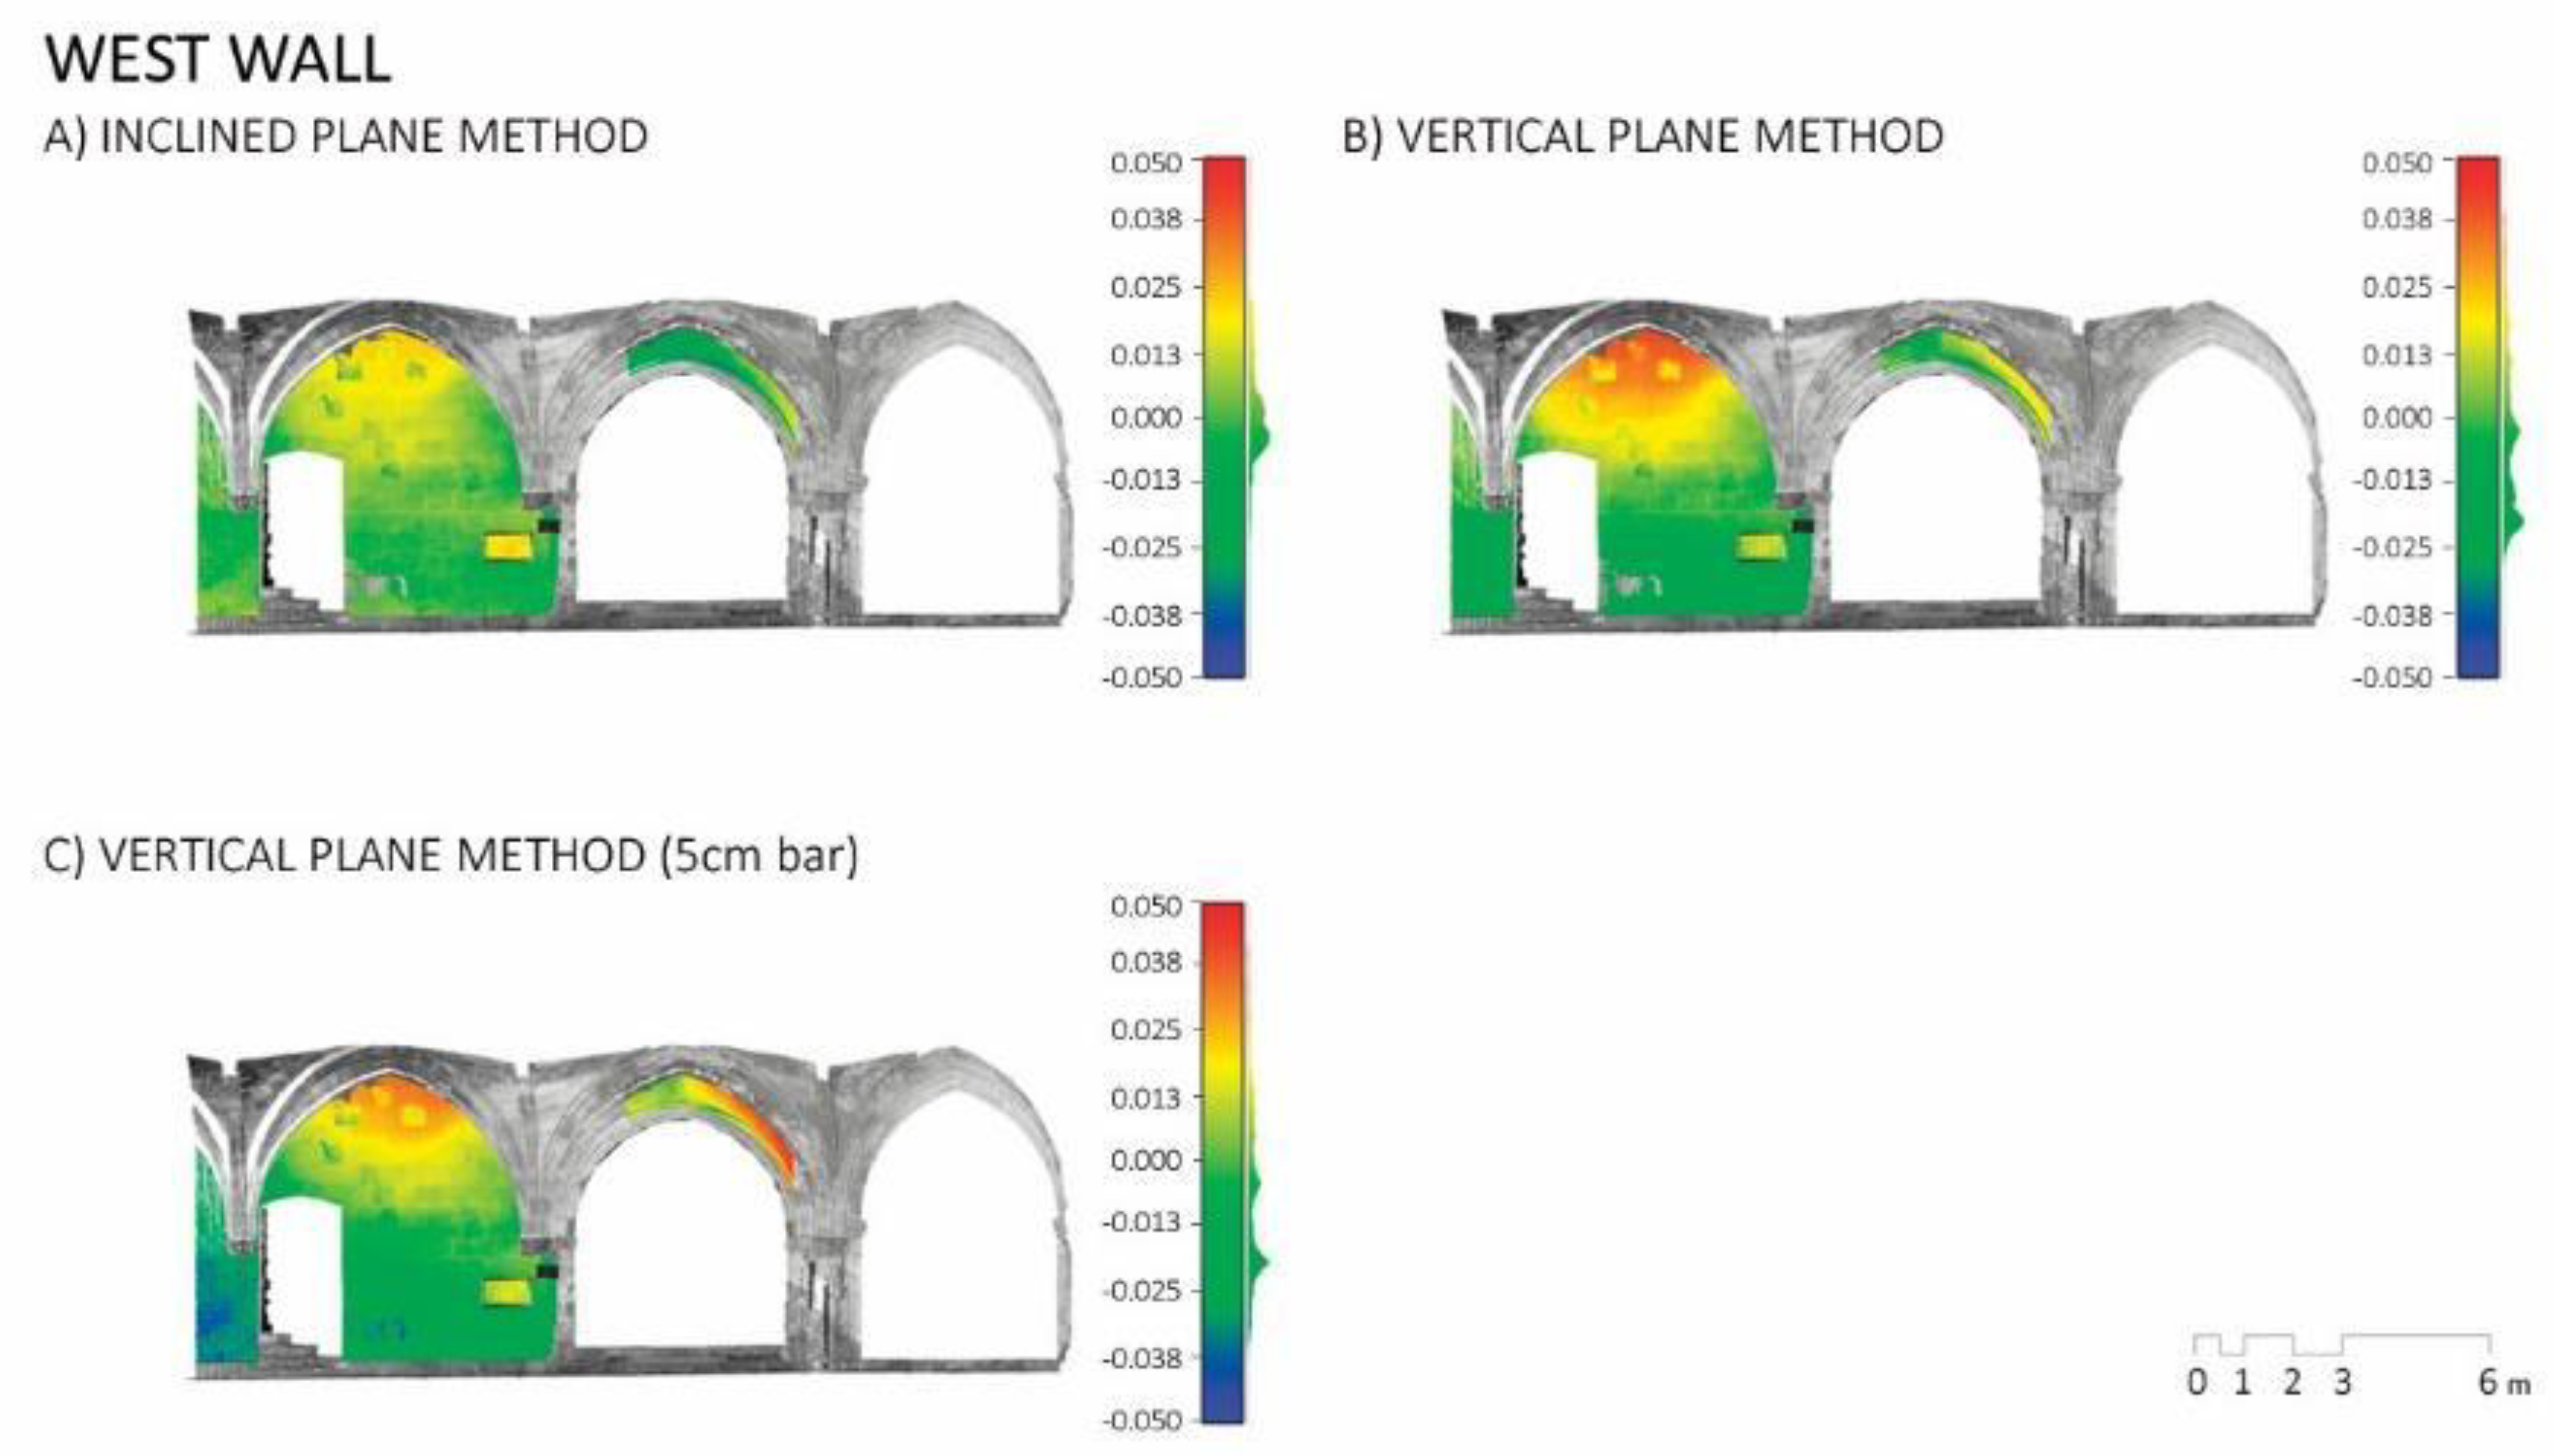
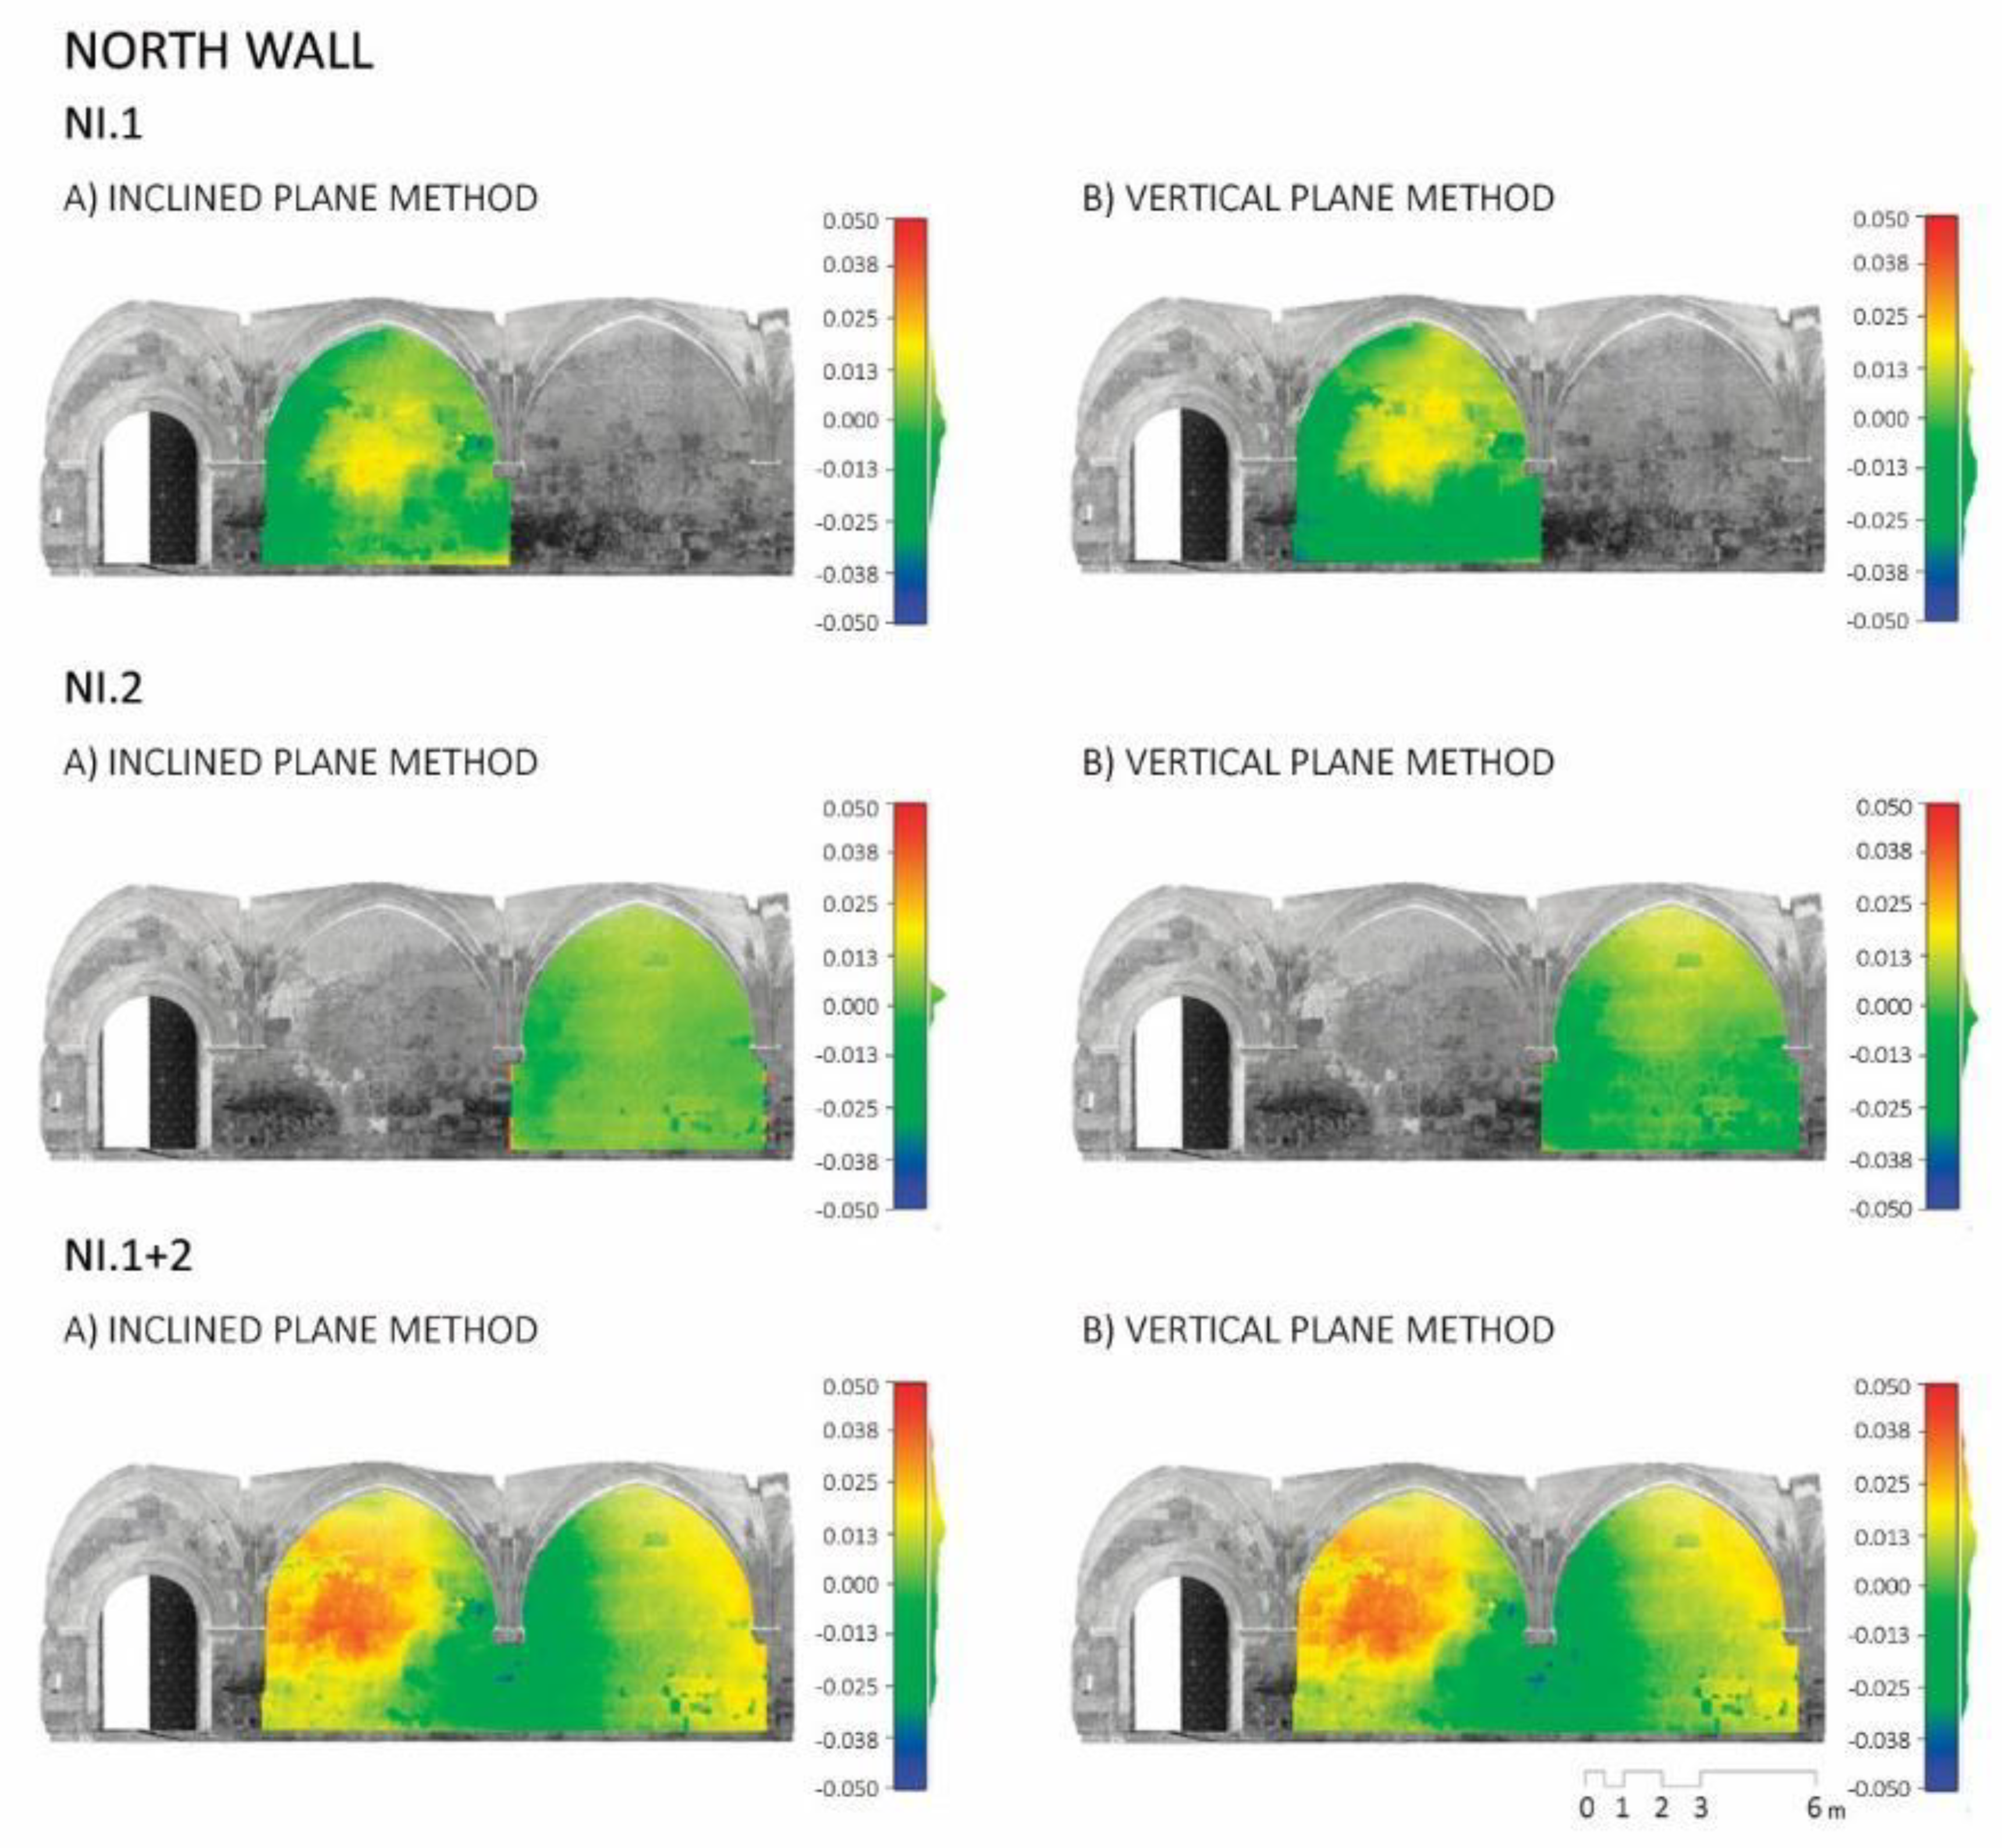
- (a)
- Considering a free plane in relation to the point cloud, the plane that best approximates the point cloud centered on a point is calculated, together with the normal vector (N) whose direction is expressed by its azimuth (units in sexagesimal degrees), and its inclination by its zenith angle.
- (b)
- With the previous data and considering the plane as vertical. The origin point of the plane is moved if necessary, so that there is no systematic offset.
- (c)
- Considering a set of points located between 5 cm and 35 cm high from the ground, the line that best approximates it is calculated and a vertical plane is defined. The origin point is moved to compensate for a possible systematic error, if necessary.
3. Results
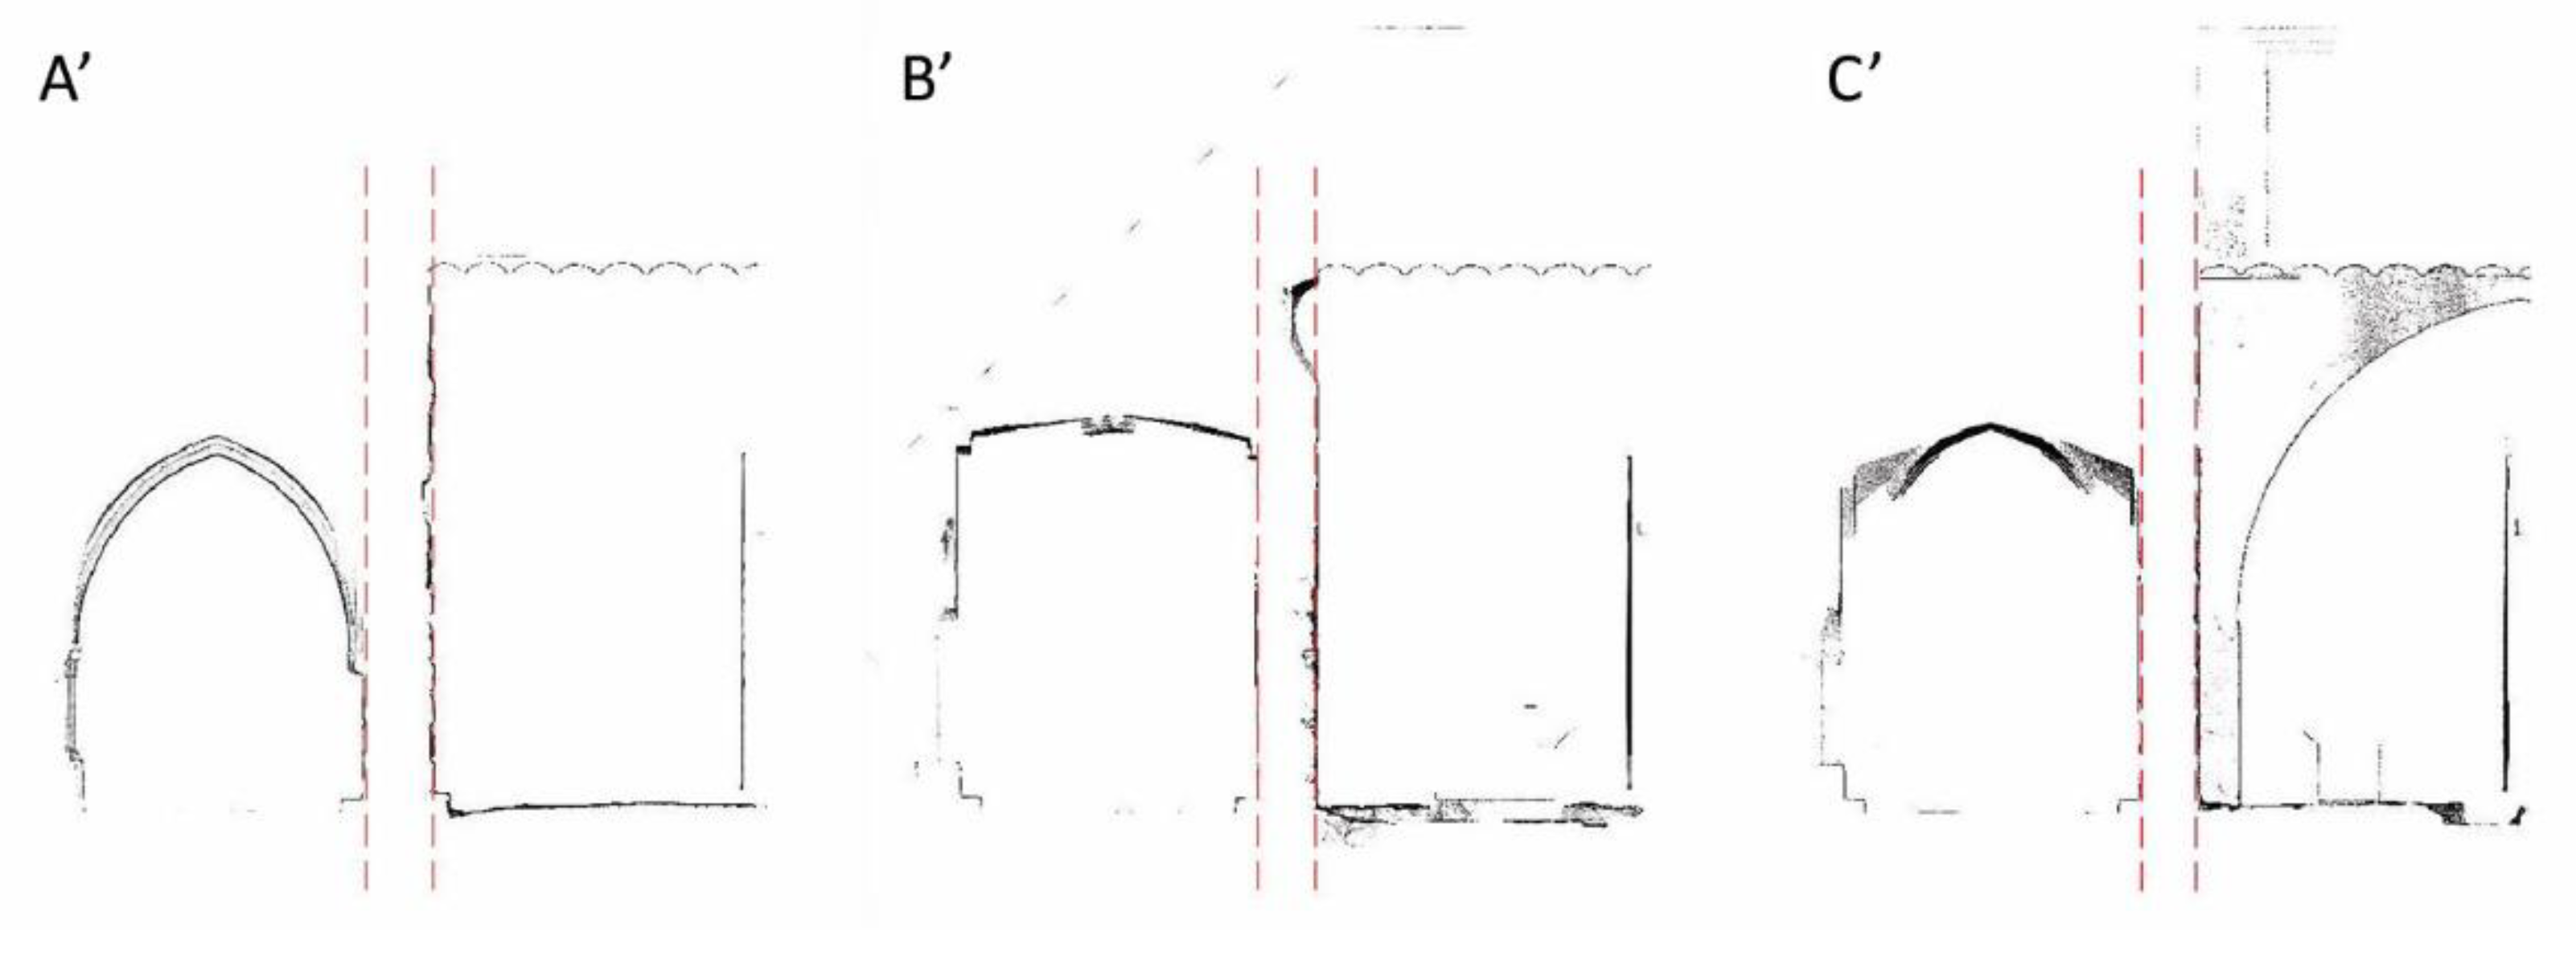
3.1. Walls Assessment
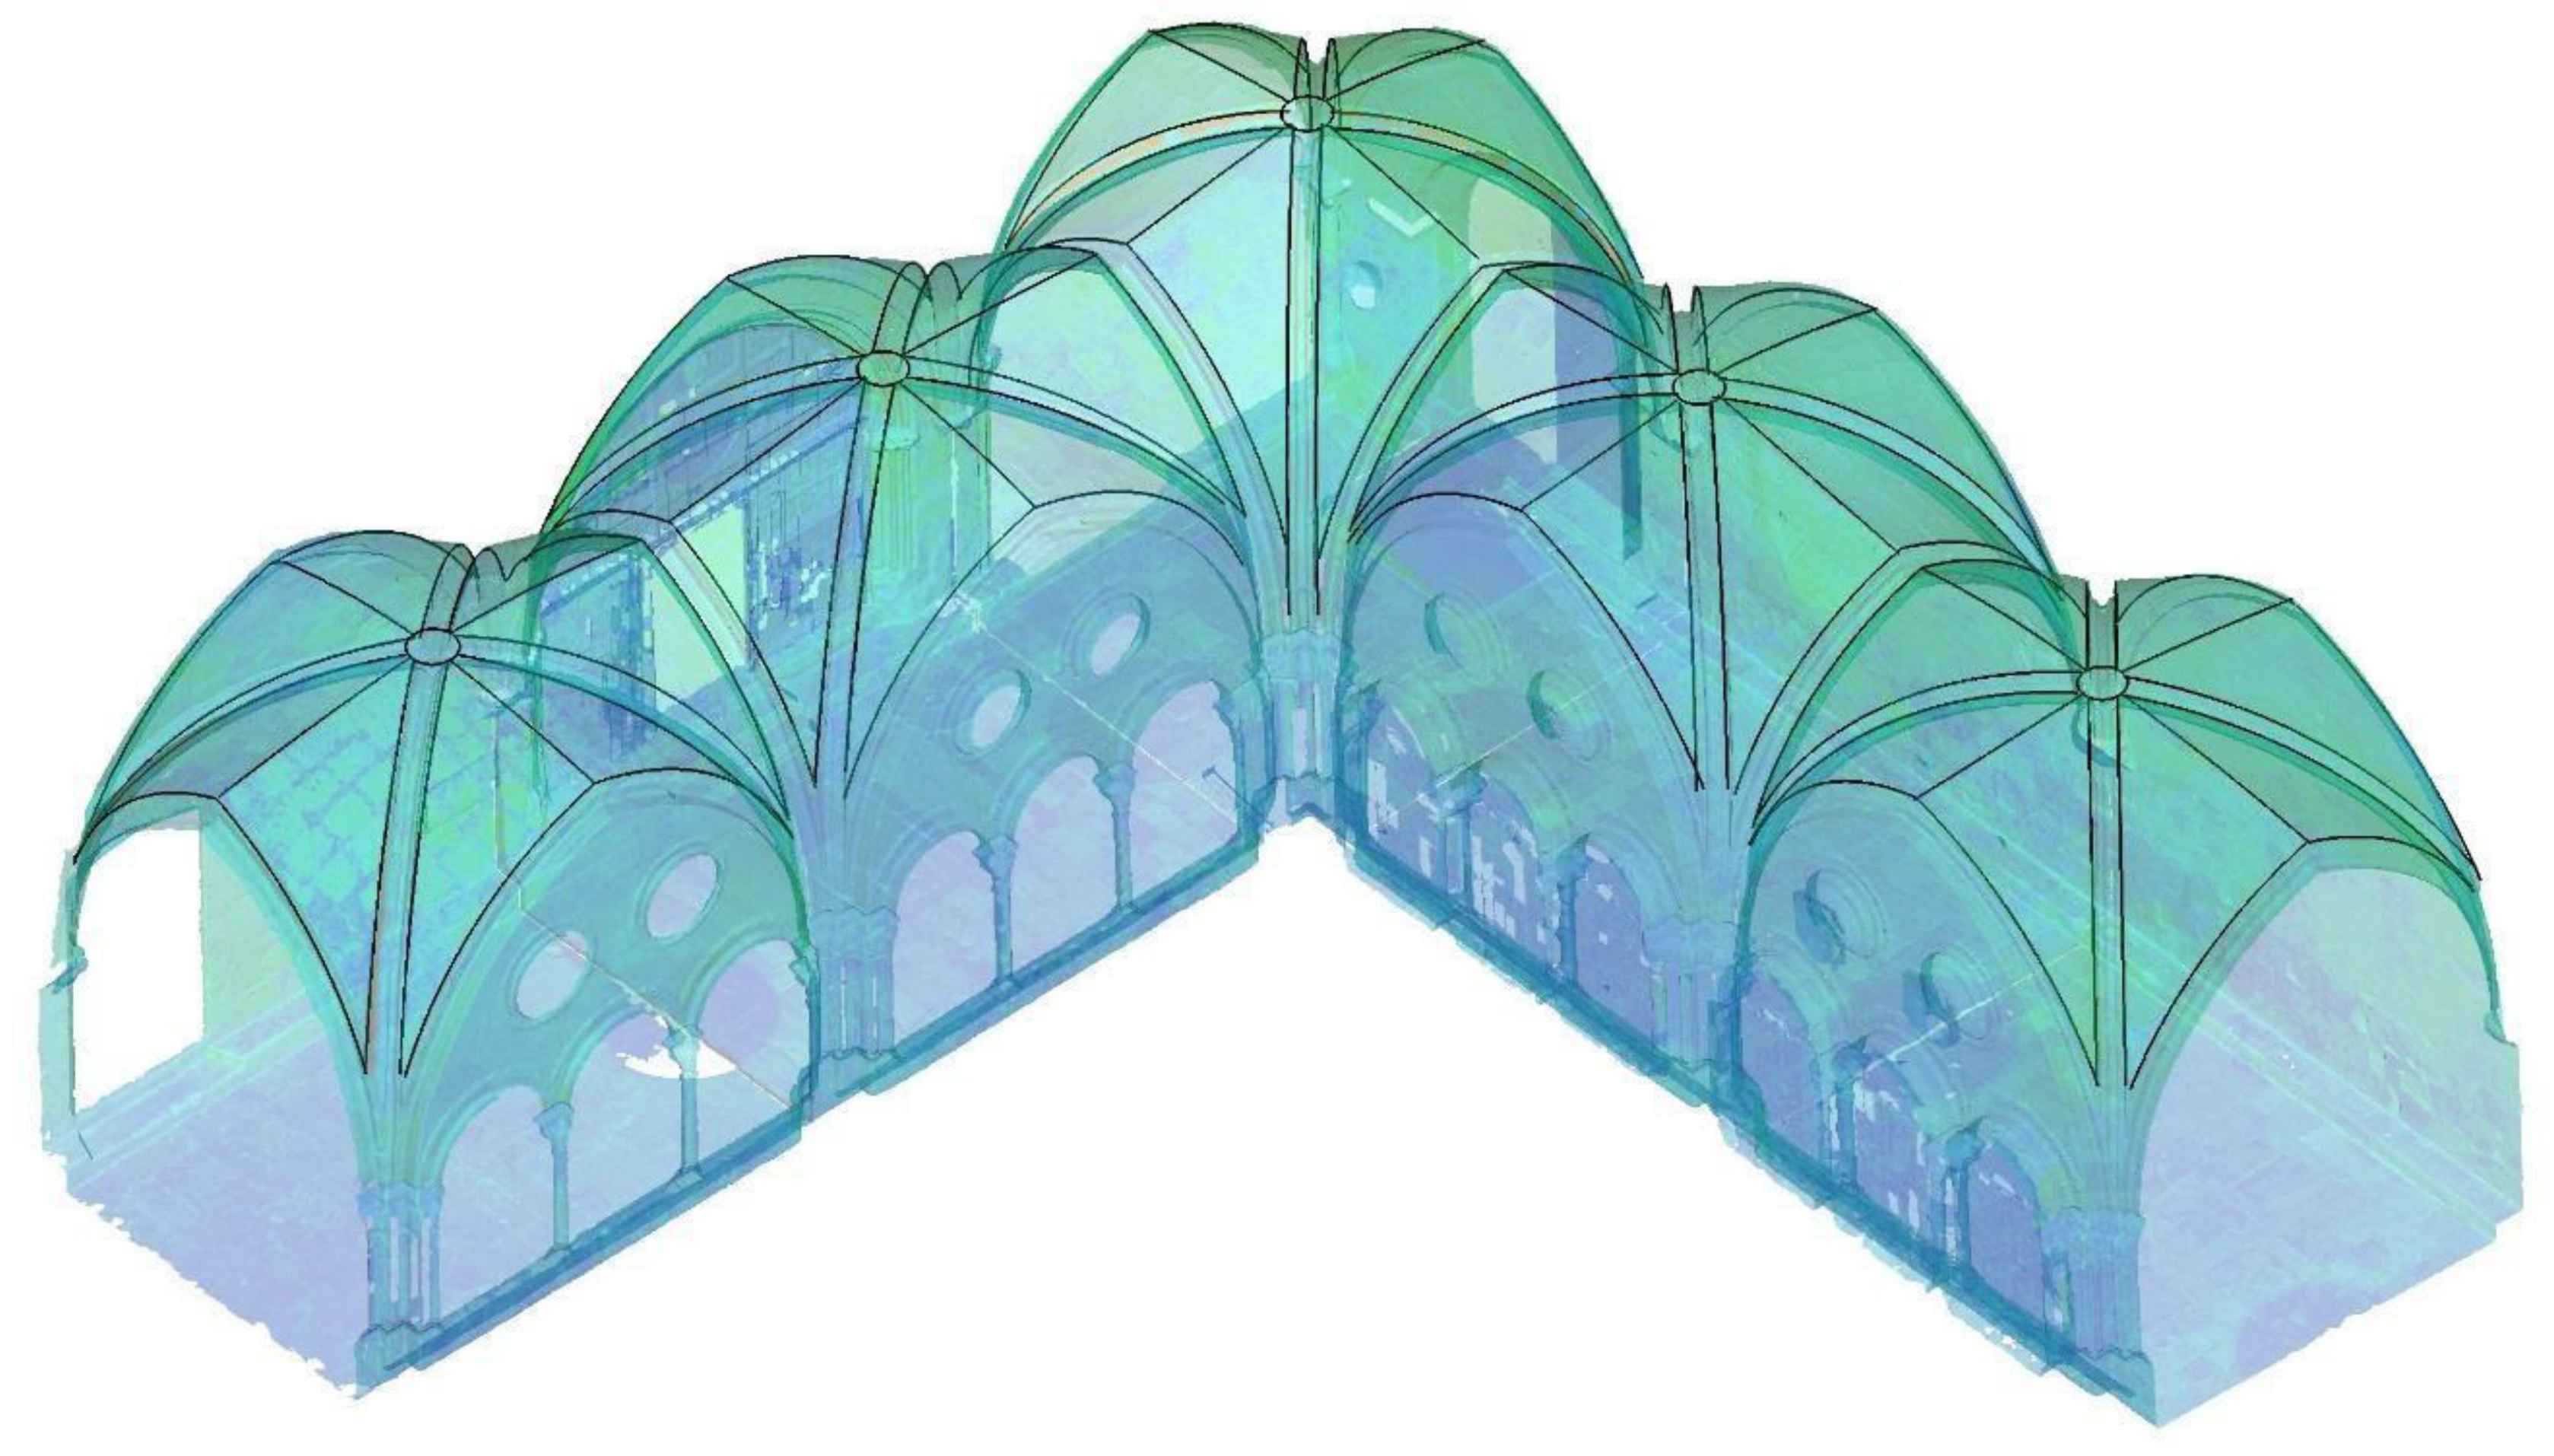
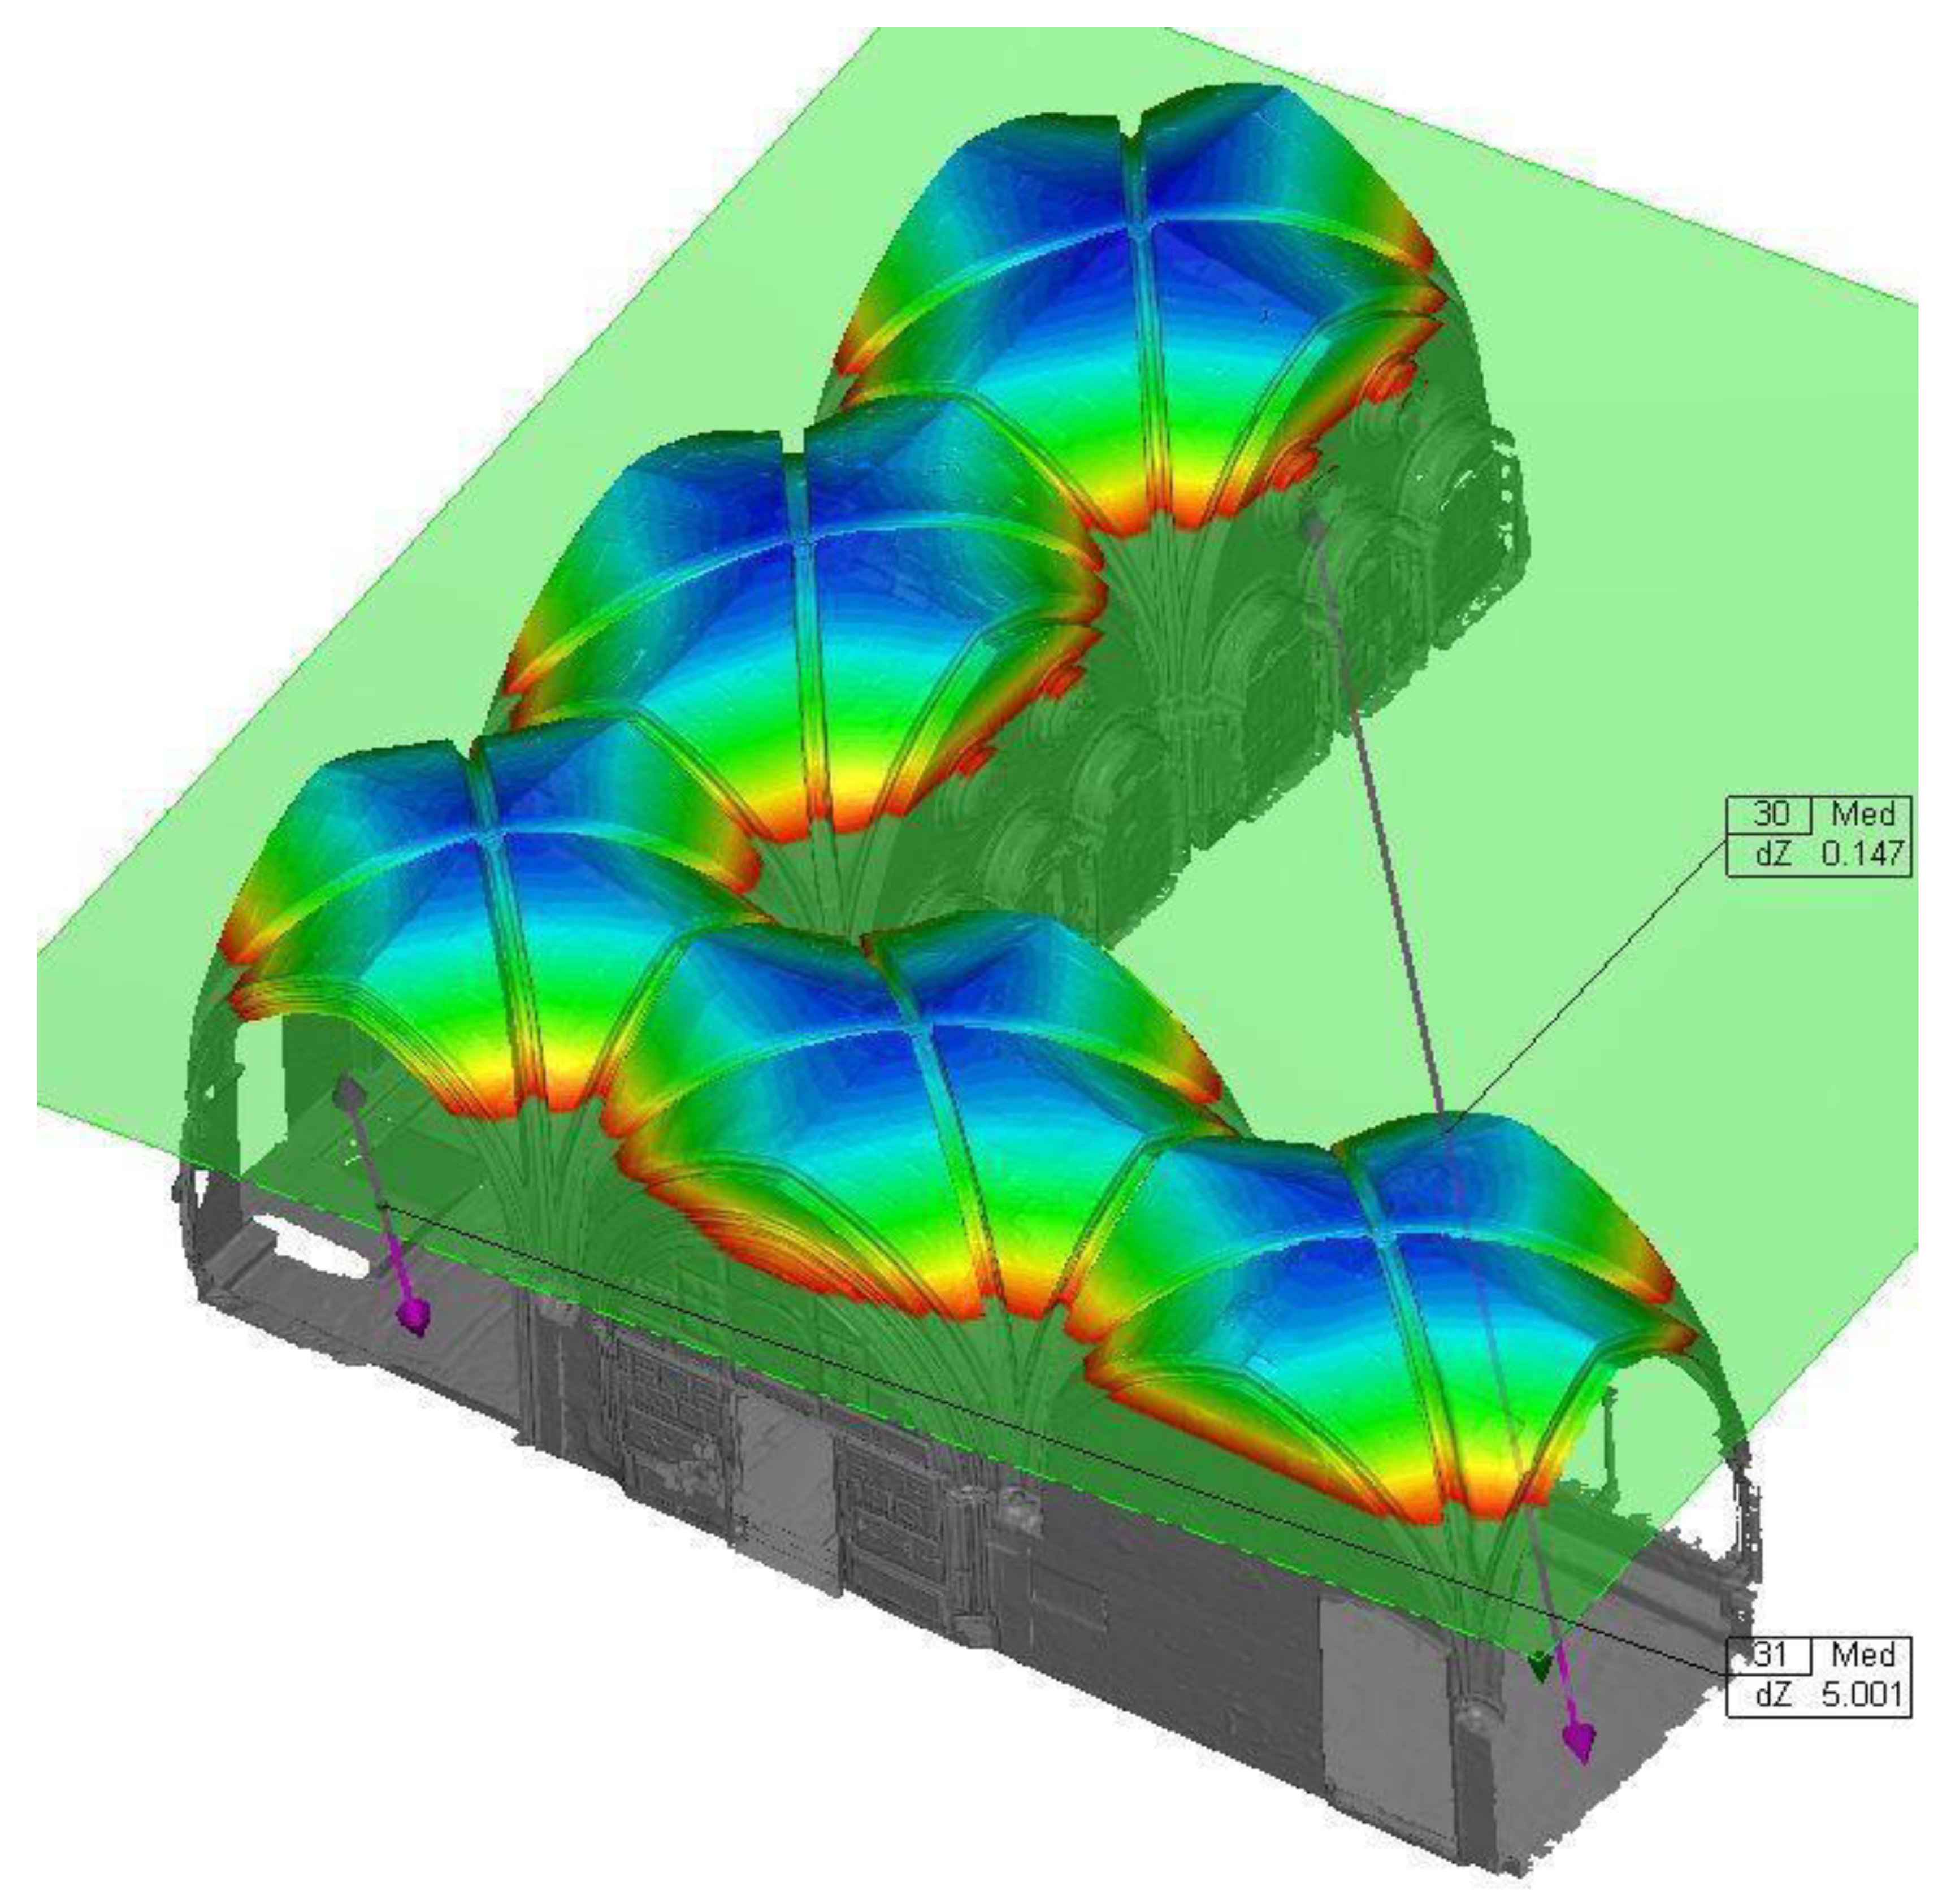
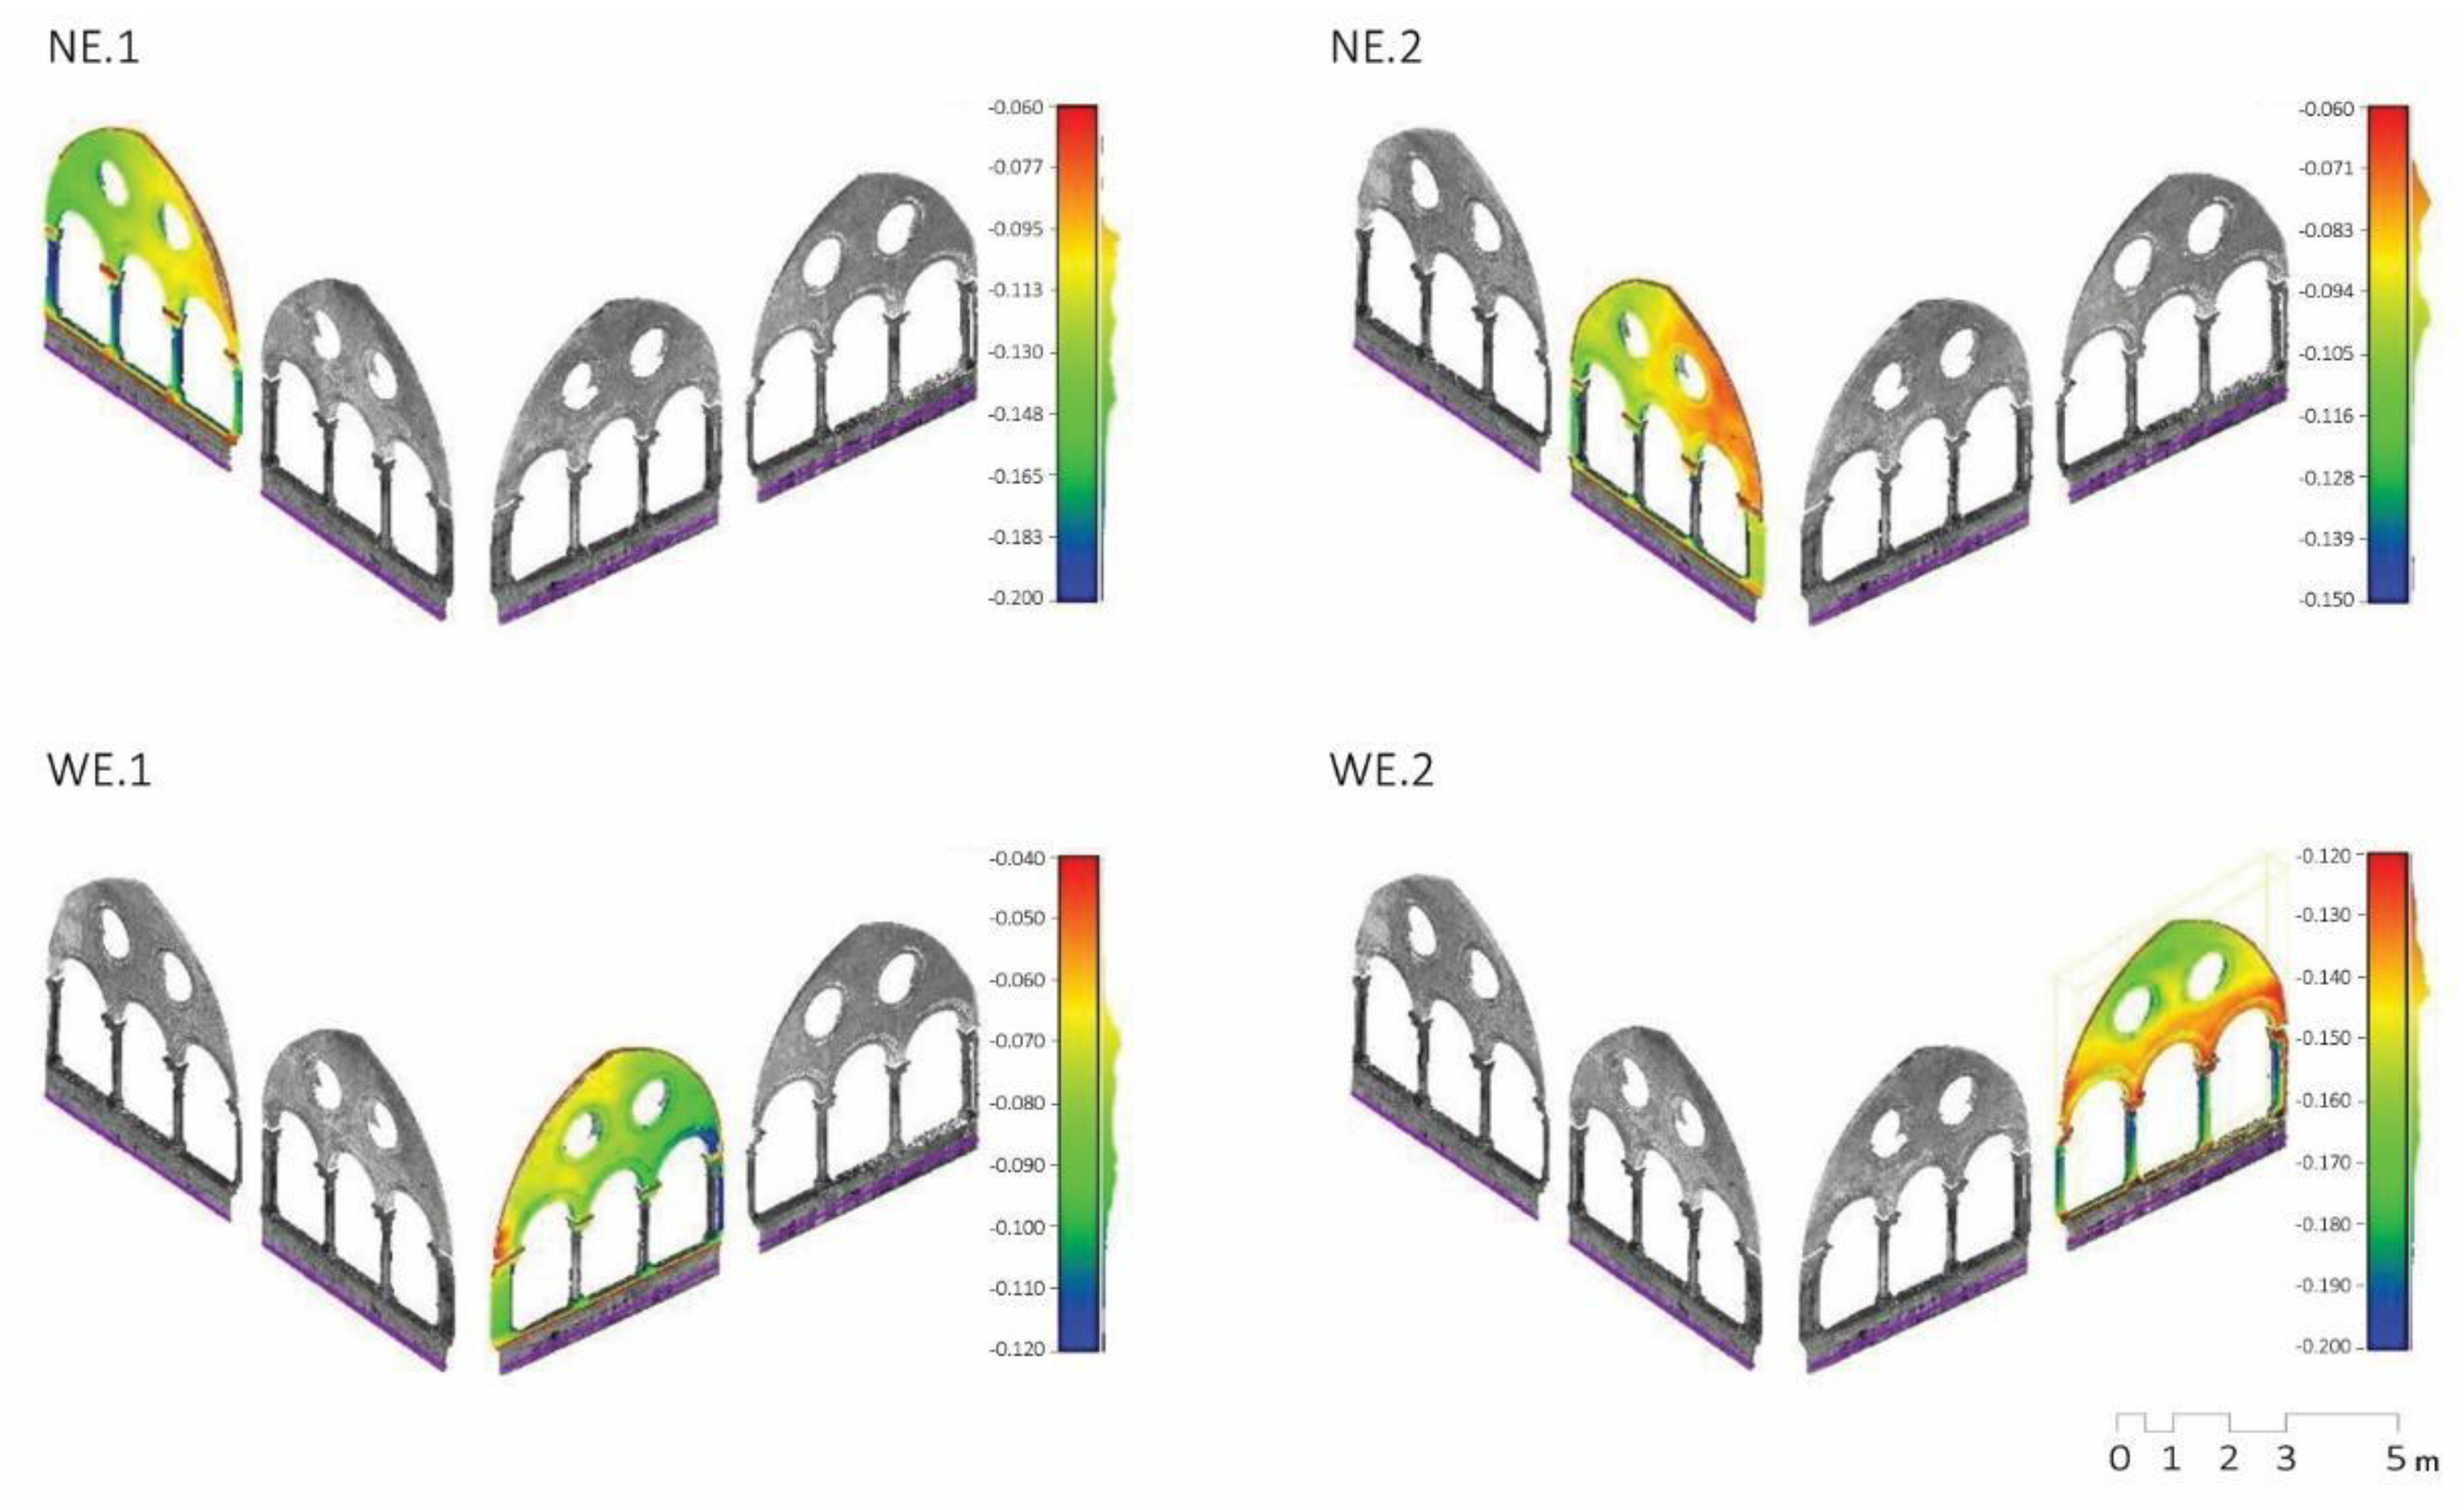
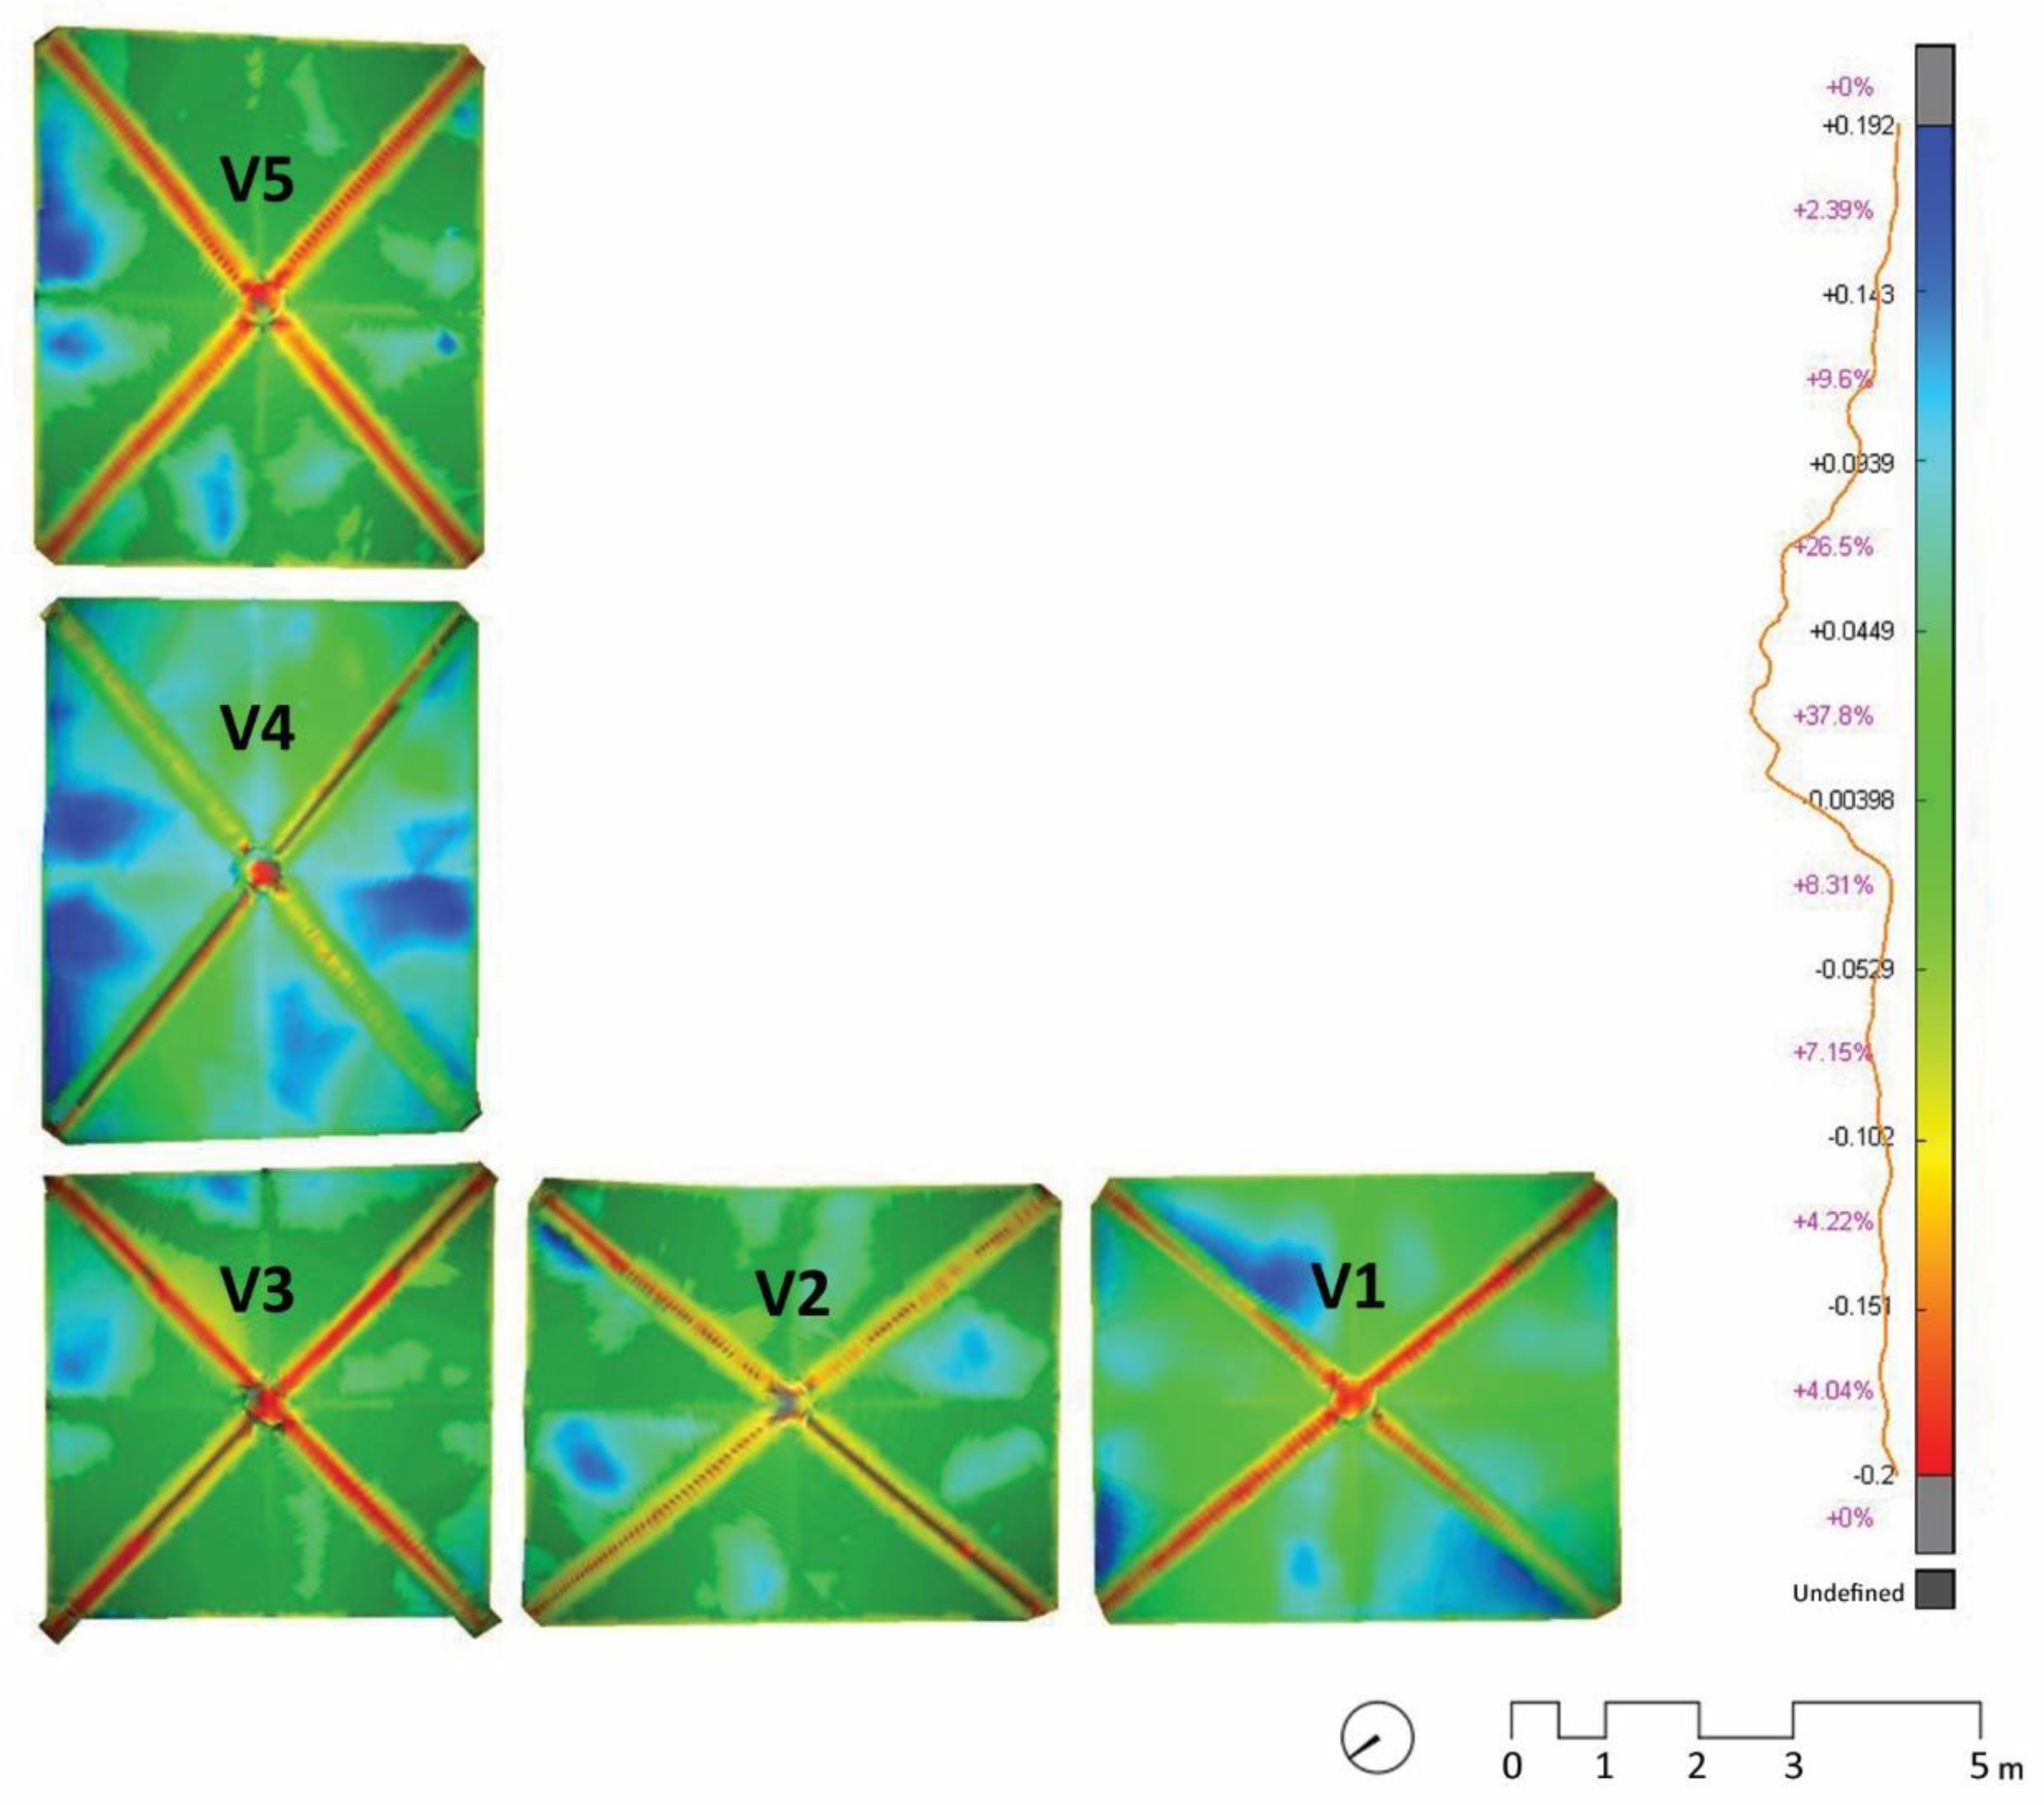
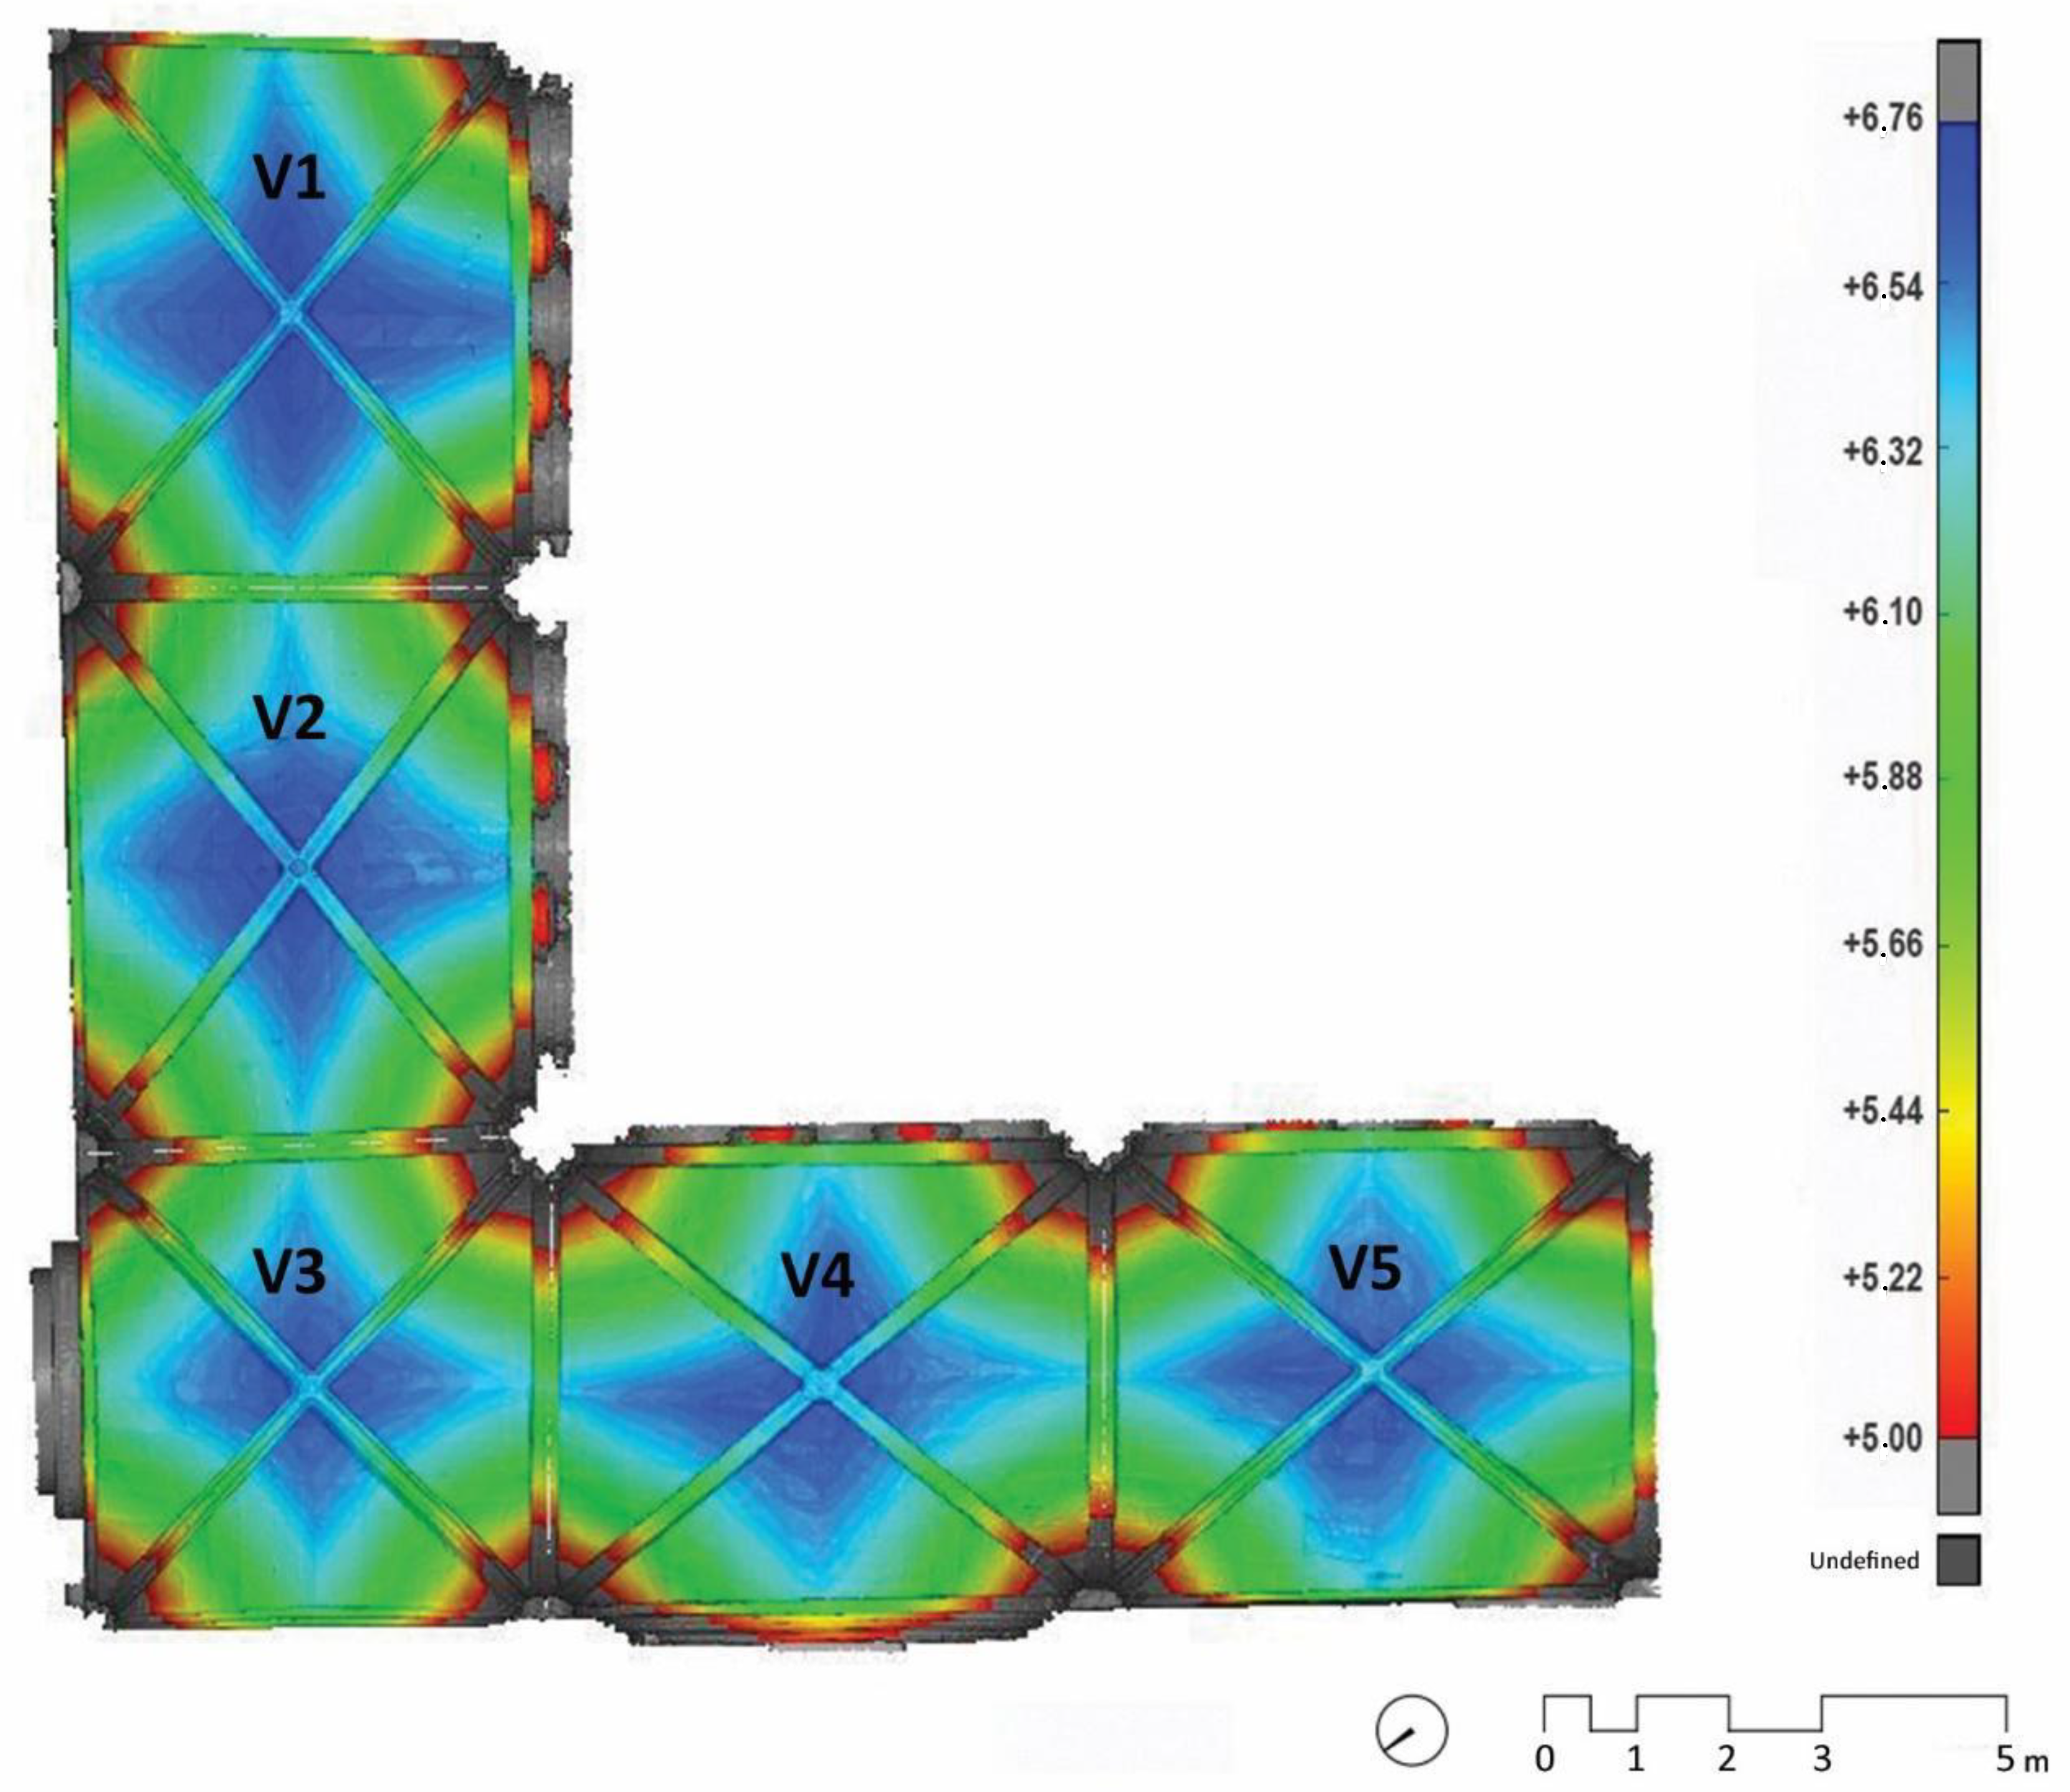
3.2. Vaults Assessment
4. Discussion
Author Contributions
Funding
Acknowledgments
Conflicts of Interest
References
- Xie, W.; He, Q.; Zhang, K.; Guo, L.; Wang, X.; Shen, J.; Cui, Z. Application of terrestrial laser scanner on tidal flat morphology at a typhoon event timescale. Geomorphology 2017, 292, 47–58. [Google Scholar] [CrossRef]
- Massiot, C.; Nicol, A.; Townend, J.; McNamara, D.; Garcia-Sellés, D.; Conway, C.E.; Archibald, G. Quantitative geometric description of fracture systems in an andesite lava flow using terrestrial laser scanner data. J. Volcanol. Geotherm. Res. 2017, 341, 315–331. [Google Scholar] [CrossRef] [Green Version]
- Abbas, M.A.; Lichti, D.D.; Chong, A.K.; Setan, H.; Majid, Z.; Lau, C.L.; Idris, K.M.; Ariff, M.F.M.; Luh, L.C. Improvements to the accuracy of prototype ship models measurement method using terrestrial laser scanner. Measurement 2017, 100, 301–310. [Google Scholar] [CrossRef]
- Suchocki, C.; Katzer, J. An example of harnessing Terrestrial Laser Scanner for remote sensing of saturation of chosen building materials. Constr. Build. Mater. 2016, 122, 400–405. [Google Scholar] [CrossRef]
- Pavlidis, G.; Koutsoudis, A.; Arnaoutoglou, F.; Tsioukas, V.; Chamzas, C. Methods for 3D digitization of Cultural Heritage. J. Cult. Herit. 2007, 8, 93–98. [Google Scholar] [CrossRef] [Green Version]
- England, H. 3D Laser Scanning for Heritage: Advice and Guidance on the Use of Laser Scanning in Archaeology and Architecture; Historic England: Swindon, UK, 2018. [Google Scholar]
- Monego, M.; Fabris, M.; Menin, A.; Achilli, V. 3-D SURVEY APPLIED TO INDUSTRIAL ARCHAEOLOGY BY TLS METHODOLOGY. Int. Arch. Photogramm. Remote Sens. Spat. Inf. Sci. 2017, 42, 449–455. [Google Scholar] [CrossRef] [Green Version]
- Martínez, S.; Ortiz, J.; Gil-Docampo, M.; Rego, M.T. Recording Complex Structures Using Close Range Photogrammetry: The Cathedral of Santiago De Compostela. Photogramm. Rec. 2013, 28, 375–395. [Google Scholar] [CrossRef]
- Sapirstein, P. Accurate measurement with photogrammetry at large sites. J. Archaeol. Sci. 2016, 66, 137–145. [Google Scholar] [CrossRef]
- Fassi, F.; Achille, C.; Fregonese, L. Surveying and modelling the main spire of Milan Cathedral using multiple data sources. Photogramm. Rec. 2011, 26, 462–487. [Google Scholar] [CrossRef]
- Monego, M.; Previato, C.; Bernardi, L.; Menin, A.; Achilli, V. Investigating Pompeii: Application of 3D geomatic techniques for the study of the Sarno Baths. J. Archaeol. Sci. Rep. 2019, 24, 445–462. [Google Scholar] [CrossRef]
- Grussenmeyer, P.; Landes, T.; Voegtle, T.; Ringle, K. Comparison methods of terrestrial laser scanning, photogrammetry and tacheometry data for recording of cultural heritage buildings. Int. Arch. Photogramm. Remote Sens. Spat. Inf. Sci. 2008, 37, 213–218. [Google Scholar]
- Pandžić, J.; Pejić, M.; Božić, B.; Erić, V. Error model of direct georeferencing procedure of terrestrial laser scanning. Autom. Constr. 2017, 78, 13–23. [Google Scholar] [CrossRef]
- Koutsoudis, A.; Vidmar, B.; Ioannakis, G.; Arnaoutoglou, F.; Pavlidis, G.; Chamzas, C. Multi-image 3D reconstruction data evaluation. J. Cult. Herit. 2014, 15, 73–79. [Google Scholar] [CrossRef]
- Quagliarini, E.; Clini, P.; Ripanti, M. Fast, low cost and safe methodology for the assessment of the state of conservation of historical buildings from 3D laser scanning: The case study of Santa Maria in Portonovo (Italy). J. Cult. Herit. 2017, 24, 175–183. [Google Scholar] [CrossRef]
- Bonali, E.; Pesci, A.; Casula, G.; Boschi, E. Deformation of Ancient Buildings inferred by Terrestrial Laser Scanning methodology: The Cantalovo church case study (Northern Italy). Archaeometry 2013, 56, 703–716. [Google Scholar] [CrossRef]
- Pesci, A.; Bonali, E.; Galli, C.; Boschi, E. Laser scanning and digital imaging for the investigation of an ancient building: Palazzo d’Accursio study case (Bologna, Italy). J. Cult. Herit. 2012, 13, 215–220. [Google Scholar] [CrossRef]
- De Catalunya, U.I.; Coll-Pla, S.; Costa-Jover, A.; Piquer, M.L.; I Virgili, U.R. Evaluation of large deformations on Romanesque masonry pillars: The case of Santa María de Arties (XII-XIII) at Valle de Arán, Spain. Rev. Constr. 2017, 16, 468–478. [Google Scholar] [CrossRef] [Green Version]
- Jover, A.C.; Ginovart, J.L.; Coll-Pla, S.; Piquer, M.L. Using the terrestrial laser scanner and simple methodologies for geometrically assessing complex masonry vaults. J. Cult. Herit. 2019, 36, 247–254. [Google Scholar] [CrossRef]
- Korumaz, M.; Betti, M.; Conti, A.; Tucci, G.; Bartoli, G.; Bonora, V.; Korumaz, A.G.; Fiorini, L. An integrated Terrestrial Laser Scanner (TLS), Deviation Analysis (DA) and Finite Element (FE) approach for health assessment of historical structures. A minaret case study. Eng. Struct. 2017, 153, 224–238. [Google Scholar] [CrossRef]
- Almac, U.; Pekmezci, I.P.; Ahunbay, M.G. Numerical Analysis of Historic Structural Elements Using 3D Point Cloud Data. Open Constr. Build. Technol. J. 2016, 10, 233–245. [Google Scholar] [CrossRef] [Green Version]
- Neuner, H.; Holst, C.; Kuhlmann, H. Overview on current modelling strategies of point clouds for deformation analysis. AVN 2016, 123, 328–339. [Google Scholar]
- Gawronek, P.; Makuch, M.; Mitka, B.; Gargula, T. Measurements of the Vertical Displacements of a Railway Bridge Using TLS Technology in the Context of the Upgrade of the Polish Railway Transport. Sensors 2019, 19, 4275. [Google Scholar] [CrossRef] [PubMed] [Green Version]
- Wei, Z.; Huadong, G.; Qi, L.; Tianhua, H. Fine Deformation Monitoring of Ancient Building Based on Terrestrial Laser Scanning Technologies. IOP Conf. Ser. Earth Env. Sci. 2014, 17, 12166. [Google Scholar] [CrossRef]
- Yang, H.; Omidalizarandi, M.; Xu, X.; Neumann, I. Terrestrial laser scanning technology for deformation monitoring and surface modeling of arch structures. Compos. Struct. 2017, 169, 173–179. [Google Scholar] [CrossRef] [Green Version]
- Yang, H.; Xu, X.; Neumann, I. Deformation behavior analysis of composite structures under monotonic loads based on terrestrial laser scanning technology. Compos. Struct. 2018, 183, 594–599. [Google Scholar] [CrossRef]
- Cabaleiro, M.; Hermida, J.; Riveiro, B.; Caamaño, J. Automated processing of dense points clouds to automatically determine deformations in highly irregular timber structures. Constr. Build. Mater. 2017, 146, 393–402. [Google Scholar] [CrossRef]
- Wojtkowska, M.; Kedzierski, M.; Delis, P. Validation of terrestrial laser scanning and artificial intelligence for measuring deformations of cultural heritage structures. Measurement 2021, 167, 108291. [Google Scholar] [CrossRef]
- Núñez-Andrés, M.A.; Buill, F.; Costa-Jover, A.; Puche, J.M. Structural assessment of the Roman wall and vaults of the cloister of Tarragona Cathedral. J. Build. Eng. 2017, 13, 77–86. [Google Scholar] [CrossRef] [Green Version]


| BAY | METH | Average (m) | Std Dev (m) | Min (m) | Max (m) | % (±2.5 cm) | No. Pts |
|---|---|---|---|---|---|---|---|
| WI.1 | (a) | 0.001 | 0.009 | −0.028 | 0.028 | 98.6 | 1,016,467 |
| WI.1 | (b) | −0.003 | 0.015 | −0.050 | 0.045 | 93.5 | 1,016,467 |
| WI.1 | (c) | −0.005 | 0.017 | −0.060 | 0.058 | 86.5 | 1,016,467 |
| NI.1 | (a) | −0.002 | 0.010 | −0.042 | 0.037 | 99.2 | 1,886,586 |
| NI.1 | (b) | −0.006 | 0.013 | −0.050 | 0.035 | 94.0 | 1,886,586 |
| NI.2 | (a) | 0.000 | 0.005 | −0.020 | 0.019 | 99.9 | 1,893,059 |
| NI.2 | (b) | −0.002 | 0.007 | −0.025 | 0.020 | 94.7 | 1,893,059 |
| NI1+2 | (a) | 0.005 | 0.017 | −0.047 | 0.042 | 86.4 | 3,779,645 |
| NI1+2 | (b) | 0.004 | 0.017 | −0.054 | 0.055 | 83.3 | 3,779,645 |
| NI1+2 | (c) | 0.006 | 0.017 | −0.048 | 0.043 | 84.2 | 3,779,645 |
| WE.1 | (c) | −0.079 | 0.061 | −0.270 | 0.126 | 23.2 | 863,707 |
| WE.1 | (a) | 0.003 | 0.009 | −0.040 | 0.029 | 98.8 | 276,866 |
| WE.2 | (c) | −0.109 | 0.068 | −0.215 | 0.038 | 26.1 | 374,081 |
| WE.2 | (a) | 0.006 | 0.008 | −0.034 | 0.031 | 99.3 | 134,708 |
| SE.1 | (c) | −0.104 | 0.069 | −0.312 | 0.089 | 23.0 | 792,774 |
| SE.1 | (a) | 0.004 | 0.007 | −0.030 | 0.025 | 99.4 | 270,631 |
| SE.2 | (c) | −0.086 | 0.060 | −0.280 | 0.086 | 22.2 | 942,233 |
| SE.2 | (a) | 0.009 | 0.006 | −0.035 | 0.025 | 99.8 | 294,047 |
| BAY | METH | Average (m) | Std Dev (m) | Min (m) | Max (m) | % (±2.5 cm) | No. Pts |
|---|---|---|---|---|---|---|---|
| WI.1 | (a) | 0.001 | 0.009 | −0.028 | 0.028 | 98.6 | 1,016,467 |
| WI.1 | (b) | −0.003 | 0.015 | −0.050 | 0.045 | 93.5 | 1,016,467 |
| WI.1 | (c) | −0.005 | 0.017 | −0.060 | 0.058 | 86.5 | 1,016,467 |
| min | −0.005 | 0.009 | −0.060 | 0.028 | |||
| max | 0.001 | 0.017 | −0.028 | 0.058 | |||
| diff | −0.006 | 0.008 | 0.032 | 0.030 | |||
| NI.1 | (a) | −0.002 | 0.010 | −0.042 | 0.037 | 99.2 | 1,886,586 |
| NI.1 | (b) | −0.006 | 0.013 | −0.050 | 0.035 | 94.0 | 1,886,586 |
| NI.2 | (a) | 0.000 | 0.005 | −0.020 | 0.019 | 99.9 | 1,893,059 |
| NI.2 | (b) | −0.002 | 0.007 | −0.025 | 0.020 | 94.7 | 1,893,059 |
| NI1+2 | (a) | 0.005 | 0.017 | −0.047 | 0.042 | 86.4 | 3,779,645 |
| NI1+2 | (b) | 0.004 | 0.017 | −0.054 | 0.055 | 83.3 | 3,779,645 |
| NI1+2 | (c) | 0.006 | 0.017 | −0.048 | 0.043 | 84.2 | 3,779,645 |
| min | −0.006 | 0.005 | −0.054 | 0.019 | |||
| max | 0.006 | 0.017 | −0.020 | 0.055 | |||
| diff | −0.012 | 0.012 | 0.034 | 0.036 | |||
| WE.1 | (c) | −0.079 | 0.061 | −0.270 | 0.126 | 23.2 | 863,707 |
| WE.1 | (a) | 0.003 | 0.009 | −0.040 | 0.029 | 98.8 | 276,866 |
| WE.2 | (c) | −0.109 | 0.068 | −0.215 | 0.038 | 26.1 | 374,081 |
| WE.2 | (a) | 0.006 | 0.008 | −0.034 | 0.031 | 99.3 | 134,708 |
| min | −0.109 | 0.008 | −0.270 | 0.029 | |||
| max | 0.006 | 0.068 | −0.034 | 0.126 | |||
| diff | −0.115 | 0.060 | 0.236 | 0.097 | |||
| NE.1 | (c) | −0.104 | 0.069 | −0.312 | 0.089 | 23.0 | 792,774 |
| NE.1 | (a) | 0.004 | 0.007 | −0.030 | 0.025 | 99.4 | 270,631 |
| NE.2 | (c) | −0.086 | 0.060 | −0.280 | 0.086 | 22.2 | 942,233 |
| NE.2 | (a) | 0.009 | 0.006 | −0.035 | 0.025 | 99.8 | 294,047 |
| min | −0.104 | 0.006 | −0.312 | 0.025 | |||
| max | 0.009 | 0.069 | −0.030 | 0.089 | |||
| diff | −0.113 | 0.063 | 0.282 | 0.064 |
Publisher’s Note: MDPI stays neutral with regard to jurisdictional claims in published maps and institutional affiliations. |
© 2020 by the authors. Licensee MDPI, Basel, Switzerland. This article is an open access article distributed under the terms and conditions of the Creative Commons Attribution (CC BY) license (http://creativecommons.org/licenses/by/4.0/).
Share and Cite
Buill, F.; Núñez-Andrés, M.A.; Costa-Jover, A.; Moreno, D.; Puche, J.M.; Macias, J.M. Terrestrial Laser Scanner for the Formal Assessment of a Roman-Medieval Structure—The Cloister of the Cathedral of Tarragona (Spain). Geosciences 2020, 10, 427. https://0-doi-org.brum.beds.ac.uk/10.3390/geosciences10110427
Buill F, Núñez-Andrés MA, Costa-Jover A, Moreno D, Puche JM, Macias JM. Terrestrial Laser Scanner for the Formal Assessment of a Roman-Medieval Structure—The Cloister of the Cathedral of Tarragona (Spain). Geosciences. 2020; 10(11):427. https://0-doi-org.brum.beds.ac.uk/10.3390/geosciences10110427
Chicago/Turabian StyleBuill, Felipe, M. Amparo Núñez-Andrés, Agustí Costa-Jover, David Moreno, Josep M. Puche, and Josep M. Macias. 2020. "Terrestrial Laser Scanner for the Formal Assessment of a Roman-Medieval Structure—The Cloister of the Cathedral of Tarragona (Spain)" Geosciences 10, no. 11: 427. https://0-doi-org.brum.beds.ac.uk/10.3390/geosciences10110427