Formation and Outburst of the Toguz-Bulak Glacial Lake in the Northern Teskey Range, Tien Shan, Kyrgyzstan


Abstract
:1. Introduction
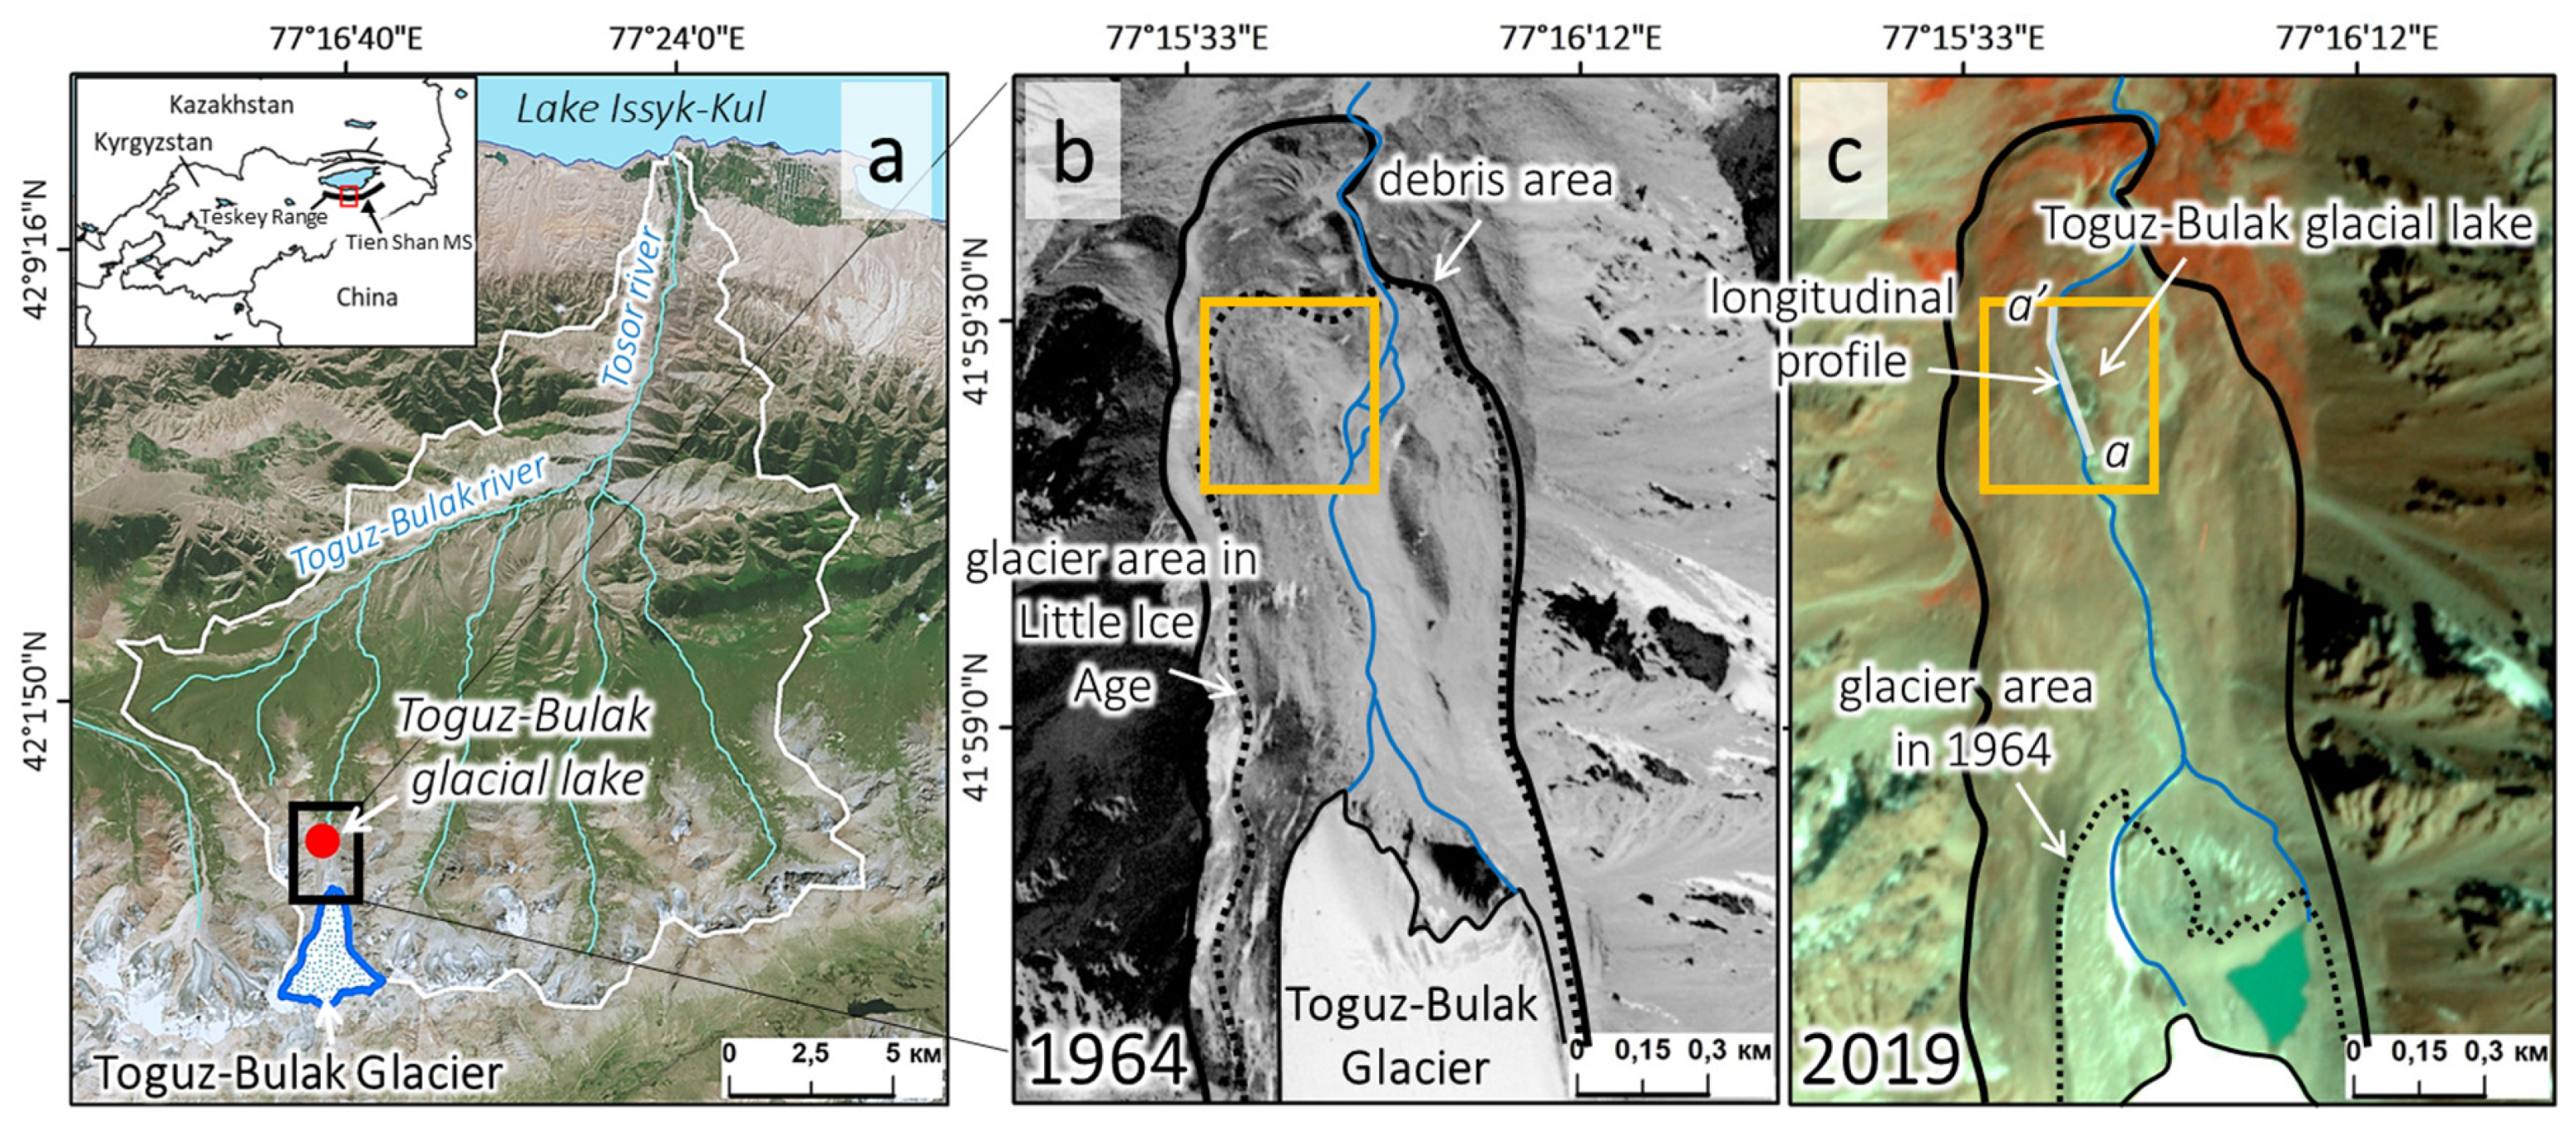
2. Study Area
3. Methods
3.1. Remote Sensing and Meteorological Data
3.2. Geomorphological Conditions of the Toguz-Bulak Glacial Lake
4. Results
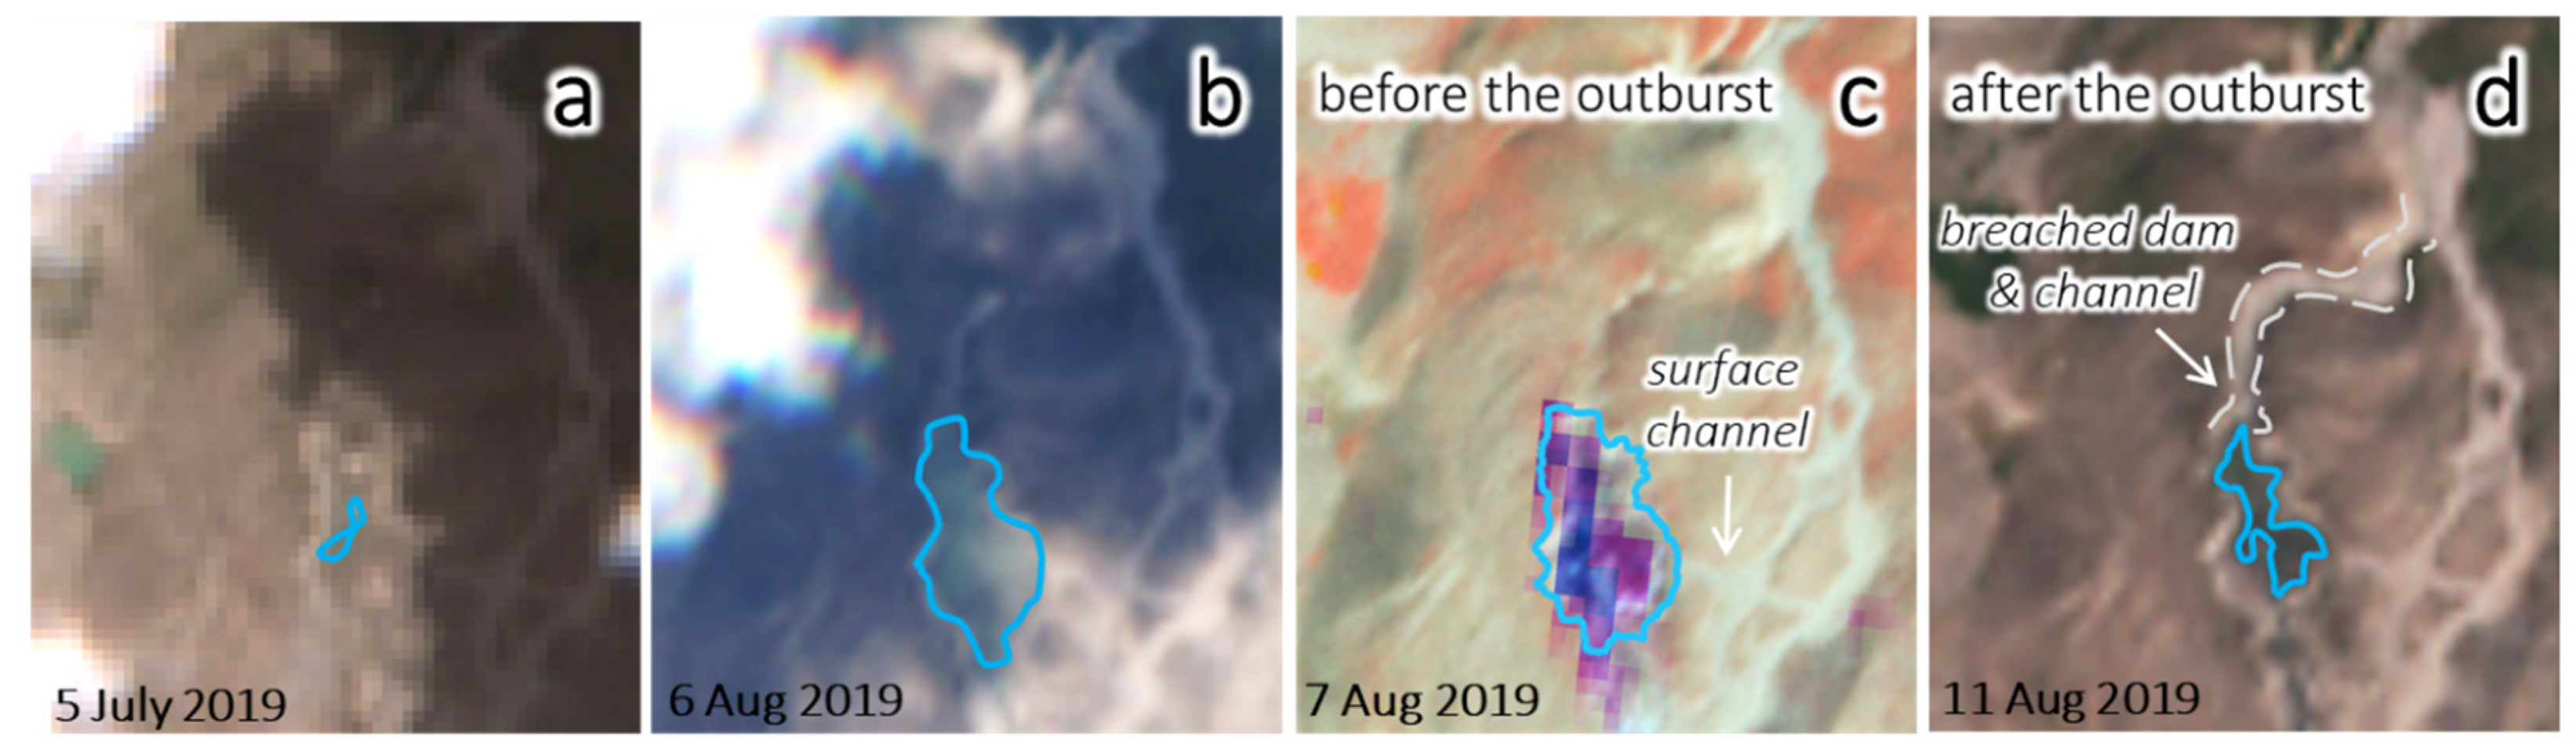
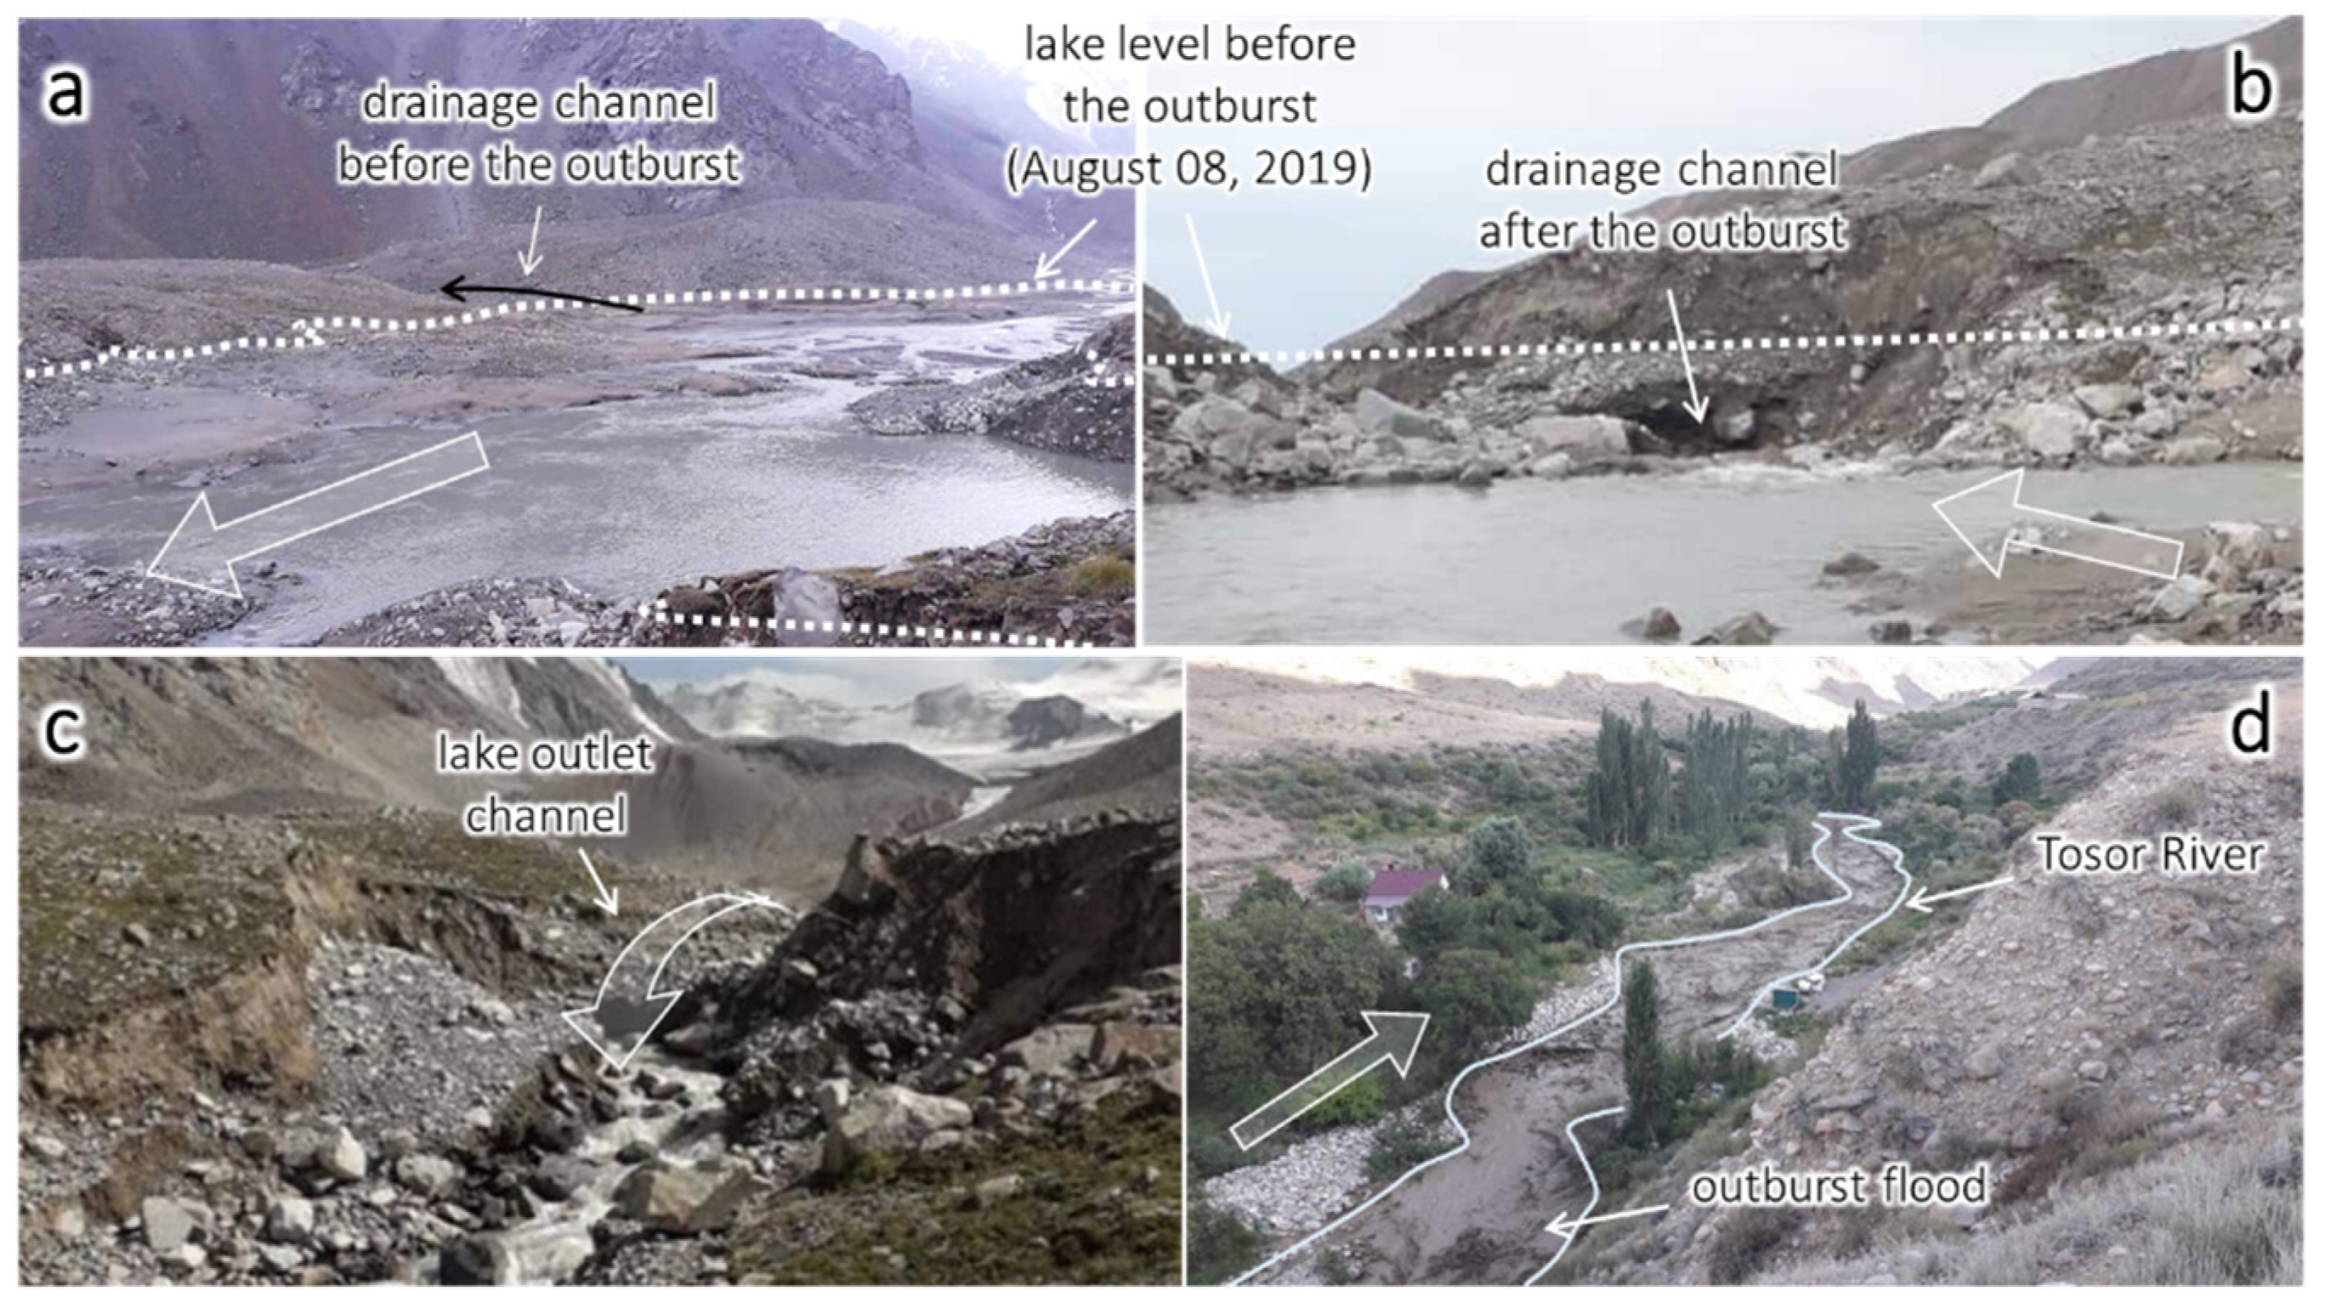
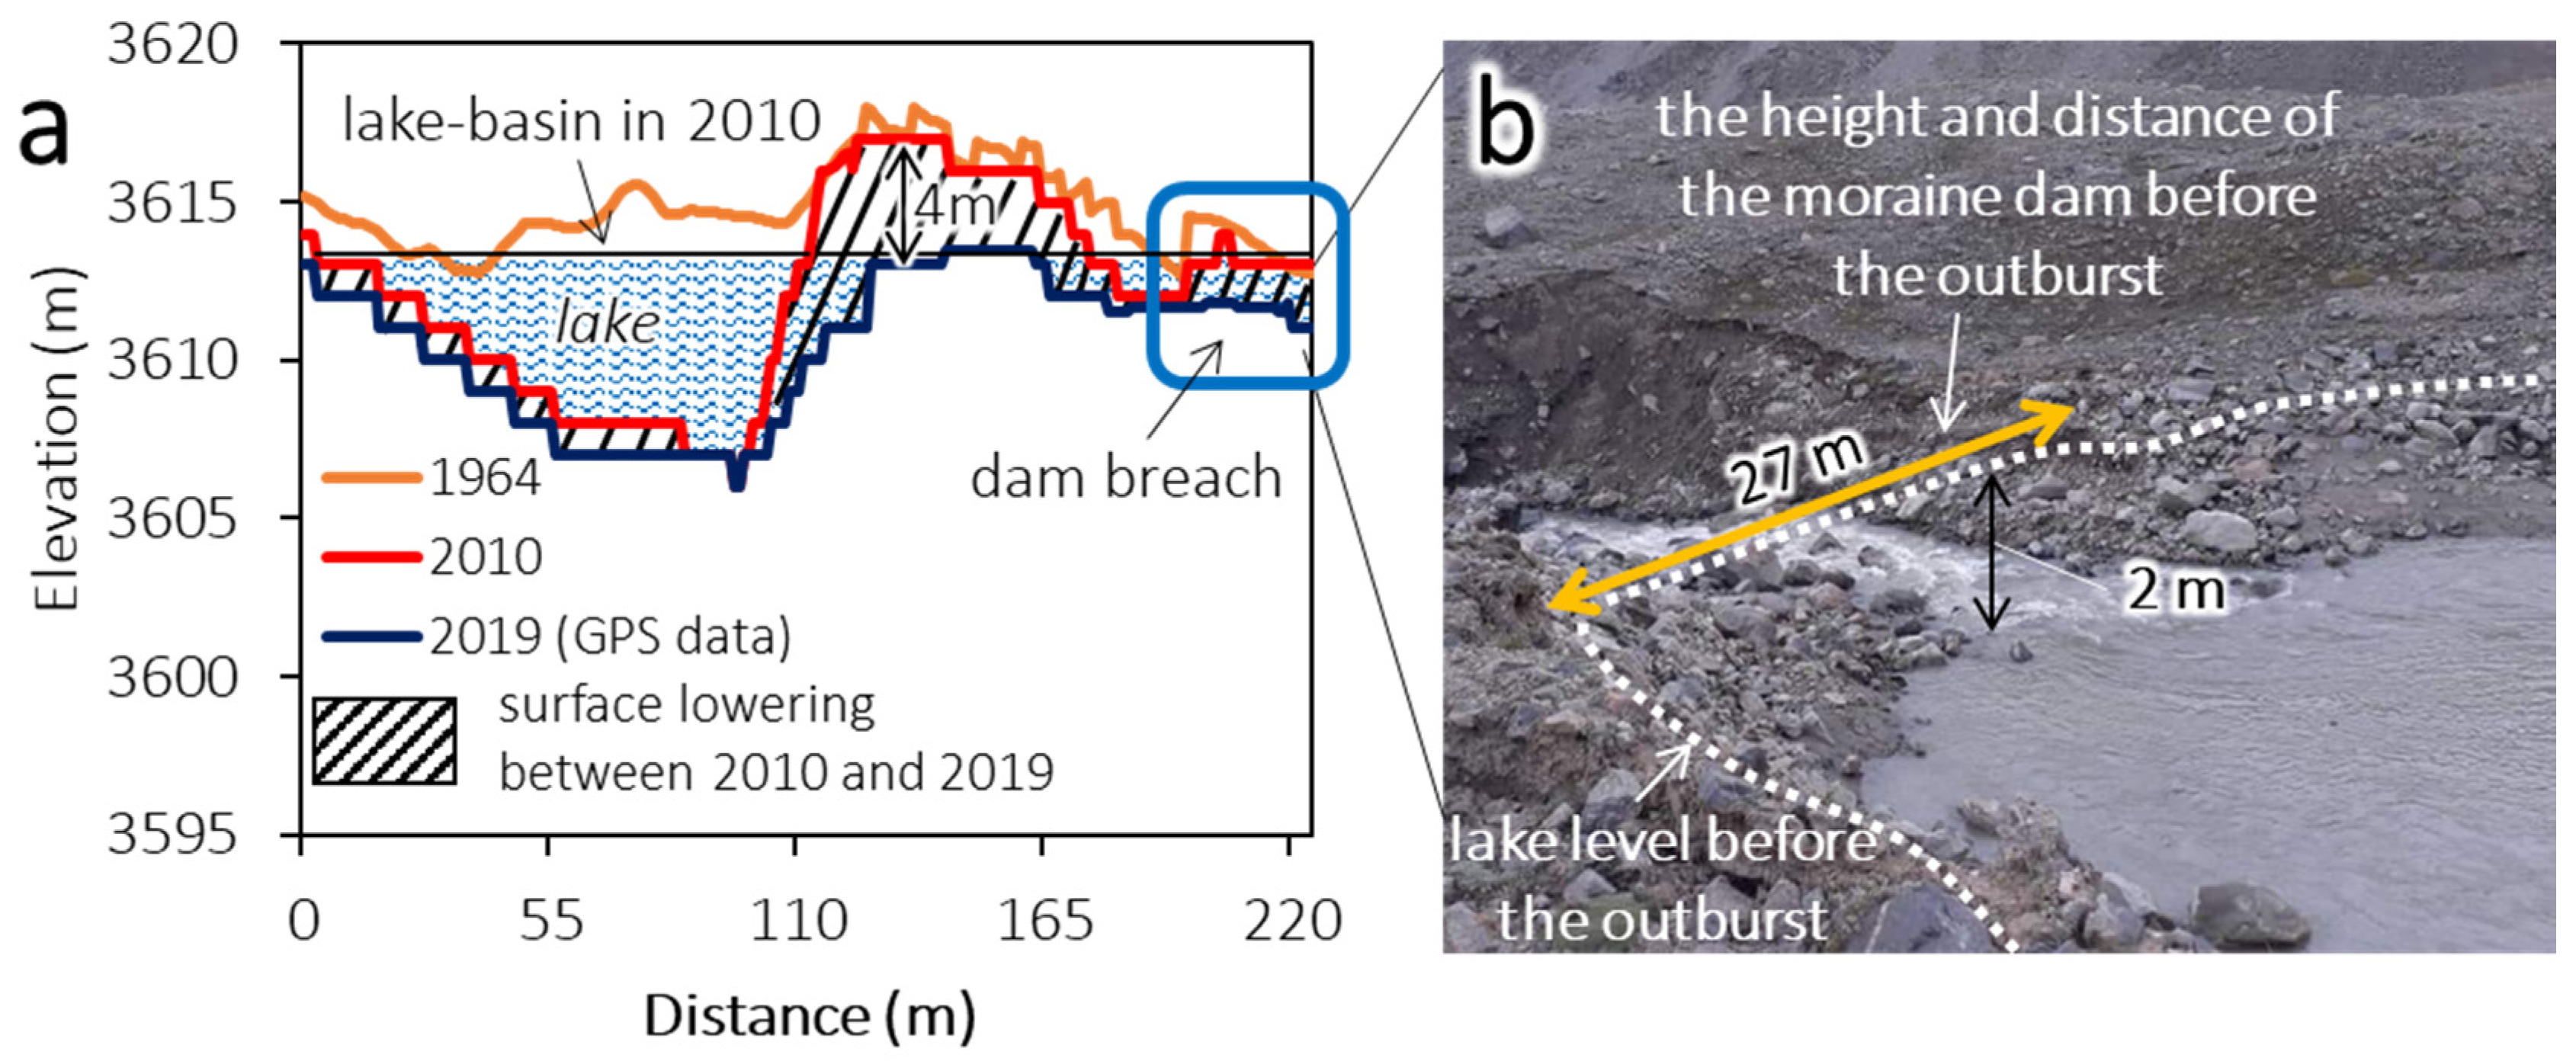
4.1. Outburst of Toguz-Bulak Glacial Lake on 8 August 2019
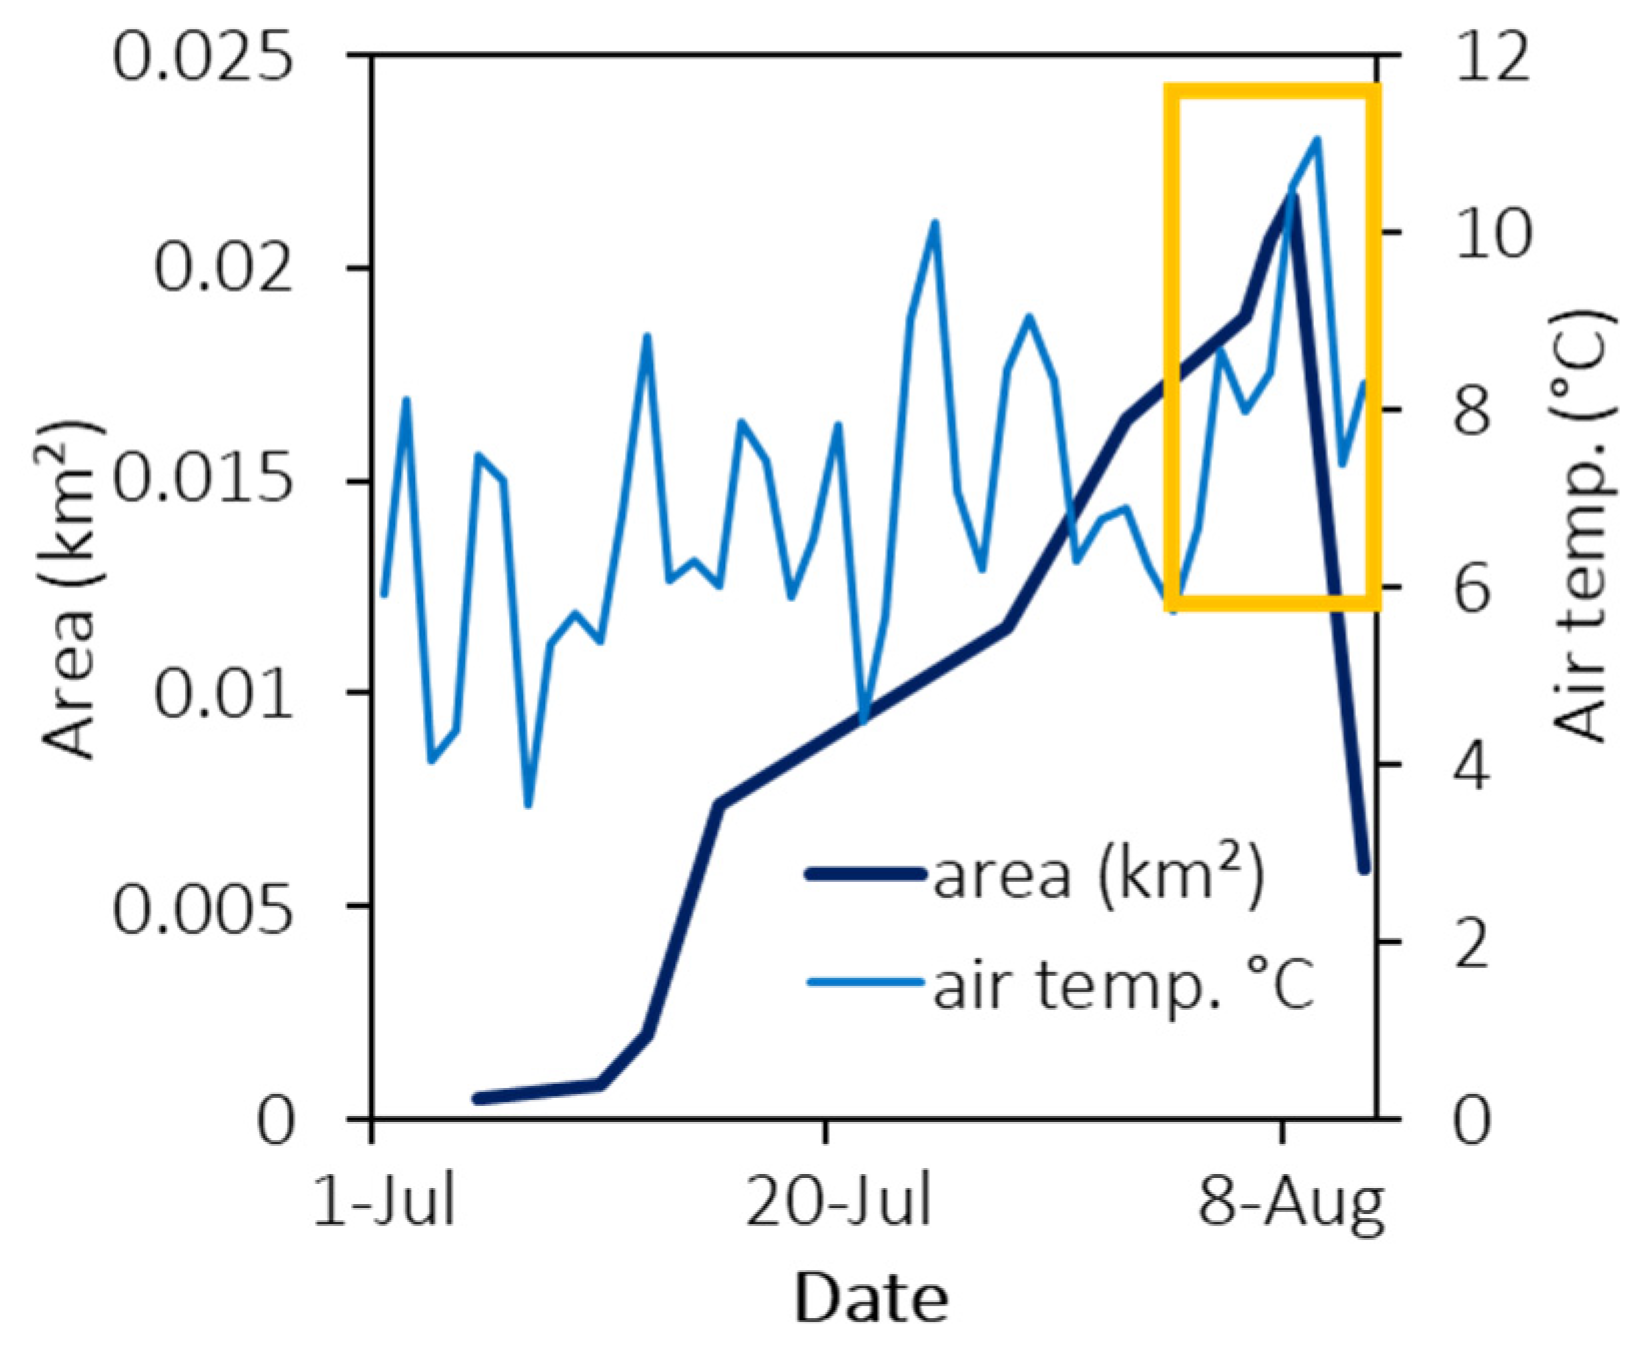
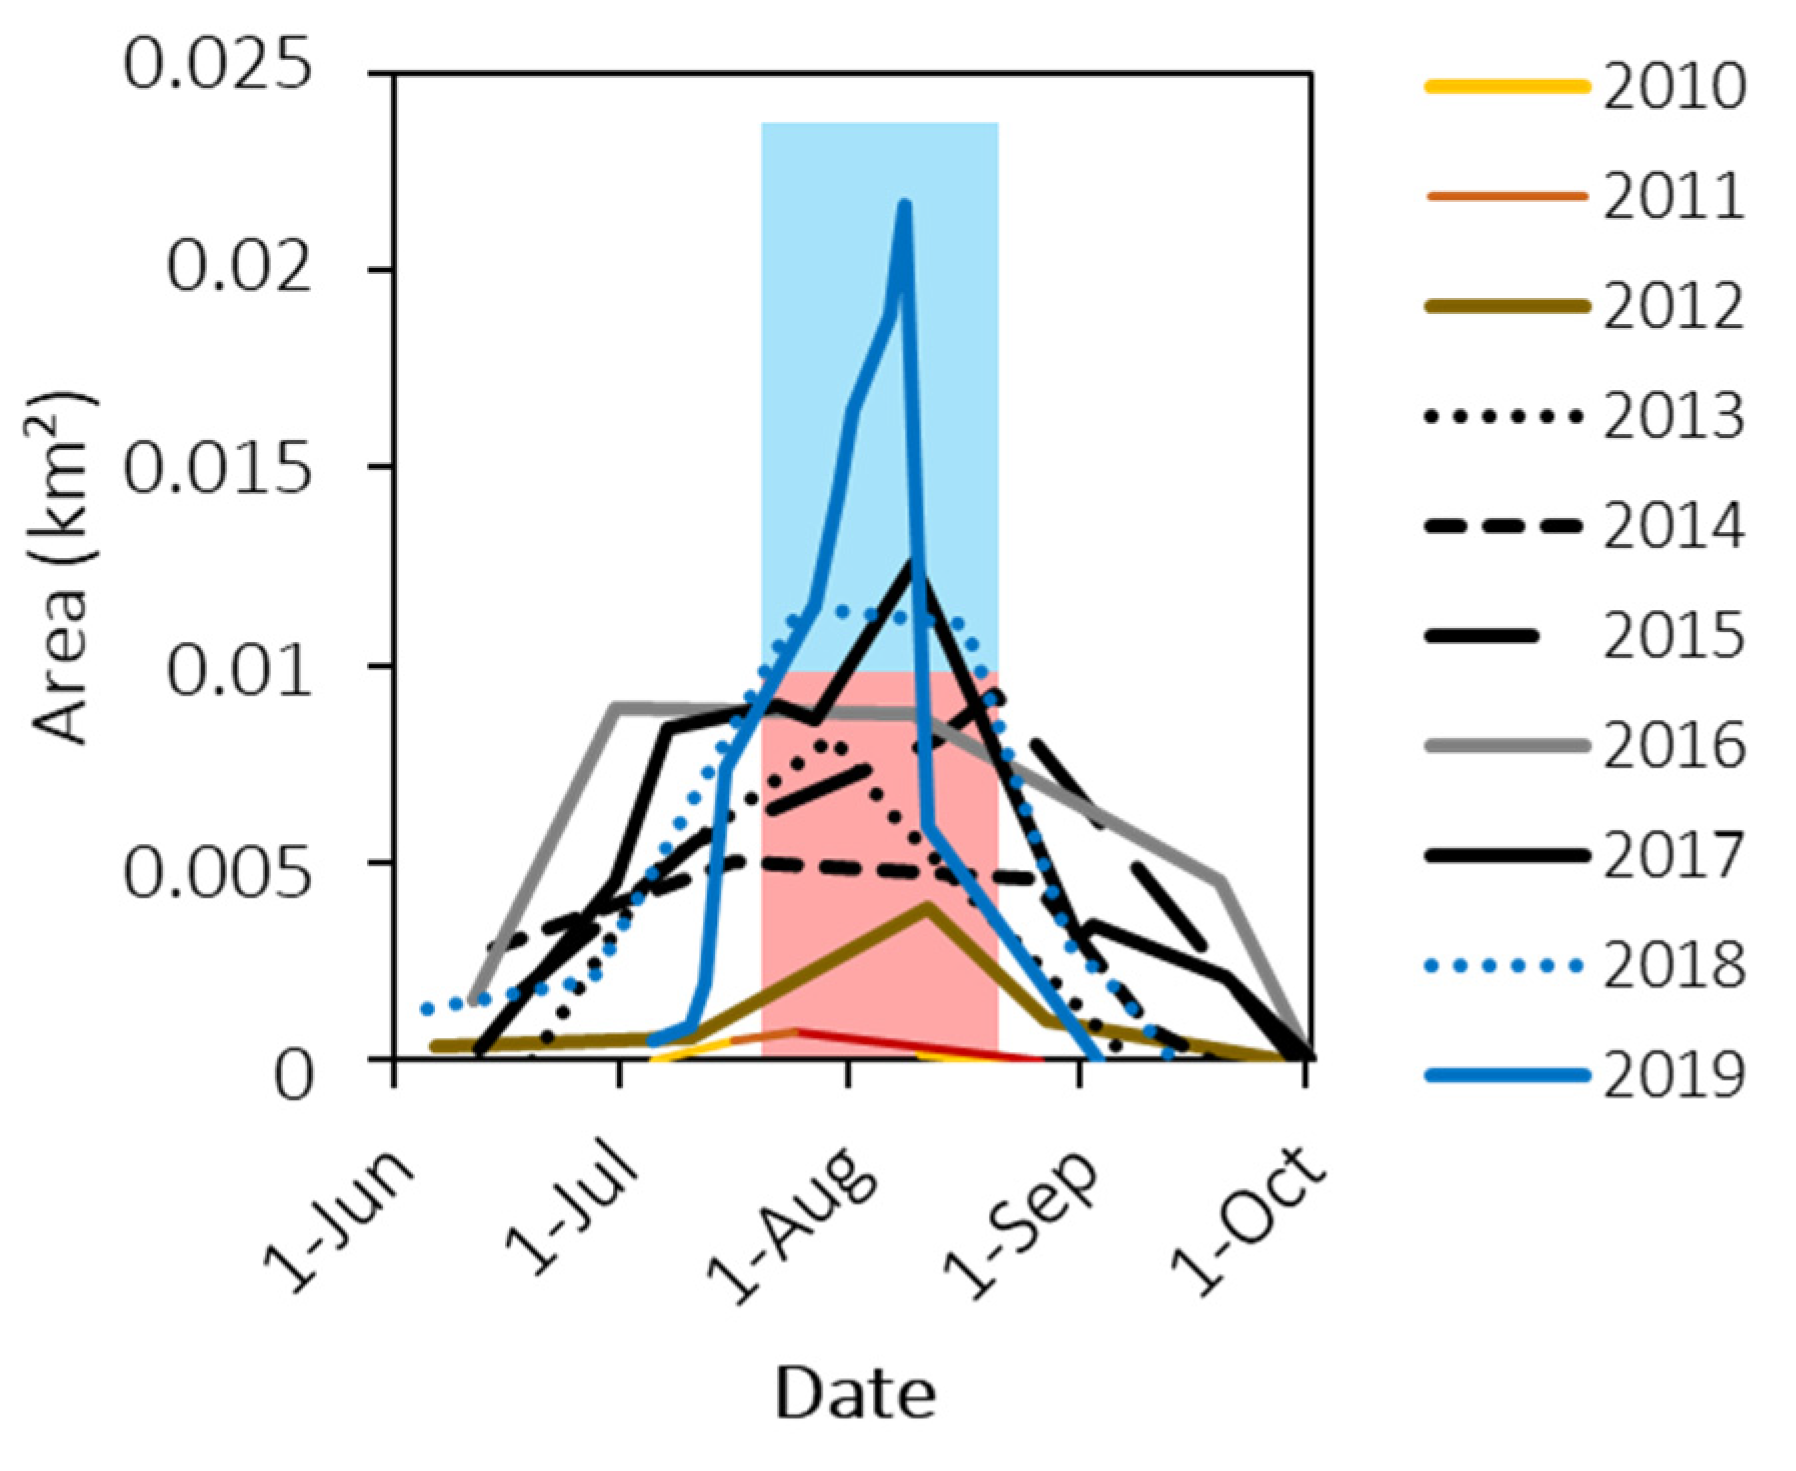
4.2. Toguz-Bulak Glacial Lake Area Variability during 2010–2019
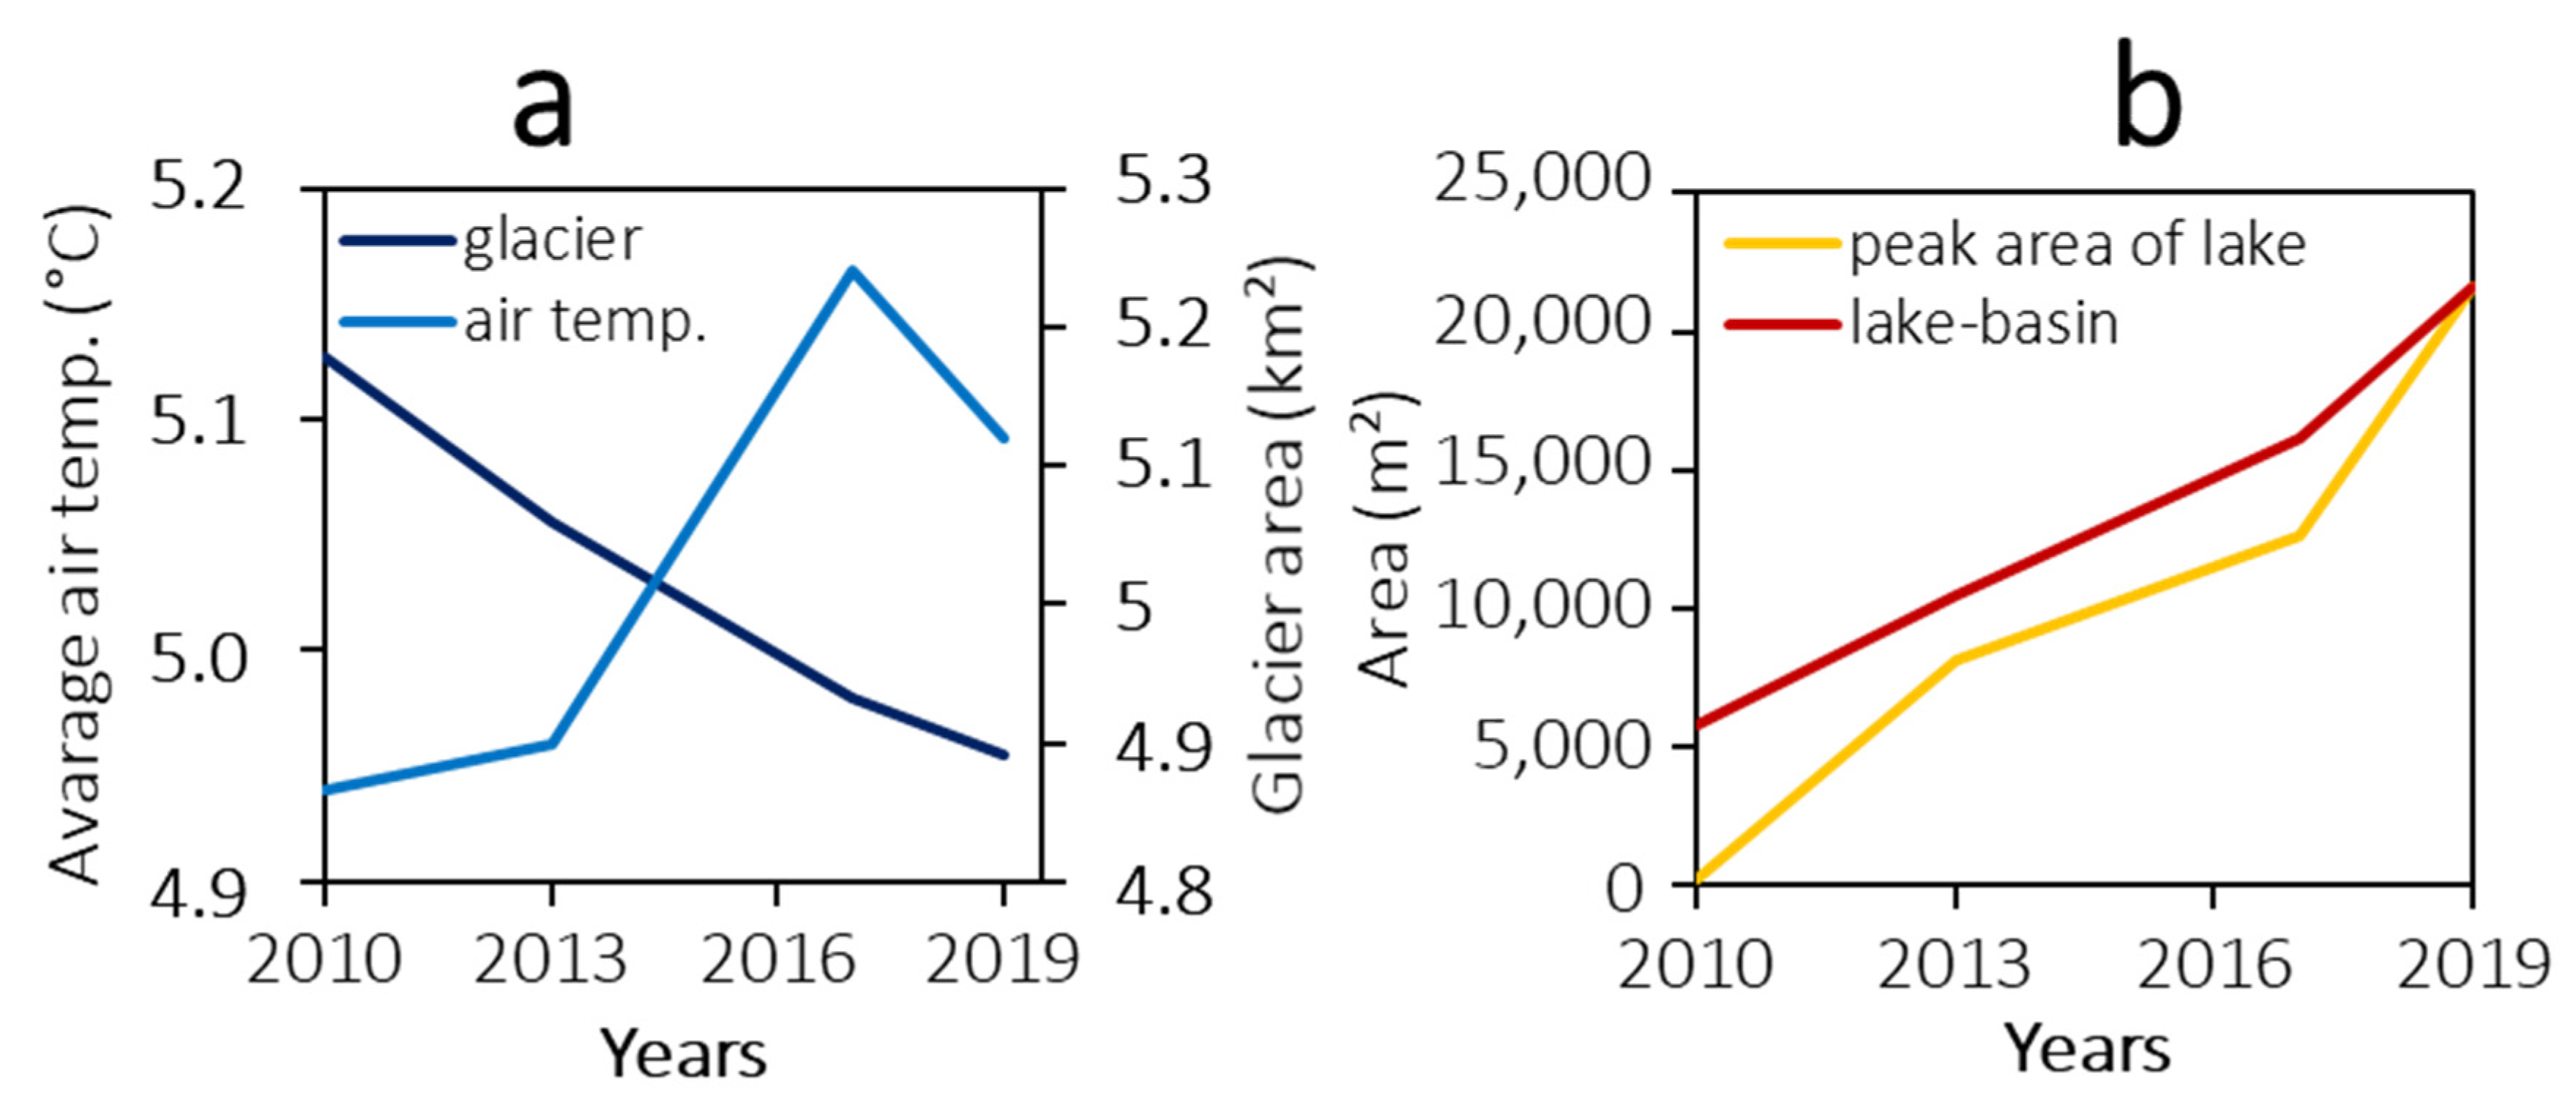
4.3. Meteorological Factors Behind the Increase in Lake Area
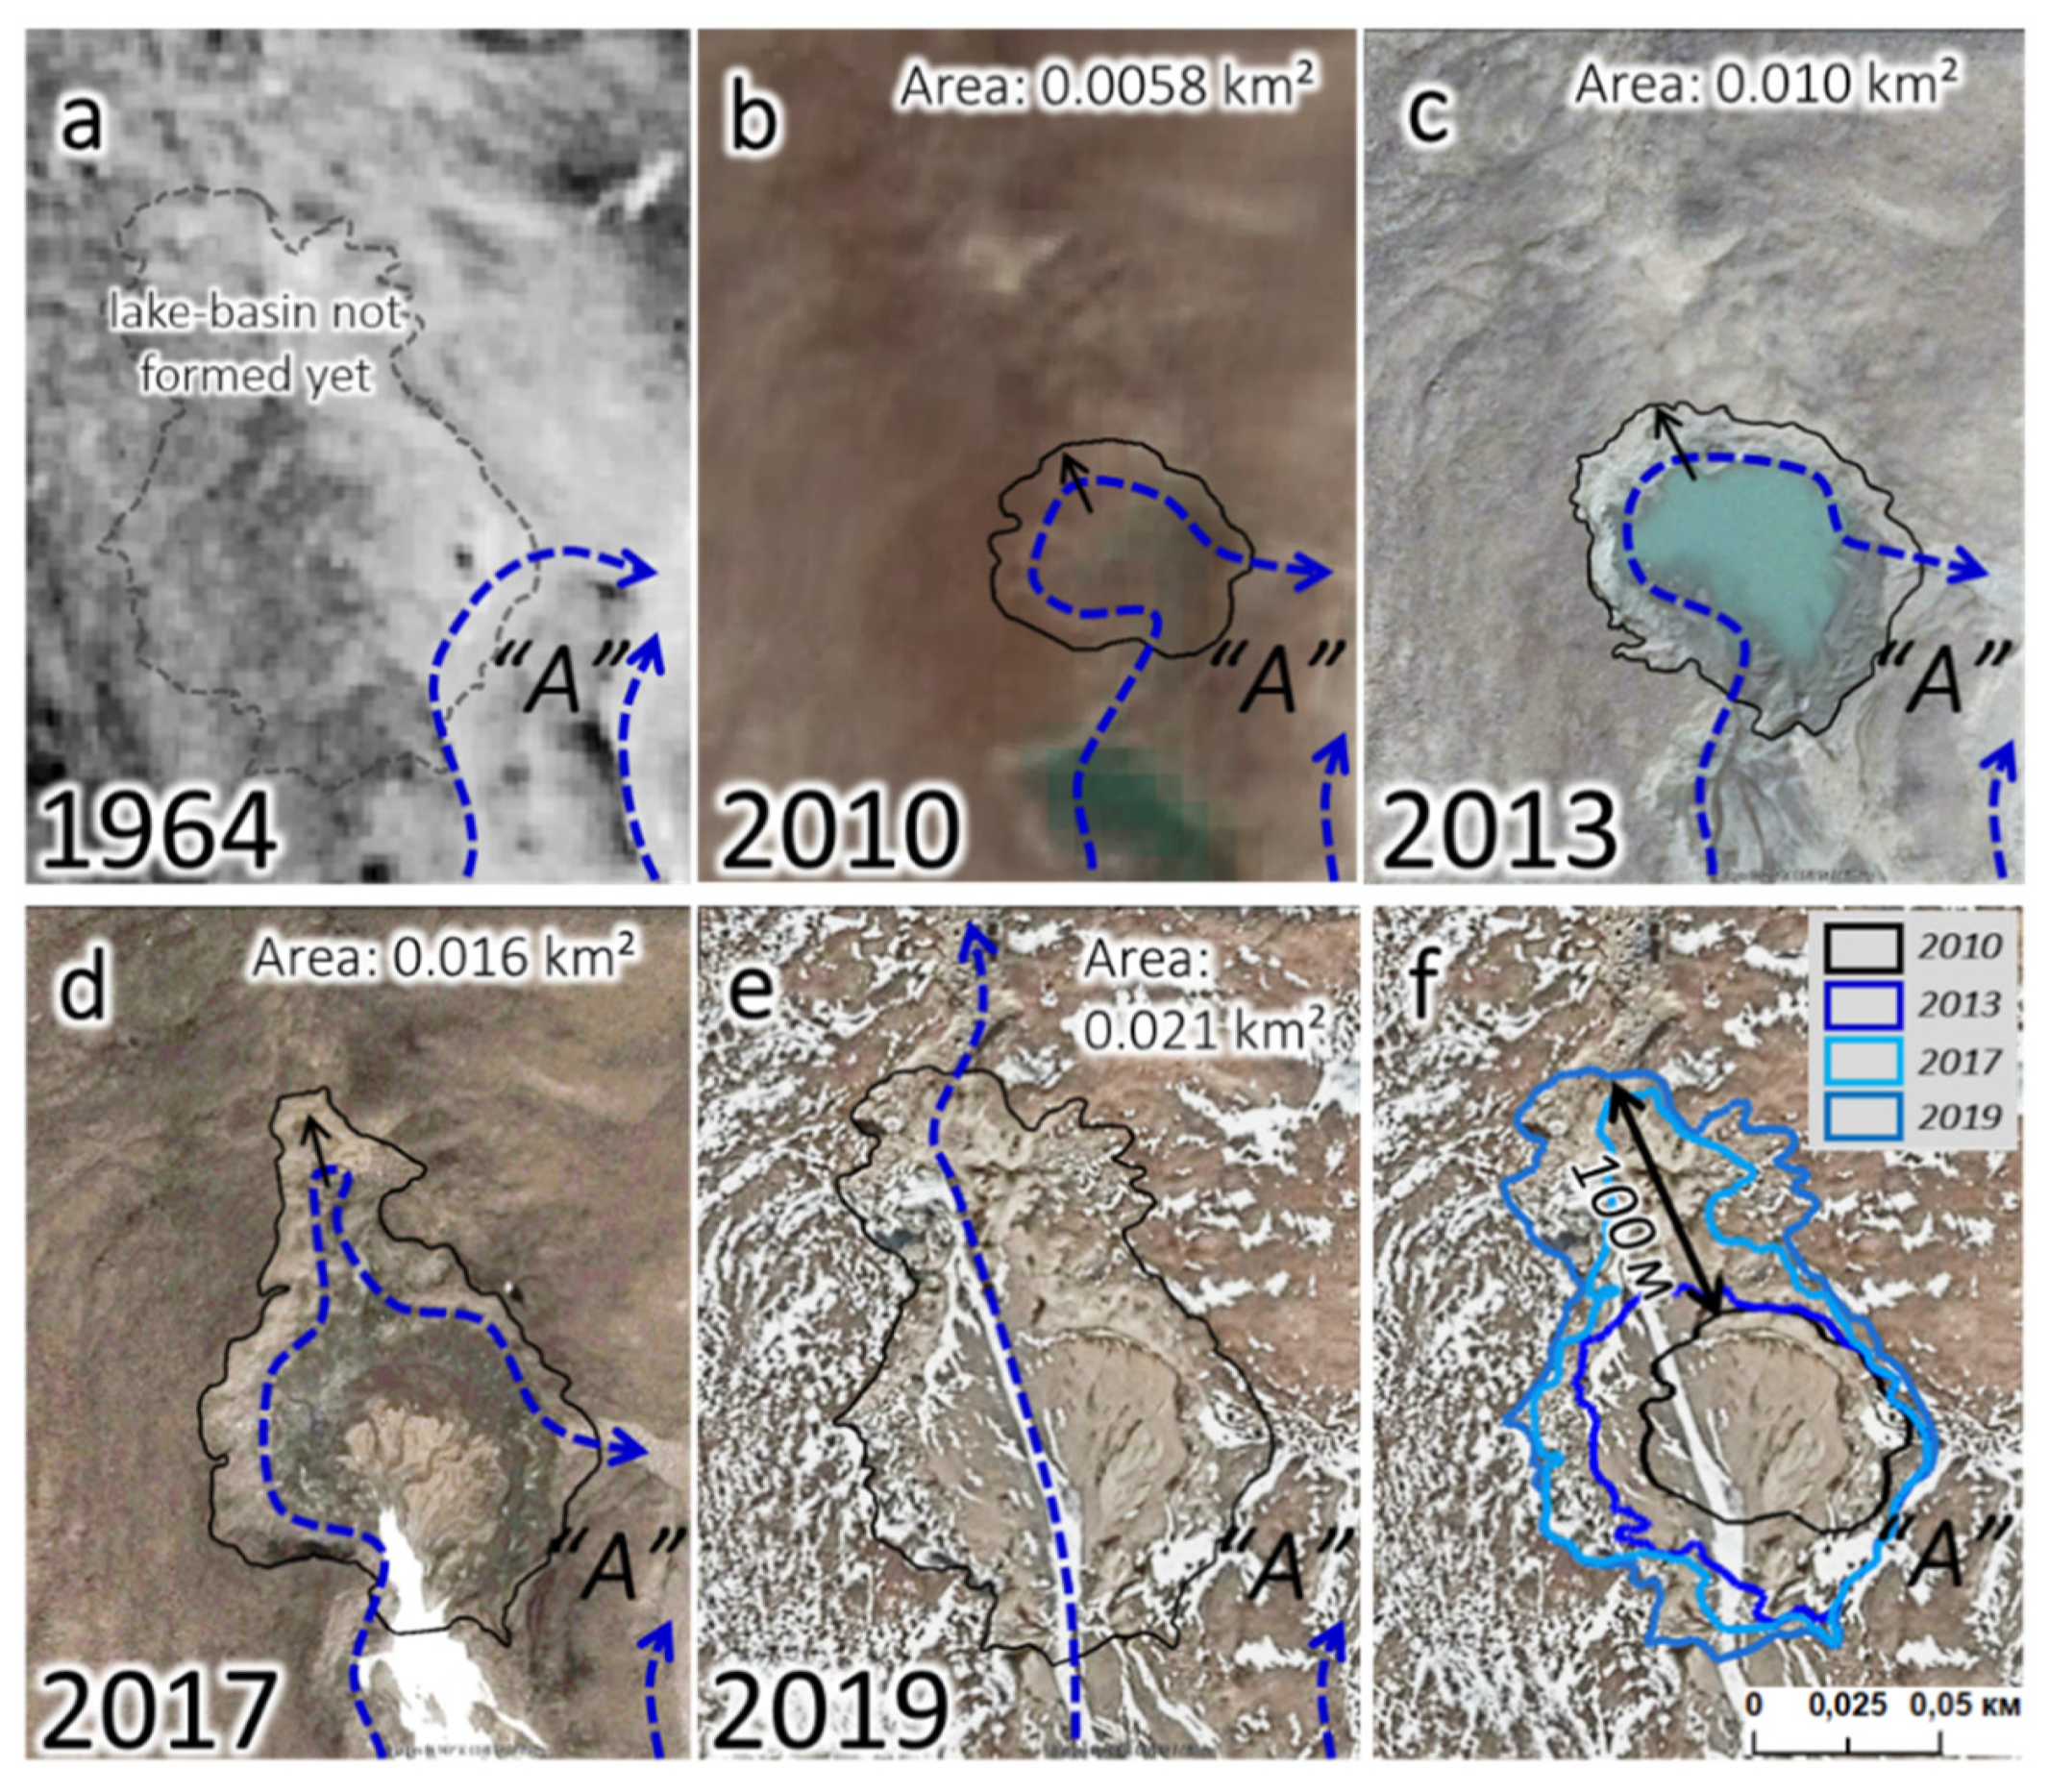
4.4. Geomorphological Processes Influencing the Development of the Toguz-Bulak Glacial Lake
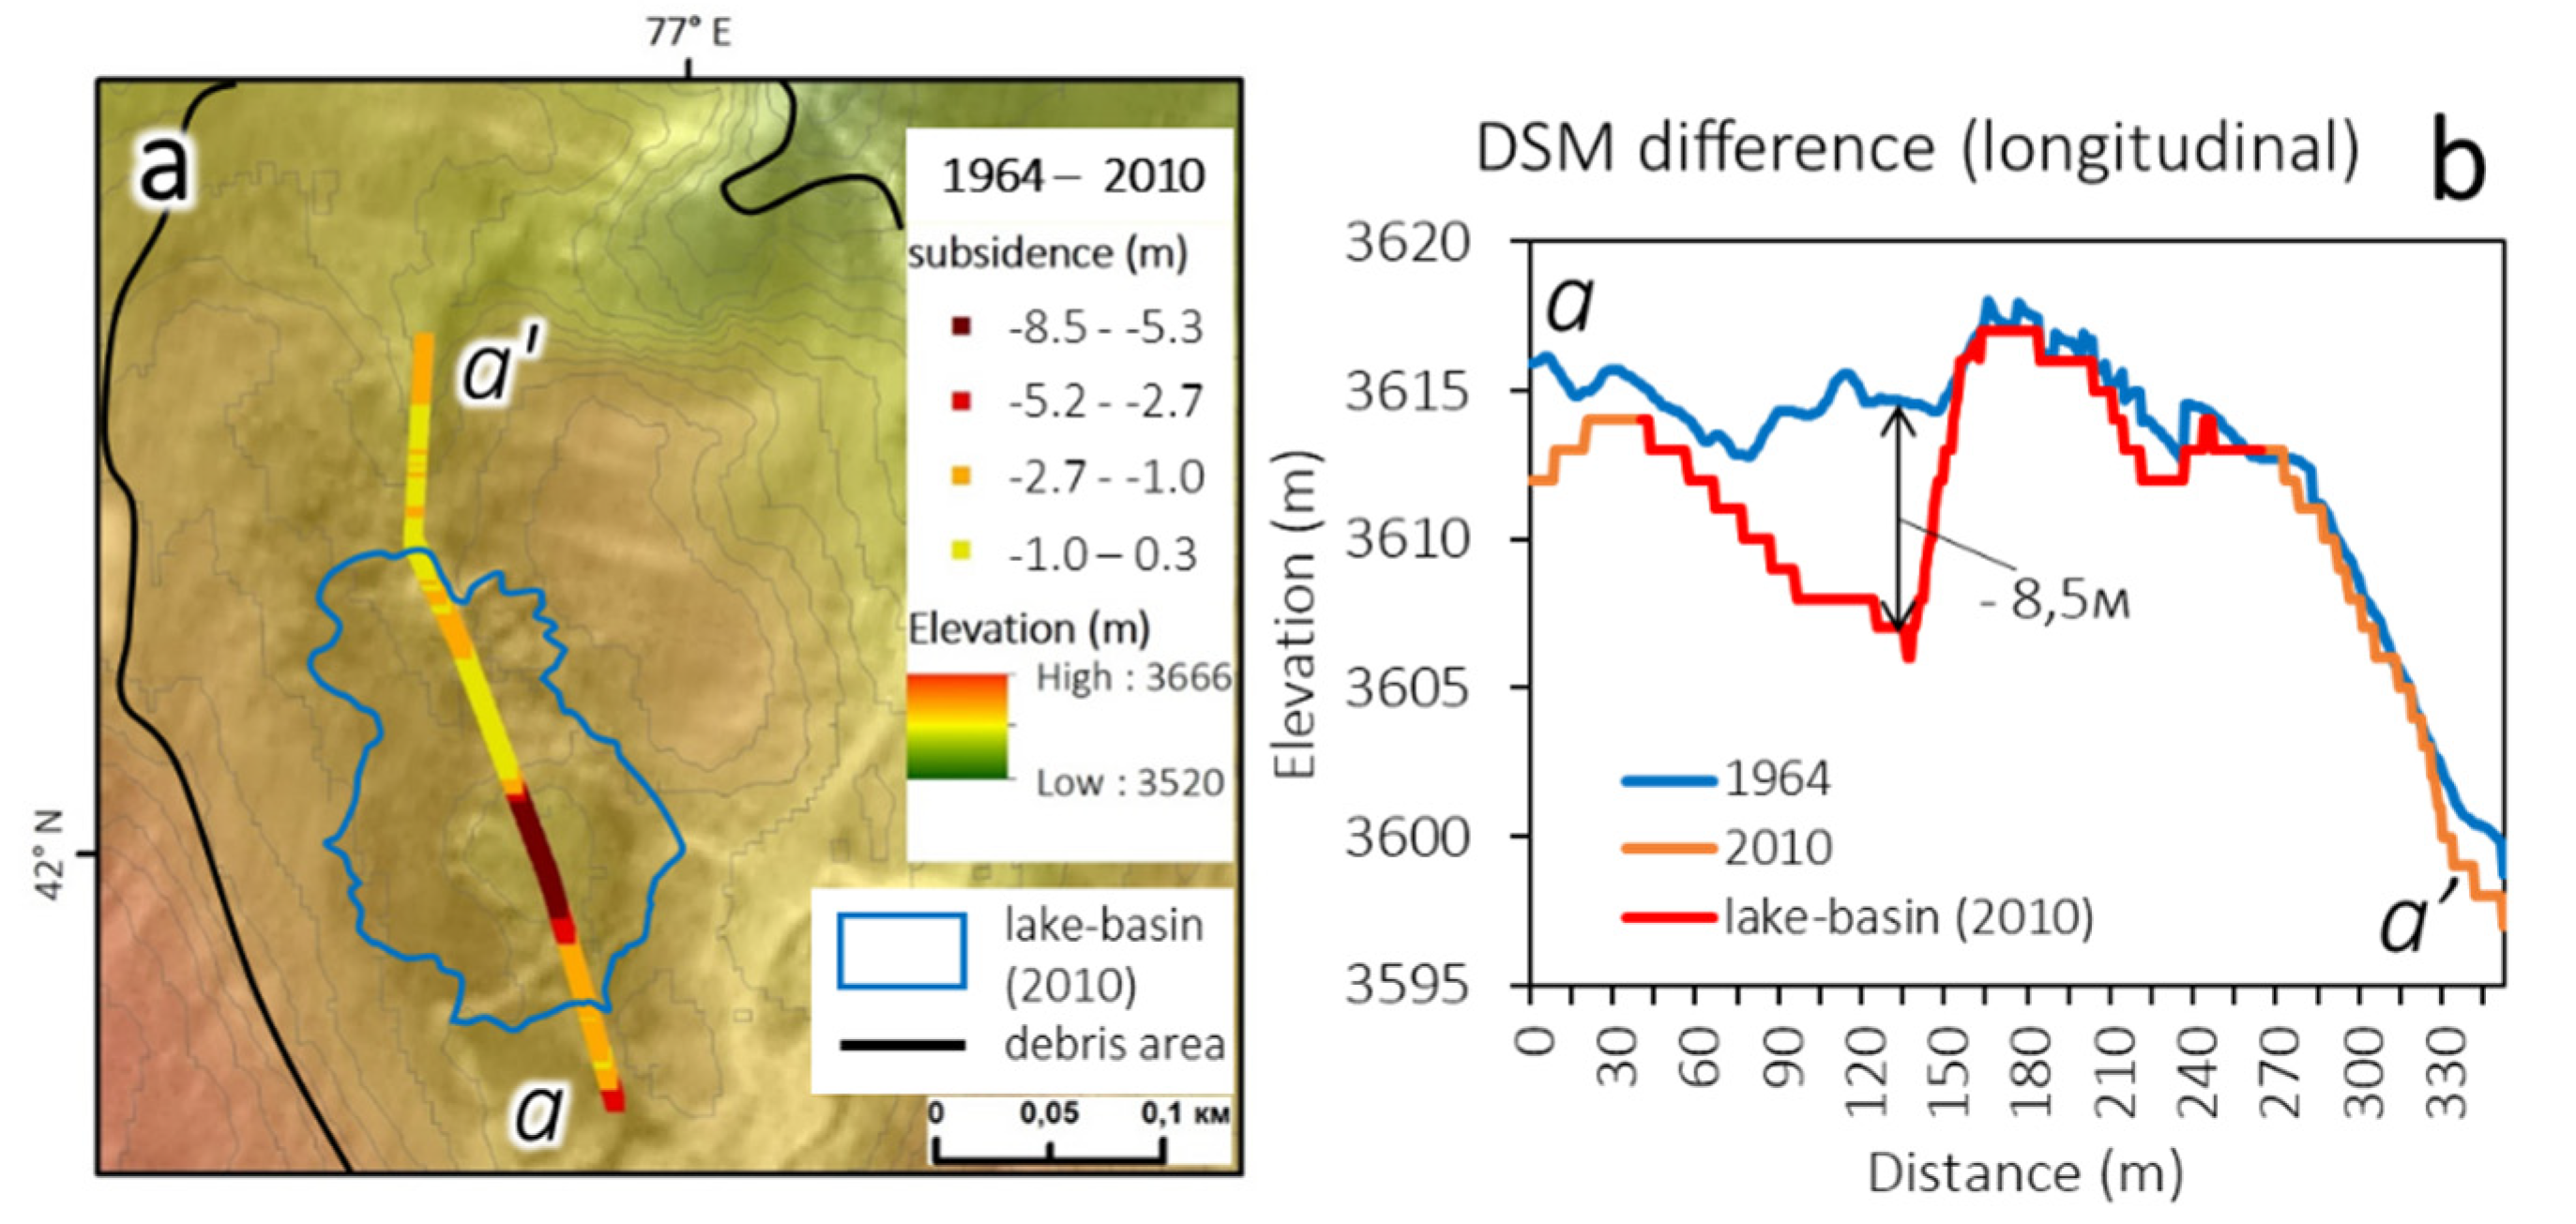
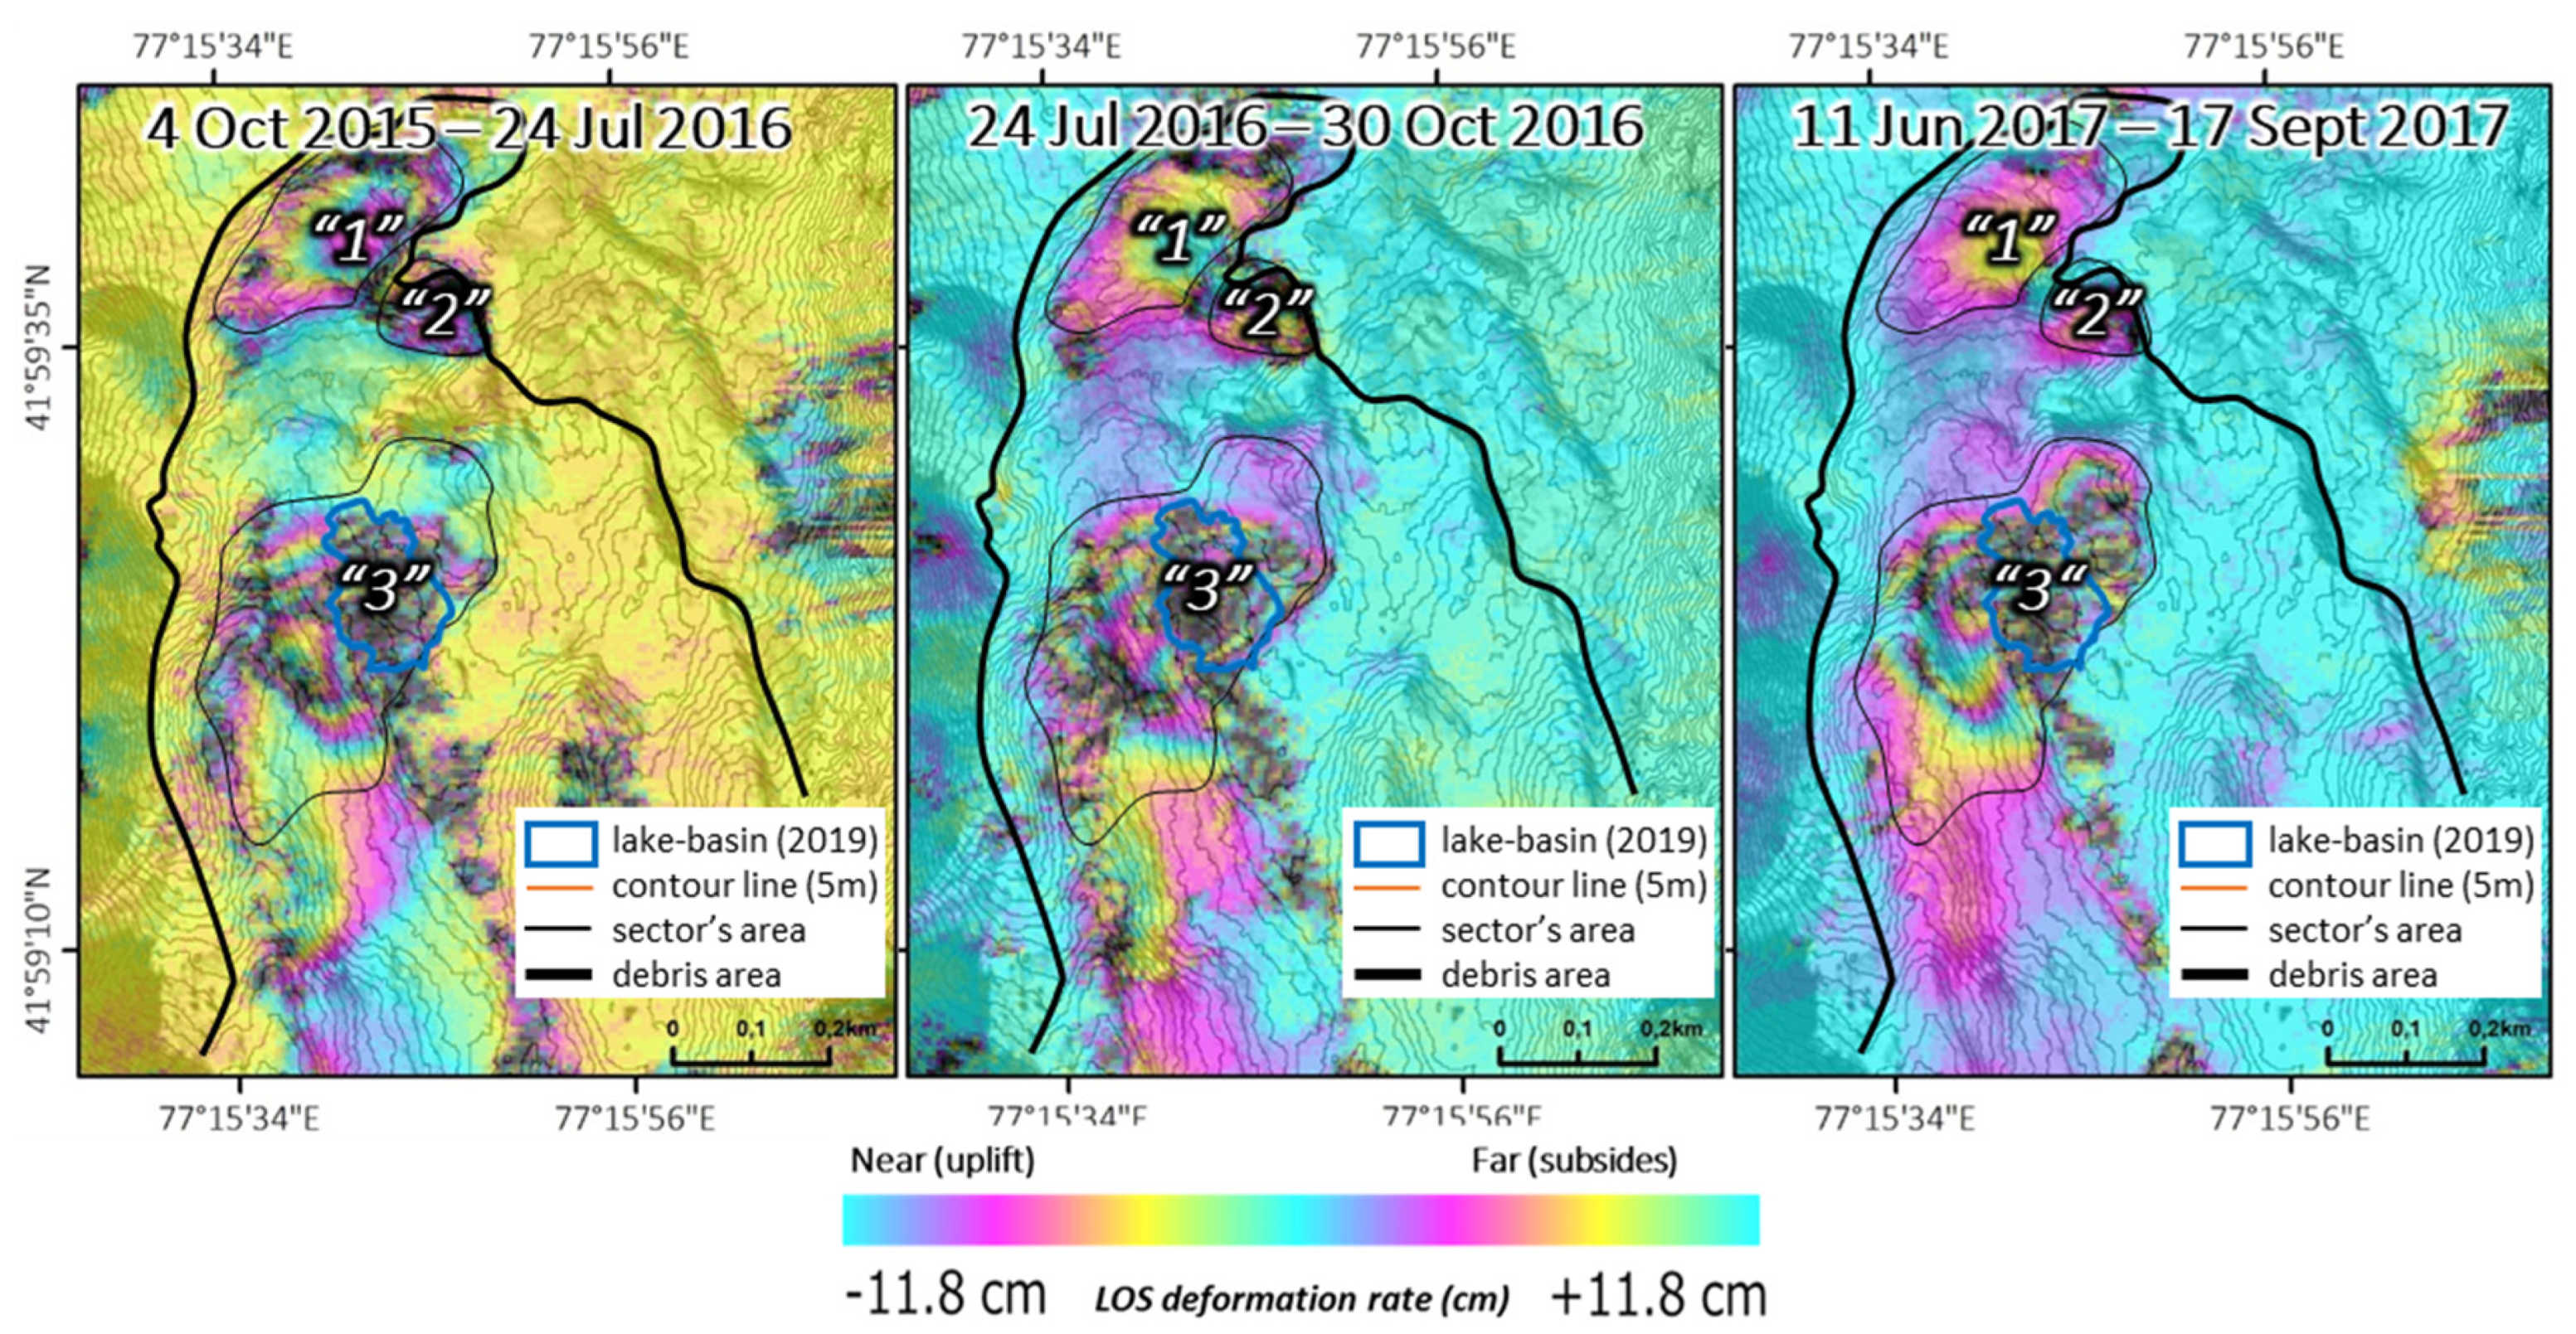
4.5. Surface Changes on the Moraine Complex
5. Discussion
5.1. Lake Development and Outburst on a Moraine Complex
5.2. Two Types of Water Storage and Drainage Systems on a Moraine Complex
6. Conclusions
Author Contributions
Funding
Acknowledgments
Conflicts of Interest
References
- Carrivick, J.L.; Tweed, F.S. A global assessment of the societal impacts of glacier outburst floods. Glob. Planet. Chang. 2016, 144, 1–16. [Google Scholar] [CrossRef]
- Harrison, S.; Kargel, J.S.; Huggel, C.; Reynolds, J.; Shugar, D.H.; Betts, R.A.; Emmer, A.; Glasser, N.; Haritashya, U.K.; Klimeš, J. Climate change and the global pattern of moraine-dammed glacial lake outburst floods. Cryosphere 2017, 12, 1195–1209. [Google Scholar] [CrossRef] [Green Version]
- Hock, R.; Rasul, G.; Adler, C.; Cáceres, B.; Gruber, S.; Hirabayashi, Y.; Jackson, M.; Kääb, A.; Kang, S.; Kutuzov, S. High Mountain Areas. In IPCC Special Report on the Ocean and Cryosphere in a Changing Climate (SROCC); Kaser, G., Mukherji, A., Eds.; IPCC: Geneva, Switzerland, 2019. [Google Scholar]
- Veh, G.; Korup, O.; Walz, A. Hazard from Himalayan Glacier Lake Outburst Floods. Proc. Natl. Acad. Sci. USA 2020, 117, 907–912. [Google Scholar] [CrossRef] [PubMed]
- Bajracharya, S.R.; Shrestha, B.R.; Rajbhandari, L. Glacial lake outburst floods in the Sagarmatha region. Mt. Res. Dev. 2007, 27, 336–344. [Google Scholar] [CrossRef] [Green Version]
- Klimeš, J. Geomorphology and natural hazards of the selected glacial valleys, Cordillera Blanca, Peru. AUC Geogr. 2012, 47, 25–31. [Google Scholar] [CrossRef] [Green Version]
- Hewitt, K.J. Natural dams and outburst floods of the Karakoram Himalaya. In Hydrological Aspects of Alpine and High Mountain Areas (Proceedings of the Exeter Symposium, July 1982); IAHS Publ. 138; International Association of Hydrological Sciences (IAHS): Great Yarmouth, UK, 1982; pp. 259–269. [Google Scholar]
- Reynolds, J.M. High–altitude glacial lake hazard assessment and mitigation: A Himalayan perspective. In Geohazards in Engineering Geology; Maund, J.G., Eddleston, M., Eds.; Engineering Geology Special Publication No. 15; Geological Society: London, UK, 1998; pp. 25–34. [Google Scholar] [CrossRef]
- Costa, J.E.; Schuster, R.L. The formation and failure of natural dams. Geol. Soc. Am. Bull. 1988, 100, 1054–1068. [Google Scholar] [CrossRef]
- Emmer, A.; Cochachin, A. The causes and mechanisms of moraine-dammed lake failures in the Cordillera Blanca, North American Cordillera, and Himalaya. Acta Univ. Carol. Geogr. 2013, 48, 5–15. [Google Scholar] [CrossRef] [Green Version]
- Shreshta, B.B. Glacial Lake Outburst due to Moraine Dam Failure by Seepage and Overtopping with Impact of Climate Change; Annuals of Disaster Prevention Research Institute, Kyoto University: Kyoto, Japan, 2010; Volume 53B. [Google Scholar]
- Richardson, S.D.; Reynolds, J.M. An overview of glacial hazards in the Himalayas. Quat. Int. 2000, 65, 31–47. [Google Scholar] [CrossRef]
- Neupane, R.; Chen, H.; Cao, C. Review of moraine dam failure mechanism. Geomat. Nat. Hazards Risk 2019, 10, 1948–1966. [Google Scholar] [CrossRef] [Green Version]
- Evans, S.G.; Clague, J.J. Recent climatic change and catastrophic geomorphic processes in mountain environments. Geo Nat. Haz. 1994, 10, 107–128. [Google Scholar] [CrossRef]
- Clague, J.J.; Evans, S.G. A review of catastrophic drainage of moraine-dammed lakes in British Columbia. Quater Sci. Rev. 2000, 19, 1763–1783. (In English) [Google Scholar] [CrossRef]
- Iribarren Anacona, P.; Norton, K.P.; Mackintosh, A. Moraine-dammed lake failures in Patagonia and assessment of outburst susceptibility in the Baker Basin. Nat. Hazards Earth Syst. Sci. 2014, 14, 3243–3259. [Google Scholar] [CrossRef] [Green Version]
- Watanabe, T.; Lamsal, D.; Ives, J.D. Evaluating the growth characteristics of a glacial lake and its degree of danger of outburst flooding: Imja Glacier, Khumbu Himal, Nepal. Norsk Geogr. Tidsskr. 2009, 63, 255–267. [Google Scholar] [CrossRef]
- Emmer, A.; Vilímek, V. New method for assessing the susceptibility of glacial lakes to the outburst floods in the Cordillera Blanca, Peru. Hydrol. Earth Syst. Sci. 2014, 18, 3461–3479. [Google Scholar] [CrossRef] [Green Version]
- Prakash, C.; Nagarajan, R. Outburst susceptibility assessment of moraine-dammed lakes in Western Himalaya using an Analytic Hierarchy Process. Earth Surface Process. Landf. 2017, 42. [Google Scholar] [CrossRef]
- Richardson, S.D.; Reynolds, J.M. Degradation of ice-cored moraine dams: Implications for hazard development. In Debris Covered Glaciers; IAHS Punbl.no. 264; International Association of Hydrological Sciences (IAHS): Washington, DC, USA, 2000; pp. 187–197. [Google Scholar]
- Worni, R.; Stoffel, M.; Huggel, C.; Volz, C.; Luckman, B. Analysis and dynamic modeling of a moraine failure and glacier lake outburst flood at Ventisquero Negro, Patagonian Andes (Argentina). J. Hydrol. 2012, 444, 134–145. [Google Scholar] [CrossRef]
- Narama, C.; Duishonakunov, M.; Kääb, A.; Daiyrov, M.; Abdrakhmatov, K. The 24 July 2008 outburst flood at the western Zyndan glacier lake and recent regional changes in glacier lakes of the TeskeyAla-Too range, Tien Shan, Kyrgyzstan. Nat. Hazards Earth Syst. Sci. 2010, 10, 647–659. [Google Scholar] [CrossRef]
- Narama, C.; Daiyrov, M.; Duishonakunov, M.; Tadono, T.; Hayato, S.; Kääb, A.; Ukita, J.; Abdrakhmatov, K. Large drainage from short-lived glacial lakes in the Teskey Range, Tien Shan Mountains, Central Asia. Nat. Hazards Earth Syst. Sci. 2018, 18. [Google Scholar] [CrossRef] [Green Version]
- Erokhin, S.A.; Zaginaev, V.V.; Meleshko, A.A.; Ruiz-Villanueva, V.; Petrakov, D.; Chernomorets, S.S.; Viskhadzhieva, S.K.; Tutubalina, O.; Stoffel, M. Debris flows triggered from non-stationary glacier lake outbursts: The case of the Teztor Lake complex (Northern Tian Shan, Kyrgyzstan). Landslides 2017, 15, 83–98. [Google Scholar] [CrossRef]
- Daiyrov, M.; Narama, C.; Yamanokuchi, T.; Tadono, T.; Kääb, A.; Ukita, J. Regional geomorphological conditions related to recent changes of glacial lakes in the Issyk-Kul basin, northern Tien Shan. Geosciences 2018, 8, 99. [Google Scholar] [CrossRef] [Green Version]
- Shatravin, V.I. The origin and structure of glacial lakes in Kyrgyz USSR and the mechanism of their outburst. Kazakh Scientific Research Hydrometeorological Institute. Mudflows 1984, 8, 77–83. [Google Scholar]
- Narama, C.; Severskiy, I.; Yegorov, A. Current state of glacier changes, glacial lakes, and outburst floods in the Ile Ala-Tau and Kungöy Ala-Too ranges, northern Tien Shan Mountains. Ann. Hokkaido Geogr. 2009, 84, 22–32. [Google Scholar] [CrossRef] [Green Version]
- UNEP. Global Outlook for Ice and Snow; UNEP: Nairobi, Kenya, 2007. [Google Scholar]
- Erokhin, S. Data Report of Glacial Lakes in 2000–2008. In Inventory of Glacial Lakes; Ministry of Emergency Situations of the Kyrgyz Republic: Bishkek, Kyrgyzstan, 2008. (In Russian) [Google Scholar]
- Janský, B.; Šobr, M.; Engel, Z. Outburst flood hazard: Case studies from the Tien-Shan Mountains, Kyrgyzstan. Limnol-Ecol. Manag. Inland Waters 2010, 40, 358–364. [Google Scholar] [CrossRef] [Green Version]
- Geological Map of the Kyrgyz SSR of 1:500,000 Scale; Academy of Sciences of the Kyrgyz SSR: Bishkek, Kyrgyzstan, 1987; pp. 38–39.
- Narama, C.; Shimamura, Y.; Nakayama, D.; Abdrakhmatov, K. Recent changes of glacier coverage in the western Terskey-Alatoo Range, Kyrgyz Republic, using Corona and Landsat. Ann. Glaciol. 2006, 43, 223–229. [Google Scholar] [CrossRef] [Green Version]
- Kääb, A.; Huggel, C.; Fischer, L.; Guex, S.; Paul, F.; Roer, I.; Salzmann, N.; Schlaefli, S.; Schmutz, K.; Schneider, D.; et al. Remote sensing of glacier- and permafrost related hazards in high mountains: An overview. Nat. Hazards Earth Syst. Sci. 2005, 5, 527–554. [Google Scholar] [CrossRef]
- Narama, C.; Kääb, A.; Duishonakunov, M.; Abdrakhmatov, K. Spatial variability of recent glacier area changes in the Tien Shan Mountains, Central Asia, using Corona (-1970), Landsat (-2000), and ALOS (-2007) satellite data. Glob. Planet Chang. 2010, 71, 42–54. [Google Scholar] [CrossRef]
- Narama, C.; Daiyrov, M.; Tadono, T.; Yamamoto, M.; Kääb, A.; Morita, R.; Ukita, J. Seasonal drainage of supraglacial lakes on debris-covered glaciers in the Tien Shan Mountains, Central Asia. Geomorphology 2017, 286, 133–142. [Google Scholar] [CrossRef] [Green Version]
- Chen, X.; Lu, J.; Cai, X.; Li, H.; Yin, S. Geomatics-based method research on capacity calculation of quake lake. Int. J. Remote Sens. 2008, 12, 885–892. [Google Scholar]
- Fujita, K.; Suzuki, R.; Nuimura, T.; Sakai, A. Performance of ASTER and SRTM DEMs, and their potential for assessing glacial lakes in the Lunana region, Bhutan Himalaya. J. Glaciol. 2008, 54, 220–228. [Google Scholar] [CrossRef] [Green Version]
- Tadono, T.; Shimada, M.; Murakami, H.; Takaku, J. Calibration of PRISM and AVNIR-2 onboard ALOS “Daichi”. IEEE Trans. Geosci. Remote Sens. 2009, 47, 4042–4050. [Google Scholar] [CrossRef]
- Shimada, M.; Tadono, T.; Rosenqvist, A. Advanced Land Observing Satellite (ALOS) and monitoring global environmental change. Proc. IEEE 2010, 98, 780–799. [Google Scholar] [CrossRef]
- Popov, N. Assessment of glacial debris flow hazard in the north Tien-Shan. In Proceedings of the Soviet-China-Japan Symposium and Field Workshop on Natural Disasters, Alma-Ata City, Kazakhstan, 2–17 September 1991; pp. 384–391. [Google Scholar]
- Haeberli, W. Frequency and characteristics of glacier floods in the Swiss Alps. Ann. Glaciol. 1983, 4, 85–90. [Google Scholar] [CrossRef] [Green Version]
- Huggel, C.; Kääb, A.; Haeberli, W.; Teysseire, P.; Paul, F. Remote sensing based assessment of hazards from glacier lake outbursts: A case study in the Swiss Alps. Can. Geotech. J. 2002, 39, 316–330. [Google Scholar] [CrossRef] [Green Version]
- Takaku, J.; Tadono, T. PRISM on-orbit geometric calibration and DEM performance. IEEE Trans. Geosci. Remote Sens. 2009, 47, 4060–4073. [Google Scholar] [CrossRef]
- Tadono, T.; Kawamoto, S.; Narama, C.; Yamanokuchi, T.; Ukita, J.; Tomiyama, N.; Yabuki, H. Development and validation of new glacial lake inventory in the Bhutan Himalayas using ALOS ‘DAICHI’. Glob. Environ. Res. 2012, 16, 31–40. [Google Scholar]
- Sandwell, D.T.; Myer, D.; Mellors, R.; Shimada, M.; Brooks, B.; Foster, J. Accuracy and Resolution of ALOS Interferometry: Vector Deformation Maps of the Father’s Day Intrusion at Kilauea. IEEE Trans. Geosci. Remote Sens. 2008, 11, 3524–3534. [Google Scholar] [CrossRef] [Green Version]
- Barboux, C.; Delaloye, R.; Lambiel, C. Inventorying of slope movements in Alpine environment using DInSAR. Earth Surface Process. Landf. 2014, 39, 15. [Google Scholar] [CrossRef] [Green Version]
- Natsuaki, R.; Nagai, H.; Motohka, T.; Ohki, M.; Watanabe, M.; Thapa, R.B.; Tadono, T.; Shimada, M.; Suzuki, S. SAR interferometry using ALOS-2 PALSAR-2data for the Mw 7.8 Gorkha, Nepal earthquake. Earth Planets Space 2016, 68, 15. [Google Scholar] [CrossRef] [Green Version]
- Goldstein, R.M.; Werner, C.L. Radar Ice Motion Interferometry. In Proceedings of the 3rd ERS ESA Symposium, ESA SP, Florence, Italy, 14–21 March 1997; pp. 969–972. [Google Scholar]
- Werner, C.; Wegmüller, U.; Strozzi, T.; Wiesmann, A. Gamma SAR and Interferometric Processing Software. In Proceedings of the ERS-ENVISAT Symposium, Gothenburg, Sweden, 16–20 October 2000. [Google Scholar]
- Quincey, D.J.; Richardson, S.D.; Luckman, A.; Lucas, R.M.; Reynolds, J.M.; Hambrey, M.J.; Glasser, N.F. Early recognition of glacial lake hazards in the Himalaya using remote sensing datasets. Glob. Planet. Chang. 2007, 56, 137–152. [Google Scholar] [CrossRef]
- Barboux, C.; Delaloye, R.; Strozzi, T.; Lambiel, C.; Collet, C. TSX DInSAR data for detecting and monitoring slope motion phenomena in an Alpine periglacial environment at different resolution scales (Western Swiss Alps, Switzerland). In Proceedings of the TerraSAR-X Science Team Meeting, DLR Oberpfaffenhofen, Weßling, Germany, 10–12 June 2013. [Google Scholar]
- Obu, J.; Westermann, S.; Bartsch, A.; Berdnikov, N.; Christiansen, H.H.; Dashtseren, A.; Delaloye, R.; Elberling, B.; Etzelmuller, B.; Kholodov, A.; et al. Northern Hemisphere permafrost map based on TTOP modelling for 2000–2016 at 1 km(2) scale. Earth-Sci. Rev. 2019, 193, 299–316. [Google Scholar] [CrossRef]
- Lliboutry, L.; Morales, B.A.; Pautre, A.; Schneider, B. Glaciological problems set by the control of dangerous lakes in Cordillera Blanca, Peru. I. Historical failures of moranic dams, their causes and prevention. J. Glaciol. 1977, 18, 239–254. [Google Scholar] [CrossRef] [Green Version]
- Yamada, T. Glacier Lake and Its Outburst Flood in the Nepal Himalaya; Monograph No. 1; Data Center for Glacier Research, Japanese Society of Snow and Ice: Tokyo, Japan, 1998; pp. 1–96. [Google Scholar]
- Fukui, K.; Fujii, Y.; Ageta, Y.; Asahi, K. Changes in the lower limit of mountain permafrost between 1973 and 2004 in the Khumbu Himal, the Nepal Himalayas. Glob. Planet. Chang. 2007, 55, 251–256. [Google Scholar] [CrossRef]
- Bolch, T.; Peters, J.; Yegorov, A.; Pradhan, B.; Buchroithner, M.; Blagoveshchensky, V. Identification of potentially dangerous glacial lakes in the northern Tien Shan. Nat. Hazards 2011, 59, 1691–1714. [Google Scholar] [CrossRef] [Green Version]
- Kropáček, J.; Neckel, N.; Tyrna, B.; Holzer, N.; Hovden, A.; Gourmelen, N.; Schneider, C.; Buchroithner, M.; Hochschild, V. Repeated glacial lake outburst flood threatening the oldest Buddhist monastery in north-western Nepal. Nat. Hazards Earth Syst. Sci. 2015, 15, 2425–2437. [Google Scholar] [CrossRef] [Green Version]
- Worni, R.; Huggel, C.; Stoffel, M.; Pulgarín, B. Challenges of modeling current very large lahars at Nevado del Huila Volcano, Colombia. Bull. Volcanol. 2012, 74, 309–324. [Google Scholar] [CrossRef]
- Benn, D.I.; Thompson, S.; Gulley, J.; Mertes, J.; Luckman, A.; Nicholson, L. Structure and evolution of the drainage system of a Himalayan debris-covered glacier, and its relationship with patterns of mass loss. Cryosphere Discuss. 2017, 1–43. [Google Scholar] [CrossRef] [Green Version]
- Narama, C.; Daiyrov, M.; Kazehare, S.; Yamamoto, M.; Tadono, T. Glacier Lake Inventory of the Northern Tien Shan–Kyrgyz, Kungoy, and Teskey Ala-Too Ranges; Report of Mountain Research Group of Niigata University; Niigata Printing: Niigata, Japan, 2015. [Google Scholar]


| Satellite | Date | Resolution (m) | Satellite | Date | Resolution (m) |
|---|---|---|---|---|---|
| Corona KH-4A | 6.10.1964 | 2.7 | Sentinel-2 | 9.8.2016 | 10 |
| Landsat-5 TM | 11.6.2010 | 30 | Sentinel-2 | 18.9.2016 | 10 |
| Landsat-5 TM | 13.7.2010 | 30 | Sentinel-2 | 8.10.2016 | 10 |
| Landsat-5 TM | 16.7.2011 | 30 | ALOS-2 | 30.10.2016 | 9.1 m × 5.3 m |
| ALOS/PRISM | 10.8.2010 | 2.5 | Google Earth-Pro | 8.6.2017 | 0.5 |
| ALOS/PRISM DSM | 10.8.2010 | 2.5 | ALOS-2 | 11.6.2017 | 9.1 m × 5.3 m |
| Landsat-7 ETM+/SLC-off | 13.8.2010 | 30 | Sentinel-2 | 12.6.2017 | 10 |
| Landsat-7 ETM+/SLC-off | 22.8.2010 | 30 | Landsat-8/OLI | 30.6.2017 | 15 (pan) |
| Landsat-7 ETM+/SLC-off | 6.6.2011 | 30 | Sentinel-2 | 7.7.2017 | 10 |
| Landsat-7 ETM+/SLC-off | 24.7.2011 | 30 | Sentinel-2 | 22.7.2017 | 10 |
| Landsat-7 ETM+/SLC-off | 26.8.2011 | 30 | Sentinel-2 | 27.7.2017 | 10 |
| Landsat-7 ETM+/SLC-off | 8.6.2012 | 30 | Sentinel-2 | 9.8.2017 | 10 |
| Landsat-7 ETM+/SLC-off | 10.7.2012 | 30 | Sentinel-2 | 31.8.2017 | 10 |
| Landsat-7 ETM+/SLC-off | 11.8.2012 | 30 | Landsat-8/OLI | 2.9.2017 | 15 (pan) |
| Landsat-7 ETM+/SLC-off | 27.8.2012 | 30 | ALOS-2 | 17.9.2017 | 9.1 m × 5.3 m |
| Landsat-7 ETM+/SLC-off | 28.9.2012 | 30 | Sentinel-2 | 20.9.2017 | 10 |
| Landsat-8/OLI | 19.6.2013 | 15 (pan) | Sentinel-2 | 10.10.2017 | 10 |
| Landsat-8/OLI | 5.7.2013 | 15 (pan) | Sentinel-2 | 10.6.2018 | 10 |
| Landsat-7 ETM+/SLC-off | 29.7.2013 | 30 | Sentinel-2 | 27.6.2018 | 10 |
| Landsat-8/OLI | 6.8.2013 | 15 (pan) | Sentinel-2 | 25.7.2018 | 10 |
| Landsat-8/OLI | 7.9.2013 | 15 (pan) | Sentinel-2 | 16.8.2018 | 10 |
| Google Earth-Pro | 11.9.2013 | 0.5 | Sentinel-2 | 5.9.2018 | 10 |
| Landsat-7 ETM+/SLC-off | 14.6.2014 | 30 | Sentinel-2 | 13.9.2018 | 10 |
| Landsat-7 ETM+/SLC-off | 16.7.2014 | 15 (pan) | Sentinel-2 | 5.7.2019 | 10 |
| Landsat-8/OLI | 25.8.2014 | 15 (pan) | Sentinel-2 | 10.7.2019 | 10 |
| Landsat-8/OLI | 10.9.2014 | 15 (pan) | Sentinel-2 | 12.7.2019 | 10 |
| Landsat-7 ETM+/SLC-off | 18.9.2014 | 15 (pan) | Sentinel-2 | 15.7.2019 | 10 |
| Landsat-8/OLI | 18.9.2014 | 15 (pan) | Sentinel-2 | 27.7.2019 | 10 |
| Landsat-7 ETM+/SLC-off | 17.6.2015 | 15 (pan) | Sentinel-2 | 30.7.2019 | 10 |
| Landsat-8/OLI | 11.7.2015 | 15 (pan) | Sentinel-2 | 1.8.2019 | 10 |
| Landsat-8/OLI | 12.8.2015 | 15 (pan) | Sentinel-2 | 6.8.2019 | 10 |
| Landsat-7 ETM+/SLC-off | 20.8.2015 | 15 (pan) | Landsat-8/OLI | 7.8.2019 | 15 (pan) |
| Landsat-8/OLI | 29.9.2015 | 15 (pan) | Planet Scope | 8.8.2019 | 3 |
| ALOS-2 | 4.10.2015 | 9.1 m × 5.3 m | Sentinel-2 | 11.8.2019 | 10 |
| Landsat-8/OLI | 11.6.2016 | 15 (pan) | Planet Scope | 30.8.2019 | 3 |
| Sentinel-2 | 30.6.2016 | 10 | Sentinel-2 | 3.9.2019 | 10 |
| ALOS-2 | 24.7.2016 | 9.1 m × 5.3 m | Google Earth-Pro | 1.11.2019 | 0.5 |
Publisher’s Note: MDPI stays neutral with regard to jurisdictional claims in published maps and institutional affiliations. |
© 2020 by the authors. Licensee MDPI, Basel, Switzerland. This article is an open access article distributed under the terms and conditions of the Creative Commons Attribution (CC BY) license (http://creativecommons.org/licenses/by/4.0/).
Share and Cite
Daiyrov, M.; Narama, C.; Kääb, A.; Tadono, T. Formation and Outburst of the Toguz-Bulak Glacial Lake in the Northern Teskey Range, Tien Shan, Kyrgyzstan. Geosciences 2020, 10, 468. https://0-doi-org.brum.beds.ac.uk/10.3390/geosciences10110468
Daiyrov M, Narama C, Kääb A, Tadono T. Formation and Outburst of the Toguz-Bulak Glacial Lake in the Northern Teskey Range, Tien Shan, Kyrgyzstan. Geosciences. 2020; 10(11):468. https://0-doi-org.brum.beds.ac.uk/10.3390/geosciences10110468
Chicago/Turabian StyleDaiyrov, Mirlan, Chiyuki Narama, Andreas Kääb, and Takeo Tadono. 2020. "Formation and Outburst of the Toguz-Bulak Glacial Lake in the Northern Teskey Range, Tien Shan, Kyrgyzstan" Geosciences 10, no. 11: 468. https://0-doi-org.brum.beds.ac.uk/10.3390/geosciences10110468