Effects of Earthquakes on Flood Hazards: A Case Study From Christchurch, New Zealand


School of Earth Sciences, University of Melbourne, Parkville 3010, Australia
*
Author to whom correspondence should be addressed.
Geosciences 2020, 10(3), 114; https://0-doi-org.brum.beds.ac.uk/10.3390/geosciences10030114
Submission received: 25 February 2020
/
Revised: 19 March 2020
/
Accepted: 20 March 2020
/
Published: 23 March 2020
(This article belongs to the Special Issue Scientific Assessment of Recent Natural Hazard Events)
Abstract
:Earthquakes can influence flood hazards by altering the flux, volumes, and distributions of surface and/or subsurface waters and causing physical changes to natural and engineered environments (e.g., elevation, topographic relief, permeability) that affect surface and subsurface hydrologic regimes. This paper analyzes how earthquakes increased flood hazards in Christchurch, New Zealand, using empirical observations and seismological data. Between 4 September 2010 and 4 December 2017, this region hosted one moment magnitude (Mw) 7.1 earthquake, 3 earthquakes with Mw ≥ 6, and 31 earthquakes with local magnitude (ML) ≥ 5. Flooding related to liquefaction-induced groundwater pore-water fluid pressure perturbations and groundwater expulsion occurred in at least six earthquakes. Flooding related to shaking-induced ground deformations (e.g., subsidence) occurred in at least four earthquakes. Flooding related to tectonic deformations of the land surface (fault surface rupture and/or folding) occurred in at least two earthquakes. At least eight earthquakes caused damage to surface (e.g., buildings, bridges, roads) and subsurface (e.g., pipelines) infrastructure in areas of liquefaction and/or flooding. Severe liquefaction and associated groundwater-expulsion flooding in vulnerable sediments occurred at peak ground accelerations as low as 0.15 to 0.18 g (proportion of gravity). Expected return times of liquefaction-induced flooding in vulnerable sediments were estimated to be 100 to 500 years using the Christchurch seismic hazard curve, which is consistent with emerging evidence from paleo-liquefaction studies. Liquefaction-induced subsidence of 100 to 250 mm was estimated for 100-year peak ground acceleration return periods in parts of Christchurch.
1. Introduction
Earthquakes can impart major influences on surface and subsurface hydrologic regimes over a variety of spatial (i.e., 0 km to more than 1000 km from the epicenter, from single sites to total areas exceeding 1000 km2) and temporal scales (i.e, transient to permanent effects generated immediately during the earthquake or accumulated over millions of years, e.g., mountain building, drainage divide migration, aquifer partitioning) [1,2,3,4] (Table 1). These include tsunamis, earthquake-induced water waves, landslides into water bodies, landslide dam outburst floods, river avulsions, liquefaction-associated ground deformations and fluid expulsions, surface subsidence, surface uplift, lateral spreading, changes to cross-sectional and longitudinal stream profiles, redistribution of surface materials (e.g., in coastal and alluvial environments), changes in stream flows and water levels in groundwater and wells (via transient and permanent deformations and permeability changes to surficial and subsurface materials and aquifers), and fracturing and deformation of engineered surface and subsurface infrastructure (e.g., levees, storm drains, pipes). Vice versa, natural and anthropogenically-influenced hydrologic regimes can impart major influences on the timing, locations, rates, and magnitudes of earthquakes [5,6,7,8,9,10] (Table 2).
Table 1 and Table 2 are not exhaustive lists but provide selected examples of the many ways in which earthquakes can influence the flux, volume, and distribution of surface and subsurface waters (Table 1) and how water influences earthquakes (Table 2). The processes described in Table 1 can be immediate or delayed and can be generally classified as (i) processes that directly alter the volume and/or flux of surface and/or subsurface waters, or (ii) processes that induce permanent and/or transient physical changes to natural and engineered environments (e.g., elevation, topographic relief, permeability) that subsequently affect surface and subsurface hydrologic regimes. Significant hydrologic effects can include surface flooding during or immediately after the earthquake [11,12,13] and changes to the surface and subsurface that subsequently influence flood hazards, including floods of meteorological origin [14]. Table 2 includes processes that influence pore-fluid pressures and permeability in and proximal to fault zones and/or those that perturb stress states in rock volumes surrounding faults, primarily through mass redistributions.
Within this context, this paper synthesizes observations of liquefaction (also known as soil liquefaction, the process whereby saturated, unconsolidated sediment temporarily loses shear strength and deforms in a fluid-like manner when subjected to seismic loading or other phenomena) and flooding in Christchurch during and after the 2010 to 2012 Canterbury earthquake sequence (CES) [15] and compares them to quantitative measurements of ground surface deformation and seismic data. Many of the phenomena in Table 1 were directly observed during the CES (e.g., landslides that partially diverted rivers, partial river avulsions, liquefaction, anomalous waves in harbors, large localized waves caused by cliff collapses in water bodies, spring temperature and discharge variations, and transient and permanent groundwater table changes) [15]. None of the processes described in Table 2 have been invoked as potential contributors to the CES seismicity to date.
The overarching purpose of this study was to provide specific examples of how individual and collective earthquakes influenced the urban flood hazard in Christchurch using empirical observations and data. We also estimated the expected return times of liquefaction-inducing ground motions that could induce flooding in Christchurch for the next 500 years. The superposition of this hazard with other hazards, such as sea-level rise [16], highlights the importance of implementing engineering and land-use practices aimed at reducing exposure and vulnerability to flood hazards in Canterbury [17] and analogous settings globally.
2. Overview of the 2010–2011 Canterbury Earthquake Sequence
2.1. Seismologic Characteristics
The evolution of the 2010–2011 Canterbury earthquake sequence (CES) and associated ground motion and environmental effects are described by Bannister and Gledhill [86], Bradley et al. [87], and Quigley et al. [15], respectively. The CES initiated with the complex multi-fault Mw 7.1 Darfield earthquake with an epicenter ≈38 km west of the Christchurch central business district (epicentral location from https://quakesearch.geonet.org.nz/) (Figure 1a). This earthquake ruptured at least seven geometrically-distinct faults [88] and generated an approximately 30 km surface rupture [89] spanning three source faults (Figure 1a). Early aftershocks (i.e., within 1 month of the Darfield earthquake) included 11 ML ≥ 5 earthquakes and spanned a 70 km (E–W) by 40 km (N–S) area encompassing the city of Christchurch (Figure 1a). The aftershock rate decreased following the Darfield earthquake in accordance with Omori’s Law [90] but was reinvigorated by the fatal 22 February Mw 6.2 Christchurch earthquake (Figure 1b; Figure 2) and other large aftershocks (e.g., 13 June 2011 Mw 6.0, 23 December 2011 Mw 5.9, and 14 February 2016 Mw 5.7) (Figure 1, Figure 2 and Figure 3). The 22 February Mw 6.2 also involved a complex rupture, including two to three distinct source faults [88]. The overall spatiotemporal evolution of the CES following the Darfield earthquake involved a general eastward migration of seismicity to beneath the city and offshore, although persistent activity continues in some areas throughout the region (e.g., SW of Christchurch) (Figure 1d). The CES earthquake frequency-magnitude distributions fit Gutenberg–Richter scaling well with b ≈ 1 (Figure 2).
Earthquake shaking throughout the CES was instrumentally recorded by more than 30 strong ground motion instruments in the Canterbury region. Summaries of CES ground motions are provided by Bradley and others [87,91,92,93,94]. More than 50 earthquakes generated peak horizontal ground accelerations (PGA) ≥ 20 cm s−2 in central Christchurch during the CES [95]. Terrestrial areas with PGA ≥ 0.1 g ranged from hundreds to >9000 km2 from individual earthquakes [15]. The spatiotemporal nature of the recurrent seismicity generated multiple episodes of liquefaction [33], subsidence [14], and flooding [15,96], as described below. At least eight distinct earthquakes caused damage to surface (e.g., buildings, bridges, roads) and subsurface (e.g., pipelines) infrastructure in areas of liquefaction and flooding (Figure 3). The wealth of geospatial data acquired prior to and throughout the CES allowed for high-precision measurements of topographic changes due to specific earthquakes to be determined throughout the region, with a particularly high density of geospatial data available for Christchurch. Information on the relationships between liquefaction-associated phenomena, land damage, and damage to the engineered environment is available from peer-reviewed academic literature [14,15,34,97,98,99,100,101,102], Geotechnical Extreme Events Reconnaissance (GEER) reports [96,103,104], and other consultancy reports [105,106,107].
2.2. Ground Deformation
Major CES earthquakes caused (permanent) horizontal and vertical displacements of the land surface that were measured using a variety of techniques, including airborne and terrestrial light detecting and ranging (LiDAR) datasets, interferometric synthetic aperture radar (InSAR) and other satellite-based data (e.g., optical data), continuous and campaign GPS data, total station and real-time kinematic GPS surveys (including cadastral surveys of faulting-affected properties and cross-channel profile surveys of urban streams), and sonar echo sounding beneath water bodies [12,14,88,89,105,108,109]. Faulting-induced surface deformations were caused by ground surface fault ruptures associated with discrete fault scarps, and more distributed ground deformation above faults that did not rupture the surface [12,88,89]. Faulting-induced deformation caused relative vertical surface displacements of several centimeters to greater than 1 meter across low relief rural and urban landscapes. Surface displacements changed stream gradients, floodplain slopes, elevations of the land surface relative to water tables, and surface and subsurface hydrology, causing partial stream avulsion and influencing flood hazards. Seismically-triggered mass movements (e.g., liquefaction, lateral spreading, subsidence, landsliding, rockfalls) also caused significant surface topography changes [14]. Liquefaction processes, including lateral spreading and subsidence, caused the shallowing of stream bottoms, narrowing of stream areas, changes in stream profile gradients, changes in floodplain slopes and elevations, and caused major-to-severe damage to land and infrastructure and increased the flood hazard in Christchurch [14].
2.3. Flooding and Liquefaction
Flooding was observed in rural properties adjacent to the Greendale Fault (Figure 4a) and other rural areas (Figure 4b) immediately following the Darfield earthquake. Flooding was also observed in areas of liquefaction following major earthquakes (Figure 5) and in subsequent large storms (Figure 5e,f). Recurrent liquefaction (Figure 6) lowered ground surface elevations in liquefaction-affected areas by >30 cm to >1 m; the effect of flood plain lowering was observed most profoundly proximal to urban streams, where high tides locally inundated former floodplains (Figure 6d). These observations are discussed in more detail below. Earthquake-induced damage to stormwater pipelines and the consequent impacts on the connectivity and capacity levels of the pipeline stormwater network contributed to an increased flood hazard in Christchurch [110]. Taylor et al. [17] describe general processes that increased the flood vulnerability in Christchurch, including changes in overland flow paths and a reduction of surface hydraulic gradients, narrowing and shallowing of urban streams and a reduction in flood plain elevations, and land settlement that allowed tidal incursions to exert stronger influence on flood hazards.
3. Surface Topography Changes Driven by Faulting During the CES
3.1. Darfield Earthquake
Of the seven fault segments that ruptured during the Mw 7.1 Darfield earthquake, surface rupture was identified on the Greendale Fault West (GFW), Greendale Fault (GF), and Greendale Fault East (GFE) (Figure 7). The traces of these surface-rupturing faults typically consisted of a combination of discrete surface fracturing, and surface folding at broad wavelengths of 101–102 m. Topographic bulges (pop-ups) formed at regular intervals, with surface areal extents from less than 10 to more than 1000 m2 and amplitudes that locally exceeded 1 m; these formed within a strike-slip (lateral displacement) zone that distributed much of the surface deformation 30–300 m into the walls of the fault. Much broader, kilometer-scale areas of uplift and subsidence were revealed using InSAR and GPS data [88] (Figure 7).
The vertical deformation associated with the fault segments depended on their orientation, subsurface geometry, and sense of movement [12,88,111,112,113,114,115]. The NE side of the GFW subsided by >0.8 m, and the SW side was lifted by as much as 0.4 m [12]. The ≈19 km trace of the GF exhibited mainly right lateral displacement with a small component of south-side-up displacement [89]. The central and western segments linked up through a complex zone of deformation that included the second-largest restraining (compressional) stepover (large area, low amplitude pop-up) on the surface trace [12]. The vertical deformation on the GFE was primarily north-side-up compared with the south-side-up vertical displacement elsewhere on the fault.
Much of the vertical deformation was not associated with a discrete surface rupture. Satellite and GPS data, along with field observations, revealed surface folding across tens of square kilometers on the upthrown side of the surface projections of the Charing Cross fault (CCF) and Hororata anticline fault (HAF) (Figure 7) [88]. The HAF thrusted southwards, such that the uplift of the HAF was steep fronted to the southeast of its axis, gently dipping to the northwest of the axis, and terminated northward against the GFW. The CCF thrusted northwestward and terminated at a triple-junction (point connecting three faults at the surface) with the GF and GFW. These three faults bound a pronounced, approximately 1-m deep area of subsidence (Figure 7) on the north side of the surface rupture. A similar, but minor area of ≈0.3 m subsidence south of the GFE was attributed to a release of right-lateral slip on the GF and GFE. Collectively, these observations highlight how different types of faults with different orientations and geometries may create large variations in relative surface elevation changes that, in the vicinity of surface water bodies, can exert strong and variable influences on the steepness and trajectory of water flow paths.
3.2. Christchurch Earthquakes
The series of earthquakes that affected the Christchurch area resulted in a cumulative vertical displacement signature dominated by the approximately 0.45 m of uplift of the Avon-Heathcote Estuary in the hanging wall of a system of blind dextral-reverse oblique faults (Figure 7c). Although liquefaction-related subsidence was locally extreme (see Section 4), tectonic subsidence was limited to less than 0.2 m. Most of the differential displacement was concentrated along a more than 5 km long zone of broad uplift west of the estuary. The hanging wall uplift of the estuary reduced the volume of the tidal prism, namely the body of water that leaves the estuary as the tide ebbs, by approximately 14.6% [116].
3.3. Cumulative Tectonic Vertical Displacements During Major CES Earthquakes
The cumulative vertical tectonic displacements caused by the CES earthquakes were small relative to the total displacements induced by tectonic displacements plus liquefaction effects (Figure 8). Approximately 0.13 ± 0.03 km3 of onshore rock was uplifted, predominantly in the hanging walls of blind thrusts and on the south side of the GF. About 0.05 ± 0.02 km3 of rock subsided, primarily in extensional quadrants of the strike-slip fault system (releasing bends), but also in the footwall of the Christchurch earthquake fault, and on the north side of the central segment of the GF.
4. Surface Topography Changes Driven by Liquefaction During the CES
4.1. Darfield Earthquake
Extensive regional liquefaction occurred during the 4 September 2010 Darfield earthquake [15,33,102,104,106]. Liquefaction manifestation at the ground surface included sand blow formation, lateral spreading, surface subsidence, and flooding. Liquefaction-induced land damage affected ≈10,000 residential properties and was generally confined to specific low-elevation (<5 m above sea level) suburbs with shallow (less than 1–2 m depth) groundwater tables [117] and thick (more than 2 m) near-surface layers of loose to medium density silt-to-fine sand sediments. Liquefaction-triggering (threshold) PGAs in areas of significant land damage were >0.15–0.17 g [15]. Surface subsidence ranged from less than 10 cm to more than 30 cm in areas of surface manifestations of liquefaction. Surface subsidence was caused by post-liquefaction volumetric densification, redistribution of liquefaction ejecta, including by anthropogenic removal (Figure 8) [97,118] and lateral spreading [119] (Figure 9). Liquefaction caused 74% of central and eastern Christchurch to subside; 60% of this area subsided by less than 0.2 m (Figure 8). The most severe land damage occurred proximal to urban rivers, estuaries, and areas underlain by former river channels [120]. These areas were comprised of highly liquefiable sediments that were able to spread laterally due to topographical variations and a lack of lateral confinement (i.e., free faces like unsupported stream banks). Lateral-spreading caused permanent ground displacements that locally exceeded 2–3 m in the areas of severe land damage (Figure 9). Horizontal ground displacements typically reduced exponentially with increasing distance from the most proximal free face, but in some cases, a block-mode mechanism of failure was exhibited, with large displacements incurring at distances >100 m from adjacent free faces (Figure 9a) [121]. The lateral spreading of sediments toward streams reduced channel widths and caused the shallowing of channel bottoms (Figure 10). Liquefaction-induced subsidence reduced flood plain elevations. Overland transport of liquefaction ejecta into streams caused increased streambed sedimentation and stream shallowing. These effects were all compounded by further CES events.
4.2. Christchurch Mw 6.2 Earthquake
The Mw 6.2 Christchurch earthquake caused the most widespread and severe liquefaction manifestation at the ground surface throughout central, southern, and eastern Christchurch, relative to all the other CES earthquakes, affecting approximately 47,000 residential properties [15]. The most severe manifestations (typically 100 to 300 mm of ejected sand and silt covering areas of more than 10 to 100 m2) were generally observed in the low-elevation suburbs adjacent to the Avon River where the groundwater was close to the ground surface [33,117] and the soils comprised thicker near- surface layers of loose- to medium-density sandy soils. The ground surface manifestations were less severe (i.e., smaller individual sand blows) in the suburbs farther away from the Avon River, where groundwater was either deeper below the ground surface or the near-surface soil layers comprised medium density to dense sandy soils. Liquefaction caused widespread and severe subsidence throughout eastern and central Christchurch due to lateral spreading, topographic re-levelling, sand and silt ejecta to the ground surface, and post-liquefaction volumetric densification. Generally, the areas where the largest volumes of water, sand, and silt ejecta occurred also experienced the greatest amount of liquefaction-related subsidence (>0.5 m). This earthquake caused 83% of eastern and central Christchurch to subside further; 78% subsided up to 0.3 m, with localized areas exceeding 1 m (Figure 8)
4.3. Cumulative Liquefaction-Driven Topographic Effects of CES
Compared to pre-earthquake elevations, 86% of central and eastern Christchurch subsided through the CES; 10% subsided more than 0.5 m, with some localized locations exceeding 1 m. Cumulative liquefaction-induced subsidence was highest in the inner-meander loops of the Avon River and associated abandoned inner meander loops (e.g., area surrounded by Horseshoe Lake Reserve in eastern Christchurch, north of the contemporary Avon River). By removing the tectonic components of uplift or subsidence [14,88], the residual vertical displacements (subsidence) could be attributed to liquefaction-induced effects. Liquefaction-induced subsidence was evident even in areas where the net effect was uplift because the tectonic uplift exceeded liquefaction-induced subsidence (e.g., parts of SE Christchurch near the estuary). The CES cumulative lateral displacements correlated well with the observed surface manifestations of liquefaction, ground cracking, and damage [14,109] (Figure 7b). In areas of severe liquefaction and lateral spreading, upward of 40% of cumulative CES horizontal displacements exceeded 1 m. The 50th percentile displacement for the “No observed ground cracking or ejected liquefiable material” category was between 0.2 and 0.3 m (the smallest displacements that could be identified within the resolution of the optical imaging approach used; see Rathje et al. [109] for details). The majority of areas and properties affected by increased flood vulnerability were already within the 1% annual exceedance probability floodplain; however, many residents were not aware that their property had been in the floodplain before the CES [17].
A comparison of pre-CES and post-13 June 2011 river and floodplain cross-sections, derived from a combination of direct river bed depth measurements and LiDAR data, shows floodplain subsidence and river channel narrowing and shallowing (Figure 10, inset panels i–v) resulting from lateral spread and sedimentation from liquefaction ejecta entering the waterways [14,17]. Smaller cross-sectional channel areas and lower flood plains collectively reduced channel cross-sectional areas, reduced channel carrying capacity, and thus increased flood hazard.
5. Influence of CES Surface Topography Changes on Flooding
5.1. Increased Flood Hazard Due to Faulting-Induced Changes in Stream and Flood Plain Gradients
The Hororata River occupies the low-gradient interdistributary zone between the Rakaia Fan to the south and the much smaller Selwyn River Fan to the north. The west segment (GFW) ruptured the surface of the interfluve between the Selwyn and Hororata Rivers, striking approximately parallel with and never more than a few hundred meters away from Hororata River [12,114]. The interfluve here consisted mainly of the surface of the Selwyn River Fan, with southeast-flowing paleochannels of the Selwyn River that merged southward with the Hororata River.
Large rainfall events in the Selwyn and Hororata catchments during August 2010 had preconditioned the landscape by causing ground saturation that contributed to a rapid, nearly 1-m pre-earthquake increase in stage height in the Selwyn River system following a moderate, 3-day rainfall event from ≈28 August onward [122]. The flood stage reached on 1 September 2010, SE of the study area, was the third-highest during the 12 months to 9 December 2010. It was increasing again due to further rainfall on 3 September when the instrument malfunctioned during the earthquake on 4 September. Both the Hororata and Selwyn Rivers would, therefore, have been at a relatively high stage when the earthquake occurred [122].
Vertical tectonic displacements of 0.8 to 1.8 m along the GFW surface rupture (Figure 7b,d) disrupted the bed of a meander bend in the strongly-flowing Hororata River, uplifting the downstream reach of the meander and forcing the river to avulse and flow along the new fault scarp [12,114]. Water flowing southeast from the avulsion node lapped onto the scarp, proving instrumental in mapping the fault in the absence of LiDAR. Floodwaters reoccupied old channels of the Selwyn River that formed low points in the scarp, eventually rejoining the Hororata River near its confluence with the Selwyn River (Figure 6b). Extensive flooding north of the avulsion node resulted from (i) the backing-up of water at the avulsion node, (ii) the expulsion of groundwater, and (iii) the tectonic damming and avulsion of ephemeral Selwyn River paleochannels that were already flowing because of underflow from the contemporary high-flood stage event in the main Selwyn River channel [15,122].
The net effect of the earthquake for post-seismic flood hazard of the southern reaches of the Hororata River is implicit in the vertical displacements shown in Figure 7. Around 2 km of riverbed was excavated over several weeks to reinstate the river in its pre-earthquake bed; that bed remains located on the footwall of a normal fault, immediately adjacent to and higher than an area of significant new accommodation space. The coseismic avulsion node is expected to be an area of major aggradation as the river (i) flows across the scarp into the bend, excavating the scarp and creating a local knickpoint, and (ii) deposits sediment as it encounters the extremely low gradient imposed by agricultural landscape change since the 1940s [122] and its post-seismic reinstatement. It is reasonable to expect that the river will re-avulse repeatedly at the avulsion node, seeking to occupy the downthrown side of the fault.
Near the village of Hororata, the Hororata River flows NE along the margin of the Rakaia River Fan, before turning to flow SE along the Rakaia–Selwyn inter-fan zone (Figure 7a,b). The angle between the NE- and SE-flowing reaches coincides with the zone of uplift on the hanging wall of the Hororata anticline blind thrust fault, and the SE-flowing reach meanders sub-parallel to the GFW. The net effect on the downstream gradient of the river is shown in Figure 7d. The only drainage reversal occurs at the avulsion node, but the gradient of the Hororata River is perturbed in many small ways that may be significant for flood hazards. For instance, during flooding in August 2017, the Hororata River occupied low lying areas north of the river (Figure 7b). The flooding occurred in a reach with little downstream gradient perturbation. However, it lay between a steepened upstream reach and a reach with a shallowed downstream gradient. Furthermore, the southward slope of the left (north) bank of the river was reduced by subsidence on the downthrown side of the GFW. Each of these changes was relatively small compared to the natural slopes; for example, the GFW subsidence on the north bank of the Hororata River only imposed a northward tilt of 1:4000 on a natural southward slope of 1:200. However, the cumulative effect of upstream steepening, downstream shallowing, and cross-stream tilting may be significant for the behavior of the river in this flood-prone area.
The Selwyn, Waianiwaniwa, and Hawkins Rivers all traverse the zone of subsidence on the hanging wall of the GFW and footwall of the CCF (Figure 7). The bed elevation changes along these rivers steepen their upstream profiles slightly but flatten their downstream profiles by 1/5th (from 0.5% to 0.4% [15]. As previously noted [15], this bed perturbation is likely to favor sedimentation and flooding in the reduced-gradient reaches of the river.
The Avon and Heathcote Rivers both traverse a tectonically uplifted zone before reaching the uplifted Avon-Heathcote Estuary (Figure 7c). The uplift reduces the gradient of both rivers (e.g., Figure 7e), increasing the flood hazard in parts of eastern Christchurch. The Flockton Basin, in particular, has effectively become a ponding area for floodwaters of the Avon River and its eastern tributaries, resulting in repeated flooding events since the onset of the CES.
5.2. Increased Flood Hazard Due to Liquefaction-Induced Topographic Changes
In 2013, the Christchurch City Council [123] released revised modified flood extents for projected 1-in-50-year and 1-in-200-year rainfall events using post-earthquake LiDAR-derived digital elevation models. These extents exceeded pre-earthquake extents by area and by severity. Key factors in the increase were the widespread tectonic and liquefaction-induced landscape changes and alteration of the longitudinal and cross-sectional profiles and sediment regimes of urban waterways. The lowering of surface elevations relative to water tables [12,117] is likely to have increased the liquefaction and flood hazard. With groundwater levels (i.e., fully saturated soils) now closer to the ground surface, there is less soil above the water table and therefore less capacity to absorb water during storm events. Leakage of underlying artesian aquifers through breached aquitards may have also influenced local hydrologic conditions [32] and thus impacted surface water infiltration. Another significant contributor to the increased flood hazard was widespread earthquake damage of the urban stormwater network, including open channels and underground pipes that were compromised by breakages, liquefaction blockages, and gradient changes [99,101]. The post-earthquake floodscape may have also been influenced by New Zealand statutory resource management framework changes, instituted in the early 1990s, which were locally translated into a new approach of naturalizing urban waterways and reducing engineered river widening and dredging programs. Pre-1990s development of the urban floodplains that are now experiencing enhanced flood hazards was facilitated by the earlier engineering approach to the urban rivers [124,125,126].
The floodplain areas along the Avon and Heathcote Rivers have an increased flood hazard due to the factors described above, including liquefaction-induced subsidence. An example of how these factors increased the 1-in-100-year storm event (1% annual exceedance probability (AEP)) flood depths (∆F) due to subsidence along the Avon River corridor is shown in Hughes et al. [14]. Christchurch City Council and national insurers (Earthquake Commission) have released a suite of reports on the implications of increased flooding vulnerability in response to the CES (e.g., https://www.eqc.govt.nz/canterbury-earthquakes/land-claims/complex-land-claims/increased-risk-of-flooding).
To estimate the potential for future earthquake-induced liquefaction and associated flooding effects, we first plotted the instrumentally-recorded geometric mean PGAs at six selected strong ground motion stations (NNBS—North New Brighton School, NBLC—New Brighton Library, CBGS—Christchurch Botanic Gardens, LINC—Lincoln School, PRPC—Pages Road Pumping Station, SHLC—Shirley Library) for the 11 strongest CES earthquakes with the largest recorded PGAs. The geometric mean PGAs were sourced directly from the values presented in Bradley [92], except for the Mw 5.7 earthquake in 2016, which was computed herein from processed PGAs obtained for these stations from Geonet. The NNBS and NBLC records were merged because of data unavailability for some events; the reported NNBS-NBLC value represents the available value (if only one value was available) or the averaged value (if both records were available). Locations and geotechnical information for stations considered herein are available at (https://www.eqc.govt.nz/sites/public_files/3783-Geotech-characterisation-Chch-strong-motion-stations.pdf) and (https://www.geonet.org.nz/data/supplementary/nzsmdb). PGA values were plotted against earthquake Mw and coded by symbols based on whether liquefaction with and without flooding was observed “proximal” (i.e., ≤3 km) to the seismometer sites in the associated earthquakes (Figure 11a). Estimated “threshold” values for liquefaction and liquefaction plus groundwater expulsion flooding in susceptible sediments were defined by linearly correlating observational data to PGA values. Minor proximal liquefaction was observed at geometric mean PGAs as low as 0.07–0.09 g and liquefaction plus groundwater expulsion surface flooding was observed in earthquakes with a geometric mean PGAs as low as 0.15 g. PGA threshold values decreased with increasing Mw because larger Mw earthquakes had longer shaking durations and thus more potentially effective liquefaction-triggering stress cycles. Using the threshold values from Figure 11a, the expected average return times of geometric mean PGAs (1/annual rate of PGA exceedance) capable of triggering future liquefaction and liquefaction plus associated groundwater expulsion flooding in Christchurch are shown in Figure 11b (using the hazard curve from Bradley [92]). The liquefaction plus groundwater expulsion flooding PGA field (#1) intersects the hazard curve at circa 100-to-475-year return times. Paleoseismic investigations of sites subjected to recurrent liquefaction during the CES revealed evidence for major pre-CES liquefaction event(s) (early historic or pre-historic “paleo-liquefaction”) in late Holocene sediments [127,128], providing additional evidence supporting the recurrence over a timescale of hundreds to thousands of years.
5.3. Summary
Christchurch experienced several intensive rainstorms in 2014 and 2017 (Figure 2), resulting in widespread flooding of properties in river suburbs that in some instances exceeded historical flooding depths and spatial extents due to floodplain subsidence through the CES. The documentation of large, loss-inducing flood events following the CES has prompted an urgent and intent governmental focus on appropriate infrastructure and urban planning responses; at present, the city’s post-quake floodscape is cited as the primary concern of city authorities.
Relative sea-level rises of 0.5 to 1 m occurred in suburbs adjoining the lower Avon River and Avon-Heathcote Estuary, which experienced tectonic downthrow and significant liquefaction/ lateral spread subsidence through the CES. These areas have thus experienced the equivalent of several centuries of projected relative sea-level rise in the absence of land elevation changes at the current global rate of sea-level rise of 3.3 ± 0.4 mm yr−1 [129], and thus provide useful analogs for the potential impacts of sea-level rise in other settings globally. In this instance, gravel stop-banks were constructed along much of the Avon River in 2011 to temporarily mitigate the post-earthquake flood hazard (Figure 9, inset panels i–v).
Probabilistic approaches that consider future impacts from natural phenomena, including tropical and extra-tropical cyclones [130], earthquakes [131], and liquefaction [33], are important when considering future risks posed by flooding in Christchurch. Investigations addressing the dynamic geomorphic responses of urban rivers and coastal plains to relative sea-level rise, shoreline retreat, groundwater responses, liquefaction, subsidence, and coastal aquifer resources are all urgently required.
The anthropogenic intervention in long-term geologic processes that previously enabled sediment aggradation to rebuild topography in this area means that, without further anthropogenic redistribution of sediment, subsidence will continue to dominate the topographic evolution of Christchurch. It is quite likely that flood events will also deposit outwash sediment onto low-lying flood plains, such as parts of the residential red zone. Strong earthquakes sourced from previously unidentified and/or blind faults and their impacts on flood and relative sea levels add to the myriad of short- to long-term challenges facing coastal environments in New Zealand and throughout the world.
In the case of future earthquake-induced effects on flood hazards in Christchurch, we view the probability of future liquefaction-inducing earthquakes and associated subsidence and increased flood hazards in eastern Christchurch over the 50, 100, 475, and 2500-year time-scale to be high to almost certain. This is consistent with the interpretations from Brackley et al. [106], who combined subsurface geological and geotechnical data with expected PGAs for return times of various time-scales derived from seismic hazard models to forecast likely distributions and magnitudes of future liquefaction and subsidence in the Christchurch area. Liquefaction-induced subsidence of 100–250 mm was estimated at 100-year earthquake PGAs for significant areas in eastern and southwestern Christchurch [106].
Without major intervention, including large engineering works and possible additional land rezoning and restrictive planning revisions, the earthquake-induced flood hazard in Christchurch will only increase with time and be compounded by expected rises in sea-level.
With our current state of knowledge of the recurrence of earthquakes on the major faults that ruptured in the CES (6–8 kyr for the Christchurch faults, 20–30 kyr for the Greendale fault) [108,132], the likelihood of future surface deformation and associated flood responses relating to recurrent movement on these faults is interpreted to be very low on timescales less than 2500 years. Future ruptures on other (unknown) local faults that could influence surface topography and thus flood hazard remains unknown; however, there is no evidence at present to suggest faults of comparable size to those that have ruptured in the CES are present beneath eastern Christchurch. In other parts of the region (western Christchurch, eastern Canterbury Plains), it is quite probable that active faults exist and may have the capacity to cause future surface deformations and drainage modifications. Some faults offshore in the Pacific Ocean and more distal sources, such as the Hikurangi subduction zone, present possible tsunami inundation flood hazards that require careful consideration in future flood assessments for Christchurch.
6. Conclusions
As previously documented [14,17,110], the discrete and cumulative effects of the Canterbury earthquake sequence increased the presence of flood hazards in Christchurch and the surrounding region through modifying surface flow and stream channel gradients, lowering flood plain elevations, reducing channel carrying capacities, and disrupting surface and subsurface drainage and infrastructure. These effects influenced flood hazards across a variety of urban and rural settings, both proximal to and more distant from streams and coastlines. Increased flood vulnerabilities have been modeled across the region [17] and have insurance implications. The high hazard of future earthquake-induced liquefaction, subsidence, and flood events over 100– to 500-year timescales is relevant to engineering design and land-use planning decisions, particularly when viewed from a multi-hazard perspective.
Author Contributions
Conceptualization, M.Q.; methodology, M.Q. and B.D.; validation, M.Q. and B.D.; formal analysis, M.Q. and B.D.; investigation, M.Q. and B.D.; data curation, M.Q. and B.D.; writing and revisions, M.Q. and B.D.; visualization, M.Q. and B.D.; funding acquisition, M.Q. All authors have read and agreed to the published version of the manuscript.
Funding
This research was funded by the New Zealand Earthquake Commission Capability Fund.
Acknowledgments
We acknowledge Brendon Bradley for assistance with seismic hazard interpretations and Craig Davis for a review.
Conflicts of Interest
The authors declare no conflict of interest.
References
- Roeloffs, E. Poroelastic Techniques in the Study of Earthquake-Related Hydrologic Phenomena. In Advances in Geophysics; Dmowska, R., Saltzman, B., Eds.; Elsevier: Amsterdam, The Netherlands, 1996; pp. 135–195. [Google Scholar]
- Montgomery, D.R.; Manga, M. Streamflow and water well responses to earthquakes. Science 2003, 300, 2047–2049. [Google Scholar] [CrossRef] [PubMed] [Green Version]
- Wang, C.-Y.; Manga, M. Earthquakes and Water; Lecture Notes in Earth Science; Springer: Berlin/Heidelberg, Germany, 2010; p. 225. [Google Scholar]
- Wang, C.-Y.; Manga, M. Groundwater Level Change. In Earthquakes and Water; Springer: Berlin/Heidelberg, Germany, 2009; pp. 67–95. [Google Scholar]
- Wang, S.; Xu, W.; Xu, C.; Yin, Z.; Bürgmann, R.; Liu, L.; Jiang, G. Changes in Groundwater Level Possibly Encourage Shallow Earthquakes in Central Australia: The 2016 Petermann Ranges Earthquake. Geophys. Res. Lett. 2019, 46, 3189–3198. [Google Scholar] [CrossRef]
- Gonzalez, P.J.; Tiampo, K.; Palano, M.; Cannavò, F.; Fernandez, J. The 2011 Lorca earthquake slip distribution controlled by groundwater crustal unloading. Nat. Geosci. 2012, 5, 821–825. [Google Scholar] [CrossRef] [Green Version]
- Amos, C.B.; Audet, P.; Hammond, W.C.; Bürgmann, R.; Johanson, I.A.; Blewitt, G. Uplift and seismicity driven by groundwater depletion in central California. Nature 2014, 509, 483–486. [Google Scholar] [CrossRef] [PubMed]
- Allen, T.; Gibson, G.; Hill, C. The Thomson Reservoir-Triggered Earthquakes. In Proceedings of the 2000 Annual Conference Australian Earthquake Engineering Society, Hobart, Australia, 17 November 2000. [Google Scholar]
- Hough, S.; Page, M. Potentially Induced Earthquakes during the Early Twentieth Century in the Los Angeles Basin. Bull. Seism. Soc. Am. 2016, 106, 2419–2435. [Google Scholar] [CrossRef]
- Hough, S.; Page, M. A Century of Induced Earthquakes in Oklahoma? Bull. Seism. Soc. Am. 2015, 105, 2863–2870. [Google Scholar] [CrossRef]
- Clark, K.J.; Hayward, B.W.; Cochran, U.; Wallace, L.M.; Power, W.L.; Sabaa, A.T. Evidence for Past Subduction Earthquakes at a Plate Boundary with Widespread Upper Plate Faulting: Southern Hikurangi Margin, New Zealand. Bull. Seism. Soc. Am. 2015, 105, 1661–1690. [Google Scholar] [CrossRef] [Green Version]
- Duffy, B.; Quigley, M.; Barrell, D.J.A.; Van Dissen, R.; Stahl, T.; Leprince, S.; McInnes, C.; Bilderback, E. Fault kinematics and surface deformation across a releasing bend during the 2010 MW 7.1 Darfield, New Zealand, earthquake revealed by differential LiDAR and cadastral surveying. GSA Bull. 2012, 125, 420–431. [Google Scholar] [CrossRef]
- Adams, J. Earthquake-dammed lakes in New Zealand. Geology 1981, 9, 215–219. [Google Scholar] [CrossRef]
- Hughes, M.W.; Quigley, M.C.; van Ballegooy, S.; Deam, B.L.; Bradley, B.A.; Hart, D.E. The sinking city: Earthquakes increase flood hazard in Christchurch, New Zealand. GSA Today 2015, 25, 3–4. [Google Scholar] [CrossRef]
- Quigley, M.C.; Hughes, M.W.; Bradley, B.A.; van Ballegooy, S.; Reid, C.; Morgenroth, J.; Horton, T.; Duffy, B.; Pettinga, J.R. The 2010-2012 Canterbury earthquake sequence: Environmental effects, seismic triggering thresholds and geologic legacy. Tectonophysics 2016, 672–673, 228–274. [Google Scholar] [CrossRef] [Green Version]
- Hart, D.E.; Giovinazzi, S.; Byun, D.S.; Davis, C.; Ko, S.Y.; Gomez, C.; Hawke, K.; Todd, D. Enhancing resilience by altering our approach to earthquake and flooding assessment: Multi-hazards. In Proceedings of the 16th European Conference on Earthquake Engineering, Thessaloniki, Greece, 18–21 June 2018. [Google Scholar]
- Taylor, M.C.; Fisher, T.S.R.; Ng, K.K.S.; Pennington, M. Flooding Vulnerability Lessons Learned in Assessing the Effects of Flooding Caused by the Canterbury Earthquake Sequence. ISSMGE Int. J. Geoengin. Case Hist. 2018, 4, 242–253. [Google Scholar]
- Dellow, S.; Massey, C.; Cox, S. Response and initial risk management of landslide dams caused by the 14 November 2016 Kaikoura earthquake, South Island, New Zealand. In Proceedings of the 20th NZGS Geotechnical Symposium, Napier, New Zealand, 26 November 2017. [Google Scholar]
- Fan, X.; Van Westen, C.; Xu, Q.; Gorum, T.; Dai, F. Analysis of landslide dams induced by the 2008 Wenchuan earthquake. J. Asian Earth Sci. 2012, 57, 25–37. [Google Scholar] [CrossRef]
- Konagai, K.; Sattar, A. Partial breaching of Hattian Bala Landslide Dam formed in the 8th October 2005 Kashmir Earthquake, Pakistan. Landslides 2011, 9, 1–11. [Google Scholar] [CrossRef]
- Dai, F.C.; Lee, C.F.; Deng, J.H.; Tham, L.G. The 1786 earthquake-triggered landslide dam and subsequent dam-break flood on the Dadu River, southwestern China. Geomorphology 2005, 65, 205–221. [Google Scholar] [CrossRef]
- Kaiser, A.; Balfour, N.; Fry, B.; Holden, C.; Litchfield, N.; Gerstenberger, M.; D’Anastasio, E.; Horspool, N.; McVerry, G.; Ristau, J.; et al. The 2016 Kaikōura, New Zealand, Earthquake: Preliminary Seismological Report. Seism. Res. Lett. 2017, 88, 727–739. [Google Scholar] [CrossRef]
- Marc, O.; Hovius, N.; Meunier, P.; Uchida, T.; Hayashi, S. Transient changes of landslide rates after earthquakes. Geology 2015, 43, 883–886. [Google Scholar] [CrossRef]
- Dai, F.; Xu, C.; Yao, X.; Xu, L.; Tu, X.; Gong, Q. Spatial distribution of landslides triggered by the 2008 Ms 8.0 Wenchuan earthquake, China. J. Asian Earth Sci. 2011, 40, 883–895. [Google Scholar] [CrossRef]
- Sattar, A.; Konagai, K.; Kiyota, T.; Ikeda, T.; Johansson, J. Measurement of debris mass changes and assessment of the dam-break flood potential of earthquake-triggered Hattian landslide dam. Landslides 2010, 8, 171–182. [Google Scholar] [CrossRef]
- Teng, W.; Hsu, M.-H.; Chang, S. Damage to hydraulic facilities from the chi?chi (Taiwan) Earthquake. J. Chin. Inst. Eng. 2000, 23, 385–394. [Google Scholar] [CrossRef]
- Burrato, P.; Vannoli, P.; Fracassi, U.; Basili, R.; Valensise, G. Is Blind Faulting Truly Invisible? Tectonic-Controlled Drainage Evolution in the Epicentral Area of the May 2012, Emilia-Romagna Earthquake Sequence (Northern Italy); Annals of Geophysics; The Emilia (Northern Italy) Seismic Sequence of May-June, 2012: Preliminary Data and Results; Istituto Nazionale di Geofisica e Vulcanologia: Rome, Italy, 2012; Volume 55. [Google Scholar]
- Guccione, M.J.; Guccione, M.J.; Mueller, K.; Champion, J.; Shepherd, S.; Carlson, S.D.; Odhiambo, B.; Tate, A. Stream response to repeated coseismic folding, Tiptonville Dome, New Madrid Seismic Zone. Geomorphology 2002, 43, 313–349. [Google Scholar] [CrossRef]
- Boudiaf, A.; Ritz, J.F.; Philip, H. Drainage diversions as evidence of propagating active faults: Example of the El Asnam and Thenia faults, Algeria. Terra Nova 1998, 10, 236–244. [Google Scholar] [CrossRef]
- Liu-Zeng, J.; Wen, L.; Sun, J.; Zhang, Z.; Hu, G.; Xing, X.; Zeng, L.; Xu, Q. Surficial Slip and Rupture Geometry on the Beichuan Fault near Hongkou during the Mw 7.9 Wenchuan Earthquake, China. Bull. Seism. Soc. Am. 2010, 100, 2615–2650. [Google Scholar] [CrossRef]
- Howard, M.; Nicol, A.; Campbell, J.; Pettinga, J.R. Holocene paleoearthquakes on the strike?slip Porters Pass Fault, Canterbury, New Zealand. N. Z. J. Geol. Geophys. 2005, 48, 59–74. [Google Scholar] [CrossRef]
- Cox, S.C.; Rutter, H.K.; Sims, A.; Manga, M.; Weir, J.J.; Ezzy, T.; White, P.A.; Horton, T.W.; Scott, D. Hydrological effects of the MW7.1 Darfield (Canterbury) earthquake, 4 September 2010, New Zealand. N. Z. J. Geol. Geophys. 2012, 55, 231–247. [Google Scholar] [CrossRef] [Green Version]
- Quigley, M.C.; Bastin, S.; Bradley, B. Recurrent liquefaction in Christchurch, New Zealand, during the Canterbury earthquake sequence. Geology 2013, 41, 614. [Google Scholar] [CrossRef]
- Cubrinovski, M.; Green, R.A.; Allen, J.; Ashford, S.; Bowman, E.; Bradley, B.; Cox, B.; Hutchinson, T.; Kavazanjian, E.; Orense, R.; et al. Geotechnical reconnaissance of the 2010 Darfield (Canterbury) earthquake. Bull. N. Z. Soc. Earthq. Eng. 2010, 43, 243–320. [Google Scholar] [CrossRef] [Green Version]
- Sassa, S.; Takagawa, T. Liquefied gravity flow-induced tsunami: First evidence and comparison from the 2018 Indonesia Sulawesi earthquake and tsunami disasters. Landslides 2018, 16, 195–200. [Google Scholar] [CrossRef] [Green Version]
- Mulcahy, M. The Port Royal Earthquake and the World of Wonders in Seventeenth-Century Jamaica. Early Am. Stud. Interdiscip. J. 2008, 6, 391–421. [Google Scholar] [CrossRef]
- Agurto-Detzel, H.; Bianchi, M.B.; Assumpção, M.; Schimmel, M.; Collaço, B.; Ciardelli, C.; Barbosa, J.R.; Calhau, J. The tailings dam failure of 5 November 2015 in SE Brazil and its preceding seismic sequence. Geophys. Res. Lett. 2016, 43, 4929–4936. [Google Scholar] [CrossRef] [Green Version]
- O’Rourke, M.; Filipov, E.T.; Uckan, E. Towards Robust Fragility Relations for Buried Segmented Pipe in Ground Strain Areas. Earthq. Spectra 2015, 31, 1839–1858. [Google Scholar] [CrossRef]
- Gragg, L. The Port Royal Earthquake. History Today 2000, 50, 28. [Google Scholar]
- Villavicencio, G.; Espinace, R.; Palma, J.; Fourie, A.; Valenzuela, P. Failures of sand tailings dams in a highly seismic country. Can. Geotech. J. 2014, 51, 449–464. [Google Scholar] [CrossRef]
- Ishihara, K. Post-earthquake failure of a tailings dam due to liquefaction of pond deposit. In Proceedings of the International Conference on Case Histories in Geotechnical Engineering, Missouri, USA, 6 May 1984; p. 13. [Google Scholar]
- Okusa, S.; Anma, S.; Maikuma, H. Liquefaction of mine tailings in the 1978 Izu-Ohshima-Kinkai earthquake, central Japan. In Proceedings of the 7th World Conference on Earthquake Engineering, Istanbul, Turkey, 8–13 September 1980. [Google Scholar]
- Kvale, A. Seismic seiches in Norway and England during the Assam earthquake of August 15, 1950. Bull. Seismol. Soc. Am. 1955, 45, 93–113. [Google Scholar]
- McGarr, A.; Vorhis, R.C. Seismic Seiches from the March 1964 Alaska Earthquake; U.S. Geological Survey Professional Paper 544–E; US Government Printing Office: Washington, DC, USA, 1968.
- Barberopoulou, A.; Qamar, A.; Pratt, T.L.; Creager, K.C.; Steele, W.P. Local amplification of seismic waves from the Denali Earthquake and damaging seiches in Lake Union, Seattle, Washington. Geophys. Res. Lett. 2004, 31, 4239. [Google Scholar] [CrossRef]
- Davison, C. Great Earthquakes; Thomas Murby & Co: London, UK, 1936. [Google Scholar]
- Gusman, A.R.; Tanioka, Y.; Matsumoto, H.; Iwasaki, S.-I. Analysis of the Tsunami Generated by the Great 1977 Sumba Earthquake that Occurred in Indonesia. Bull. Seism. Soc. Am. 2009, 99, 2169–2179. [Google Scholar] [CrossRef]
- Sawai, Y.; Namegaya, Y.; Okamura, Y.; Satake, K.; Shishikura, M. Challenges of anticipating the 2011 Tohoku earthquake and tsunami using coastal geology. Geophys. Res. Lett. 2012, 39. [Google Scholar] [CrossRef] [Green Version]
- Gutscher, M.-A. The great Lisbon earthquake and tsunami of 1755: Lessons from the recent Sumatra earthquakes and possible link to Plato’s Atlantis. Eur. Rev. 2006, 14, 181–191. [Google Scholar] [CrossRef]
- Power, W.; Clark, K.; King, D.N.; Borrero, J.; Howarth, J.D.; Lane, E.M.; Goring, D.; Goff, J.; Chagué-Goff, C.; Williams, J.H.; et al. Tsunami runup and tide-gauge observations from the 14 November 2016 M7.8 Kaikōura earthquake, New Zealand. Pure Appl. Geophys. 2017, 174, 2457–2473. [Google Scholar] [CrossRef]
- Ammon, C.J.; Kanamori, H.; Lay, T.; Velasco, A.A. The 17 July 2006 Java tsunami earthquake. Geophys. Res. Lett. 2006, 33. [Google Scholar] [CrossRef] [Green Version]
- Mörner, N.-A. Paleo-tsunamis in Sweden. Phys. Chem. Earth Part B 1999, 24, 443–448. [Google Scholar] [CrossRef]
- Tsuji, Y.; Matsutomi, H.; Imamura, F.; Takeo, M.; Kawata, Y.; Matsuyama, M.; Takahashi, T.; Sunarjo; Harjadi, P. Damage to coastal villages due to the 1992 Flores Island earthquake tsunami. Pure Appl. Geophys. 1995, 144, 481–524. [Google Scholar] [CrossRef]
- Pranantyo, I.R.; Cummins, P.R. Multi-Data-Type Source Estimation for the 1992 Flores Earthquake and Tsunami. Pure Appl. Geophys. 2019, 176, 2969–2983. [Google Scholar] [CrossRef]
- Abercrombie, R.E.; Antolik, M.; Felzer, K.; Ekström, G. The 1994 Java tsunami earthquake: Slip over a subducting seamount. J. Geophys. Res. Space Phys. 2001, 106, 6595–6607. [Google Scholar] [CrossRef]
- Garrett, E.; Fujiwara, O.; Garrett, P.; Heyvaert, V.M.; Shishikura, M.; Yokoyama, Y.; Hubert-Ferrari, A.; Brückner, H.; Nakamura, A.; De Batist, M. A systematic review of geological evidence for Holocene earthquakes and tsunamis along the Nankai-Suruga Trough, Japan. Earth-Sci. Rev. 2016, 159, 337–357. [Google Scholar] [CrossRef] [Green Version]
- Davies, G.; Griffin, J.; Løvholt, F.; Glimsdal, S.; Harbitz, C.; Thio, H.K.; Lorito, S.; Basili, R.; Selva, J.; Geist, E.; et al. A global probabilistic tsunami hazard assessment from earthquake sources. Geol. Soc. 2017, 456, 219–244. [Google Scholar] [CrossRef] [Green Version]
- Steffen, R.; Steffen, H.; Weiss, R.; Lecavalier, B.S.; Milne, G.A.; Woodroffe, S.A.; Bennike, O. Did Deglaciation of the Greenland Ice Sheet Cause a Large Earthquake and Tsunami around 10,600 Years Ago? Earth ArXiV 2019. [Google Scholar] [CrossRef] [Green Version]
- Udías, A. Large Earthquakes and Tsunamis at Saint Vincent Cape before the Lisbon 1755 Earthquake: A Historical Review. Pure Appl. Geophys. 2019. [Google Scholar] [CrossRef]
- Cox, S.C.; Menzies, C.D.; Sutherland, R.; Denys, P.H.; Chamberlain, C.; Teagle, D.A. Changes in hot spring temperature and hydrogeology of the Alpine Fault hanging wall, New Zealand, induced by distal South Island earthquakes. Geofluids 2015, 15, 216–239. [Google Scholar] [CrossRef] [Green Version]
- Amoruso, A.; Crescentini, L.; Petitta, M.; Rusi, S.; Tallini, M. Impact of the 6 April 2009 L’Aquila earthquake on groundwater flow in the Gran Sasso carbonate aquifer, Central Italy. Hydrol. Process. 2010, 25, 1754–1764. [Google Scholar] [CrossRef]
- Roeloffs, E.A.; Nelms, D.L.; Sheets, R.A. Widespread groundwater-level offsets caused by the Mw 5.8 Mineral, Virginia, earthquake of 23 August 2011. In The 2011 Mineral, Virginia, Earthquake, and Its Significance for Seismic Hazards in Eastern North America; Horton, J.W., Jr., Chapman, M.C., Green, R.A., Eds.; Geological Society of America: Boulder, CO, USA, 2015. [Google Scholar]
- Kitagawa, Y.; Koizumi, N.; Takahashi, M.; Matsumoto, N.; Sato, T. Changes in groundwater levels or pressures associated with the 2004 earthquake off the west coast of northern Sumatra (M9.0). Earth Planets Space 2006, 58, 173–179. [Google Scholar] [CrossRef] [Green Version]
- Yan, R.; Woith, H.; Wang, R. Groundwater level changes induced by the 2011 Tohoku earthquake in China mainland. Geophys. J. Int. 2014, 199, 533–548. [Google Scholar] [CrossRef] [Green Version]
- Wetzler, N.; Shalev, E.; Göbel, T.; Amelung, F.; Kurzon, I.; Lyakhovsky, V.; Brodsky, E.E. Earthquake Swarms Triggered by Groundwater Extraction Near the Dead Sea Fault. Geophys. Res. Lett. 2019, 46, 8056–8063. [Google Scholar] [CrossRef]
- Bella, F.; Biagi, P.F.; Caputo, M.; Cozzi, E.; Della Monica, G.; Ermini, A.; Plastino, W.; Sgrigna, V. Aquifer-induced Seismicity in the Central Apennines (Italy). In Seismicity Caused by Mines, Fluid Injections, Reservoirs, and Oil Extraction; Talebi, S., Ed.; Birkhäuser Basel: Basel, Switzerland, 1999; pp. 179–194. [Google Scholar]
- Simpson, D.W. Seismicity changes associated with reservoir loading. Eng. Geol. 1976, 10, 123–150. [Google Scholar] [CrossRef]
- Simpson, D.; Negmatullaev, S.K. Induced seismicity at Nurek reservoir, Tadjikistan, USSR. Bull. Seism. Soc. Am. 1981, 71, 1561–1586. [Google Scholar]
- Baecher, G.B.; Keeney, R.L. Statistical examination of reservoir-induced seismicity. Bull. Seism. Soc. Am. 1982, 72, 553–569. [Google Scholar]
- Zoback, M.D.; Hickman, S. In situ study of the physical mechanisms controlling induced seismicity at Monticello Reservoir, South Carolina. J. Geophys. Res. Space Phys. 1982, 87, 6959–6974. [Google Scholar] [CrossRef] [Green Version]
- Talwani, P.; Acree, S. Pore pressure diffusion and the mechanism of reservoir-induced seismicity. In Earthquake Prediction; Springer: Berlin/Heidelberg, Germany, 1985; pp. 947–965. [Google Scholar]
- Simpson, D.; Leith, W.; Scholz, C. Two types of reservoir-induced seismicity. Bull. Seism. Soc. Am. 1988, 78, 2025–2040. [Google Scholar]
- Talwani, P. On the Nature of Reservoir-induced Seismicity. Pure Appl. Geophys. 1997, 150, 473–492. [Google Scholar] [CrossRef]
- Chen, L.; Talwani, P. Reservoir-induced seismicity in China. In Seismicity Caused by Mines, Fluid Injections, Reservoirs, and Oil Extraction; Springer: Berlin/Heidelberg, Germany, 1998; pp. 133–149. [Google Scholar]
- Gahalaut, K.; Gahalaut, V.K.; Pandey, M. A new case of reservoir triggered seismicity: Govind Ballav Pant reservoir (Rihand dam), central India. Tectonophysics 2007, 439, 171–178. [Google Scholar] [CrossRef]
- Simpson, D.W.; Stachnik, J.C.; Negmatoullaev, S.K. Rate of Change in Lake Level and Its Impact on Reservoir Triggered SeismicityRate of Change in Lake Level and Its Impact on Reservoir Triggered Seismicity. Bull. Seism. Soc. Am. 2018, 108, 2943–2954. [Google Scholar] [CrossRef]
- Lei, X. Possible roles of the Zipingpu Reservoir in triggering the 2008 Wenchuan earthquake. J. Asian Earth Sci. 2011, 40, 844–854. [Google Scholar] [CrossRef]
- Ellsworth, W.L. Injection-Induced Earthquakes. Science 2013, 341, 1225942. [Google Scholar] [CrossRef] [PubMed]
- Nicol, A.; Carne, R.; Gerstenberger, M.; Christophersen, A. Induced seismicity and its implications for CO2 storage risk. Energy Procedia 2011, 4, 3699–3706. [Google Scholar] [CrossRef] [Green Version]
- Nicol, A.; Gerstenberger, M.; Bromley, C.; Carne, R.; Chardot, L.; Ellis, S.; Jenkins, C.; Siggins, T.; Viskovic, P. Induced seismicity; observations, risks and mitigation measures at CO 2 storage sites. Energy Procedia 2013, 37, 4749–4756. [Google Scholar] [CrossRef] [Green Version]
- Vilarrasa, V.; Carrera, J. Geologic carbon storage is unlikely to trigger large earthquakes and reactivate faults through which CO2could leak. Proc. Natl. Acad. Sci. USA 2015, 112, 5938–5943. [Google Scholar] [CrossRef] [Green Version]
- Ansari, E.; Bidgoli, T.S.; Hollenbach, A. Accelerated Fill-Up of the Arbuckle Group Aquifer and Links to U.S. Midcontinent Seismicity. J. Geophys. Res. Solid Earth 2019, 124, 2670–2683. [Google Scholar] [CrossRef]
- Elsworth, D.; Spiers, C.; Niemeijer, A.R. Understanding induced seismicity. Science 2016, 354, 1380–1381. [Google Scholar] [CrossRef]
- Cappa, F.; Rutqvist, J. Impact of CO2 geological sequestration on the nucleation of earthquakes. Geophys. Res. Lett. 2011, 38. [Google Scholar] [CrossRef] [Green Version]
- Zoback, M.D.; Gorelick, S.M. Earthquake triggering and large-scale geologic storage of carbon dioxide. Proc. Natl. Acad. Sci. USA 2012, 109, 10164–10168. [Google Scholar] [CrossRef] [Green Version]
- Bannister, S.; Gledhill, K. Evolution of the 2010–2012 Canterbury earthquake sequence. New Zealand. J. Geol Geophys. 2012, 55, 295–304. [Google Scholar] [CrossRef]
- Bradley, B.A.; Quigley, M.C.; Van Dissen, R.J.; Litchfield, N.J. Ground Motion and Seismic Source Aspects of the Canterbury Earthquake Sequence. Earthq. Spectra 2014, 30, 1–15. [Google Scholar] [CrossRef]
- Beavan, J.; Motagh, M.; Fielding, E.J.; Donnelly, N.; Collett, D. Fault slip models of the 2010- 2011 Canterbury, New Zealand, earthquakes from geodetic data, and observations of post-seismic ground deformation. N. Z. J. Geol. Geophys. 2012, 55, 207–221. [Google Scholar] [CrossRef]
- Quigley, M.C.; Van Dissen, R.; Litchfield, N.; Villamor, P.; Duffy, B.; Barrell, D.; Furlong, K.; Stahl, T.; Bilderback, E.; Noble, D. Surface rupture during the 2010 MW 7.1 Darfield (Canterbury) earthquake: Implications for fault rupture dynamics and seismic-hazard analysis. Geology 2012, 40, 55–58. [Google Scholar] [CrossRef] [Green Version]
- Shcherbakov, R.; Nguyen, M.; Quigley, M. Statistical analysis of the 2010 M W 7.1 Darfield Earthquake aftershock sequence. N. Z. J. Geol. Geophys. 2012, 55, 305–311. [Google Scholar] [CrossRef]
- Bradley, B.A. Systematic Ground Motion Observations in the Canterbury Earthquakes and Region-Specific Non-Ergodic Empirical Ground Motion Modeling. Earthq. Spectra 2015, 31, 1735–1761. [Google Scholar] [CrossRef]
- Bradley, B. Benefits of site-specific hazard analyses for seismic design in New Zealand. Bull. N. Z. Soc. Earthq. Eng. 2015, 48, 92–99. [Google Scholar] [CrossRef]
- Bradley, B.A.; Baker, J.W. Ground motion directionality in the 2010–2011 Canterbury earthquakes. Earthq. Eng. Struct. Dyn. 2015, 44, 371–384. [Google Scholar] [CrossRef]
- Bradley, B.; Burks, L.S.; Baker, J. Ground motion selection for simulation-based seismic hazard and structural reliability assessment. Earthq. Eng. Struct. Dyn. 2015, 44, 2321–2340. [Google Scholar] [CrossRef] [Green Version]
- Quigley, M.; Forte, A. Science Website Traffic in Earthquakes. Seism. Res. Lett. 2017, 88, 867–874. [Google Scholar] [CrossRef] [Green Version]
- Allen, J.; Davis, C.; Giovinazzi, S.; Hart, D.E.; Cochrane, T.; Deam, B.; De Pascale, G.; Hicks, M.; Holland, D.; Hughes, M.; et al. Geotechnical & Flooding Reconnaissance of the 2014 March Flood Event Post 2010–2011 Canterbury Earthquake Sequence, New Zealand; Report No. GEER035; University of Canterbury: Canterbury, New Zealand, 2014. [Google Scholar]
- Van Ballegooy, S.; Malan, P.; Lacrosse, V.; Jacka, M.E.; Cubrinovski, M.; Bray, J.D.; O’Rourke, T.D.; Crawford, S.A.; Cowan, H. Assessment of liquefaction-induced land damage for residential Christchurch. Earthq. Spectra 2014, 30, 31–55. [Google Scholar] [CrossRef]
- Cubrinovski, M.; Winkley, A.; Haskell, J.; Palermo, A.; Wotherspoon, L.; Robinson, K.; Bradley, B.; Brabhaharan, P.; Hughes, M. Spreading-induced damage to short-span bridges in Christchurch, New Zealand. Earthq. Spectra 2014, 30, 57–83. [Google Scholar] [CrossRef]
- Cubrinovski, M.; Hughes, M.; O’Rourke, T. Impacts of liquefaction on the potable water system of Christchurch in the 2010–2011 Canterbury (NZ) earthquakes. J. Water Supply Res. Technol.—AQUA 2014, 63, 95–105. [Google Scholar] [CrossRef]
- Cubrinovski, M.; Haskell, J.; Winkley, A.; Robinson, K.; Wotherspoon, L. Performance of bridges in liquefied deposits during the 2010–2011 Christchurch, New Zealand, earthquakes. J. Perform. Constr. Facil. 2014, 28, 24–39. [Google Scholar] [CrossRef] [Green Version]
- O’Rourke, T.D.; Jeon, S.S.; Toprak, S.; Cubrinovski, M.; Hughes, M.; van Ballegooy, S.; Bouziou, D. Earthquake response of underground pipeline networks in Christchurch, NZ. Earthq. Spectra 2014, 30, 183–204. [Google Scholar] [CrossRef]
- Townsend, D.; Lee, J.M.; Strong, D.T.; Jongens, R.; Smith Lyttle, B.; Ashraf, S.; Rosser, B.; Perrin, N.; Lyttle, K.; Cubrinovski, M.; et al. Mapping surface liquefaction caused by the September 2010 and February 2011 Canterbury earthquakes: A digital dataset. N. Z. J. Geol. Geophys. 2016, 59, 496–513. [Google Scholar] [CrossRef]
- Cubrinovski, M.; Green, R.; Wotherspoon, L. Geotechnical Reconnaissance of the 2011 Christchurch, New Zealand Earthquake; GEER Association Report No GEER-027. Available online: http://www.geerassociation.org/index.php/component/geer_reports/?view=geerreports&id=41 (accessed on 25 February 2020).
- Green, R.A.; Cubrinovski, M.; Allen, J.; Ashford, S.; Bowman, E.; Bradley, B.A.; Cox, B.; Hutchinson, T.; Kavazanjian, E.; Orense, R. Geotechnical Reconnaissance of the 2010 Darfield (New Zealand) Earthquake; Report of Geo-Engineering Extreme Event Reconnaissance (GEER); Bulletin of the New Zealand Society for Earthquake Engineering; University of Canterbury: Canterbury, New Zealand, 2010; Volume 43. [Google Scholar]
- Measures, R.J.; Hicks, M.; Shankar, U.; Bind, J.; Arnold, J.; Zeldis, J. Mapping Earthquake Induced Topographical Change and Liquefaction in the Avon-Heathcote Estuary; NIWA Client Report CHC2011-066, Prepared for Environment Canterbury; NIWA: Christchurch, New Zealand, 2011; 28p. [Google Scholar]
- Brackley, H.L. Review of Liquefaction Hazard Information in Eastern Canterbury, Including Christchurch City and Parts of Selwyn, Waimakariri and Hurunui Districts; GNS Science Consultancy Report 2012/218; Canterbury Regional Council: Canterbury, New Zealand, 2012; 99p.
- Tonkin & Taylor. Liquefaction Vulnerability Study; Report for the New Zealand Earthquake Commission; Tonkin and Taylor: Christchurch, New Zealnad, 2013; 52p. [Google Scholar]
- Hornblow, S.; Quigley, M.; Nicol, A.; Van Dissen, R.; Wang, N. Paleoseismology of the 2010 Mw 7.1 Darfield (Canterbury) earthquake source, Greendale Fault, New Zealand. Tectonophysics 2014, 637, 178–190. [Google Scholar] [CrossRef]
- Rathje, E.M.; Secara, S.S.; Martin, J.G.; Van Ballegooy, S.; Russell, J. Liquefaction-Induced Horizontal Displacements from the Canterbury Earthquake Sequence in New Zealand Measured from Remote Sensing Techniques. Earthq. Spectra 2017, 33, 1475–1494. [Google Scholar] [CrossRef]
- Cavalieri, F.; Franchin, P.; Giovinazzi, S. Earthquake-altered flooding hazard induced by damage to storm water systems. Sustain. Resilient Infrastruct. 2016, 1, 14–31. [Google Scholar] [CrossRef]
- Van Dissen, R.; Barrell, D.; Litchfield, N.; Villamor, P.; Quigley, M.; King, A.; Furlong, K.; Begg, J.; Townsend, D.; Mackenzie, H.; et al. Surface rupture displacement on the Greendale Fault during the Mw 7.1 Darfield (Canterbury) Earthquake, New Zealand, and its impact on man-made structures. In Proceedings of the Ninth Pacific Conference on Earthquake Engineering, Building an Earthquake-Resilient Society, Auckland, New Zealand, 14–16 April 2011. [Google Scholar]
- Quigley, M.C.; Villamor, P.; Furlong, K.; Beavan, J.; Van Dissen, R.; Litchfield, N.; Stahl, T.; Duffy, B.; Bilderback, E.; Noble, D.; et al. Previously unknown fault shakes New Zealand’s South Island. EOS 2010, 91, 469–470. [Google Scholar] [CrossRef] [Green Version]
- Quigley, M.C.; Van Dissen, R.; Villamor, P.; Litchfield, N.; Barrell, D.; Furlong, K.; Stahl, T.; Duffy, B.; Bilderback, E.; Noble, D.; et al. Surface rupture of the Greendale Fault during the Darfield (Canterbury) earthquake, New Zealand: Initial findings. Bull. N. Z. Soc. Earthq. Eng. 2010, 43, 236–242. [Google Scholar] [CrossRef]
- Barrell, D.J.A.; Litchfield, N.; Townsend, D.B.; Quigley, M.; Van Dissen, R.; Cosgrove, R.; Cox, S.C.; Furlong, K.; Villamor, P.; Begg, J.G.; et al. Strike-slip ground-surface rupture (Greendale Fault) associated with the 4 September 2010 Darfield earthquake, Canterbury, New Zealand. Q. J. Eng. Geol. Hydrogeol. 2011, 44, 283–291. [Google Scholar] [CrossRef]
- Villamor, P.; Litchfield, N.; Barrell, D.; Van Dissen, R.; Hornblow, S.; Quigley, M.; Levick, S.R.; Ries, W.F.; Duffy, B.; Begg, J.; et al. Map of the 2010 Greendale Fault surface rupture, Canterbury, New Zealand: Application to land use planning. N. Z. J. Geol. Geophys. 2012, 55, 223–230. [Google Scholar] [CrossRef] [Green Version]
- Measures, R.J.; Bind, J. Hydrodynamic Model of the Avon Heathcote Estuary, Model Build and Calibration; NIWA Client Report CHC2013-116, Prepared for Environment Canterbury; NIWA: Auckland, New Zealand, 2013; 29p. [Google Scholar]
- van Ballegooy, S.; Cox, S.C.; Thurlow, C.; Rutter, H.K.; Reynolds, T.; Harrington, G.; Fraser, J.; Smith, T. Median Water Elevation in Christchurch and Surrounding Area after the 4 September 2010 Darfield Earthquake; Version 2. GNS Science Report 2014/18; GNS Science: Lower Hutt, New Zealand, 2014. [Google Scholar]
- Villemure, M.; Wilson, T.M.; Bristow, D.; Gallagher, M.; Giovinazzi, S.; Brown, C. Liquefaction Ejecta Clean-Up in Christchurch during the 2010-2011 Earthquake Sequence. In Proceedings of the New Zealand Society for Earthquake Engineering (NZSEE) Annual Conference, Christchurch, New Zealand, 13–15 April 2012. [Google Scholar]
- Van Ballegooy, S.; Berryman, K.; Deam, B.; Jacka, M. Repeated major episodes of tectonic deformation, lateral spread and liquefaction in Christchurch during the Canterbury Earthquake Sequence of 2010–2011. In Engineering Geology for Society and Territory; Springer: Berlin/Heidelberg, Germany, 2015; Volume 5, pp. 1043–1049. [Google Scholar]
- Wotherspoon, L.M.; Pender, M.; Orense, R. Relationship between observed liquefaction at Kaiapoi following the 2010 Darfield earthquake and former channels of the Waimakariri River. Eng. Geol. 2012, 125, 45–55. [Google Scholar] [CrossRef]
- Cubrinovski, M.; Robinson, K.; Taylor, M.; Hughes, M.; Orense, R. Lateral spreading and its impacts in urban areas in the 2010–2011 Christchurch earthquakes. N. Z. J. Geol. Geophys. 2012, 55, 255–269. [Google Scholar] [CrossRef]
- Duffy, B. The Structural and Geomorphic Development of Active Collisional Orogens, from Single Earthquake to Million Year Timescales, Timor Leste and New Zealand. In Department of Geological Sciences; University of Canterbury: Christchurch, New Zealand, 2013; p. 238. [Google Scholar]
- Christchurch City Council. Flood Extent Models, Christchurch City Council Flood Modeling Data. 2014. Available online: http://maps.cera.govt.nz/advanced-viewer/?Viewer=Ccc-Floor-Levels (accessed on 12 December 2014).
- Wilson, J. Christchurch: Swamp to city: A short history of the Christchurch Drainage Board, 1875–1989; Te Waihora Press for the Christchurch Drainage Board: Christchurch, New Zealand, 1989. [Google Scholar]
- Canterbury Regional Council. Avon and Heathcote Catchment, Rivers and Estuary: Issues and Options for Managing the Heathcote River Floodplain; Canterbury Regional Council Report R93; Canterbury Regional Council: Canterbury, New Zealand, 1993; 43p.
- Canterbury Regional Council. Avon River: Issues and Options for Managing the Avon River Floodplain; Canterbury Regional Council Report R97; Canterbury Regional Council: Canterbury, New Zealand, 1997; 41p.
- Bastin, S.H.; Quigley, M.; Bassett, K. Paleoliquefaction in Christchurch, New Zealand. GSA Bull. 2015, 127, 1348–1365. [Google Scholar] [CrossRef]
- Villamor, P.; Almond, P.; Tuttle, M.P.; Giona-Bucci, M.; Langridge, R.M.; Clark, K.; Ries, W.; Bastin, S.H.; Eger, A.; Vandergoes, M.; et al. Liquefaction Features Produced by the 2010–2011 Canterbury Earthquake Sequence in Southwest Christchurch, New Zealand, and Preliminary Assessment of Paleoliquefaction Features. Bull. Seismol. Soc. Am. 2016, 106, 1747–1771. [Google Scholar] [CrossRef] [Green Version]
- Cazenave, A.; Dieng, H.-B.; Meyssignac, B.; Von Schuckmann, K.; Decharme, B.; Berthier, E. The rate of sea-level rise. Nat. Clim. Chang. 2014, 4, 358–361. [Google Scholar] [CrossRef]
- Woodruff, J.D.; Irish, J.; Camargo, S. Coastal flooding by tropical cyclones and sea-level rise. Nature 2013, 504, 44–52. [Google Scholar] [CrossRef] [Green Version]
- Gerstenberger, M.; McVerry, G.; Rhoades, D.; Stirling, M. Seismic hazard modeling for the recovery of Christchurch. Earthq. Spectra 2014, 30, 17–29. [Google Scholar] [CrossRef]
- Mackey, B.H.; Quigley, M. Strong proximal earthquakes revealed by cosmogenic 3He dating of prehistoric rockfalls, Christchurch, New Zealand. Geology 2014, 42, 975–978. [Google Scholar] [CrossRef] [Green Version]
Figure 1.
Canterbury earthquake sequence (CES) seismicity in the Canterbury region for time slices indicated in (a) to (d) spanning from the Darfield earthquake (3 September 2010 16:35:46 UTC) to 6 December 2017 (23:59 UTC). Locations of the earthquake epicenters and magnitude information were derived from GeoNet Quakesearch in December 2017 (https://quakesearch.geonet.org.nz/) for the spatial domain LAT = −43.4° to −43.7°; LONG = 171.8° to 173° (decimal degrees). The up-dip surface projections of Darfield earthquake blind faults (dashed white lines) are from Beavan et al. [88] and the surface ruptures are from Quigley et al. [89]. The locations of liquefaction (liq) with and without flood-inducing earthquakes (see also Figure 3) are shown with stars. The areas of flooding associated with the expulsion of groundwaters (most commonly associated with liquefaction) are shown in light blue (a,b areas were simplified from Townsend et al. [102] and including the present authors’ reconnaissance field observations; c,d were from reconnaissance field observations by the present authors). Areas of flooding due to partial stream avulsion were associated with fault surface rupture in the Darfield earthquake from Duffy et al. [12].

Figure 2.
(a) CES seismicity for 3 September 2010 (0:00 UTC) to 6 December 2017 (23:59 UTC) derived from GeoNet Quakesearch in December 2017 (https://quakesearch.geonet.org.nz/) for the spatial domain LAT = −43.4° to −43.7°; LONG = 171.8° to 173° (decimal degrees). Earthquake frequency-magnitude described by Log(N) earthquakes (y-axis) with ML ≥ associated ML values on the x-axis. The Gutenberg–Richter (G-R) least-squares fit to earthquakes yielded b = 1 for the 3.8 ≤ ML ≤ 6.0 range. The numbers of earthquakes in the CES region were 3492 ML ≥ 3, 344 ML ≥ 4, 31 ML ≥ 5, 3 ML ≥ 6, 1 ML ≥ 7. (b) The number of ML ≥ 3 earthquakes per month (y-axis) vs. months (mo.) since the Darfield earthquake (“months since mainshock”). Month 1 = Sept 4 to 30th 2010. The three-month running average of monthly earthquake rate shows a decline from the peak rate following the Darfield earthquake (>1000 earthquakes per mo.) to <10 earthquakes per mo. by July–September 2012. The 14 February 2016 Mw 5.7 earthquake was associated with a spike (>30 earthquakes per mo.) set amongst a continuing decline. Months with significant earthquake-induced flood events are shown with black stars and months with significant meteorologically-triggered flood events are shown with open stars.

Figure 3.
Earthquakes in the Christchurch region from the Darfield earthquake (2010) to 2016 that produced liquefaction, lateral spreading, flooding, and damage to infrastructure.
Figure 3.
Earthquakes in the Christchurch region from the Darfield earthquake (2010) to 2016 that produced liquefaction, lateral spreading, flooding, and damage to infrastructure.

Figure 4.
(a) Partial avulsion of the Hororata River resulting from a surface rupture on the Greendale Fault (dashed white line) in the Darfield earthquake. View is toward the southeast. The image location corresponds to the dark blue zone (“areas with avulsion-induced flooding”) in Figure 1a. Flooding occurred largely on the downthrown (northeast) side of the Greendale Fault and avulsion flood waters re-occupied paleochannels downstream. Image date was 13 September 2010 (9 days after the Darfield earthquake). The figure was sourced from Quigley et al. [15]. (b) Groundwater expulsion flooding along the western margin of the Port Hills due to the strong ground shaking of sediments with shallow water tables, probably accompanied by liquefaction, and probably associated with shaking amplification due to the shallowing depth of basalt bedrock toward the flanks of the Port Hills. The presence of loessic silt in sediment underlying this area may have reduced the sediment permeability and water reabsorption into the subsurface.

Figure 5.
(a) Flooding related to the liquefaction and groundwater expulsion in eastern Christchurch after the Darfield 2010 Mw 7.1 earthquake and (b) in eastern Christchurch after the June 2011 Mw 6.0 earthquake. (c) Flooding related to liquefaction, groundwater expulsion, surface subsidence, and downstream uplift in eastern Christchurch after the February 2011 Mw 6.2 earthquake. The figure was sourced from Quigley et al. [15]. (d) Flooding related to lateral-spreading, floodplain surface subsidence, and decreased Avon River channel volumes in eastern Christchurch in 2012. The figure was sourced from Quigley et al. [15]. (e) Flooding related to the March 2014 meteorological flood event in the Flockton Basin (see Figure 7 for the location of Flockton Basin). The flooding was affected by CES-induced surface subsidence and decreased drainage infrastructure effectiveness. (f) Flooding related to the March 2014 meteorological flood event along Heathcote River. The flooding was affected by CES liquefaction, groundwater expulsion, surface subsidence, channel area changes, and downstream uplift caused by the February 2011 Mw 6.2 earthquake. Figure 5f is courtesy of The Press, Christchurch.

Figure 6.
(a–g) Distinct episodes of recurrent liquefaction at a single site induced by CES earthquakes. The figure was sourced from Quigley et al. [33]. The timing of the photographs with respect to each earthquake is shown. (h) Cumulative land subsidence of ≈45 cm induced by recurrent liquefaction relative to a vertically-fixed artesian water pipe fixed into sediment below the liquefiable layer; the white stain and rust-coated pipe segment were below the ground surface prior to the 2010 Mw 7.1 Darfield earthquake.

Figure 7.
Vertical tectonic displacements during the Canterbury earthquake sequence and in relation to major rivers. AHE—Avon-Heathcote Estuary, CCF—Charing Cross fault, GF—Greendale fault, GFE—Greendale fault east segment, GFW—Greendale fault west segment, HAF—Hororata Anticline Fault. (a) Shaded relief map of cumulative vertical displacements during the CES summarized using data from [88] showing regions of uplift and subsidence. (b) Detail of the GFW and HAF, showing the Hororata River’s position on the proximal footwall of the GFW and the extent of coseismic flooding. The colored reaches relate to the downstream profile of elevation changes shown in panel (d). Increasing downstream uplift shallowed the gradient, and increasing downstream subsidence steepened it. (c) Detail of the Christchurch area, showing the Avon and Heathcote Rivers crossing the uplift as they flow toward the estuary. (d) Hororata River stream profile post-Darfield earthquake. (e) Avon River stream profile post CES.

Figure 8.
(a–d) Differential LiDAR models illustrating total vertical ground movements (ΔETot) in Christchurch through the Canterbury earthquake sequence. (A) Vertical movements from 2003 to 5 September 2010, encapsulating movements from 4 September 2010. (B) Vertical movements from 2003 to May 2011, encapsulating movements from 22 February 2011. (C) Vertical movements from 2003 to September 2011, encapsulating movements from 13 June 2011. (D) Vertical movements from 2003 to February 2012, encapsulating movements from 23 December 2011. The linear artefacts evident in (a)–(d) were due to minor elevation errors along the LiDAR flight lines. The figure was sourced from Quigley et al. [15].

Figure 9.
(A) Measured permanent lateral spreading displacements in South Kaiapoi (blue) and North Kaiapoi (red) after the 2010 Darfield earthquake. The figure was sourced from Cubrinovski et al. [121]. (B) Cumulative liquefaction-induced horizontal displacements integrated over the CES plotted for different liquefaction land damage states. The figure was sourced from Rathje et al. [109].

Figure 10.
Main map: Cumulative horizontal movements (∆XLiq) in Christchurch in the vicinity of the Avon River from September 2010 to 13 June 2011, derived from LiDAR offset analysis [88]. Also shown: Increased 1-in-100-year storm event (1% annual exceedance probability (AEP)) flood depths (∆F) due to subsidence caused by the Canterbury earthquake sequence using current sea level, rainfall, and urban extent. The Christchurch central business district (CBD) is shown, as is the Dudley Creek/Flockton Basin area where recent flooding of residential properties had been problematic. Inset panels: Floodplain and river cross-sections (i–v) obtained from field surveys and LiDAR analyses, with elevation (E) changes shown as the relative level in meters (m RL) from 2008 (solid gray lines) to September 2011 (black lines). Transect distance (D) is in meters (m). The locations of stopbanks (SB) constructed after the 22 February 2011 Christchurch earthquake are shown in green. The figure was sourced from Hughes et al. [14].

Figure 11.
(a) Geometric mean peak ground acceleration (PGA) vs. Mw for CES earthquakes with the largest recorded PGAs at selected strong ground motion seismometer stations where proximal (i.e., ≤3 km distance) earthquake-induced liquefaction with or without groundwater-expulsion flooding was observed. Threshold boundaries for liquefaction plus flooding (1) and liquefaction only (2) were approximated from observational data points. (b) Christchurch seismic hazard curve from Bradley [92] showing the geometric mean PGA field required for liquefaction plus flooding (expanded to 0.15 to 0.3 g) intersecting the hazard curve at return periods of ≈100 to ≈475 years. NNBS—North New Brighton School, NBLC—New Brighton Library, CBGS—Christchurch Botanic Gardens, LINC—Lincoln School, PRPC—Pages Road Pumping Station, SHLC—Shirley Library.


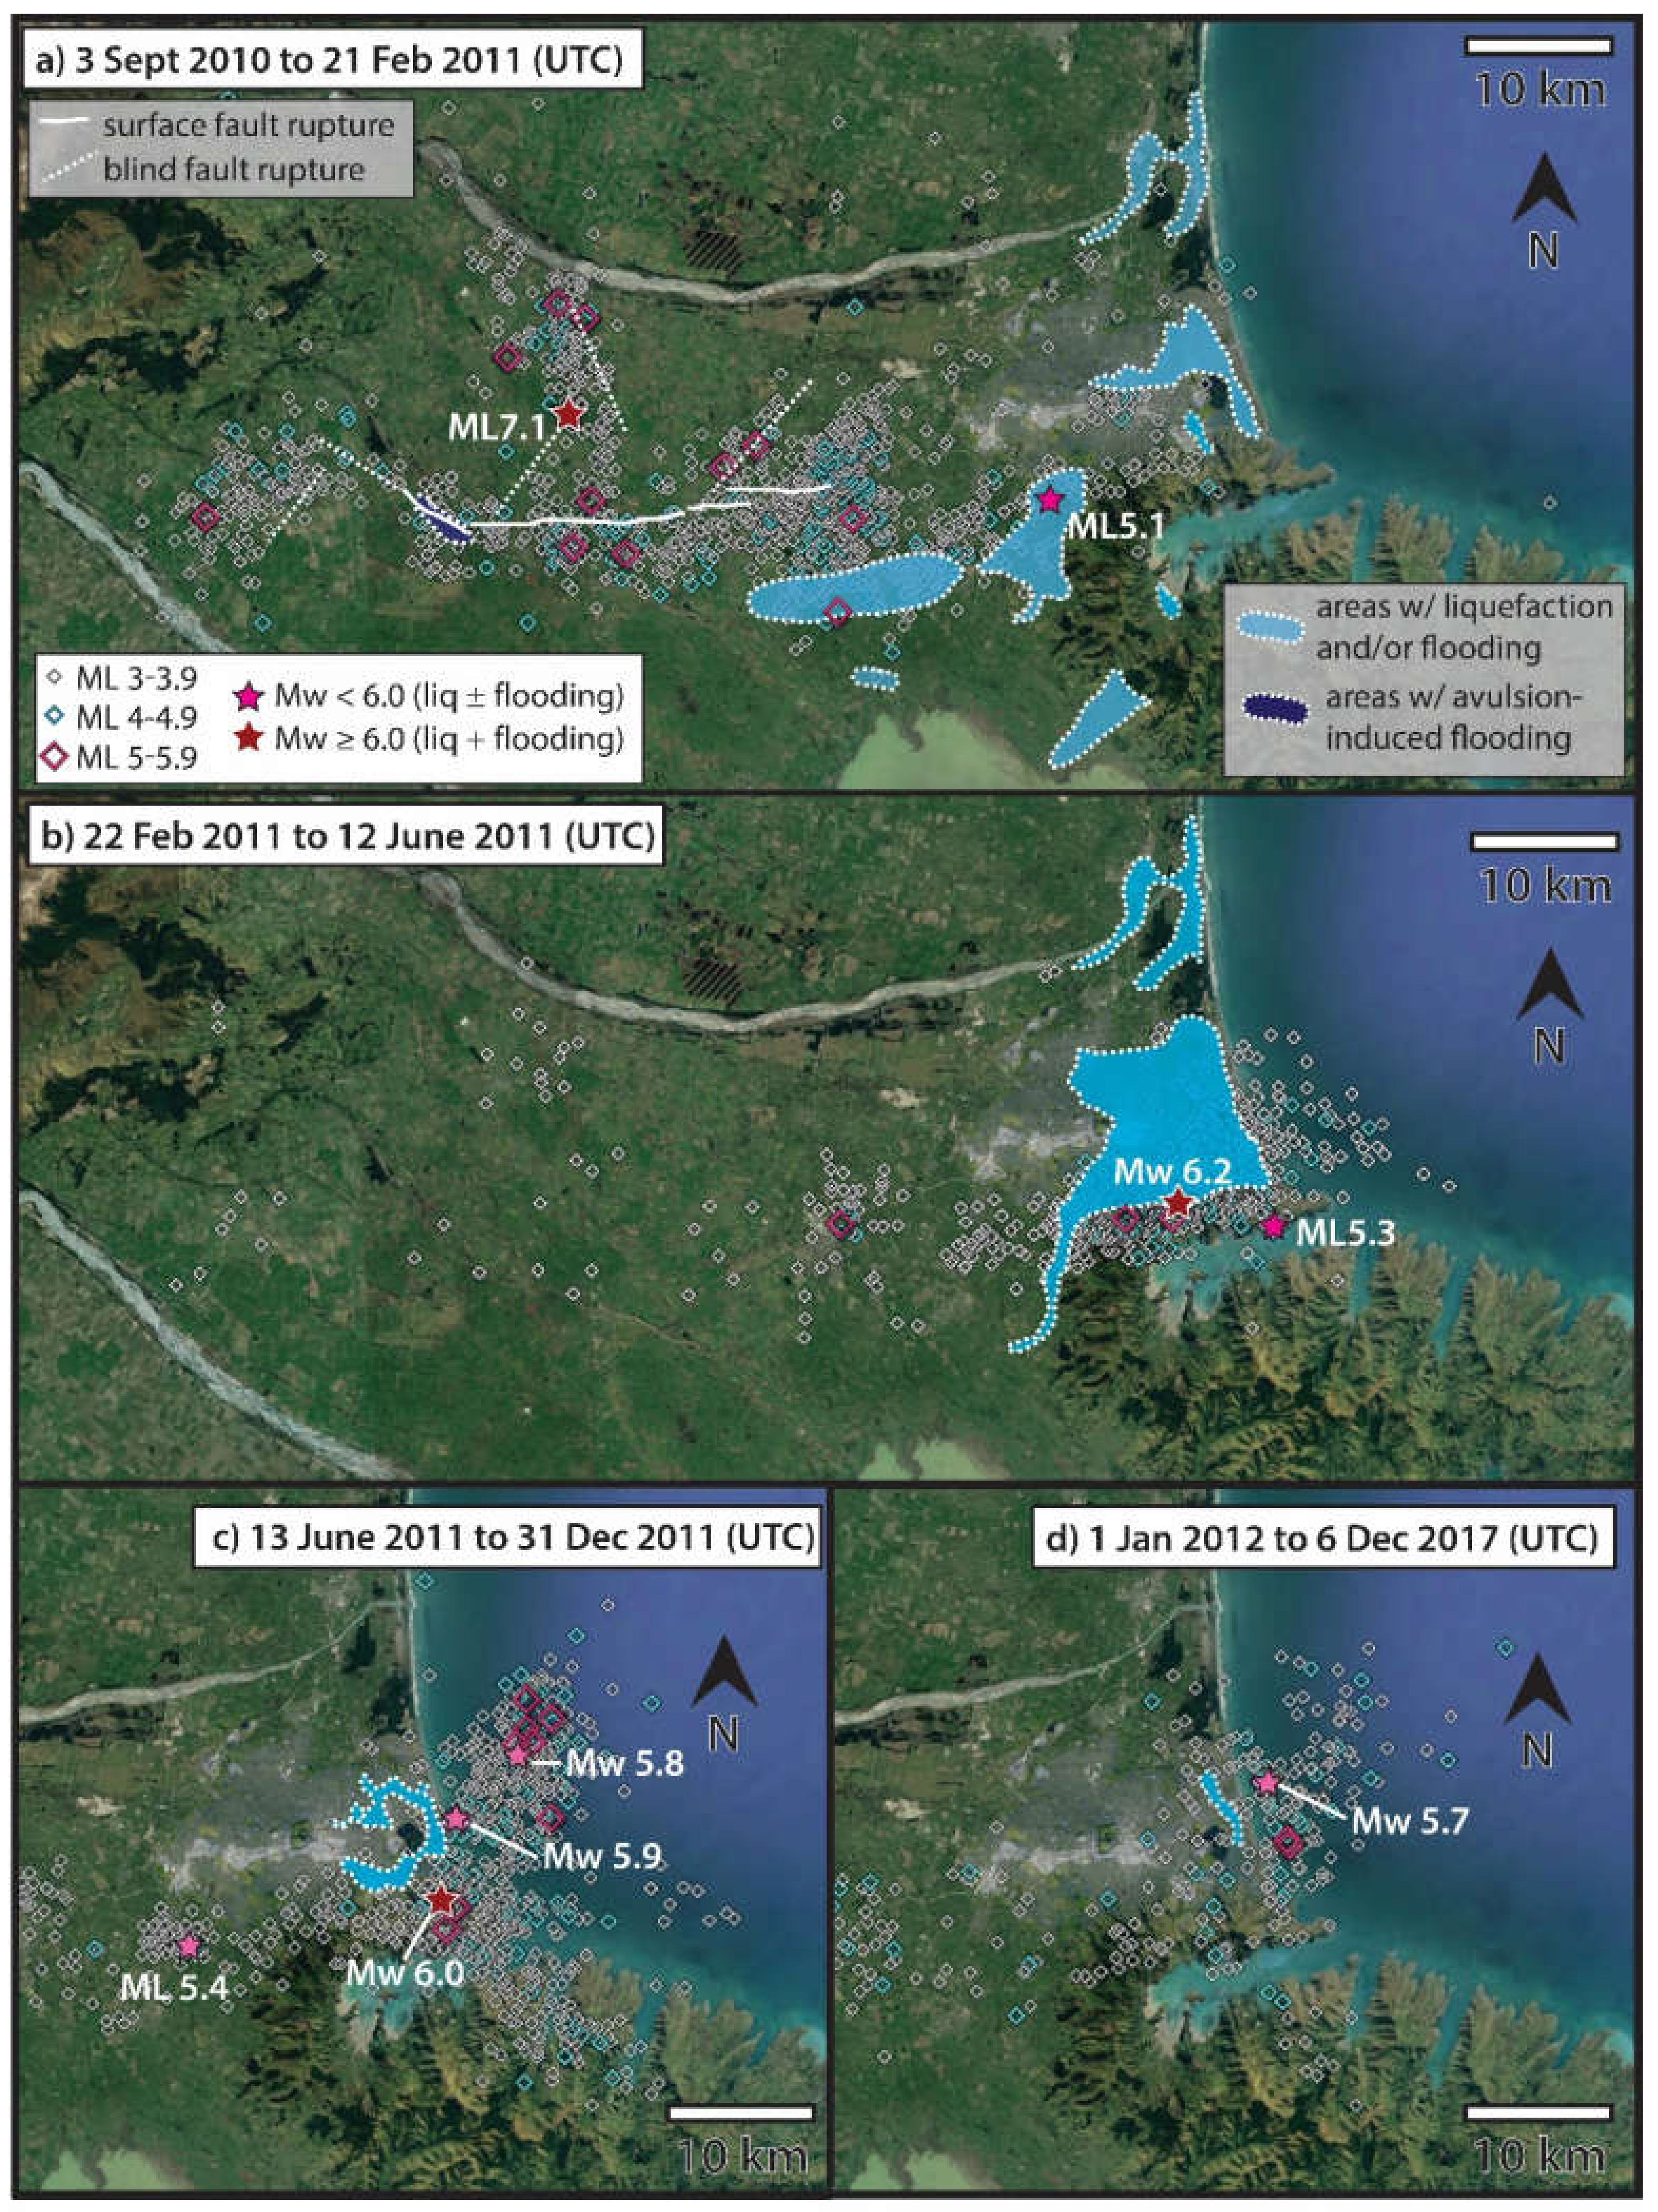
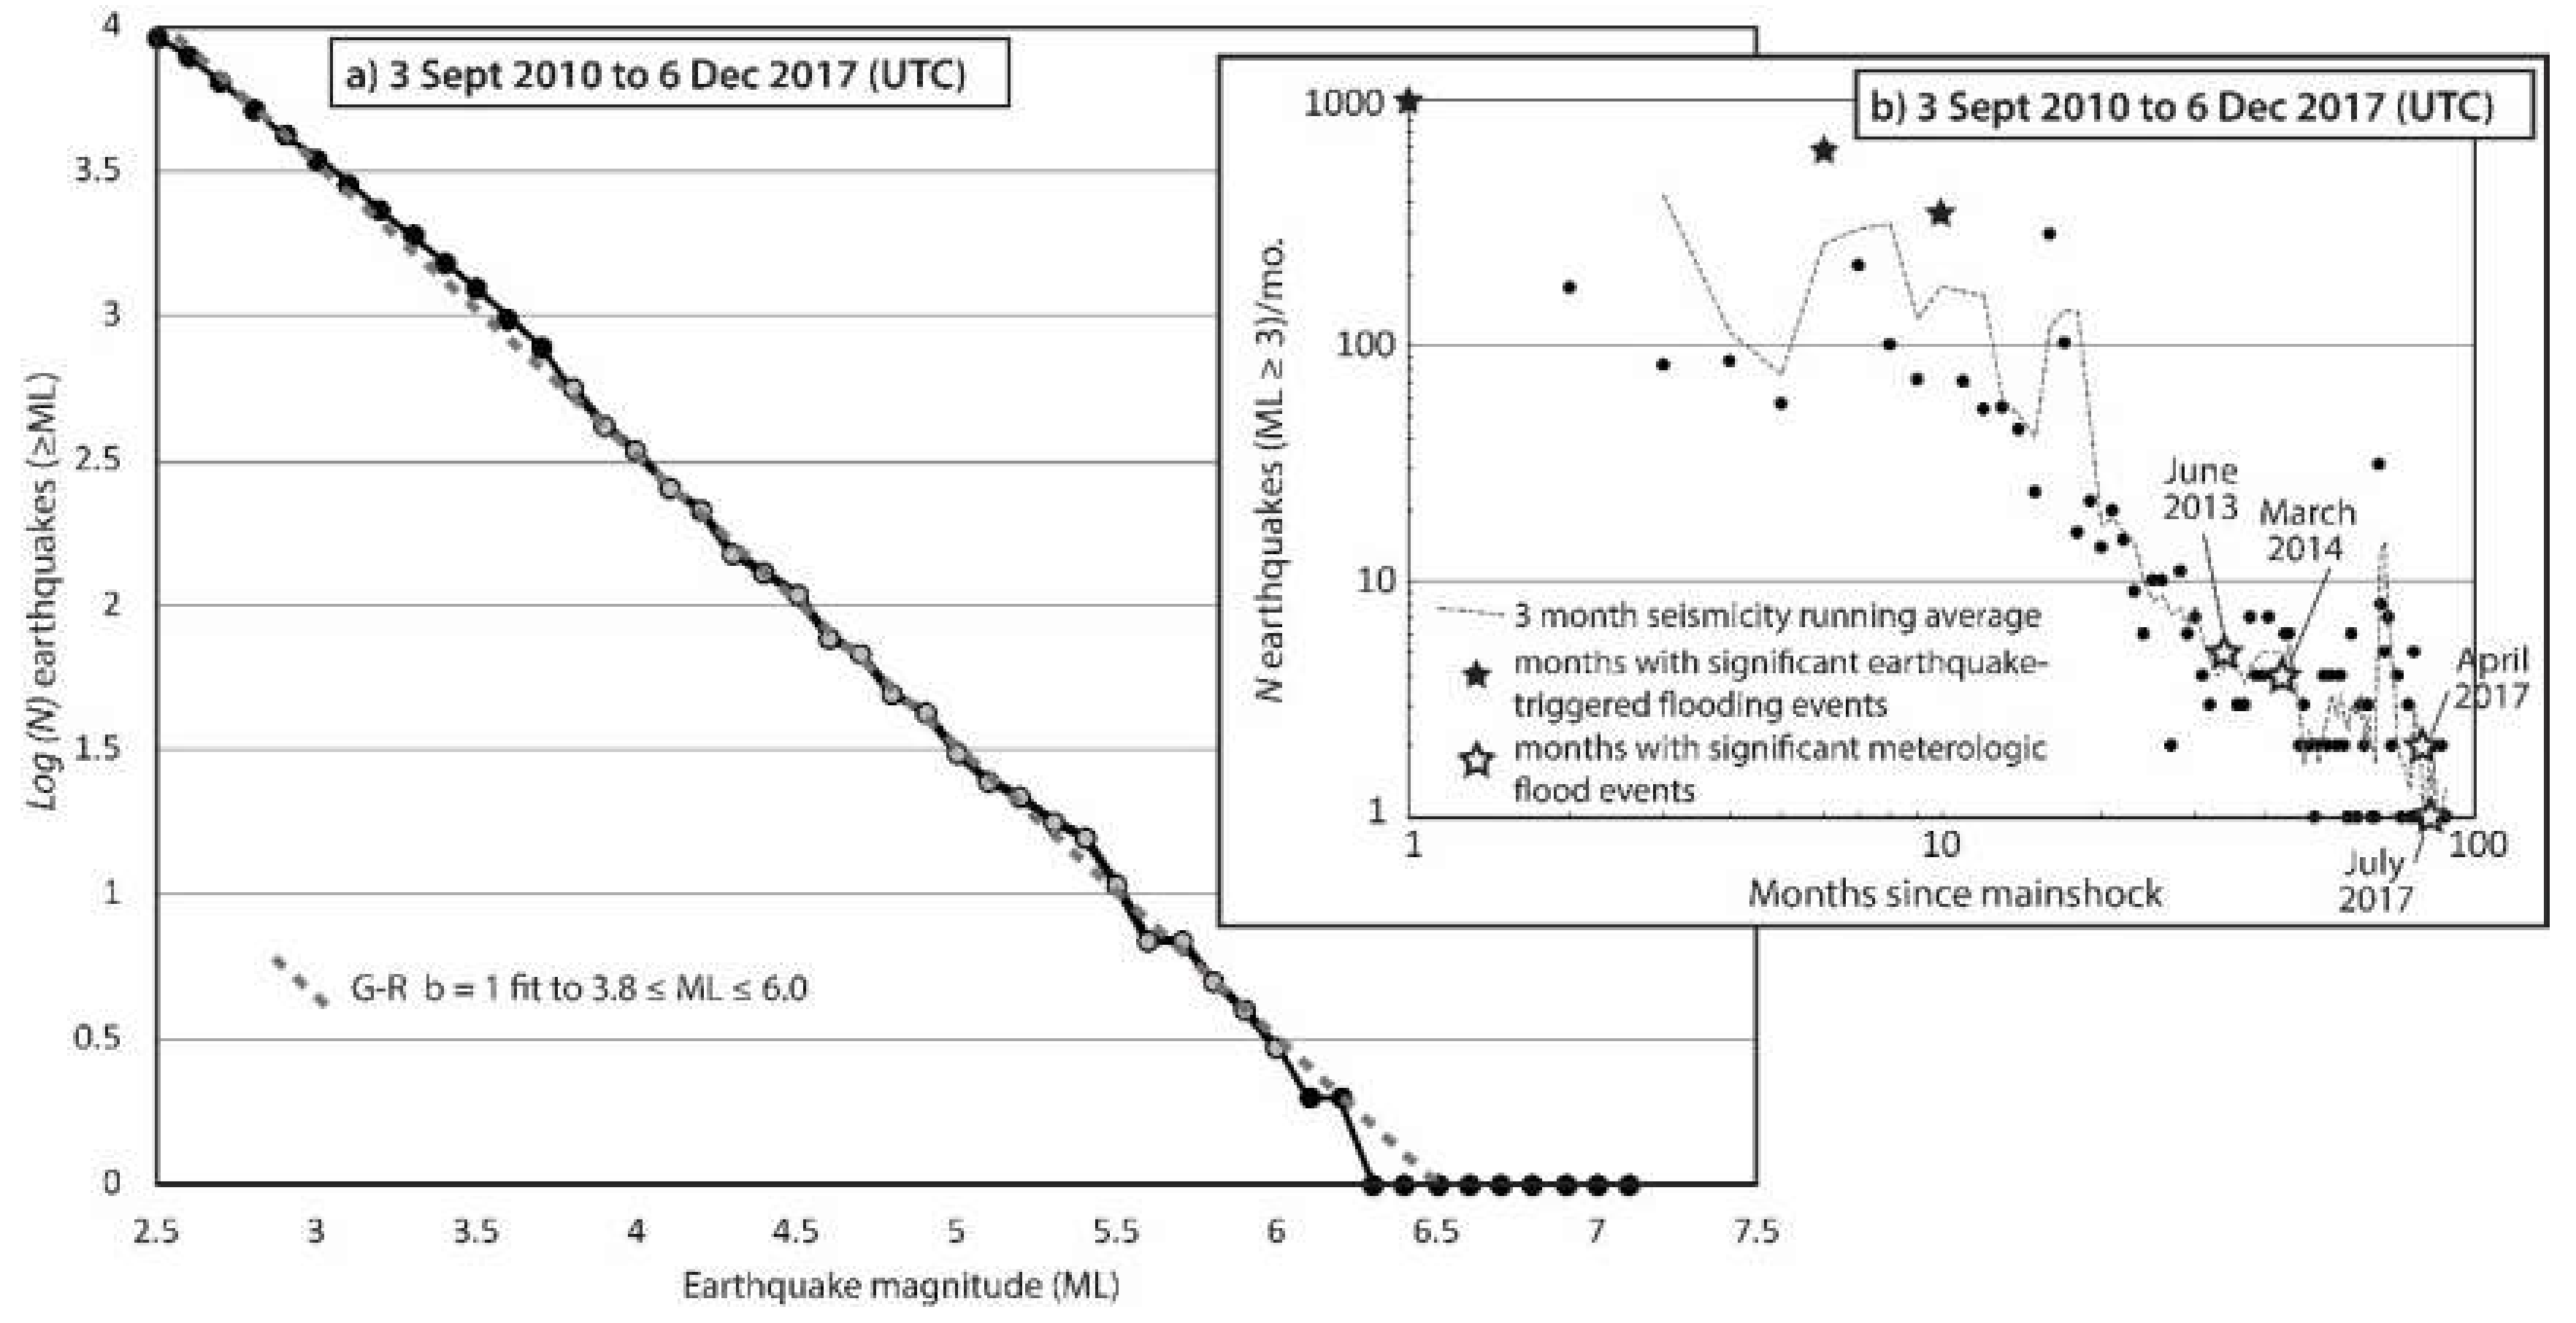
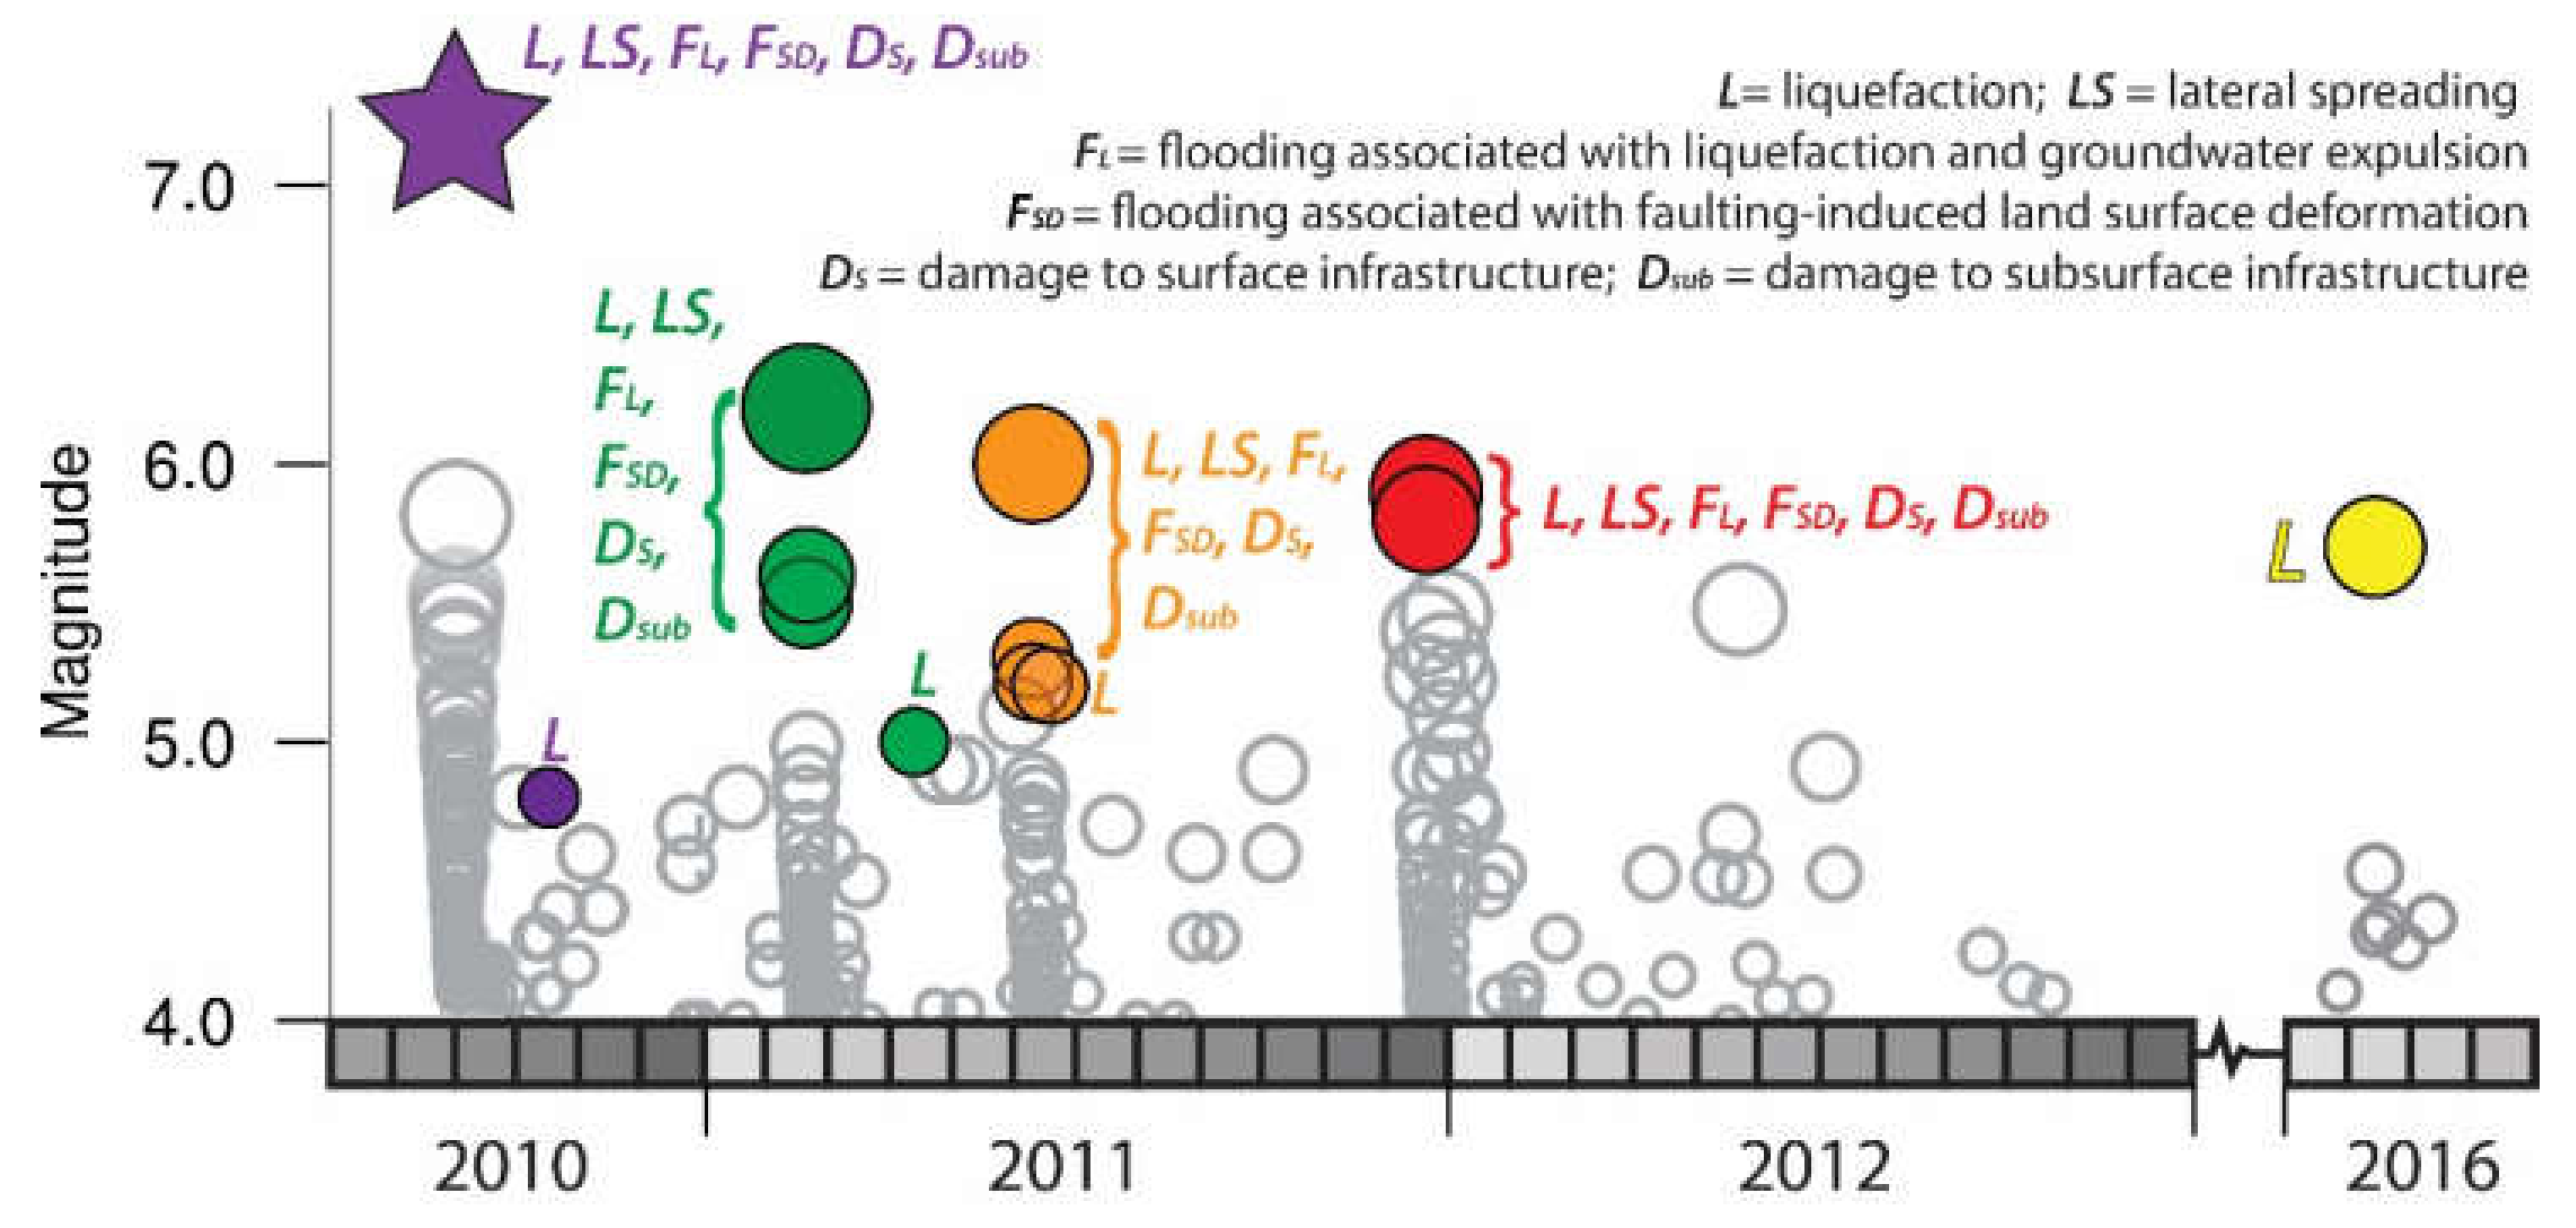
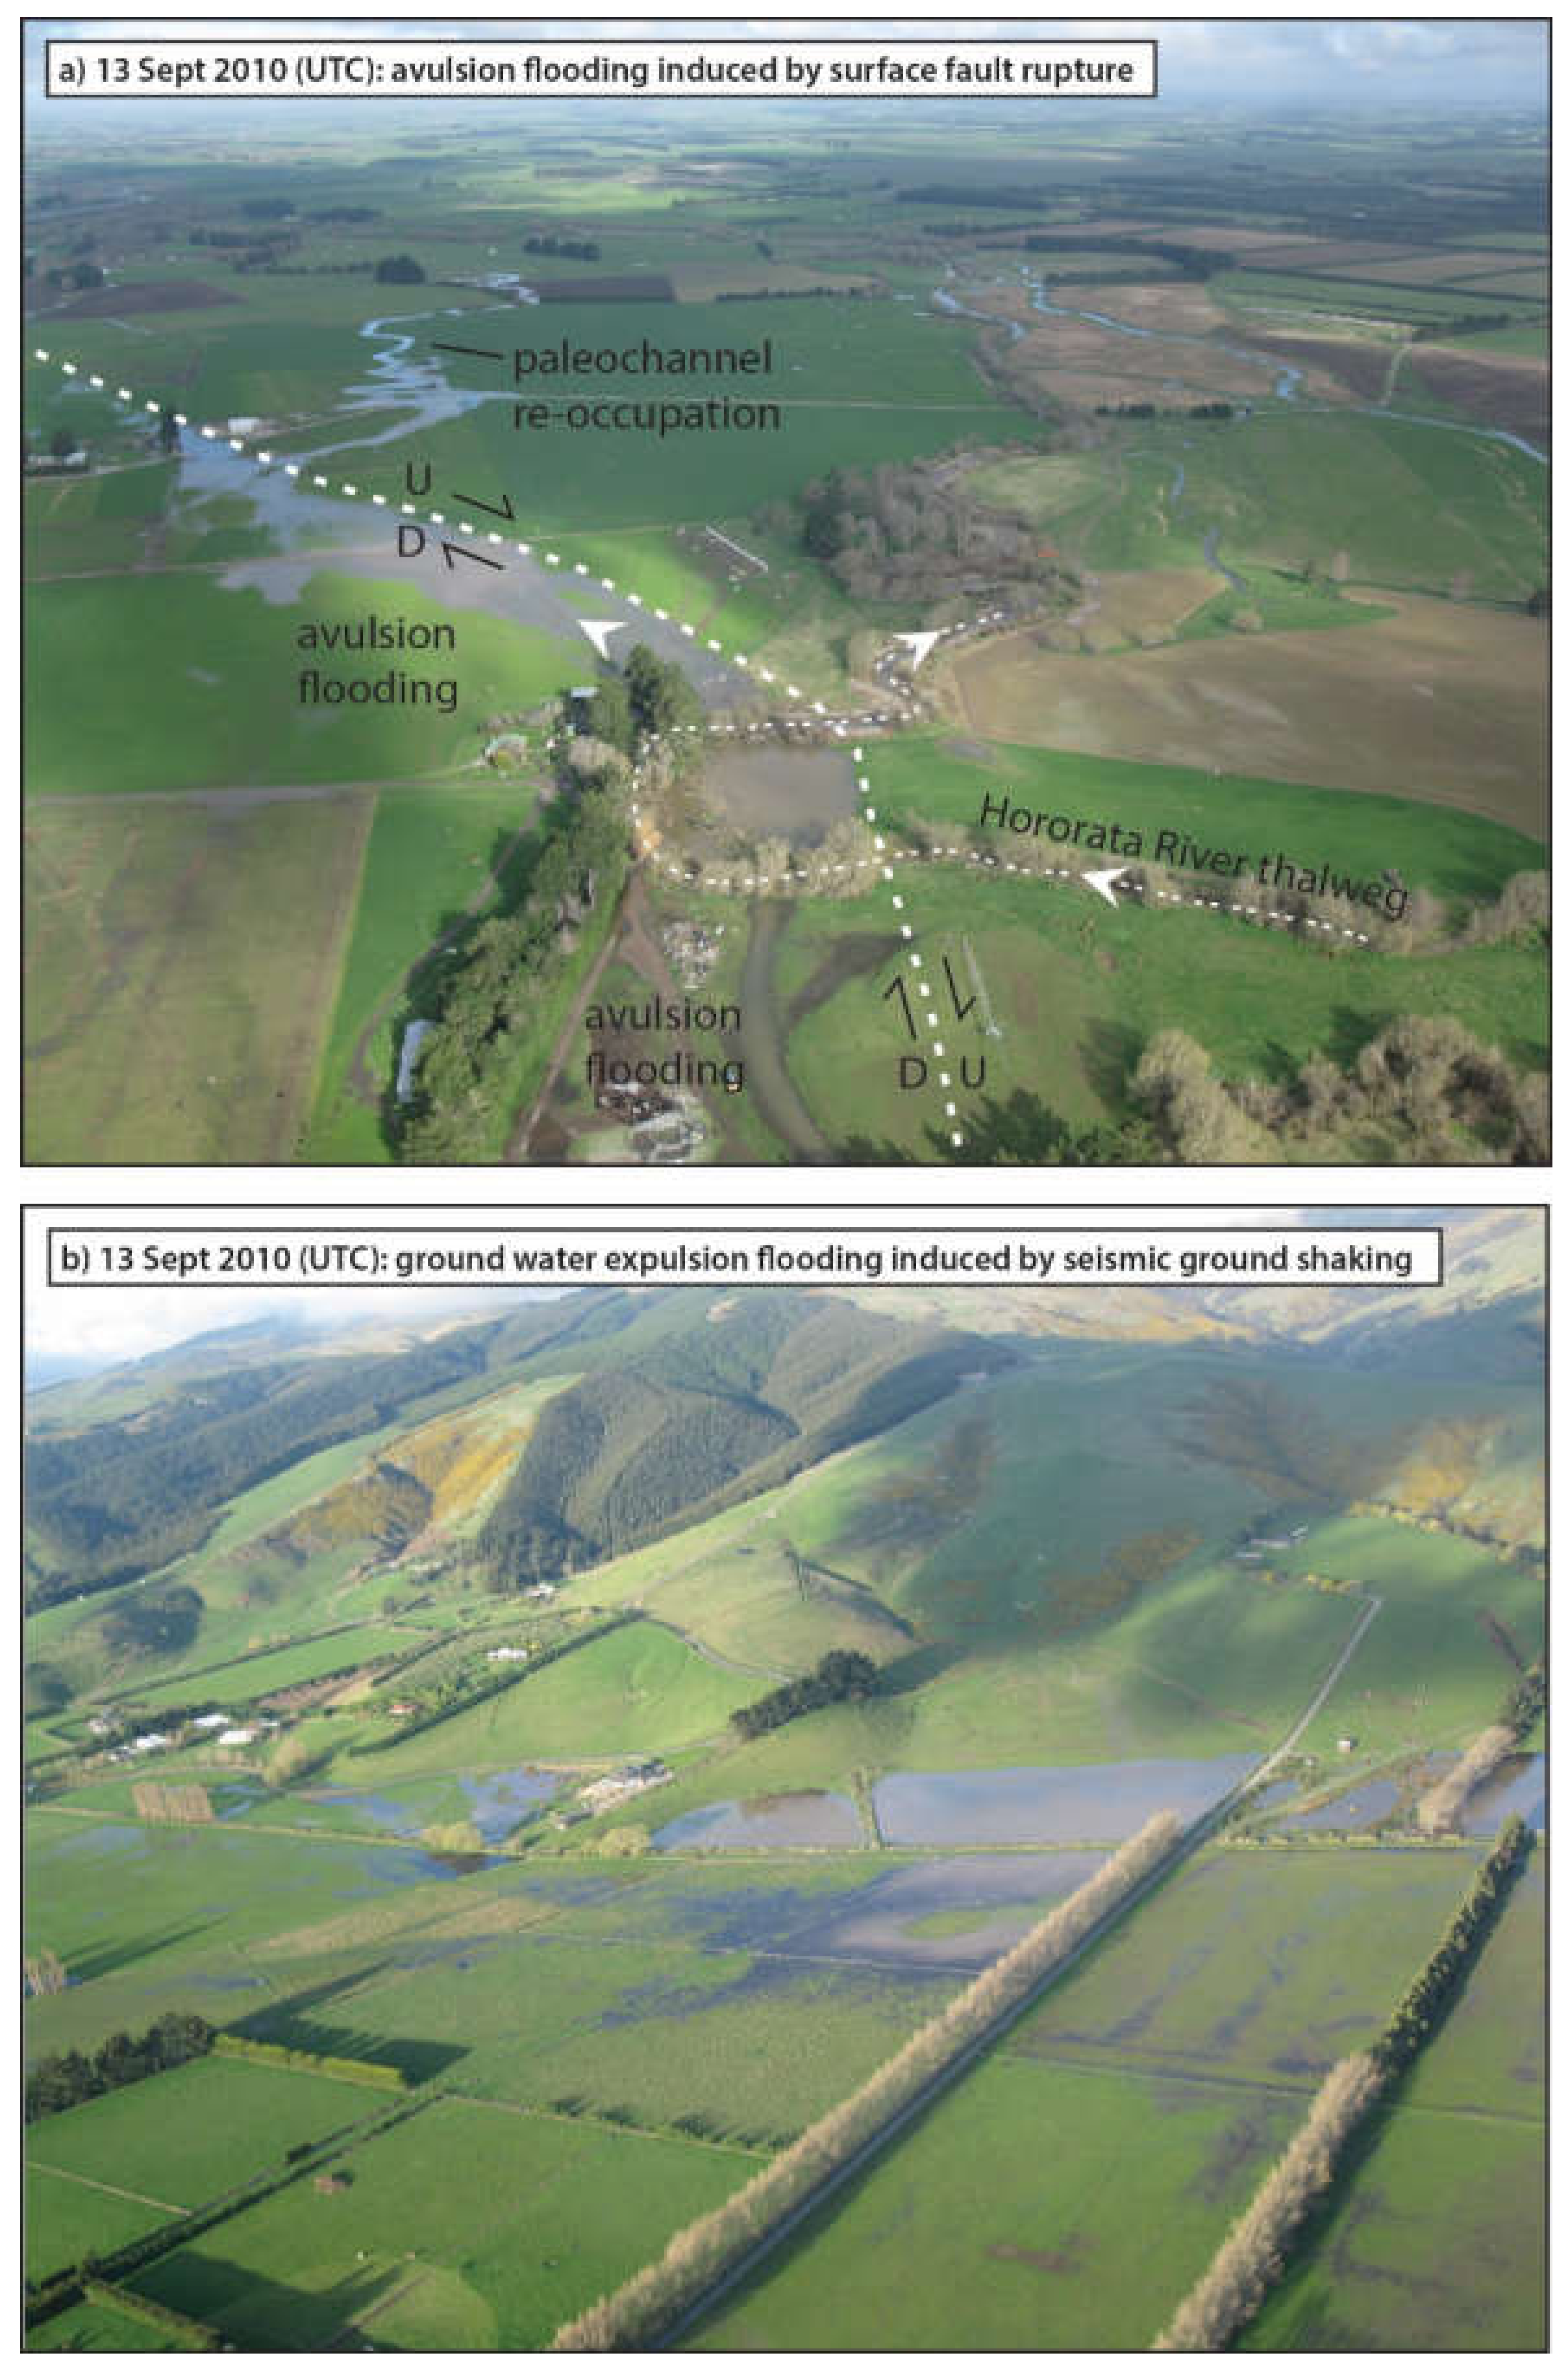
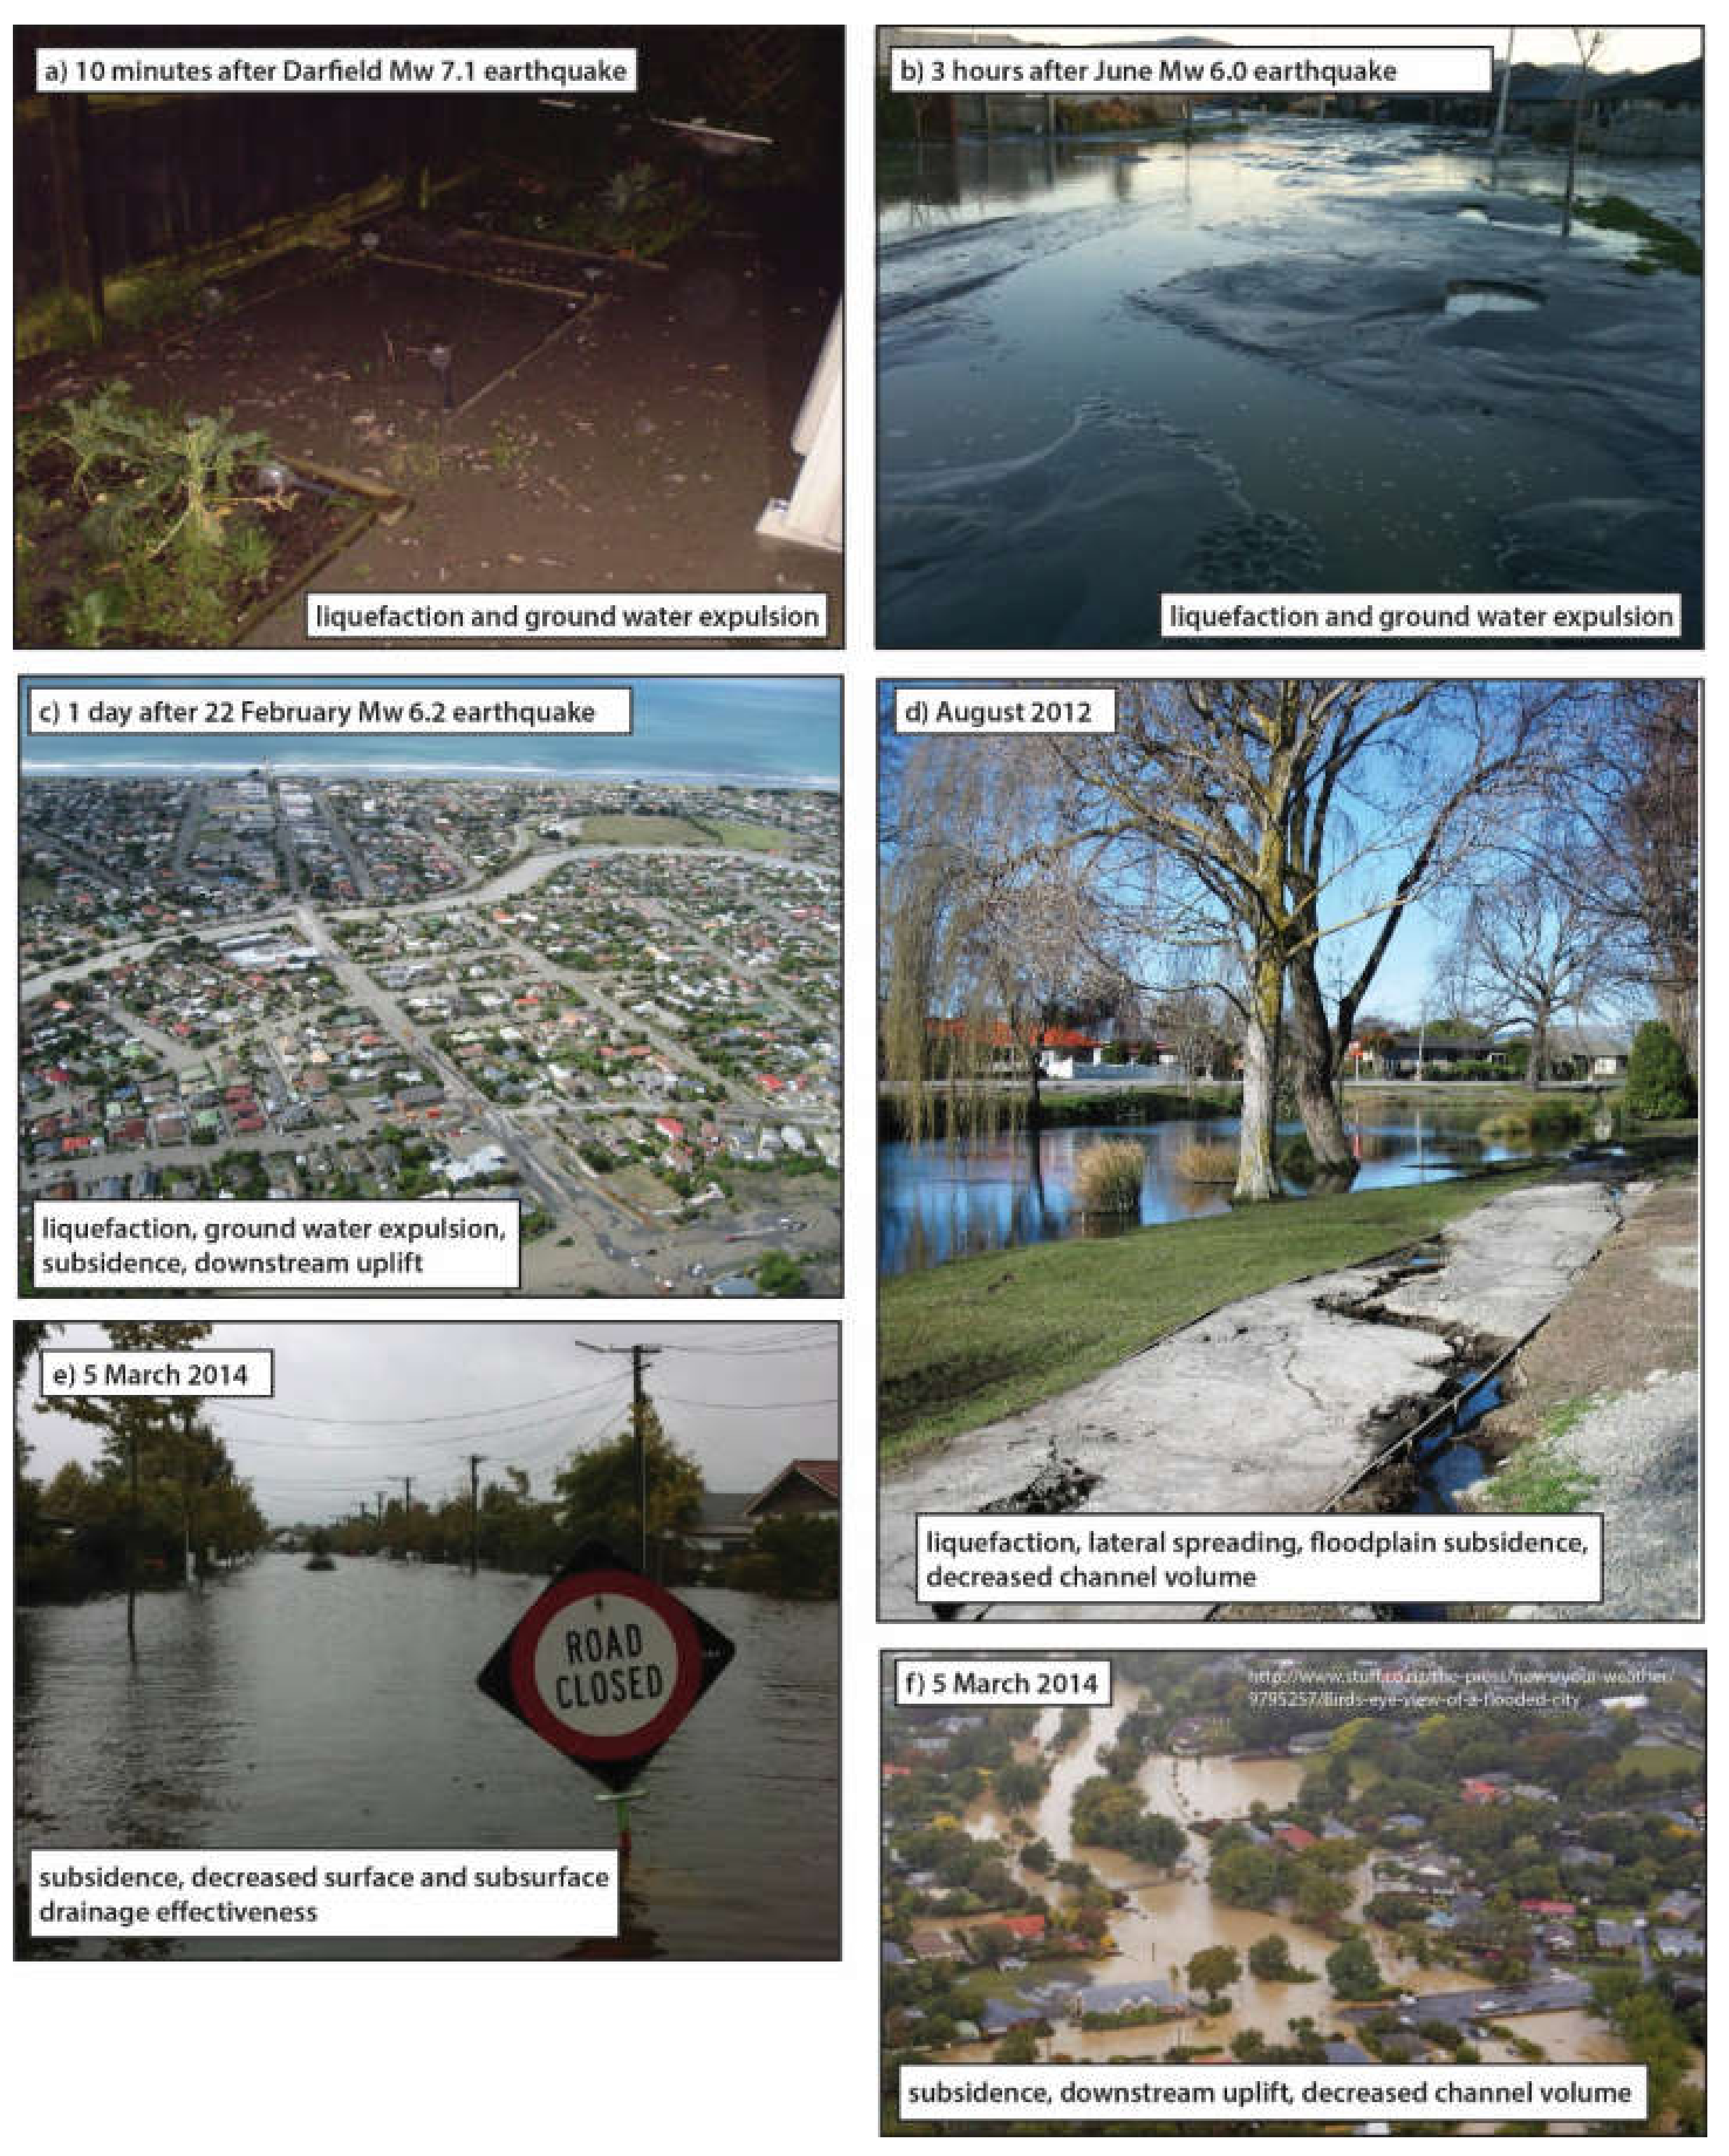
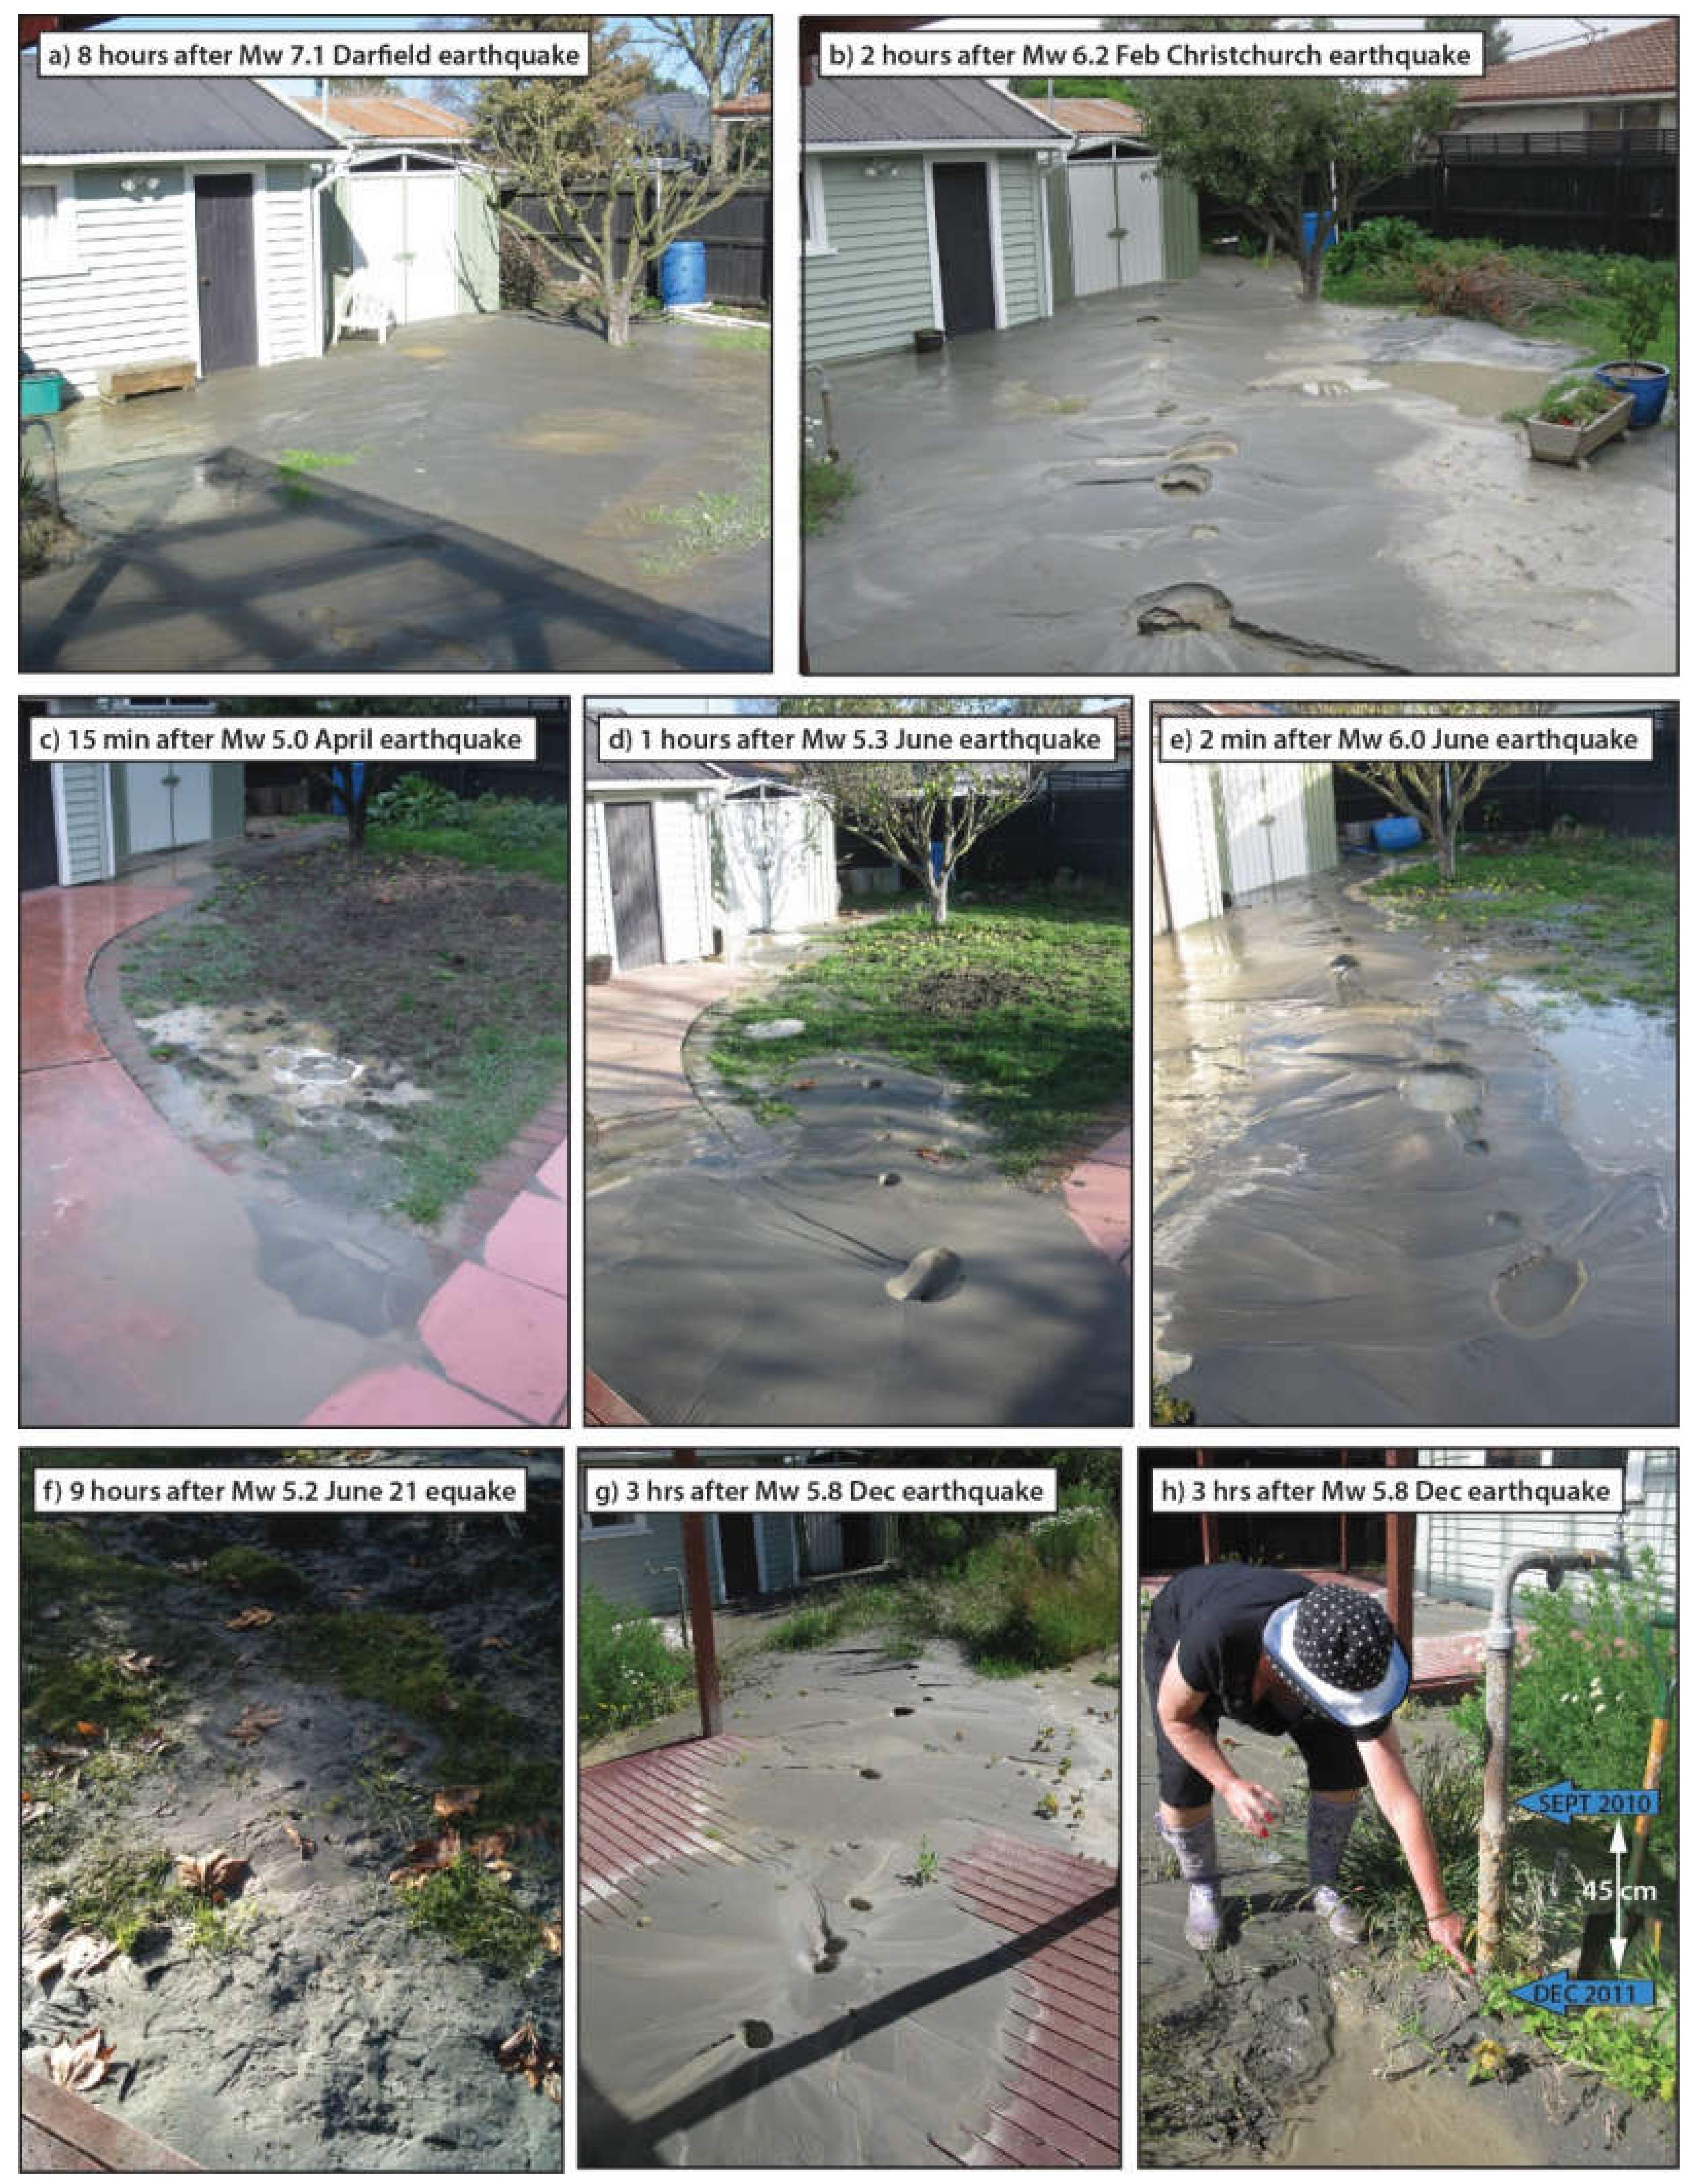
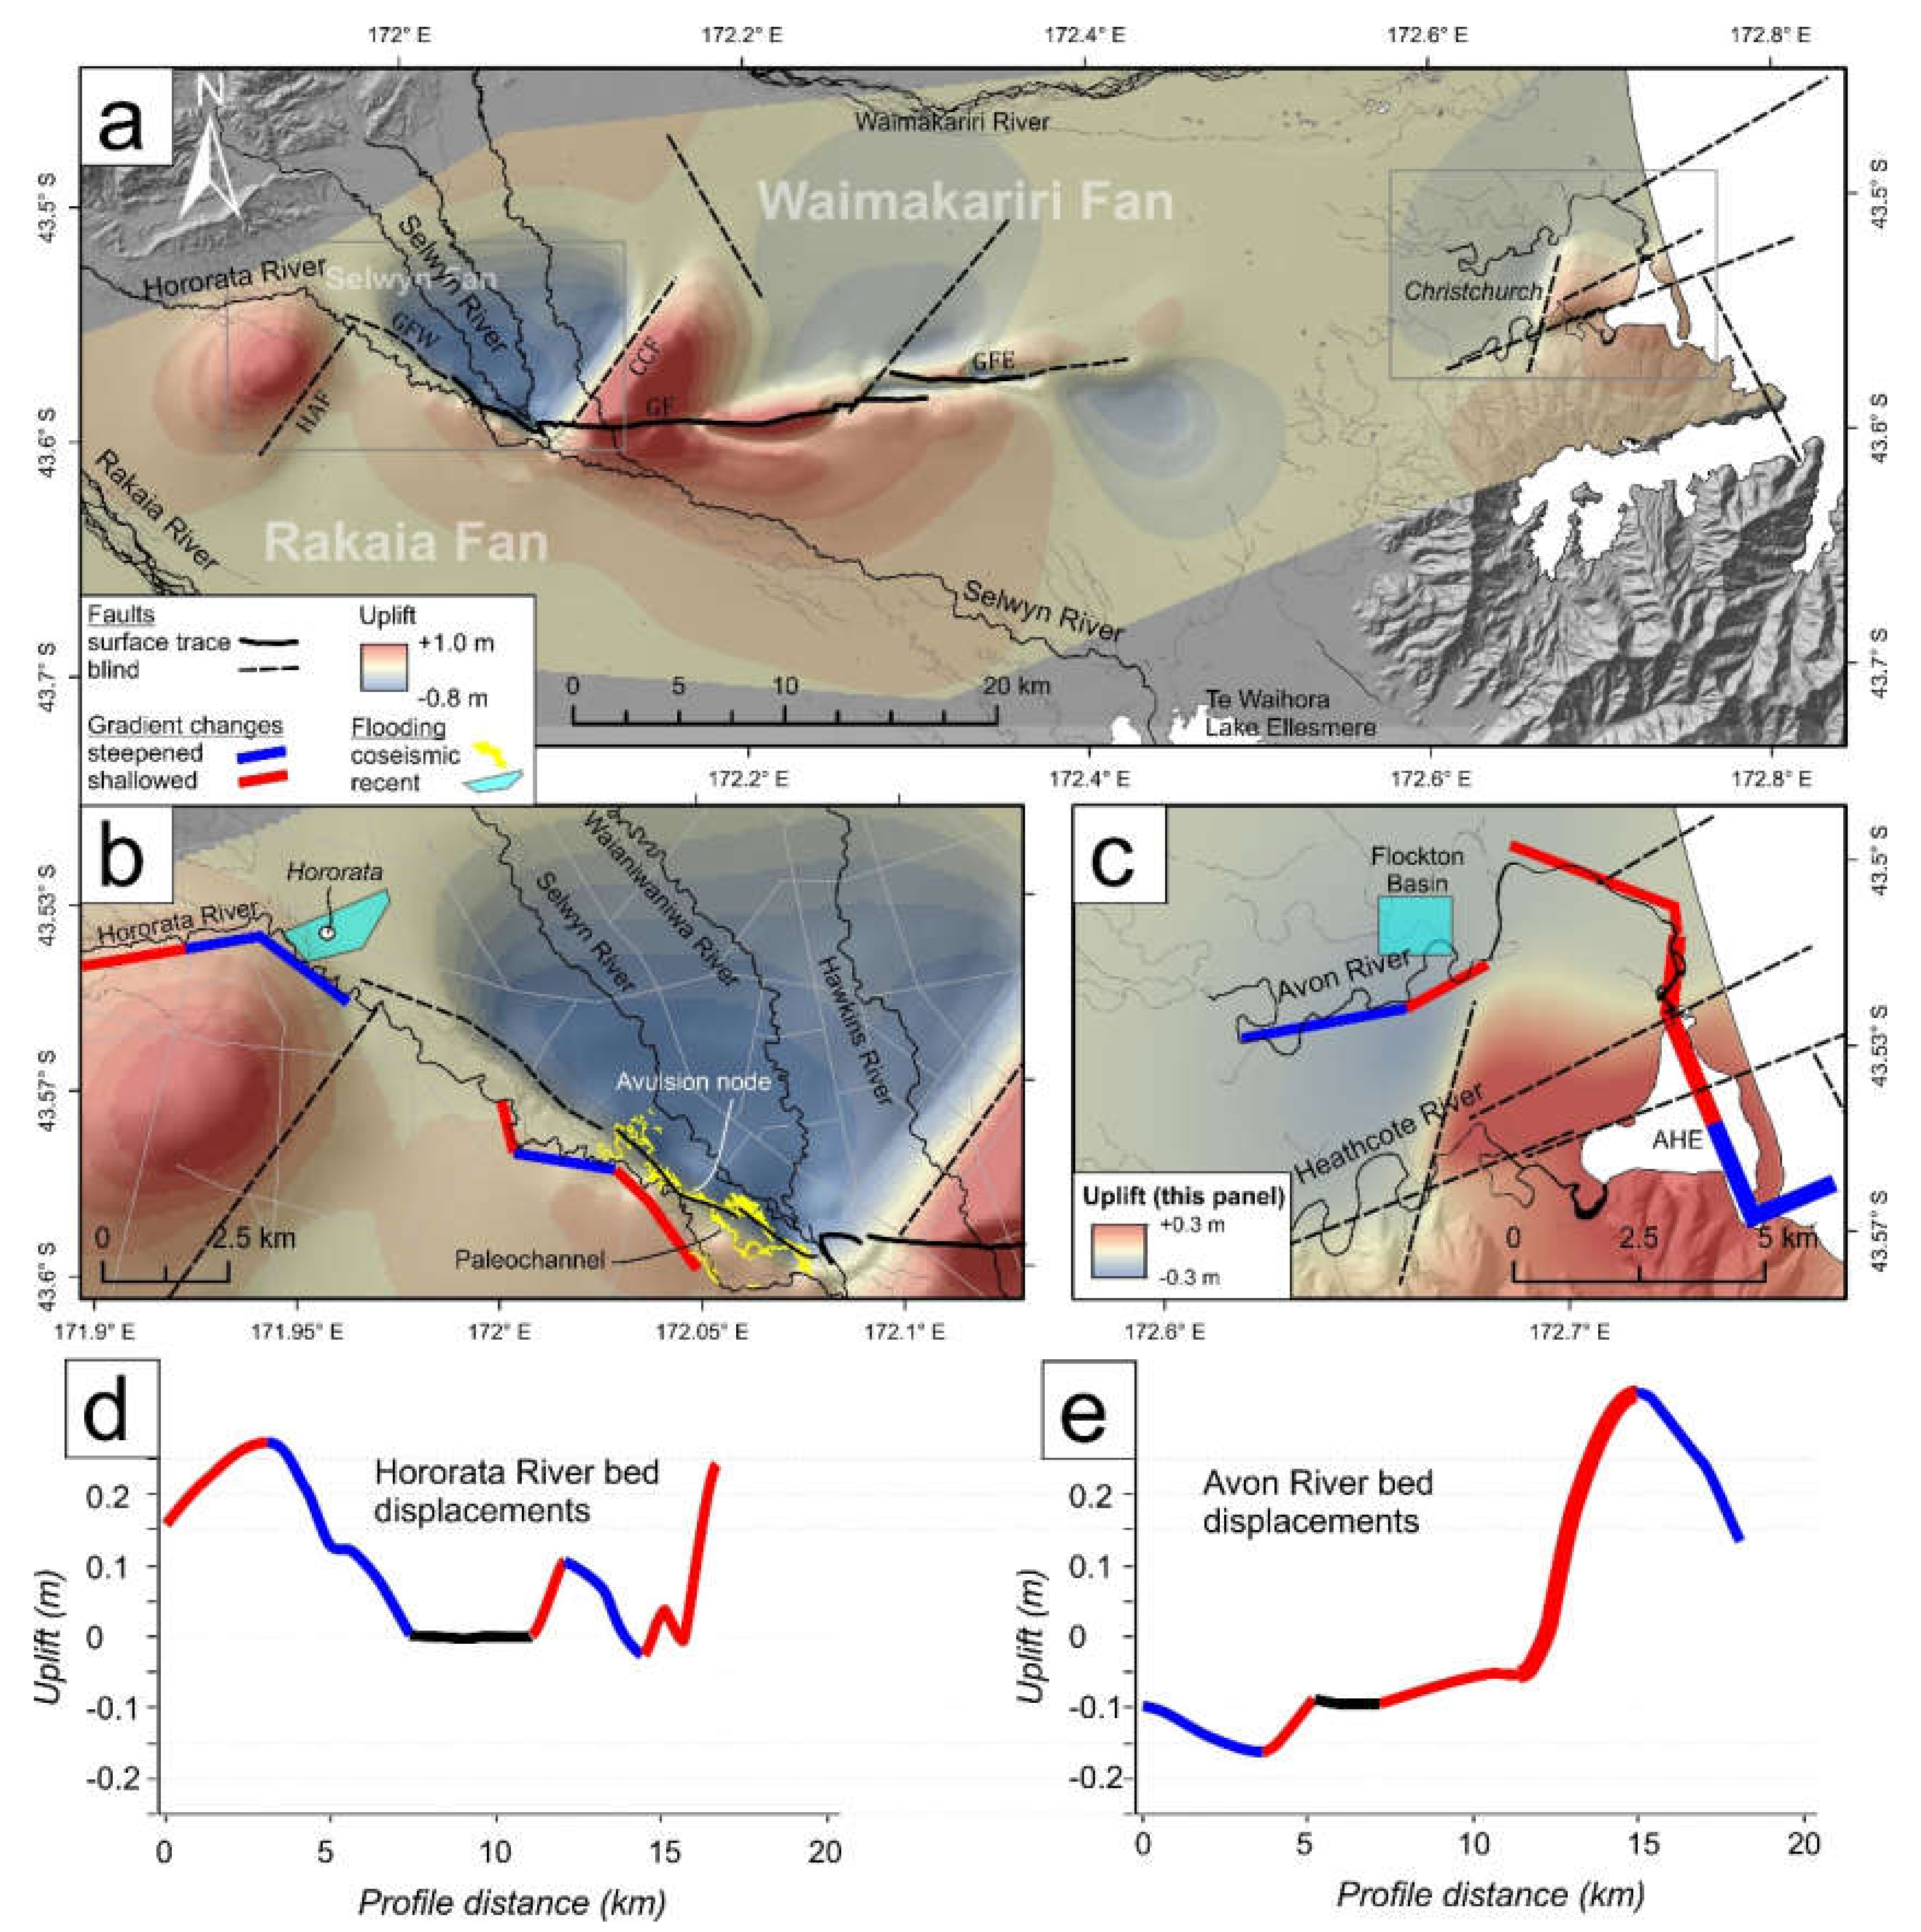
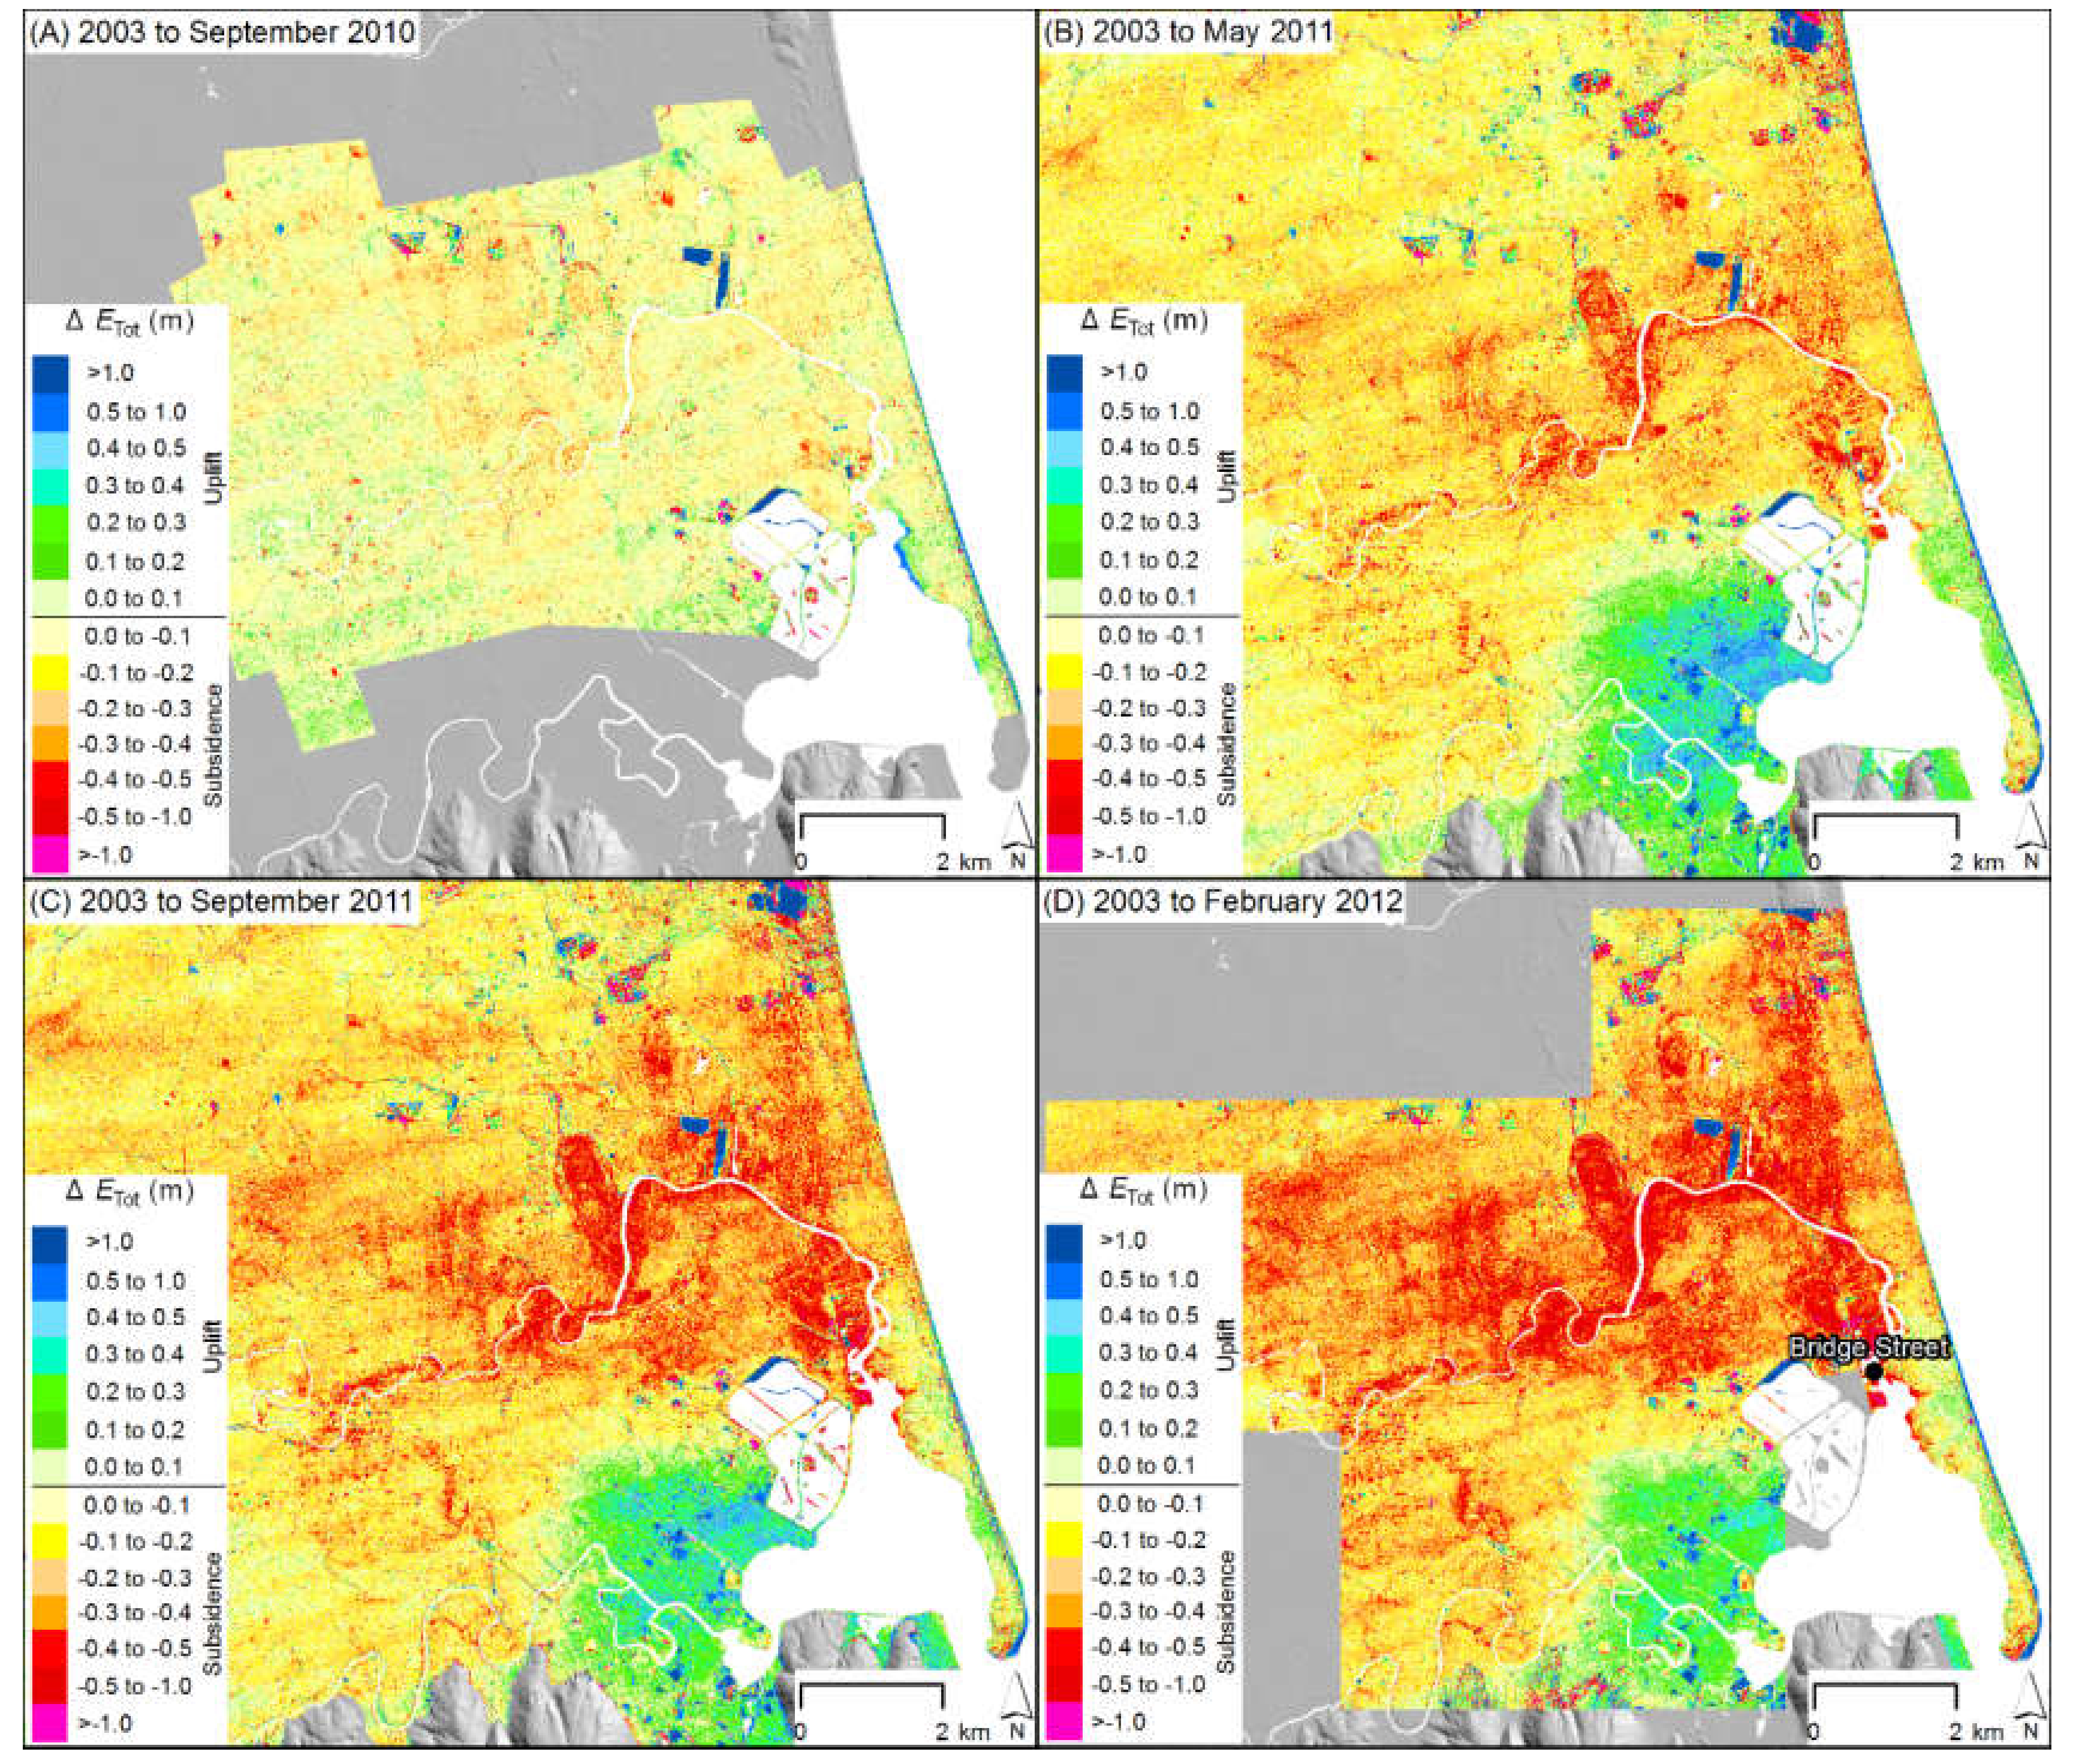
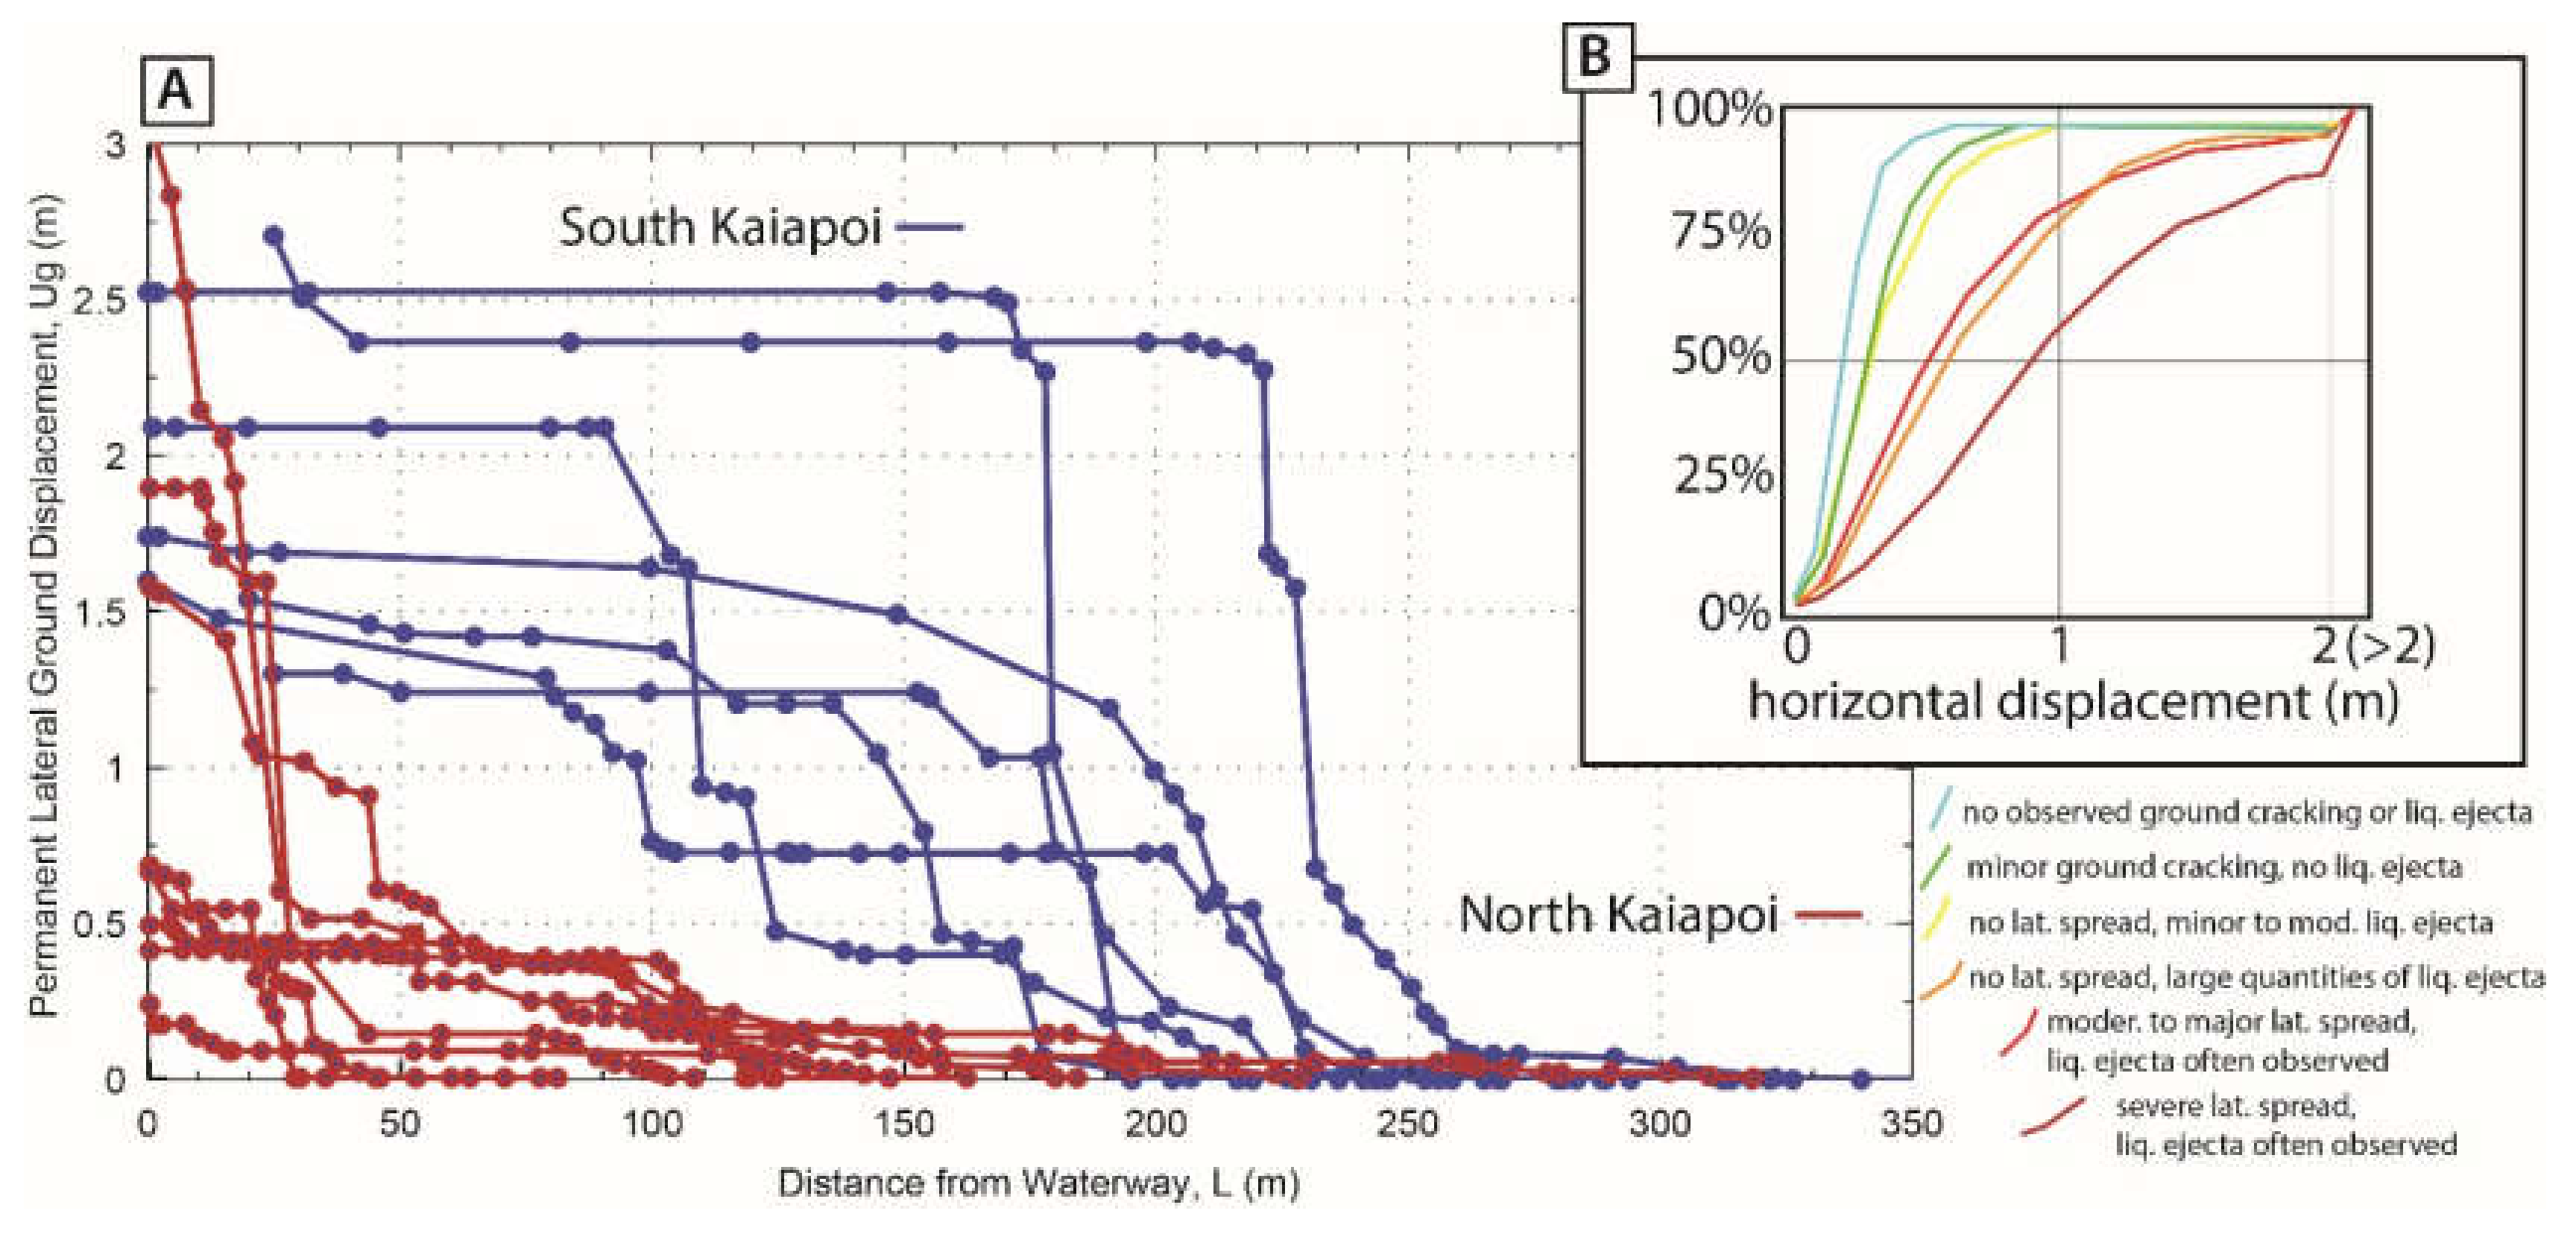
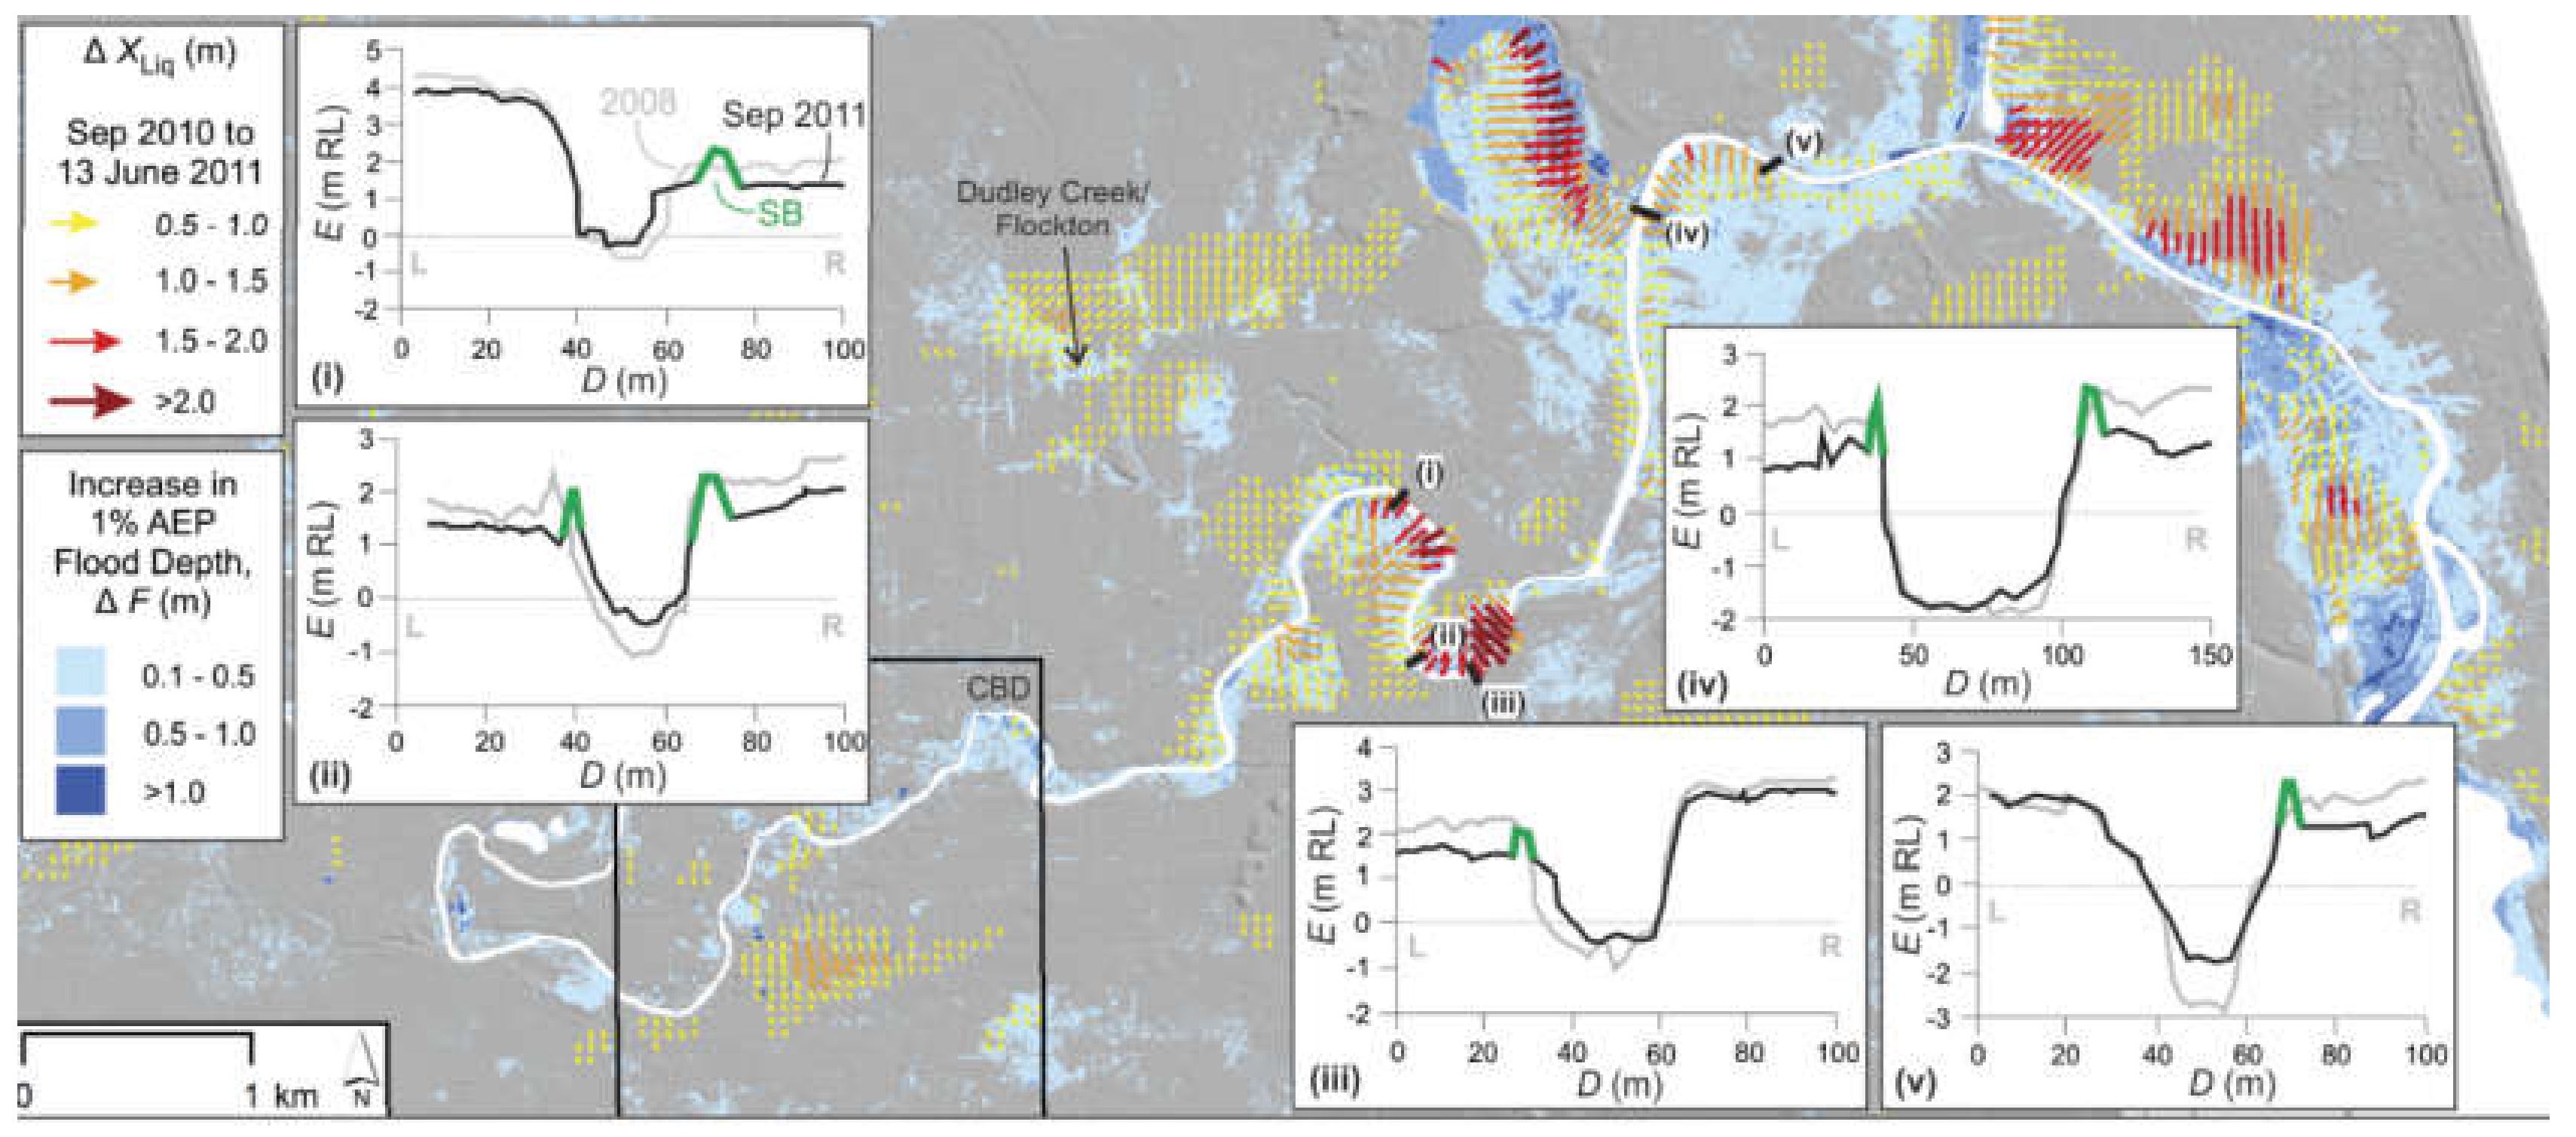
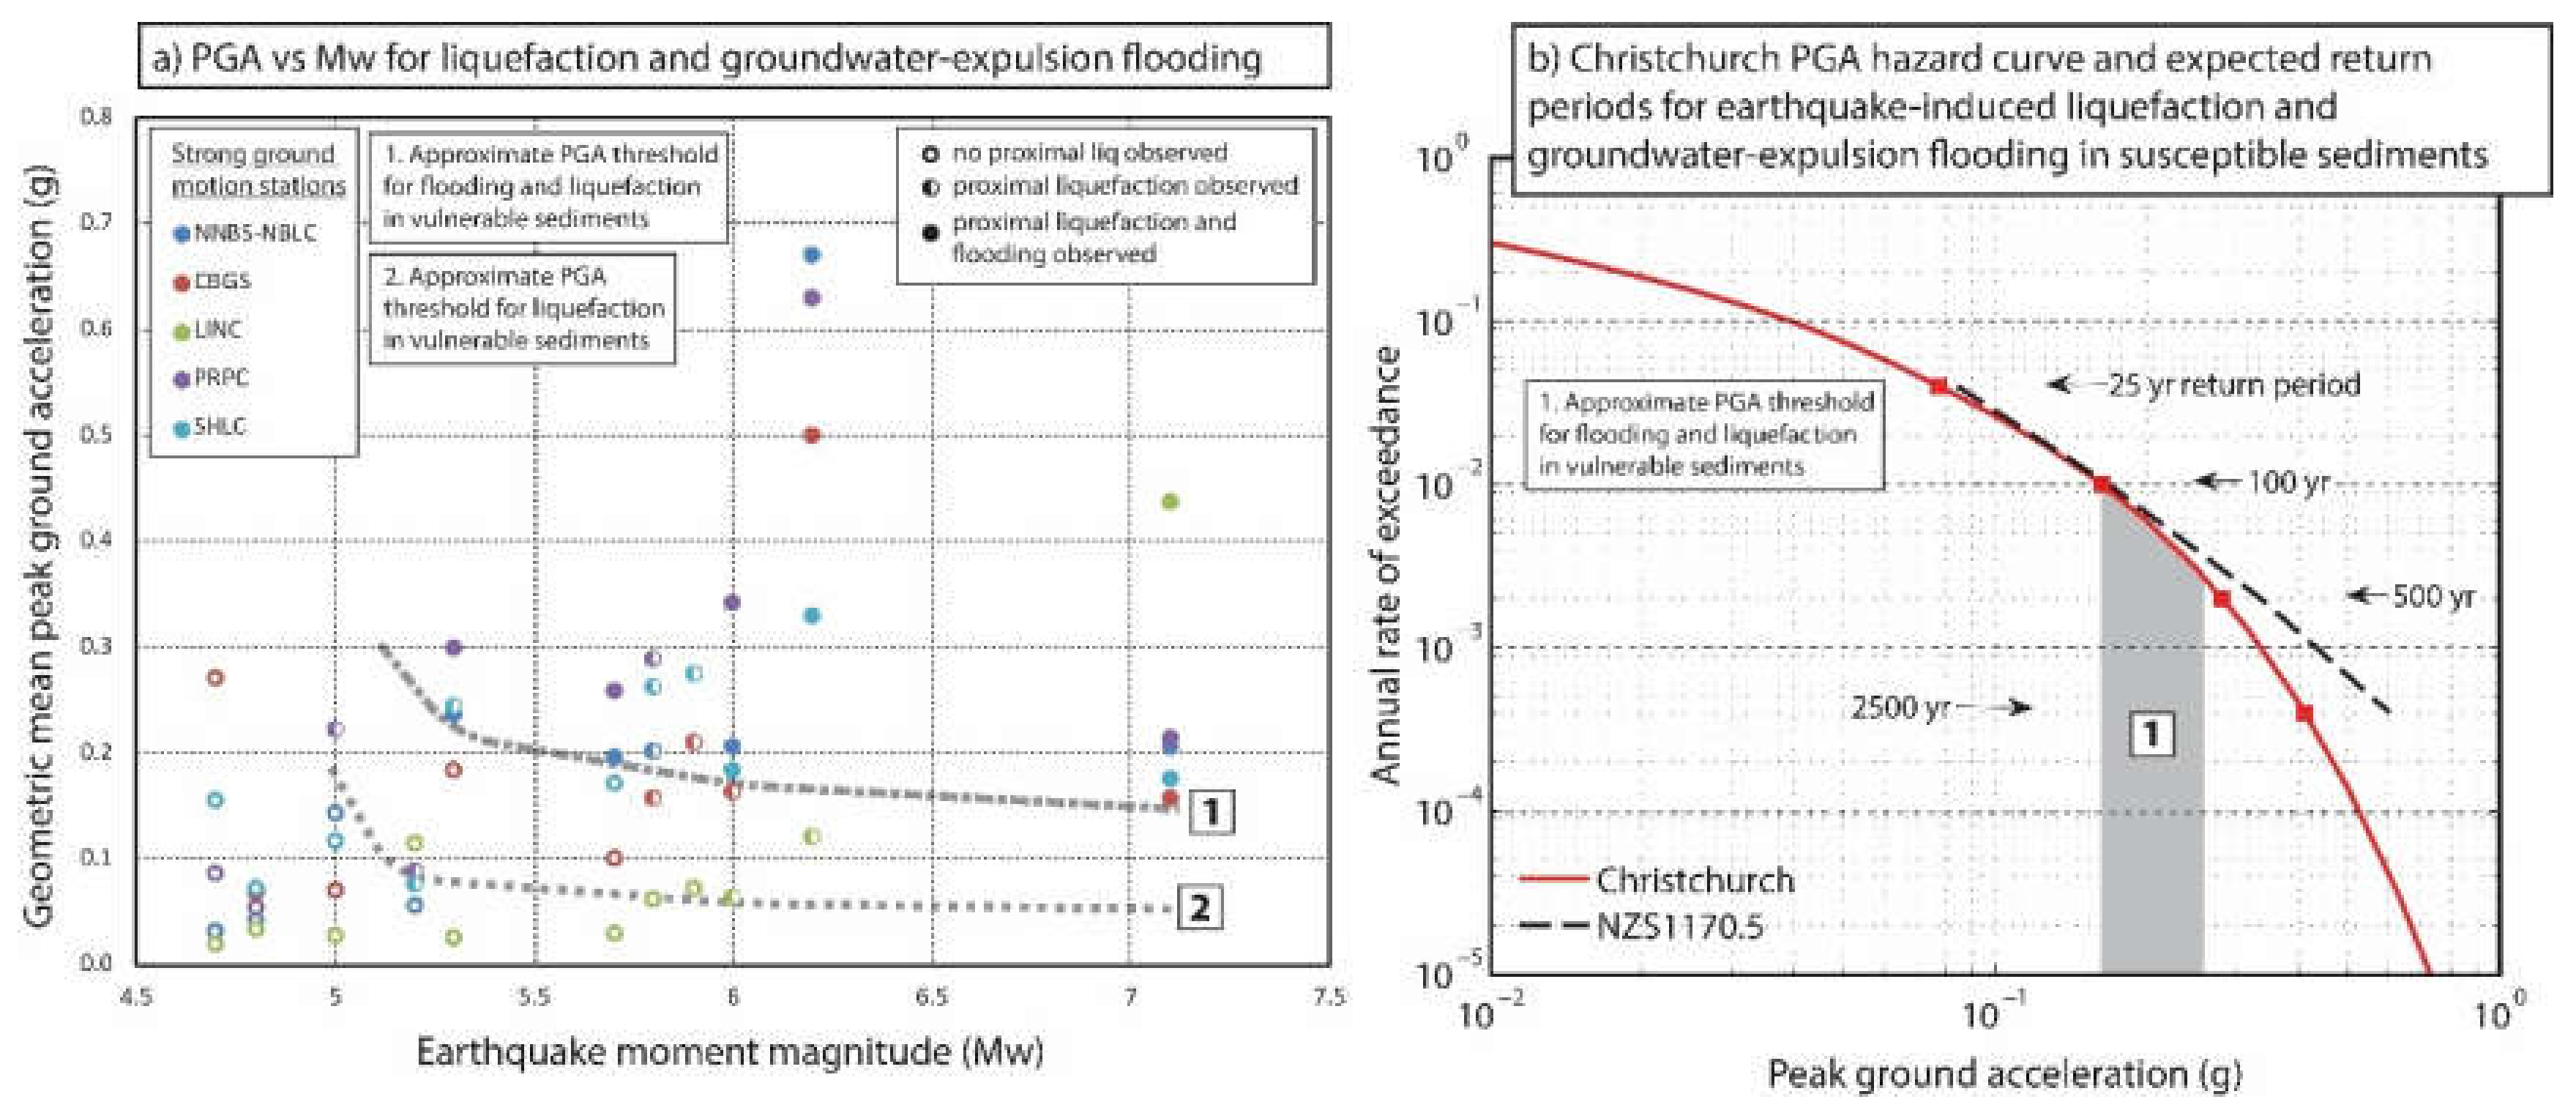
Table 1.
Examples of earthquake-induced influences on surface and subsurface hydrology.
| Category | Effects | References |
|---|---|---|
| Landslide dam | Dams and other drainage-impeding landslides may be triggered by earthquakes and alter the distribution, volume, and flux of surface waters in a catchment [13,18,19,20]. Generally, many small dams are formed, along with one or two larger dams. Breaks may occur rapidly or after several years, and a catastrophic breach may cause widespread flood-related casualties. In 1786, >100,000 people were killed by a dam-break flood following a catastrophic breach of a 50 × 106 m3 earthquake landslide dammed lake [21]. | [13,18,19,20,21,22,23,24,25,26] |
| River avulsion | The avulsion of rivers occurs where the channel crosses a geomorphic scarp or channel gradient anomaly, including over a blind fault rupture [27]. The consequences depend on the sense of the scarp [12], flow direction of the river, stream power relative to gradient perturbation [28], and relative relief of the scarp and surrounding landscape [29]. The fault displacement of streams commonly occurs at mountain fronts where the displaced rivers are deeply incised and avulsion does not occur. Avulsion is more commonly reported from paleoseismic studies than contemporary (historic) records. | [12,27,28,29,30,31] |
| Liquefaction | Release of artesian groundwater pressure may contribute to recurrent liquefaction above extensive alluvial aquifers [32]. The occurrence of liquefaction depends on the magnitude–distance scaling [33]. Liquefaction-induced ground failure and lateral spreading [34] may result in the widespread failure of horizontal infrastructure, such as sewerage pipes. Liquefied gravity flows may contribute to a tsunami in the marine environment [35] or directly result in mass casualties onshore. Large-scale submarine liquefaction may cause coastal areas to slip below sea level (as at Port Royal in 1692) [36] and result in large-scale coastal geomorphic reorganization. Even in recent times and in areas with a relatively small perceived seismic hazard, tailings dams may liquefy, resulting in catastrophic failure [37] | [15,32,33,34,35,36,37,38,39,40,41,42] |
| Seiche | Seiches may be generated at vast distances from the epicenter of an earthquake. Following the 2002 Denali earthquake, seiches on Lake Union in Seattle, Washington, damaged houseboats. The Lisbon earthquake of 1755 caused meter-scale river-level changes across Europe at least and the great Assam earthquake of 1950 generated seiches in Norway and Britain. The 1964 Alaska earthquake generated measurable seiches at >10% of gauging stations across North America and many more beyond that. The distribution of reports was strongly related to the rigidity of near-surface sediments. | [43,44,45,46] |
| Tsunami | Tsunami-induced flooding may occur as a result of a submarine coseismic landslide and/or an offshore fault rupture. Subduction-related tsunamogenic earthquakes may occur in the lower plate [47]; plate interface [48,49]; or upper crustal, upper plate faults [50]. Furthermore, low rigidity faults may cause a major tsunami even at relatively low magnitudes [51]. Climate change may have a major impact on the distribution of tsunami potential as ice-unloading redistributes the stresses around ice sheets (see, for example, Mörner [52]). | [47,48,49,50,51,52,53,54,55,56,57,58,59] |
| Surface-water changes | Sustained changes in river discharge may occur over weeks to months following the earthquake with a range of tens to hundreds of kilometers, especially as a result of gradient changes and groundwater expulsion. | [2,32] |
| Groundwater changes | Groundwater responses to earthquakes are well documented following many earthquakes in areas including China, the United States, New Zealand, Indonesia, Japan, and Italy, among others. Well levels may respond over thousands of kilometers and temperature and pressure of spring discharge may respond over hundreds of kilometers. The scale of the well response is linked to the earthquake magnitude but responses are common across a range of moderate- to large-magnitude earthquakes. | [15,60,61,62,63,64] |
Table 2.
Influence of surface and subsurface hydrologic processes on earthquakes.
| Category | Effects | References |
|---|---|---|
| Natural changes in groundwater level | Groundwater recharge at seasonal to centennial timescales may result in increased seismicity rates or local earthquakes. Groundwater unloading may control the slip distributions during earthquakes. | [5,6] |
| Aquifer drawdown | Groundwater drawdown and the resulting seasonal changes in groundwater loading may cause significant changes in local stress regimes, resulting in the redistribution of seismicity on seasonal timescales. Examples include seismicity rate variations in California, the Dead Sea region, and the central Appenines of Italy. | [6,7,65,66] |
| Reservoir-induced seismicity | In many cases, large lake-level rises following initial impoundment or dam-raising lead to the development of reservoir-induced seismicity. Although this may decrease initially, the filling of the reservoir may transmit long-term pore pressure changes to seismogenic depths, triggering larger earthquakes. The dam height, reservoir volume, and seasonal variations in dam capacity are key influences. Large seasonal variations in the water depth may result in protracted histories of induced earthquakes, such as Koyna, India; Nurek, Tajikistan; and Aswan, Egypt. The largest earthquake potentially attributed to reservoir seismicity is the Mw 7.9 Wenchuan earthquake, for which the Zipingpu Reservoir may have advanced the earthquake due to the reservoir induced stress changes of several tens of kPa at the focal depth. | [8,67,68,69,70,71,72,73,74,75,76,77] |
| Geological disposal of fluids | Fracking has been suggested to dramatically affect earthquake hazards but its importance may be secondary to the disposal of fluids [78], such as oil and gas field brines and wastewater, which may result in pressure diffusion over tens of kilometers from an injection site, as well as swarms of seismicity. The flow rate and volume are critical parameters and magnitude exceedance may scale with volume [79]. Induced seismicity due to fluid removal and reinjection has continued for over a hundred years, although analysis of earthquakes in California and Oklahoma indicates that the mechanisms have varied with industry practices [9,10]. The geological sequestration of CO2, which is a critical component of any climate management strategy, may [80] (or may not [81]) result in significant changes in seismicity rates around storage sites. | [9,10,78,79,80,81,82,83,84,85] |
© 2020 by the authors. Licensee MDPI, Basel, Switzerland. This article is an open access article distributed under the terms and conditions of the Creative Commons Attribution (CC BY) license (http://creativecommons.org/licenses/by/4.0/).
Share and Cite
MDPI and ACS Style
Quigley, M.; Duffy, B. Effects of Earthquakes on Flood Hazards: A Case Study From Christchurch, New Zealand. Geosciences 2020, 10, 114. https://0-doi-org.brum.beds.ac.uk/10.3390/geosciences10030114
AMA Style
Quigley M, Duffy B. Effects of Earthquakes on Flood Hazards: A Case Study From Christchurch, New Zealand. Geosciences. 2020; 10(3):114. https://0-doi-org.brum.beds.ac.uk/10.3390/geosciences10030114
Chicago/Turabian StyleQuigley, Mark, and Brendan Duffy. 2020. "Effects of Earthquakes on Flood Hazards: A Case Study From Christchurch, New Zealand" Geosciences 10, no. 3: 114. https://0-doi-org.brum.beds.ac.uk/10.3390/geosciences10030114
Note that from the first issue of 2016, this journal uses article numbers instead of page numbers. See further details here.