Evaluating Rockfall Risk: Some Critical Aspects
by
 , , , , ,
Claudio Scavia
1 ,
,
Monica Barbero
1,
Marta Castelli
1,
Maddalena Marchelli
2,
Daniele Peila
2,
Giulia Torsello
1 and
Gianmarco Vallero
1,* 1
Department of Structural, Building and Geotechnical Engineering, Politecnico di Torino, C.so Duca degli Abruzzi 24, 10129 Turin, Italy
2
Department of Environment, Land and Infrastructure Engineering, Politecnico di Torino, C.so Duca degli Abruzzi 24, 10129 Turin, Italy
*
Author to whom correspondence should be addressed.
Geosciences 2020, 10(3), 98; https://0-doi-org.brum.beds.ac.uk/10.3390/geosciences10030098
Submission received: 13 January 2020
/
Revised: 24 February 2020
/
Accepted: 26 February 2020
/
Published: 3 March 2020
(This article belongs to the Special Issue Innovative Strategies for Sustainable Mitigation of Landslide Risk)
Abstract
:Rockfalls evolve rapidly and unpredictably in mountain environments and can cause considerable losses to human societies, structures, economical activities, and also natural and historical heritage. Rockfall risk analyses are complex and multi-scale processes involving several disciplines and techniques. This complexity is due to the main features of rockfall phenomena, which are extremely variable over space and time. Today, a considerable number of methods exists for protecting land, as well as assessing and managing the risk level. These methodologies are often very different from each other, depending on the data required, the purposes of the analysis, and the reference scale adopted, i.e., the analysis level of detail. Nevertheless, several questions still remain open with reference to each phase of the hazard and risk process. This paper is devoted to a general overview of existing risk estimation methodologies and a critical analysis of some open questions with the aim of highlighting possible further research topics. A typical risk assessment framework is exemplified by analyzing a real case study. Each step of the process is treated at both the detailed and the large scale in order to highlight the main characteristics of each level of detail.
1. Introduction
Protecting people, structures and infrastructures against rockfall phenomena is one of the most challenging task in the study of rock slope stability, especially in time of rapid and extreme climate changes [1,2,3]. Rockfalls evolve quickly and unpredictably, often at extremely high speeds exceeding 5 m/s up to 30 m/s [4], and involve a complex sequence of motions (e.g., detachment, fall, rolling, bouncing) of one or more rock fragments interacting mainly with the substrate (i.e., generally a steep slope) with negligible dynamic interaction between single blocks [5,6,7]. The movements of blocks during the falling process are in most cases unpredictable and highly influenced by the boundary conditions (e.g., collision of the boulder with natural or human-made obstacles, interaction between rock fragments belonging to the same falling blocks cluster) [8].
When the anthropized territories are prone to slope instability events, the possibility of economical, physical, and social losses has to be analyzed and, if necessary, reduced. For this purpose, a crucial role is played by risk assessment procedures [9] that allow us to estimate the landslide risk within a given area subject to specific types of landslide in a qualitative or quantitative way. Risk assessment gives the information to choose the more efficient strategies for the land protection. Referring to rockfall phenomena, different methodologies have been proposed to evaluate the risk and a lot of studies have been carried out. However, some open questions still remain due to the high complexity of the problem.
This paper is devoted to discuss some of the most important questions and critical aspects that can arise when performing a rockfall risk assessment (i.e., danger, hazard, vulnerability, risk mitigation and management), especially with reference to the different scales of analysis [10,11,12,13]. Moreover, the paper describes some of the current risk analysis techniques that can be found in the literature and are typically used for rockfall mitigation purposes. The observations reported in this work will be addressed by referring to a rockfall prone site in the North-Western Italian Alps (i.e., the Cels-Morlière hamlet). The main issues surveyed during the analysis of the case under study are illustrated in detail.
2. The Risk Assessment Procedure
As is well known, the risk assessment procedure involves five steps: (i) identification of the danger, (ii) runout analysis, (iii) hazard evaluation, (iv) vulnerability assessment, and (v) risk estimation.
(i) The danger is related to the most likely instability scenario: its estimation requires the characterization of the rock mass (i.e., geomechanical survey, rock quality, etc.) and the consequent identification of the rockfall source zones (i.e., detachment niches) and estimation of rock volumes involved.
(ii) In the second step, the invasion areas affected by the passage of the blocks are identified via simplified approaches or trajectographic numerical simulations depending on the scale of observation. Information on the block velocity, bounce height, passage, and stopping probability are provided by the runout analyses.
(iii) Temporal and spatial probability of occurrence is estimated on the basis of the evaluated kinetic energy, the temporal detachment likelihood, and the spatial probability of passage.
(iv) Referring to the elements at risk, the level of vulnerability (on a scale between 0 to 1, typically) can be defined as the degree of loss expected within the area affected by the hazard [14,15].
The vulnerability can be evaluated for different types of elements at risk: population, buildings, and engineering structures, infrastructures, and lines, environmental and historical heritage, public service utilities, and economic activities [16]. To do this, the kinematic properties of the falling rock blocks, and, in the case of structural elements, the geometric and mechanical properties of the structure have to be known.
(v) Finally, the risk can be computed by combining the likelihood of the event, the spatial and temporal probability, the vulnerability, and the worth of the element at risk [14,17,18].
The risk assessment procedure allows to compare the computed risk to tolerable and acceptable thresholds so as to choose the most appropriate and suitable strategies to reach the risk mitigation [14,18]. The mitigation of risk can be achieved by reducing the hazard, the exposition, and the vulnerability or the value of the element at risk. In the first case, the hazard can be reduced by means of protection works (e.g., flexible barriers, embankments), stabilization works (e.g., anchorages, nails), or others (e.g., controlled blasting). Vulnerability can be reduced by enhancing the resistance capacity of the element at risk to dynamic impact loads [19]. The reduction of exposition can be related to early warning systems and delocalization, while the reduction of the value can be obtained by a change of the designated use of the element at risk. In all cases, an evaluation of the residual risk is needed, which is the risk still existing after the effect of the mitigation action. Fell (1994) [9] suggested that the decisions concerning the risk mitigation strategies and the management of the residual risk should be made jointly by technicians, owners, politicians, and local administrators [14].
An important aspect in rockfall risk management is represented by both the aging and degradation processes affecting the usually installed protection devices during their working life [20]. The maintenance issue assumes a crucial role for public administrators in assessing how long a certain investment ensures the needed risk mitigation [21]. With reference to the flexible barriers, the evaluation of the residual capacity is still an open question despite the crucial importance of ageing damages (i.e., post/rope strikes, plant filling of the net, oxidation of the structural elements, plasticization of the dissipators, etc.) that can occur during their life [21,22,23].
In order to obtain quantitative results [11], the whole risk assessment and management procedure can be carried out adopting a multi-scale methodological approach in which every level of detail (i.e., the reference scale) has to be chosen considering the purposes of the analysis and also the available data. Several authors proposed different scales on the base of: (i) geographical considerations relative to typical extensions of land portions (e.g., national, regional, local, and site-specific) [10] or (ii) the introduction of pre-defined scale factors (e.g., small, medium, large, and detailed) [11,12] (Table 1).
Each step of the risk analysis procedure is strongly influenced by the adopted reference scale. Van Westen et al. (2008) [12] suggested that the relative importance of the input data depends on the scale and, thus, on the purposes of the analysis. For example, the availability of a landslide inventory is a key element for all the scales, while the mechanisms at the basis of triggering become more important as the scale factor increases. Both the available techniques for collecting the landslide information and the relevance of environmental factors for landslide susceptibility and hazard are clearly influenced by the adopted reference scale. Finally, the spatial representation of the main elements at risk depends on the four levels of detail reported in Table 1. For example, referring to buildings, the structures are collected in groups at the small and medium scales, whereas, at the large scale, each building is considered singularly, even with simplified approaches based on structural typology, by taking into account its specific resistance capacity and expected degree of loss [15,24].
Each scale has a specific purpose in choosing the most adequate land protection strategy. At small and medium scales, some degree of detail is inevitably lost (e.g., the geological conditions of a large area are considered homogeneous, all slopes are read with the same exposure or steepness and are assigned similar features and/or probabilities of failure). Landslides are often treated together with other types of phenomena occurring within the specific study area [10], while, at the large and detailed scales, it is possible to analyze the single event. For the sake of simplicity, the paper refers only to large and detailed scales.
3. The Case Study
The case study to which this paper refers is the Cels-Morlière hamlet, in the municipality of Exilles (Piedmont). Cels (UTM: 4996137 337399 32T) is located on the left hydrographical bank of the Dora Riparia river in the Susa Valley, North-Western Italian Alps (Figure 1). The site involves an area of about 1.5 km2 with altitudes ranging from 850 m and 1400 m a.s.l. The orientation of the studied slope is estimated 150°/60°. From a geological point of view, the rock mass is composed of compact mica schist with local layers of several tens of meters of striped amphibolite belonging to the pre-Triassic unit of the Ambin Group. The site is historically prone to rockfall events involving the hamlet and some sections of a road. Several studies were carried out in order to better investigate rockfall susceptibility, hazard, and risk levels of this area.
The inhabited area is located at the foot of a 170 m height slope and suffered catastrophic rockfall events in the past, according to results from the rockfall historical database of the Piedmont region. For example, in 1636, a huge collapse of the rockface affected the entire hamlet, completely destroying 12 residential mountain buildings. Starting from the early 1970s, the site has been involved in a series of rockfall events having an average block volume larger than 0.5 m3 and an annual frequency of occurrence of about 0.3.
More recently, in November 2011, a large event involved the hamlet and the uphill municipal road (Figure 2a): three houses were impacted (i.e., Blds. 1, 2, and 3 in Figure 2b) by a cluster of falling blocks having an average volume of about 5 m3 (with a minimum and a maximum value of 1.5 m3 and 10 m3, respectively). A breach of their uphill walls could be observed after the event, as shown in Figure 2b. The fallen boulders also caused the re-mobilization of a 40 m3 block resting along the cliff that, after a small path, struck an outside bathroom belonging to the Bld. 2. During the event, a preexisting barrier line (build up in the 1980s and having a nominal capacity of 800 kJ) was destroyed. In the following year, the barrier was restored by removing the damaged modules and installing new ones. In addition, a new barrier alignment was installed in 2016, for a total length of 340 m and a nominal capacity of 3000 kJ. A more detailed description of the installed protection devices is provided in Section 9.2.
4. Identification of the Danger
It is largely known that rock slope failure results from a series of complex interaction between existing natural discontinuities and brittle fracture propagation through intact rock bridges [25,26]. The identification of the danger needs a detailed geo-structural survey of the rock slope in order to identify the discontinuity sets and to collect all the required data for their characterization (i.e., orientation, spacing, persistence, aperture, weathering, roughness, hydraulic condition, filling, etc.) [27]. Starting from this information, it is possible to perform a kinematic analysis of the most likely modes of instability (e.g., toppling, planar, or wedge sliding) and, also, to define the potentially unstable volumes [28,29].
4.1. Detailed Scale
At the detailed scale, the danger estimation depends on the available input data. If a good estimation of the rock bridge location within the rock mass is available, it is possible to adopt a Fracture Mechanics based method to study the level of danger [25]. Such a type of physical-based method is often difficult to apply because the rock bridges are seldom visible and their extent cannot be known without performing back-analyses. In particular, the Linear and Non-Linear Fracture Mechanics were applied with good results to several back-analysis cases to analyze the triggering processes at the base of some real rockfall event [30,31]. The extension of the above mechanical approach to forecasting analyses could be achieved starting from large data sets of spacing and persistence of the natural discontinuities. Because in this case the procedure would require heavy computational resources, a statistical distribution of the variables governing the stability problem should be introduced, and a probabilistic Fracture Mechanics approach should be adopted.
In cases in which insufficient information concerning the structure of the rock mass is available, completely statistical approaches are typically preferred to physical-based ones [14,32]. This is also due to the fact that it is not possible to relate the recurrence of the triggering factors to the occurrence of an event of a certain magnitude, with the required accuracy [31,33]. The statistical methodologies are based on the construction of a magnitude-frequency relationship. Hungr et al. (1999) [34] suggested that the size-frequency distributions for rockfalls within a given homogeneous area could be defined by a power law. In particular, small-volume blocks are more frequent than larger ones. Several authors used statistical models to describe the volume-frequency relationship for a number of case studies: for example, Dussage-Peisser et al. (2002) [35] built a frequency law for a well monitored rock faces in the French Alps.
Rockfall danger can be defined by taking into account also the time-frequency related to the different volumes [36]. Usually, the temporal variability of the events is considered during the hazard analysis phase and the danger relates only to spatial considerations. The difficulty in relating the triggering cause, and its return period, to the rockfall event requires to use historical data. Some approaches are available in literature for this purpose. For example, De Biagi et al. (2017) [37], adopting the Rockfall Block Size Distribution (RBSD) introduced by Ruiz-Carulla et al. (2015) [32], developed a methodology for building the volume-frequency law and computing the design volume to be used in rockfall hazard assessment and in design of the protection devices [33,38]. The method provides the setting-up of historical catalogue C* of the recorded events and the list F* of the fallen blocks surveyed at the foot of the slope. At each of the inventories, a probabilistic model is assigned: a Poisson distribution for the catalog C* and a Pareto Type I for the list F*. Therefore, the volume v having a return period T is given by the following relationship:
where is the threshold volume (i.e., the minimum volume that, if fallen, has been certainly observed), and and are the annual frequency of occurrence and the parameter of the size-frequency distribution, respectively. The epistemic uncertainties influencing the estimation of the design volume (i.e., v), due to missed events, to a limited set of measured blocks and to an observation period of finite length, have been considered into a series of correction coefficients (i.e., , U, and D, respectively) to be applied at rockfall design volume.
The statistical method was applied to the Cels-Morlière case study. A threshold volume of 1.5 m3 was chosen for the site because it represents the lowest rock volume that reached the hamlet in 2011. The annual frequency of occurrence was evaluated referring to the events contained within historical catalogues of the Piedmont Region and Arpa Piemonte. An observation period t = 46 years (i.e., from 1972 to 2018) was considered and events having a volume larger than were selected. The frequency was computed as and a value of 0.23 yrs−1 was estimated. In other words, an event of at least 1.5 m3 happens with a return period of about = 4.3 years. Starting from a survey of the fallen blocks observed at the foot of the cliff, the Pareto Type I parameter (i.e., ) was evaluated with the Non-Linear Least Square method and a value of about 1.56 was found. In Figure 3, a graph of Equation (1) is reported for a range of return periods between 4.3 and 100 years. The obtained volumes are in good agreement with that observed during the past phenomena: the minimum, average, and maximum size (i.e., 1.5, 5, and 10 m3) observed during the 2011 event relates to return periods of 5, 30, and 100 years, respectively. However, the return period for a 40 m3 block (i.e., the re-mobilized block in 2011 event) results in about 730 years, which seems too long for the survey evidence. In fact, a considerable number of large size blocks are observed along the slope, by revealing that the site was prone to very extensive fall in the past. The re-mobilization processes can considerably increase the volume and multiply the potential rockfall sources. This topic should be further investigated in order to properly identify all the possible scenarios.
It has been shown that the reliability of the statistical method highly depends on the quality of both the historical catalogue C* and the list F* of the surveyed blocks. The data collected within the regional landslide inventories are often lacking and discontinuous; for this reason, it is necessary to implement as far as possible complete and updated ones. It is worthy to note that the stability conditions of a rock slope vary continuously due to climate changes [39,40] that increase the rockfall frequency on mountain slopes, especially during extremely warm summers as in 2003 and 2015 [3], and the presence of new fallen blocks laying along the slopes. This requires a continuous updating of the inventories.
Finally, referring to the list F*, the survey of the blocks has to be conducted with reference to a specific detachment area in order to evaluate the actual contribution of a single detachment niche. This is not easy to obtain because rockfall is basically a diffuse phenomenon, and a deposit zone at the foot of the cliff can potentially collect blocks coming from several source points.
4.2. Large Scale
At the large scale simplified approaches can be used for larger portions of land. One of the possible approaches consists in identifying homogeneous areas onto the rock face with common geological and geomechanical features (fracturing conditions, rock face height, etc.), as well as almost constant slope aspect [41].
The homogeneous areas and their features can be easily implemented and managed within a Geographic Information System environment (GIS, hereafter). GIS-based procedures suggest locating the rockfall source areas, within each homogeneous zone, where steep outcrops are present [42]. The identification phases can be further refined by adopting additional geomorphological studies or field surveys [43].
Referring to each homogeneous zone and on the basis of the spatial arrangement of the natural discontinuities, several instability modes could be activated. Furthermore, it is possible to link both a characteristic volume and a consequent spatial failure probability to each of the possible instability modes. In order to summarize into a single parameter the results of the detachment analysis, a detachment index can be introduced. This index takes into account the total amount of the boulders that can detach, the probability of failure, and their volume. can be calculated as [44]:
where n is the total number of the potential failure modes, the spatial failure probability evaluated for the i-th failure mode, and the block volume estimated during the survey phase. By using this index, it is possible to determine the most likely zone to trigger rockfalls, and a map of the triggering susceptibility can be produced.
5. Analysis of the Runout Phase
The second step of a landslide risk analysis relates to the evaluation of the invasion zones. To do this, the block kinematics (i.e., falling trajectory, passing height, velocity, energy, and maximum distance reached) has to be evaluated for each rockfall scenario. Four motion mechanisms are typically distinguished [22,45]: free falling, bouncing, rolling, and sliding. The free-fall is usually reduced to a parabolic movement, and the friction offered by the air is typically neglected [46]. The bouncing and rolling phases still remain one of the most unclear and enigmatic portion of the whole rockfall trajectory because of the relevant effects that even a small variation in the boundary conditions could generate on them. Bouncing is generally modeled by adopting simplified approaches based on one or two restitution coefficients evaluated experimentally [5,47,48,49].
Different methodologies can be used for the trajectory analysis, distinguishing from each other for the approximations made and the adopted reference scale [12]. First of all, it is possible to discern between 2D or 3D methods depending on the spatial assumption made for the block propagation [22]. 2D models compute the rockfall trajectory along a user-defined slope profile [50], while the 3D ones allow to take into account also the lateral spreading of the boulder and, generally, permit to better simulate the peculiarities of the actual natural phenomena. However, their computational effort is remarkably higher than the 2D models.
The propagation models can be also distinguished in three groups, by referring to the adopted rock block mechanics [22,51,52]: (i) rigorous analytical models of the rigid body, (ii) lumped mass analytical models, and (iii) hybrid models. In particular, the rigid body approaches take into account the inertia of the falling boulders that are simulated as a rigid-shaped object. In the lumped mass methods, the blocks are simulated as dimensionless points and the effects due to the size, the shape, and the angular momentum are neglected. The hybrid methodologies are an intermediate solution between the previous two: during the flight phases the rock block is simulated as a point, while it becomes a rigid body during the interactions with the slope (i.e., impact, bounces, etc.). Additional approaches are the numerical models (e.g., the Finite Element Methods or the Discrete Element Methods) and the approximated ones (e.g., the shadow angle method) in which the mechanical simulation of the falling boulder is substituted by alternative observations.
Finally, the methods can be distinguished on the basis of their probabilistic or deterministic nature [52]. The former take into account the statistical variability of the variables influencing the rockfall runout phase (e.g., volume, soil type, roughness of the slope, vegetation), while the latter use constant values to characterize both the boulder and the cliff.
Independently from the reference scale, all the methodologies describe the interactions between the falling block and the slope by considering all the possible variables conditioning the process [22,46]: characteristics of the rock block, type of soil, and potential obstacles to the boulder motion (i.e., structures, protection works, etc.). An important aspect to be taken into account is the mitigation effect of existing forest cover [53,54]. This issue results are important, especially at the larger scales, because the actual barrier effect of trees can be significantly relevant (e.g., dissipative energy capacity from 200 up to 500 kJ, as reported in [55]).
5.1. Detailed Scale
Generally, the analysis of the rockfall runout process at the detailed scale requires analytical models able to predict the block trajectories starting from the resolution of the fundamental principles of the Newtonian mechanics [46]. The trajectographic analyses require a considerable number of input parameters, for example, the size and shape of the block, the soil characteristic parameters, the presence of trees, and the mitigation devices, if present, in order to provide the necessary information to conduct in-depth studies (e.g., back analyses) and design the protection works. Dealing with the aleatory characteristics of the rockfall phenomenon, it is essential to adopt stochastic approaches in which the analyses are probabilistic and rely on physically-based models and the input parameters are considered with their stochastic variability. This approach requires a large number of simulations: for each of them a set of parameters are randomly extracted (e.g., with the Monte Carlo procedure). Therefore, it is important to select a sufficient number of simulations in order to ensure the statistical validity of the results obtained. In particular, the back-analysis results a fundamental tool for conducting the hazard analysis and allowing us to obtain the set of parameters required by the adopted method which best simulate the actual rockfall event.
Referring to the Cels-Morlière case study, a trajectographic simulation was performed adopting the rigid body 3D probabilistic method embedded in the software Rockyfor3D [56]. This choice is due to the fact that Rockyfor3D takes into account: (i) the presence of flexible net barriers by creating three raster files which contain information about the number of nets, as well as their dissipative capacity and height, measured in the normal direction from the slope surface and (ii) the mitigation effect of trees starting from a restricted number of data concerning their species, forest density, and trunk diameter [53]. First of all, a back analysis of the 2011 event was carried out in order to choose the most appropriate soil characteristic (i.e., restitution coefficients and roughness parameters), starting from the data collected during the on-site survey. The pre-event DTM had a resolution of 5 m × 5 m and was created in 2010 by the Piedmont Region. A 5 m3 block with a rock matrix density of about 2600 kg/m3 was considered, the detachment niches observed during the on-site survey activity were set as source points, and a number of 20,000 simulations started from each of these points. The analysis is carried on by adopting a broad-leaf forest with density of 400 trees/ha, which is representative of the observed number of trees and their essence (i.e., chestnut trees). A flexible net barrier of 800 kJ capacity and 4.5 m-height was considered. The output had to be presented in terms of mean kinetic energy in order to obtain comparable quantities between the simulations made by the two software used in the paper (i.e., Rockyfor3D and QPROTO). The results of the back analysis are reported in Figure 4a, where it can be seen that the barrier is damaged, and the blocks continue their descent beyond the existing protection works. At the building’s location (Bld. 1 to 3), the obtained energies are contained in a range between 500 kJ and 1500 kJ (maximum value). These values are higher than the ones computed on the basis of the observed damages (for Blds. 2 and 3, the estimated energies are between 500–1000 kJ) but results in the best approximation of the real event. Nevertheless, the difference is considered acceptable because the trajectographic analysis has to be precautionary. A further trajectographic simulation was carried out by referring to a larger volume of about 40 m3 discharged by a source point located right above the barrier. This scenario relates to the re-mobilized block along the slope. Even in this case, the results fit quite well with the surveyed evidences, and a kinetic energy value of about 6000 kJ is registered at the location of the outside bathroom of the Bld. 1 (Figure 4b). This high value corresponds to a degree of loss of 1 (i.e., total loss), as reported by Agliardi et al. (2009) [57]. This can justify the complete destruction of the bath occurred during the Cels-Morlière event.
Referring to the back-analysis of the Cels-Morlière case study, some significant remarks can be highlighted.
(i) First of all, the mitigation effect of trees assumes an important role, i.e., the old chestnut tree forest considerably contributes to the reduction of the falling block velocity and, so, to the intensity of the phenomenon at the hamlet location. Further studies may be needed on the effect of trees that, from a first point of view, contribute to the mitigation of rockfalls (e.g., alpine protection forests), while, from another one, can cause an increase in fracturing conditions of the rock face due to the growth of roots within the outcrops (e.g., creating preferential path for surface water). Forests can considerably modify the kinematics of the descent trajectories (e.g., energies, rebound heights, travel distances) and give a crucial contribution in conducting back analyses. It is important to refer back analyses to the exact conditions of the trees that could be observed before the considered event, taking into account that a high number of factor, such as time, fires, snow avalanches, human activity, and also rockfalls themselves can completely change forest density and typology [58,59,60]. However, even if the calibration of the back analysis takes all these factors into account, future variations of the forest conditions still remain a relevant issue in forecasting rockfall analyses.
(ii) Another feature is relative to the re-mobilized blocks that, in this case study, assumes a primary influence. In fact, neglecting this issue could lead to an excessive underestimation of the involved energies.
(iii) The role of the existing rockfall barriers cannot be ignored in a detailed propagation analysis, even in the case in which the dissipation capacity of the protection works is smaller than the estimated energy of the expected event. It is important to define the contribution of the barrier failure to the runout phase because the impacts can significantly reduce the velocity of boulder and divert the trajectories from the original descent paths. Furthermore, the efficiency of the protection work strongly decreases over time because of the environmental conditions. It is confirmed that the reliability of back analysis, used as a method for the calibration of forecast models, is better, as much detailed information is available on the historical event.
(iv) During the back analysis, the adopted DTM must be the pre-event digital model of the terrain because a more recent one can contain modifications caused by the studied event that can potentially invalidate the goodness of the analysis. Moreover, the DTM must have the same resolution both for the back analysis and the forecasting scenarios. Some authors observed [61] that the DTM resolution highly influences the trajectographic modeling.
Furthermore, referring to the statistical method reported in Equation (1) and adopting the parameters validated through the back-analysis, three different return periods were selected: 5, 30, and 100 years (corresponding to 1.5, 5, and 10 m3, respectively). For each magnitude-time scenario, a corresponding propagation analysis was conducted, adopting Rockyfor3D software. The entire rock face was considered as source point location, following the advice provided by the technicians operating at the site. The same 4.5 m-height barrier of 800 kJ was considered in order to evaluate the hazard after the 2011 event. The results of the analyses are reported in Figure 5, where it can be seen that wider invasion zones correspond to larger volumes (i.e., most dangerous scenarios). In particular, adopting a volume of 1.5 m3, the simulated trajectories just barely reach the inhabited area, as the back-analysis suggests. Larger volumes involve mainly the dwellings, confirming the surveys conducted after the 2011 event (Figure 2b). Finally, the largest volume scenario (i.e., 10 m3) results are comparable to the maximum block size observed during the considered event (without considering the re-mobilized 40 m3 block). The analyses do not take into account the largest volumes that can be re-mobilized starting from additional locations along the slope.
5.2. Large Scale
At the large scale, the propagation analyses can be carried out by adopting simplified approaches, allowing us to perform reliable simulations with quite a reduced number of input parameters and computational effort. Thus, whenever the portion of land is too wide (i.e., smaller than 1:5000) to allow the rigorous investigation of the block-slope interactions, it is more advisable to use large-scale approaches that do not simulate the boulder mechanics and adopt physically based methodologies [42]. Typically, the large-scale methods can be embedded in a GIS environment in order to properly manage the input data (e.g., DEM, geological map, vegetation map) and provide the spatial distribution of the rockfall invasion zones.
Several different groups of models can be found in literature distinguishing on the basis of the simplifications made. For example, many rockfall and hydrological tools [62,63,64] implement the estimation of the steepest descent paths [65]. This method is based on the concept that rock blocks behave as surface water following the steepest descent down a slope [43]. The assessment of the direction of steepest descent relies on neighborhood analysis of DEM to determine which cell surrounding the current one has the lowest elevation [42,63,66]. Such models generally compute the rockfall trajectories with topographic-hydrological approaches and estimate velocities and runout distances with a sliding block approach in which the falling materials follow the steepest path along the cliff. Obviously, these models do not provide information on rebound heights [22].
Other methodologies usually adopted for the assessment of the runout distances at the wider scales are the Shadow Angle Method [67] and the Cone Method [68]. Both of them adopted a simplified energy approach in which the falling block path is summarized by an equivalent sliding motion of the boulder along a straight line (i.e., the energy line) connecting the location of the farthest observed fallen block to the apex of the talus slope (i.e., the Shadow Angle Method) or the rockfall source point (i.e., the Cone Method) [68]. The energy line is inclined of an angle , with respect to the horizontal (i.e., the energy line angle), that assumes the meaning of a global block-slope friction angle which takes into account all the dissipative phenomena occurring throughout the motion phases. Furthermore, the vertical distance between the slope and the energy line is considered proportional to the kinetic energy of the block in a given DEM cell.
The Cone Method, as well as the Shadow Angle one, has been implemented in many tools operating within GIS environment. For example, Jaboyedoff and Labiouse (2003) [69] developed the software CONEFALL that compute both the invasion zone and the kinetic energy content of the block in every cell of the input DEM file. Some authors of this paper introduced the QPROTO plugin for the open-source cross-platform QGIS (https://plugins.qgis.org/plugins/qproto/). The plugin implements the method by executing a viewshed analysis starting from a fixed set of viewpoints (i.e., the rockfall source points). From each of these points of view, a visibility cone is defined in the vertical and horizontal plane through the angles and that represent the energy line angle and the lateral spreading one, respectively. The angle represents the main parameter of the Cone Method and has to summarize in its value all the information relative to the block (e.g., size and shape) and the cliff (e.g., roughness, soil type, slope, length, forest density, protection works). Thus, the validation of is one of the most crucial issues in applying the Cone Method. In recent decades, several authors provided a certain number of recommendations to determine usable range of values for this angle starting from empirical on-site observation of real rockfall events [5,67,68]. However, these suggestions usually are strongly influenced by the reference site and a general relationship between the energy line angle and both the block and the cliff parameters is still missing.
With reference to the Cels-Morlière case study, the Cone Method implemented in QPROTO plugin, was applied to implement quick propagation analysis. First of all, the energy line angle necessary for the simulation was evaluated starting from the observation of the 2011 event. In particular, the angle is evaluated by using the following relationship [68]:
where is the elevation of the rockfall source point, is the elevation of the farthest location of the block, and () is the distance between the farthest deposit point and the rockfall source, evaluated along a straight line connecting the projection of these two points in a horizontal plane; the distance can be expressed in x and y components as . For the 2011 event, which is relative to an average volume of 5 m3, is equal to 39°. Adopting this value, QPROTO was used to conduct a forecasting simulation having as source area the same one adopted in the Rockyfor3D analyses. The comparison between the Rockyfor3D and the QPROTO outputs is reported in Figure 6a,b in terms of mean kinetic energies. It can be seen that the invasion areas are comparable. In particular, the area located uphill of the barrier is characterized by the maximum energies. In general, QPROTO returns higher values than Rockyfor3D because of the simplifications adopted. This aspect can be indeed observed at the Cels-Morlière urban area in which Rockyfor3D gives values between 500 and 1500 kJ, while QPROTO is between 2000 and 3000 kJ. The difference between the two methods is acceptable and QPROTO confirms its good reliability for large reference scales in which the precautionary nature of this tool is required. QPROTO is a mechanical-based tool adopting a simplified model to define the invasion zones and the time-independent hazard of rockfall phenomena. Its results are precautionary (i.e., larger invasion areas and higher kinetic energy content) with respect to more detailed software. It can be seen that QPROTO provides results that are in accordance with previous considerations.
Because the QPROTO plugin simulates the rockfall phenomena by using only one parameter (i.e., the energy line angle), the analysis is very sensitive to the value of this angle that has to take into account all the information linked to the block and slope characteristics. In practical cases this could become a problem because whenever the scenario changes (i.e., the volume changes) a consequent variation of the angle is expected. In particular, minor values of are expected to larger volumes because wider areas (i.e., farther runout distances) could be involved. Therefore, further studies should be conducted in order to evaluate the influence of the volume and other parameters on the energy line angle allowing to consider different scenarios in QPROTO quick analyses.
6. Evaluation of the Hazard
From a quantitative point of view, the rockfall hazard can be defined as the likelihood that a particular danger exists or may occur within a given area [17,70]. Typically, for a given danger, the characterization of the hazard has to include three main components [71]: (i) the involved area, which describes the spatial limits of the possible evolution of the phenomenon; (ii) the intensity of the expected rockfall event describing its potential destructive impact; and (iii) the probability of occurrence, i.e., the probability that a certain danger will occur in a specified period of time, in a given area and with a certain intensity.
In some cases, the temporal variability of the hazard (i.e., the probability of occurrence) can be taken into account during the phase of danger characterization. This is the case of the present paper in which a frequency-volume relationship is introduced in Section 4.1 and a return period is associated to each danger scenario. In this way, the hazard assessment only refers to the kinematics of the runout process.
6.1. Detailed Scale
The hazard evaluation at the detailed scale requires a complete and reliable trajectographic model able to predict the runout distances, passing heights, velocities, and energies of the falling blocks (see Section 5.1). The size (i.e., the volume) and the shape (e.g., rectangular, ellipsoidal, spherical, disc shaped) of the blocks can be obtained starting from a classical geo-mechanical survey of the rock face or via the construction of a frequency-volume relationship. In this way, all the input parameters necessary to the conduction of a damage analysis of the elements at risk are made available.
Existing approaches for the quantitative hazard and risk evaluation demonstrate a high value of subjectivity [15,72] and uncertainties in the historical inventories and in damage assessment. Several authors [15,67,73,74,75] introduced the event tree (ET, hereafter) approach for solving these problems and provide an objective method to quantify both the rockfall hazard and risk. In general, ETs are largely used in Aerospace, Nuclear, and many other fields of modern Engineering to investigate, identify, and quantify the consequences of loss-making events.
Adopting the ET approach, De Biagi et al. (2017) [15] proposed a multi-step framework to assess the rockfall risk on buildings considering the occurrence of the rockfall event, the kinetic energy, and the structural response of the impacted elements. Within the methodology, the spatial probability of impact is derived by trajectory analyses performed with a stochastic approach. The probability that the block collides a structural or nonstructural building element is evaluated on the basis of geometrical considerations in order to provide different damage scenarios to be used within the computation of the vulnerability.
6.2. Large Scale
At the large scale, the evaluation of the hazard has to be carried out, adopting the same level of detail of the propagation methods described in the Section 5.2. In particular, in this paper, the Cone Method has been introduced referring to its implementation within the GIS-based QPROTO plugin. The tool permits to conduct preliminary hazard analysis at the large scale assigning a different detachment propensity index () to each rockfall source cell.
The QPROTO simulations not only provide the output raster files of the velocities (i.e., minimum, mean and maximum velocity) and energies (i.e., minimum, mean, and maximum kinetic energy) but allow us to obtain information on both the susceptibility and the time-independent hazard. In this case, the susceptibility is evaluated by summing the of every source point viewing the considered cell and describe how the invasion zones are distributed in the space.
In particular, four raster files can be obtained for the hazard analysis purposes: (i) count, reporting the number of source points that view each cell of the runout area; (ii) susceptibility, reporting the sum of the propensity index seeing each cell of the runout area; (iii) w_en, reporting the time-independent hazard evaluated as the maximum product between the kinetic energy linked to each cone passing in the cell times the associated (in this way, the product is a weighted product with reference to the propensity index that became a weight of the multiplication); and (iv) w_tot_en, reporting the time-independent hazard evaluated as the total weighted kinetic energy. The two latter files refer to two parameters: and . The first one is given by the following relationship:
in which the subscript i refers to the i-th visibility cone that see the cell P(x,y) of the invasion zone. It can be seen that the maximum product in Equation (4) is weighted by adopting the index. The second parameter considers the summation of the contribution of all the source point that see a specific cell of the runout zone and is given as:
In the following, an application of the QPROTO plugin to the case study of Cels-Morlière village is reported. In Figure 7a,b, the raster maps of the files count and susceptibility are reported, respectively. Both the files show that the portion of the slope uphill the buildings involved in the 2011 events is the most prone area to rockfall phenomena. This is mainly because the highest number of visibility cones that pass on this part of the cliff. The values of adopted in the analysis are all set equal to 1 because an evaluation of the fracture condition of the rock face is not available. In this way, the maps show the same results in terms of most likely invasion zones.
The last two raster files are shown in Figure 8a,b. In the first case, the maximum values of are located in the portions of the slope in which the kinetic energy reach the highest values. This happens because a unitary propensity to detachment is taken into account. In the file, the most likely passing zones are defined by considering the summation between the estimated energy and the propensity to detachment. Even in this case, the most prone area is located uphill of the 2011 impacted buildings. The output can be interpreted as a map of the time-independent rockfall hazard that can identify the zone in which a more detailed hazard analyses are needed.
The most detailed large-scaled analysis could be obtained by investigating the contribution of the propensity to detachment index to the spatial distribution of the hazard.
7. Assessment of the Vulnerability
Generally, the vulnerability is related to the expected degree of loss of the exposed elements [16]. Referring to different typologies of elements at risk, the vulnerability definition depends on the application field. Several authors proposed different vulnerability classifications for landslide problems based on qualitative or quantitative approaches [24]. As an example, Fell (1994) [9] distinguished between social vulnerability (i.e., the vulnerability of people involved in a landslide) and vulnerability of structures and activities. Cardinali et al. (2002) [76] grouped the elements at risk on the basis of the expected damage level by adopting a qualitative classification for roads, buildings, and people. Castelli and Scavia (2008) [71], in the framework of the IMIRILAND project, identified four main vulnerability categories: physical (e.g., structures and infrastructures), economic (e.g., economic activities), environmental (e.g., flora, fauna, historical, and architectural heritage), and social (people). From a quantitative point of view, the vulnerability is usually expressed on a scale from 0 (i.e., no loss expected) to 1 (i.e., total loss expected) [9,16,77].
In particular, referring to structures and buildings exposed to rockfall events, the vulnerability (i.e., the structural or physical vulnerability) requires the knowledge of the destructiveness of the falling block, i.e., the intensity of the phenomenon which is due to its kinetic energy content [78,79], as well as the resistance capacity of the structure to withstand the rockfall accidental actions [24]. Although sophisticated and detailed methodologies for the assessment of both risk and hazard exist, the rockfall structural vulnerability is still scarcely deepened, and mainly empirical considerations have been provided [77,79]. As an example, for highly energetic rockfall phenomena, the loss due to the impact of blocks on buildings is typically expected to be very high, while, in case of small- and medium-sized events, this loss can vary considerably [72]. Similarly, in 2001, the Australian Geological Survey Organization [80] proposed a purely empirical classification of building vulnerability based on simple considerations concerning the average slope of the rockfall prone cliff: a vulnerability value equal to 1 is recommended for slopes steeper than 25°, while a value of 0.25 is introduced for small rockfall and less steep cliffs.
In 1982, the UNESCO suggested a classification of the vulnerability assessment methods for structures by identifying four main groups [81]:
- Categorization methods, based on a typological classification of structures (e.g., buildings types);
- Inspection and rating methods, based on the attribution of a rating to each structure;
- Analytical methods, based on a detailed analysis of the structure for the estimation of its expected resistance capacity with respect to an accidental event; and
- Experimental methods, based on tests for the definition of the structural properties of both the structure and its components.
Depending on the reference scale, the available information and the purposes of the analysis, the most appropriate method can be chosen among the above-mentioned items. For example, the categorization methods can be used at the large scales for land planning purposes where the response of a specific building to rockfall accidental action is not interesting and the behavior of a reference building is representative of the response of all the structures within a given homogeneous area (i.e., an area characterized by an unique building type). On the contrary, the analytical and experimental methods can be implemented at the detailed scale whenever structural and geometric information is available for each structure within the invasion zone.
7.1. Detailed Scale
At the detailed scale, the assessment of the structural vulnerability should be carried out by adopting rigorous and analytical structural approaches able to take into account the interaction between the rock boulder action and the impacted structure [72]. Obviously, this kind of analyses have to be tailored to every type of building typology (e.g., reinforced concrete, masonry, wooden buildings) located in the considered zone. For example, Mavrouli and Corominas (2010) [24,82] introduced an analytical method for assessing the vulnerability of reinforced concrete buildings. In this paper, the authors examined the behavior of a simple reinforced concrete frame by coupling a particle finite element method (PFEM) analysis, with the aim of evaluating the dynamic action of rockfall, with a finite element method (FEM) computation for the evaluation of the stresses induced into the structure. The same procedure was adopted by Mavrouli et al. (2017) [72] for assessing the damage index of three masonry buildings impacted by real rockfall events in the Iberian Peninsula.
De Biagi et al. (2017) [15], in the framework of an ETs risk analysis, considered the various damage scenarios that could be potentially activated by a rock block impacting a reinforced concrete building. The vulnerability is estimated as the summation of the contribution of all these possible scenarios and the corresponding failure processes.
In all these applications, the attention must be turned to the progressive-collapse potential. The failure of a structural element (e.g., column, load-bearing wall) can cause a propagation of the local damage within the structure inducing a partial or global collapse. In detail, three different scenarios can be found [15]: (i) no damage propagation; (ii) local collapse involving a single part of the building, and (iii) global collapse when the whole structure is interested. In reinforced concrete buildings, the robustness of the whole structural system has to be investigated. If a fallen block impacts a column and the collapse occurs, the remaining structure has to bridge over the destroyed elements without any further failures. Thus, at the detailed scale, an FEM analysis of the progressive collapse could be useful in order to evaluate step-by-step the global stability, defined by gradually omitting the impact-collapsed structural elements [24]. In this way, a damage index DI can be computed as the ratio between the number of failed elements and the total number of elements. Finally, the vulnerability can be defined as the probability that an impact can cause a certain DI. In order to explore a wider range of block magnitudes and intensities, fragility curves could be developed to assess the physical vulnerability [82]. The analytical methods for assessing the physical vulnerability represent a new research field in rockfall risk studies. While a certain number of papers are beginning to be published referring to reinforced concrete buildings, masonry structures still receive little attention [72]. This is a curious issue if we consider that masonry structures are very common building typologies in mountainous rockfall prone areas worldwide [72].
New studies should be referred to the possibility of reducing the physical vulnerability of existing buildings for the purpose of risk mitigation. Usually the risk management strategies focus on reducing the level of hazard without taking into account the objects at risk. Nevertheless, in several countries, the impact of a boulder on the uphill walls was considered in many traditional building practices. For example, in Swiss and Italian Alps, it was common to place the woodshed outside the exposed walls to dissipate the kinetic energy of an impacted boulder through the deformation of the logs.
7.2. Large Scale
The quantitative evaluation of the physical vulnerability at the large scale has to be conducted adopting simplified approaches to be used by territorial administrators for assessing the more critical zones in which further studies should be carried out. Generally, categorization methods based on a typological classification of buildings are preferred at this level of detail. The structures can be grouped into homogeneous areas in which a unique vulnerability value is usually applied to each of them. For example, Heinimann (1999) [83] and Uzielli et al. (2008) [79] proposed, for larger scales, the attribution of a vulnerability value to building according to their typology. A general framework to classify the physical vulnerability from detailed to small scale was introduced by Dai et al. (2002) [84]. The authors suggested to take into account both the individual characteristics of the buildings (e.g., typology, nature, age) and a catalogue of damages induced by past events. More recently, for the large Italian event of Fiumelatte village, Agliardi et al. (2009) [57] proposed a site-dependent empirical relation between the rockfall kinetic energy (evaluated through an event back-analysis) and the observed damage level (i.e., the estimated vulnerability). An interesting GIS-based approach for assessing the vulnerability starting from a monetary value per unit area was introduced by Remondo et al. (2008) [85] for a Spanish study area.
Some of the authors of this paper are setting up a method for the quantitative vulnerability assessment of masonry buildings based on an analytical simple approach. Three local failure mechanisms for the masonry walls were considered (i.e., punching, arching, and vertical bending), and the damage propagation within the structure was treated by using simple considerations (e.g., geometry of the building, number of spans, slab orientation, masonry maintenance) and distinguishing between structural or non-structural wall elements. Although the simplicity of the method, a spatial mapping of the structural vulnerability can be obtained for preliminary computation of the rockfall risk. The method requires a quick survey of the buildings within the study area and can be used exclusively for masonry structures. Further development has to take into account a wider range of building typologies to implement the method into a more complex inhabited area.
8. Evaluation of the Risk
The risk can be defined as the probability that a rockfall phenomenon of a given intensity occurs in a certain space and time, producing a particular level of damage to the exposed elements [17]. The risk relates both to the likelihood of a determined phenomenon and the expected consequences (i.e., the “losses”) on the elements at risk [70]. With regard to risk analysis procedures, four different categories can be considered, depending on the vulnerability typologies described above [71]: physical, economic, environmental, and social.
Several risk analysis and assessment methodologies have developed with different assumptions on the elements at risk, the purposes of the analysis, the reference scale, and the available input data. Quantitative and qualitative approaches are available: the former quantifies the risk through a probabilistic analysis of the parameters influencing the hazard and the severity of the consequences to the exposed assets [36,71]; the latter provides an estimation of the level of risk without a specific numerical value.
In the following, some quantitative risk analysis procedures are highlighted in order to supply some basic information referring to different scales of detail.
8.1. Detailed Scale
At the detailed scale, the evaluation of the risk is carried on by using specific procedures for each risk component. Referring to buildings, the physical risk is computed by using analytical and quantitative procedures that consider both the local failure and the partial or global collapse of the structure due to the possible propagation of the damage within the structural and nonstructural elements. Following this conceptual framework, De Biagi et al. (2017) [15] proposed an ET approach for the quantitative risk assessment. Different damage scenarios, resulting from the occurrence of possible sequences of events, can be generated and, for each of them, a probability is assigned. Depending on mechanical properties of the material, the geometry of the structural element and the loading conditions, the probability of having elastic, plastic or failure behavior is computed. Finally, the physical risk can be computed in terms of reparation costs by summing the reparation cost associated to each damage scenario, times its associated probability. Similarly, the social risk for people living in the buildings is given by the summation of the products of the risk to people associated with each damage scenario (computed on the basis of the average occupation and failure probability of each room) times its associated probability of occurrence.
The method is particularly performing because it allows us to take into account the different behavior between small blocks, which are not able to cause the failure of the structural elements, and the larger blocks that are able to compromise the load-bearing capacity of the structure. The main limitation of the method is due to the fact that the method does not allow to consider the motion of blocks within the structure and the potential additional damages [15]. In order to take into account this effect, an FEM analysis of the robustness of the building is needed [82].
Because the vast heterogeneity of the different elements at risk, several quantitative risk assessment procedures are available in literature. For example, for roads and infrastructures located near unstable rock slopes, many methodologies can be found. At the detailed scale, ETs can provide, again, a useful aid. Peila and Guardini (2008) [86] introduced an ET approach which quantitatively determines the conditional probability that a moving vehicle could be hit by a fallen block or not when it is travelling along a stretch of road. The ET allows us to also determine the probability that fatal or non-fatal accident occurs. Moreover, the procedure admits taking into account a wide set of fatal or non-fatal accident scenarios. The method is tailored for detailed scale because it requires a series of preliminary data, such as the geometry of the slope, the maximum speed of the vehicle, and the number of rocks hitting the road per year (their size and/or their expected size).
8.2. Large Scale
The computation of the risk at the large scale requires the use of reliable methods able to quantitatively describe the level of risk due to extreme wide and/or complex landslide phenomena involving different typologies of elements at risk. At the same time, the methods have to be quick and easy-to-use in order to provide rapid results to territorial administrators interested in the following risk management phase. Moreover, the computation of risk may be constantly updated in order to immediately identify when the risk becomes lower than the acceptable one.
As an example, the quantitative risk assessment method developed in the IMIRILAND project is presented in the following [36,71]. The framework of the methodology, which is originally developed for large and complex landslides in North-Western Italian Alps, can also be successfully adapted to rockfall events. Rockfall is indeed a complex, diffuse and random-scattered phenomenon that requires a rigorous and detailed methodological approach. The method consists of five main items: (i) collection of the data; (ii) danger identification and characterization; (iii) multidisciplinary approach to hazard analysis; (iv) consequence analysis (i.e., vulnerability and worth estimation of the elements at risk); and (v) risk calculation, by multiplying the occurrence probability and the consequences. The crucial point of the methodology is represented by the hazard estimation which implies a multidisciplinary approach in order to take into account all the possible factors influencing its definition. The IMIRILAND method can be applied with reference to the different types of element at risk mentioned above. In particular, the methodology provides a set of vulnerability indexes that are tailored for the purposes of the analysis and quantifying the number of expected losses [36].
More detailed methods are available for specific types of elements at risk. For example, in case of road or infrastructures, empirical procedures can be adopted. Pierson (1990) [87] introduced the Rockfall Hazard Rating System (RHRS) that assigns scores to nine categories that can affect the rockfall hazard and the vehicle vulnerability within a specific site. Because this method contains all the elements regarding the rockfall hazard (i.e., slope height, geologic character, volume of rockfall/block size, climate, and presence of water on slope and rockfall history) and the vehicle vulnerability (i.e., ditch effectiveness, average vehicle risk, percent of decision, sight distance, roadway width), the resulting total score assesses the degree of the exposition to the risk along roads [88]. The RHRS method was updated in time to adapt its parameters to different practical cases. For example, Budetta (2004) [88] proposed a modification of the method in order to render easier and objective the original RHRS. In particular, the geologic characteristics of the rock face were improved by introducing the Romana’s Slope Mass Rating. Mölk et al. (2008) [89] adjusted the method to the conditions found in the populated areas of the Austrian Alps and focused their attention in quantitatively estimating the probability of fatal accidents in permanently inhabited areas.
To conclude, Remondo et al. (2008) [85] introduced a GIS-based quantification of the risk in monetary terms. The quantification of the risk is provided for each element at risk which is present within the analysis area.
9. Risk Management and Conservation Assessment of Protection Devices
The final step of the risk analysis procedure is represented by the management of the risk once mitigation countermeasures have been designed and installed. The management phase is strictly connected to the assessment of the degree of conservation of the protective works overtime.
Among the protection devices against rockfall, the most common are the flexible net barriers (or, equivalently, net fences) [22,90,91], the drapery meshes [92,93], and embankments [94,95,96]. All of them play a crucial role in the frame of hazard and risk analyses, halting the motion of the blocks or, at least, decreasing their velocity and propagation probability [22,86,91,97].
The behavior and the performance of rockfall protection measures, that is their effectiveness and efficiency in time, are influenced by different factors, which are time dependent and unpredictable, such as impacts and interactions with vegetation, together with an incorrect or even missing maintenance. All these aspects affect the degree of conservation and thus sometimes the durability and the capacity (effectiveness), i.e., their capability to produce the required result, and the ability to produce the result in the optimal way (efficacy). The assessment of the degree of conservation is therefore of key importance for the management of rockfall protection systems.
For this purpose, based on the outcomes of past studies reported in the literature [20,21,23,98], and in-situ observations, different types of damages have been identified and classified into several groups related to: (i) surrounding context (i.e., connected with vegetation, variation in time of morphology); (ii) design, positioning and installation techniques; (iii) post-impact conditions (in the hypothesis that no maintenance is performed after the impact); (iv) aging, weathering, wearing and corrosion (in the hypothesis that no maintenance procedure is performed); and (v) incorrect maintenance procedures.
Focusing in particular on net fences, it is worth mentioning that the actual design approach, consisting in choosing a suitable commercial product, on the basis of the results of propagation analyses, might not always guarantee an adequate structural reliability. The performances of the commercial product is assessed through codified impact tests, and, consequently, the current design procedures rarely consider the impact point location, the shape of the block, and its kinematics during the impact [99,100,101]. As a consequence, the nominal capacity of the barrier might differ from the real one [102]. Furthermore, the effectiveness of a barrier can be compromised by errors in the positioning and the installation techniques [103].
Nevertheless, the purpose of the proposed section is to provide a profitable tool for the evaluation of the residual efficiency of the net fences when no quantitative data from monitoring is available. Then, starting from the initial hypothesis that at the beginning of its working life the protection system has its maximum efficiency, i.e. assuming that it has been properly designed and positioned, a procedure able to evaluate the degree of degradation and to assess the state of conservation of both rockfall net fences and drapery mesh systems has been developed [98]. The method is based on a multi-criteria analysis, involving screening survey and providing a semi-quantitative value of the degree of conservation showing if the effectiveness is compromised, even though a complete assessment of the efficiency loss is far to be found. These structures are multi-component devices and their composing elements can be differently compromised. The leading idea is to consider that each component can affect the global efficiency of the entire system in different ways, depending on the damaged element and on its type of damage. Due to the large variety of these systems, the research aims to find a general approach to investigate all the possible damages which can involve these systems and their consequences.
In the following, the drapery mesh approach is shortly discussed and an application to flexible net barriers is proposed. The considered reference scale is the large one and more in-depth studies should be carried out with reference to detailed scale (e.g., by using a FEM analysis of the considered protection work).
Generally, rockfall net fences consist of a sequence of functional modules made up of an interception structure (i.e., one or two layers of steel mesh supported by struts, typically) and a set of connection cables anchored in the ground [104]. The interception structure is made by the principal net that has to bear the dynamic impact of the falling rock block through its plastic deformation and transferring the load to the foundations. A large variety of technologies for the principal net, posts, fixing, and connecting components can be found in practice, and different energy dissipating devices have been developed [105].
9.1. The Proposed Methodology
The damage scenarios occurring on the main elements of a rockfall net fence can only be assessed through an extensive survey campaign having the aim of inventorying all the actual damages. Consequently, a complete list of the potential damages that can occur on each component of the protective device has been prepared. Several typologies of damages can be observed, differing mostly for: when they occur in the service life of the system, the inducing factors (natural aging or impact), and the maintenance actions.
In order to consider the influence of each damaged element on the entire efficiency of the system, different weights () were associated to each i-th damage and three importance classes were defined: C1 relates to a negligible influence of the issue to the overall efficiency, C2 is when the issue might influence the efficiency of the protection system to a limited extent, and C3 is associated to a critical issue considerably reducing the efficiency of the whole protection system. The damage level for each element is defined by the technician during a survey activity, by choosing among three level of damage observed: D0 for no or negligible damage, D1 for a slight or intermediate damage, D2 for a considerable damage. Both the level of damage of each element and its class of importance are combined to evaluate the efficiency of the whole system by using weighted sum and matrix approaches. These two methods were tailored and partially combined to define the efficiency of a rockfall net fence. Table 2 details the scores assigned to link each damage level to the importance factor (). Three maintenance levels were introduced, depending on both the level of damage and the class of importance of the component: A0 if a long-term maintenance plan is needed, A1 if a short/medium-term maintenance plan is needed, and A2 if urgent maintenance is needed. The maintenance level of the whole system is the worst maintenance level obtained by each component.
The number of damaged components directly relates to the extent of the required intervention activities. It emerges that either the deterioration of several minor components or the damage of a unique principal part of a protection system can compromise the efficiency of the whole system. In addition, the system can be totally inefficient and thus ineffective even though a single key component is highly damaged. In this case, the expected consequence can be marked with the class of importance C3. In this particular case, in which only a fundamental component is damaged, the global score is low but an immediate maintenance activity is needed.
9.2. The Case Study
The proposed procedure was applied to the case study of Cels-Morlière hamlet. Currently, the site is characterized by the presence of different alignments of flexible barriers, differing in installation time, geometry, technology of the components, and dissipation capacity. The first protection work has been installed since the early 1980s, before the publishing of the ETAG 027 [106], now EAD 340059-00-0106 [104]. Three net fence alignments were built (i.e., Barrier 1, in Figure 9 and Figure 10a), for a total length of 170 m. A first barrier scheme was adopted, with an 8 m spanning functional module and a nominal height of 4.5 m. Wire rope net panels are used for the principal net, while steel ropes with a diameter of 16 mm are adopted for the longitudinal ropes, anchoring the net to the posts (HEA160 profiles) through cantilever-joints with prefixed breaking points. The posts are hinged to the base and anchored to the rock through a base plate with four bolts. Four upslope ropes are connected to each post. Both upslope and longitudinal ropes are equipped with energy dissipating devices. In particular, the brake consists of a looped cable, using the ropes of the net fence and friction clamps, working by pure friction, with a nominal dissipative capacity of 200 kJ each one. The performance of this barrier had been estimated of about 800 kJ.
The rockfall event of November 2011 caused the failure and the damage of some functional modules of the above described barriers. Consequently, a restoration of the net fence lines was performed, removing the destroyed modules and installing new ones similar to the original and replacing the damaged elements. Nevertheless, the wire rope net panel layout differs from the original ones, e.g., in the clip connection, as well as the rope-mesh connection elements, and the support ropes slightly differ in diameter.
In addition, new barrier alignments (i.e., Barrier 2, in Figure 9 and Figure 10b), uphill Barrier 1, have been installed in 2016, for a total length of 340 m. This net fence is certified according to ETAG 027 [106] and guarantees a maximum energy level of 3000 kJ. It is composed by functional module spans of about 10 m and a nominal height of 5 m. The method for assessing the degree of conservation has been applied to these barriers.
Analyzing Barrier 1, a significant interaction with vegetation can be observed, causing a partial deformation of the mesh. A considerable corrosion degree is recorded on the connection elements among the mesh panels, between the mesh and the ropes, and, in particular, on the wire rope grip of the upslope, the lateral and the support ropes. Furthermore, the number and the applied torque of the wire rope grips are lower than those prescribed by the European standards [107]. Considering the ropes, oxidation or removal of the corrosion protection is observed in several parts. Lateral anchor ropes, as well as upslope anchor ropes are in some cases loose or unusually stressed. Damages are observed in the rope-anchors, such as in the thimble in the eye assembly of the rope. Moreover, the rope-anchor connections show important degradation. The vegetation interacts also with the energy dissipating devices, which are characterized also by corroded zones. Both deformation and sliding of the energy dissipating devices have not been recorded. All these observations produce a global score of 0.47 and an A2 maintenance level. This means that the extension of the local damages is considerable, i.e., several elements are affected by ageing, corrosion or other issues. Thus, an urgent maintenance activity is needed as fundamental elements, such as the ropes, shows deficiency in connection elements.
Barrier 2 results in a global score of 0.1, as only some rope-anchor connection elements are slightly oxidized. This means that the loss of efficiency is negligible. The estimated maintenance level is A0, i.e., only a long-term maintenance plan is needed. In the frame of a hazard analysis with the perspective of considering the actual condition, Barrier 2 can be considered totally efficient, while Barrier 1 completely ineffective. In the perspective of a risk management plan, and of a propagation analysis to be carried out in the present time, the contribution of Barrier 1 should be neglected.
To conclude, at the detailed scale, the attention should be devoted to the analysis of the residual capacity offered by the barriers along their nominal life and after the occurrence of one or more previous impacts. The final purpose is the estimation of the contribute offered by a partially damaged barrier to quantitative risk analyses and the modeling of this contribute in trajectographic analyses. The transient phase between total protection and partial safety is one of the most unknown and needs further investigations and procedures to be better simulated and managed. In order to obtain these, results an FEM analysis campaigns and full-scale tests on the barrier degradation could be useful, as well as reliability-based analyses.
10. Discussion and Conclusions
The rockfall risk analysis is a wide and complex issue in the frame of safety and civil engineering. Several approaches have been developed during the last decades, and new ones are still being introduced. Researchers’ efforts are devoted to increase the knowledge of the phenomenon and to set up more rigorous approaches for its management. Nevertheless, several issues still remain unsolved, and new questions to be solved steadily appear.
The work presented in this paper fits into this framework, by providing a critical analysis of some of the open questions detected during the implementation of a typical rockfall risk procedure, and an overview of some existing methods to achieve the estimation of risk and its components. Many of the presented methodologies have been developed during the authors research activity in the framework of the Project of Relevant National Interest (PRIN 2015) named “Innovative Monitoring and Design Strategies for Sustainable Landslide Risk Mitigation”.
The topics are introduced by following a classical risk assessment procedure, which includes six main steps: (i) identification of the danger, (ii) runout analysis, (iii) hazard evaluation, (iv) vulnerability assessment, (v) risk estimation, and (vi) risk management. For each of these parts, a quick overview and a summary of the main unsolved questions is provided, with reference to the multi-scale approach proposed by Fell et al. (2008) [11]. In particular, more effort is devoted to large and detailed scale to which the majority of the research activity is currently addressed worldwide.
The danger identification phase relates to the definition of the expected rockfall magnitude scenarios at a given site. Although a considerable number of studies have been carried out, remarkable uncertainties are due to the dislocation of the rock bridges, its failure probability and the definition of a mechanical relationship linking the rockfall trigger to its causes. Alternative methods based on frequency-magnitude laws can be adopted, but the consequent lack of mechanical considerations has to be taken into account.
Generally, the hazard evaluation includes the computation of the spatial and temporal probability of occurrence and the estimation of the intensity of the phenomenon. In rockfall instabilities, modeling the trajectories of the falling blocks requires the use of a stochastic approach. In addition, if the most recent codes allow to carry on stochastic runout analyses, fragmentation, forest mitigation, and interaction with existing protection works represent relevant research activities to be further investigated both at detailed and large scales.
The vulnerability assessment, i.e., the analysis of the expected losses, represents the key point in order to link the hazard evaluation to the estimation of the risk. A crucial point is represented by the model to assess the degree of loss of the elements at risk, strictly depending on its typology (i.e., people, infrastructures, economic activities, historical heritage, etc.). For example, masonry buildings vulnerability is generally poorly investigated, despite the widespread diffusion of these constructions in areas prone to rockfall.
Finally, the role of the degradation of rockfall protection works is extremely important in order to evaluate their residual dissipative capacity and degree of maintenance over time. The actual capacity of flexible net barriers over time, for example, is useful to constantly update the actual risk level within a specific exposed area protected by this type of work. For this purpose, the scientific community should provide appropriate tools based both on analytical-numerical model (i.e., detailed scale) and quick survey activities (i.e., large scale).
These highlighted items are only some of the open questions that rockfall research will have to face in the future. The authors believe that the same multi-scale approach used for other typologies of landslides is suitable to rockfall purposes. At the large scale, the GIS-based techniques allow us to simulate the runout phase by also adopting physical-based and mechanical tools (see the QPROTO plugin mentioned above, for example), highlighting the zones in which further and more detailed and rigorous analyses can be carried.
Vulnerability models to be implemented in GIS environment for mapping the losses within a large portion of land, also considering all the existing elements at risk, should be provided by the research community.
Land protection cannot be performed efficiently without a multi-scale approach in which every level of detail exchange information from each other. In this framework, GIS-based techniques, physical-based approaches, and also new technologies (such as big-data analysis of monitoring systems, for example) could play an important role in the future for the mitigation and management of rockfall events.
Author Contributions
The main idea of the paper was conceptualized by G.V., M.B. and M.C.; G.V. and M.M. write the original draft of the manuscript; G.T. conducted the software simulations of the case study; M.B., M.C. and D.P. supervised the research; the overall work was carried out under the supervision of C.S.; All authors have read and agreed to the published version of the manuscript.
Funding
This work has been partially supported by the Italian Ministry of Education, Universities and Research in the framework of the Project of Relevant National Interest (PRIN 2015 - code: 201572YTLA_008) on “Innovative Monitoring and Design Strategies for Sustainable Landslide Risk Mitigation”.
Acknowledgments
The authors gratefully address their thanks to S. Campus (Regione Piemonte) and L. Lanteri (ARPA Piemonte) for the concession of the data relative to the study case.
Conflicts of Interest
The authors declare no conflict of interest.
References
- Stoffel, M.; Tiranti, D.; Huggel, C. Climate change impacts on mass movements—Case studies from the European Alps. Sci. Total Environ. 2014, 493, 1255–1266. [Google Scholar] [CrossRef]
- Paranunzio, R.; Laio, F.; Chiarle, M.; Nigrelli, G.; Guzzetti, F. Climate anomalies associated with the occurrence of rockfalls at high-elevation in the Italian Alps. Nat. Hazards Earth Syst. Sci. 2016, 16, 2085–2106. [Google Scholar] [CrossRef] [Green Version]
- Ravanel, L.; Magnin, F.; Deline, P. Impacts of the 2003 and 2015 summer heatwaves on permafrost-affected rock-walls in the Mont Blanc massif. Sci. Total Environ. 2017, 609, 132–143. [Google Scholar] [CrossRef] [PubMed]
- Hungr, O.; Corominas, J.; Eberhardt, E. Estimating landslide motion mechanism, travel distance and velocity. In Landslide Risk Management; CRC Press: Boca Raton, FL, USA, 2005; pp. 109–138. [Google Scholar]
- Hungr, O. Engineering evaluation of fragmental rockfall hazard. In Proceedings of the 5th International Symposium on Landslides, Lausanne, Switzerland, 10–15 July 1988; pp. 685–690. [Google Scholar]
- Frattini, P.; Crosta, G.; Carrara, A.; Agliardi, F. Assessment of rockfall susceptibility by integrating statistical and physically-based approaches. Geomorphology 2008, 94, 419–437. [Google Scholar] [CrossRef]
- Hungr, O.; Leroueil, S.; Picarelli, L. The Varnes classification of landslide types, an update. Landslides 2014, 11, 167–194. [Google Scholar] [CrossRef]
- Glover, J.M.H. Rock-Shape and Its Role in Rockfall Dynamics. Ph.D. Thesis, Durham University, Durham, UK, 2015. [Google Scholar]
- Fell, R. Landslide risk assessment and acceptable risk. Can. Geotech. J. 1994, 31, 261–272. [Google Scholar] [CrossRef]
- Corominas, J.; van Westen, C.; Frattini, P.; Cascini, L.; Malet, J.P.; Fotopoulou, S.; Catani, F.; Van Den Eeckhaut, M.; Mavrouli, O.; Agliardi, F.; et al. Recommendations for the quantitative analysis of landslide risk. Bull. Eng. Geol. Environ. 2014, 73, 209–263. [Google Scholar] [CrossRef]
- Fell, R.; Corominas, J.; Bonnard, C.; Cascini, L.; Leroi, E.; Savage, W.Z. Guidelines for landslide susceptibility, hazard and risk zoning for land-use planning. Eng. Geol. 2008, 102, 99–111. [Google Scholar] [CrossRef] [Green Version]
- Van Westen, C.J.; Castellanos, E.; Kuriakose, S.L. Spatial data for landslide susceptibility, hazard, and vulnerability assessment: An overview. Eng. Geol. 2008, 102, 112–131. [Google Scholar] [CrossRef]
- Ferlisi, S.; Gullà, G.; Nicodemo, G.; Peduto, D. A multi-scale methodological approach for slow-moving landslide risk mitigation in urban areas, southern Italy. Euro-Mediterr. J. Environ. Integr. 2019, 4, 20. [Google Scholar] [CrossRef] [Green Version]
- Turner, A. Rockfall risk assessment and risk management. In Rockfall: Characterization and Control; Turner, A., Schuster, L., Eds.; Transportation Research Board: Washington, DC, USA, 2012; pp. 113–176. [Google Scholar]
- De Biagi, V.; Napoli, M.L.; Barbero, M. A quantitative approach for the evaluation of rockfall risk on buildings. Nat. Hazards 2017, 88, 1059–1086. [Google Scholar] [CrossRef]
- Glade, T. Vulnerability assessment in landslide risk analysis. Erde 2003, 134, 123–146. [Google Scholar]
- Fell, R.; Ho, K.K.; Lacasse, S.; Leroi, E. A Framework for Landslide Risk Assessment and Management. In Landslide Risk Management; CRC Press: Boca Raton, FL, USA, 2005; pp. 13–36. [Google Scholar]
- Glade, T.; Crozier, M.J. A review of scale dependency in landslide hazard and risk analysis. Landslide Hazard Risk 2005, 75, 138. [Google Scholar]
- Egli, T.; Roth, C.; Marro, C. Chutes de pierres. In Recommandations: Protection des Objets Contre les Dangers Naturels Gravitationnels; Turner, A., Schuster, L., Eds.; Association des établissements Cantonaux d’assurance Incendie (AEAI): Bern, Switzerland, 2005. [Google Scholar]
- Prina Howald, E.; Abbruzzese, J.M.; Grisanti, C. An approach for evaluating the role of protection measures in rockfall hazard zoning based on the Swiss experience. Nat. Hazards Earth Syst. Sci. 2017, 17, 1127–1144. [Google Scholar] [CrossRef] [Green Version]
- Luciani, A.; Todaro, C.; Peila, D. Maintenance and risk management of rockfall protection net fences through numerical study of damage influence. Frat. Ed Integrità Strutt. 2018, 12, 241–250. [Google Scholar] [CrossRef] [Green Version]
- Volkwein, A.; Schellenberg, K.; Labiouse, V.; Agliardi, F.; Berger, F.; Bourrier, F.; Dorren, L.K.; Gerber, W.; Jaboyedoff, M. Rockfall characterisation and structural protection-a review. Nat. Hazards Earth Syst. Sci. 2011, 11, 2617–2651. [Google Scholar] [CrossRef] [Green Version]
- Luciani, A.; Peila, D.; Barbero, M. Studio numerico dell’influenza dell’ammaloramento delle barriere paramassi. Geoingegneria Ambientale E Mineraria (GEAM) 2016. [Google Scholar]
- Mavrouli, O.; Corominas, J. Vulnerability of simple reinforced concrete buildings to damage by rockfalls. Landslides 2010, 7, 169–180. [Google Scholar] [CrossRef] [Green Version]
- Einstein, H.; Veneziano, D.; Baecher, G.; O’reilly, K. The effect of discontinuity persistence on rock slope stability. In International Journal of Rock Mechanics and Mining Sciences & Geomechanics Abstracts; Elsevier: Amsterdam, The Netherlands, 1983; Volume 20, pp. 227–236. [Google Scholar]
- Elmo, D.; Donati, D.; Stead, D. Challenges in the characterisation of intact rock bridges in rock slopes. Eng. Geol. 2018, 245, 81–96. [Google Scholar] [CrossRef]
- Higgins, J.; Andrew, R. Rockfall types and causes. In Rockfall: Characterization and Control; Transportation Research Board: Washington, DC, USA, 2012; pp. 21–55. [Google Scholar]
- Palmstrøm, A. Characterizing rock masses by the RMi for use in practical rock engineering: Part 1: The development of the Rock Mass index (RMi). Tunn. Undergr. Space Technol. 1996, 11, 175–188. [Google Scholar] [CrossRef]
- Higgins, J.; Andrew, R. Site characterization. In Rockfall: Characterization and Control; Transportation Research Board: Washington, DC, USA, 2012; pp. 177–211. [Google Scholar]
- Castelli, M.; Scavia, C. Fracture mechanics approach to the study of failure in rock. Rev. Française Génie Civ. 2004, 8, 653–682. [Google Scholar] [CrossRef]
- Castelli, M.; Allodi, A.; Scavia, C.; Frayssines, M. A fracture mechanics approach to the study of rock fall triggering. In Proceedings of the 11th ISRM Congress. International Society for Rock Mechanics and Rock Engineering, Lisbon, Portugal, 9–13 July 2007. [Google Scholar]
- Ruiz-Carulla, R.; Corominas, J.; Mavrouli, O. A methodology to obtain the block size distribution of fragmental rockfall deposits. Landslides 2015, 12, 815–825. [Google Scholar] [CrossRef] [Green Version]
- Barbero, M.; Castelli, M.; Cavagnino, G.; De Biagi, V.; Scavia, C.; Vallero, G. Application of a Statistical Approach for the Assessment of Design Block in Rockfall: A Case Study in Sesia Valley (Northern Italy). In Proceedings of the National Conference of the Researchers of Geotechnical Engineering, Penang, Malaysia, 21–22 August 2019; Springer: Berlin/Heidelberg, Germany, 2019; pp. 621–629. [Google Scholar]
- Hungr, O.; Evans, S.; Hazzard, J. Magnitude and frequency of rock falls and rock slides along the main transportation corridors of southwestern British Columbia. Can. Geotech. J. 1999, 36, 224–238. [Google Scholar] [CrossRef]
- Dussauge-Peisser, C.; Helmstetter, A.; Grasso, J.R.; Hantz, D.; Desvarreux, P.; Jeannin, M.; Giraud, A. Probabilistic approach to rock fall hazard assessment: Potential of historical data analysis. Nat. Hazards Earth Syst. Sci. 2002, 2, 15–26. [Google Scholar] [CrossRef]
- Amatruda, G.; Bonnard, C.; Castelli, M.; Forlati, F.; Giacomelli, L.; Morelli, M.; Paro, L.; Piana, F.; Pirulli, M.; Polino, R.; et al. A key approach: The IMIRILAND project method. In Identification and Mitigation of Large Landslide Risks in Europe; CRC Press: Boca Raton, FL, USA, 2004; pp. 31–62. [Google Scholar]
- De Biagi, V.; Napoli, M.L.; Barbero, M.; Peila, D. Estimation of the return period of rockfall blocks according to their size. Nat. Hazards Earth Syst. Sci. 2017, 17, 103–113. [Google Scholar] [CrossRef] [Green Version]
- De Biagi, V. Brief communication: Accuracy of the fallen blocks volume-frequency law. Nat. Hazards Earth Syst. Sci. 2017, 17, 1487–1492. [Google Scholar] [CrossRef] [Green Version]
- Gariano, S.L.; Guzzetti, F. Landslides in a changing climate. Earth-Sci. Rev. 2016, 162, 227–252. [Google Scholar] [CrossRef] [Green Version]
- D’Amato, J.; Hantz, D.; Guerin, A.; Jaboyedoff, M.; Baillet, L.; Mariscal, A. Influence of meteorological factors on rockfall occurrence in a middle mountain limestone cliff. Nat. Hazards Earth Syst. Sci. 2016, 16, 719–735. [Google Scholar]
- Di Crescenzo, G.; Santo, A. High-resolution mapping of rock fall instability through the integration of photogrammetric, geomorphological and engineering–geological surveys. Quat. Int. 2007, 171, 118–130. [Google Scholar] [CrossRef]
- Turner, A.; Duffy, J. Modeling and prediction of rockfall. In Rockfall: Characterization and Control; Turner, A., Schuster, L., Eds.; Transportation Research Board: Washington, DC, USA, 2012. [Google Scholar]
- van Dijke, J.J.; van Westen, C.J. Rockfall hazard: A geomorphologic application of neighbourhood analysis with ILWIS. ITC J. 1990, 1, 40–44. [Google Scholar]
- Castelli, M.; Mallen, L.; Scavia, C. Analisi di run out. In Progetto n 165 PROVIALP; Alpine, P.D.L.V., Alpina, P.D.V., Eds.; Arpa Piemonte: Turin, Italy, 2008. [Google Scholar]
- Ritchie, A.M. Evaluation of rockfall and its control. In Highway Research Record; Highway Research Board: Washington, DC, USA, 1963. [Google Scholar]
- Turner, A.; Duffy, J. Evaluation of the rockfall mechanics. In Rockfall: Characterization and Control; Turner, A., Schuster, L., Eds.; Transportation Research Board: Washington, DC, USA, 2012. [Google Scholar]
- Chau, K.; Wong, R.; Wu, J. Coefficient of restitution and rotational motions of rockfall impacts. Int. J. Rock Mech. Min. Sci. 2002, 39, 69–77. [Google Scholar] [CrossRef]
- Buzzi, O.; Giacomini, A.; Spadari, M. Laboratory investigation on high values of restitution coefficients. Rock Mech. Rock Eng. 2012, 45, 35–43. [Google Scholar] [CrossRef]
- Volkwein, A.; Brügger, L.; Gees, F.; Gerber, W.; Krummenacher, B.; Kummer, P.; Lardon, J.; Sutter, T. Repetitive rockfall trajectory testing. Geosciences 2018, 8, 88. [Google Scholar] [CrossRef] [Green Version]
- Azzoni, A.; La Barbera, G.; Zaninetti, A. Analysis and prediction of rockfalls using a mathematical model. In International Journal of Rock Mechanics and Mining Sciences & Geomechanics Abstracts; Elsevier: Amsterdam, The Netherlands, 1995; Volume 32, pp. 709–724. [Google Scholar]
- Giani, G.P. Rock Slope Stability Analysis; CRC Press: Boca Raton, FL, USA, 1992. [Google Scholar]
- Guzzetti, F.; Crosta, G.; Detti, R.; Agliardi, F. STONE: A computer program for the three-dimensional simulation of rock-falls. Comput. Geosci. 2002, 28, 1079–1093. [Google Scholar] [CrossRef]
- Dorren, L.K.; Berger, F. Stem breakage of trees and energy dissipation during rockfall impacts. Tree Physiol. 2006, 26, 63–71. [Google Scholar] [CrossRef]
- Masuya, H.; Amanuma, K.; Nishikawa, Y.; Tsuji, T. Basic rockfall simulation with consideration of vegetation and application to protection measure. Nat. Hazards Earth Syst. Sci. 2009, 9, 1835–1843. [Google Scholar] [CrossRef]
- Dorren, L.; Berger, F.; Jonsson, M.; Krautblatter, M.; Mölk, M.; Stoffel, M.; Wehrli, A. State of the art in rockfall–forest interactions. Schweiz. Z. Fur Forstwes. 2007, 158, 128–141. [Google Scholar] [CrossRef] [Green Version]
- Dorren, L.K. Rockyfor3D (v5. 2) revealed. In Transparent Description of the Complete 3D Rockfall Model; EcorisQ Paper; ecorisQ: Geneva, Switzerland, 2015; Available online: www.ecorisq.org (accessed on 25 February 2020).
- Agliardi, F.; Crosta, G.; Frattini, P. Integrating rockfall risk assessment and countermeasure design by 3D modelling techniques. Nat. Hazards Earth Syst. Sci. 2009, 9, 1059. [Google Scholar] [CrossRef] [Green Version]
- Stoffel, M.; Schneuwly, D.; Bollschweiler, M.; Lievre, I.; Delaloye, R.; Myint, M.; Monbaron, M. Analyzing rockfall activity (1600–2002) in a protection forest—a case study using dendrogeomorphology. Geomorphology 2005, 68, 224–241. [Google Scholar] [CrossRef]
- Moos, C.; Dorren, L.; Stoffel, M. Quantifying the effect of forests on frequency and intensity of rockfalls. Nat. Hazards Earth Syst. Sci. 2017, 17, 291. [Google Scholar] [CrossRef] [Green Version]
- Mainieri, R.; Lopez-Saez, J.; Corona, C.; Stoffel, M.; Bourrier, F.; Eckert, N. Assessment of the recurrence intervals of rockfall through dendrogeomorphology and counting scar approach: A comparative study in a mixed forest stand from the Vercors massif (French Alps). Geomorphology 2019, 340, 160–171. [Google Scholar] [CrossRef]
- Crosta, G.; Agliardi, F. Parametric evaluation of 3D dispersion of rockfall trajectories. Nat. Hazards Earth Syst. Sci. 2004, 4, 583–598. [Google Scholar] [CrossRef] [Green Version]
- Quinn, P.; Beven, K.; Chevallier, P.; Planchon, O. The prediction of hillslope flow paths for distributed hydrological modelling using digital terrain models. Hydrol. Process. 1991, 5, 59–79. [Google Scholar] [CrossRef]
- Meissl, G. Modelling the runout distances of rockfall using a geographic information system. Z. FÜR Geomorphol. Suppl. 2001, 125, 129–137. [Google Scholar]
- Wichmann, V. The Gravitational Process Path (GPP) model (v1. 0)—a GIS-based simulation framework for gravitational processes. Geosci. Model Dev. 2017, 10, 3309–3327. [Google Scholar] [CrossRef] [Green Version]
- Dorren, L.K. A review of rockfall mechanics and modelling approaches. Prog. Phys. Geogr. 2003, 27, 69–87. [Google Scholar] [CrossRef]
- O’Callaghan, J.F.; Mark, D.M. The extraction of drainage networks from digital elevation data. Comput. Vision, Graph. Image Process. 1984, 28, 323–344. [Google Scholar] [CrossRef]
- Evans, S.; Hungr, O. The assessment of rockfall hazard at the base of talus slopes. Can. Geotech. J. 1993, 30, 620–636. [Google Scholar] [CrossRef]
- Jaboyedoff, M.; Labiouse, V. Preliminary estimation of rockfall runout zones. Nat. Hazards Earth Syst. Sci. 2011, 11, 819–828. [Google Scholar] [CrossRef] [Green Version]
- Jaboyedoff, M.; Labiouse, V. CONEFALL: A program for the quick preliminary estimation of the rock-fall potential of propagation zones. Comput. Geosci. 2003, Submitted. [Google Scholar]
- Pierson, L. Rockfall hazard Rating Systems. In Rockfall: Characterization and Control; Turner, A., Schuster, L., Eds.; Transportation Research Board: Washington, DC, USA, 2012. [Google Scholar]
- Castelli, M.; Scavia, C. A multidisciplinary methodology for hazard and risk assessment of rock avalanches. Rock Mech. Rock Eng. 2008, 41, 3–36. [Google Scholar] [CrossRef]
- Mavrouli, O.; Giannopoulos, P.; Carbonell, J.; Syrmakezis, C. Damage analysis of masonry structures subjected to rockfalls. Landslides 2017, 14, 891–904. [Google Scholar] [CrossRef]
- Hoek, E. Practical Rock Engineering. Available online: https://www.rocscience.com/assets/resources/learning/hoek/Practical-Rock-Engineering-Full-Text.pdf (accessed on 3 March 2020).
- Mignelli, C.; Peila, D.; Russo, S.L.; Ratto, S.M.; Broccolato, M. Analysis of rockfall risk on mountainside roads: Evaluation of the effect of protection devices. Nat. Hazards 2014, 73, 23–35. [Google Scholar] [CrossRef]
- Budetta, P.; De Luca, C.; Nappi, M. Quantitative rockfall risk assessment for an important road by means of the rockfall risk management (RO. MA.) method. Bull. Eng. Geol. Environ. 2016, 75, 1377–1397. [Google Scholar] [CrossRef]
- Cardinali, M.; Reichenbach, P.; Guzzetti, F.; Ardizzone, F.; Antonini, G.; Galli, M.; Cacciano, M.; Castellani, M.; Salvati, P. A geomorphological approach to the estimation of landslide hazards and risks in Umbria, Central Italy. Nat. Hazards Earth Syst. Sci. 2002, 2, 57–72. [Google Scholar] [CrossRef] [Green Version]
- Papathoma-Köhle, M.; Zischg, A.; Fuchs, S.; Glade, T.; Keiler, M. Loss estimation for landslides in mountain areas–An integrated toolbox for vulnerability assessment and damage documentation. Environ. Model. Softw. 2015, 63, 156–169. [Google Scholar] [CrossRef]
- Hungr, O. Some methods of landslide hazard intensity mapping. In Landslide Risk Assessment; Routledge: Abingdon, UK, 2018; pp. 215–226. [Google Scholar]
- Uzielli, M.; Nadim, F.; Lacasse, S.; Kaynia, A.M. A conceptual framework for quantitative estimation of physical vulnerability to landslides. Eng. Geol. 2008, 102, 251–256. [Google Scholar] [CrossRef]
- AGSO. Natural Hazards and the Risk they Pose to South-East Queensland; Technical Report; AGSO Geoscience Australia: Canberra, Australia, 2001.
- UNPD; UNESCO. Vulnerability and Seismic Hazard. Vulnerability Analysis in the Balkan Region; Project RER/79/014 WG.B Final Report; Technical Report; AUNPD/UNESCO: Paris, France, 1982. [Google Scholar]
- Mavrouli, O.; Corominas, J. Rockfall vulnerability assessment for reinforced concrete buildings. Nat. Hazards Earth Syst. Sci. 2010, 10, 2055–2066. [Google Scholar] [CrossRef] [Green Version]
- Heinimann, H. Risikoanalyse bei gravitativen Naturgefahren—Fallbeispiele und Daten. In Umwelt-Materialen; Federal Office for Environment, Forest and Landscape: Bern, Switzerland, 1999; Volume 107/I. [Google Scholar]
- Dai, F.; Lee, C.; Ngai, Y.Y. Landslide risk assessment and management: An overview. Eng. Geol. 2002, 64, 65–87. [Google Scholar] [CrossRef]
- Remondo, J.; Bonachea, J.; Cendrero, A. Quantitative landslide risk assessment and mapping on the basis of recent occurrences. Geomorphology 2008, 94, 496–507. [Google Scholar] [CrossRef]
- Peila, D.; Guardini, C. Use of the event tree to assess the risk reduction obtained from rockfall protection devices. Nat. Hazards Earth Syst. Sci. 2008, 8, 1441–1450. [Google Scholar] [CrossRef] [Green Version]
- Pierson, L.A.; Davis, S.A.; Van Vickle, R. Rockfall Hazard Rating System: Implementation Manual; Technical Report; Transportation Research Board: Washington, DC, USA, 1990. [Google Scholar]
- Budetta, P. Assessment of rockfall risk along roads. Nat. Hazards Earth Syst. Sci. 2004, 4, 71–81. [Google Scholar] [CrossRef] [Green Version]
- Mölk, M.; Poisel, R.; Weilbold, J.; Angerer, H. Rockfall rating systems: Is there a Comprehensive method for hazard zoning in populated areas? In Proceedings of the 11th Interpraevent 2008 Congress, Dornbirn (Vorarlberg), Austria, 26–30 May 2008; Volume 2.
- Peila, D.; Ronco, C. Design of rockfall net fences and the new ETAG 027 European guideline. Nat. Hazards Earth Syst. Sci. 2009, 9, 1291–1298. [Google Scholar] [CrossRef] [Green Version]
- Gottardi, G.; Govoni, L.; Mentani, A.; Ranalli, M.; Strada, C. The effectiveness of protection systems toward rockfall risk mitigation. Geotech. Saf. Risk. ISGSR 2011 2011, 2011, 157–164. [Google Scholar]
- Muhunthan, B.; Shu, S.; Sasiharan, N.; Hattaleh, O.; Badger, T.C.; Lowell, S.M.; Duffy, J.D.; Center, W.S.T. Analysis and Design of Wire Mesh/Cable Net Slope Protection; California Department of Transportation: Sacramento, CA, USA, 2005.
- Bertolo, P.; Oggeri, C.; Peila, D. Full-scale testing of draped nets for rock fall protection. Can. Geotech. J. 2009, 46, 306–317. [Google Scholar] [CrossRef]
- Peila, D.; Oggeri, C.; Castiglia, C. Ground reinforced embankments for rockfall protection: Design and evaluation of full scale tests. Landslides 2007, 4, 255–265. [Google Scholar] [CrossRef]
- Lambert, S.; Bourrier, F. Design of rockfall protection embankments: A review. Eng. Geol. 2013, 154, 77–88. [Google Scholar] [CrossRef]
- Lambert, S.; Kister, B. Efficiency assessment of existing rockfall protection embankments based on an impact strength criterion. Eng. Geol. 2018, 243, 1–9. [Google Scholar] [CrossRef]
- Gorlato, A.; Gottardi, G.; Govoni, L.; Ranalli, M.; Mentani, A.; Strada, C. The role of falling rock protection barriers in the context of landslide risk analysis and mitigation. In Proceedings of the 12th INTERPRAEVENT Congress, Grenoble, France, 23–26 April 2012; Volume 2, pp. 699–706. [Google Scholar]
- Marchelli, M.; De Biagi, V.; Peila, D. A quick-assessment procedure to evaluate the degree of conservation of rockfall drapery meshes. Frat. Ed Integrità Strutt. 2019, 13, 437–450. [Google Scholar] [CrossRef] [Green Version]
- Bourrier, F.; Lambert, S.; Baroth, J. A reliability-based approach for the design of rockfall protection fences. Rock Mech. Rock Eng. 2015, 48, 247–259. [Google Scholar] [CrossRef]
- Toe, D.; Mentani, A.; Govoni, L.; Bourrier, F.; Gottardi, G.; Lambert, S. Introducing meta-models for a more efficient hazard mitigation strategy with rockfall protection barriers. Rock Mech. Rock Eng. 2018, 51, 1097–1109. [Google Scholar] [CrossRef] [Green Version]
- Coulibaly, J.B.; Chanut, M.A.; Lambert, S.; Nicot, F. Toward a Generic Computational Approach for Flexible Rockfall Barrier Modeling. Rock Mech. Rock Eng. 2019, 52, 4475–4496. [Google Scholar] [CrossRef]
- Yu, Z.; Zhao, L.; Liu, Y.; Zhao, S.; Xu, H.; Chan, S. Studies on flexible rockfall barriers for failure modes, mechanisms and design strategies: A case study of Western China. Landslides 2019, 16, 347–362. [Google Scholar] [CrossRef]
- Dimasi, C.; Luciani, A.; Martinelli, D.; Paganone, M.; Peila, D. Controllo delle barriere paramassi a rete per la loro gestione e manutenzione. Geam. Geoing. Ambient. Mineraria 2015, LII, 65–73. [Google Scholar]
- EAD 340059-00-0106. Falling Rock Protection Kits; Standard; EOTA: Brussels, Belgium, 2018. [Google Scholar]
- Castanon-Jano, L.; Blanco-Fernandez, E.; Castro-Fresno, D.; Ballester-Muñoz, F. Energy dissipating devices in falling rock protection barriers. Rock Mech. Rock Eng. 2017, 50, 603–619. [Google Scholar] [CrossRef] [Green Version]
- ETAG, E. 027-Guideline for the European Technical Approval of Falling Rock Protection Kits; EOTA: Brusseles, Belgium, 2008. [Google Scholar]
- UNI EN 13411-5:2009. Estremità per funi di Acciaio - Sicurezza - Parte 5: Morsetti per Funi; Standard; UNI: Milan, Italy, 2009. [Google Scholar]
Figure 1.
Cels-Morlière study case (red dot in the two maps above): (a) Location of the site within the Italian peninsula and the Piedmont region; (b) geographical overview of the site within the North-Western Italian Alps.
Figure 1.
Cels-Morlière study case (red dot in the two maps above): (a) Location of the site within the Italian peninsula and the Piedmont region; (b) geographical overview of the site within the North-Western Italian Alps.

Figure 2.
Overview of the site involved in the 2011 rockfall event: (a) Orthophoto of the Cels-Morlière area. The rock face is highlighted with a white background, the hamlet is colored in light blue, and the dotted white line refers to the flexible barrier impacted during the 2011 event. The red circle shows the detachment niche of the 2011 event, while the red arrow and the white circle indicate the estimated trajectory of the blocks and the impacted buildings; (b) top: (courtesy of the Piedmont Region) the observed damage on the Eastern impacted building (i.e., Bld. 2); bottom: the location of the three impacted masonry buildings within the Cels-Morlière hamlet.

Figure 3.
Results of the application of the statistical method [37] to the case study of Cels-Morlière. It can be seen that to longer return periods correspond larger volumes and, thus, more dangerous scenarios.
Figure 3.
Results of the application of the statistical method [37] to the case study of Cels-Morlière. It can be seen that to longer return periods correspond larger volumes and, thus, more dangerous scenarios.

Figure 4.
Map of the mean kinetic energy obtained with the software Rockyfor3D for the back-analyses of the November 2011 event in Cels-Morlière (rockfall source zone in yellow, impacted buildings in red, barrier in white dashed line): (a) Back-analysis of the main event (i.e., cubic block with volume of 5 m3, which represents the average volume estimated for the 2011 event). It can be seen that the intensity of the phenomenon, evaluated at the involved buildings (Bld. 1 to 3) is compatible with the surveyed damage levels; (b) back-analysis of the re-mobilization of the 40 m3 cubic block. The detachment niche is located uphill the barrier alignments.

Figure 5.
Maximum extent of the invasion areas obtained via the probabilistic software Rockyfor3D (red: 5 years—1.5 m3, yellow: 30 years—5 m3, green: 100 years—10 m3).
Figure 5.
Maximum extent of the invasion areas obtained via the probabilistic software Rockyfor3D (red: 5 years—1.5 m3, yellow: 30 years—5 m3, green: 100 years—10 m3).

Figure 6.
Forecasting analyses of the 5 m3 rockfall scenario: (a) The Rockyfor3D simulation shows a wide runout area involving the inhabited area which was effectively subjected to the 2011 event. Furthermore, the whole hamlet can be interested by this rockfalls; (b) the QPROTO analysis highlights the same invasion zones of Rockyfor3D. A little difference in the north-eastern part can be observed, in which the descent paths evaluated in Rockyfor3D canalized into a stream. The energy values computed with QPROTO are higher than Rockyfor3D values because of the different mechanical models.

Figure 7.
Two outputs of the time-independent hazard maps obtained through the QPROTO plugin: (a) The count file relates to the numbers of visibility cones that view a specific cell of the slope. It can be seen that the middle part of the cliff (uphill the buildings involved in the 2011 events) has the highest visibility; (b) in the susceptibility raster, the same result can be found but in a qualitative scale ranging from very low to very high susceptibility.

Figure 8.
Weighted energy files provided by QPROTO plugin: (a) The w_en file provides a qualitative representation of the parameter over the estimated invasion zone. The result shows the maximum products between and the kinetic energy in each cell; (b) the w_tot_en gives the same areas highlighted in the maps of Figure 7a,b

Figure 9.
Map of the Cels-Morlière case study with the location of the two investigated barriers.

Figure 10.
View of the protection works observed during the survey activity at Cels-Morlière: (a) Superimposition of the two rockfall net fence alignments: the one installed in 2016 (Barrier 2) and the one installed in 1984 (Barrier 1); (b) side view of the 2016 barrier (Barrier 2).
Figure 10.
View of the protection works observed during the survey activity at Cels-Morlière: (a) Superimposition of the two rockfall net fence alignments: the one installed in 2016 (Barrier 2) and the one installed in 1984 (Barrier 1); (b) side view of the 2016 barrier (Barrier 2).


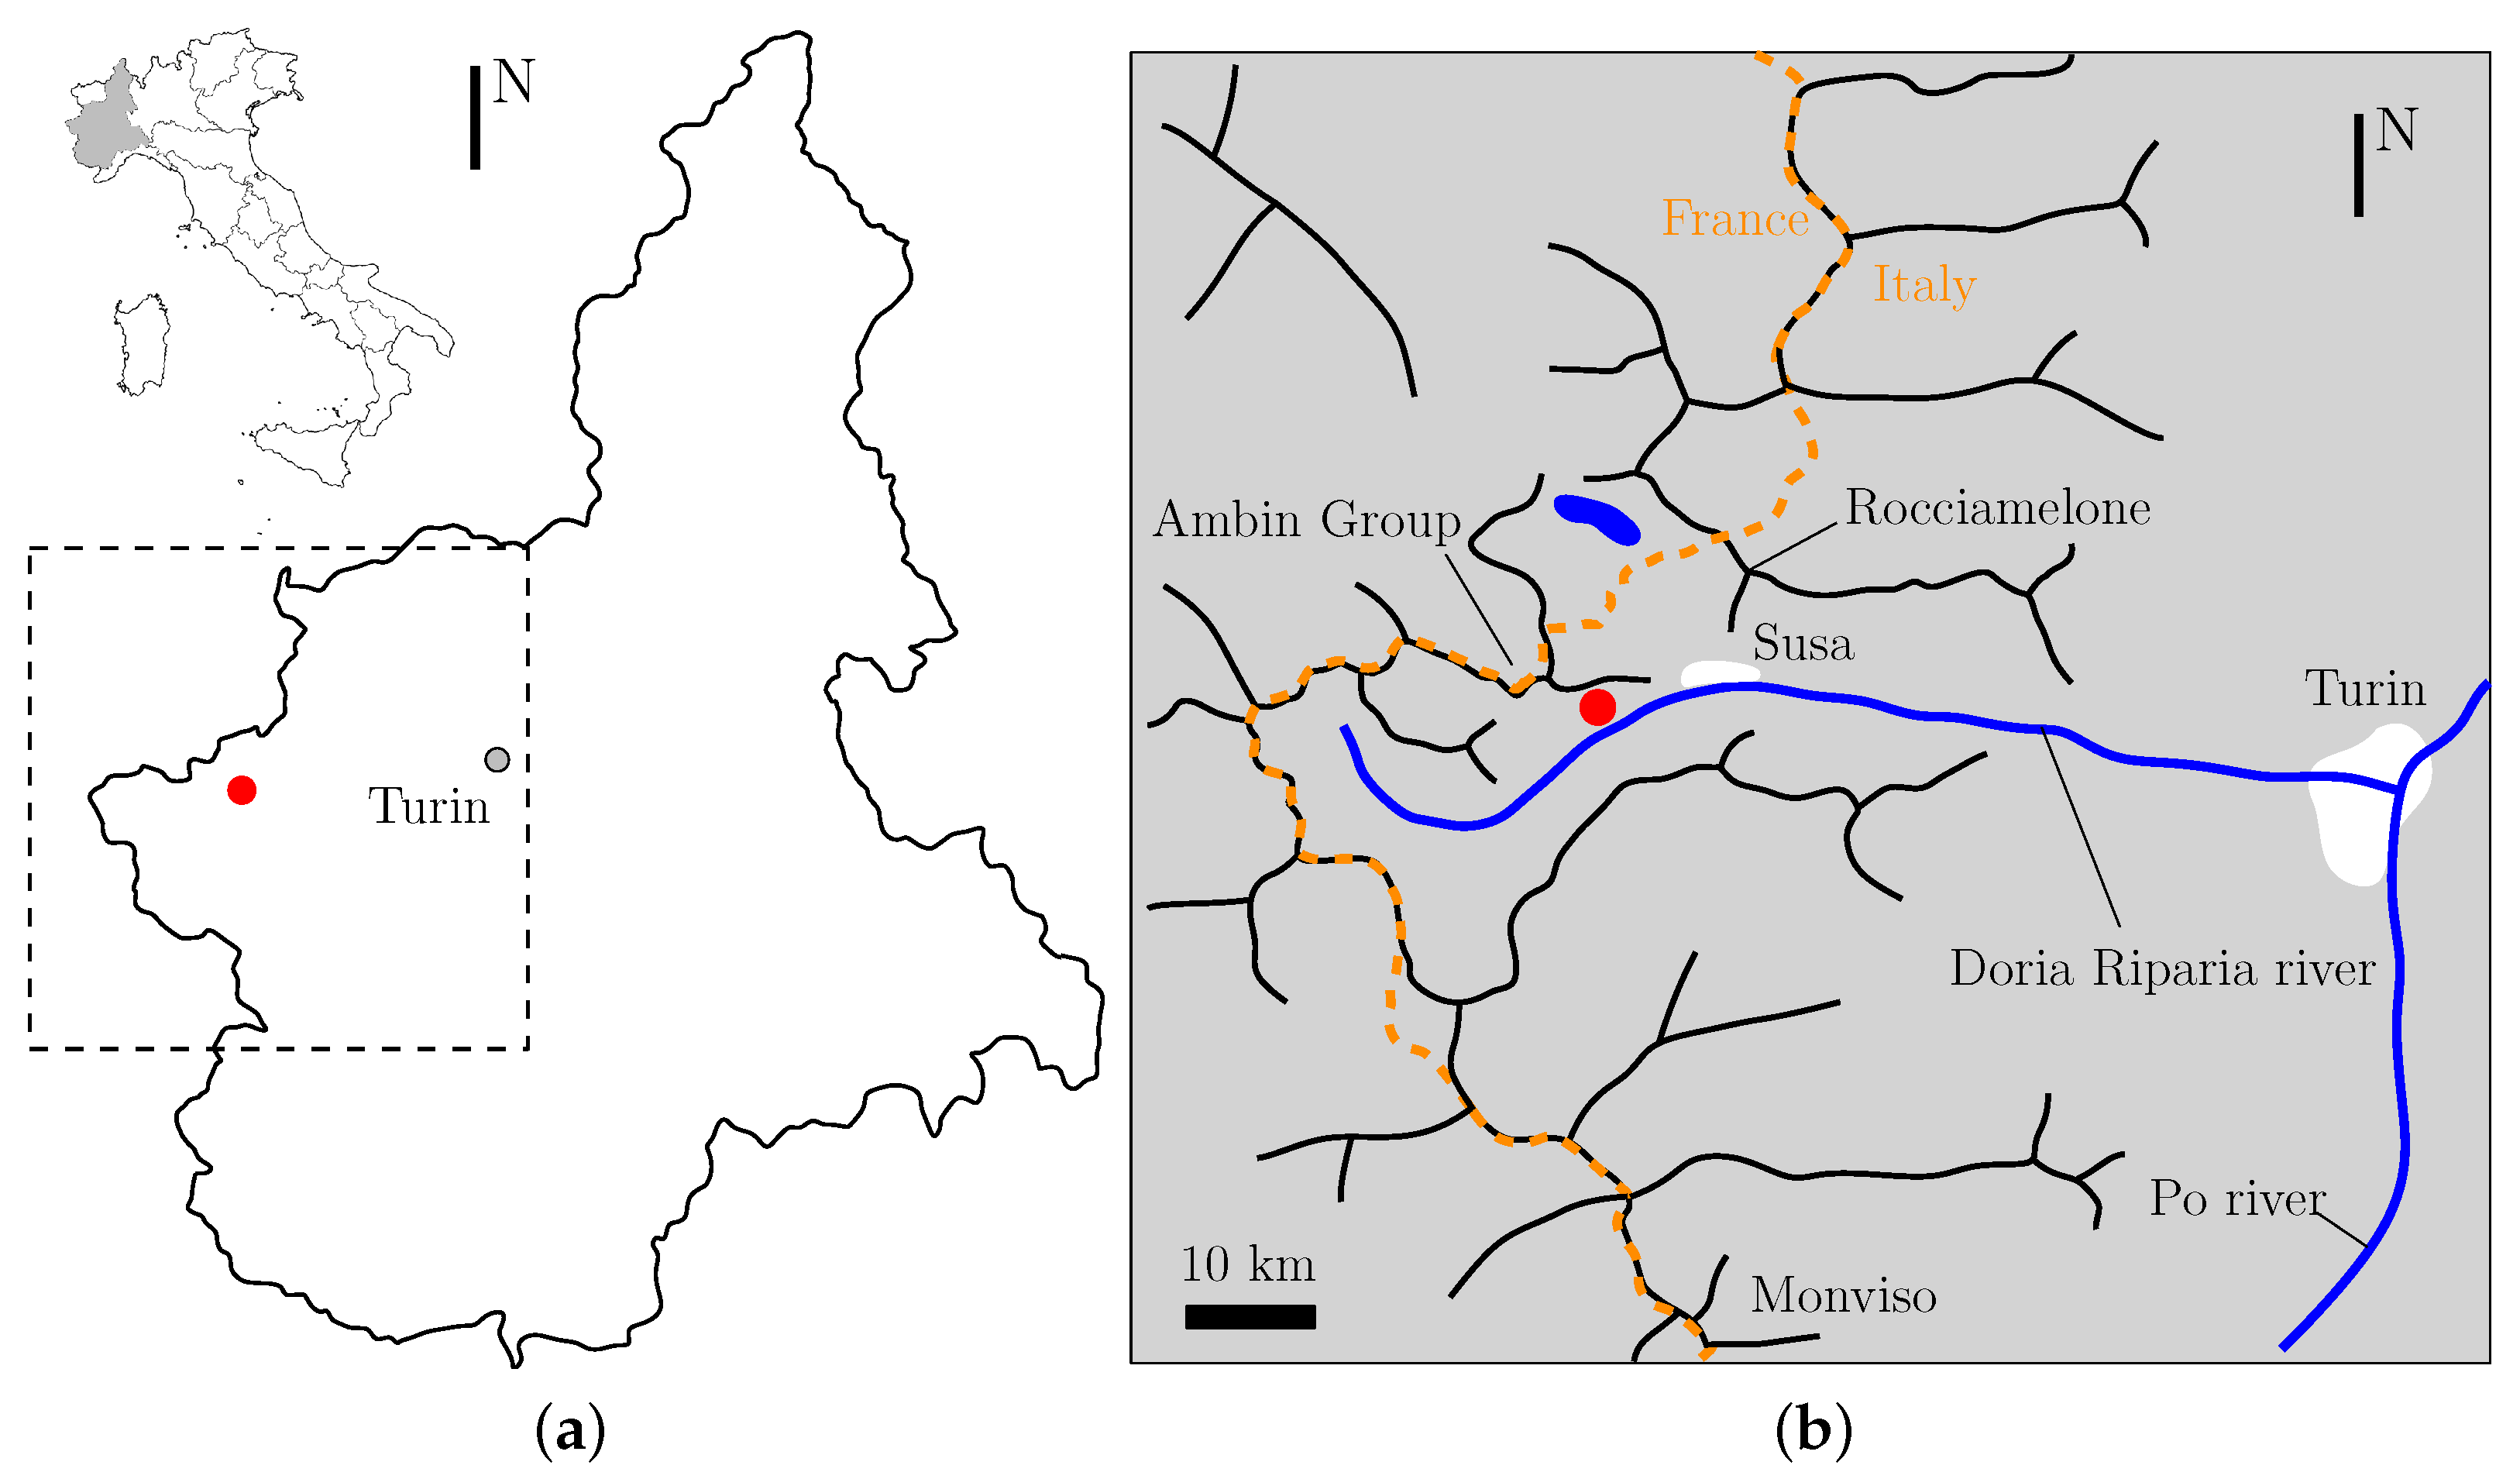
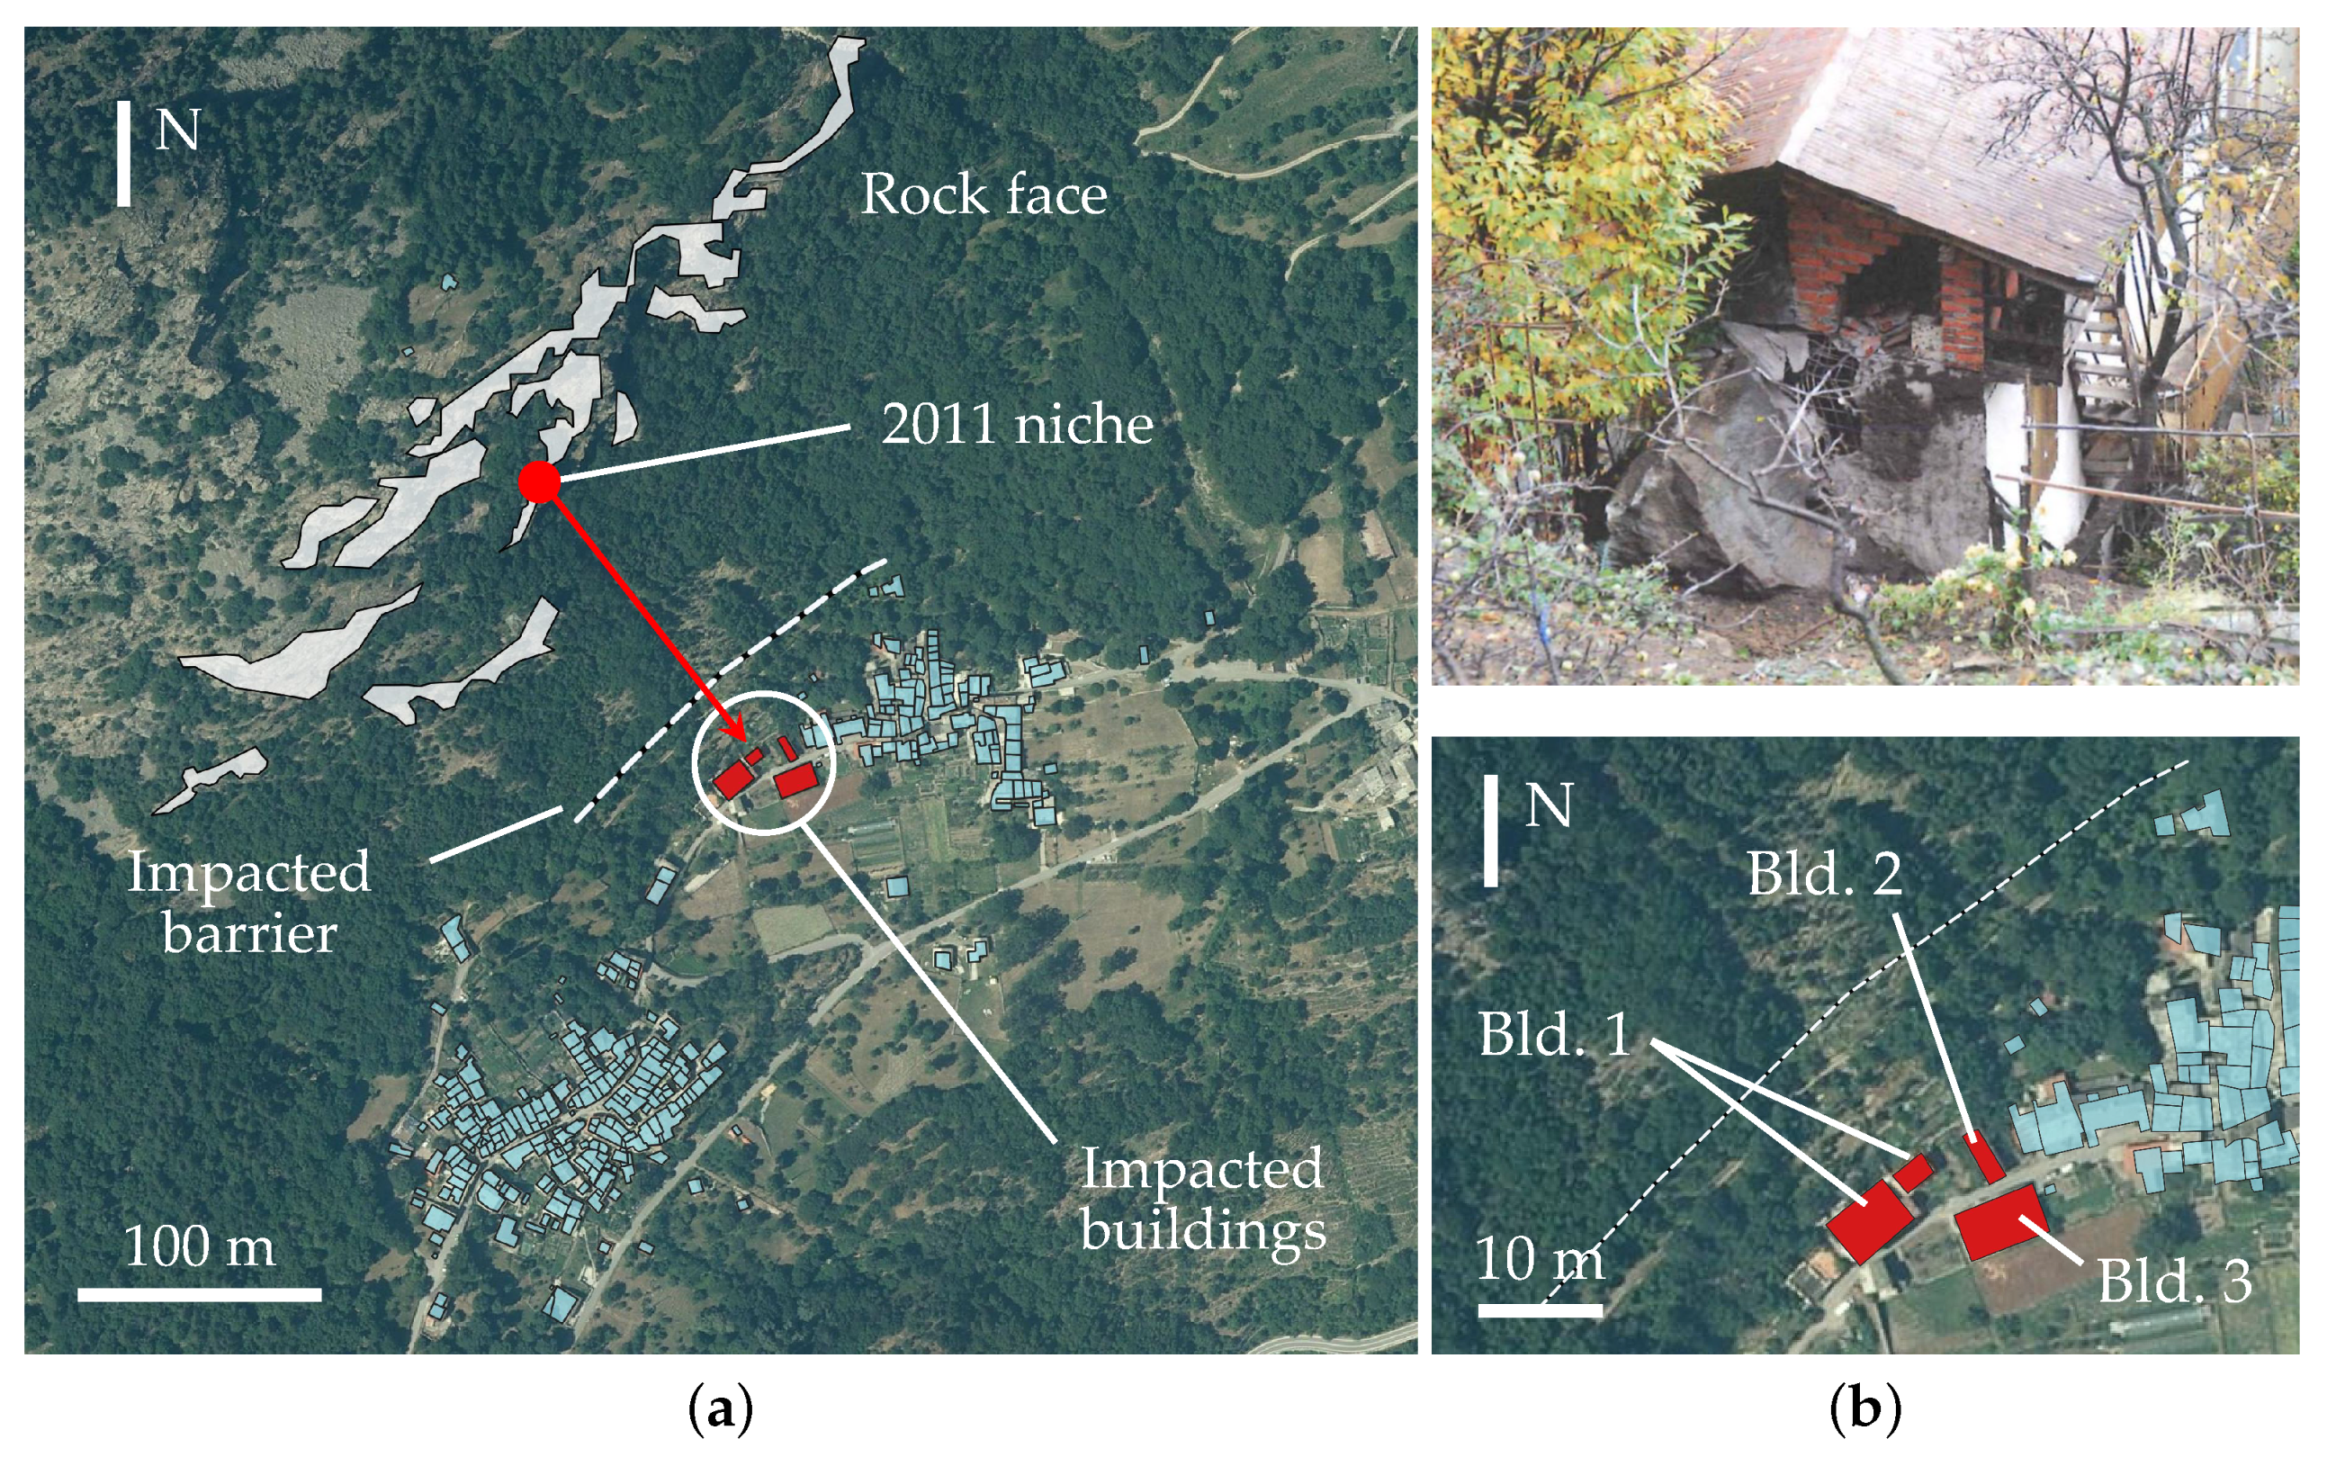
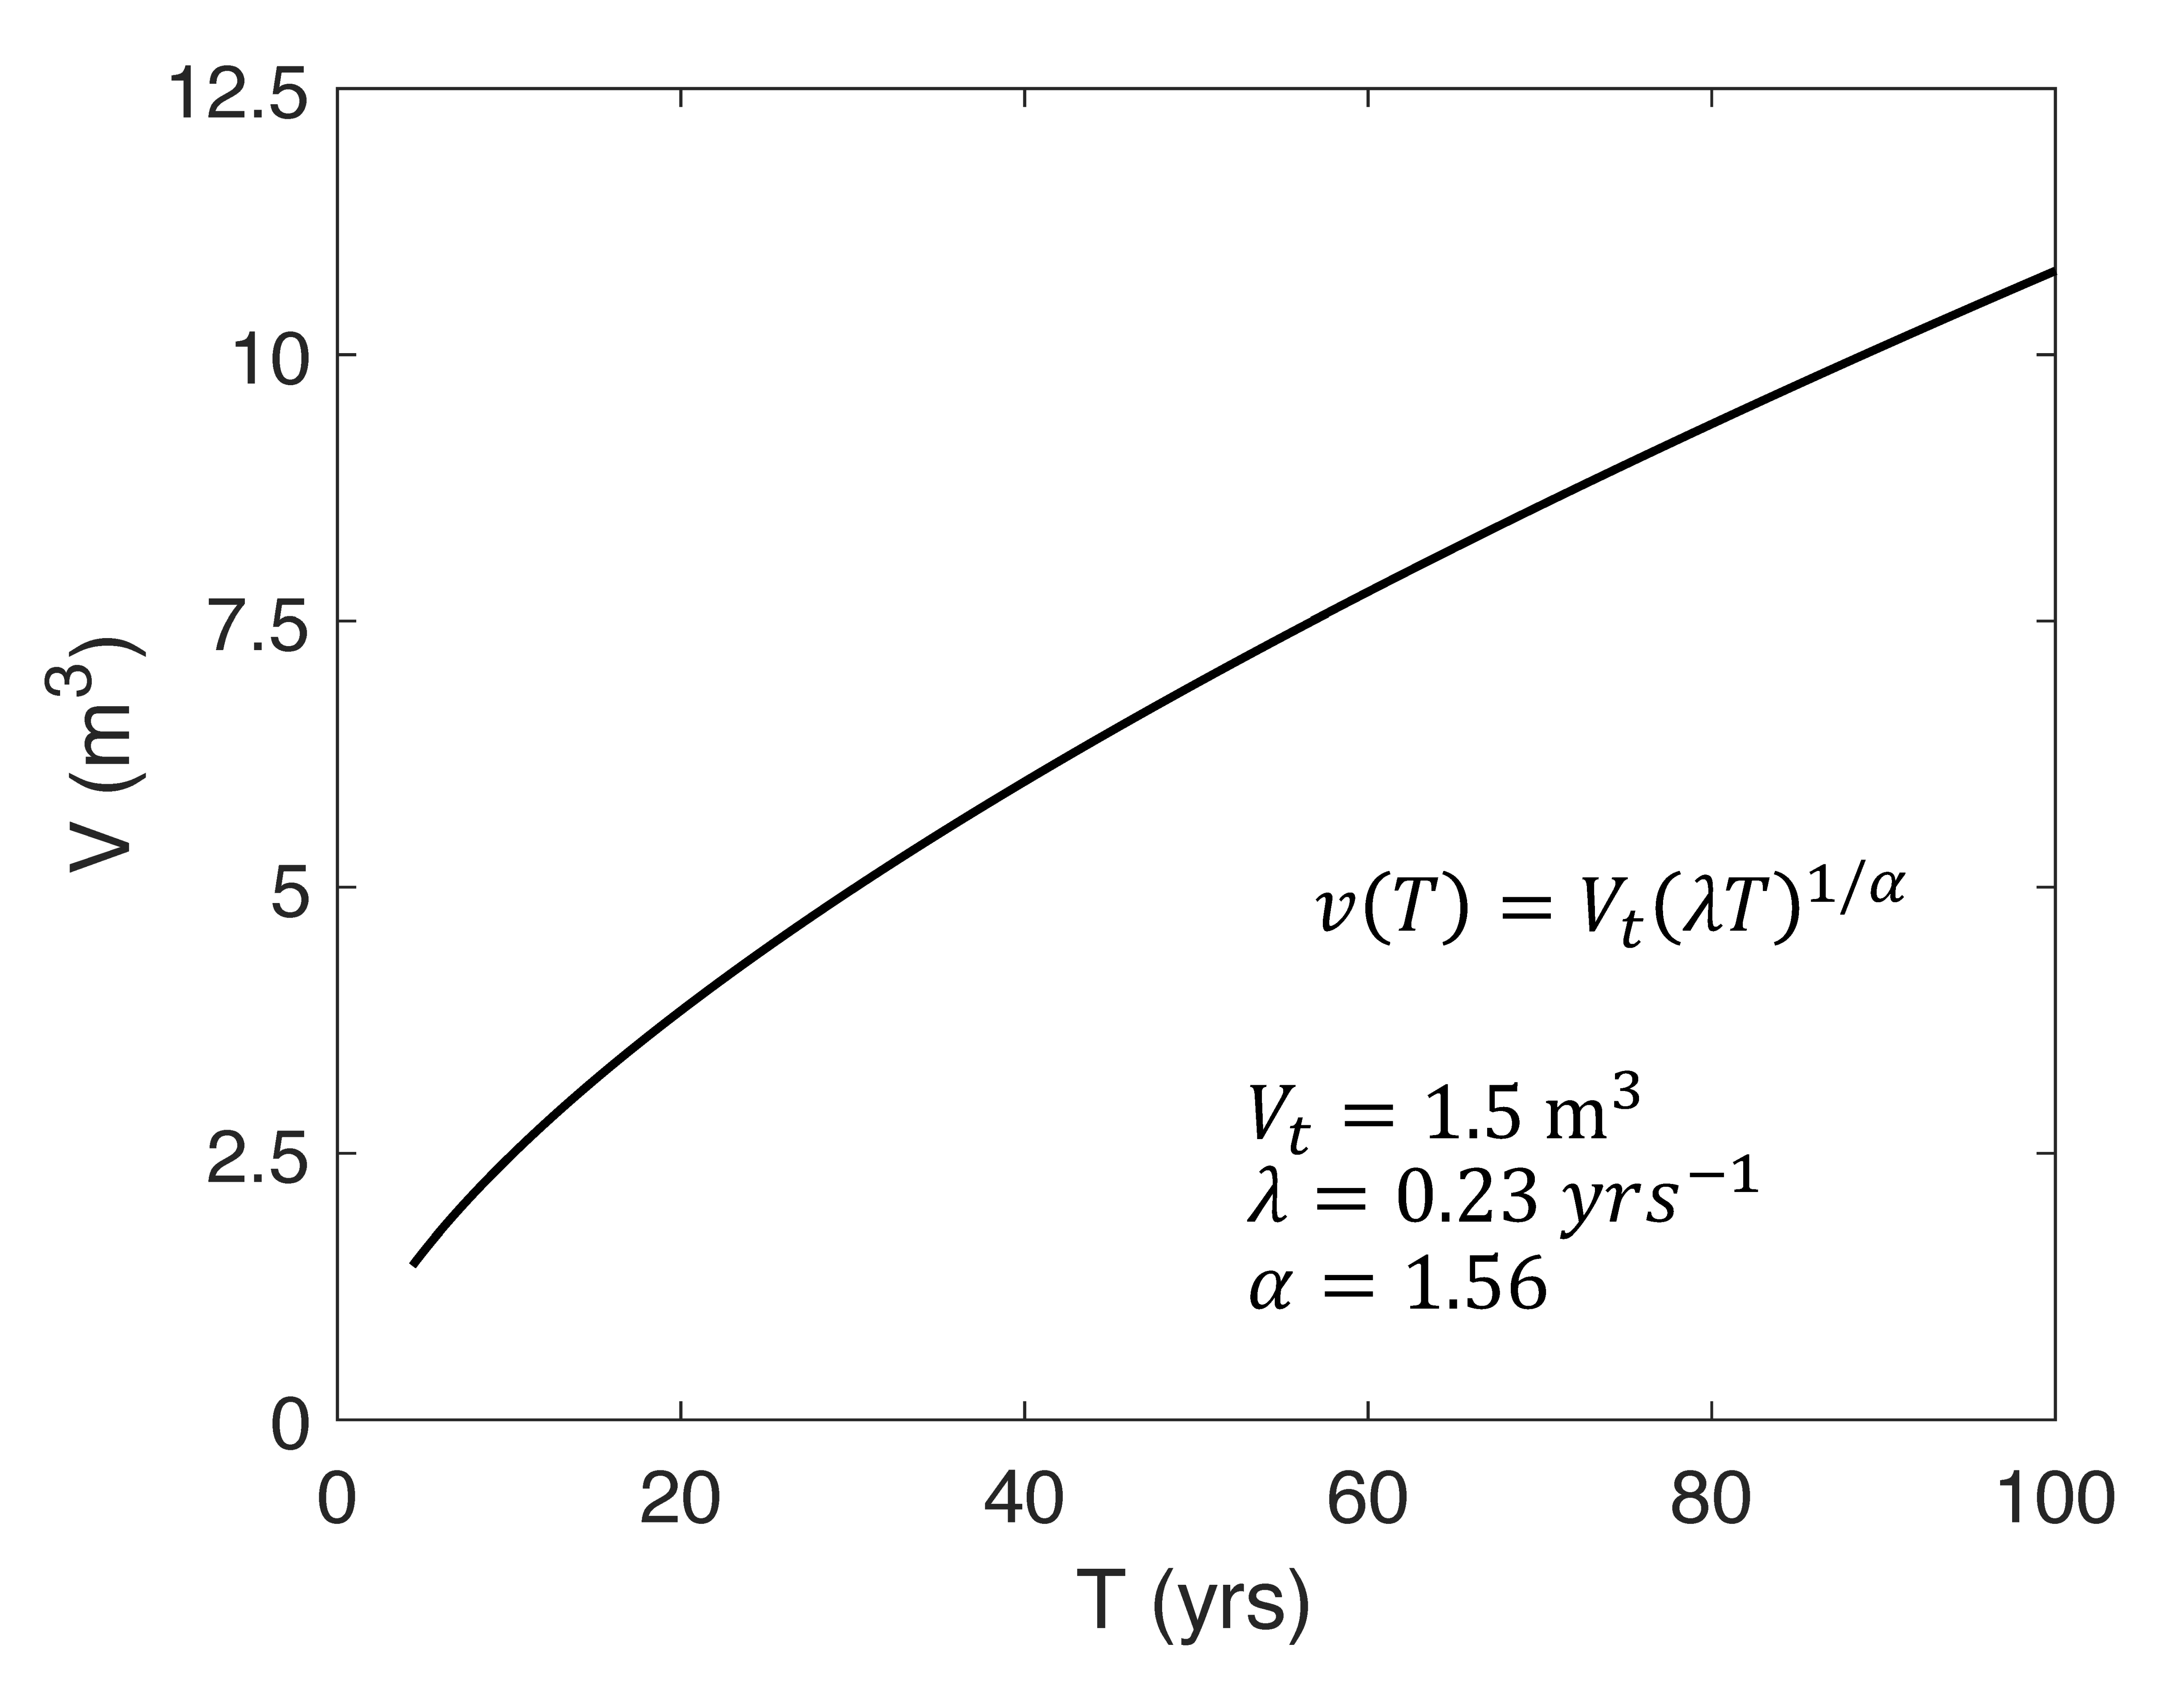
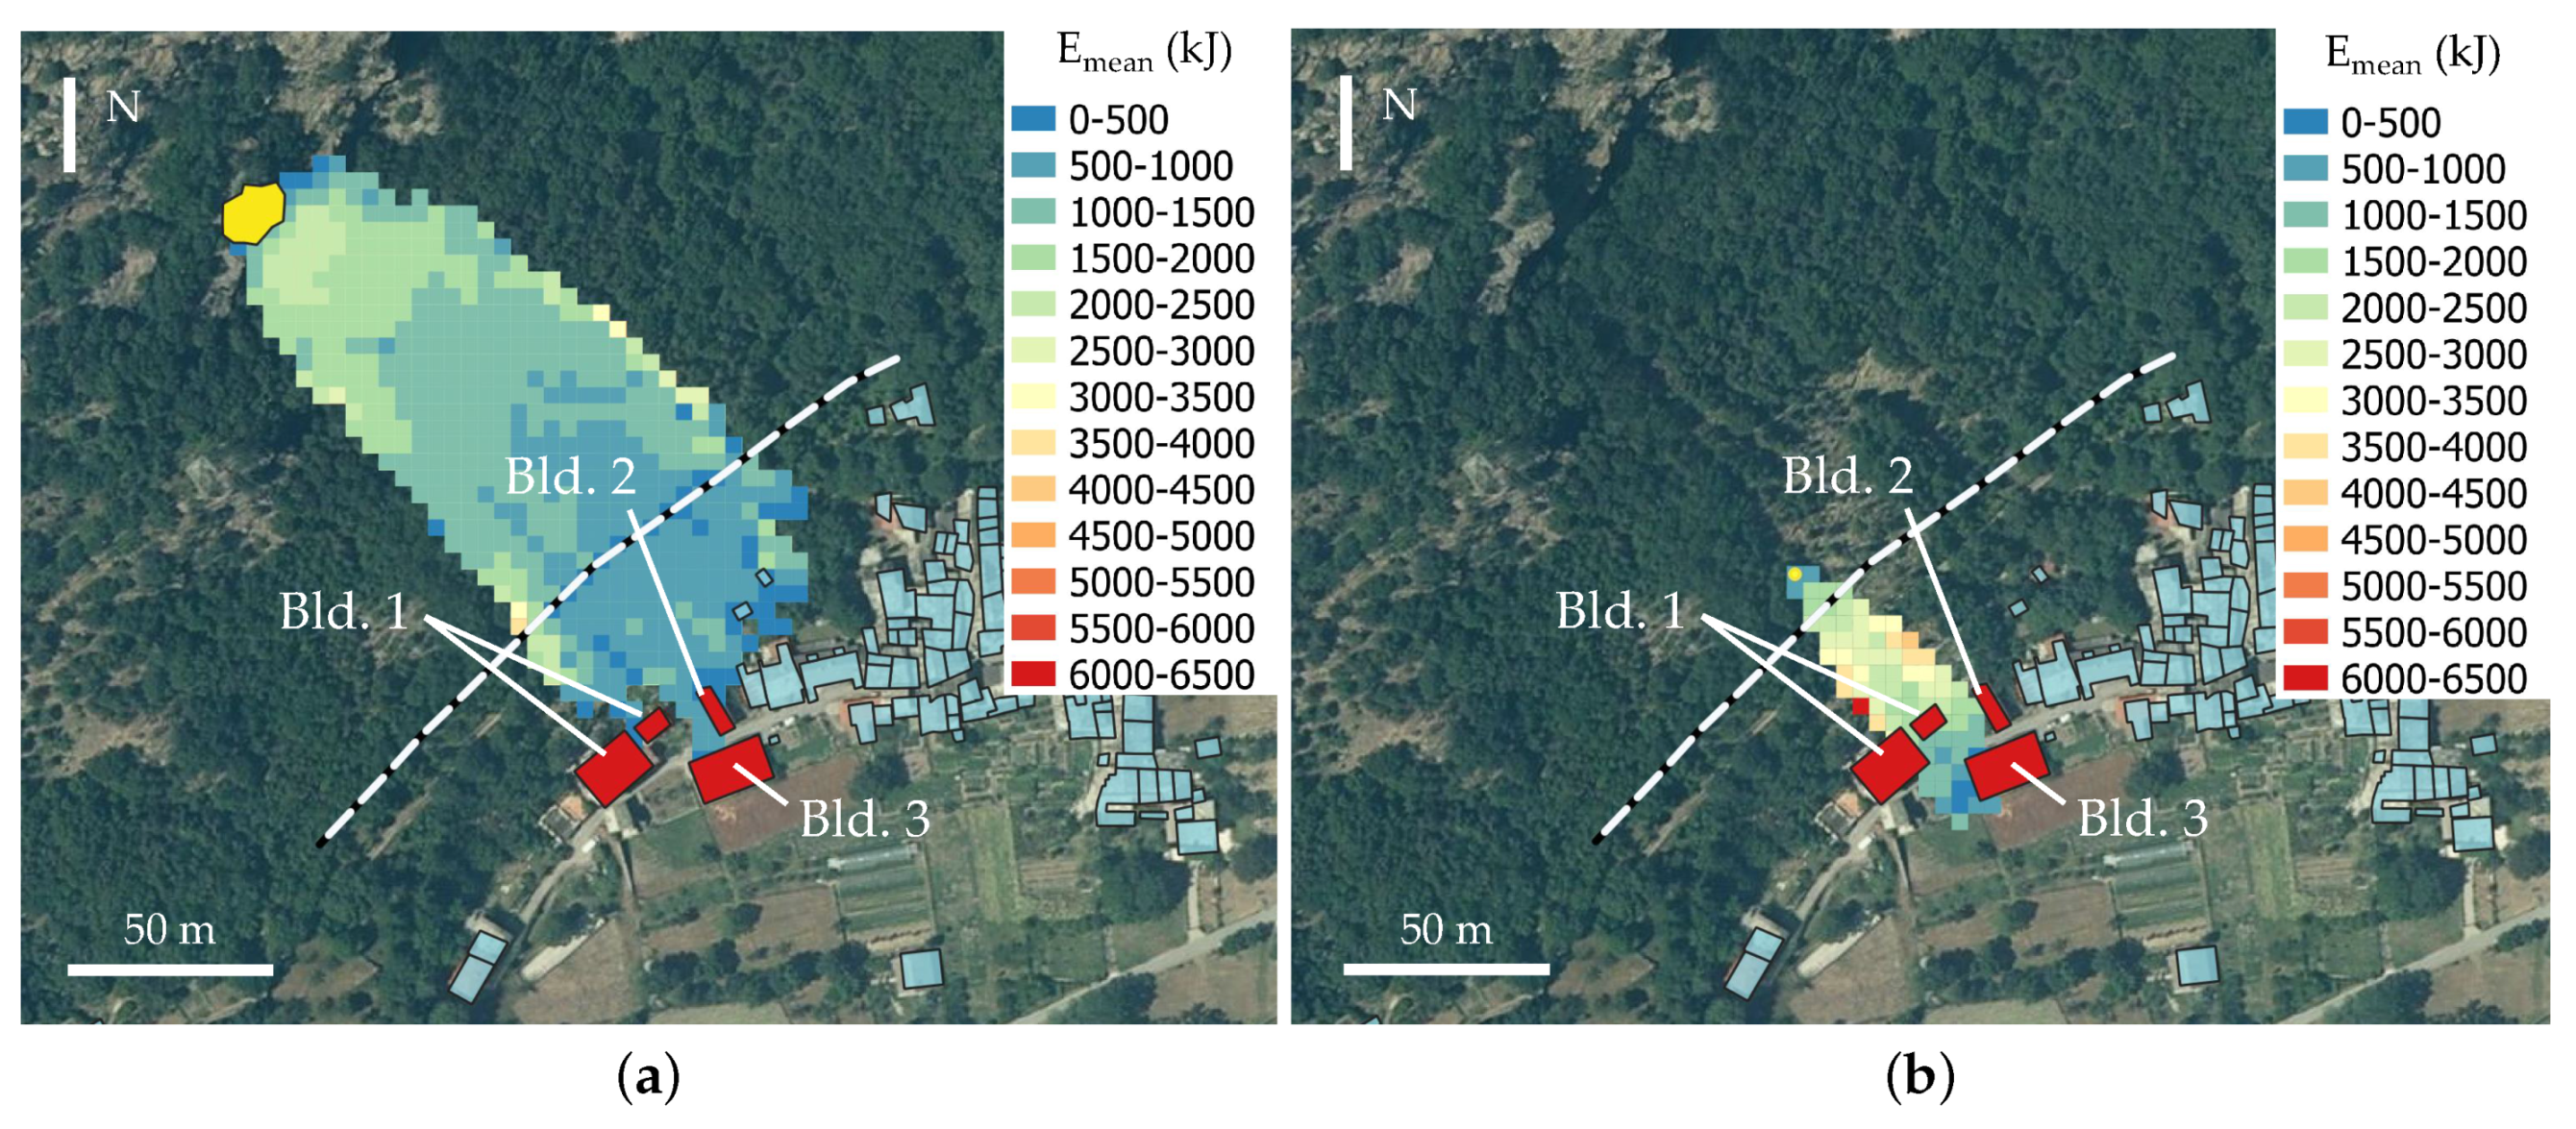
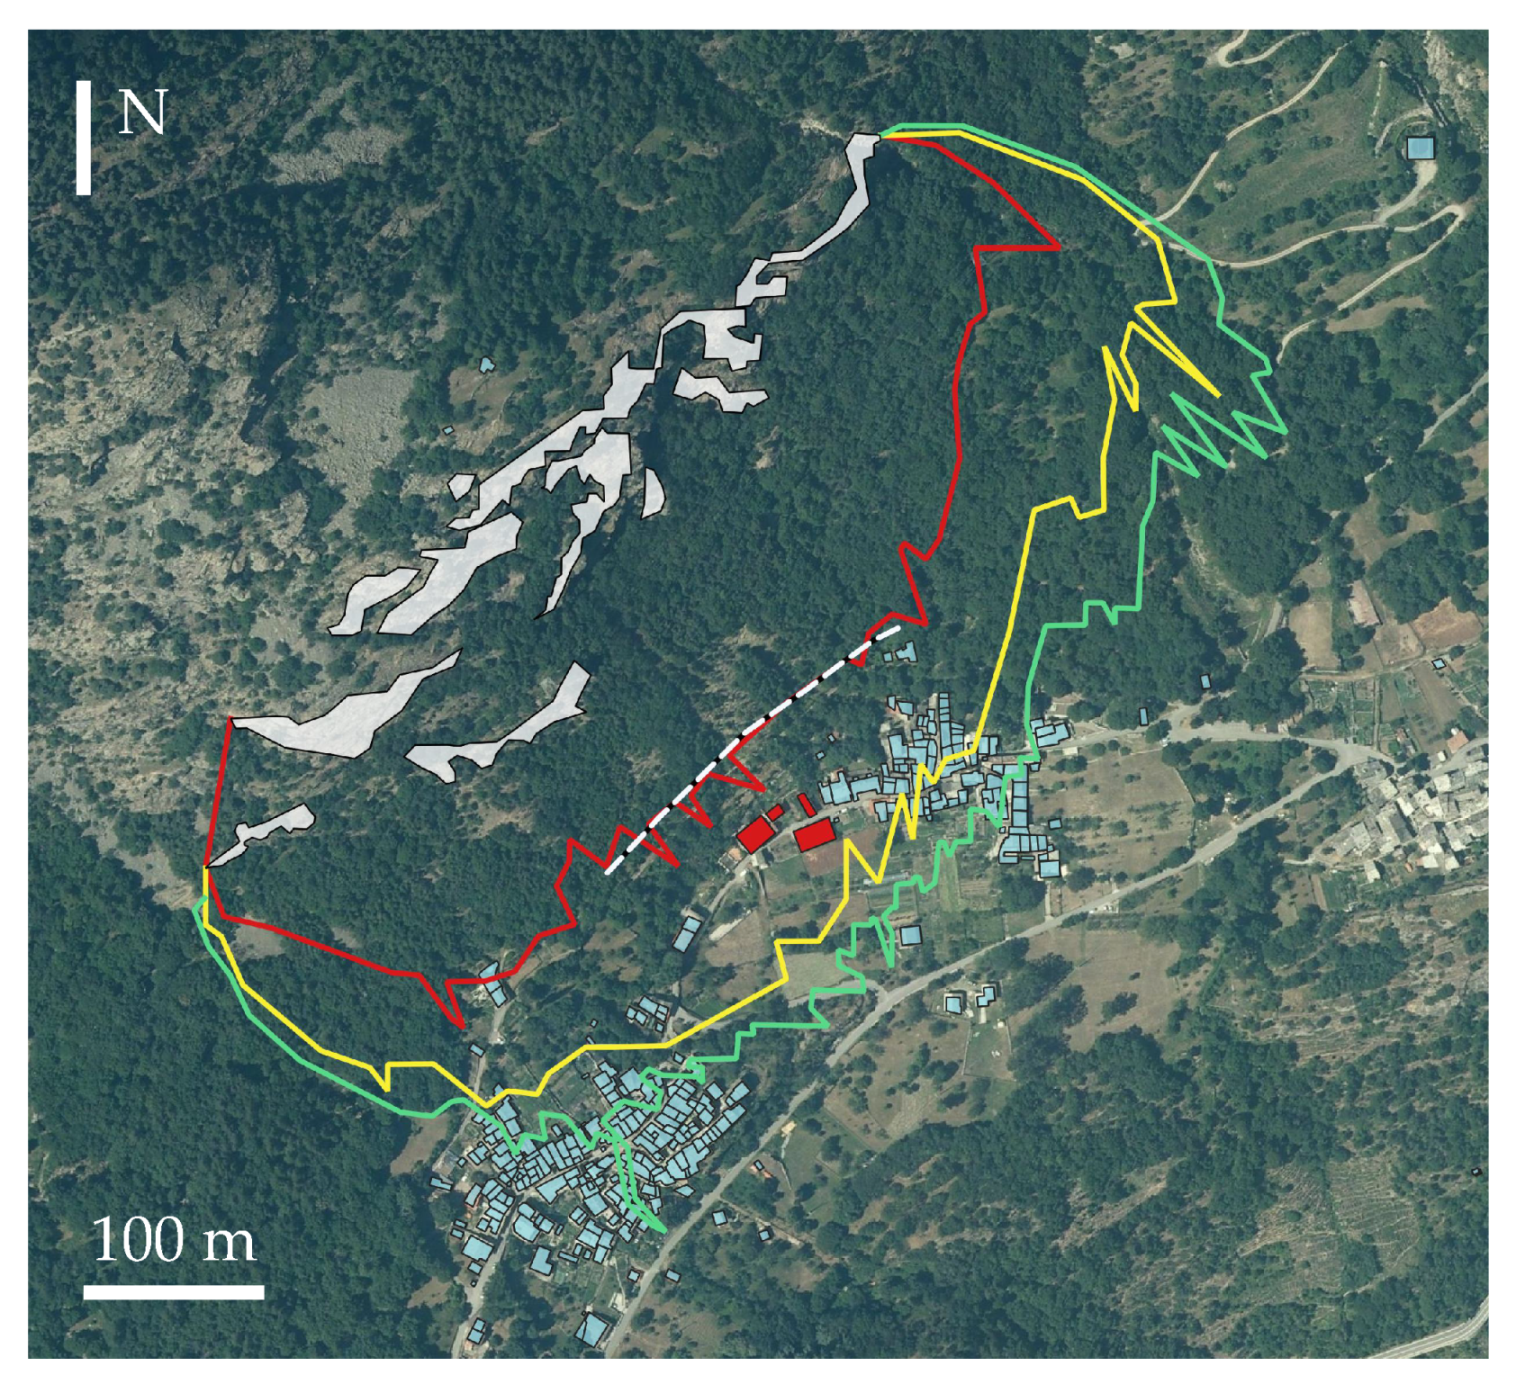
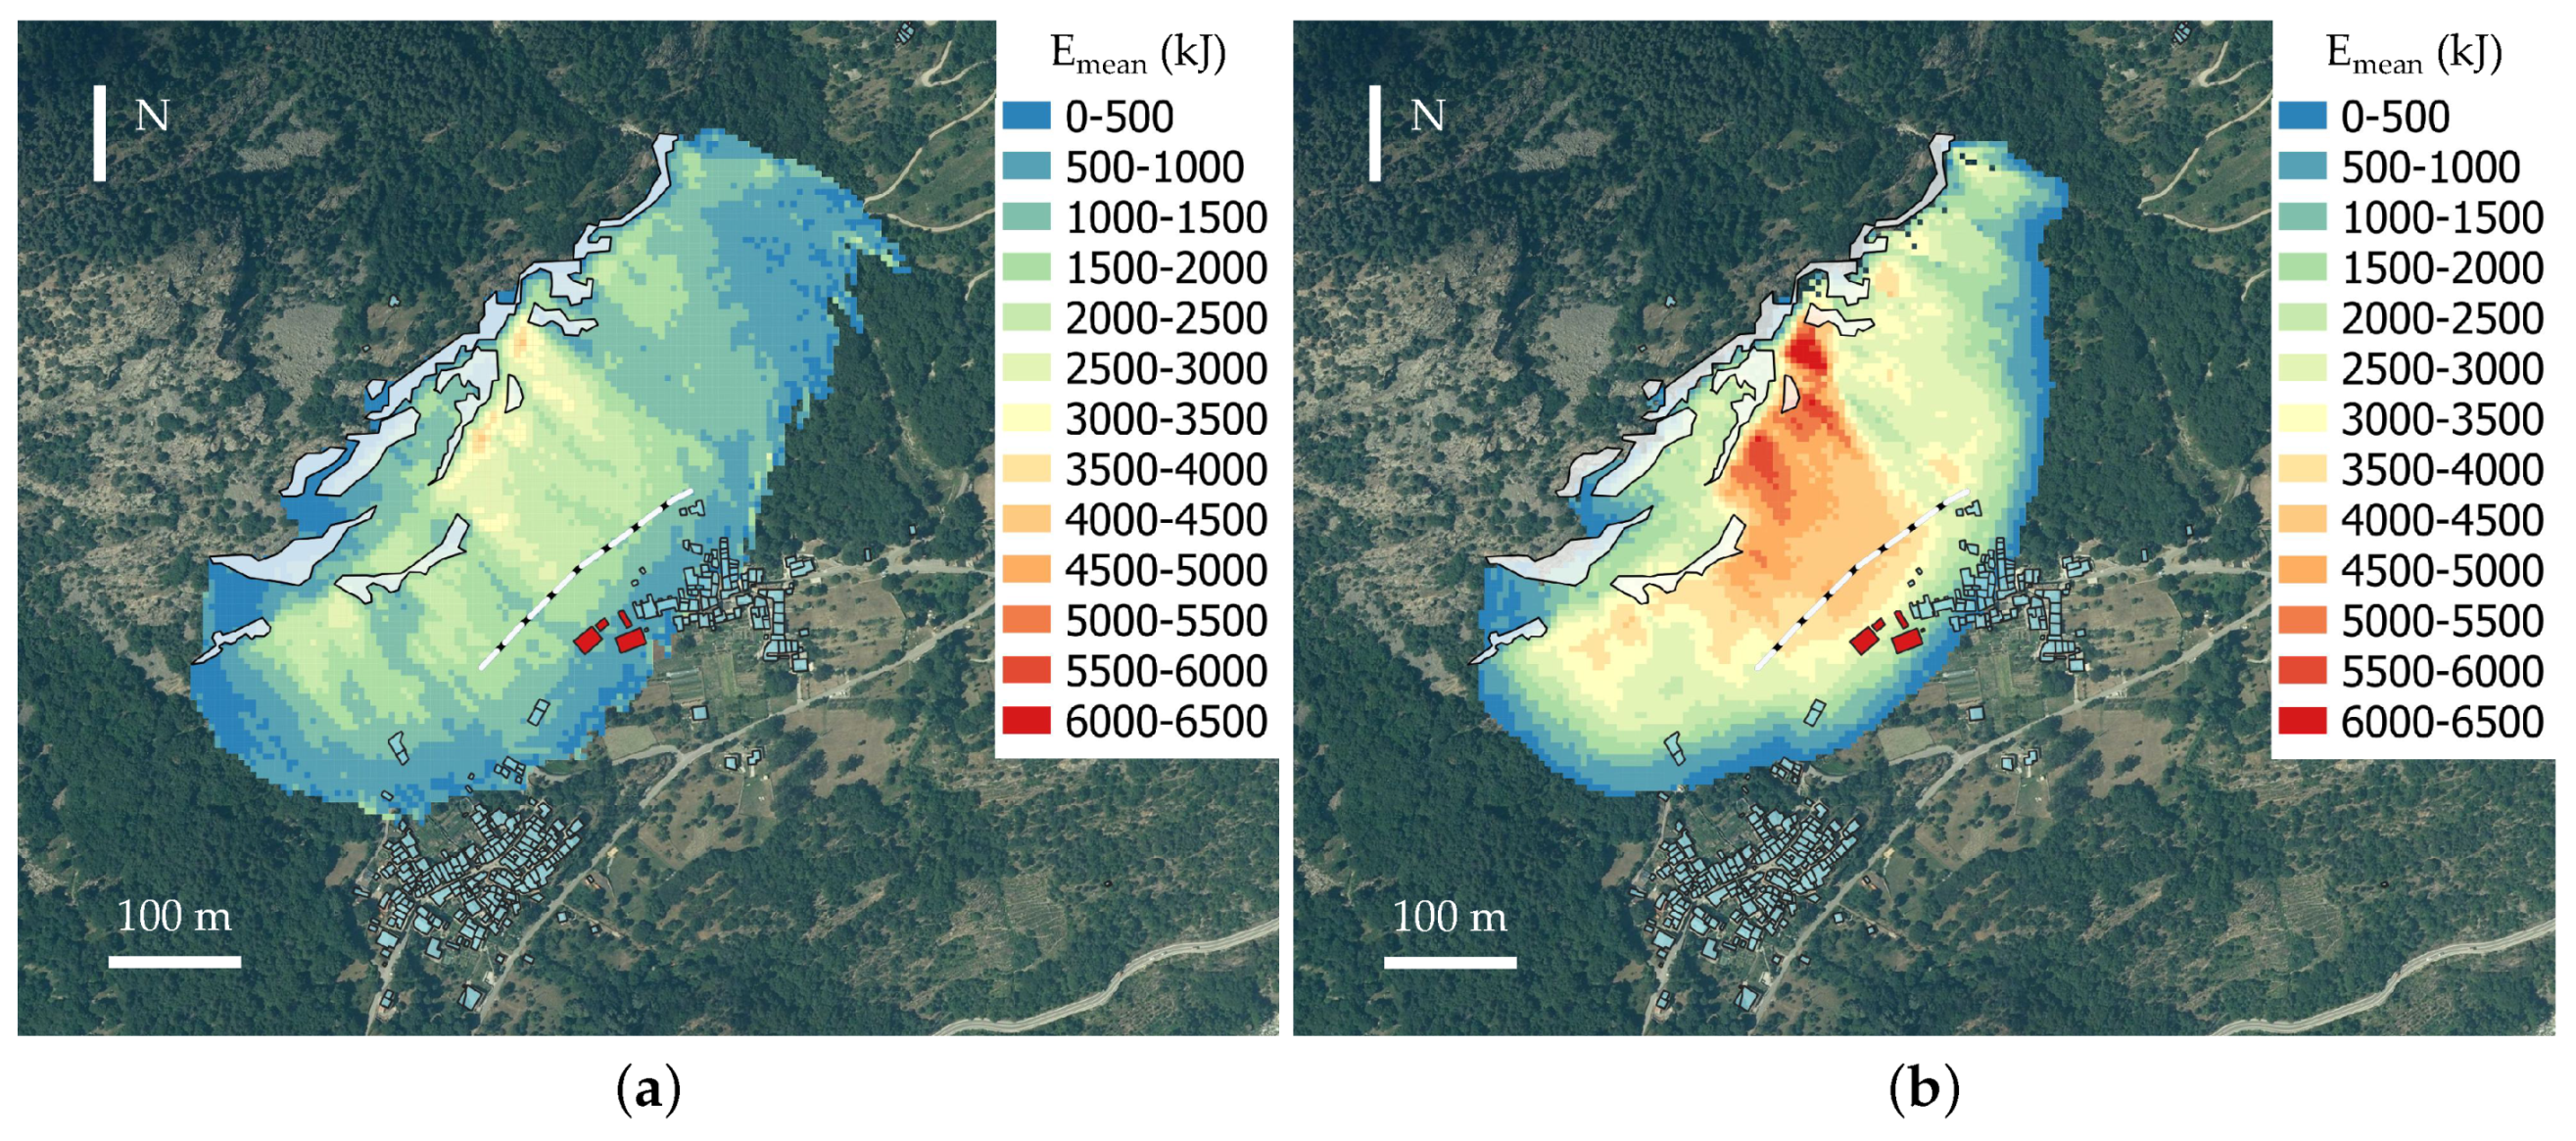
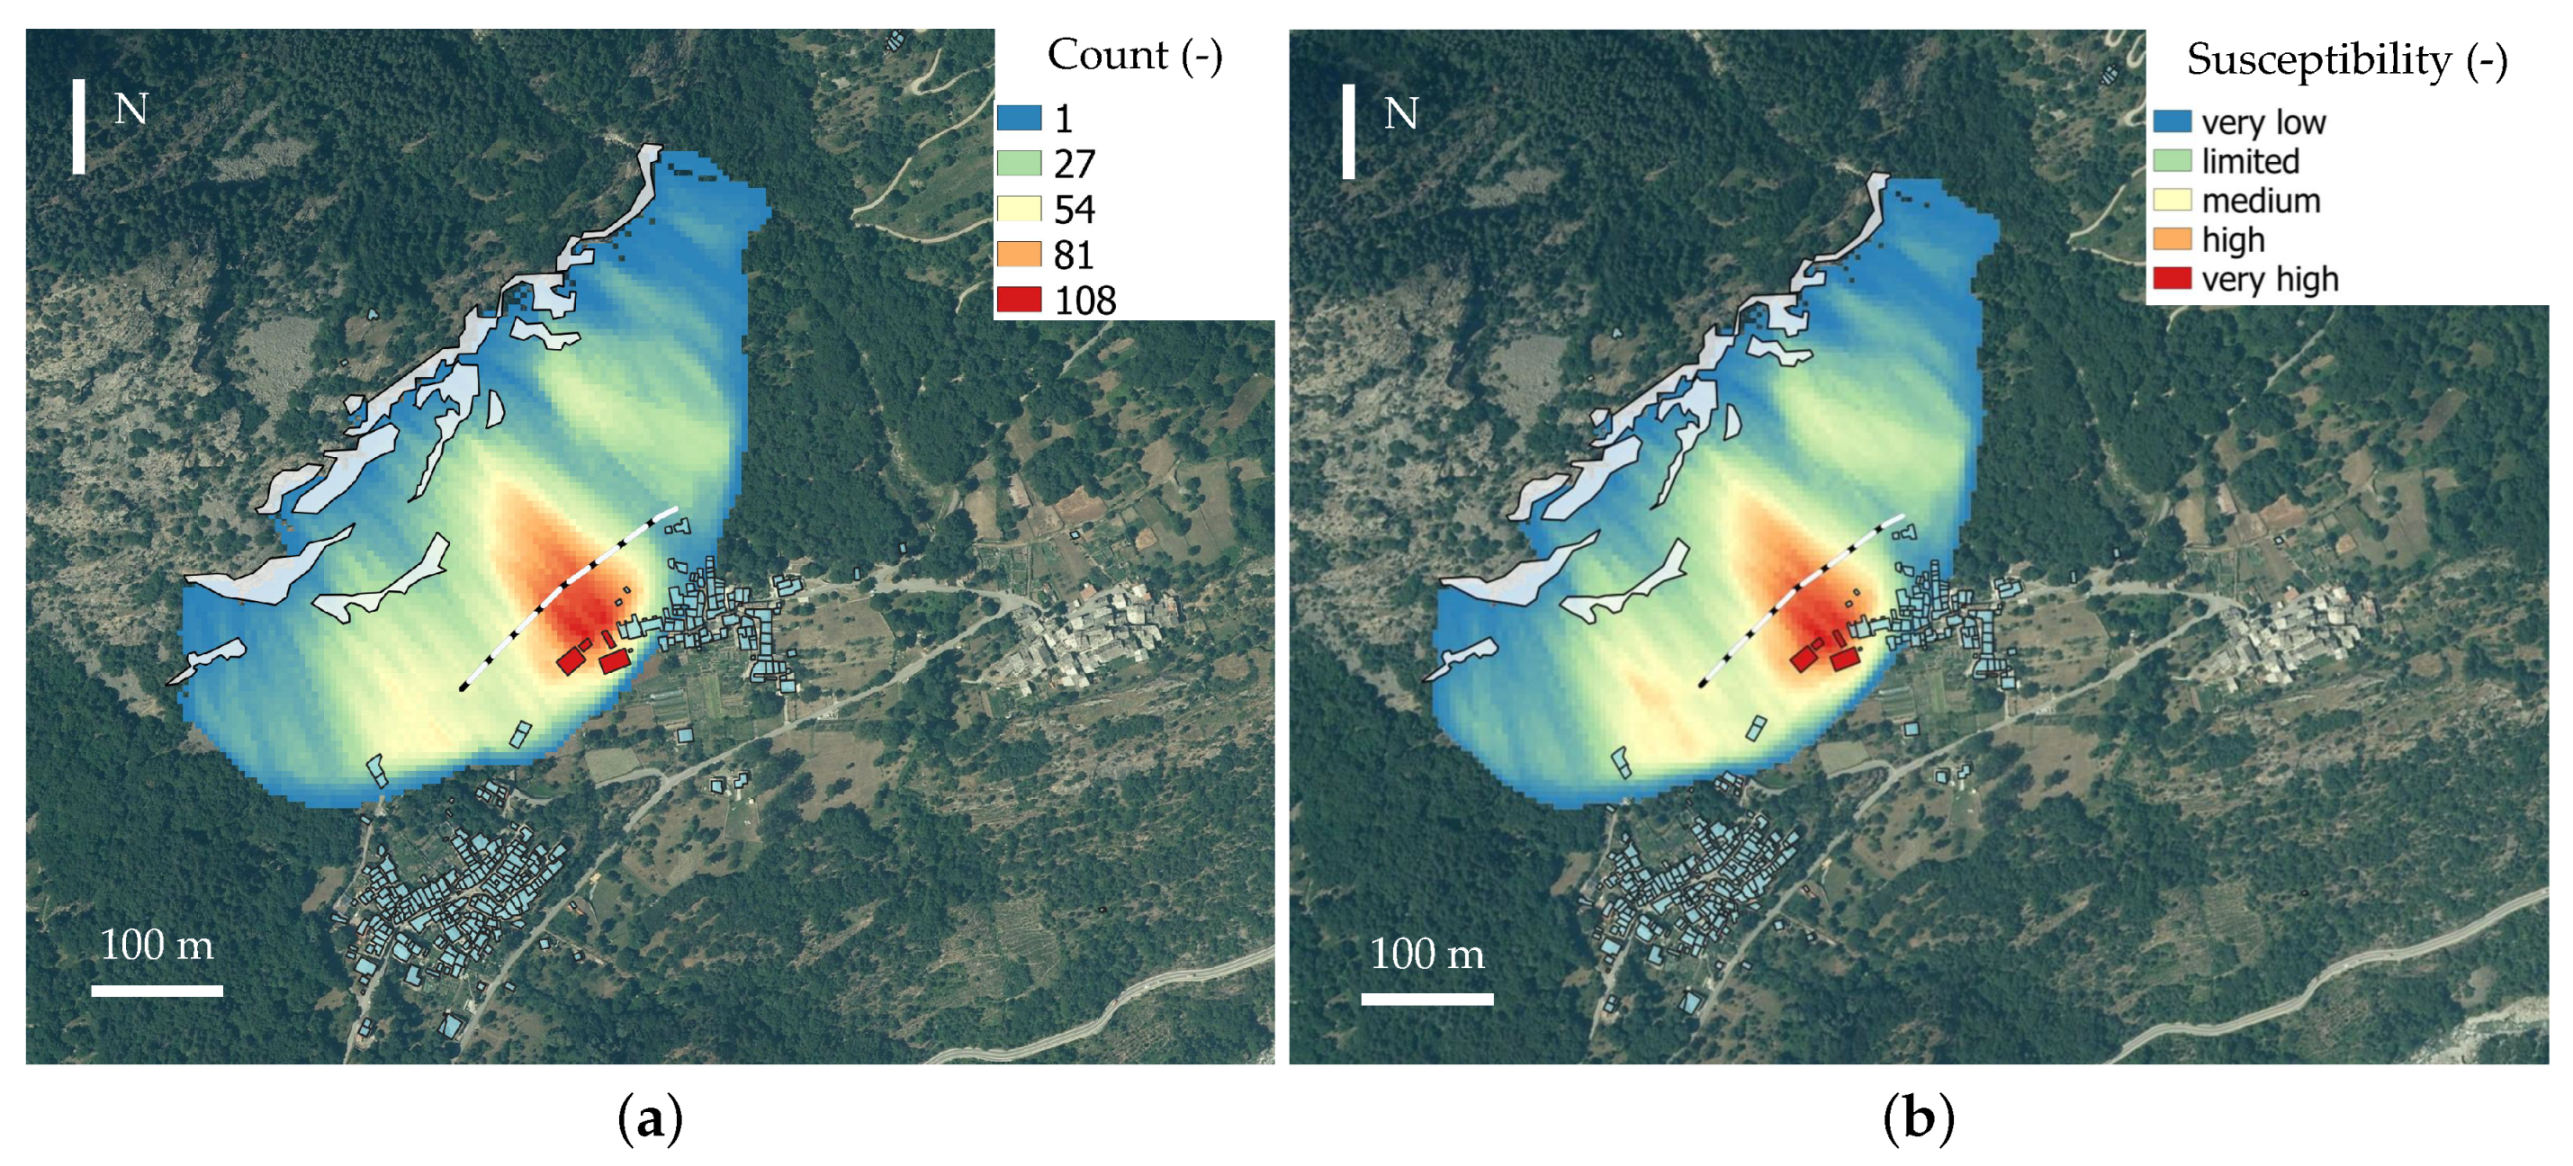
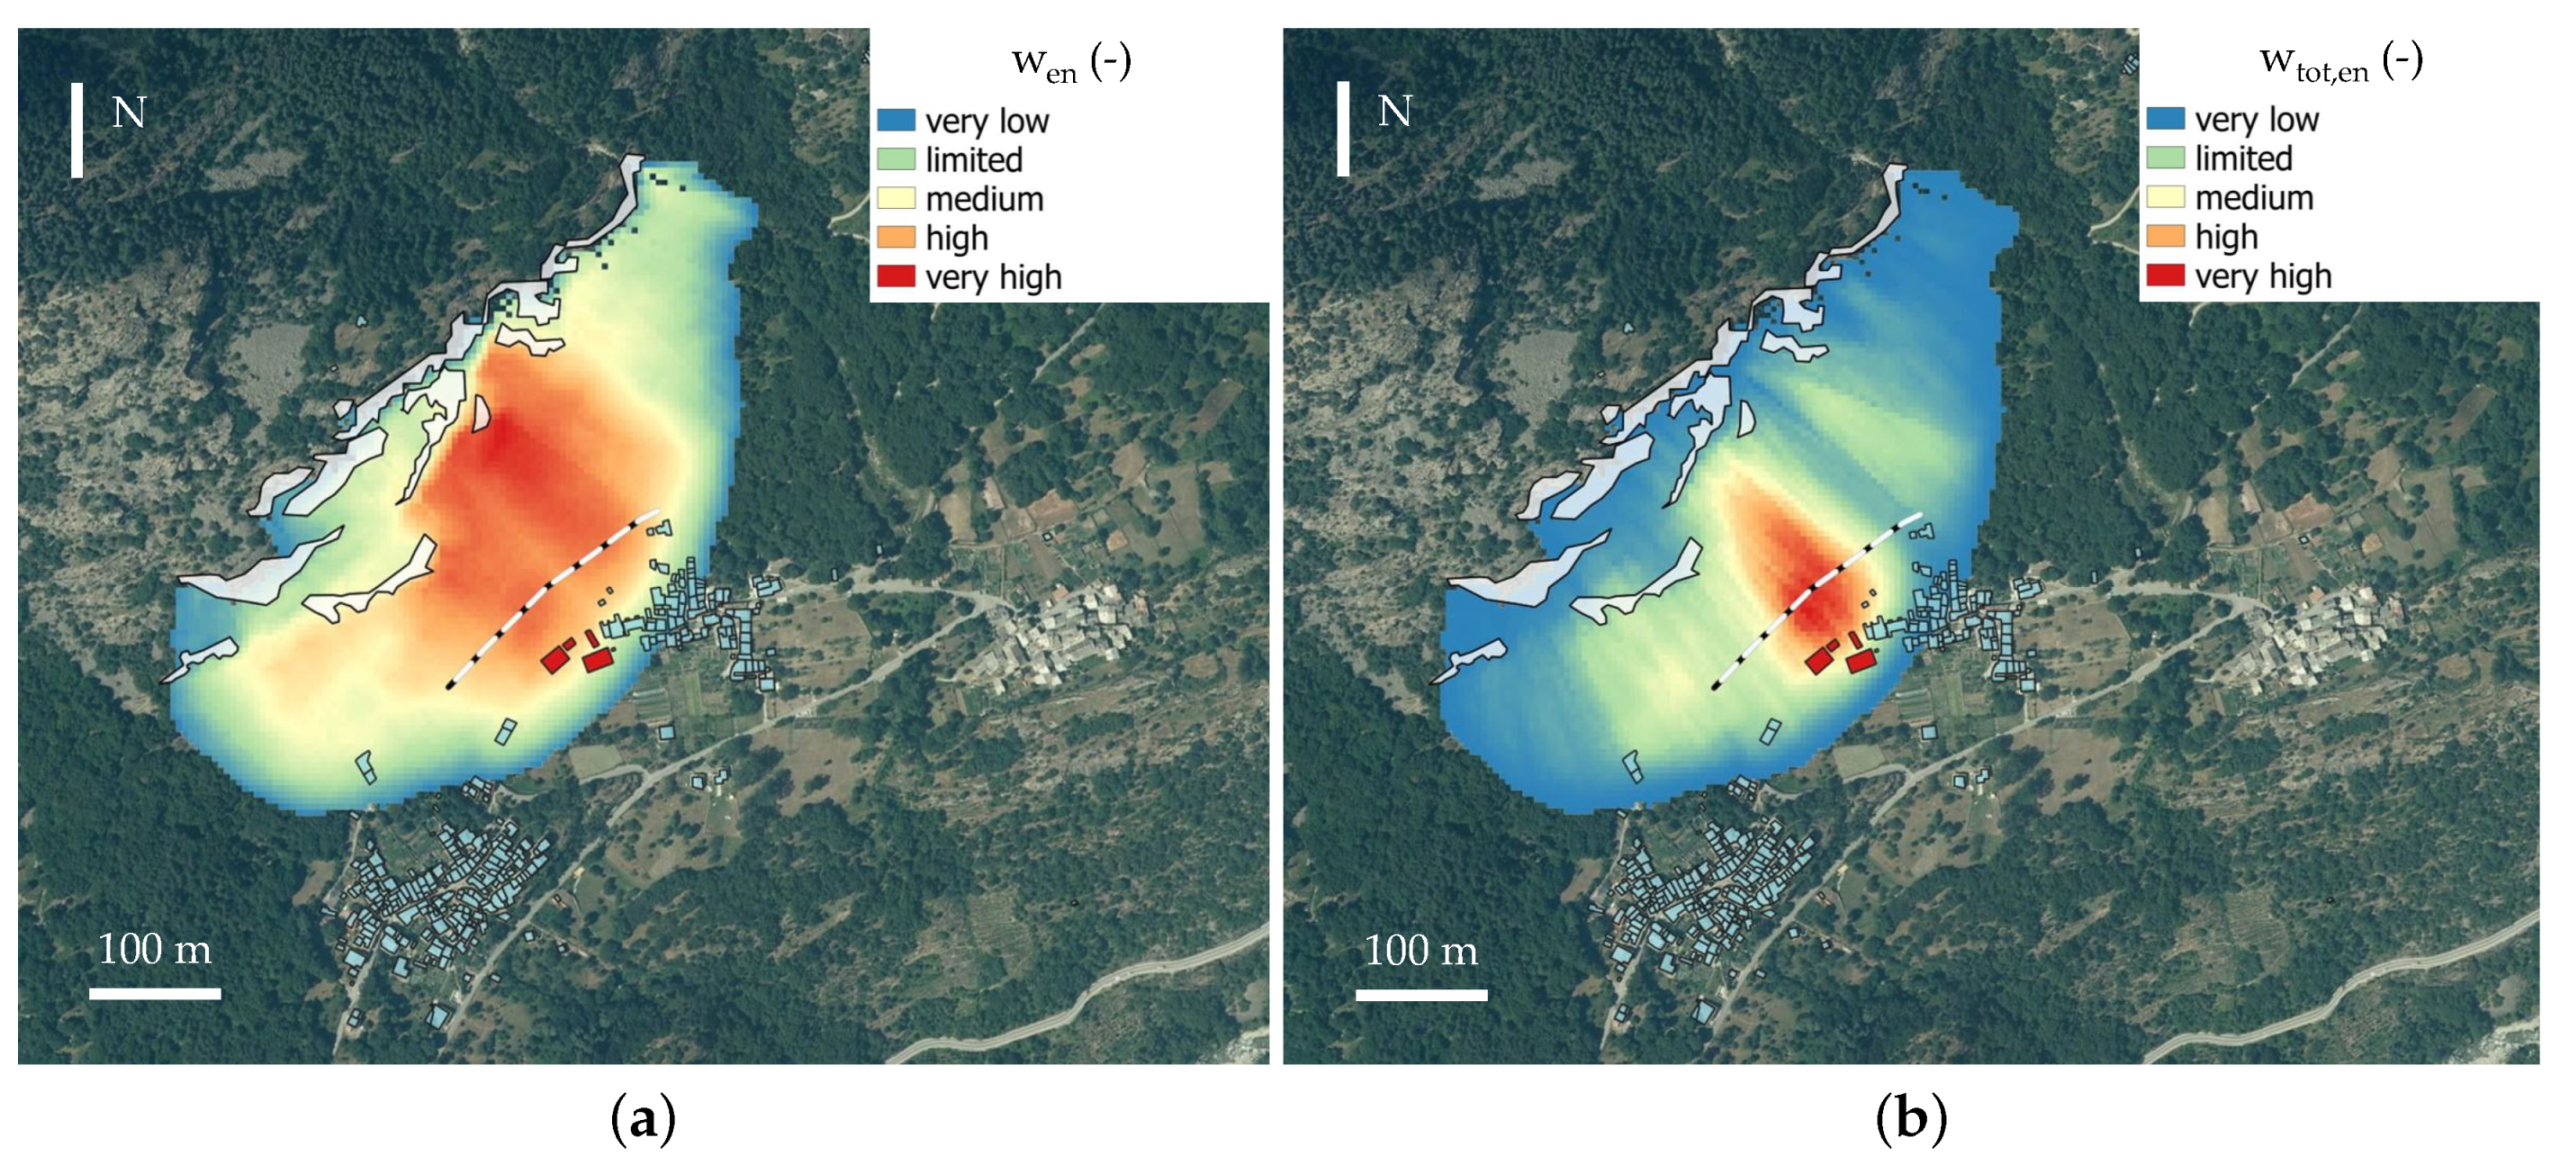
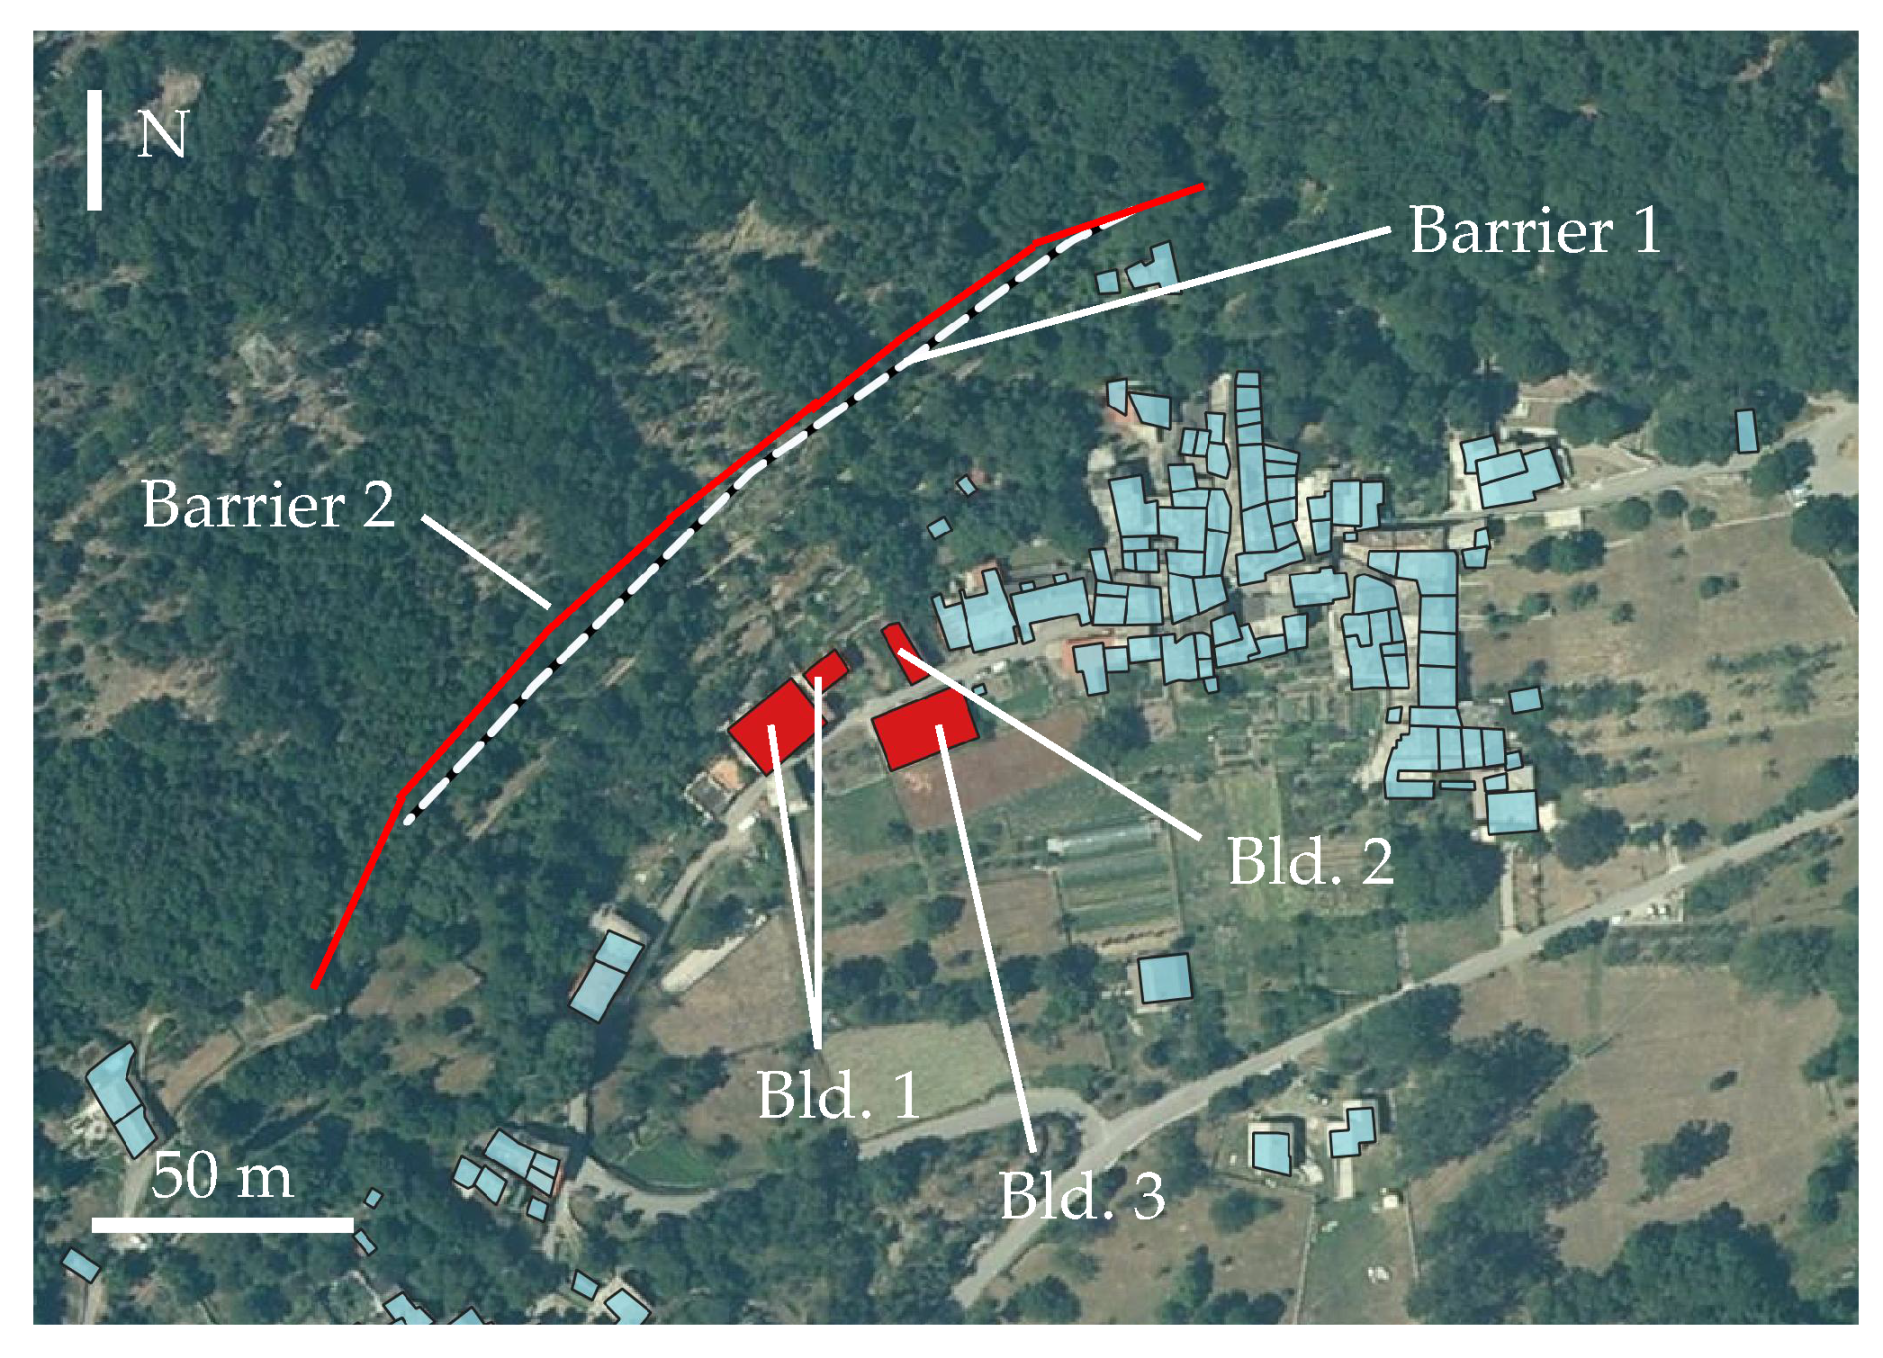
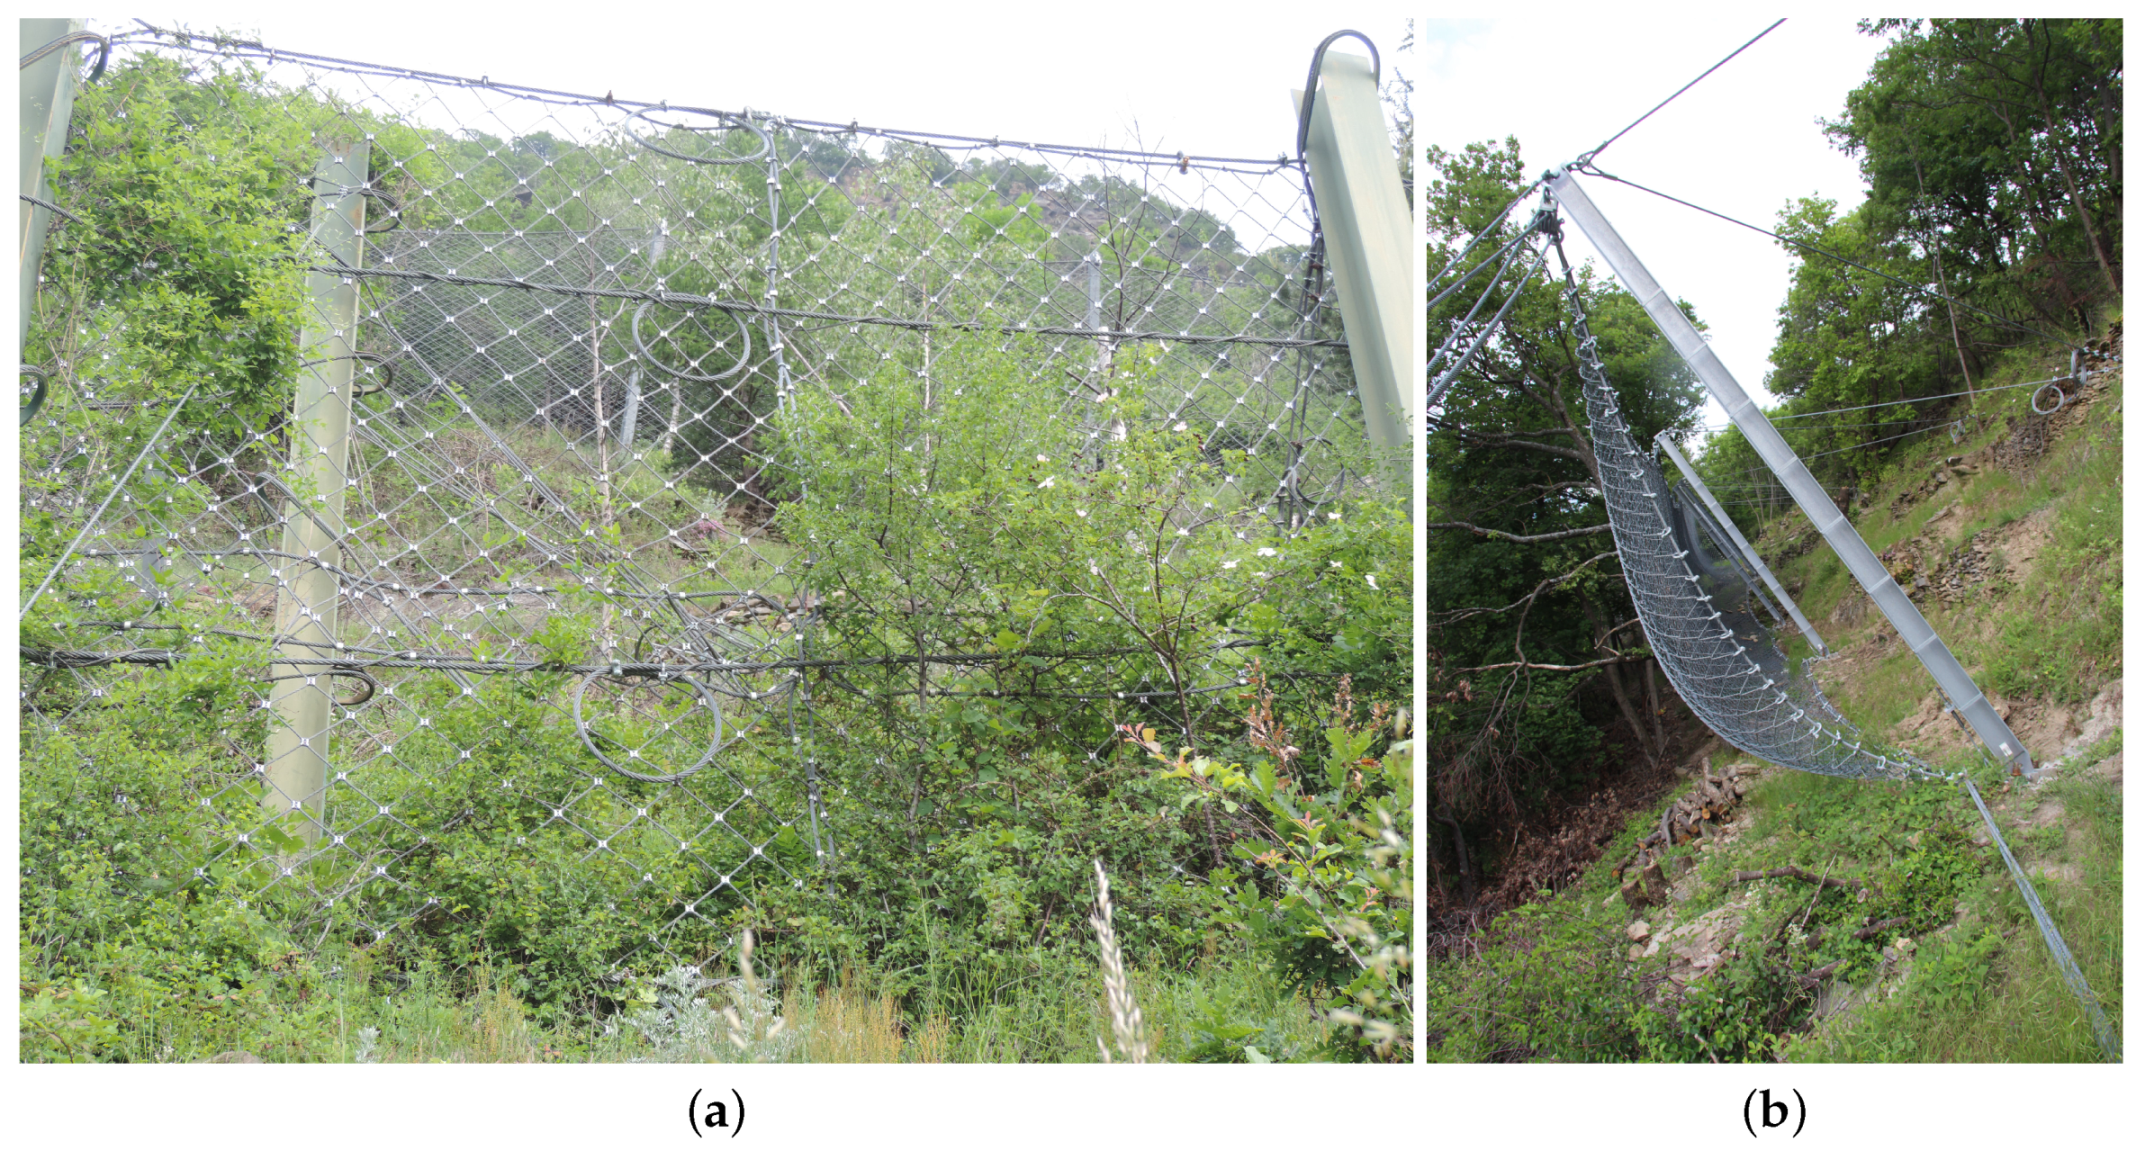
Table 1.
Examples of different reference scales adopted in rockfall risk analyses.
| Corominas et al. (2014) | Fell et al. (2008) |
|---|---|
| National (< 1:250,000) | Small (< 1:100,000) |
| Regional (1:25,000 – 1:250,000) | Medium (1:25,000 – 1:100,000) |
| Local (1:5000 – 1:25,000) | Large (1:5000 – 1:25,000) |
| Site-specific (> 1:5000) | Detailed (> 1:5000) |
Table 2.
Scores and maintenance levels (in brackets) attributed to each entry of the check lists to be used for each product, depending on the level of damage and the class of importance.
Table 2.
Scores and maintenance levels (in brackets) attributed to each entry of the check lists to be used for each product, depending on the level of damage and the class of importance.
| C1 | C2 | C3 | |
|---|---|---|---|
| D0 | 0 (A0) | 0 (A0) | 0 (A0) |
| D1 | 1 (A0) | 2 (A0) | 3 (A1) |
| D2 | 2 (A0) | 3 (A1) | 5 (A2) |
© 2020 by the authors. Licensee MDPI, Basel, Switzerland. This article is an open access article distributed under the terms and conditions of the Creative Commons Attribution (CC BY) license (http://creativecommons.org/licenses/by/4.0/).
Share and Cite
MDPI and ACS Style
Scavia, C.; Barbero, M.; Castelli, M.; Marchelli, M.; Peila, D.; Torsello, G.; Vallero, G. Evaluating Rockfall Risk: Some Critical Aspects. Geosciences 2020, 10, 98. https://0-doi-org.brum.beds.ac.uk/10.3390/geosciences10030098
AMA Style
Scavia C, Barbero M, Castelli M, Marchelli M, Peila D, Torsello G, Vallero G. Evaluating Rockfall Risk: Some Critical Aspects. Geosciences. 2020; 10(3):98. https://0-doi-org.brum.beds.ac.uk/10.3390/geosciences10030098
Chicago/Turabian StyleScavia, Claudio, Monica Barbero, Marta Castelli, Maddalena Marchelli, Daniele Peila, Giulia Torsello, and Gianmarco Vallero. 2020. "Evaluating Rockfall Risk: Some Critical Aspects" Geosciences 10, no. 3: 98. https://0-doi-org.brum.beds.ac.uk/10.3390/geosciences10030098
Note that from the first issue of 2016, this journal uses article numbers instead of page numbers. See further details here.