Article

A Gas-Emission Crater in the Erkuta River Valley, Yamal Peninsula: Characteristics and Potential Formation Model

1
Center for Hydrocarbon Recovery, Skolkovo Institute of Science and Technology (Skoltech), Skolkovo Innovation Center, 3 Nobel Street, Moscow 121205, Russia
2
Total, 2 Jean Miller, La Defense, 92078 Paris, France
3
Department of Science and Innovation of the Yamal-Nenets Autonomous District (YNAO), Salekhard 629008, Russia
4
Arctic Research Center of the Yamal-Nenets Autonomous District, Salekhard 629008, Russia
*
Author to whom correspondence should be addressed.
Submission received: 27 January 2020 / Revised: 27 April 2020 / Accepted: 6 May 2020 / Published: 8 May 2020
(This article belongs to the Special Issue Gas Emissions and Crater Formation in Arctic Permafrost)

Abstract

:
Methane is a powerful greenhouse gas, and the abrupt degassing events that recently have formed large craters on the Russian Arctic Yamal and Gydan Peninsulas have caused major concern. Here we present field data on cover sediments and evolution of a gas-emission crater discovered in the Erkuta–Yakha River valley in the southern Yamal Peninsula in June 2017. The crater is located south of other similar craters discovered over the past decade in northern West Siberia. Data were collected during a field trip to the Erkuta crater in December 2017 which included field observations and sampling of permafrost soil and ground ice from the rim of the crater. All soil and ice samples were measured for contents of methane and its homologs (ethane and propane) and carbon dioxide. The contents of carbon dioxide in some samples are notably higher than methane. The strongly negative δ13С of methane from ground ice samples (−72‰) is typical of biogenic hydrocarbons. The ratio of methane to the total amount of its homologs indicate a component of gases that have migrated from a deeper, thermogenic source. Based on obtained results, a potential formation model for Erkuta gas-emission crater is proposed, which considers the combined effect of deep-seated (deep gas migration) and shallow (oxbow lake evolution and closed talik freezing) causes. This model includes several stages from geological prerequisites to the lake formation.

1. Introduction

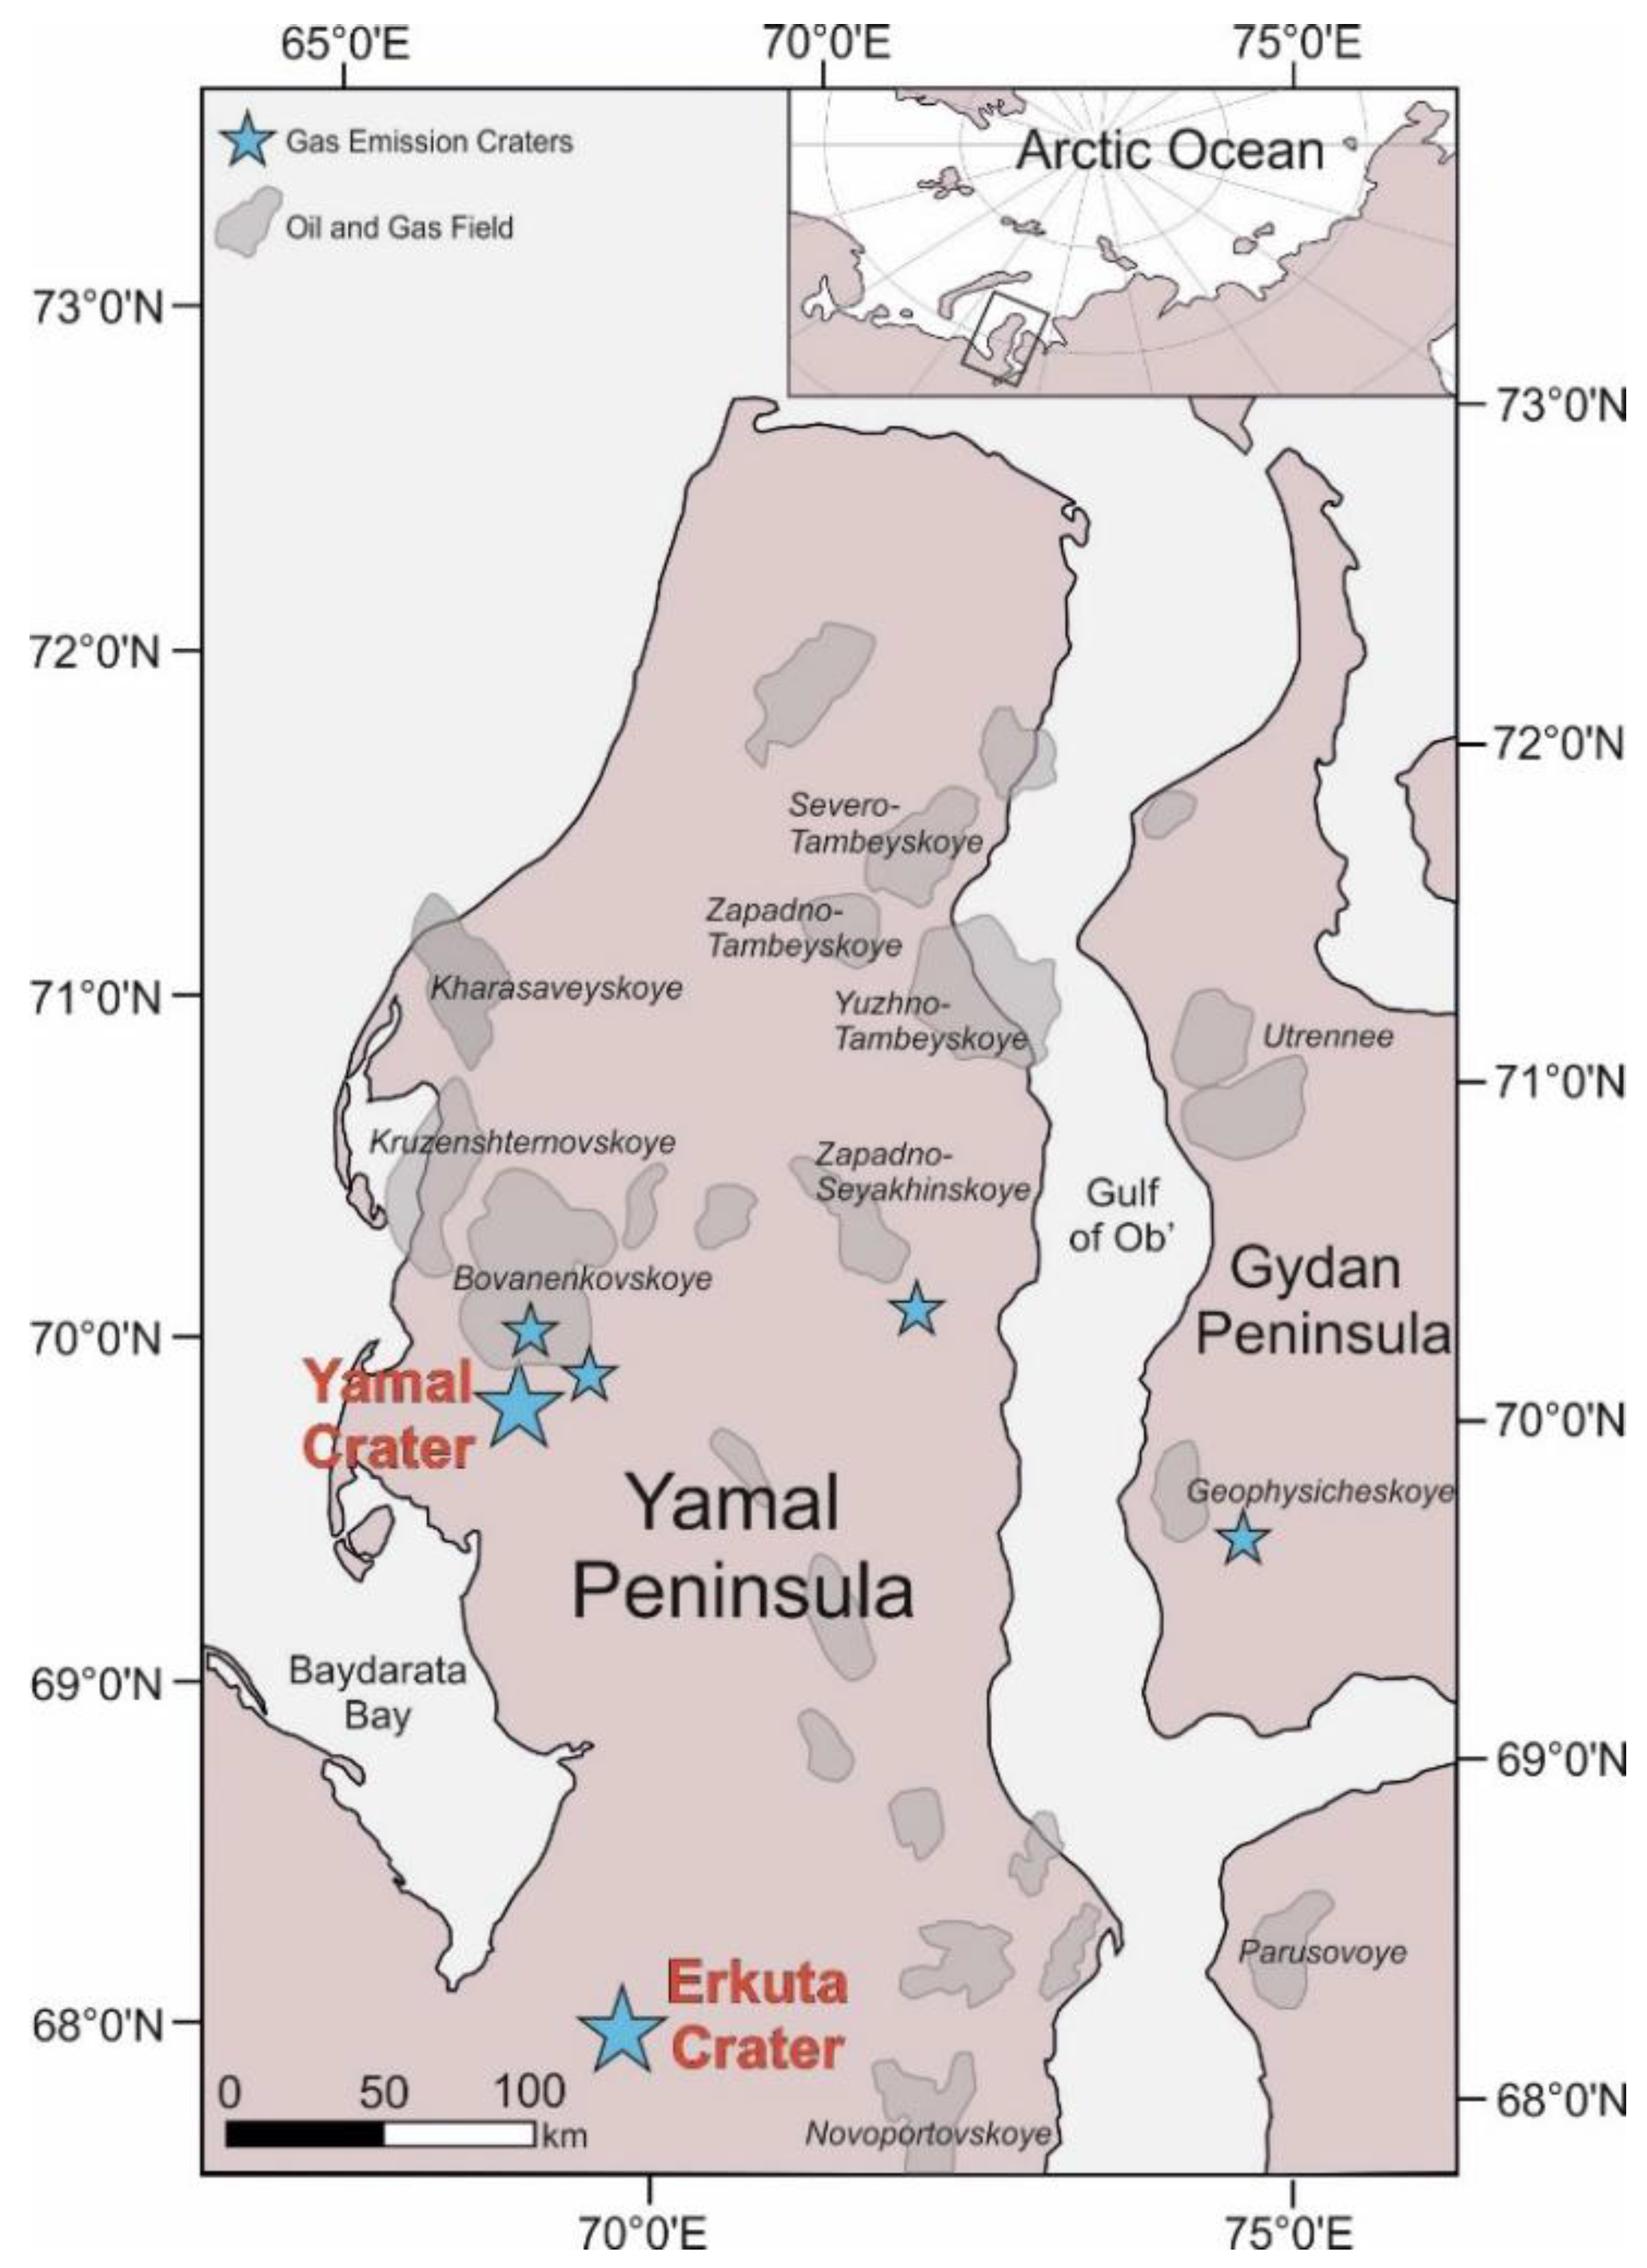
Methane is a powerful greenhouse gas, and the recent abrupt events of degassing and crater formation on the Yamal and Gydan Peninsulas (Figure 1) have caused major concern that a warming Arctic may lead to increased thawing of permafrost and gas emissions. In addition, exploration and development of oil and gas fields in northern West Siberia, with construction of production, transportation and support facilities upon permafrost, face problems due to the harsh Arctic climate, low negative temperatures of air and ground and complex periglacial processes like frost heaving, thermokarst, thermal erosion. Processes in shallow permafrost may lead to the formation of gas-emission craters, a phenomenon discovered during exploration for the past decade in the Arctic West Siberia. The first methane-leaking crater (Yamal Crater) was found in the Yamal Peninsula 42 km from the Bovanenkovo gas field (Figure 1), and that discovery was followed by several more from the Yamal and Gydan Peninsulas [1,2,3]. The Yamal Crater has been better documented [4,5,6,7] than the others, which are only imaged in few photographs, but the available data are insufficient to concede about the conditions and causes of its origin. The crater origin has been unanimously attributed to an explosive gas emission event, but the origin of the gas remains a subject of discussions.
The proposed hypotheses explaining the formation of the Yamal Crater, and other craters in the Yamal and Gydan Peninsulas, can be divided into two main groups that invoke either deep-seated or shallow causes. The deep-seated causes of crater formation [7,8,9] include increased deep heat flux, upward migration of deep gaseous fluids through fault zones and fault intersections to shallow permafrost and dissociation of intrapermafrost gas hydrates driven by ascending heat and gas flows. These processes can produce reservoirs of pressurized gas in shallow permafrost which can release explosively, break up the frozen cap and form a crater.
The hypothesized shallow prerequisites of crater formation are associated with permafrost temperature variations under the effects of climate and surface heat transfer. These models involve permafrost is warming from above and the ensuing destabilization of relict gas hydrates in the upper permafrost [2,5]. Another possible explanation for crater formation is that freezing of a closed talik (a body of unfrozen soils in permafrost) produces a confined hydraulic system with gradually increasing gas pressure and a pingo-like feature prone to collapse by explosive emission of the pressurized gas [10].
Understanding the formation mechanisms of gas-emission craters requires collecting and analyzing new relevant field data. At the time being, only a few panoramic photographs of craters other than the Yamal Crater (Figure 1) and that in the Seyakha River valley [11] are available. Any new data on the crater structure and evolution, on gas chemistry and stable isotopes, as well as on the lithology of permafrost in the area are of scientific value. Field data from crater evolution is particularly important because the craters have a very short lifetime (a few months to one or two years) before transforming into lakes. However, drilling and geophysical surveys from the craters are lacking as the craters are most often located in hardly accessible remote areas far from infrastructure.
Here we provide substantive background on the cover sediments of the Erkuta crater in the southern Yamal Peninsula (Figure 1) and propose a formation model that could provide a basis for further assessment with more field data.

2. Erkuta Crater and Its Evolution

The Erkuta crater formed in the winter of 2016–2017 in the southern Yamal Peninsula (Figure 1), in typical conditions of continuous permafrost described in a number of publications [12,
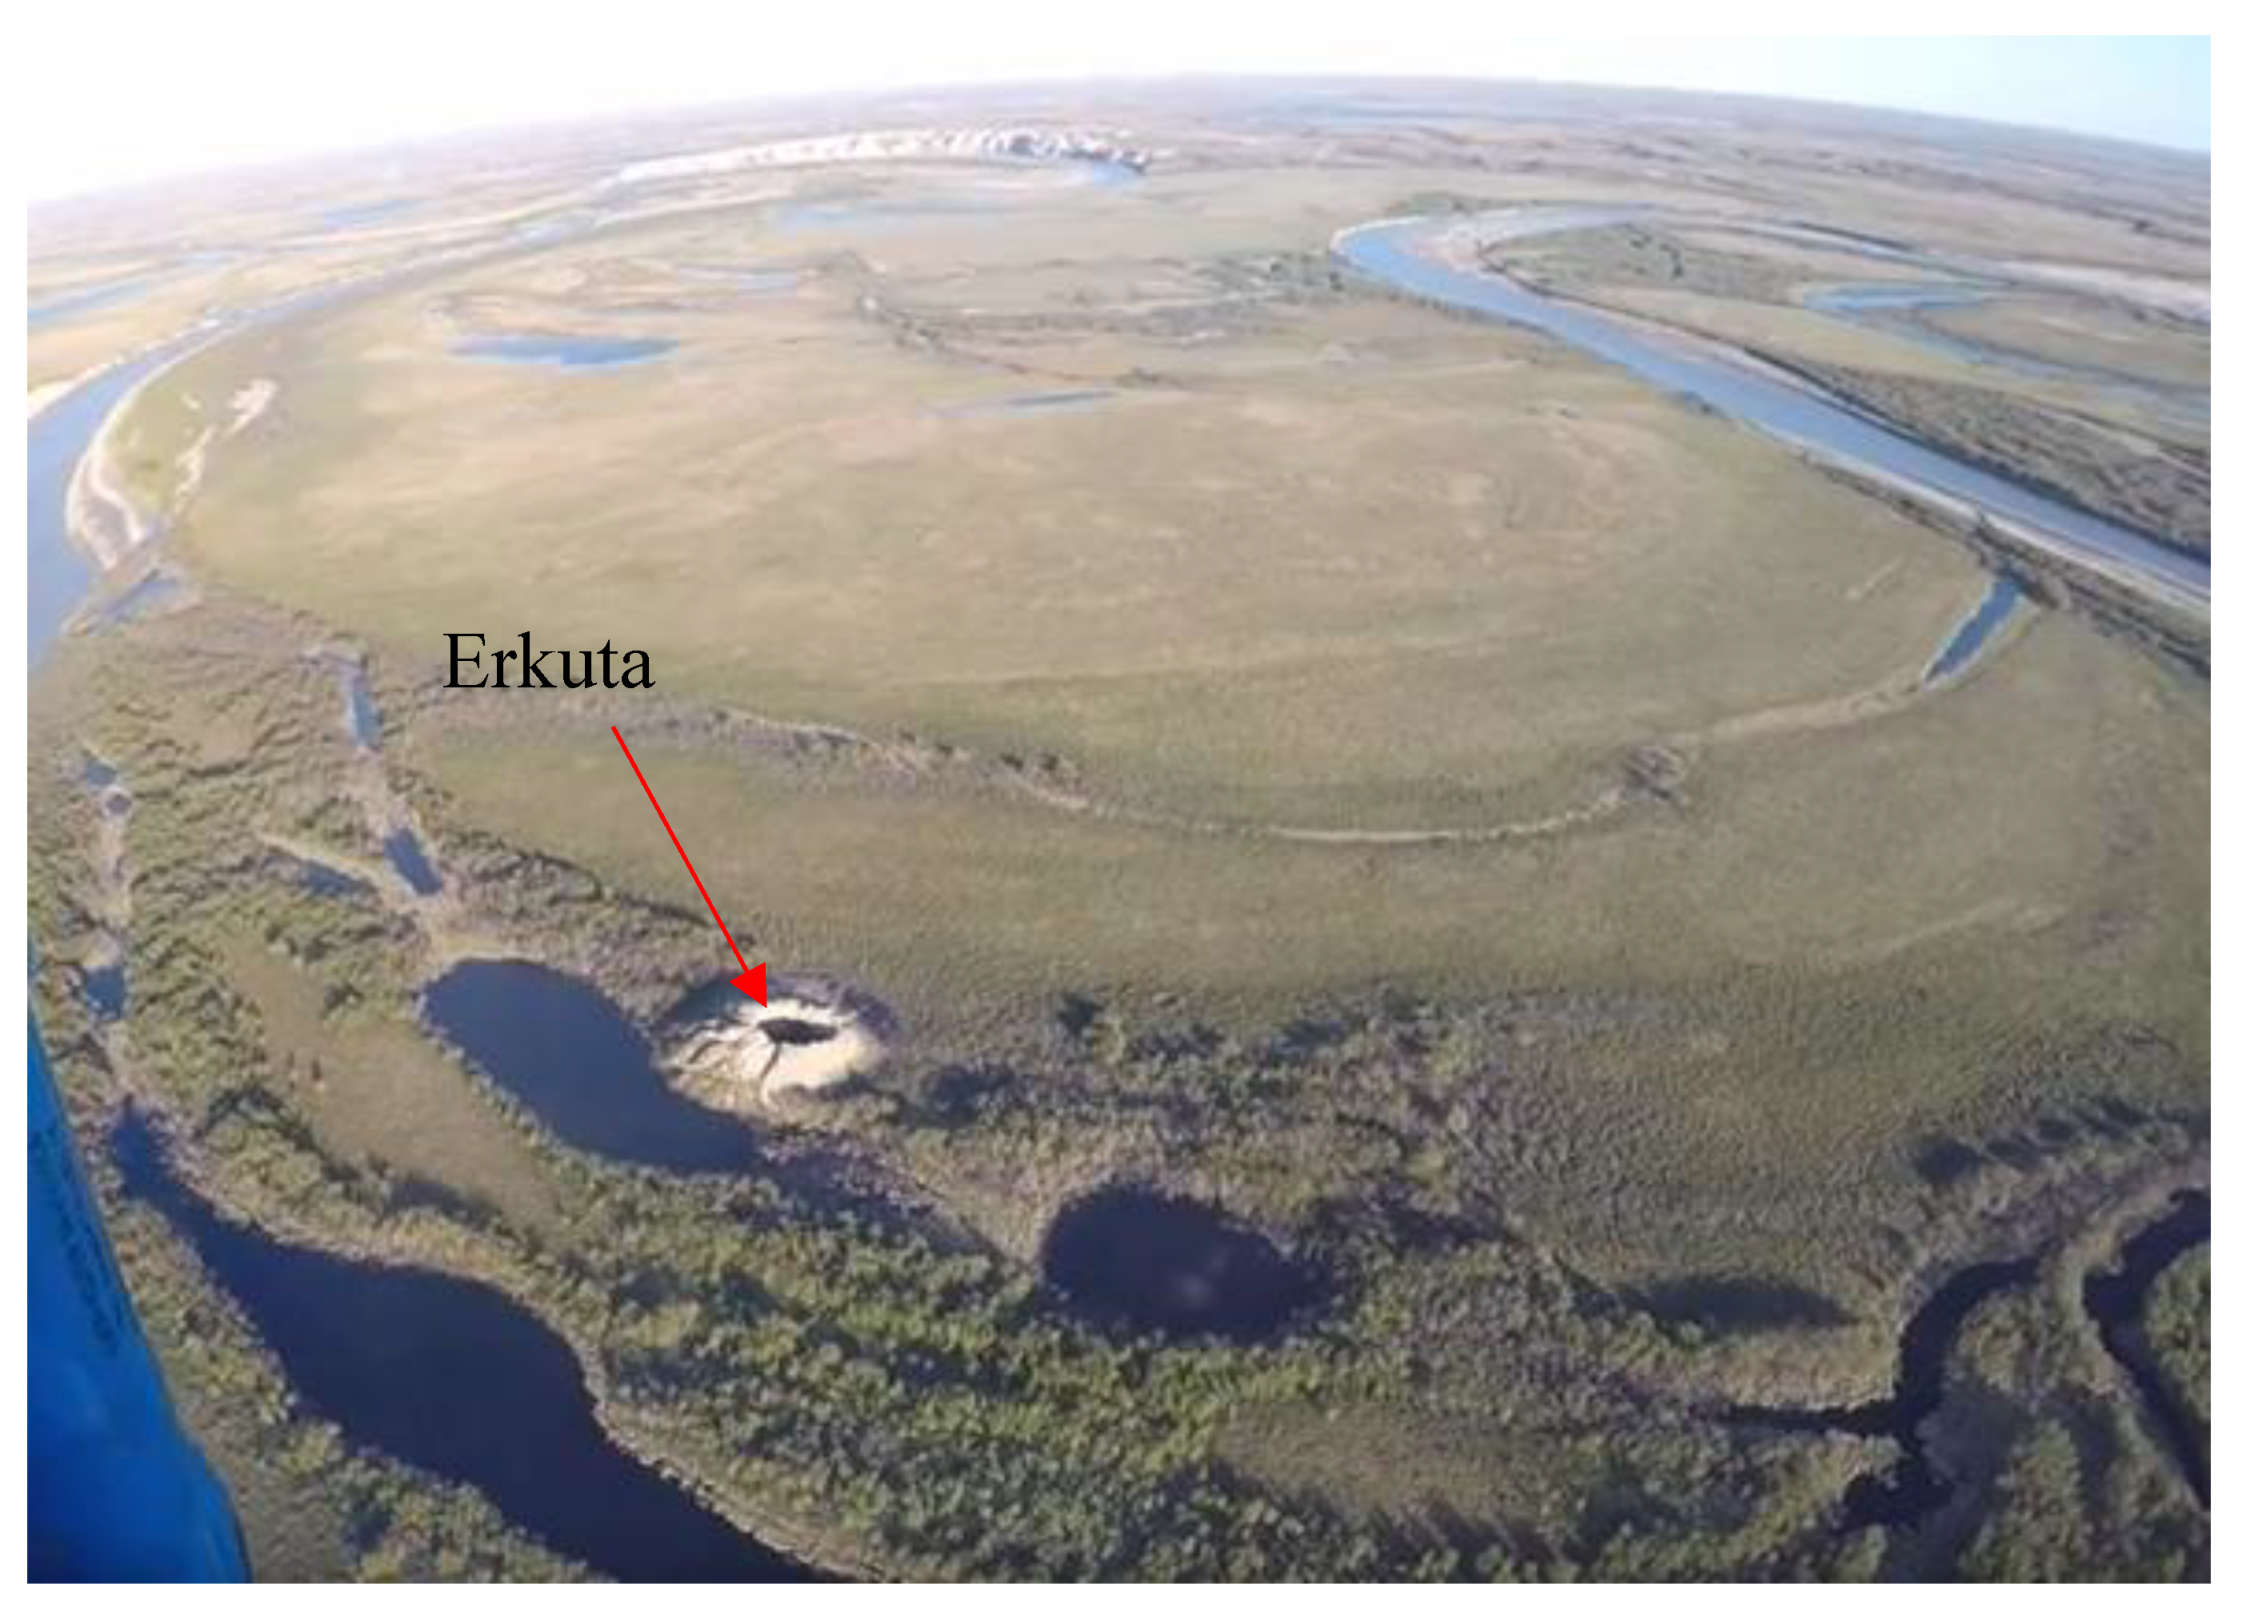
13]. Permafrost mainly consists of interbedded Quaternary (middle-upper Pleistocene and Holocene) sand, silty sand, sandy silt and clay silt with lenses of gas-saturated rocks and cold saline groundwater (cryopegs). Ice contents in shallow permafrost can reach 40%–50%, mainly in fine-grained sediments. Even though the long-term mean ground temperatures of the study area are −5 to −6 °C and permafrost is around 200-m-thick; the zero °C isotherm can be even 100–150 m deeper due to salinity of soils and the presence of cryopegs. The seasonal thaw depth is about 0.7–1.2 m. The territory abounds in ground ice of various genetic types, seasonal and perennial frost heaves, peatlands, swamps and thermokarst lakes that occupy 20% of the area, including lakes with crater-like features possibly associated with gas emission through faults and fractures on the bottom. The gas-emission crater formed in the Erkuta–Yakha River valley filled with floodplain and riverbed alluvial sand and silt enclosing plant detritus. There are many oxbow lakes in the crater area, some close to the crater (Figure 2).
The crater was discovered in June 2017 by people from the Erkuta polar station on the floodplain of the Erkuta River, 30 km east of the station. The area is of interest to biologists for its proximity to the nesting-place of falcons. Two years before, the terrain was absolutely flat, as witnessed by Dr. A. Sokolov in a TV broadcast (“Vesti Yamal”) of 30 June 2017.
The team of biologists led by Sokolov observed heaving of the previously flat surface, as well as cracks in soil, during field works in July 2016, a year before the crater was first discovered in June 2017. The newly formed crater had a cylindrical shape, 10 to 12 m in diameter, with smooth walls was 20 m deep (A. Sinitsyn, Personal Communication). The original heave mound was not fully eliminated (Figure 2): the crater was encircled by a 2–3 m high parapet-like ridge, with its slopes covered with silt and clay silt ejected during the explosive gas emission.
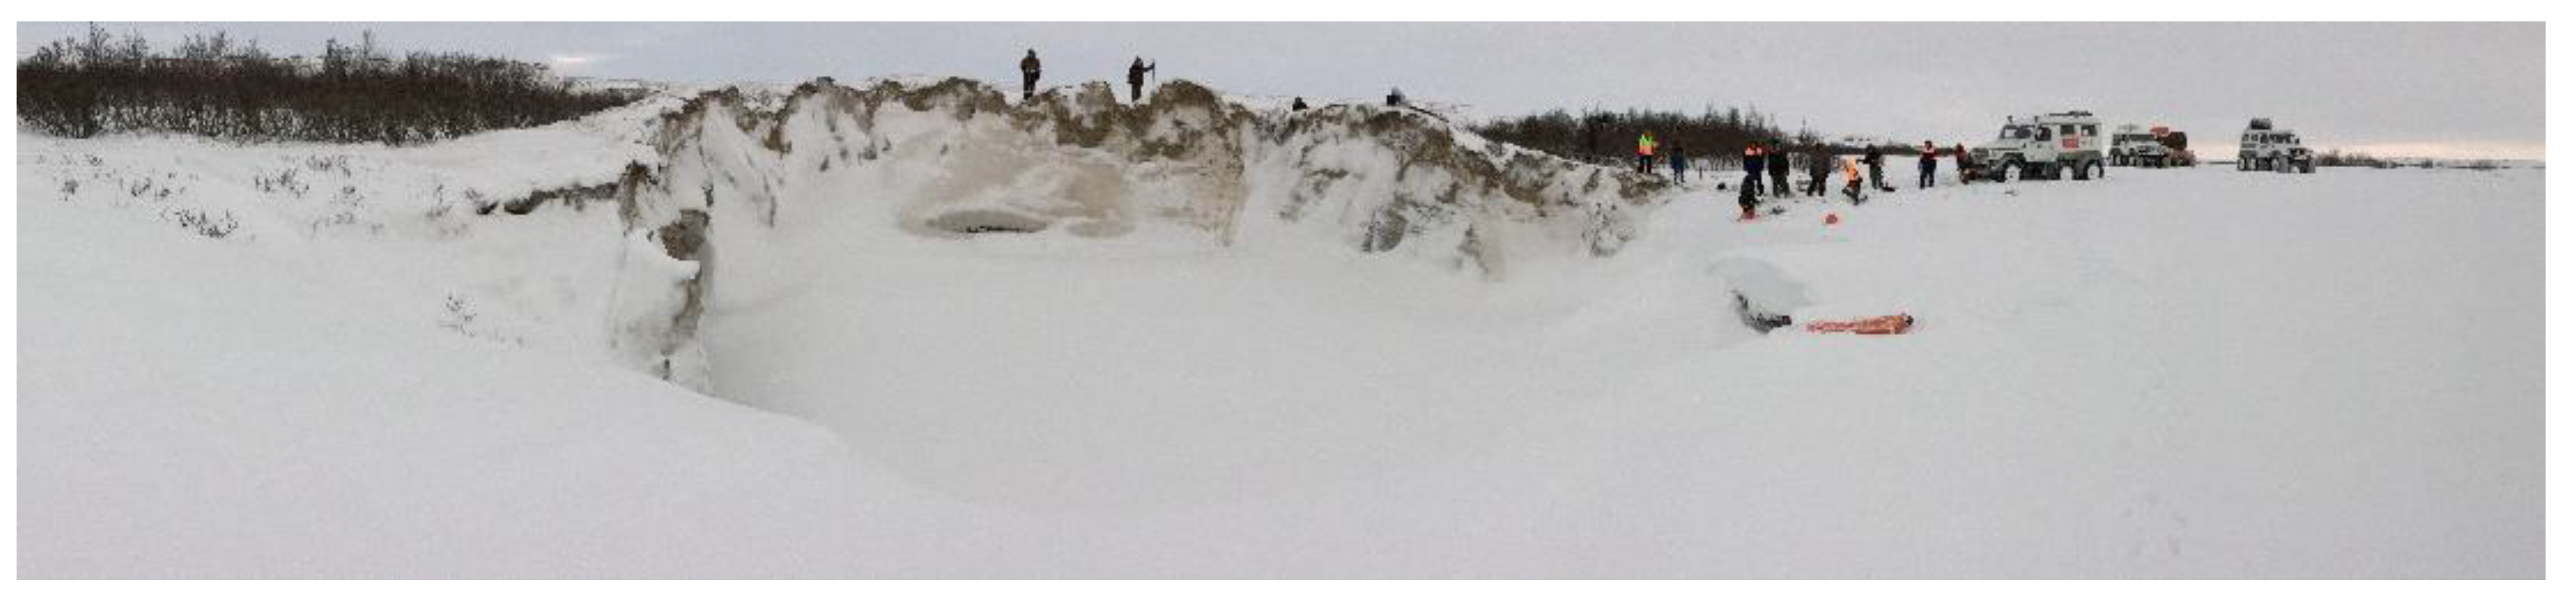
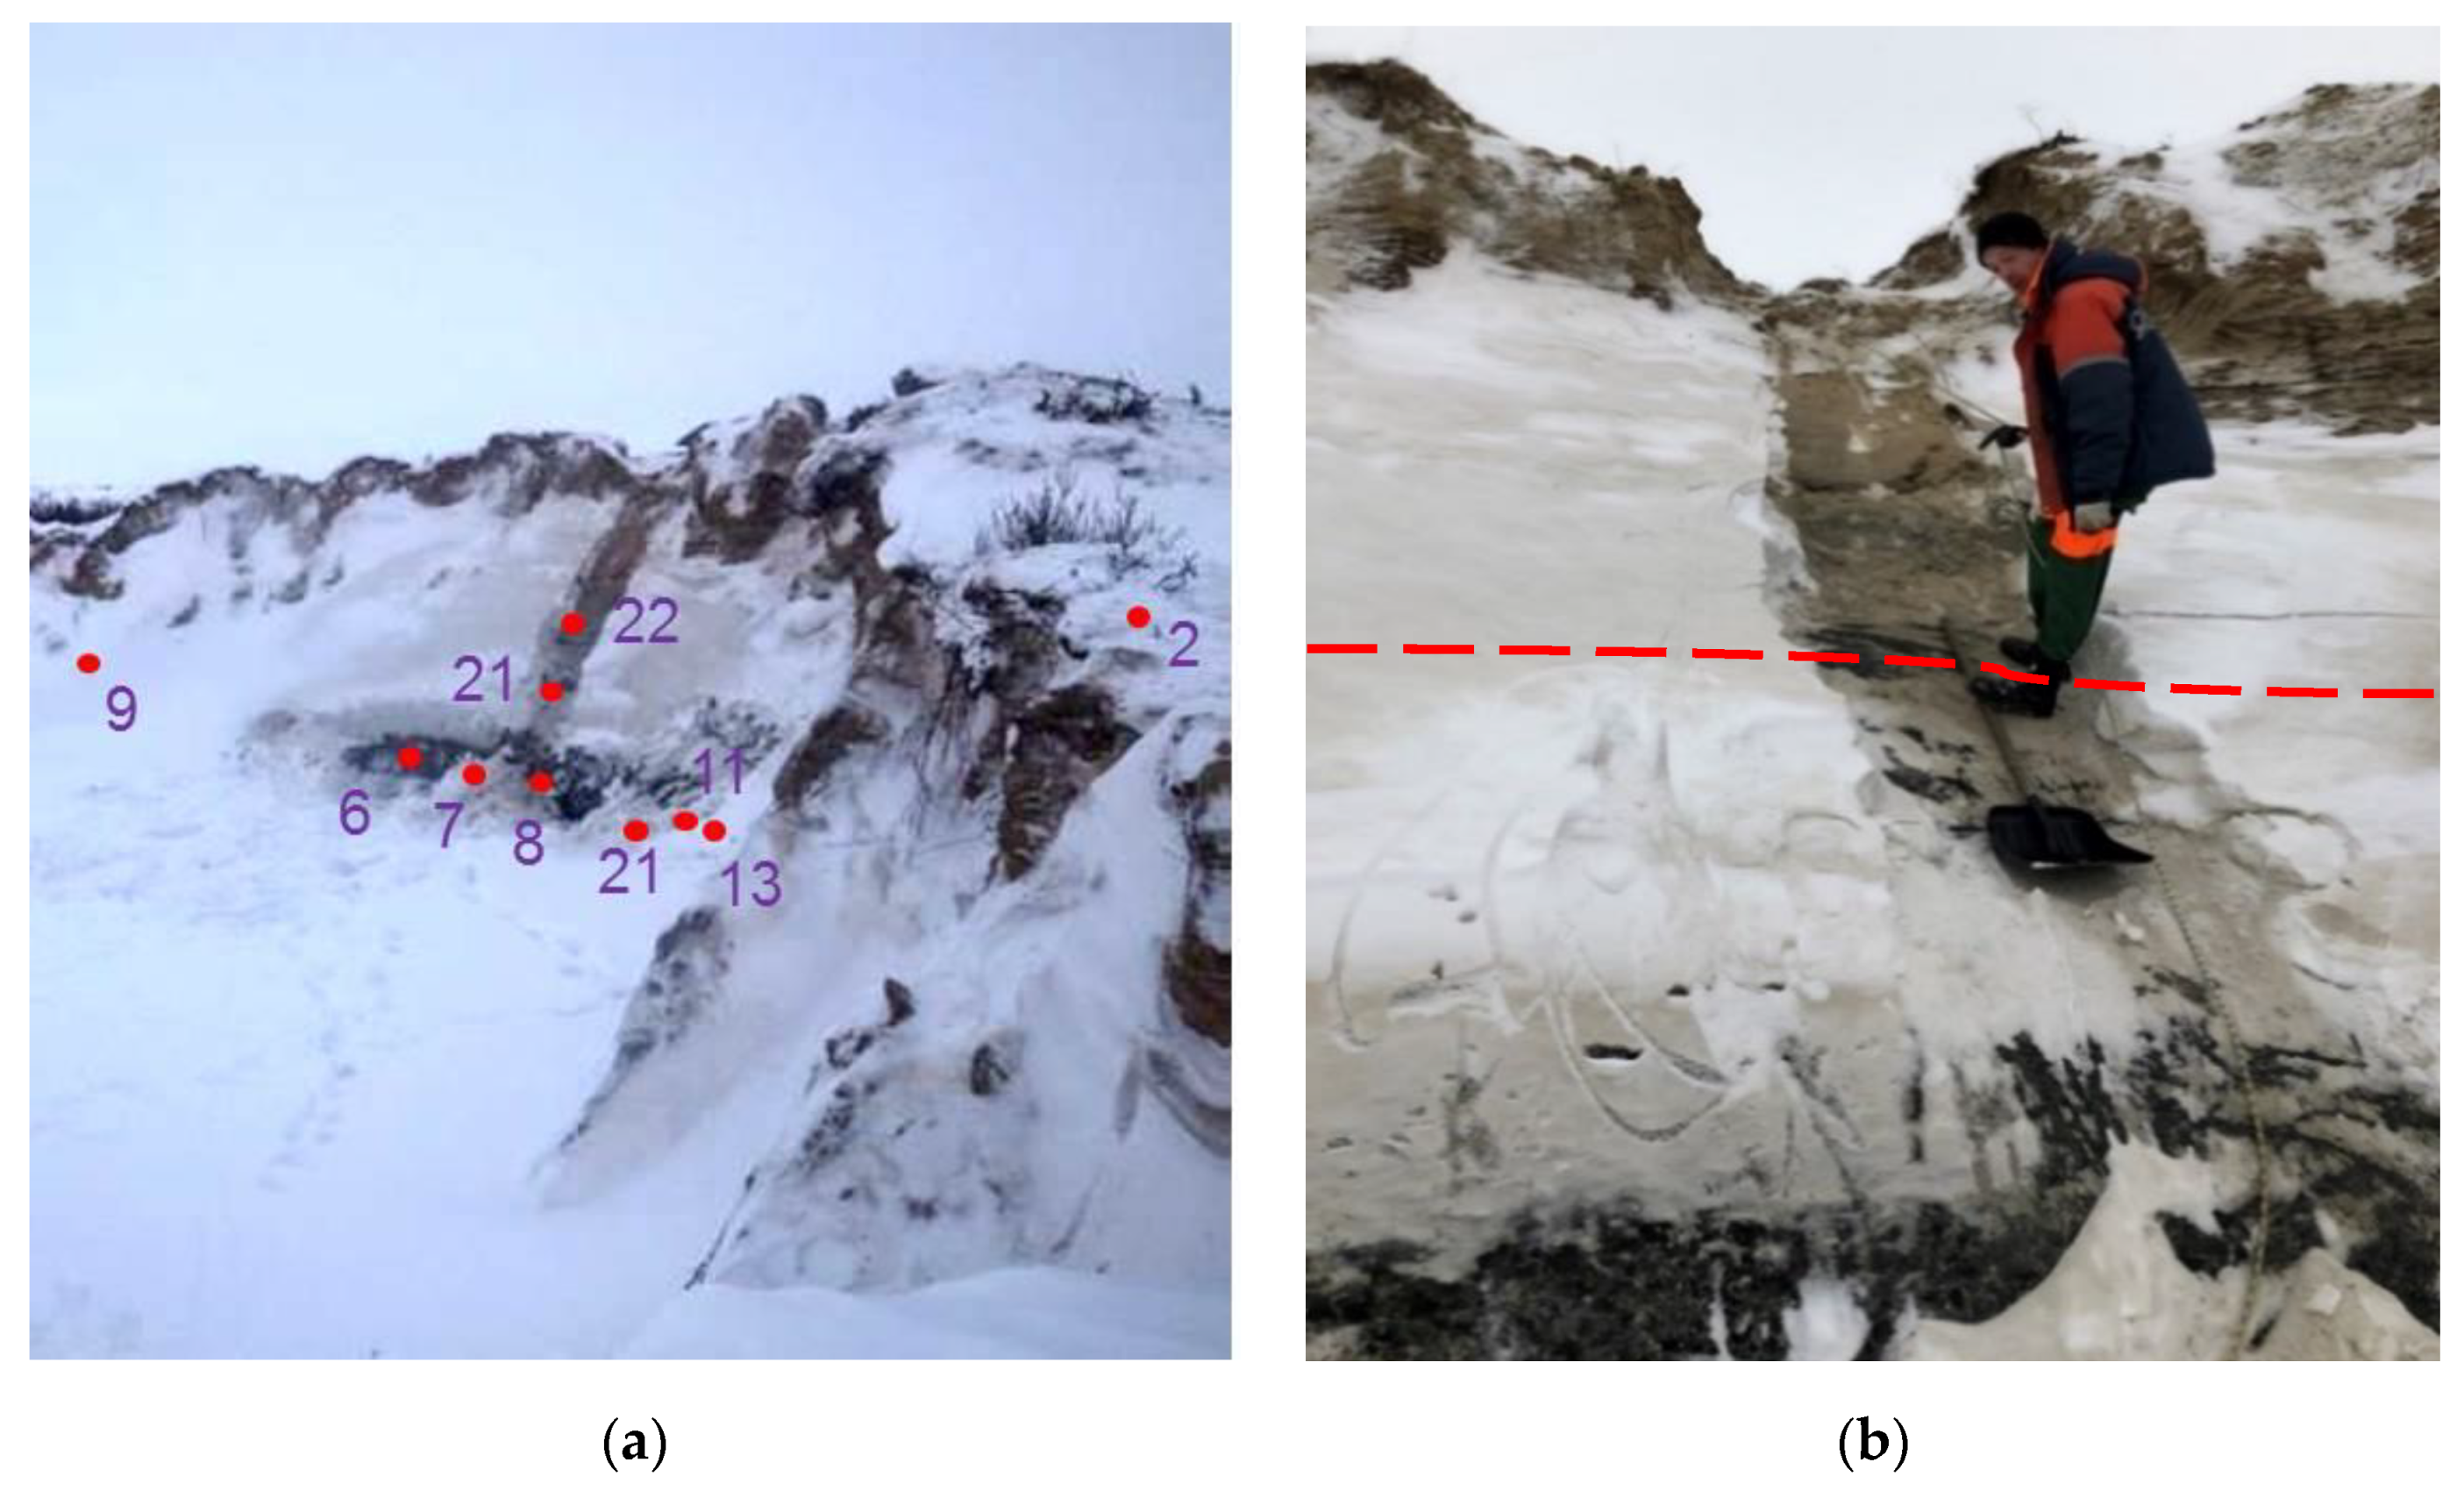
In December 2017, a field trip to the Erkuta crater (Figure 3) was organized jointly by the government of the Yamal–Nenets Autonomous District, the Total SA and the Skolkovo Institute of Science and Technology (Skoltech). The field work included sampling of soil, ice and water from the crater rim. By that time, the southern wall of the crater had collapsed and the diameter increased to 17.5 m. The crater was partly filled with water which made an up to 8-m-deep lake covered by ~1-m-thick ice under ~0.8 m of snow. A part of the parapet-like ridge remained around the crater next to a lake (
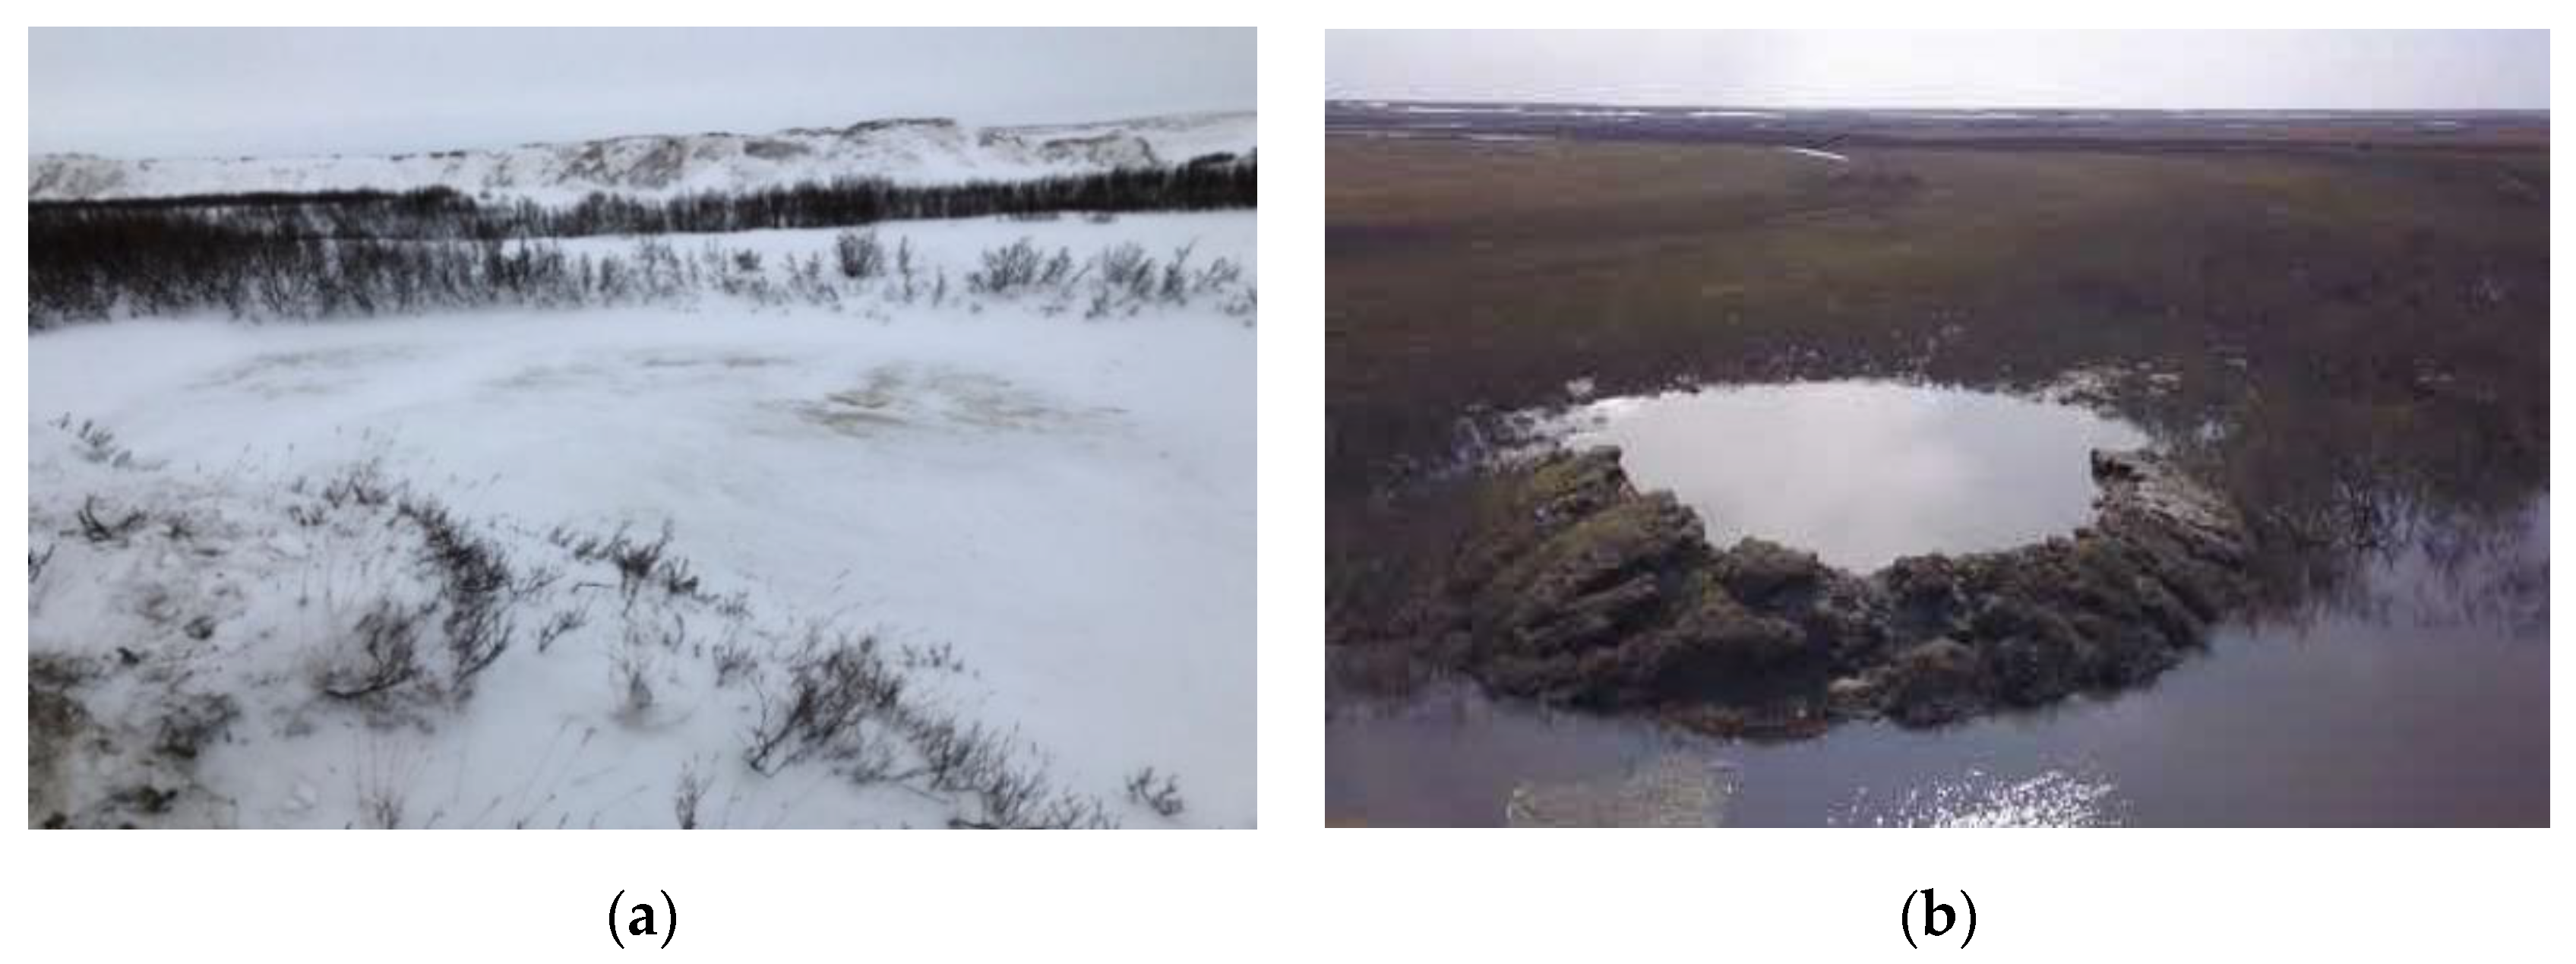
Figure 4a).
In June 2018, the crater was imaged by a drone survey (Figure 4b), which showed further degradation of its wall. The deep crater of a year before became almost fully filled with water and transformed into a lake semi-circled by a remnant 2–3 m parapet (Figure 4b). The crater wall was deformed by thermal erosion and slumping in its outer part but remained vertical in the inner part.

3. Field Data

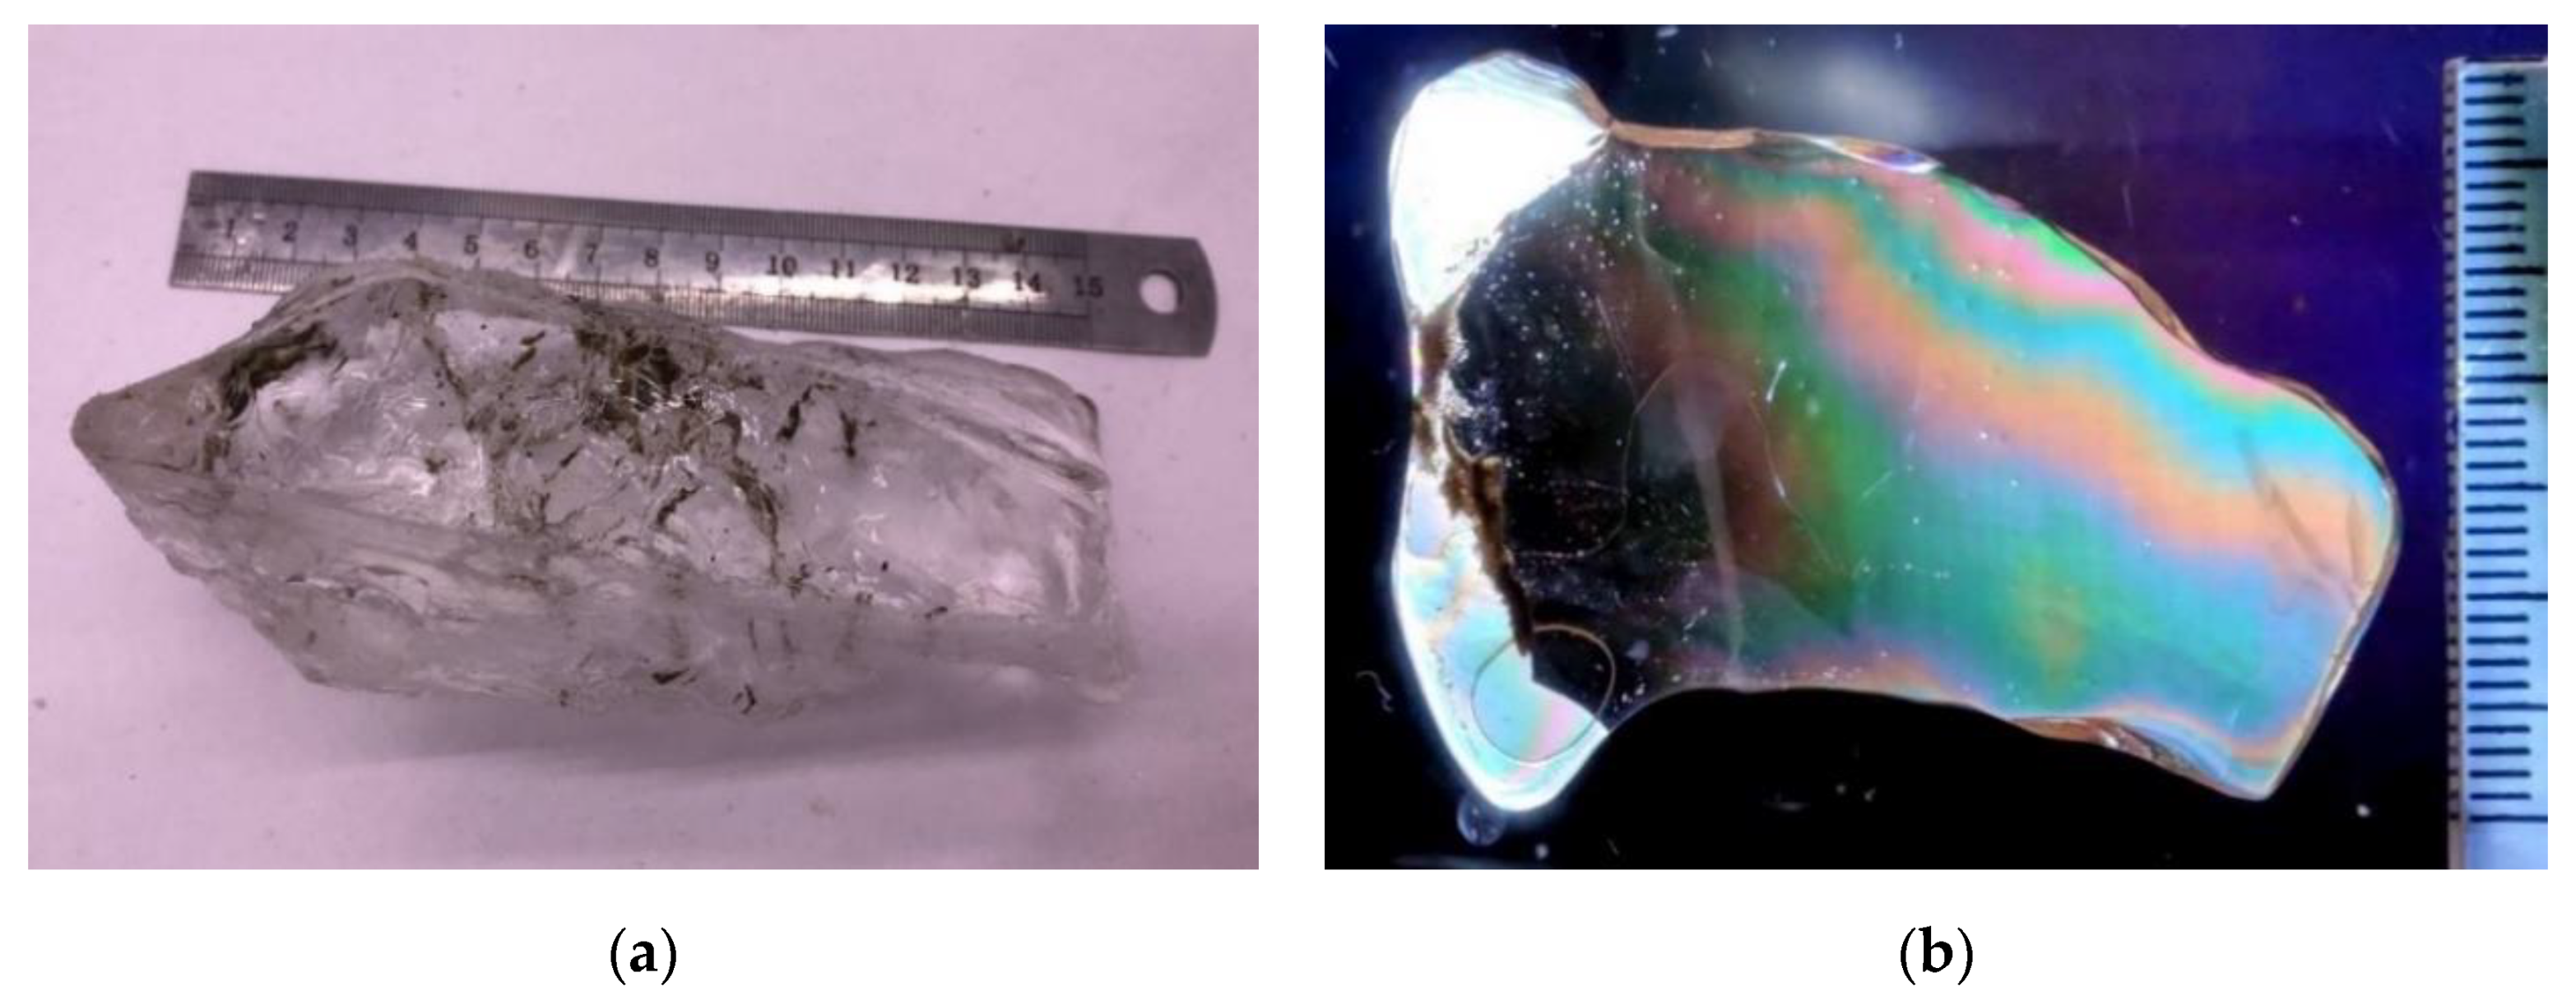
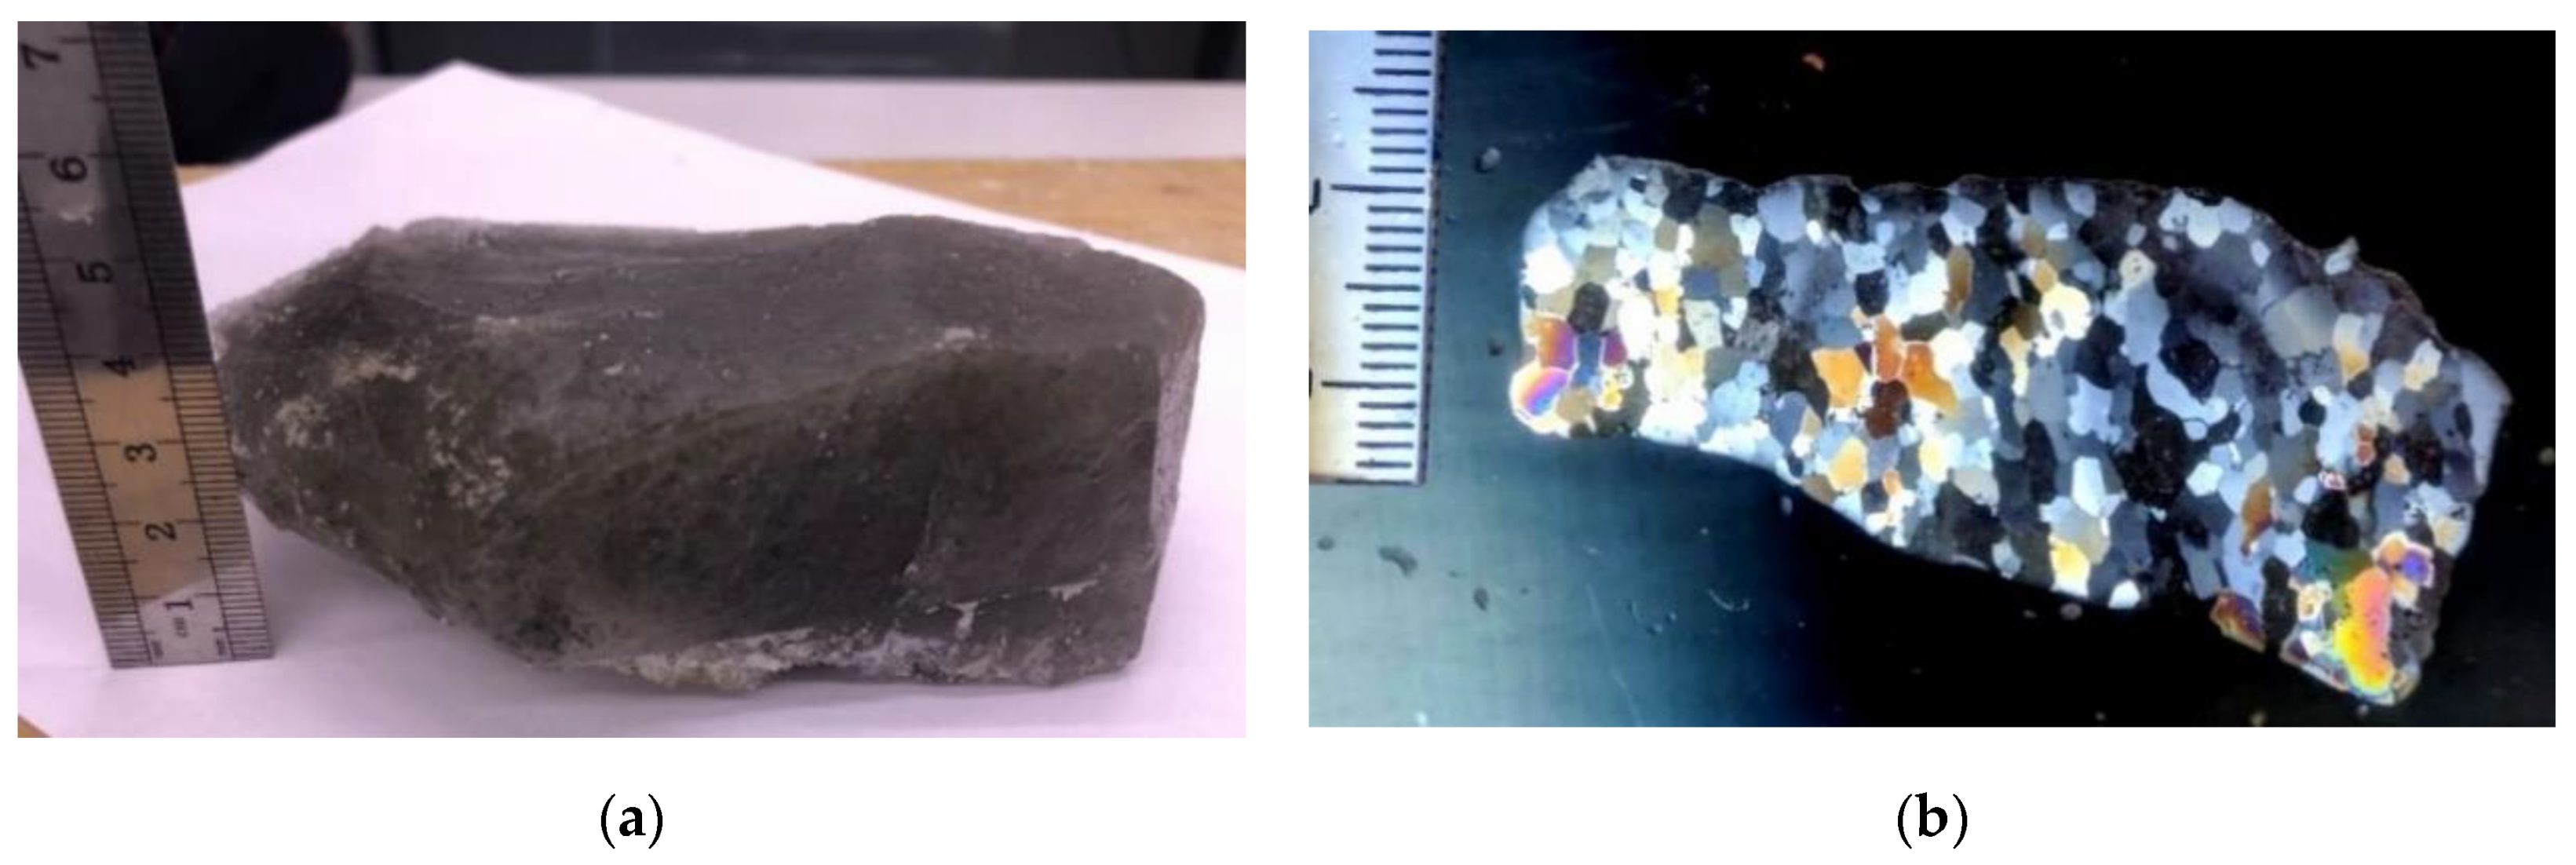
Field studies in December 2017 revealed a layer of massive ground ice, 3–4 m of visible thickness, in the inner wall of the crater (Figure 5a,b).
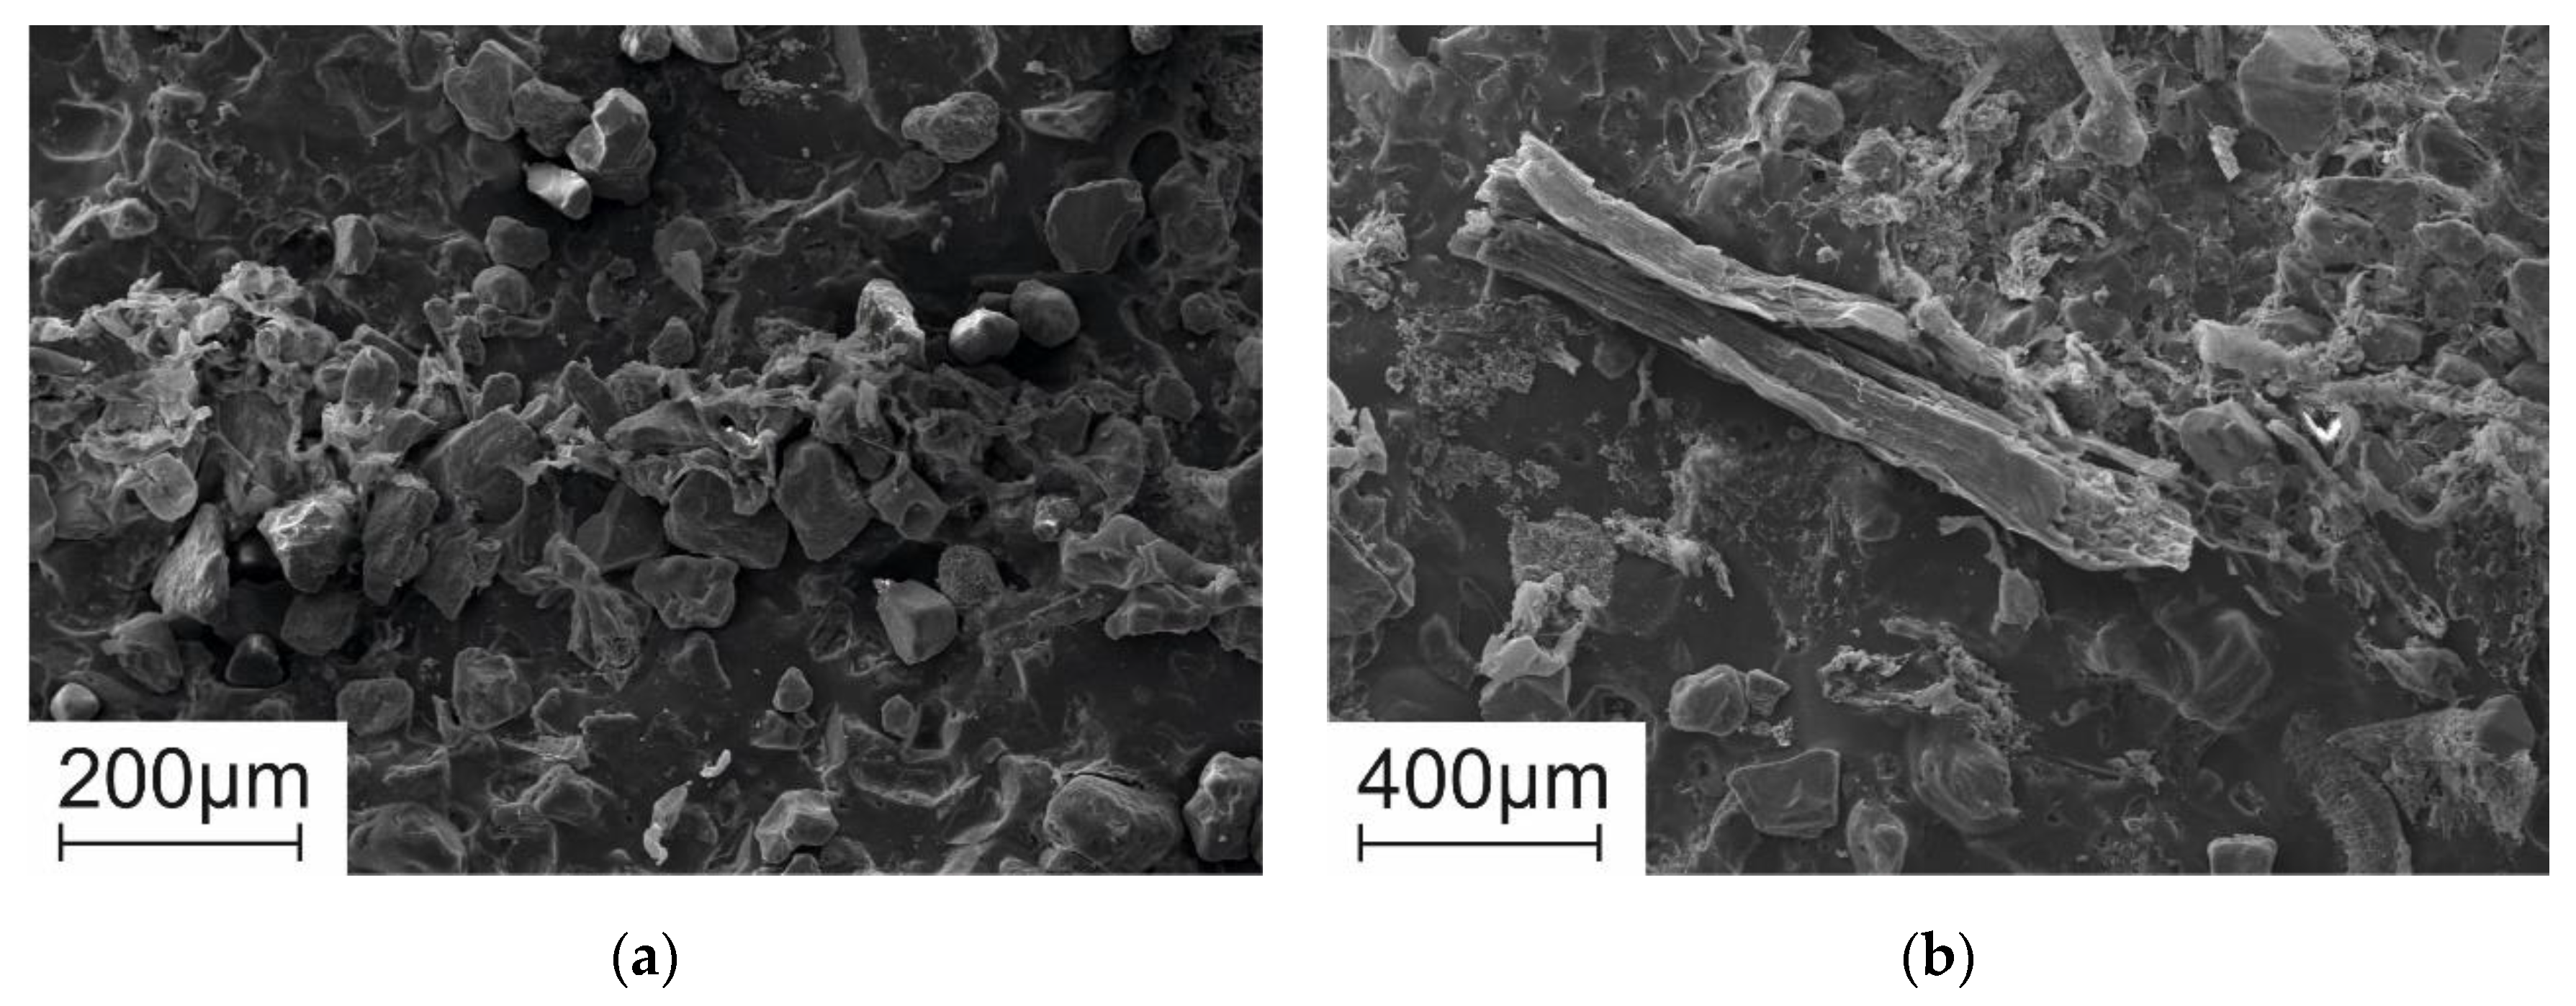
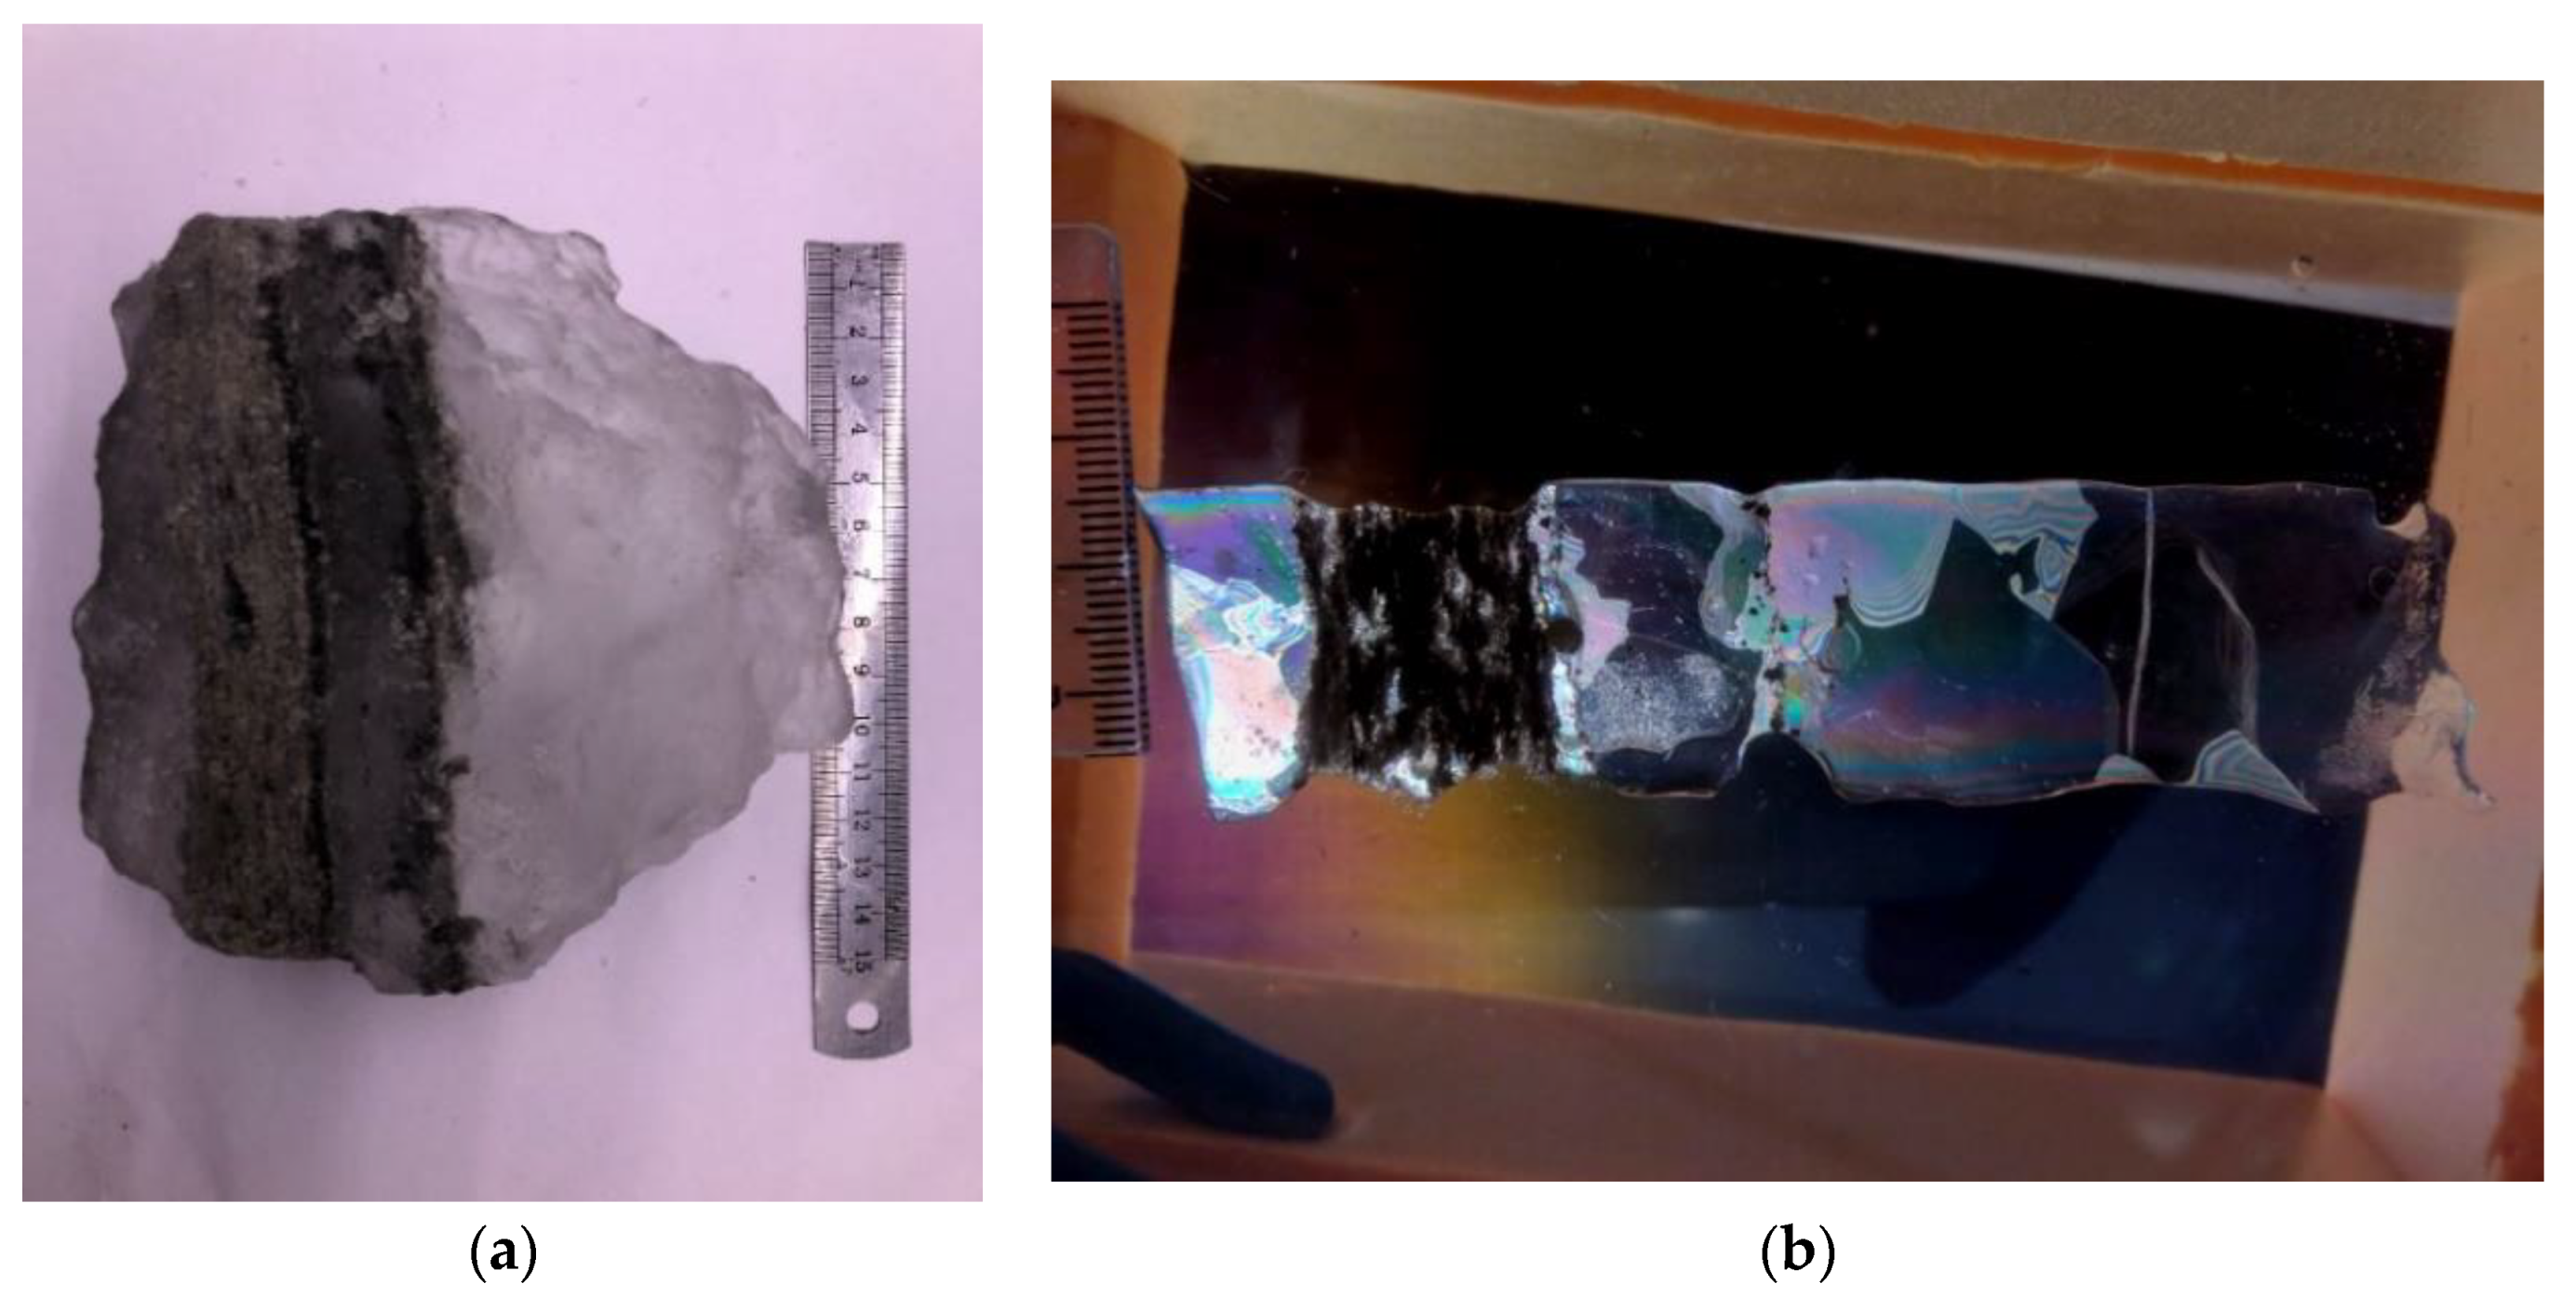
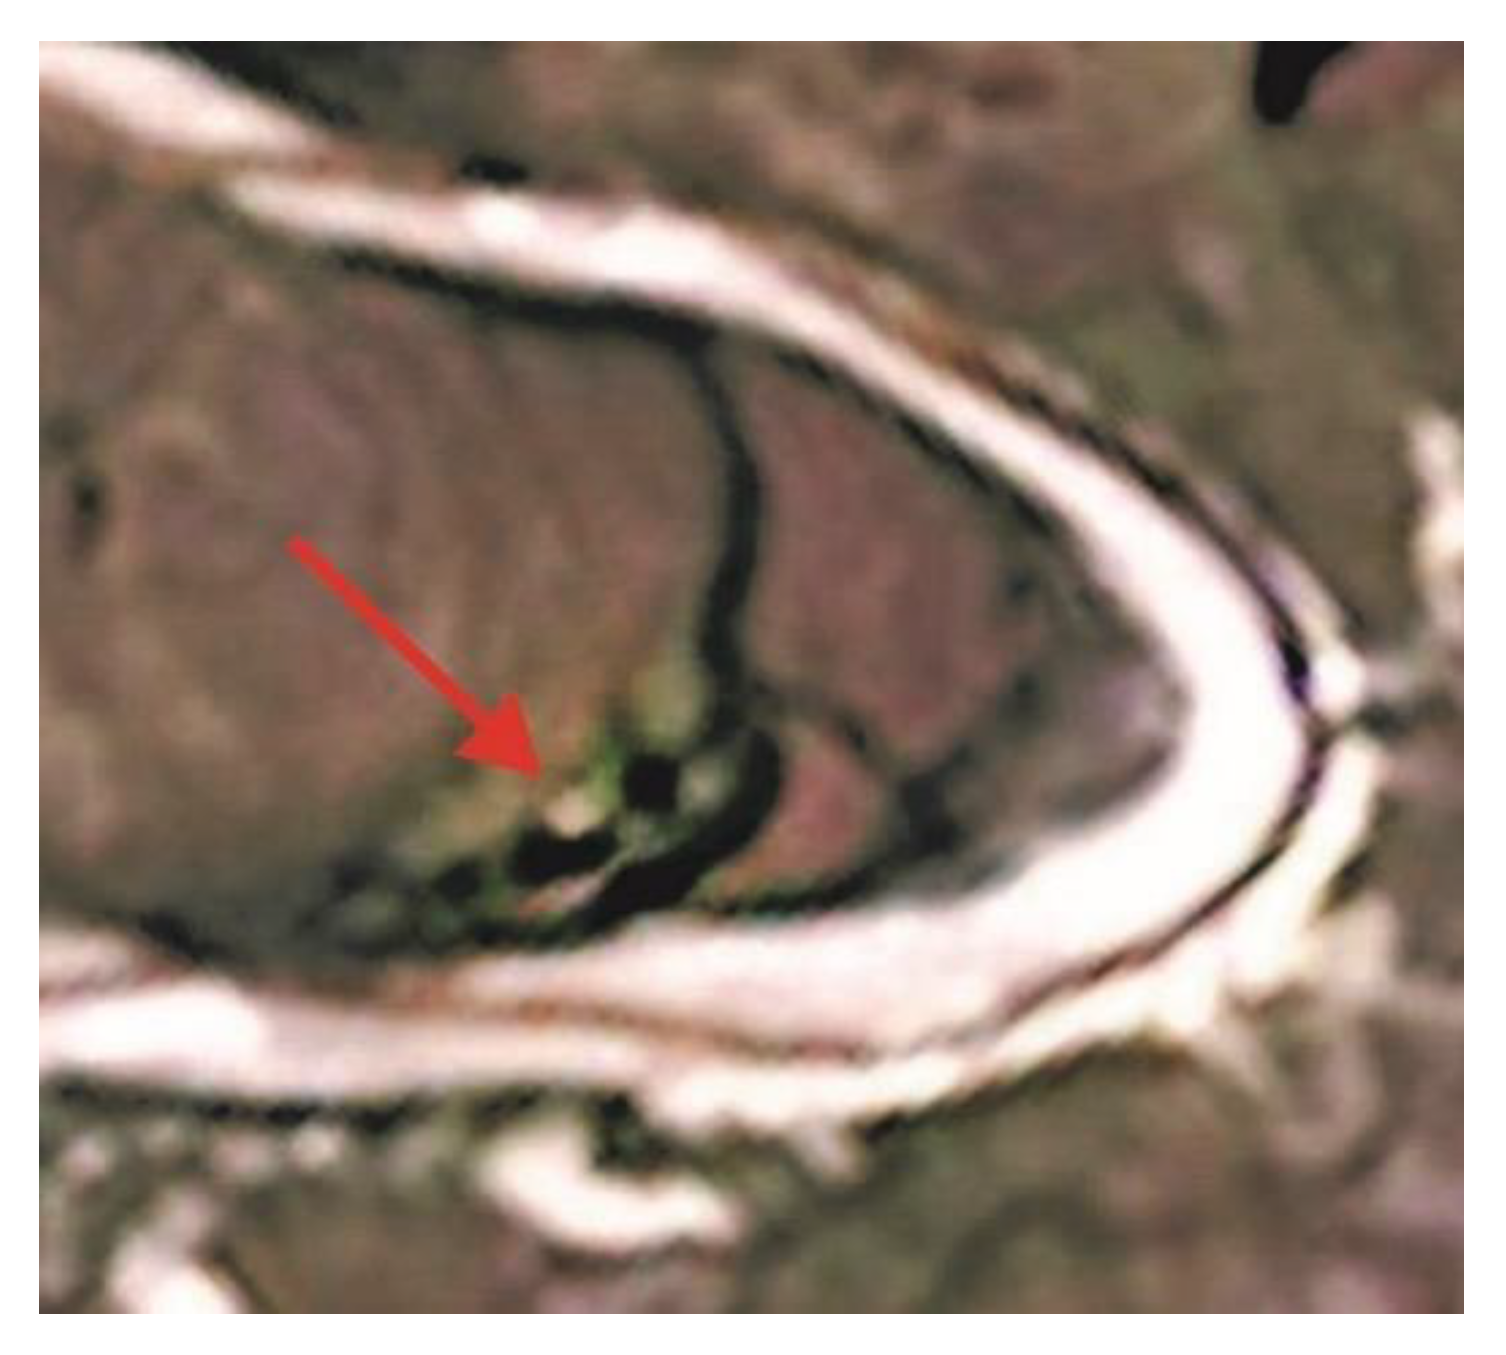
Ice at the sampling site was generally transparent and pure, but locally enclosed 1–2-cm-thick layers of fine-grained soil (Figure 6a,b) and a minor amount of intricately shaped 1–3 mm gas bubbles. The clear massive ice was topped by a dirty gray ice layer of a few centimeters thick with abundant soil inclusions.
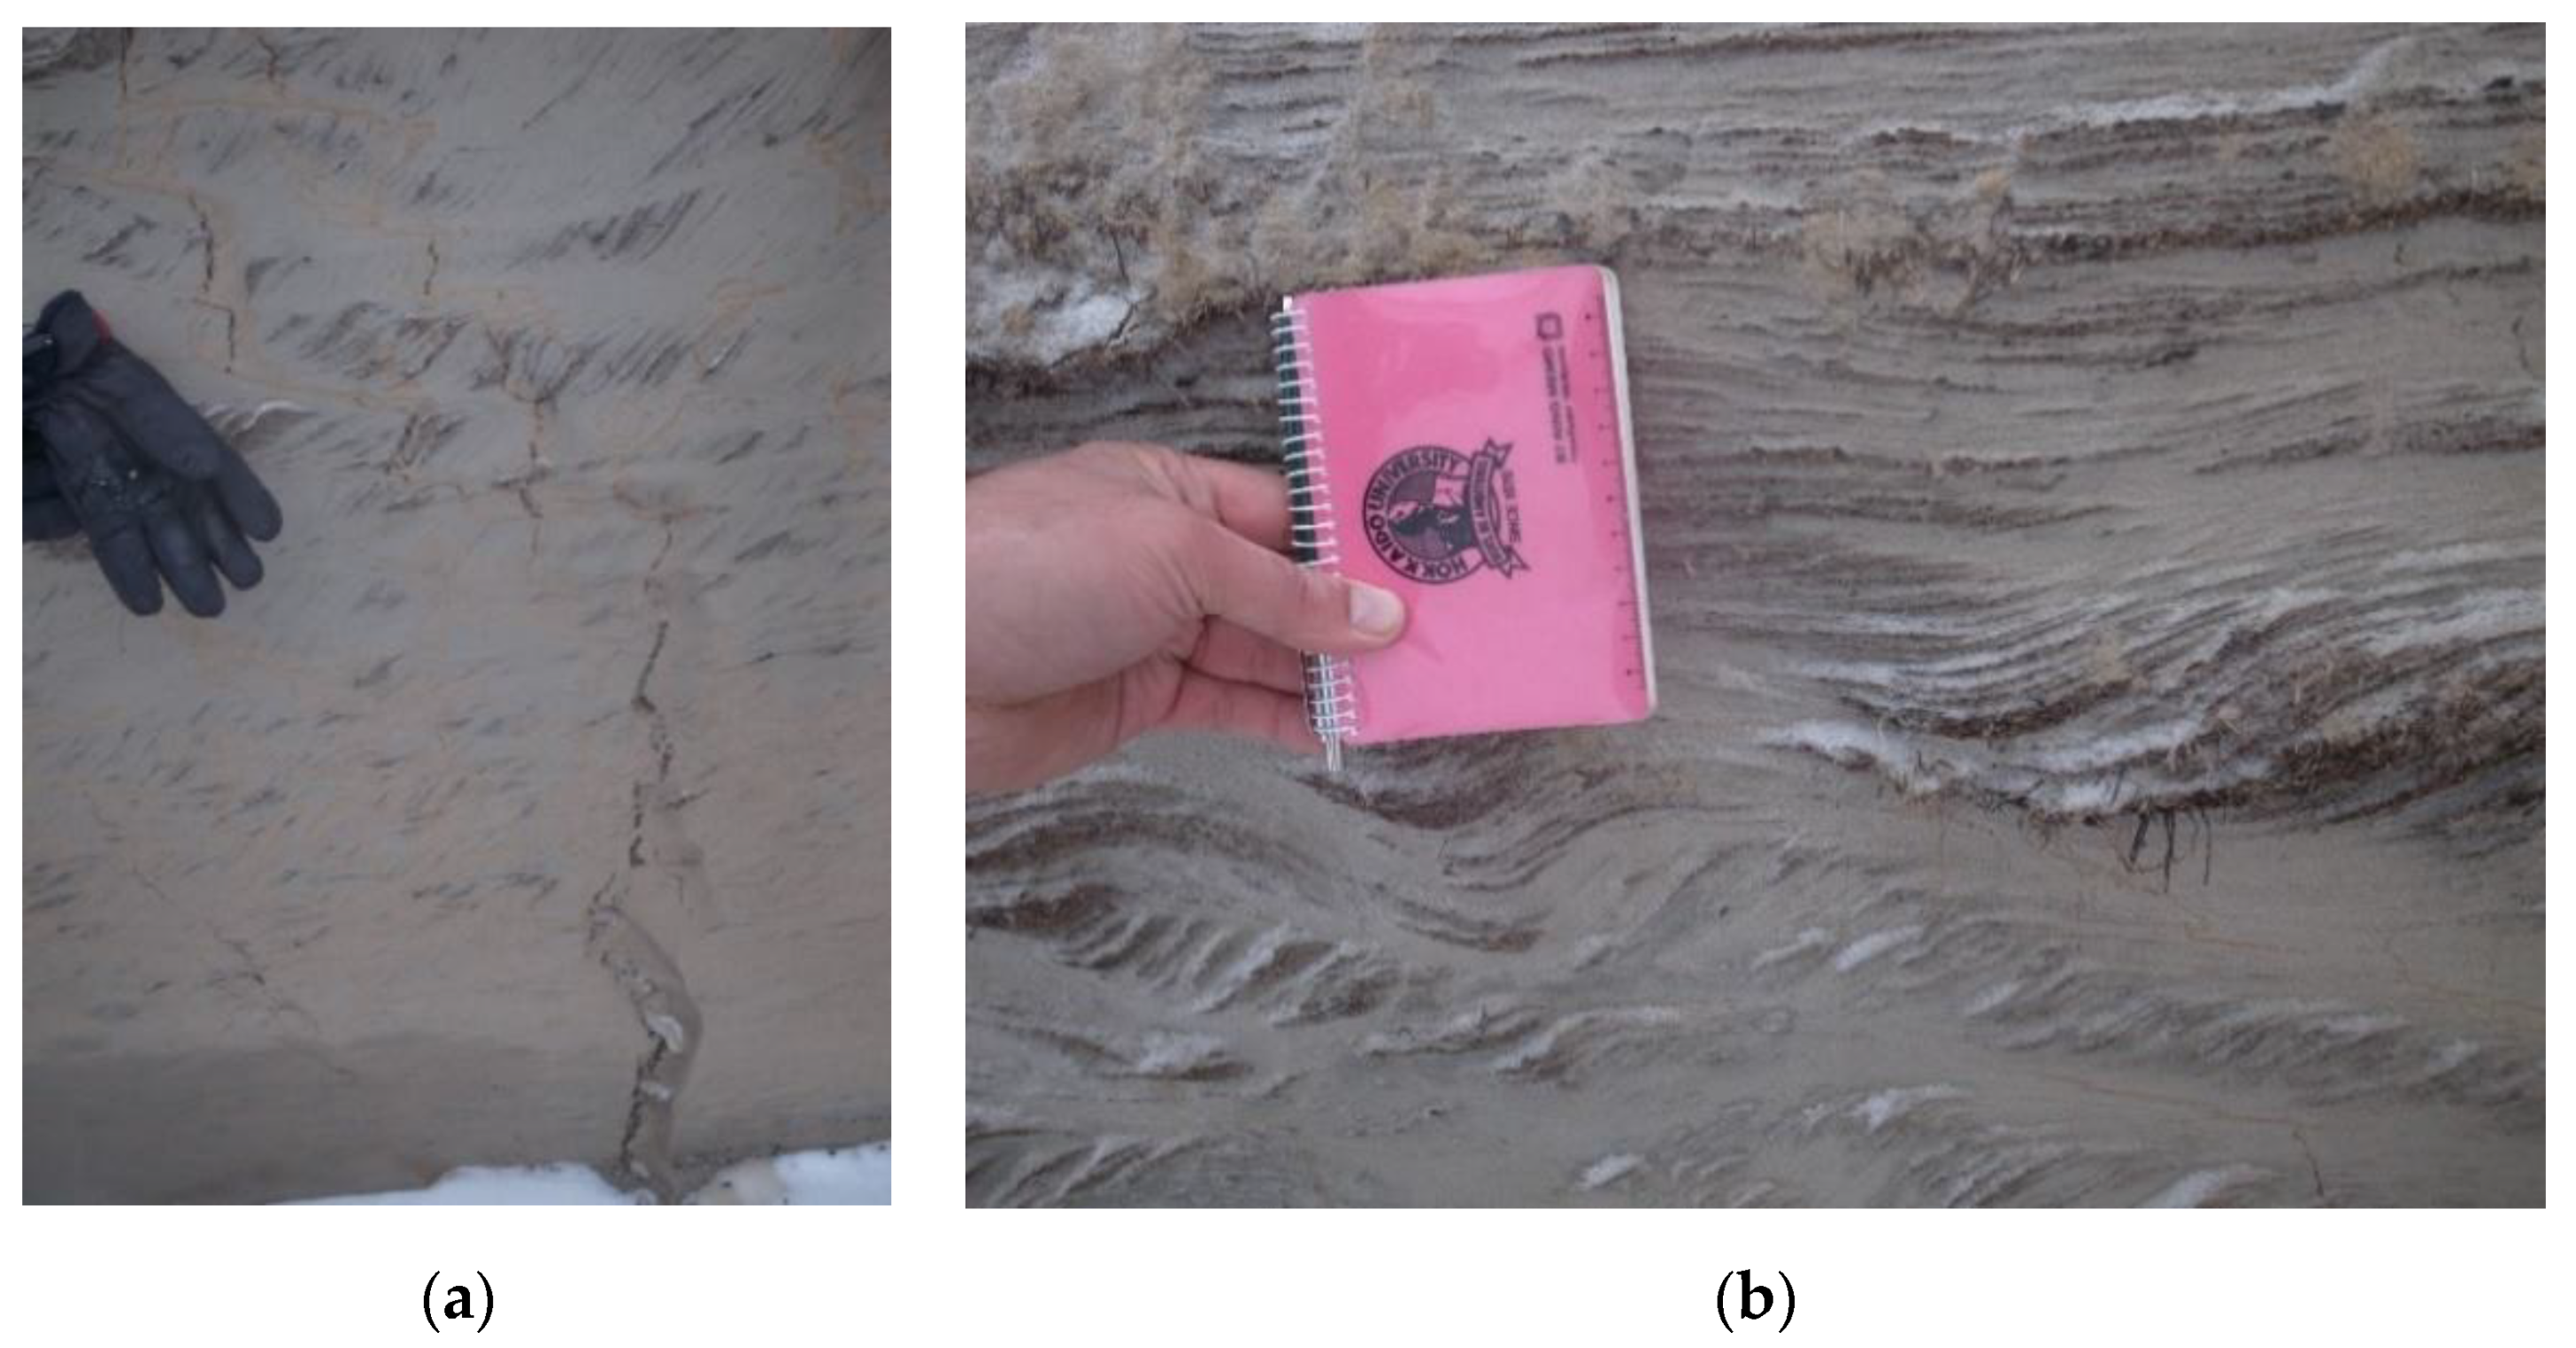
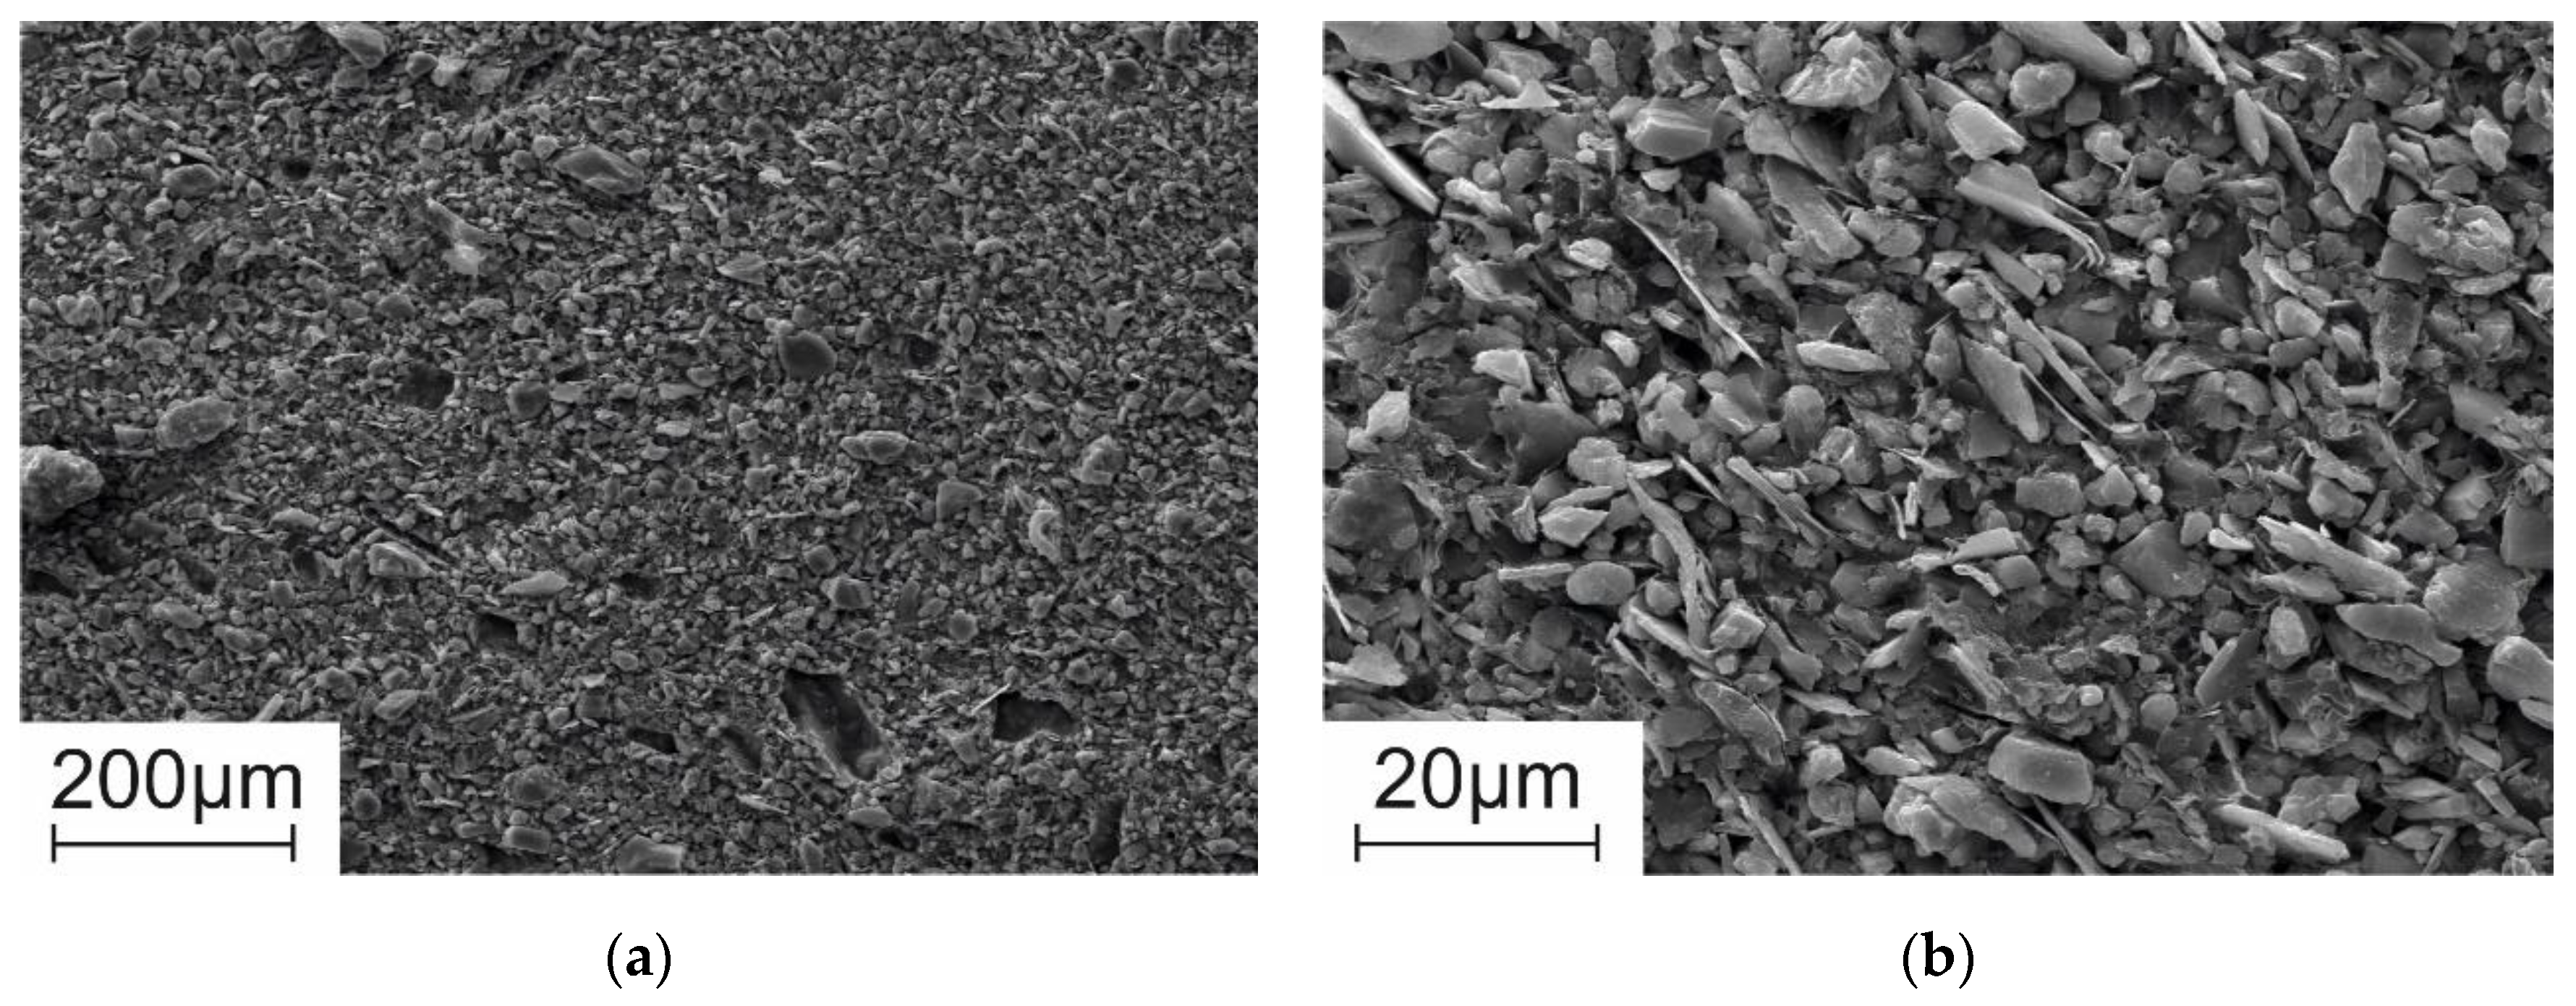
The ground ice was overlain by frozen silt with organic inclusions (plant remnants). The sediments had cross and wavy stratification common to alluvial facies (Figure 7a,b). Some organic layers and lenses were a few centimeters thick and a few cm to tens of centimeters long.
The sandy crater wall was locally cut by discontinuous branching fractures partly filled with ice, often within zones of iron impregnation (Figure 7a). The fractures possibly formed under stress produced by fluid (water or gas) pressure from underlying sediments.
The ejected clay silt on the outer crater wall was originally wet and was deposited in a floodplain environment; it differed markedly from the overlying organic-rich alluvial sand.
Shrubs on the remnant slope facing the lake do not differ much from the surrounding lowland vegetation. Therefore, heaving shortly preceded the gas emission event and did not cause substantial changes to the vegetation. Otherwise, at years-long heaving, vegetation would have adapted to new conditions. Shrubs in the Arctic tundra are usually lower on topographic highs than on the plainland and lack from many areas where only grass can grow.

4. Laboratory Data

4.1. Samples

The samples collected during the December 2017 field trip to the crater included frozen soil from the northern wall, fine-grained material ejected from the crater and ice (Table 1).
The particle size distribution of soil samples and soil inclusions in ground ice was analyzed in the laboratory of Fundamentproekt (Table 2). The particles sizes were determined by the pipette method in silt and clay and by sieve analysis in sand.
The particle sizes of soil over the ground ice mainly correspond to silty sand while the ejected material is mainly light clay silt and silt, with particle sizes similar to those of soil inclusions in visible ground ice.
The mineralogy of soil samples was analyzed at the Geological Faculty of the Lomonosov Moscow State University on a Rigaku ULTIMA-IV X-ray diffractometer (Japan) [14]. The samples consist mainly of quartz and feldspar minerals (microcline and albite), about 80%–90% in total. Quartz percentages reach 61.8% and 74.3% in silty sand samples 8 and 9, respectively, notably more than in clay silt sample 2 (~45.2%). The feldspar minerals are 32.3% in sample 2, 23.9% in sample 8 and about 15.4% in sample 9. Clay minerals are mainly mixed-layer illite–smectite, from 5.8% in sample 9% to 10.2% in sample 2. Other minerals occur in minor amounts (1% or less). Samples 2 and 8 share similarity in mineralogy, with similar amounts of microcline, illite, smectite and kaolinite, and thus were originally involved in similar deposition processes.
The soil and ice samples were analyzed for the contents of soluble salts by using soil–water extracts prepared from 100 g of dry substance. Soil-free massive ground ice was analyzed in the molten state. The total percentage of salts did not exceed 0.1% in soil samples and was in a range of 40–173 mg/L in ice samples. The predominant major ions were alkaline metals (Na+K) and Mg2+ as cations and SO42+ and Cl as anions (Figure 8).
The contents of unfrozen pore water in samples of erupted material (sample 2) and sand from the crater wall (sample 9) were determined from pore water activity [15]. The amount of liquid water in the sand samples decreased abruptly at temperatures below −1 ℃ and was less than 1% at −4 ℃. The clay silt sample (2) contained more unfrozen water than the sand sample (9): ~4% at −4 ℃ and around 3% at −10 ℃.
We compared major-ion chemistry (Table 3) and stable isotopes of water in ice samples from the crater wall and in crater lake water. The ice samples (11 and 13) were recovered from the middle part of the ice lens free from visible soil inclusions. Prior to analyses, ice samples were melted, and the obtained water was collected without filtering.
The salinity of lake water is higher than that of ground ice: contents of some major ions are 7 to 11 times higher (Table 3), especially SO42−, Mg2+ and Ca2+.
The oxygen and hydrogen isotope compositions of water from the lake and ice are also different: those of ground ice are more depleted than in surface water from the crater (Figure 9). These compositions indicate that the mean annual temperature was 7 to 10 °C lower than now when the ice was forming.

4.2. Structure and Texture of Soil and Ice Samples

The structure and texture of soil and ice samples were analyzed at Skoltech. The microstructure of frozen soil was studied in replica samples (imprints of fresh fracture planes on a plexiglass film) under an optical microscope (at Skoltech) and a scanning electron microscope (at Moscow University). The techniques for preparing replica samples and their optical and electron microscopy were reported in a number of publications [16,17]. Ice structure and texture were studied in thin sections between crossed Polaroids; the thin sections were prepared following the standard procedures [17].
Soil microstructure was studied in sand from the crater wall (sample 9) and in ejected clay silt (sample 2). According to reflected light optical microscopy, the sand sample (9) mostly consists of 0.1–0.25 mm subrounded isometric quartz particles, with lesser amounts of fine-grained material, lenses and layers of more or less strongly degraded organic remnants, distinct 1–2 mm brown organic inclusions, as well as black organic–mineral concretions of silty sand and decayed organics.
SEM images (Figure 10) highlight the morphology of quartz grains, with signatures of brittle fracture and dissolution (Figure 10a) and with organic inclusions of different sizes, shapes and decay degrees (Figure 10b). Finer silt or clay particles make continuous or discontinuous films and clusters on the surface of sand particles.
The microstructure of clay silt ejected from the crater (sample 2) was also examined under the optical and electron microscopes. Reflected light optical microscopy revealed quite uniform silt and clay particles with rare sand grains and fuzzy dark brown organic inclusions. SEM images of different magnifications (Figure 11) resolve fine sand and coarse silt particles (and their replica imprints) cemented by clay silt at ×500 (Figure 11a) and 5 μm to 20 μm particles at ×2000 (Figure 11b). The ×2000 images reveal orientations of mineral matrix particles delineated by sericite flakes, as well as organic inclusions easily spotted due to their particular shapes.
The ice macrostructure was studied in samples 6, 8 and 11 of ground ice and sample 22 from the top of the ice lens, at the ice–soil contact (Table 1). Samples 6 and 11 are generally similar: massive transparent ice with chains of rare 0.3–0.5 cm air bubbles and thin flaky layers of silt and clay particles (Figure 12а). Clusters of mineral particles occur also at ice crystal boundaries. Mineral inclusions are more numerous than air bubbles. Ice crystals in samples 6 and 11 appear as exceeding 5–7 cm in size, but the actual size is difficult to estimate because only crystal fragments fit into the thin sections (Figure 12b).
Unlike samples 6 and 11, ice sample 8 (Figure 13a) encloses a layer of silty sand (Table 2) in pure ice almost free from soil particles and air bubbles. The ice crystals are fine (few mm) along the soil layer and coarser (2–3 cm) away from it (Figure 13b). Although the true size of the ice crystals remains unknown because of the limited thin section size, they may be commensurate with those in samples 6 and 11. The soil layer, in its turn, encloses numerous small 3–5-mm-long, and up to 2-mm-thick lenses of ice with fine crystals (fractions of mm).
Ice sample 22 from the top of the ice lens differs markedly in color from the other ice samples (Figure 14a). It encloses numerous scattered small soil particles and air bubbles which make it looking like dirty opaque ice. The ice crystals are fine (2–4 mm) and generally isometric (Figure 14b). The sand-silt material occurs both along the boundaries of ice crystals and inside them. The ice crystals in this sample are finer than in the three other samples possibly because they nucleated and grew in the presence of mineral components in the medium which provide numerous centers of crystallization but is unfavorable for the formation of large ice crystals.

4.3. Gas Analyses

The gas component was analyzed in sample 9 of sandy permafrost and samples 6, 21, 22 and 23 of ground ice. Intrapermafrost gas from sample 9 was extracted by 150 ml syringes from thawing ~50 g specimens in a concentrated NaCl solution following the standard technique [18], using pure nitrogen or helium as carrier gas.
The permafrost soil and ice samples were delivered to Skoltech (Moscow) from the Erkuta crater in thermal containers. The gas composition was analyzed at the Geological Faculty of the Lomonosov Moscow State University (Moscow) and at the Hydroisotope Laboratory (Germany). At the Moscow University, the composition of hydrocarbon gases was studied on a Thermo Finnigan Trace GC Ultra gas chromatograph. The analytical work in Germany included analyses of intrapermafrost gas on a Thermo Scientific DELTA V Plus (IRMS) mass spectrometer (Waltham, MA USA), as well as determination of major-ion chemistry and stable isotopes in ground ice and crater lake water. The analytical results are summarized in Table 4 and Table 5.
Methane was present in all samples (Table 4 and Table 5): mostly a few cm3 per 1 kg of soil or ice. Its content reached 94 cm3/kg at the top of ground ice (sample 22) but was about 10 times less in sample 21 from the middle of the ground ice lens (Table 4). All samples except for 21 contained much more СО2 than methane (Table 5), which may be evidence of cryogenic concentration in frozen sand, e.g., during freezing of a talik [10]. The contents of ethane and propane (methane homologs) varied from fractions to 2–3 cm3/kg (Table 4). The ratios of methane to its homologs in ice samples were generally from 2 to 40 and indicated the presence of both biogenic methane and a component associated with sediment maturation (deep gas). The carbon isotope composition of methane in ground ice (δ 13С = −72‰) analyzed at the Hydroisotope Laboratory (Germany) likewise suggests biogenic origin of the gas.

5. Formation Model of the Erkuta Crater

The obtained results have implications for the formation mechanism of the Erkuta crater, which formed on the site of the paleo-channel of the Erkuta–Yakha River. The contours of the dried riverbed can be seen in a photograph of 2017 (Figure 2), as well as in a satellite image of 2013 (Figure 15). As a result of evolution, the paleo-channel gradually turned into an oxbow lake, which continued to degrade and split up into several small drying lakes. Then a heaving mound began to form within one of these dried-up lakes. Contour of a mound is a bright spot (probably slightly elevated and drained soils) against the background of a dark thawed water-saturated soils, which can be distinguished in a satellite image of the beginning of summer 2013 (Figure 15).
The thermal effect of such lakes often produces a zone of unfrozen rocks (a talik) underneath. The lake sediments within the taliks contain organic matter recycled by microorganisms with release of biogenic methane. Additionally, gases can penetrate into the lake sediments from deep subsurface through permeable deformed zones. The talik beneath the Erkuta crater was most likely closed, given that the permafrost thickness in the area is about 200 m deep and the lake was small. The lake was gradually shoaling and shrinking whereby the talik was freezing from below and from the sides, which caused stress buildup inside the remaining confined talik [19,20]. The stress released explosively by eruption of the gas–water–soil mixture from the freezing talik and the ensuing formation of the crater in its place.
Based on our results and available information, we propose the following conceptual model for formation of the Erkuta crater, (Figure 16):
Stage I: A lake is underlain by a talik, with periodic inputs of organic matter into the lake in summer seasons. The organic matter in the lake sediments is recycled microbially with generation of biogenic methane which is accumulated in winter and emitted into the air in spring. The gaseous component of the sediments in the talik increases additionally due to migration of deeper thermogenic gases along faults and fractures in the crust. Emission of deep-seated gases from Arctic lakes is known from several other areas [1,2,11].
Stage II: Onset of talik freezing takes place after the lake had dried out. The talik undergoes confined freezing and becomes saturated with biogenic and deep-seated thermogenic gas.
Stage III: Confined freezing of the talik and buildup of cryogenic pressure takes place. Freezing of gas-saturated pore moisture under gas pressure at this stage has been studied previously by thermodynamic modeling in laboratory experiments [21,22].
As the lake is drying, the sub-lake unfrozen sediments are freezing from the top and from the sides, which leads to cryogenic gas concentration and stress buildup in the freezing closed talik. Gas-bearing sediments in the latter are confined by the surrounding ice-rich sediments, which increases gas pore pressure in the talik. The pressure may lead to ductile deformation of the permafrost cap above the talik if it exceeds the overburden pressure. At this stage, gas, water and soil in the residual talik can start to stratify.
Stage IV: Stratification of gas, water and soil in the residual talik and heaving. This process occurs in fairly homogeneous alluvial deposits. represented by sandy and silty sediments. As a result of stratification, heavier and denser soil stays on the bottom, while the light volatile gas component rises to the top; liquid water is in the middle. The layers of predominant soil, water and gas components are separated by dash lines in the figure, which are drawn tentatively because each layer contains some amounts of other components. If the pressure buildup is slow, the frozen cap can deform ductily, producing long-lasting heaves on the surface, pingo-like structures. However, if pressure increases rapidly, no slow heaving occurs long before the stress release.
Stage V: Pressure increase in the talik saturated with water and gas and explosive pressure release breaking through the frozen cap. This phenomenon is known as cryovolcanism [10,23]: eruption of water, fluids and liquefied soil triggered by overpressure in a freezing confined or open water-bearing system. The collapse of the frozen cap may be accompanied by outpouring of water or mud. No explosion occurs if the amount of gas in the talik is small, but the gas–water–soil mass from the talik erupts explosively and becomes dispersed, together with the frozen cap debris, in the presence of a gas cap.
Stages VI and VII: Progress of cryovolcanism. At stage VI, the gas–water–soil mixture erupts vigorously, and a crater starts to form. The explosive gas emission breaks up the meters thick frozen cap and disperses its material around the cryovolcano vent. A part of the ejected material falls near the crater and produces a parapet-like ridge rising above the surface around the crater, while some other part obviously falls back into the crater and gradually sinks to the bottom. As the eruption continues, the ejected unfrozen soil falls over the debris of the frozen cap. The soil, water and gas components of the talik, which were previously stratified during the confined freezing, mix again when erupting (Figure 16; Stage VI). The level of the gas–water–soil mixture in the crater gradually decreases and the crater walls emerge. At stage VII, the eruption stops and leaves a crater, with its diameter commensurate with that of the residual closed talik prior to the emission. The ice-rich debris of the cap and the ejected talik sediments are scattered around the crater and cover its bottom.
Note that stages V, VI and VII follow one after another in a few hours to days.
Stage VIII: Stable evolution of the crater and its gradual transformation into a different landform. As the ejected material becomes involved into seasonal freezing–thawing cycles, the crater becomes filled with water in a few months and transforms into a circular lake surrounded by ejected material.
The suggested model explains the crater formation as a result of gas generation and accumulation in a sub-lake talik and the evolution of the talik exposed to confined freezing as the lake is drying out. Gas accumulation in the talik is additionally maintained by ascend of deep fluids migrating upwards through permeable faulted and fractured bedrock.

6. Discussion

The data on the structure and composition of soil samples from the crater wall, as well as the proposed conceptual model for formation of the Erkuta crater, characterize it as a feature of explosive gas emission. Apparently, the crater formed in the place of a freezing closed talik under a dried lake by explosion of pressurized gas in the confined unfrozen sediments. The formation of the crater was preceded by rapid heaving within one or two years, judging by remnants of a mound detected in the first helicopter view of the area (Figure 2). The crater had a shape of a vertical cylinder with smooth walls, possibly because the explosion broke the frozen cap above the talik and mobilized the unfrozen soil–water–gas mass from the talik. A similar process of cryovolcanism has been proposed for formation of the Yamal crater [10]. In our case, we also consider the talik zone freezing. However, the essential role in the gas accumulation process (unlike the model [10] for the Yamal crater) is played not by the biogenic gas generated in the bottom sediments of the thermokarst lake, but by the deep gas entering through the permeable zones.
The presence of fractures partly filled with ice on the crater walls (Figure 7) also indicates that the freezing talik underwent buildup and partial release of stress. Our results indicate that the gas accumulated in and emitted from the talik came from two sources: it was biogenic gas resulting from microbially mediated decay of organic matter in lake sediments and thermogenic gas that migrated from deeper hydrocarbon reservoirs through permeable deformed bedrock. The proposed formation model of the Erkuta crater, unlike that of cryovolcanism suggested for the Yamal Crater [10], includes the contributions of thermogenic gas that had migrated along faults and fractures from deeper hydrocarbon reservoirs in addition to biogenic gas that formed within the talik.
In general, proposed formation model for the Erkuta crater associated with the emission of gas, which is accumulated in shallow permafrost. Its main feature is the consideration of the combined influence of deep-seated (deep gas migration) and shallow (oxbow lake evolution and closed talik freezing) causes in the process of Erkuta gas-emission crater formation. This vision is fundamentally different from the models of other authors, where only one prerequisites type of crater formation is considered: either deep-seated causes [7,8,9] or only shallow ones [2,5,10].

7. Conclusions

The study presents exceptional data on the Erkuta gas-emission crater which was discovered in the summer of 2017 in the floodplain of the Erkuta–Yakha River on the Yamal Peninsula, south of all other craters of this kind found in the North of West Siberia for the past decade.
The main value of the research was the timely organized field trip to the crater in December 2017, which allowed collecting field data and sampling soil, ice and water before the crater became fully filled with water. The lifetime of these features being very short (<2 years), the soil and ground ice collected in December 2017 are the only samples suitable for laboratory analyses.
The study provides field data on the crater evolution in 2017–2018 and laboratory results for samples of frozen soil and ground ice from the crater walls. The crater formation was preceded by rapid heaving (within 1–2 years) detectable in aerial photographs. The presence of fractures partly filled with ice on the crater walls records buildup and partial release of stress in the freezing talik.
The carbon isotope composition of the gas component in ground ice proves the biogenic origin of methane in the surrounding permafrost (δ13С = −72‰). The presence of ethane and propane indicates that deep-seated gases generated during sediment maturation processes may have been involved into the gas-emission event. The higher contents of carbon dioxide compared to methane in several samples confirms the assumption of cryogenic concentration, which usually occurs during freezing of taliks.
The results are used to model the formation of the Erkuta gas-emission crater in shallow permafrost caused by the evolution of a talik under a dry lake, assuming a deep gas flow into the unfrozen zone. The model describes the crater evolution in several stages from geological prerequisites to the formation of a new lake-like landform.

Author Contributions

Conceptualization, methodology, supervision, E.C., J.S.; organization and field work, J.S., A.T., A.S., E.C., B.B., M.S., A.C., C.B.; laboratory research and analysis, E.C., N.S., J.S., B.B., S.G., D.D.; writing manuscript and editing, E.C., N.S., J.S., D.D., B.B. All authors have read and agreed to the published version of the manuscript.

Funding

This research was funded by the energy company Total SA (France), Russian Science Foundation (grant 18-77-10063) with logistic support of the reconnaissance field trip by the Arctic Research Center of the Yamal-Nenets Autonomous District (Russia).

Acknowledgments

The study was carried out jointly by the Skolkovo Institute of Science and Technology (Moscow), the Total Company (France) and the Department of Science and Innovations of the Yamal–Nenets Administrative District. We thank anonymous reviewers for their insightful comments and suggestions that helped us to improve the manuscript.

Conflicts of Interest

The authors declare no conflict of interest.

References

  1. Bogoyavlensky, V.I.; Bogoyavlensky, I.V.; Sizov, O.S.; Nikonov, R.A.; Kargina, T.N. Earth degassing in the Arctic: Comprehensive studies of the distribution of frost mounds and thermokarst lakes with gas blowout craters on the Yamal Peninsula. Arct. Ecol. Econ. 2019, 4, 52–68. (In Russian) [Google Scholar] [CrossRef] [Green Version]
  2. Dvornikov, Y.A.; Leibman, M.O.; Khomutov, A.V.; Kizyakov, A.I.; Semenov, P.B.; Bussmann, I.; Babkin, E.M.; Heim, B.; Portnov, A.; Babkina, E.A.; et al. Gas-emission craters of the Yamal and Gydan peninsulas: A proposed mechanism for lake genesis and development of permafrost landscapes. Permafr. Periglac. Process 2019, 30, 146–162. [Google Scholar] [CrossRef] [Green Version]
  3. Khimenkov, A.N.; Sergeev, D.O.; Vlasov, A.N.; Volkov-Bogorodsky, D.B. Explosive processes in the permafrost zone as a new type of geocryological hazard. Geoecol. Eng. Geol. Hydrogeol. Geocryol. 2019, 6, 30–41. (In Russian) [Google Scholar] [CrossRef]
  4. Bogoyavlensky, V.I. Oil and gas emissions in the onshore and offshore Arctic areas. Drill. Oil 2015, 6, 4–10. Available online: https://burneft.ru/archive/issues/2015-06/4 (accessed on 27 April 2020). (In Russian).
  5. Leibman, M.O.; Plekhanov, A.V. The Yamal gas emission crater: results of preliminary survey. KholodOk 2014, 2, 9–15. (In Russian) [Google Scholar]
  6. Kizyakov, А.I.; Sonyushkin, A.V.; Leibman, М.О.; Zimin, M.V. Geomorphological conditions of the gas-emission crater and its dynamics in central Yamal. Earth’s Cryosphere 2015, 2, 15–25. [Google Scholar]
  7. Olenchenko, V.V.; Sinitsky, A.I.; Antonov, E.Y.; Eltsov, I.N.; Kushnarenko, O.N.; Plotnikov, A.E.; Potapov, V.V.; Epov, M.I. Results of geophysical researches of the area of new geological formation “Yamal crater”. Earth’s Cryosphere 2015, 4, 94–106. [Google Scholar]
  8. Epov, M.I.; Eltsov, I.N.; Olenchenko, V.V.; Potapov, V.V.; Kushnarenko, O.N.; Plotnikov, A.E.; Sinitsky, A.I. Bermuda triangle of Yamal. Sci. First Hand 2014, 5, 14–23. [Google Scholar]
  9. Bogoyavlensky, V.I.; Garagash, I.A. Justification of generation of gas emission craters in the Arctic by mathematical modelling. Arct. Ecol. Econ. 2015, 3, 12–17. (In Russian) [Google Scholar]
  10. Buldovicz, S.N.; Khilimonyuk, V.Z.; Bychkov, A.Y.; Ospennikov, E.N.; Vorobyev, S.A.; Gunar, A.Y.; Gorshkov, E.I.; Chuvilin, E.M.; Cherbunina, M.Y.; Kotov, P.I.; et al. Cryovolcanism on the earth: Origin of a spectacular crater in the Yamal Peninsula (Russia). Sci. Rep. 2018, 8. [Google Scholar] [CrossRef] [PubMed]
  11. Bogoyavlensky, V.I.; Sizov, O.S.; Mazharov, A.V.; Bogoyavlensky, I.V.; Nikonov, R.A.; Kargina, T.N.; Kishankov, A.V. Earth degassing in the Arctic: remote and field studies of the Seyakha catastrophic gas blowout on the Yamal Peninsula. Arct. Ecol. Econ. 2019, 1, 88–105. (In Russian) [Google Scholar] [CrossRef]
  12. Ershov, E.D. (Ed.) Geocryology of the USSR. In West Siberia; NEDRA: Moscow, Russia, 1989; p. 454. ISBN 5-247-00432-9. (In Russian) [Google Scholar]
  13. Melnikov, E.S.; Grechishchev, S.E. (Eds.) Permafrost and Development of Oil and Gas Areas; GEOS: Moscow, Russia, 2002; p. 402. ISBN 5-89118-260-2. (In Russian) [Google Scholar]
  14. Trofimov, V.T.; Korolev, V.A. (Eds.) Laboratory Classes in Soil Science: Students Manual; Moscow University Press: Moscow, Russia, 2017; p. 654. ISBN 978-5-91304-724-3. (In Russian) [Google Scholar]
  15. Istomin, V.A.; Chuvilin, E.M.; Bukhanov, B.A. Fast estimation of unfrozen water content in frozen soils. Earth’s Cryosphere 2017, 6, 116–120. [Google Scholar] [CrossRef]
  16. Ershov, E.D.; Lebedenko, Y.P.; Yazynin, O.M.; Chuvilin, E.M. (Eds.) Microstructure of Permafrost; Moscow University Press: Moscow, Russia, 1988; p. 186. ISBN 5-211-00124-9. (In Russian) [Google Scholar]
  17. Ershov, E.D. (Ed.) Methods of Geocryological Studies. In Students Manual; Moscow University Press: Moscow, Russia, 2004; p. 512. ISBN 5-211-06121-7. (In Russian) [Google Scholar]
  18. Kraev, G.N.; Rivkina, E.M. Accumulation of methane in permafrost. Arct. Environ. Res. 2017, 17, 173–184. (In Russian) [Google Scholar] [CrossRef]
  19. Mackay, J.R. Pingo growth and collapse, Tuktoyaktuk Peninsula Area, Western Arctic Coast, Canada: along-term field study. Géogr. Phys. Quat. 1998, 52, 271–323. [Google Scholar] [CrossRef] [Green Version]
  20. Yershov, E.D. General Geocryology; Cambridge University Press: Cambridge, UK, 1998; p. 604. [Google Scholar]
  21. Chuvilin, E.M.; Davletshina, D.A.; Bukhanov, B.A.; Grebenkin, S.I.; Istomin, V.A.; Sergeeva, D.V.; Badetz, C.; Stanilovskaya, J.V. Effect of gas composition and pressure on pore water freezing point in gas-saturated sediments: an experimental study. Earth’s Cryosphere 2019, 23, 44–49. [Google Scholar] [CrossRef]
  22. Istomin, V.A.; Chuvilin, E.M.; Sergeeva, D.V.; Bukhanov, B.A.; Badetz, C.; Stanilovskaya, Y.V. Thermodynamics of freezing soil closed system saturated with gas and water. Cold Reg. Sci. Technol. 2020, 170, 2. [Google Scholar] [CrossRef]
  23. Alekseev, V.R. Cryovolcanism and mystery of the Patom crater. Geodyn. Tectonophys. 2012, 3, 289–307. (In Russian) [Google Scholar] [CrossRef]
Figure 1. Location map of the Erkuta crater and oil and gas fields in the Yamal Peninsula.
Geosciences 10 00170 g001
Figure 2. Helicopter view of the Erkuta crater and adjacent territory in summer 2017. Photo by the Yamal-Nenets Autonomous District (YNAO) government.
Geosciences 10 00170 g002
Figure 3. Panoramic view of the Erkuta crater in December 2017. Photograph by J.V. Stanilovskaya.
Geosciences 10 00170 g003
Figure 4. A lake (a) next to the remnant parapet-like ridge around the Erkuta crater (December 2017, photograph by E. Chuvilin) and a panoramic view (b) of the Erkuta crater (summer 2018, photograph by A. Sokolov).
Geosciences 10 00170 g004
Figure 5. Sampling points (red circles) in the inner wall of the Erkuta crater, December 2017. (a) fragment of the sampling site, (b) numbers of sampling points correspond to sample numbers in Table 1. Red dashed line in panel b delineates the ice top. Photograph by E. Chuvilin, December 2017.
Geosciences 10 00170 g005
Figure 6. Massive ground ice in the crater wall (December 2017). Photograph by E. Chuvilin. (a) the surface of ice, (b) fresh crush cut of ground ice with soil inclusions.
Geosciences 10 00170 g006
Figure 7. Interbedded sandy and silty soils with inclusions of organic matter in the crater wall (December 2017). Photograph by E. Chuvilin. (a) discontinuous branching fractures, (b) wavy stratification of organic material.
Geosciences 10 00170 g007
Figure 8. Concentrations of water-soluble salts in samples (mg/L): Lake = water from crater lake; Ice = sample 22; Lean clay (surface) = sample 2; Sand = sample 9.
Geosciences 10 00170 g008
Figure 9. Oxygen and hydrogen isotopic compositions of water sampled from the crater lake and ground ice.
Geosciences 10 00170 g009
Figure 10. SEM images of sand sample 9 at different magnification factors, with signatures of fracture and dissolution (a) and organic inclusions (b).
Geosciences 10 00170 g010
Figure 11. SEM images of clay silt sample 2 at different magnification factors: general view (a) and detail image (b).
Geosciences 10 00170 g011
Figure 12. Ice sample 6: general view (a) and structure under polarized light (b).
Geosciences 10 00170 g012
Figure 13. Ice sample 8: general view (a) and structure under polarized light (b).
Geosciences 10 00170 g013
Figure 14. Ice sample 22: general view (a) and structure under polarized light (b).
Geosciences 10 00170 g014
Figure 15. Satellite image of the Erkuta crater area at the beginning of summer 2013.
Geosciences 10 00170 g015
Figure 16. Formation of the Erkuta crater in several stages: I: a lake and a talik underneath; II: onset of talik freezing after the lake has dried out; III: confined freezing of the talik and buildup of cryogenic pressure. Arrows show the expulsion direction of gas (blue dots); IV: stratification of gas, water and soil in the freezing talik and frost heaving; V: collapse of the frozen cap above the talik by pressurized gas (cryovolcanism); VI: active eruption of the gas–water–soil mass and onset crater formation; VII: end of eruption and crater formation; VIII: lake formation as crater becomes filled with water.
Geosciences 10 00170 g016
Table 1. List of soil and ice samples (see Figure 5).
Sample No.Brief DescriptionSampling Point
Sample 2Loam ejected from the craterOn the surface near the crater
Sample 6Ice with soil inclusions (less than 1%) from ice lens0.5 m above the lake ice surface
Sample 7Ice with soil inclusions (up to 2%–3%) from ice lens0.5 m above the lake ice surface
Sample 8Ice with soil inclusions (up to 2%–3%) from ice lens0.5 m above the lake ice surface
Sample 9SandFrom the crater’s inner sidewall. Sampling point at 1.2 m above the lake ice surface
Sample 11Pure iceA lens of massive ice in the crater’s sidewall; The middle part of the lens is free from visible inclusions of soils. Sampling point at 0.5 m above the lake ice surface and 2 m to the right of sample No.6
Sample 13Pure ice
Sample 21Pure iceIce from a lens of massive underground ice in the crater’s sidewall. The middle part of the ice intrusion with visible (1%–2%) inclusions of soils. Sampling point at 1 m below the top of the ice lens
Sample 22Ice with soil additivesAt a contact between a lens of underground ice and overlaying frozen soil
Sample 23Ice with soil additivesAt a contact between the massive underground ice and the lake ice in the crater
Table 2. Particle size distribution and air-dried density of soil samples.
Sample No.Particle Size Distribution, %Air-Dry Density of Soil, g/cm3Type of Soil
1–0.05 mm0.05–0.002 mm<0.002 mm
Sample 216.267.816.02.66Light clay silt
Sample 740.535.723.82.7Light silt
Sample 887.09.33.72.66Silty sand
Sample 994.53.91.62.64Silty sand
Table 3. Major-ion chemistry of water samples (analyzed at the Laboratory of Hydroisotopes).
SampleNa+, mg/LK+, mg/LCa2+, mg/LMg2+, mg/LCl, mg/LSO42−, mg/L
Water from crater lake9.92.427.011.02.821.0
Ground ice2.41.04.21.21.40.67
Table 4. Contents of methane and its homologs in ground ice and permafrost samples.
SampleСН4, cm3/kgС2Н6, cm3/kgС3Н8, cm3/kg
Data of Moscow University
Sample 61.67
Sample 224.740.03
1.640.030.01
Sample 231.6
0.80.080.08
Data of Hydroisotope Lab
Sample 219.33.22.2
Sample 22941.70.8
Table 5. Contents of carbon dioxide and methane and its homologs in ground ice and permafrost samples from the crater wall (by Hydroisotope Lab).
SampleCO2,%CH4, ppmC2H6, ppmC3H8, ppm
Sample 96.08
Sample 212075
Sample 221.7643484

