The Three-Segment Control and Measurement of Reliable Monitoring of the Deformation of the Rock Mass Surface and Engineering Structures on the Międzyodrze Islands in Szczecin, NW Poland

 ,
,
Abstract
:1. Introduction
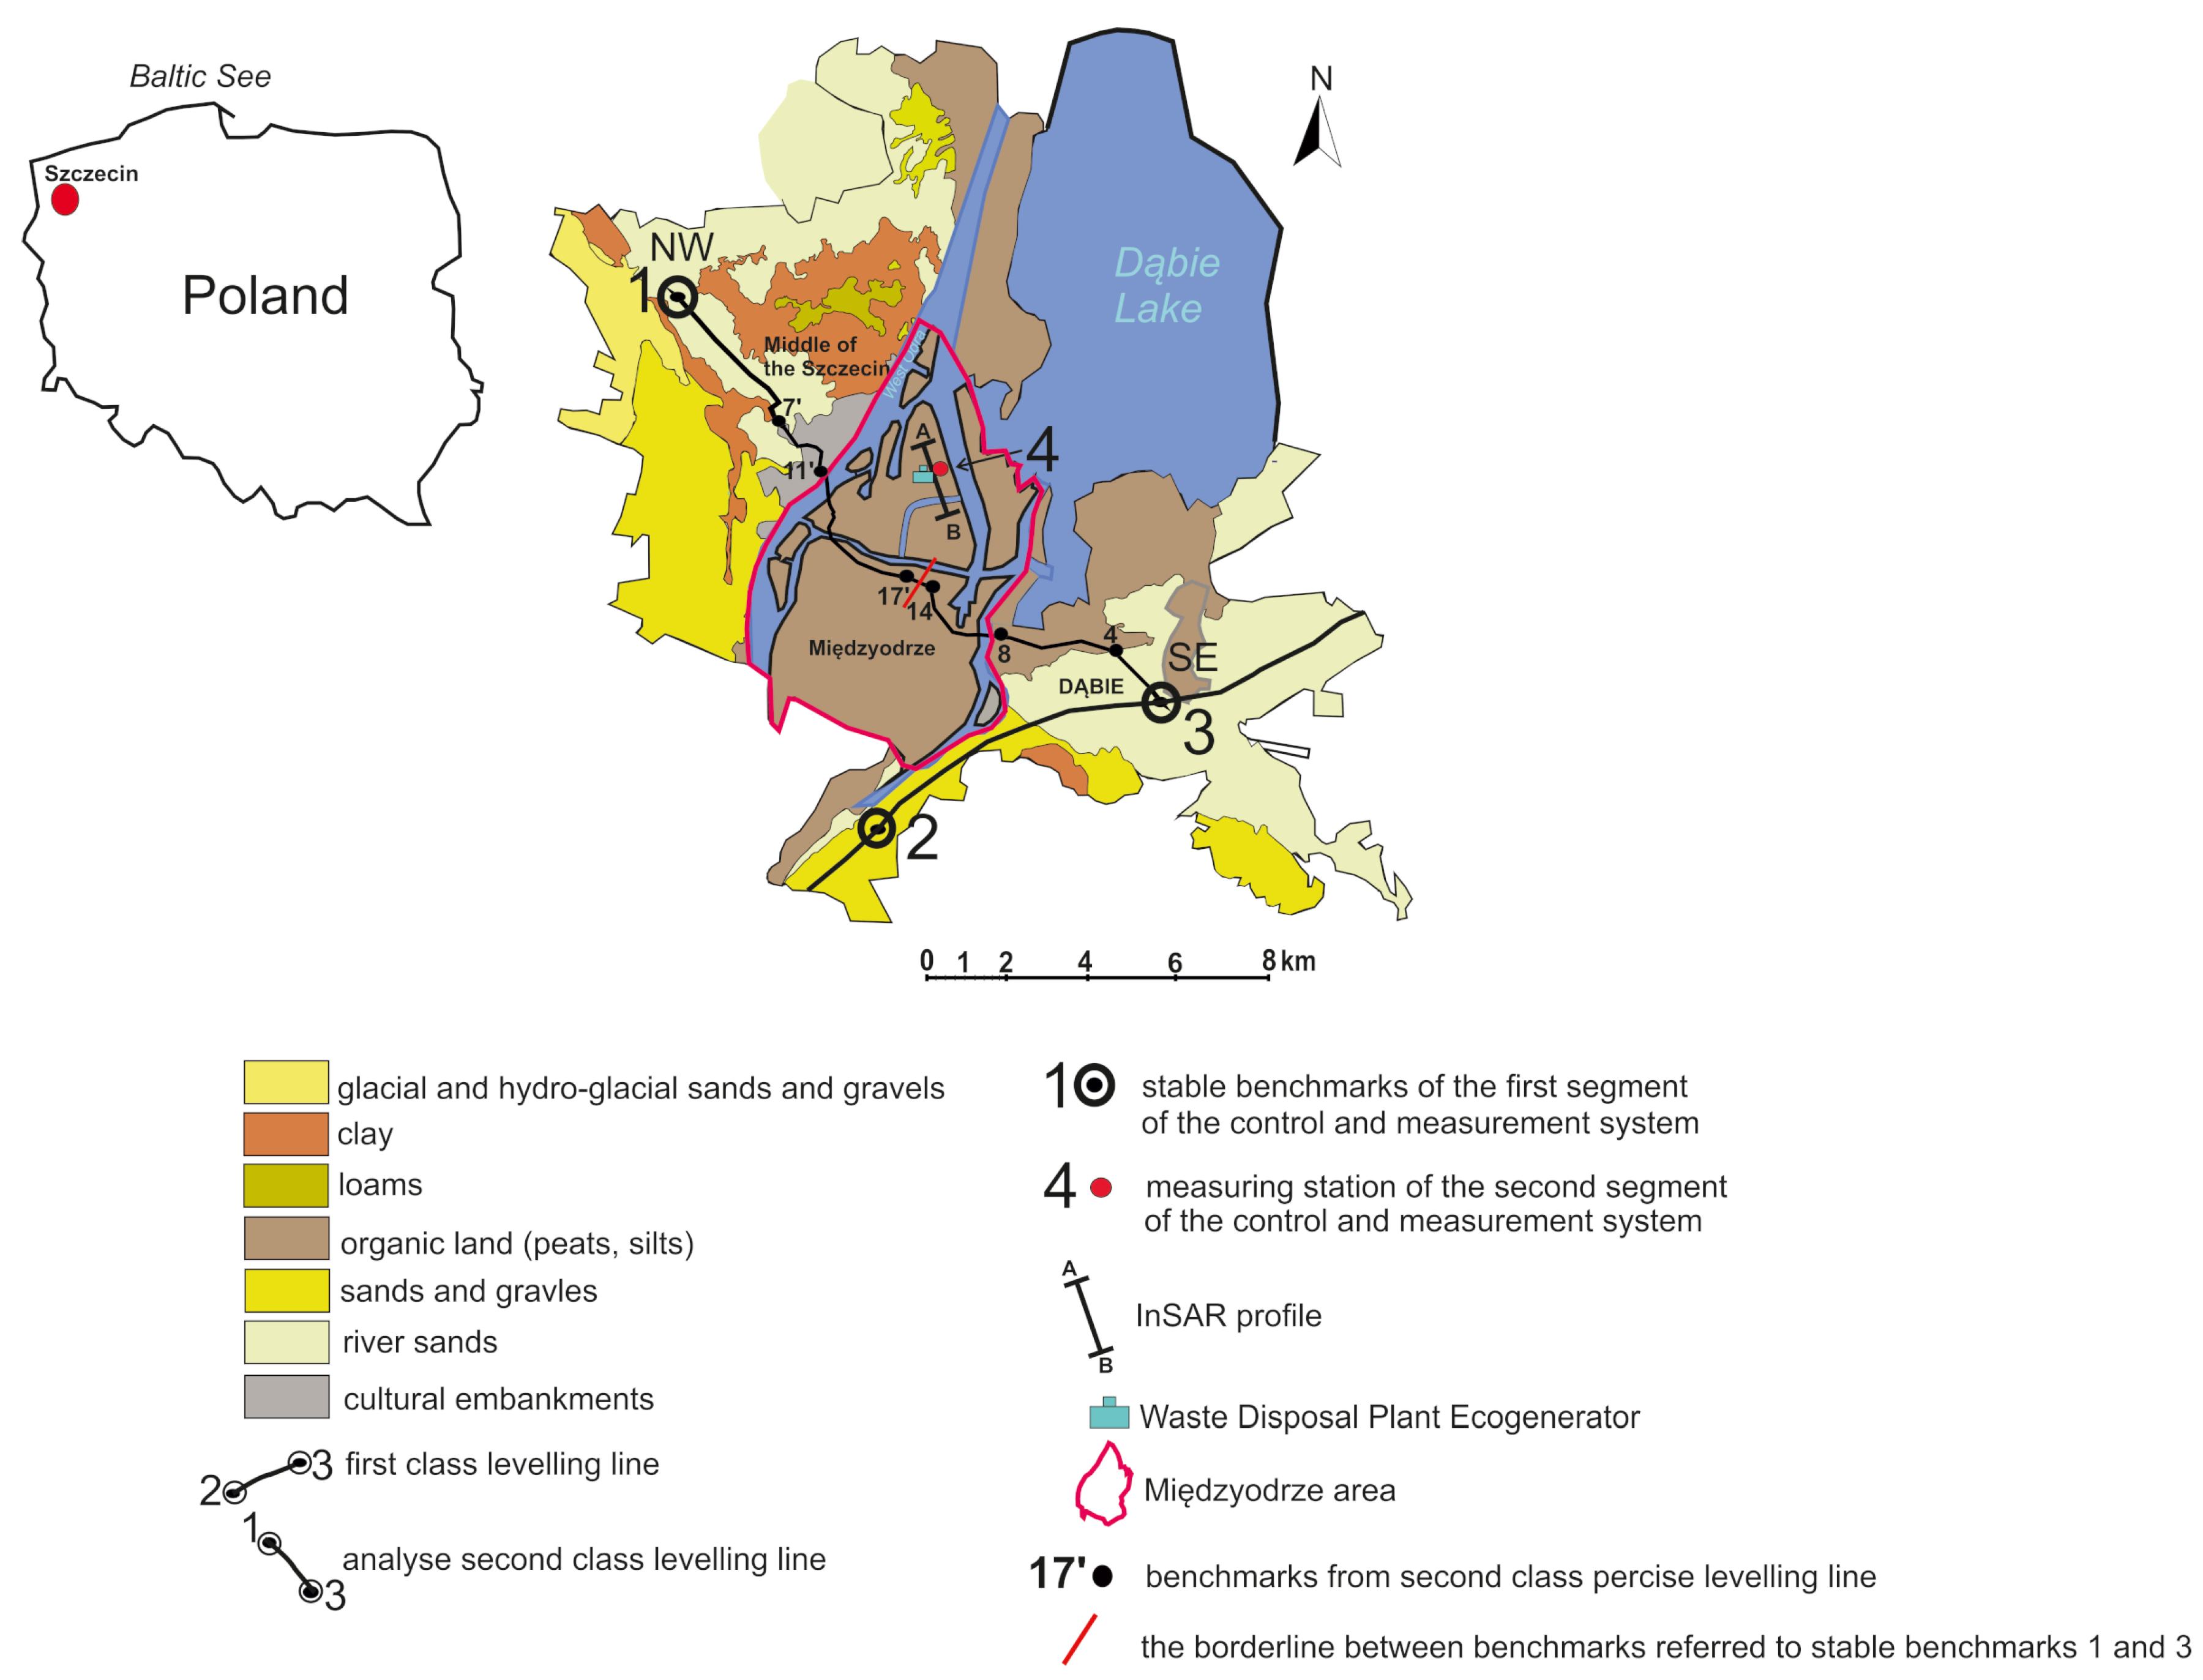
2. Characteristics of the Geological Structure of the Szczecin and the Engineering Structure
3. Methods
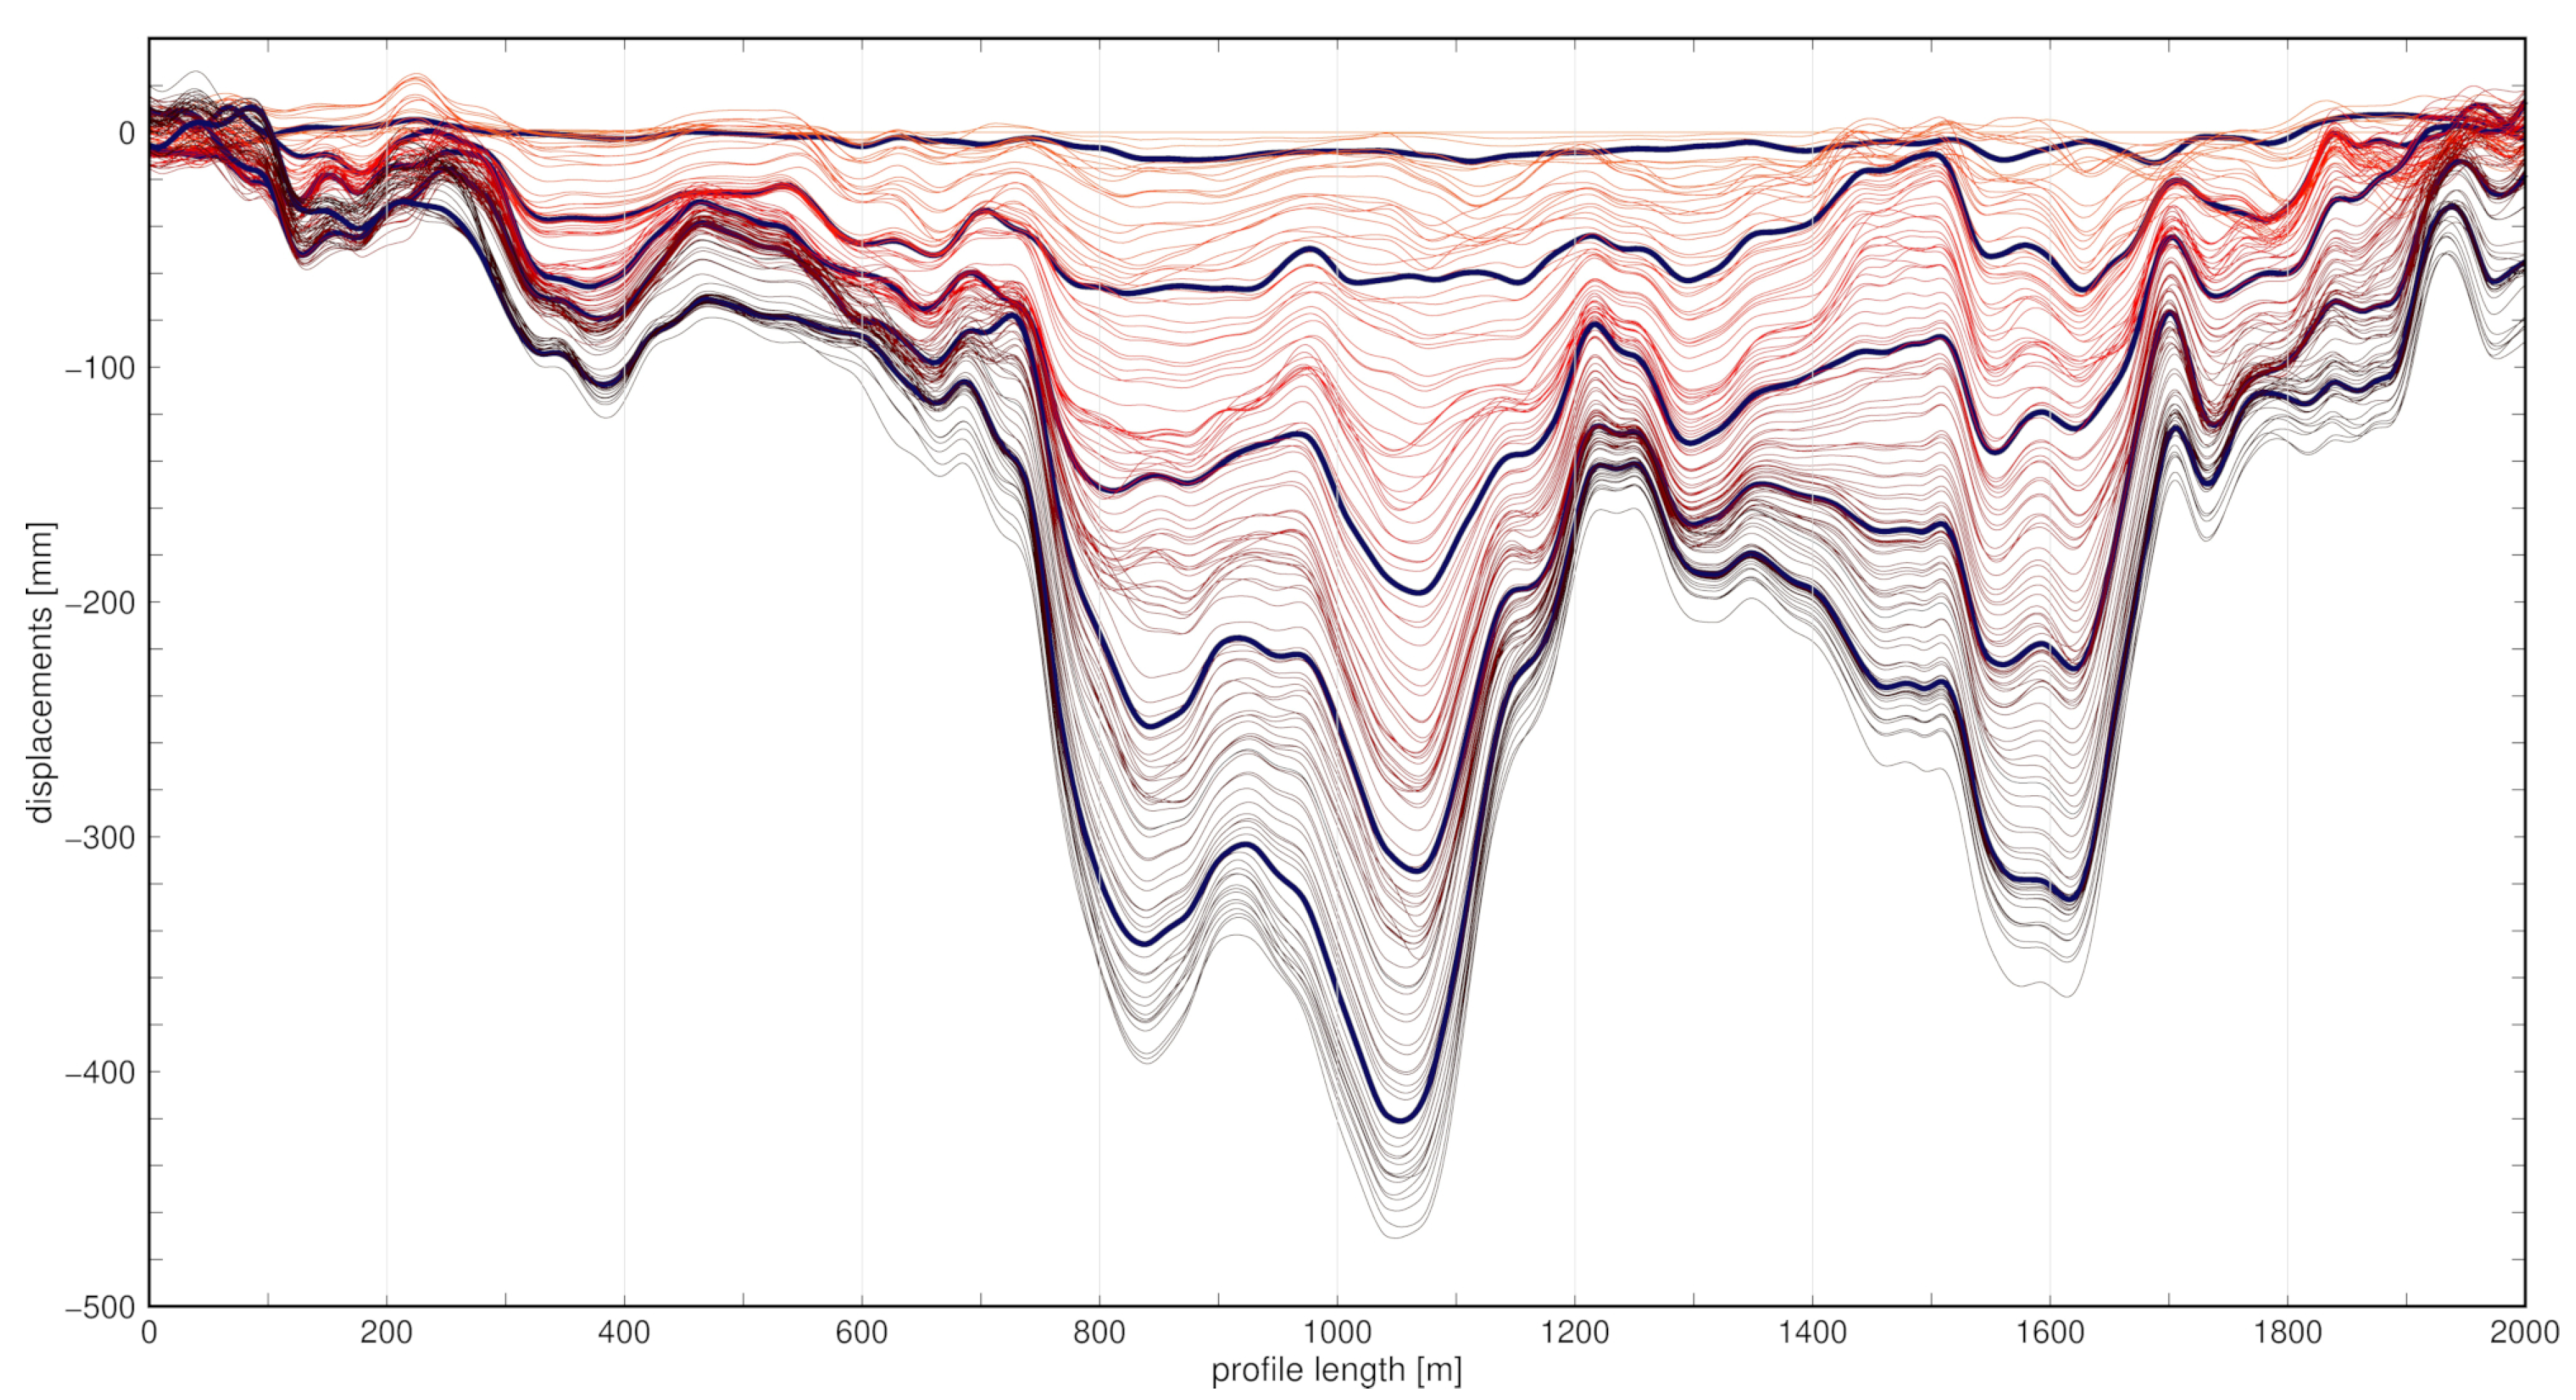
4. Results
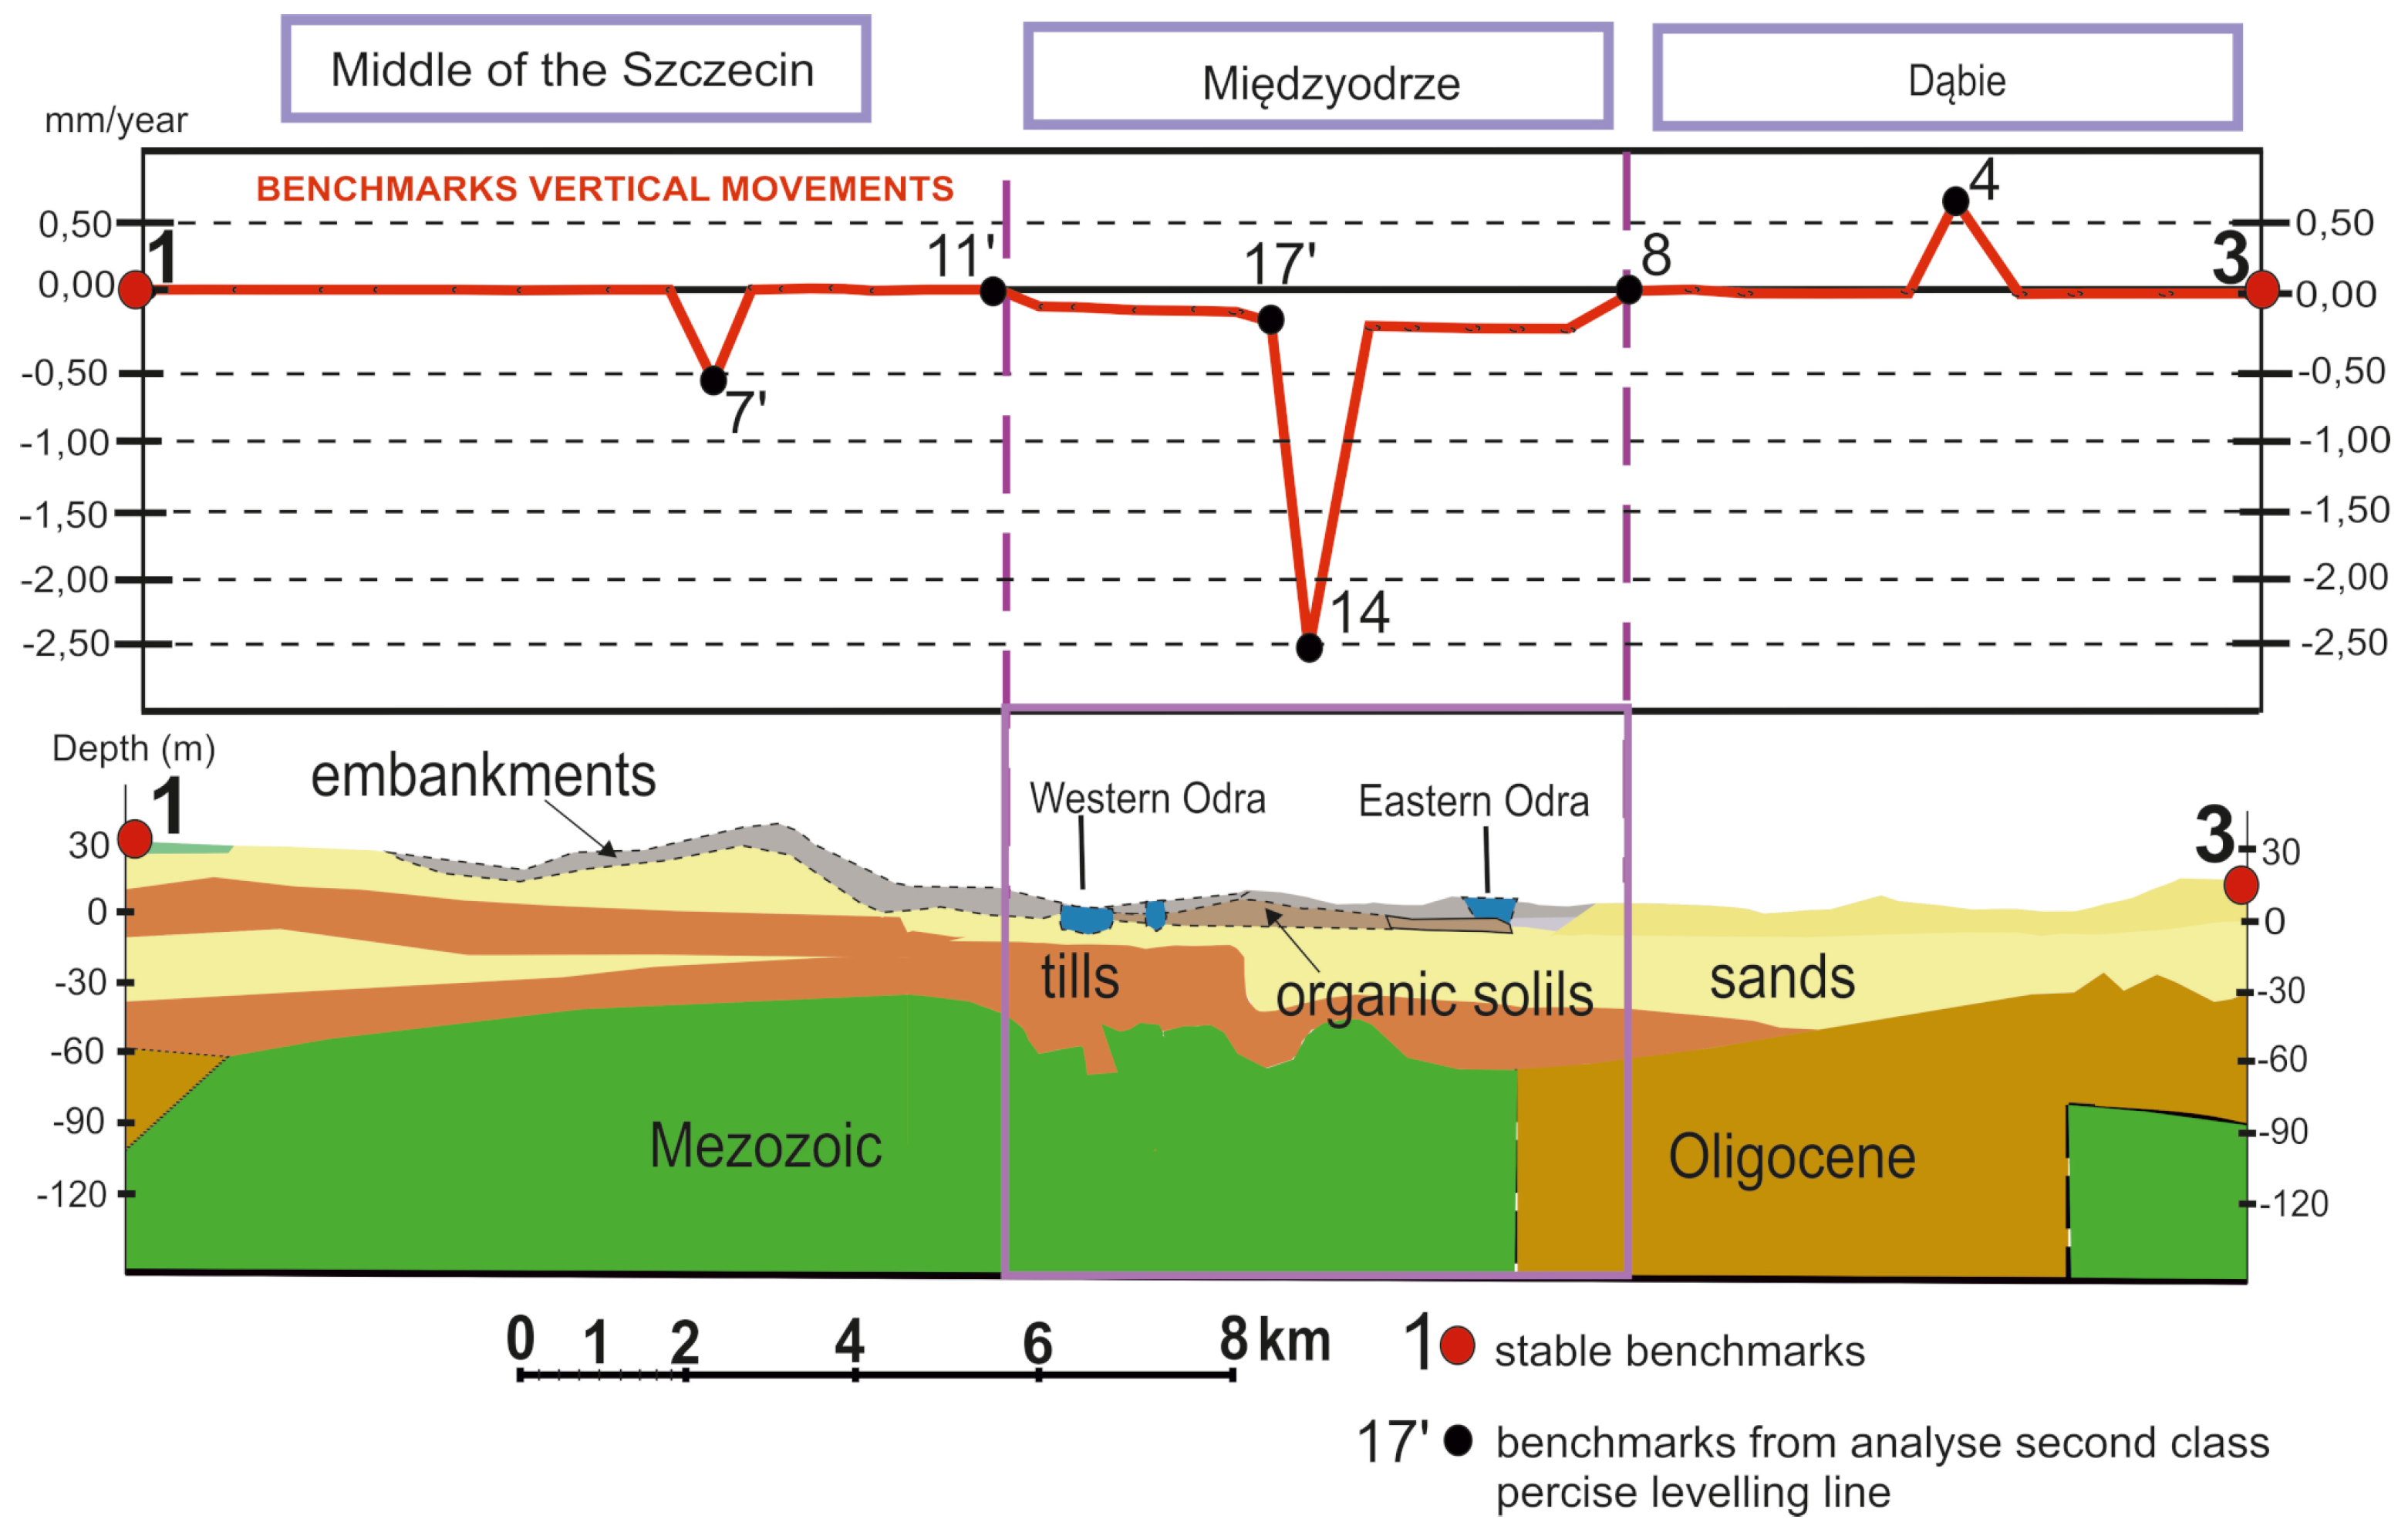
4.1. Analysis of Changes in the Height of the Benchmarks on the sEcond Class Levelling Line
- RMSE average variation in excess,where: —RMSE of the i-th overrun, —RMSE of the i-th difference in elevation,
- the speed at which the altitude changes,where: - speed of changes in altitude of benchmarks in the period between n and n + 1, —the difference in height of benchmarks between epochs, —year of the measurement epoch n, —year of the measurement epoch n + 1,
- RMSE speed change in altitude,where: —RMSE nivelation over a distance of 1 km, —RMSE speed change in altitude, —distance of the i-th episode from the reference benchmark of a given line, —year of the measurement epoch n, —year of the measurement epoch n + 1.
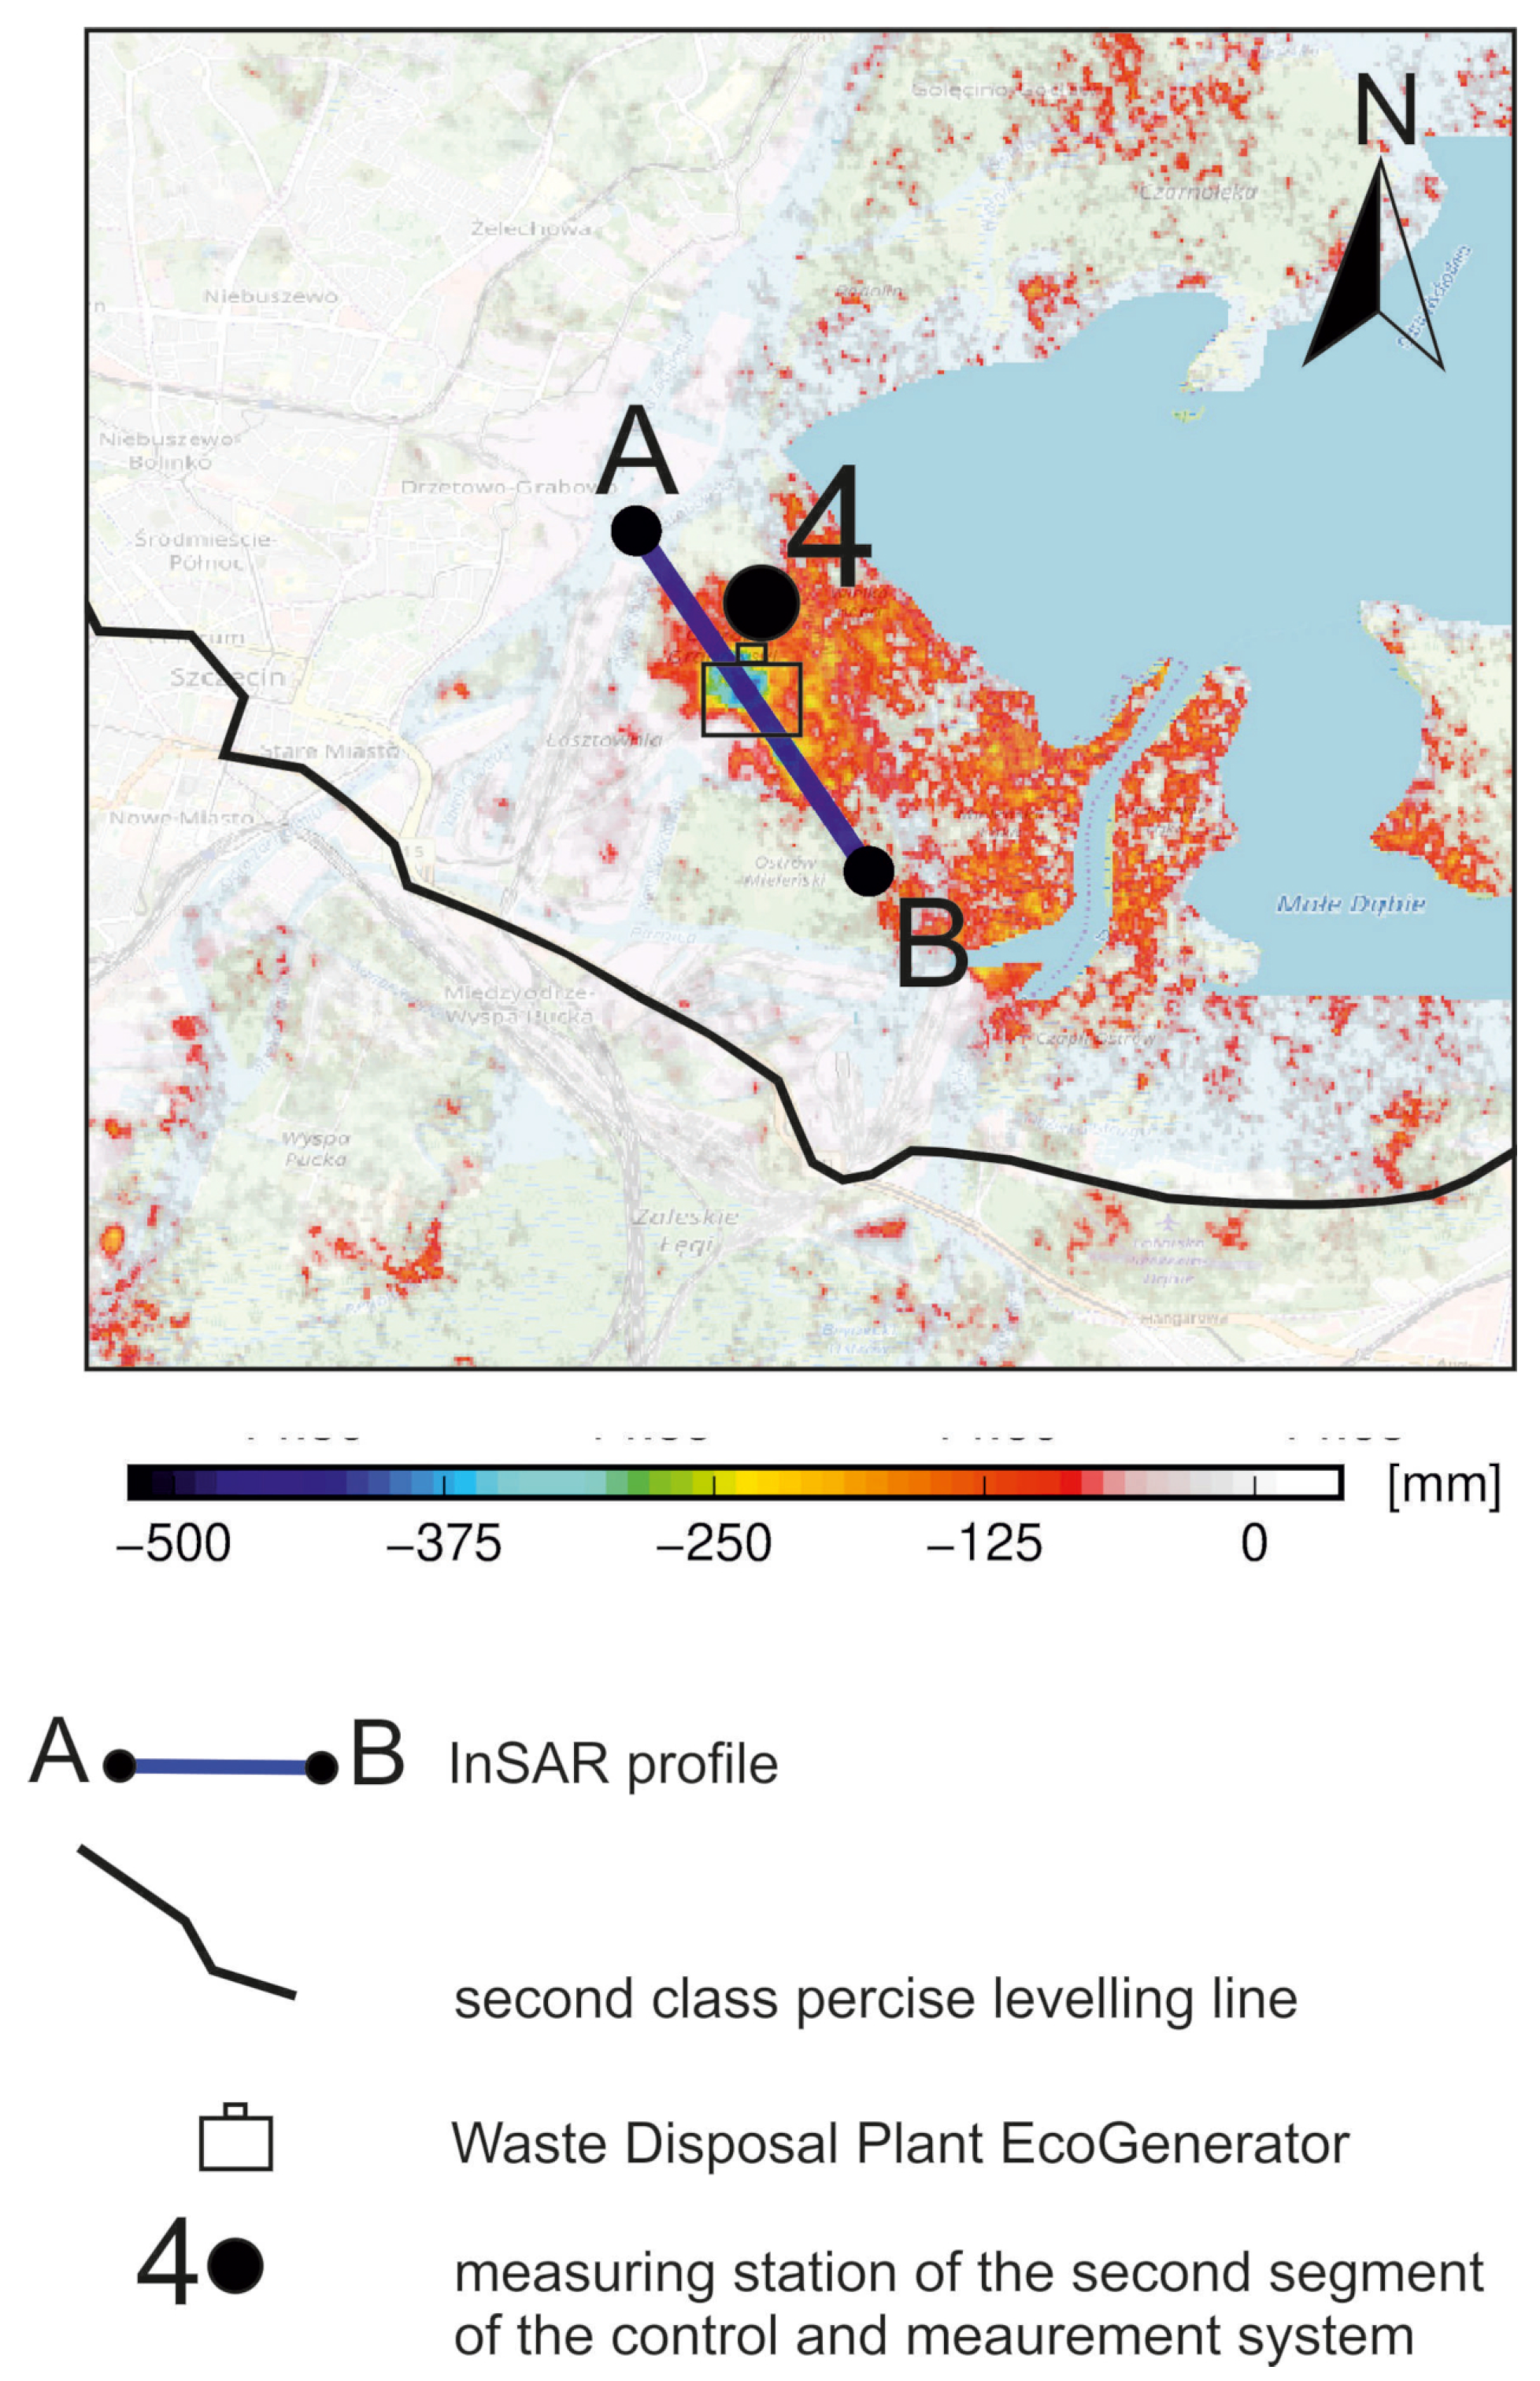
4.2. Analysis of Changes in Displacement Values Obtained Using InSAR
5. Discussion
6. Conclusions
Author Contributions
Funding
Conflicts of Interest
References
- Kozińska, B. (Ed.) Spatial Development of Szczecin from the Beginning of the 19th Century to the Second World War; Association of Art historians. Szczecin Branch; National Museum in Szczecin: Szczecin, Poland, 2002. (In Polish) [Google Scholar]
- Krygowski, B. About the relationship between the sculpture of today’s surface and the structure of the ground in Szczecin Pomerania. Sci. Notebooks Adam Mickiewicz Univ. Poznań 1959, 2, 69–86. (In Polish) [Google Scholar]
- Cacoń, S. The measurements and monitoring systems with GPS-the basis for reliable data on deformation of an engineering object. In Proceedings of the XXI International Congress FIG, Commission 6, Brighton, UK, 19–25 July 1998; pp. 530–540. [Google Scholar]
- Cacoń, S.; Bosy, J.B.K. The GPS levelling network in the conurbation of Wrocław. Artif. Satell. 1999, 2, 163–170. [Google Scholar]
- Cacoń, S.; Kontny, B.; Bosy, J. 3 D monitoring of the selected active tectonic structures in Poland, Italy and Greece. Acta Geodyn. Geomater. 2007, 4, 7–17. [Google Scholar]
- Dobracki, R. Explanations to the Detailed Geological Map of Poland in the Scale 1:50,000, Sheet Szczecin (228); Technical Report; Geological Surveyes: Warszawa, Poland, 1982. (In Polish)
- Żelaźniewicz, A.; Paweł, A.; Buła, Z.; Karnkowski, P.; Konon, A.; Andrzej, Ś.; Żaba, J.; Żytko, K. Tectonic Subdivision of Poland; Tectonic Regionalisation of Poland, Committee of Geological Sciences PAN: Wrocław, Poland, 2011; pp. 8–14. (In Polish) [Google Scholar]
- Piotrowski, A.; Rielsko-Rybak, J.; Sydor, P. “Szczecin on stilts” - geological and engineering conditions of the foundation of the city and port in the Oder Valley. In Proceedings of the LXXX Scientific Congress of the Polish Geological Society, Szczecin, Poland, 11–14 August 2010. (In Polish). [Google Scholar]
- Tarnawski, M. Geological-Engineering Studies of Weak-Bearing Soils in the Lower Oder Valley; Guide LV of the PTG Congress 16–18 August, 1983 Szczecin; Geological Surveyes: Warszawa, Poland, 1983; pp. 178–180. (In Polish)
- Wolak, B. Engineering-Geological Documentation of the Subsoil for the Disposal Plant EcoGenerator; Geotechnical Consulting Office: Szczecin, Poland, 2015. (In Polish) [Google Scholar]
- Milczarek, W. Application of a small baseline subset time series method with atmospheric correction in monitoring results of mining activity on ground surface and in detecting induced seismic events. Remote Sens. 2019, 11, 1008. [Google Scholar] [CrossRef] [Green Version]
- Rucker, M.L.; Panda, B.B.; Meyers, R.A.; Lommler, J.C. Using InSAR to detect subsidence at brine wells, sinkhole sites, and mines. Carbonates Evaporites 2013, 28, 141–147. [Google Scholar] [CrossRef]
- Ratkajec, M.; Kapovic, Z.; Mastelic-Ivic, S. Combination of GPS and Precise Levelling in Measurements of Vertical Bridge Deformations. Acta Geod. Geophys. Hung. 2000, 35, 219–226. [Google Scholar] [CrossRef]
- Wyrzykowski, T. Precision Levelling, 2nd ed.; Polish Cartographic Publishing Enterprise: Warszawa-Wrocław, Poland, 1993. (In Polish) [Google Scholar]
- Sandwell, D.; Mellors, R.; Tong, X.; Wei, M.; Wessel, P. Open radar interferometry software for mapping surface Deformation. Eos Trans. Am. Geophys. Union 2011, 92, 234. [Google Scholar] [CrossRef] [Green Version]
- Chen, C.W.; Zebker, H.A. Network approaches to two-dimensional phase unwrapping: Intractability and two new algorithms. J. Opt. Soc. Am. A 2000, 17, 401–414. [Google Scholar] [CrossRef] [PubMed]
- Farr, T.; Rosen, P.A.; Caro, E.; Crippen, R.; Duren, R.; Hensley, S.; Kobrick, M.; Paller, M.; Rodriguez, E.; Roth, L.; et al. The shuttle radar topography mission. Rev. Geophys. 2007, 45, 1–33. [Google Scholar] [CrossRef] [Green Version]
- Berardino, P.; Fornaro, G.; Lanari, R.; Sansosti, E. A new algorithm for surface deformation monitoring based on small baseline differential {SAR} interferograms. IEEE Trans. Geosci. Remote Sens. 2002, 40, 2375–2383. [Google Scholar] [CrossRef] [Green Version]


| Segment I | Segment II | Segment III | |
|---|---|---|---|
| Measuring method | Total station | Exstensometr, | |
| Measuring instrument | Precision levelling | Precision levelling | Feelergate, |
| Dilatometer | |||
| Frequency of Observation | 1–2 years | 3 months | 1–30 days or permanently |
| Accuracy of displacement | |||
| determination | ±(0.5) mm | ±(0.5–2) mm | ±(0.01–0.1) mm |
| Distance from | Height Changed | Height Changed | RMSE of the Speed | ||
|---|---|---|---|---|---|
| Benchmarks | Fixed Benchmark | 1975–2000 | Speed | of Change of | |
| R | 1975–2000 | Altitude ± mV | Area | ||
| 1975–2000 | |||||
| [km] | [mm] | [mm/year] | [mm/year] | ||
| 1 | 0.00 | 0.0 | 0.00 | 0.00 | |
| 1 | 1.00 | −0.2 | 0.00 | 0.03 | |
| 2 | 1.89 | 0.2 | 0.00 | 0.05 | |
| 3 | 2.54 | 1.02 | 0.05 | 0.07 | |
| 4 | 3.11 | 17.09 | 0.72 | 0.08 | DĄBIE |
| 5 | 3.51 | 0.2 | 0.00 | 0.10 | |
| 6 | 3.87 | −0.2 | 0.00 | 0.10 | |
| 7 | 4.41 | 0.0 | 0.00 | 0.10 | |
| 8 | 4.54 | 0.0 | 0.00 | 0.10 | |
| 9 | 6.55 | −3.9 | −0.16 | 0.12 | |
| 10 | 7.81 | −4.0 | −0.16 | 0.14 | |
| 11 | 8.41 | −4.1 | −0.16 | 0.14 | |
| 12 | 9.03 | −4.1 | −0.16 | 0.15 | |
| 13 | 10.41 | −4.3 | −0.17 | 0.16 | |
| 14 | 11.51 | −63.1 | −2.52 | 0.19 | MIEDZYODRZE |
| 17’ | 8.02 | −2.8 | −0.11 | 0.16 | |
| 16’ | 6.97 | −2.8 | −0.11 | 0.13 | |
| 15’ | 6.50 | −2.9 | −0.12 | 0.12 | |
| 14’ | 5.74 | −3.0 | −0.12 | 0.12 | |
| 13’ | 5.54 | −3.1 | −0.12 | 0.11 | |
| 12’ | 5.35 | −3.1 | −0.12 | 0.11 | |
| 11’ | 4.97 | 0.0 | 0.00 | 0.10 | |
| 10’ | 4.77 | 0.0 | 0.00 | 0.10 | |
| 9’ | 4.75 | −0.5 | −0.02 | 0.10 | |
| 8’ | 4.63 | 0.1 | 0.00 | 0.10 | |
| 7’ | 3.52 | −13.0 | −0.52 | 0.09 | MIDDLE OF |
| 6’ | 3.07 | 0.5 | 0.02 | 0.08 | THE SZCZECIN |
| 5’ | 2.84 | 0.5 | 0.02 | 0.08 | |
| 4’ | 2.21 | 0.3 | 0.01 | 0.06 | |
| 3’ | 1.77 | 0.0 | 0.00 | 0.06 | |
| 2’ | 1.24 | 0.0 | 0.00 | 0.04 | |
| 1’ | 0.38 | 0.0 | 0.00 | 0.03 | |
| 3 | 0.00 | 0.0 | 0.00 | 0.00 |
| Item | Attribute |
|---|---|
| satellite | Sentinel 1A/1B |
| path number | 73 |
| sensor mode | IW 1 |
| incidence angle | 33.54° |
| analysis time | from 15.11.2014 to 28.07.2019 |
| amount of data SAR | 129 |
| perpendicular baselines | 50 [m] |
| time baselines | 40 [days] |
| total number of interferograms | 329 |
© 2020 by the authors. Licensee MDPI, Basel, Switzerland. This article is an open access article distributed under the terms and conditions of the Creative Commons Attribution (CC BY) license (http://creativecommons.org/licenses/by/4.0/).
Share and Cite
Zygmunt, M.; Cacoń, S.; Milczarek, W.; Sanecki, J.; Piotrowski, A.; Stępień, G. The Three-Segment Control and Measurement of Reliable Monitoring of the Deformation of the Rock Mass Surface and Engineering Structures on the Międzyodrze Islands in Szczecin, NW Poland. Geosciences 2020, 10, 179. https://0-doi-org.brum.beds.ac.uk/10.3390/geosciences10050179
Zygmunt M, Cacoń S, Milczarek W, Sanecki J, Piotrowski A, Stępień G. The Three-Segment Control and Measurement of Reliable Monitoring of the Deformation of the Rock Mass Surface and Engineering Structures on the Międzyodrze Islands in Szczecin, NW Poland. Geosciences. 2020; 10(5):179. https://0-doi-org.brum.beds.ac.uk/10.3390/geosciences10050179
Chicago/Turabian StyleZygmunt, Marek, Stefan Cacoń, Wojciech Milczarek, Józef Sanecki, Andrzej Piotrowski, and Grzegorz Stępień. 2020. "The Three-Segment Control and Measurement of Reliable Monitoring of the Deformation of the Rock Mass Surface and Engineering Structures on the Międzyodrze Islands in Szczecin, NW Poland" Geosciences 10, no. 5: 179. https://0-doi-org.brum.beds.ac.uk/10.3390/geosciences10050179