1. Introduction
Human-induced landslides usually occur on cut slopes due to excavation works, leading to many fatalities and significant damages in economic and social terms. In fact, slope excavations are one of the most hazardous operations in geotechnical works. Such occurrences are very frequent in urban areas, where construction and excavation work, typical of the urbanisation process, are known to increase the incidence of slope failure, acting on the hydrological processes and stress distribution. In addition to the safety of workers within the construction sites, in the urban context the risk is amplified by the damaging effects that can be generated to the urban settlements in the surrounding areas (e.g., strategic infrastructures, communication roads, utilities, etc.).
Since the worldwide population is expected to increase over the coming years, reaching 8.5 billion in 2030, with the half of the population concentrated in urban areas, nowadays the effect of excavation works on the stability of cut slope is a topical issue.
Many studies have shown that the failure on cut slopes is related both to stress release induced by excavation, to site conditions (e.g., seepage), and to the mechanical behavior of the material (e.g., [
1]). In some cases the slope failure can be triggered by the collapse of some structural elements (e.g., retaining wall built to allow the urbanization [
2]), in other cases, the landslide can passively involve the structural elements along the slope (e.g., [
3,
4]). In the urban context the interaction between slope dynamic and engineering works should be very complex, so much that in a back analysis of an already occurred collapse it should be very hard to distinguish between an “engineering mistake” in the collapsed structure or “geological mistakes” in the recognition of the natural slope dynamics.
In this framework, monitoring systems can play an important role in the understanding and management of this kind of hazardous mixed settings [
5]. In fact, monitoring systems can be deployed on the basis of different purposes such as knowledge, control and emergency monitoring and for several application such as: standard maintenance, screening in occasion of critical events (e.g., earthquakes, landslides, etc.), advanced maintenance of critical elements, construction works [
6]. In such contexts, where mass wasting processes interact with urban settlements, innovative remote sensing technologies are improving the way data is acquired and interpreted, simplifying field work and enhancing the reliability of analysis [
7].
2. Study Area
2.1. General Framework
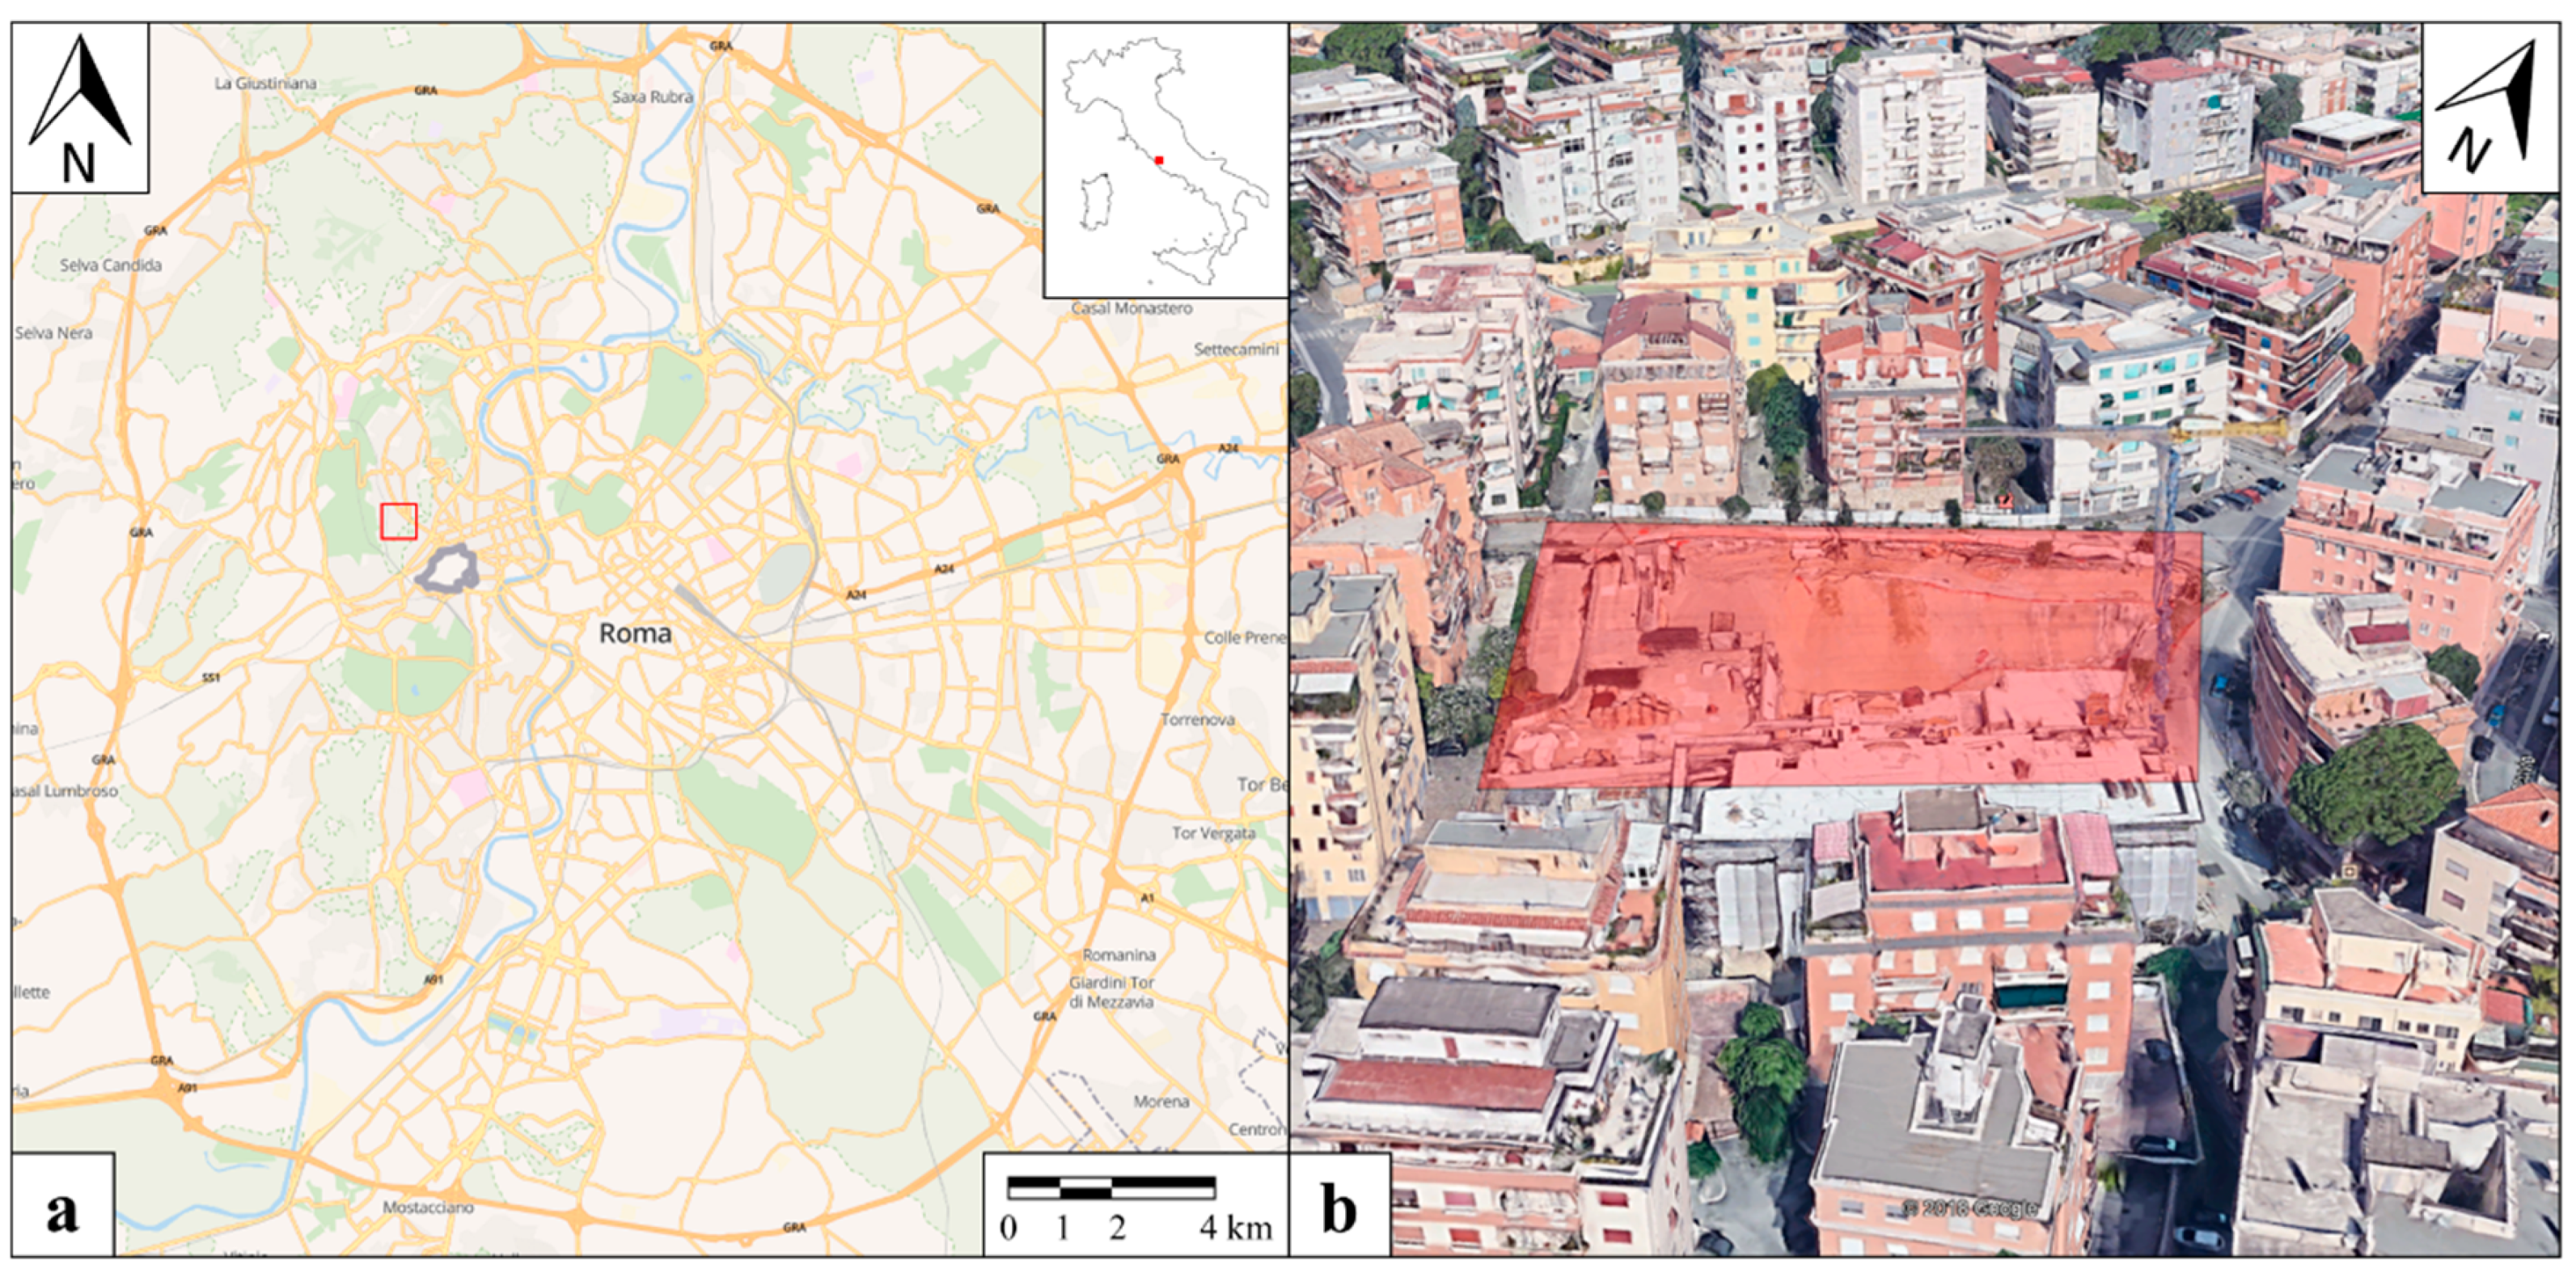
The area is located in the North-Western sector of the Municipality of Rome (Central Italy). The site of interest is within the Balduina district, in the vicinity of the Vatican City. This district is located on a hill facing on the right the Tiber river alluvial plain, which is highly urbanized too (
Figure 1). The neighborhood was built around 1910 with some elegant villas while the large and intensive expansion started in the 1940s, just after World War II, reaching a population of more than 40,000. In detail, the event involved an artificial cut slope where a piling wall was built within a construction site in a highly populated area (Lat.: 41.911296°; Long.: 12.440274°).
2.2. Geological and Geomorphological Setting
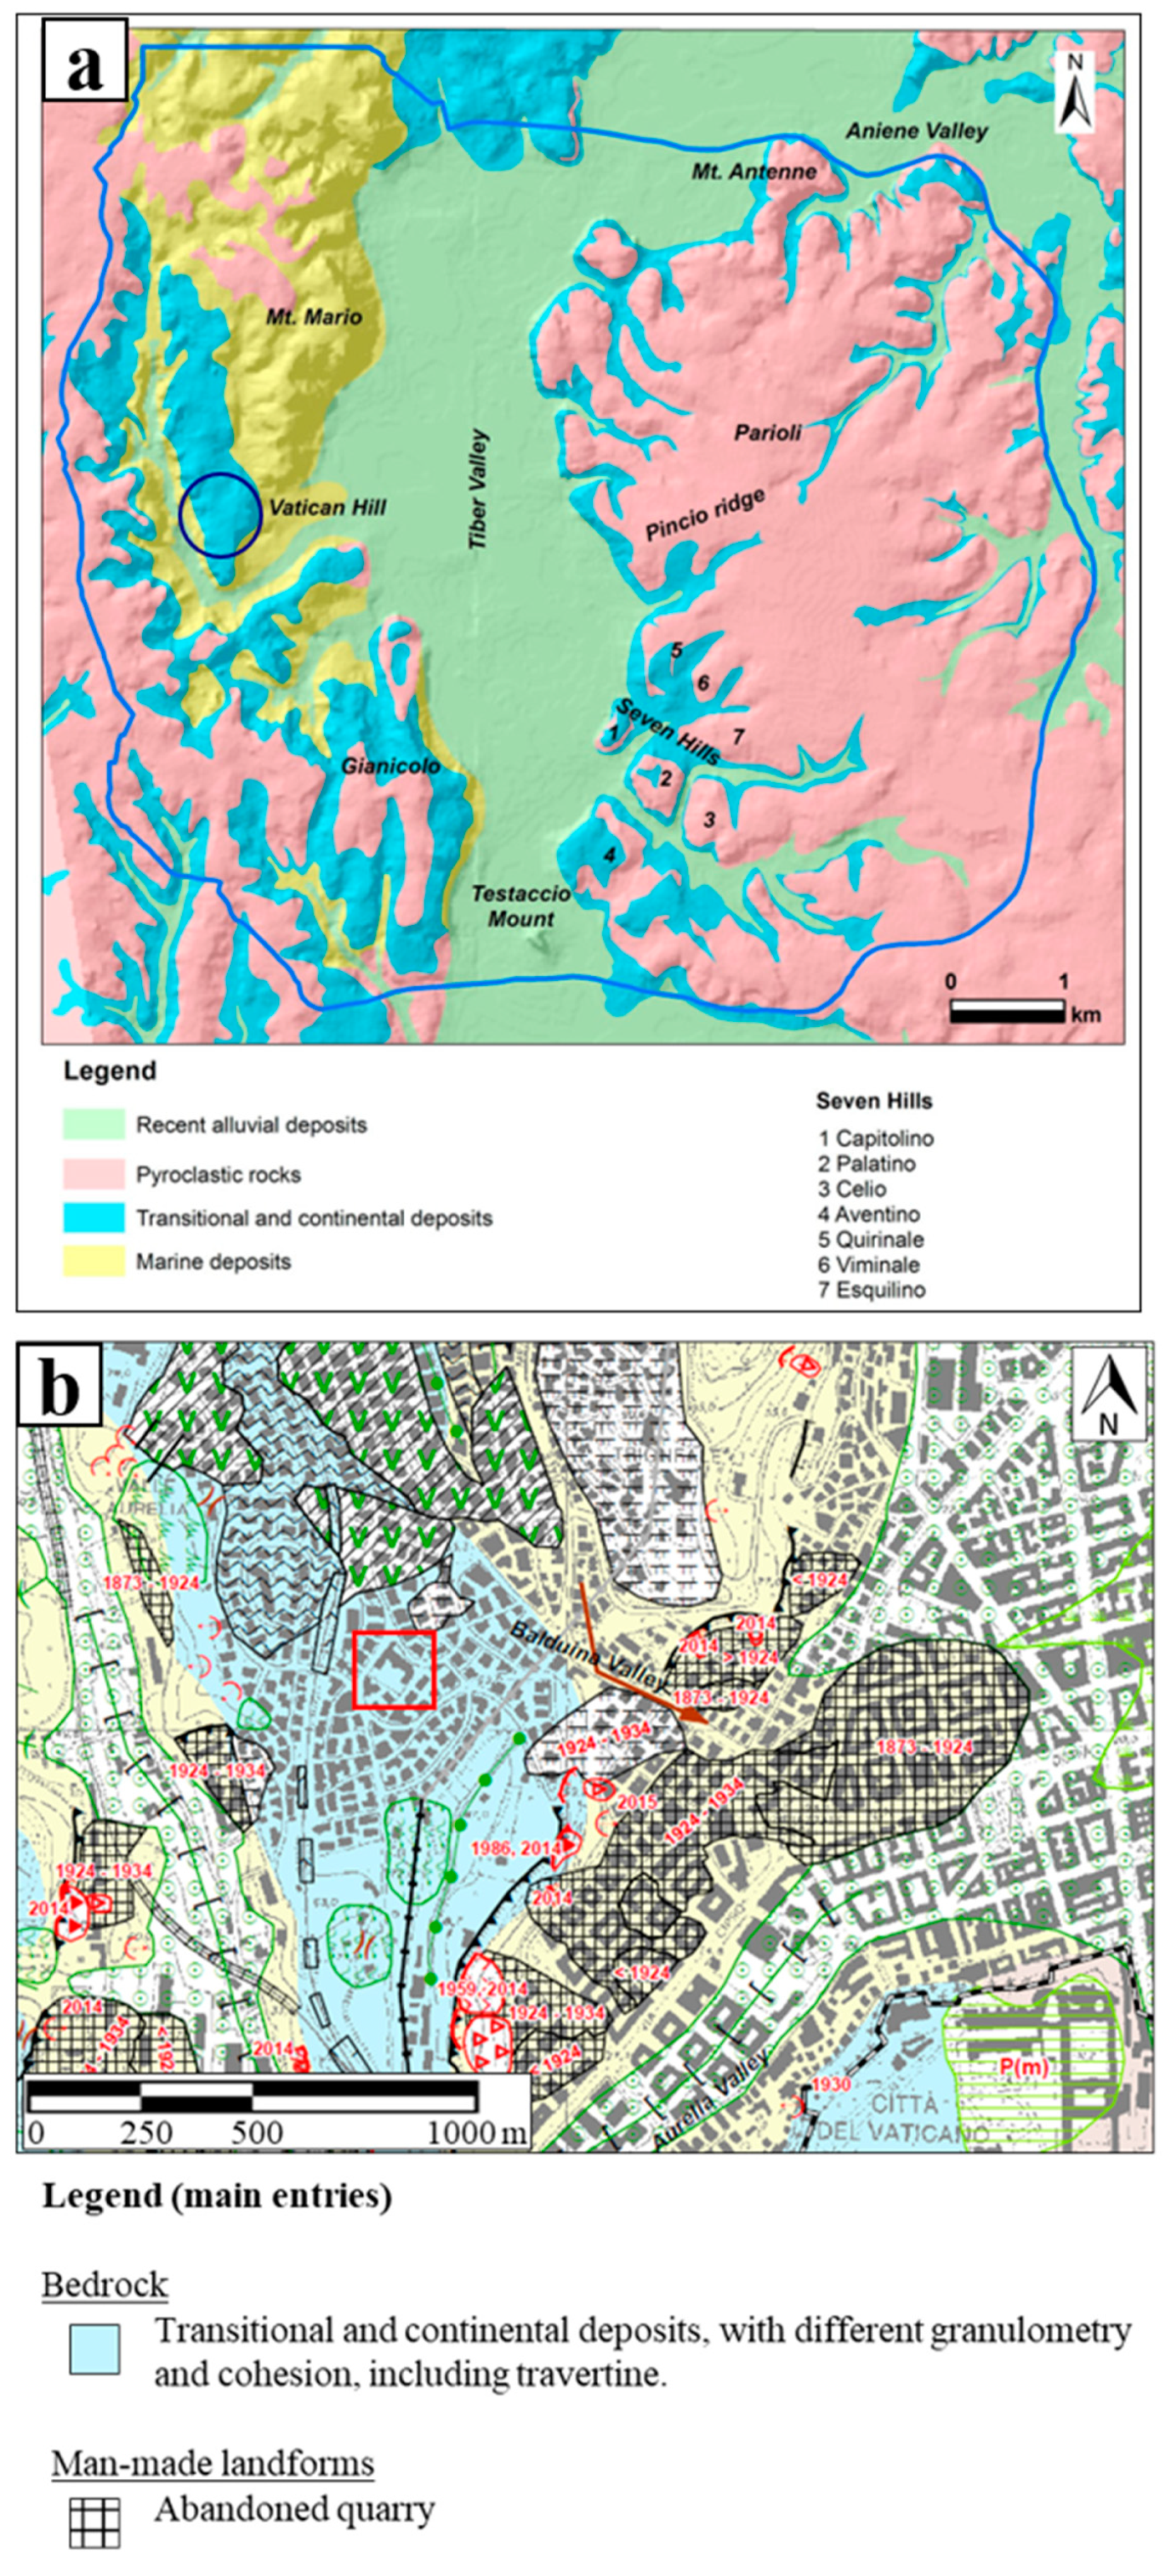
The study area is a clear example of urban geology and the consequences of the interaction between man and nature. Man has led to an almost complete eradication of the morphology existing before the intensive urbanization [
8]. Since the beginning of the last century, at the foot of the Balduina hill quarrying activity for clay-like materials were performed, initiated during the Roman age (from 1st century AD) [
9].
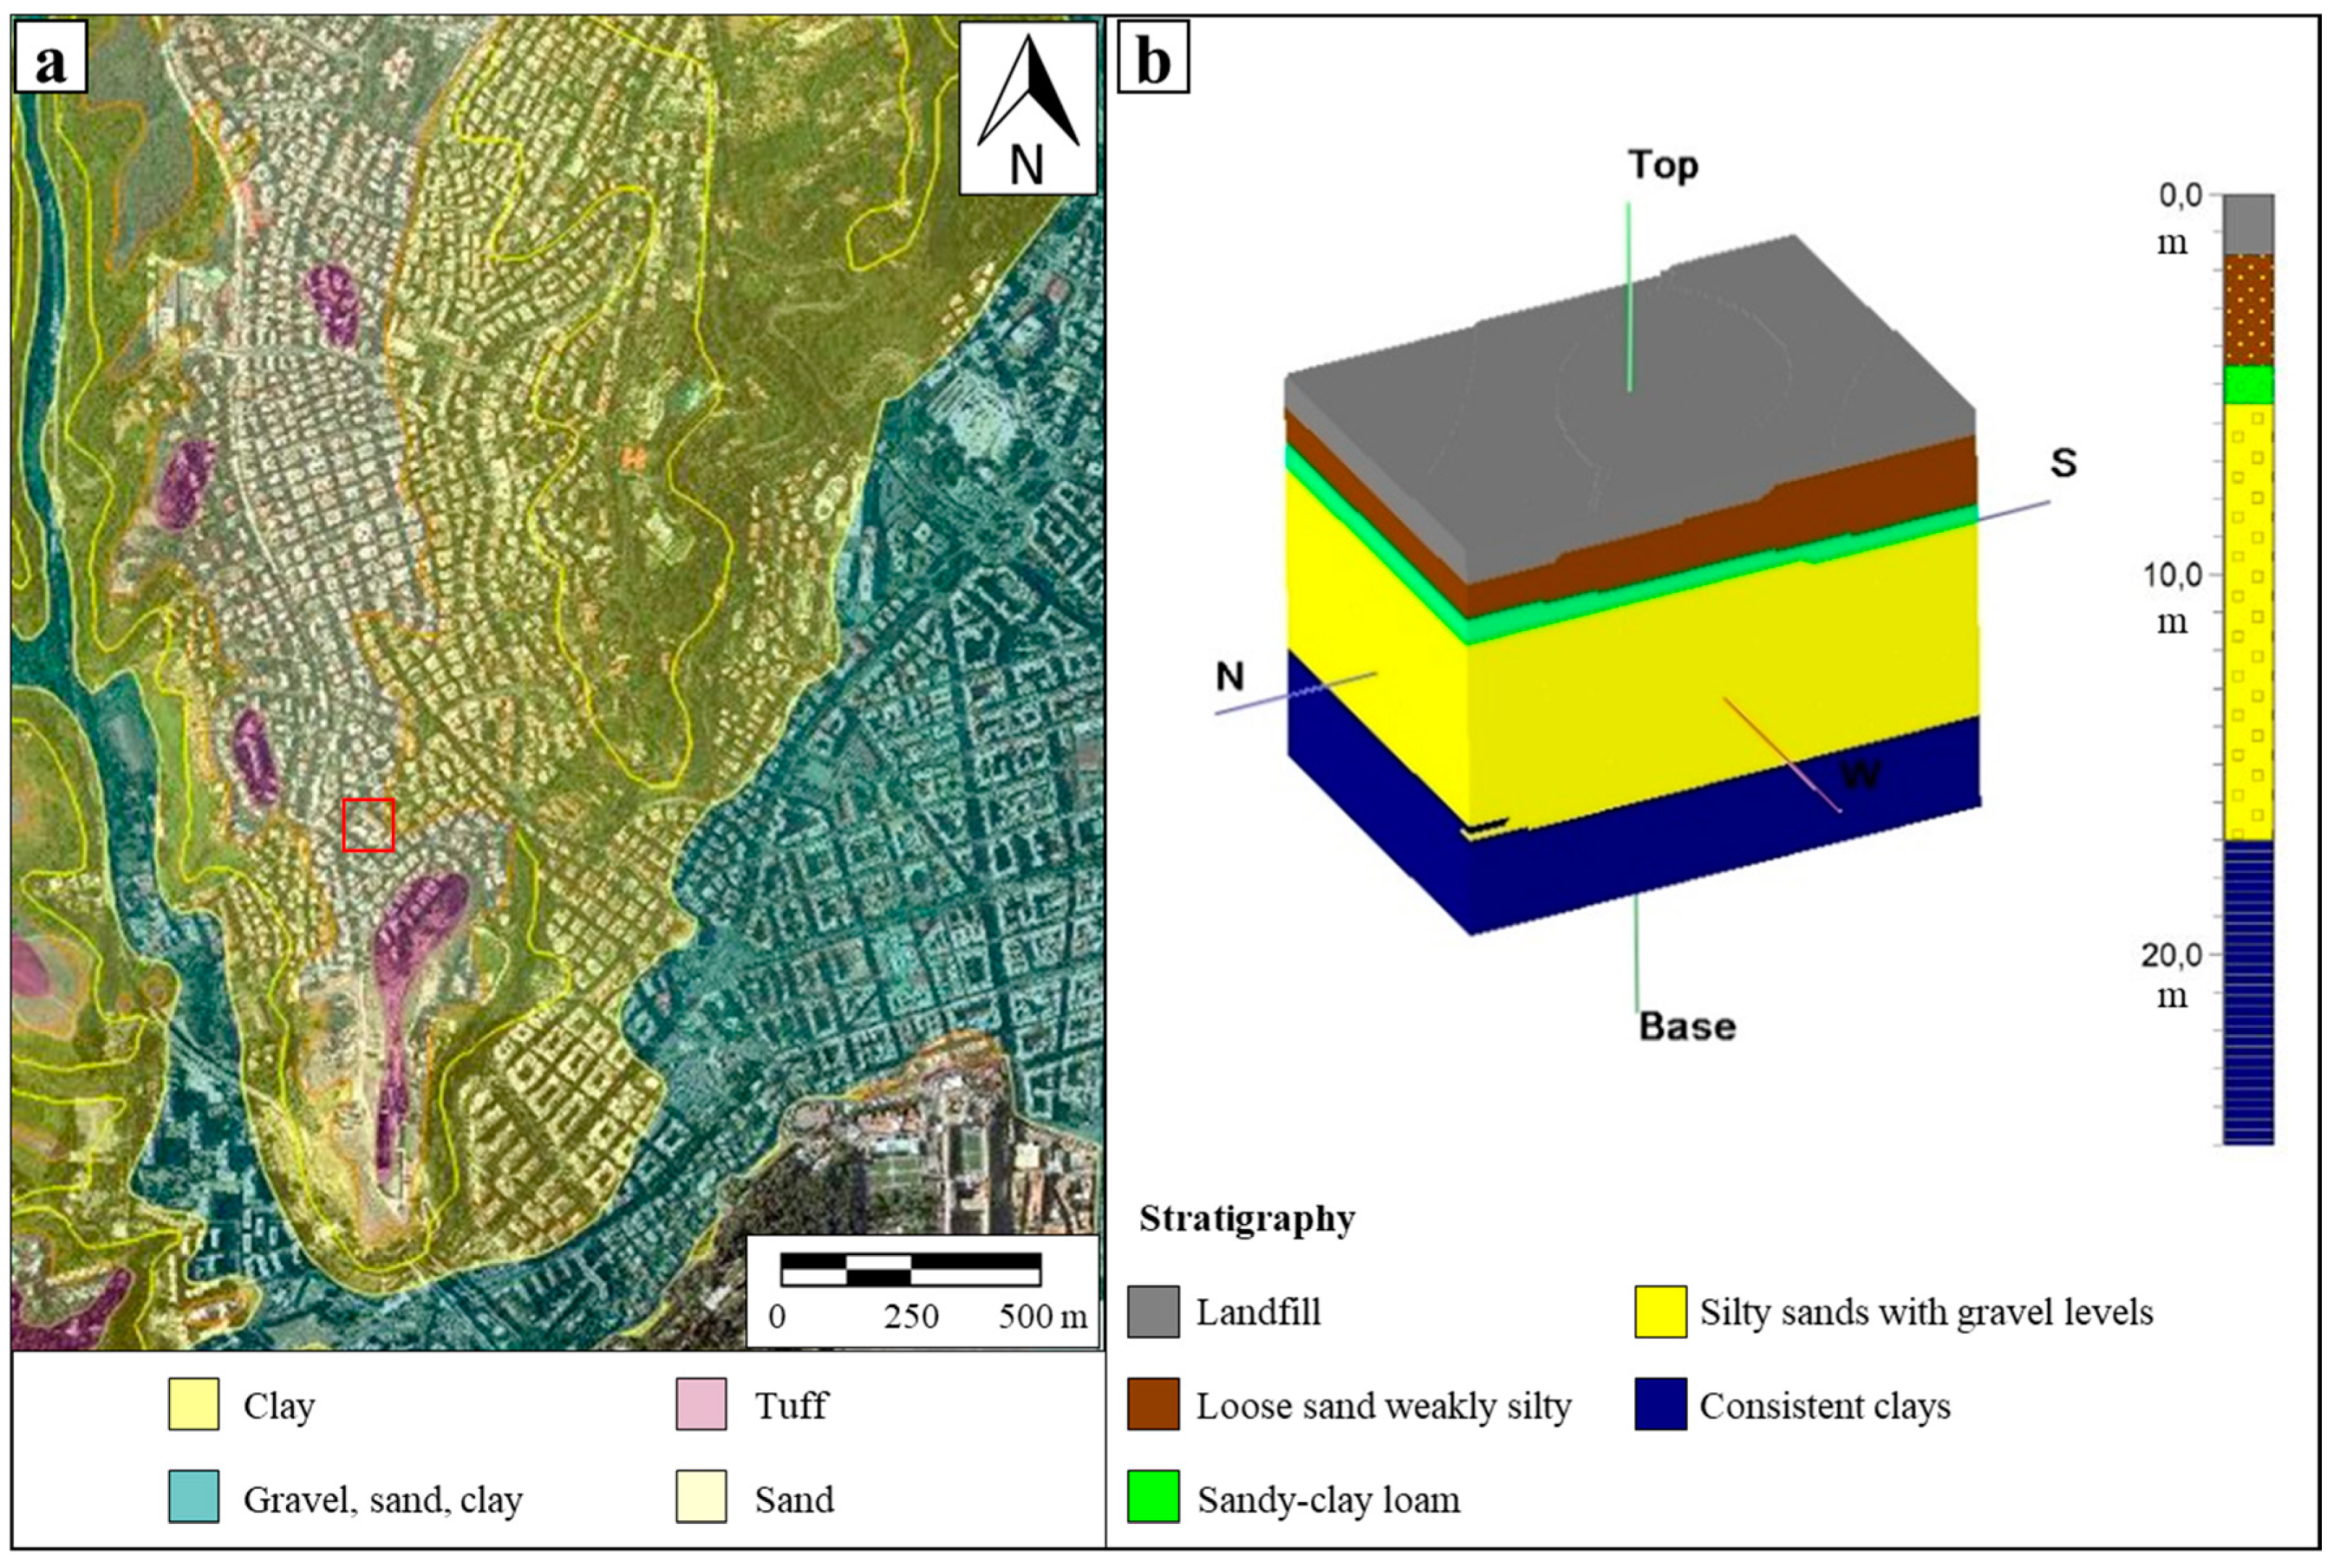
The stratigraphy succession of Balduina is the result of the geological evolution of this Roman neighborhood (
Figure 2). The oldest outcropping sediments are represented by the “Monte Vaticano Unit”, which is characterized by marine grey–blue clays (Middle–Upper Pliocene) with decimeter-scale intercalations of sands [
10]. This formation reaches about 800 m in thickness and constitutes the bedrock of the Roman area. It is locally overlaid by the Monte Mario Unit (Lower Pleistocene) outcropping along the ridge on the right flank of the present Tiber valley. This unit is characterized by a lower, predominantly clay/silt-like portion which passes upwards through grey sands, yellow marine sands and finally a lagoon clay deposit (
Figure 3). On the top of this marine and transitional unit, a succession of continental deposits outcrops dating since back 900 thousand years ago [
11] and related either to the paleo-Tiber river and its tributaries during several depositional cycles and to volcanic activity in the surrounding areas. Locally, the Monte Ciocci Formation is present, characterized by a succession of gravels, sands and clays and correlated to the oldest paleo-Tiber river cycle [
12]. This geological setting is linked to important tectonic movements which occurred during the Lower-Pleistocene, along NW–SE, NE–SW and N–S trending faults systems which isolated the Monte Mario-Vaticano-Gianicolo Ridge and lowered the historical center area [
13,
14].
In the sketch of
Figure 3b is represented the local geological setting as reconstructed for this study by means of some boreholes performed in this area. The model is generated by dividing the geological units according to the hydrogeological characteristics. In this regard, the Monte Ciocci Unit and the Monte Mario Unit have been merged within the yellow level (silty sand with gravel levels). From a geotechnical point of view, on-site investigations have shown that the sandy and gravelly deposits are very thick and locally cemented.
The hydrogeological investigations, made possible thanks to the installation of piezometers, identify the presence of a groundwater level which stands at a depth of about 11.7 m below the ground level and therefore inside the unit characterized by medium–fine yellow–ocher sands interspersed with gravelly centimetric limestone and selciferous levels. This is also confirmed by the field observations: the Pleistocene sand–gravel-like units were characterized by evident traces of oxidation, evidence of water circulation. In addition, the bottom of the excavation was frequently flooded. The aquifer is locally sustained by the very low hydraulic conductivity of the consistent clay. As a matter of fact, the base of the piles constituting the collapsed piling wall reach the consistent clay.
2.3. The Occurrence of Piling Wall Collapsing
In the framework of construction works for the erection of three residential buildings in a densely urbanized area, a large excavation was performed within the study area in order to create building foundations and garages. The excavation reached the depth of 11 m, supported in the North–Western side by a piling wall 47 m long.
On February 14th, 2018 (around 17:30), a portion of the piling wall on the North–Western side partially collapsed between the Via Livio Andronico and Via Lattanzio streets. Soil behind the collapsed piling wall slipped inside the excavation site dragging seven cars parked on one side of the road running parallel to the piling wall and lipping some residential building located on the opposite side of the road. In the following hours, the Firefighters Department of Rome bordered the unstable area for safety reasons. Although nobody was injured in the collapse, 22 families living in the two buildings next to the construction site have been evacuated as a precautionary measure.
In addition, the Civil Protection of Rome, thanks to the technical support of the Research Centre on Geological Risks (CERI) of the Sapienza University of Rome, started the continuous monitoring of affected area through remote sensing techniques. In order to assure the safety of technicians involved in the monitoring campaign, avoiding any physical contact with the restricted area, fully remote sensing instruments were installed without targets on the ground. In the first few hours after the collapse, a terrestrial laser scanner (TLS) and a Terrestrial Synthetic Aperture Radar Interferometer (TInSAR) were installed with the aim to control the evolution of the situation in order to support the local authority in managing the residual risk and to ensure the safety of workers during emergency operations (cfr. [
6]).
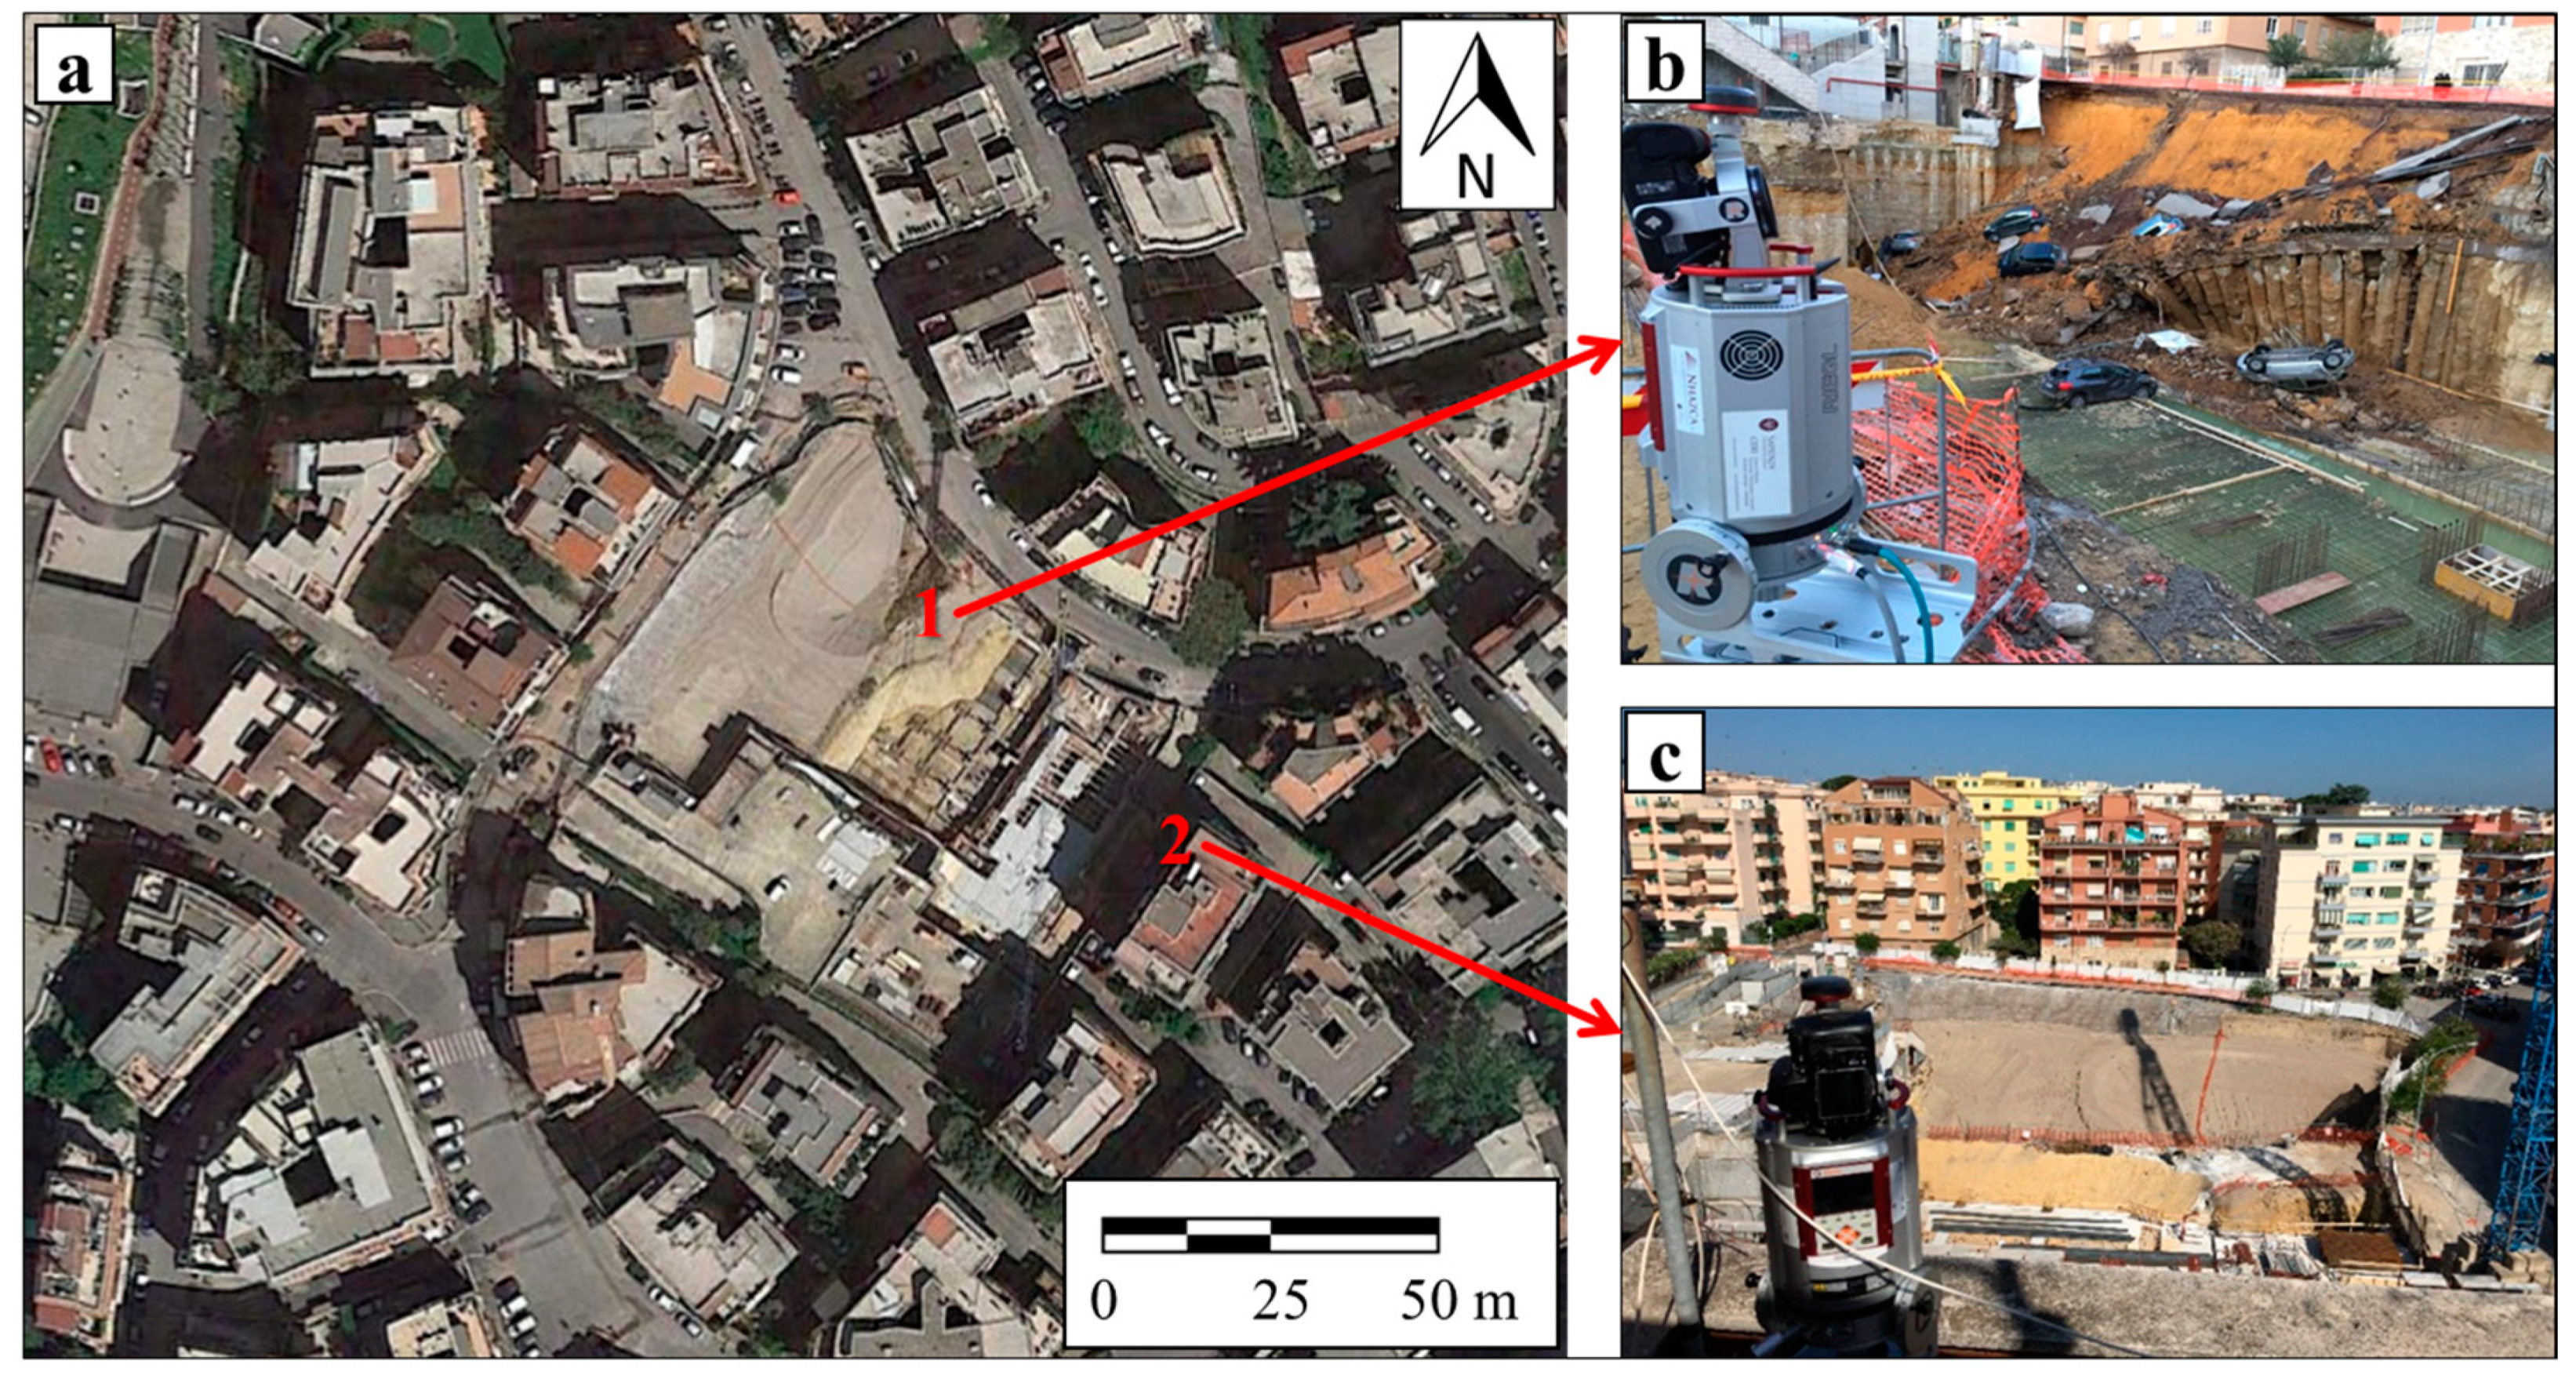
Eighteen high-resolution multi-temporal scans using a terrestrial laser scanner (TLS) were collected, mainly in the first few days after the collapse. Scans were acquired from two fixed points located within the working area and on the rooftop of a building located near the construction site (
Figure 4). In addition to TLS scans, continuous TInSAR monitoring, with high temporal sampling rate (about 5 min) and data transfer in real-time, was carried out for about three and a half months, until May 26th, collecting more than 25,000 SAR images.
Following the collapse, between 18th and 20th February, with the aim to safeguard the area, a provisional safety intervention through a new embankment with filling material (pozzolan) was realized in correspondence of the failed piling wall.
A few days after the collapse, a judicial inquiry was also started in order to establish the possible causes of the collapse and the entire construction site was seized.
3. Monitoring Instruments and Techniques Used
3.1. Terrestrial Laser Scanning (TLS)
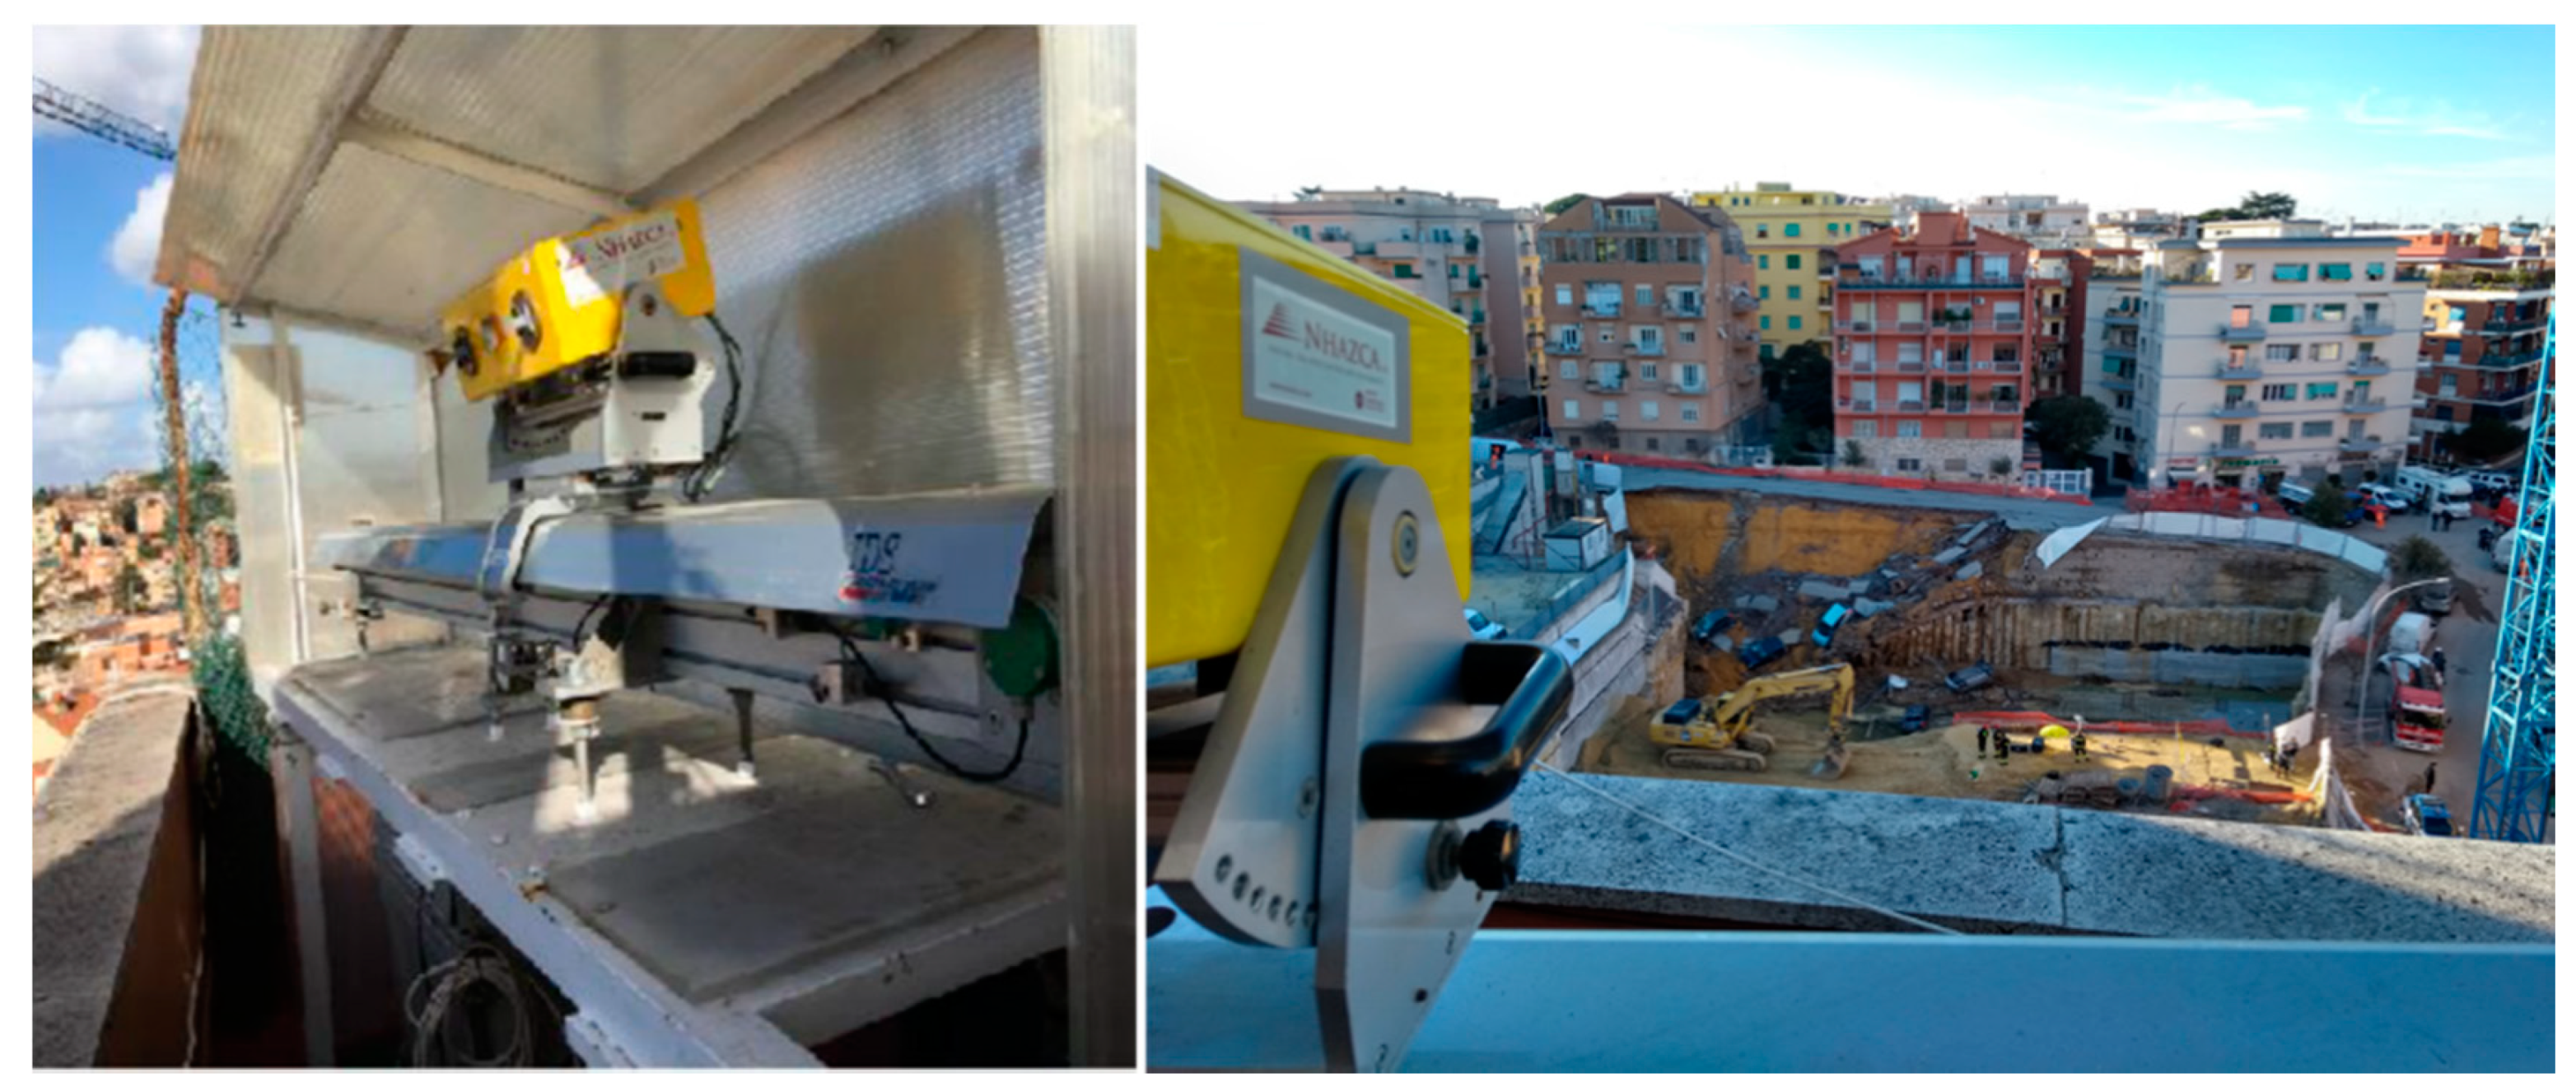
Terrestrial Laser Scanner (TLS) surveys were performed using the device Riegl VZ1000 equipped with a GPS receiver, on-board inclination sensor, digital compass (to georeference the acquired data) and a high-resolution digital camera (Nikon D700). TLS was placed on a temporary platform specifically arranged to ensure the exact re-positioning of the sensor by means of a tripod. In the present work, two different scan positions for the TLS were used: in the first monitoring phase (in the hours following the collapse) scans were carried out in a safe place within the construction site (position one,
Figure 4b). Afterwards, the TLS survey was carried out from a building rooftop located in front of the construction site (position two,
Figure 4c). From this last position, it has been possible to monitor both the portion of the piling walls affected by the collapse, the portion not affected and the buildings behind. Although the TLS device used has a range of about 1400 m, scans were limited to 450 m in order to quickly perform the acquisition process and to reduce the size of the point clouds.
During the period between February 15th and May 25th, 18 multi-temporal TLS scans were collected (
Table 1). The software used to manage the high-resolution 3D digital models was Riscan Pro [
16] that is designed to optimize the field acquisition procedure. For the alignment and processing of acquired point clouds CloudCompare software (Version 2.6.1, Électricité de France – EDF R&D, Paris, France) was used. CloudCompare, is a 3D point cloud editing and processing open source software. The M3C2 and Volume 2.5D plugins for the operations and processing were exploited [
17].
The M3C2 plugin allows for the evaluation of the distance between the two selected point clouds using a specific algorithm. The method uses a set of calculation “core” points
i, for which one distance and confidence interval is calculated. The core points will generally be a sub-sampled version of the reference cloud (e.g., by setting a minimum point spacing), but all calculations use the original raw data. For any given core point, a normal vector is defined for each cloud by fitting a plane to the neighbors of that cloud. Once the normal is defined for the core point
i, it is used to project
i onto each cloud at scale
d (called the projection scale). This amounts to defining the average positions
i1 and
i2 of each cloud in the vicinity of
i. This is done by defining a cylinder of radius
d/2 whose axis goes through
i and which is oriented along the normal vector. The intercept of each cloud with the cylinder defines two subsets of points of size n1 and n2. Projecting each of the subsets on the axis of the cylinder it is possible to estimate two distributions of distances [
18].
The Volume 2.5D plugin can be used to compute the volume between two 2.5D clouds. It relies on a rasterization/gridding process of the cloud that is based on the setting of the basic grid parameters such as: the step (cell spacing), the main projection direction and the cell height (how the height of each cell should be computed when multiple points fall inside). Once the parameters are set, CloudCompare will then compute the 2.5D grid, project the cloud inside and deduce the volume as well as other statistics. To compute the volume CloudCompare sums the contribution of each cell. This contribution is simply the volume of the elementary parallelepiped corresponding to the cell footprint multiplied by the difference in heights (dV = grid step × grid step × difference of height) [
18].
3.2. Terrestrial SAR Interferometry (TInSAR)
In addition to the TLS instrument, a TInSAR (Terrestrial SAR Interferometer model IBIS-L) (by IdS GeoRadar S.r.l.) has been installed with the aim to performs a real-time remote monitoring of possible deformations, along the instrument Line of Sight (LoS), on piling wall and buildings behind with short scan time of about 5 min.
TInSAR is a ground-based radar monitoring technique founded on the same operational principles of satellite SAR Interferometry. This technique is based on an active radar sensor that emits and receives electromagnetic waves (Ku band) while moving along a rail. TInSAR is characterized by 24/7 efficacy under any weather and lighting conditions, maximum range of 4 km, high accuracy in displacement measurement, high sampling rate (up to 5 min) and widespread monitoring capabilities [
19]. SAR images consist of several pixels, the size of which depends on several parameters (e.g., equipment, distance between sensor and scenario, etc.). A displacement map, along the instrument LoS, with related time series for each pixel can be obtained by computing the phase difference on pixels of at least two SAR images, acquired at different times [
20].
Thanks to the assistance of Fire Department, the system was deployed on a rooftop of a building (position two in
Figure 4a) by means of a modular basement designed for the quick installation, covering a survey area 20 to 150 m away from the sensor (
Figure 5). The monitoring radar platform was continuously active from February 19th to May 26th, 2018 with high temporal sampling rate (about 5 min), collecting about 25,000 SAR images. Thanks to this large amount of data (due to the high time resolution) some considerations can be made: the acquired data showed accuracy values ranging from a few tenths of mm to about 1 mm, depending on the different monitoring areas and construction site work. This because the accuracy values are strictly correlated to the investigated scenario (e.g., short distance, high wave reflection, etc.), as reported by [
19]. Additionally, the presence of some working machines, and their handling during the monitoring acquisitions (e.g., excavation works between February 17th and 19th, etc.), affected the overall data quality and its accuracy. Acquired data shown in
Figure 6, both in terms of radar displacement map and time series, are characterized by high accuracy values (tenths of mm) as they are referred to low noise areas.
4. Results
4.1. Distance Maps and Volume Computing from TLS Measurements
The analysis of different point clouds, acquired by TLS over time, permitted the evaluation of the evolution of the construction site during the monitoring period, the volumes involved in the collapse and the efficacy of emergency stabilization measures.
By comparing several point clouds, acquired both from position one within the construction site (
Figure 4b) and position two on the building rooftop (
Figure 4c), some results concerning the days following the collapse and consisting of 3D distance maps were achieved. In detail, the comparison between February 15th (02:24:44) and February 16th (09:48:57), computed in terms of M3C2 distance (distance is computed horizontally), highlights the absence of significant changes in the structures and material involved in the collapse, including buildings which were cautiously evacuated after the collapse. Additionally, the evaluation of point clouds acquired between February 17th (09:05:29) and February 19th (12:51:27), during the emergency stabilization works, show a difference of about 8 m along the vertical component (M3C2 distance is computed vertically) close to the piling wall. This was due to the presence of filling material used within the construction site for the emergency stabilization of the piling wall (
Figure 7).
A further long-term analysis of point clouds acquired between February 19th (12:51:27) and May 26th (08:46:14) was carried out with the aim of identifying possible unstable areas and compare the cumulative displacement detected with measures acquired by TInSAR.
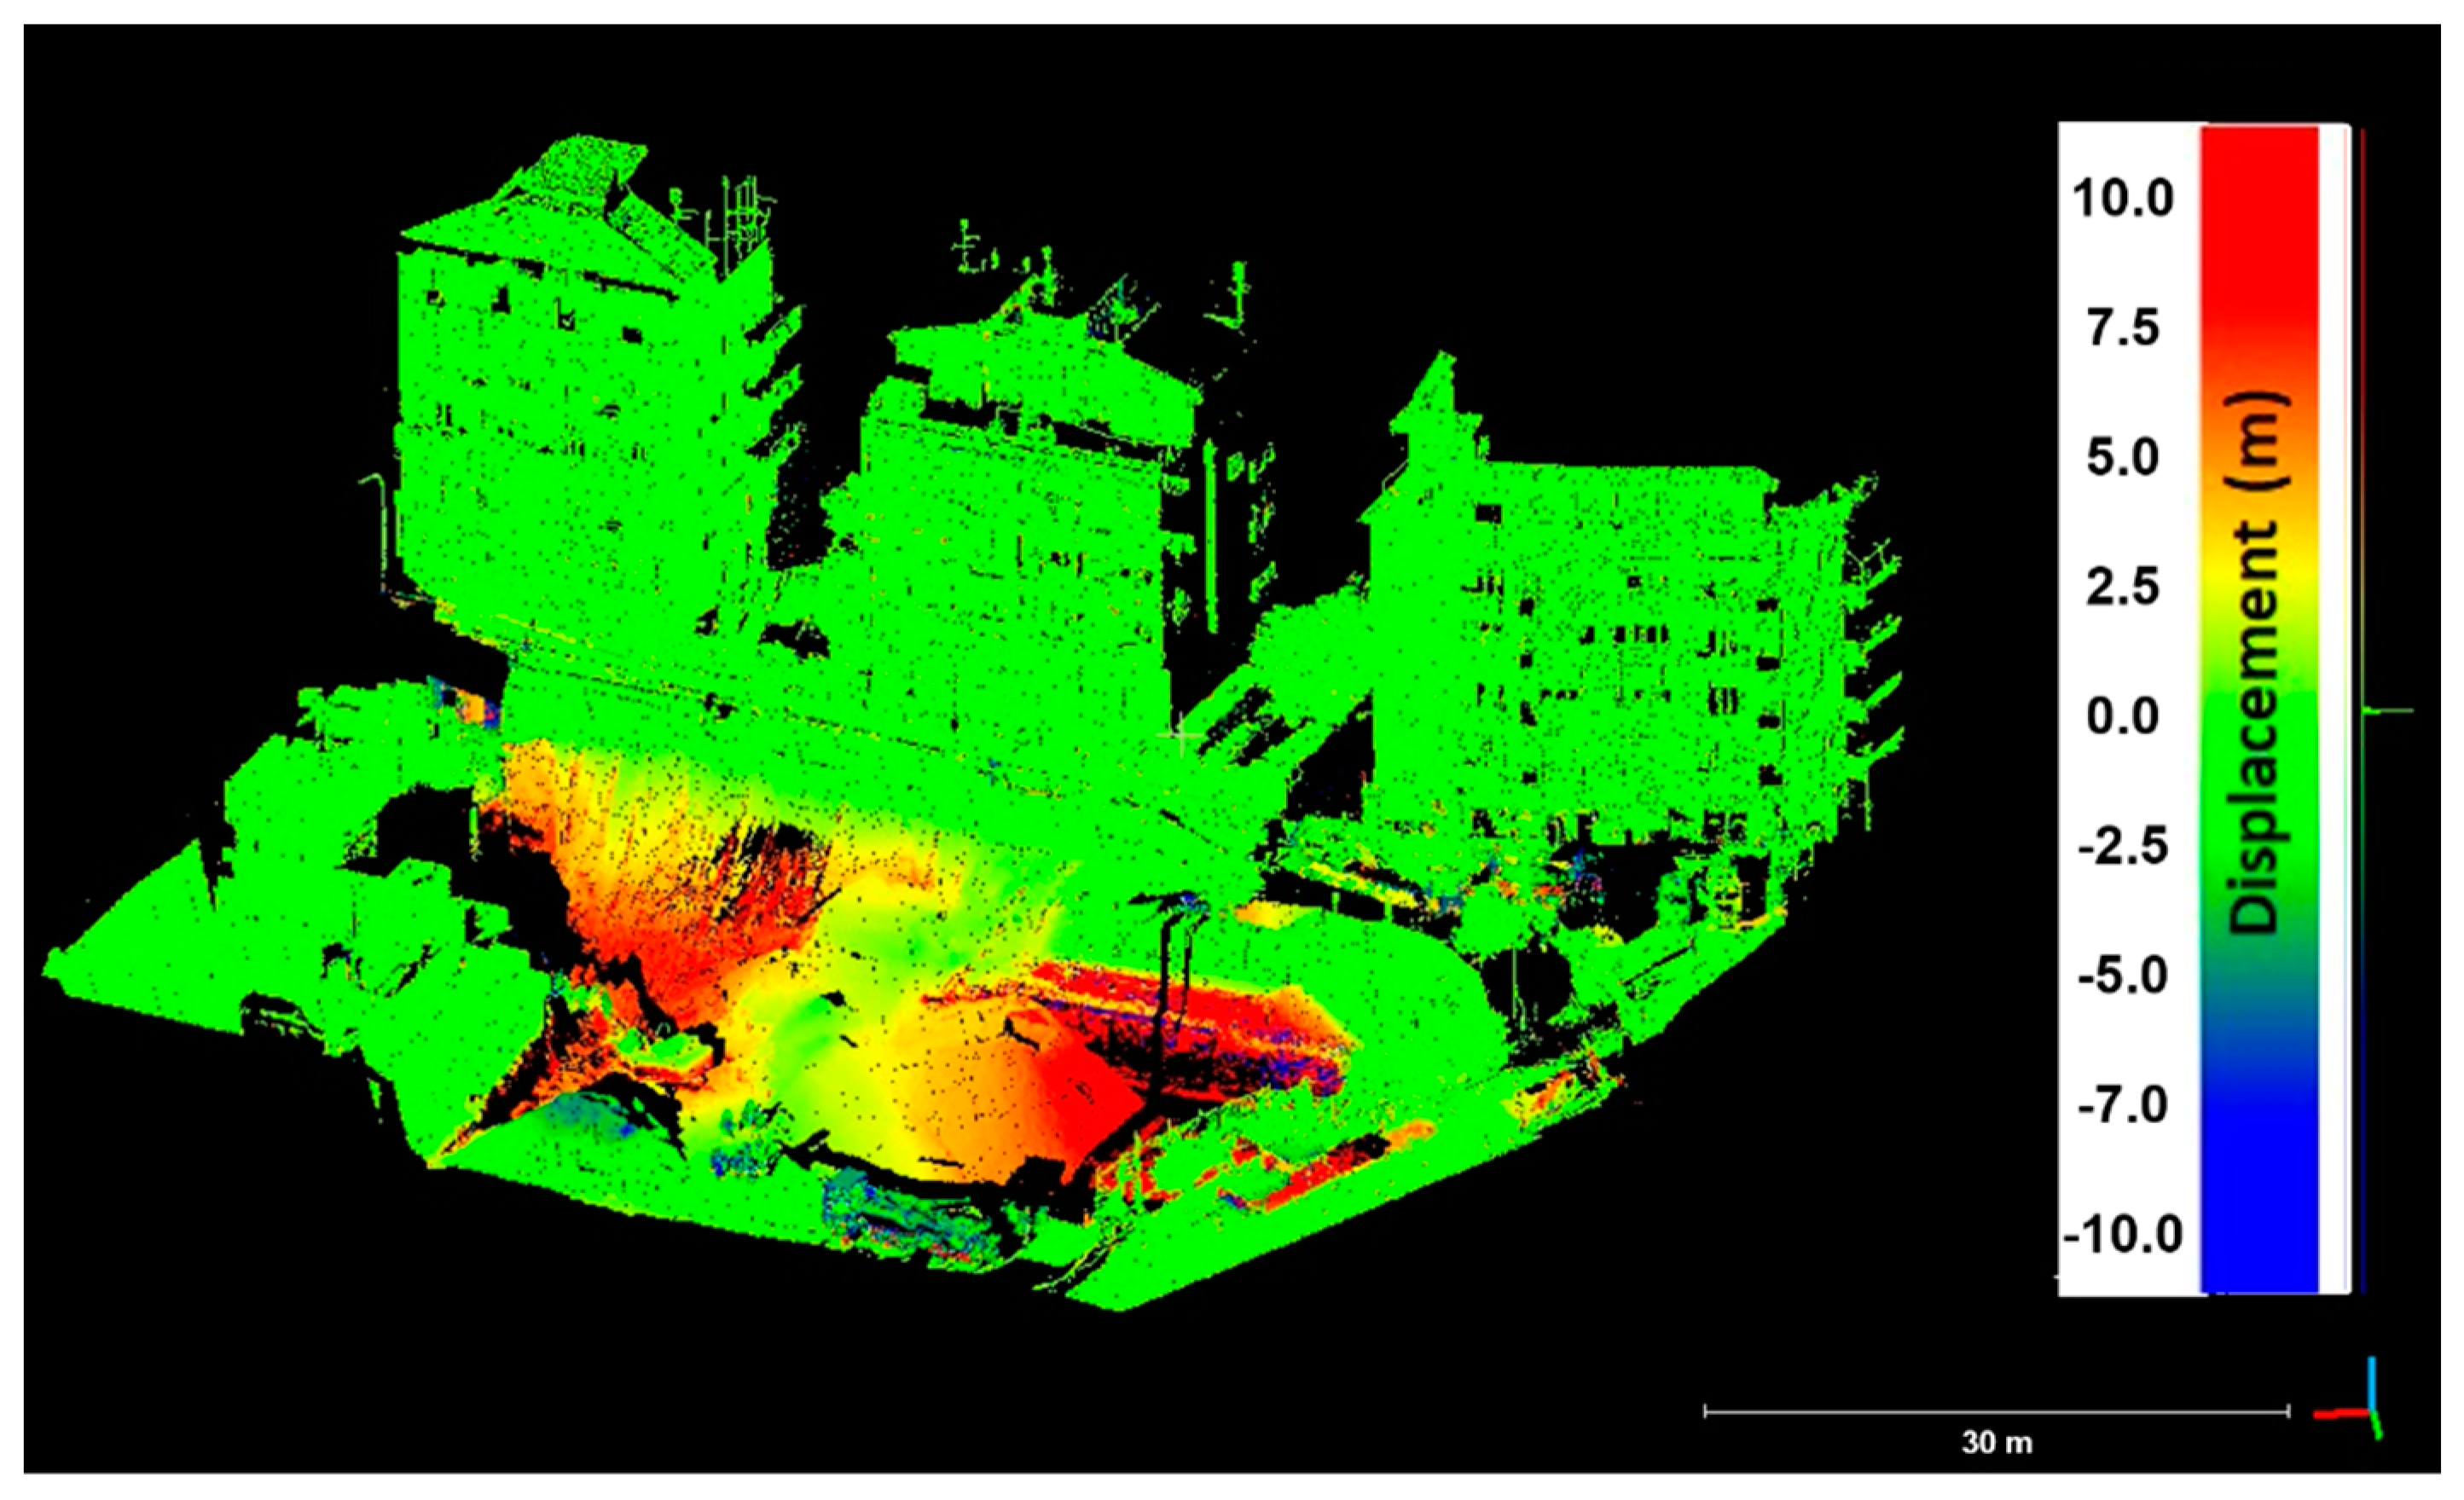
Figure 6a shows the 3D map, computed in terms of M3C2 distance (distance is computed horizontally i.e., normals are constrained in the XY plane). Areas in blue show a negative distance which can be interpreted as lack of material. The maximum value of distance, computed along the X direction, is of about 25 cm.
In addition, an estimation of the total volume involved in the collapse was carried out. In detail, after the 3D synthetic reproduction of the collapsed road stretch, based on the available design data and through the generation of about 1000 artificial points (each with XYZ coordinates), a comparison with point cloud acquired on February 16th (15:01:08) was made. Thanks to these comparisons and measurements made on the generated point cloud, using CloudCompare Volume 2.5D tool, the geometry of the detachment area (road basement behind the piling wall,
Figure 4b) was defined in the three dimensions:
Length of the collapsed road stretch = 30 m;
Width of the collapsed road stretch = 6 m;
Height of the piling wall = 7 m.
A statistical analysis considering several parameters of CloudCompare Volume 2.5D tool (e.g., grid, cell height, match cells) was performed in order to estimate the mobilized volume involved in the collapse. Following this analysis, a volume of approx. 850 m3 was estimated, corresponding to approx. 67% of the total volume of the original road basement behind the piling wall.
4.2. Displacement Maps and Time Series from TInSAR
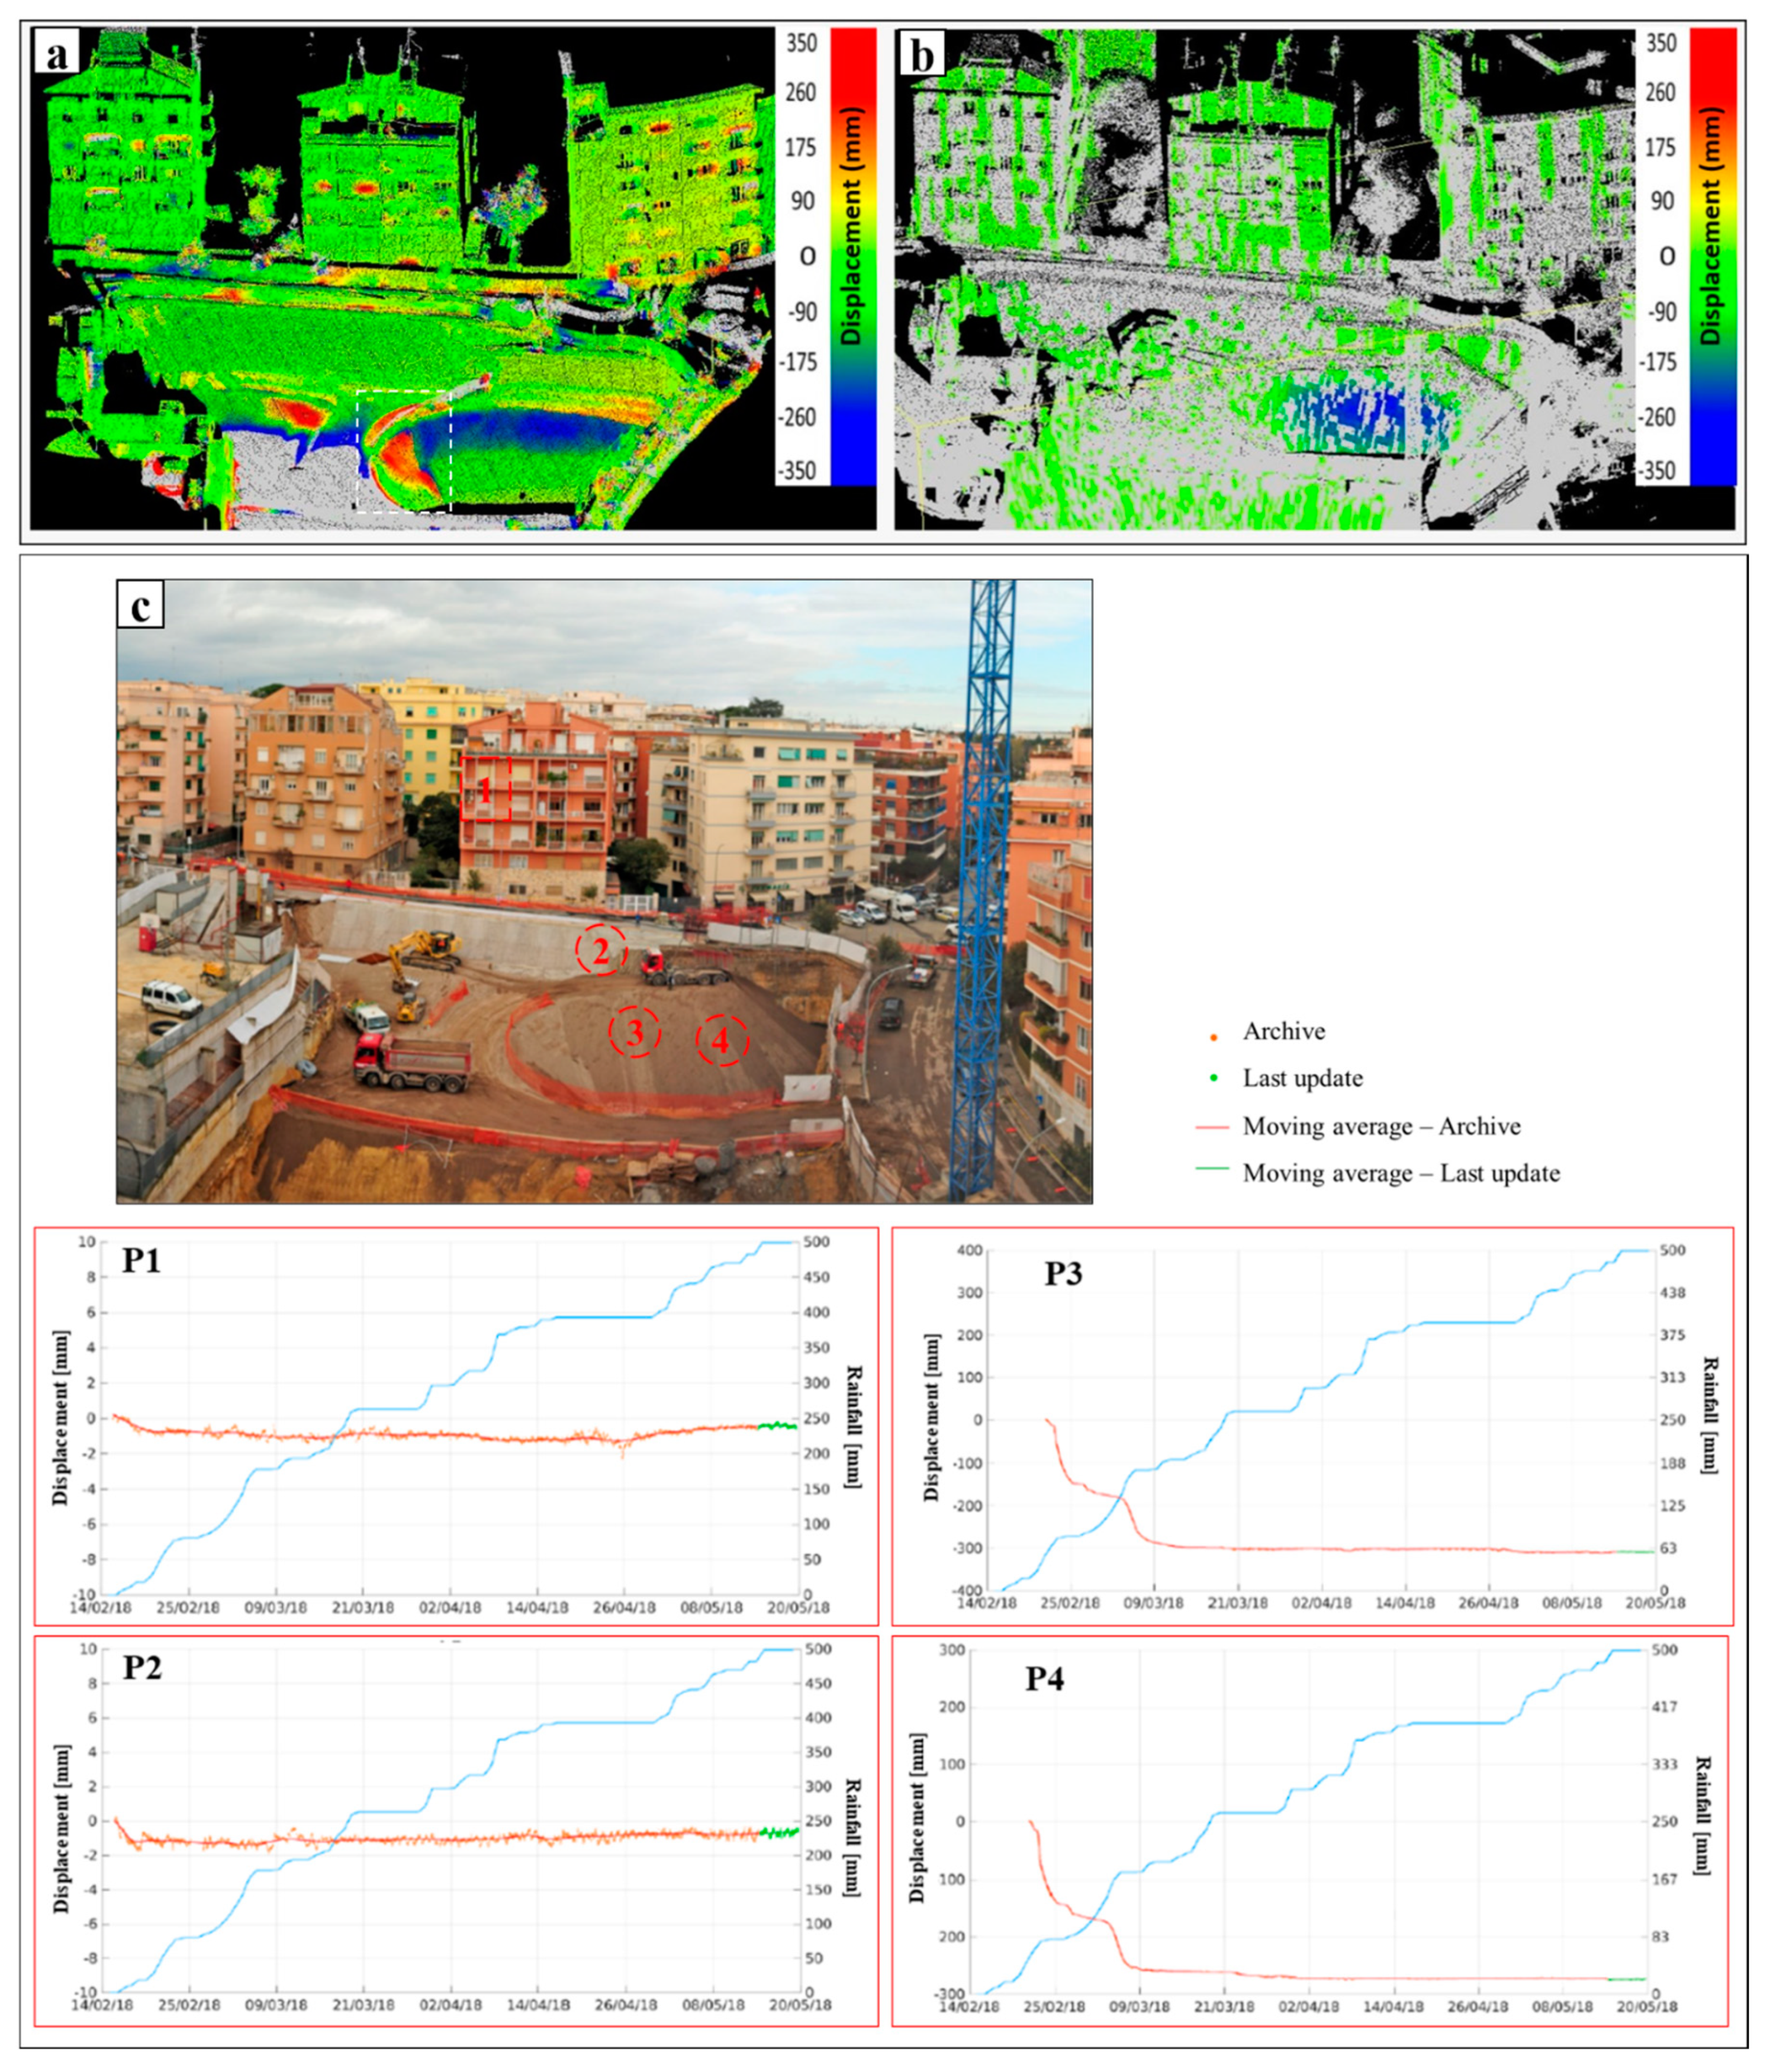
The results from TInSAR monitoring, performed between February 19th and May 26th, consist of a radar displacement map, projected on one of the TLS point clouds acquired, and relative displacement time series for each pixel. Thanks to this overlapping process, it was possible to discriminate the unstable area from pixels characterized by high stability, represented in green in
Figure 6b. Conventionally, if a pixel moves away from the sensor between two consecutive measures the TInSAR technique assumes positive value of displacement while if a pixel moves towards the sensor it assumes a negative value (red and blue color, respectively, in
Figure 6b) [
20,
21]. Thanks to these results, which show the displacement values over time for each pixel (
Figure 6c), it has been possible to understand the possible processes of mobilization providing useful information on the behavior of the entire investigated scenario such as buildings (e.g., P1), piling wall (e.g., P2) and filling material taken in place as first emergency intervention of stabilization within the construction site (e.g., P3 and P4). These results highlight that:
The piling wall showed a mobilization rate, along the instrument LoS, of about 1 mm in the two days following the collapse (value close to the instrumental error); such (negative) displacement has been recorded along the instrument LoS, indicating a movement towards the excavation;
Pixels coincident with buildings show a similar behavior to that of the piling wall.
The filling material within the construction site was involved in a mobilization process. The associated time series clearly showed that, between February 22nd and March 1st, it was affected by 170 mm of displacement along the radar LoS. After a temporary deceleration, it showed a significant acceleration around March 3rd which caused, in less than two days, a further shift of about 100–130 mm. This new acceleration was correlated to heavy rainfall (about 80 mm in three days) which affected the city of Rome during those days. In the area taken into consideration, the overall displacement of the filling material reached about 270–300 mm along the radar LoS.
5. Discussions and Conclusions
The present work describes an engineered slope, where the interaction between human activities and geological context can identify effects interfering with urban assets and safety conditions of workers and citizens. Although it has not been a particularly large slope failure, the effects generated have been severe. In addition to people evacuations, site impoundment, road closure and restoration works, a judicial inquiry has been initiated to establish the possible causes of collapse. About two years later it has been possible to reopen the affected road.
The original purpose of the monitoring of this geotechnical asset was to support the local authority to manage the residual risk and to ensure the safety of workers during emergency operations. From the large monitoring data base some important information was inferred.
Thanks to the technical capabilities of the high technology instruments used, in terms of frequency of data collection, processing and transmission, it has been possible to thoroughly monitor occurrences over emergency phases, providing in real-time useful data to civil protection authorities by means of constant updates on field and weekly reports. The completely remote operation allowed continuous monitoring of the piling wall evolution and the stability of the man-made structures without any change in instrumental configuration or installation of targets within the unstable area. The integration of deformation data given by TInSAR monitoring with geometrical statistics given by the TLS surveys was fundamental as it investigated and characterized, in spatial and temporal terms, both the engineering structures and the gravitational instabilities.
The comparison of the results obtained through the use of two monitoring techniques (TLS and TInSAR) led to a detailed analysis of the mobilization of the temporary slope of filling material. The area subject to mobilization was defined in approximately 150 m
2. It is important to highlight that only the multitemporal analysis trough TLS was able to detect a change in distance that occurred on the right side of the temporary slope (white dashed polygon in
Figure 6a). This because the portion of mobilized material was almost parallel to the radar line of sight (LoS) and therefore the sensor was not able to detect and measure its movement.
Thanks to a detailed analysis on the point clouds generated, the mobilized volume of soils back to the collapsed part of the piling wall has been estimated as approx. 850 m3 while the total volume of the detachment portion corresponds to approx. 1260 m3. As shown by the comparison between the point clouds and time series in the days following the collapse, the remaining part of the piling wall showed no significant deformation. The buildings behind it did not show any displacement either. Only the filling material taken in place as first emergency intervention of stabilization within the construction site has been involved in a mobilization process which, thanks to the monitoring systems installed, has been continuously controlled with high accuracy. Such filling material has been affected by two distinct mobilizations in the periods February 22nd–March 1st (170 mm) and March 3rd–March 5th (100–130 mm) the last one of which correlated to heavy rainfall.
The present case reveals that data collected by this integrated monitoring system may improve the knowledge on the deformational behavior and related triggering factors of both the engineered slope and man-made structures.
Author Contributions
F.I. and P.M. performed the measurements, F.B. and P.M. were involved in planning and supervised the work, F.I. and S.R. processed the experimental data, performed the analysis, drafted the manuscript and designed the figures. C.E. aided in interpreting the results and worked on the manuscript. All authors have read and agreed to the published version of the manuscript.
Funding
This research received no external funding.
Acknowledgments
The authors wish to thank the Department of Safety and Civil Protection of the Municipality of Rome (Ferri G.) for the support provided during the field surveys.
Conflicts of Interest
The authors declare no conflict of interests.
References
- Bozzano, F.; Martino, S.; Priori, M. Natural and man-induced stress evolution of slopes: The Monte Mario hill in Rome. Environ. Geol. 2006, 50, 505–524. [Google Scholar] [CrossRef]
- Lim, A. Lesson learned from retaining wall failures: A geotechnical disaster. In MATEC Web of Conferences; EDP Sciences: Les Ulis, France, 2018; Volume 229, p. 03014. Available online: https://0-doi-org.brum.beds.ac.uk/10.1051/matecconf/201822903014 (accessed on 13 July 2020).
- Cui, Y.; Xu, C.; Xu, S.; Chai, S.; Fu, G.; Bao, P. Small-scale catastrophic landslides in loess areas of China: An example of the March 15, 2019, Zaoling landslide in Shanxi Province. Landslides 2020, 17, 669–676. [Google Scholar] [CrossRef]
- Brook, M.S. Field reconnaissance of the Rawene Slip urban landslide, Auckland, New Zealand. Landslides 2018, 15, 2295–2302. [Google Scholar] [CrossRef]
- Frodella, W.; Ciampalini, A.; Bardi, F.; Salvatici, T.; Di Traglia, F.; Basile, G.; Casagli, N. A method for assessing and managing landslide residual hazard in urban areas. Landslides 2018, 15, 183–197. [Google Scholar] [CrossRef]
- Mazzanti, P. Toward transportation asset management: What is the role of geotechnical monitoring? J. Civil. Struct. Health Monit. 2017. [Google Scholar] [CrossRef]
- Guzzetti, F.; Mondini, A.C.; Cardinali, M.; Fiorucci, M.; Santangelo, M.; Chang, K.T. Landslide inventory maps: New tools for an old problem. Earth Sci. Rev. 2012, 112, 1–25. [Google Scholar] [CrossRef] [Green Version]
- Del Monte, M.; D’Orefice, M.; Luberti, G.M.; Marini, R.; Pica, A.; Vergari, F. Geomorphological classification of urban landscapes: The case study of Rome (Italy). J. Maps 2016, 12, 178–189. [Google Scholar] [CrossRef] [Green Version]
- Amanti, M.; Troccoli, A.; Vitale, V. Pericolosità geomorfologica nel territorio di Roma Capitale. Analisi critica di due casi di studio: La Valle dell’Inferno e la Valle dell’Almone. Mem. Descr. Carta Geol. 2013, 93, 35–66. [Google Scholar]
- Marra, F.; Rosa, C. Stratigrafia e assetto geologico dell’area romana. Mem. Descr. Carta Geol. d’It. 1995, 50, 49–118. [Google Scholar]
- Corazza, A.; Lombardi, L.; Marra, F. Geologia, idrogeologia e approvvigionamento idrico del colle Capitolino (Roma, Italia). Ital. J. Quat. Sci. 2004, 17, 413–441. [Google Scholar]
- Karner, D.B.; Marra, F.; Renne, P.R. The history of the Monti Sabatini and Alban Hills Volcanoes: Growndwork for Assessing Volcanictectonic Hazards for Rome. J. Volcanol. Geotherm. Res. 2001, 107, 185–219. [Google Scholar] [CrossRef]
- Giordano, G.; Esposito, A.; De Rita, D.; Fabri, M.; Mazzini, I.; Trigari, A.; Rosa, C.; Funiciello, R. The sedimentation along the Roman Coast between Middle and Upper Pleistocene: The interplay of eustatism, tectonics and volcanism—New data and review. II Quat. 2003, 16, 121–129. [Google Scholar]
- Bozzano, F.; Andreucci, A.; Gaeta, M.; Salucci, R. A geological model of the buried Tiber River valley beneath the historical centre of Rome. Bull. Eng. Geol. Environ. 2000, 59, 1–21. [Google Scholar] [CrossRef]
- Ventriglia, U. Geologia del Territorio del Comune di Roma (Ventriglia 2002). Available online: http://www.provincia.rm.it/dipartimentoV/SitoGeologico/PagDefault.asp?idPag=20 (accessed on 13 July 2020).
- Riegl. Laser Measurement System. Available online: http://www.riegl.com/index.php?id=221 (accessed on 13 July 2020).
- CloudCompare Version 2.6.1, User manual. Available online: http://www.cloudcompare.org/doc/qCC/CloudCompare%20v2.6.1%20-%20User%20manual.pdf (accessed on 13 July 2020).
- Lague, D.; Brodu, N.; Leroux, J. Accurate 3D comparison of complex topography with terrestrial laser scanner: Application to the Rangitikei canyon (N-Z). ISPRS J. Photogramm. Remote Sens. 2013, 82, 10–26. [Google Scholar] [CrossRef] [Green Version]
- Bozzano, F.; Mazzanti, P.; Prestininzi, A. A radar platform for continuous monitoring of a landslide interacting with an under-construction infrastructure. Ital. J. Eng. Geol. Environ. 2008, 2, 35–50. [Google Scholar]
- Hanssen, R.F. Radar Interferometry: Data Interpretation and Error Analysis; Kluwer Academic: Dordrecht, The Netherlands, 2001; Volume 2. [Google Scholar]
- Romeo, S.; Kieffer, D.S.; Di Matteo, L. The Ingelsberg landslide (Bad Hofgastein, Austria): Description and first results of monitoring system (GBInSAR technique). Rend. Online Soc. Geol. Ital. 2015, 32, 24–27. [Google Scholar] [CrossRef]
© 2020 by the authors. Licensee MDPI, Basel, Switzerland. This article is an open access article distributed under the terms and conditions of the Creative Commons Attribution (CC BY) license (http://creativecommons.org/licenses/by/4.0/).

 ,
, 


