Article

Seismically Induced Soil Liquefaction and Geological Conditions in the City of Jama due to the M7.8 Pedernales Earthquake in 2016, NW Ecuador

by
Diego Avilés-Campoverde
1,*,
Kervin Chunga
2,
Eduardo Ortiz-Hernández
2,3,
Eduardo Vivas-Espinoza
1,
Theofilos Toulkeridis
4,
Adriana Morales-Delgado
1 and
Dolly Delgado-Toala
5
1
Facultad de Ingeniería en Ciencias de la Tierra, Escuela Superior Politécnica del Litoral, Campus Gustavo Galindo Km 30.5 Vía Perimetral, P.O. Box 09-01-5863, Guayaquil 090903, Ecuador
2
Departamento de Construcciones Civiles, Facultad de Ciencias Matemáticas, Físicas y Químicas, Universidad Técnica de Manabí, UTM, Av. José María Urbina, Portoviejo 130111, Ecuador
3
Department of Civil Engineering, University of Alicante, 03690 Alicante, Spain
4
Departamento de Ciencias de la Tierra y de la Construcción, Universidad de las Fuerzas Armadas ESPE, Av. Gral. Rumiñahui s/n, P.O. Box 171-5-231B, Sangolquí 171103, Ecuador
5
Facultad de Ingeniería, Universidad Laica Eloy Alfaro de Manabí, Ciudadela Universitaria, vía San Mateo, Manta 130214, Ecuador
*
Author to whom correspondence should be addressed.
Submission received: 2 November 2020 / Revised: 21 December 2020 / Accepted: 28 December 2020 / Published: 31 December 2020
(This article belongs to the Special Issue Earthquake Environmental Effects in the Historical and Recent Data)

Abstract

:
Seismically induced soil liquefaction has been documented after the M7.8, 2016 Pedernales earthquake. In the city of Jama, the acceleration recorded by soil amplification yielded 1.05 g with an intensity of VIII to IXESI-07. The current study combines geological, geophysical, and geotechnical data in order to establish a geological characterization of the subsoil of the city of Jama in the Manabi province of Ecuador. Then, the liquefaction potential index (LPI) has been evaluated considering the PGA-rock values calculated from deterministic methods applied to nearby geological faults, as well as the soil acceleration records for the city of Jama since the Pedernales megathrust earthquake. The importance of conducting geotechnical evaluations of particular colluvial, alluvial, and floodplain deposits, for which the liquefaction probability profiles have been additionally obtained, may serve as a useful tool for edifices foundations or earthquake resistant designs. Finally, the site response analysis is presented using a linear equivalent analysis, where previously seismic records compatible with the target spectrum have been selected. Hereby, the results of ground surface effects have been compared with the spectra of the Ecuadorian Regulation of Construction (NEC) in the context of local seismic amplification.

1. Introduction

There are a variety of geologic effects that may be triggered by strong earthquakes causing severe damage to human settlements as well as strategic infrastructure and even threatening the lives of inhabitants [1,2,3,4,5,6,7,8,9,10,11]. Such secondary coseismic effects may include the shaping and modification of a vast area and corresponding landscapes over a longer period of time due to the generation of landslides, ground shaking, and slope failure as well as tsunamis amongst many others, which may leave behind zones of destruction and or catastrophic consequences [12,13,14,15,16,17,18,19,20,21].
Within the earthquake induced geological and geomorphological hazards, the soil liquefaction is the main cause of destruction that is directly related to earthquakes and has the ability of subsidence, position variation or even collapse for buildings [2,22,23,24,25,26]. Hazen [27], first proposed one of the principal patterns for this coseismic liquefaction phenomenon, while later the physical effects were evaluated where heavy structures tend to sink and light structures tend to float [28,29,30,31,32].
In this context, earthquake environmental effects are the most common expressions documented in thrust earthquakes of 6.9 ≤ M ≤ 7.9 on the central coast of Ecuador [18,26]. During the earthquakes of 1942 (M7.9) and 2016 (M7.8), several liquefaction phenomena that induced processes of lateral spreading in river margins, subsidence, depression, or holes in the ground and sand boils were documented in the city of Jama [33,34,35]. Many of these coseismic deformations have been formed in recent soils on floodplains and terraces, where the groundwater is located between 1 and 5.0 m of depth [18,36].
The process of liquefaction is described as a transformation of saturated granular material from a solid to a liquefied state due to the increase in pore pressure. This causes shear stresses and subsequent rupture of the soil skeleton. Hereby, the sudden action of the seismic load generates an increment in the pore pressure, thus bringing the effective stress to zero, causing a coseismic liquefaction [37,38,39,40].
The geological setting of the city of Jama, leads to the influence of the saturated soils of the Holocene on liquefaction potential analysis, that is, recently deposited sediments such as alluvial, colluvial, paleochannel and paleo-coastal lagoons, which are prone to suffer the phenomenon of liquefaction in seismic area with a PGA greater than 0.38 g [11,35,36]. A map with the delineation of these soils with coseismic potential will potentially contribute to the development and further land use of the urban area of Jama.
We report results of mapping of coseismic geological effects in the surface area of the Pedernales M7.8 2016 earthquake, and its correlation with the Potential Liquefaction Index (PLI), applying various deterministic methods. This method has started from liquefaction evaluation based on a stress approach proposed by Seed and Idriss [28]. Additionally, data from standard penetration test (SPT) drilling have been used, which consider corrections for overload effects, water table level and seismic magnitude [41,42,43].
The variables we have used in order to express the liquefaction potential are the demand CSR (cyclic stress ratio) and the resistance CRR (Cyclic resistance ratio). With these values, the safety factor (SF) may be calculated, applying the resistance over the demand ratio. If this SF> 1 indicates that this layer or stratum is not liquefiable and SF <1 indicates that it has a high probability that the soil presents liquefaction (Seed and Idriss [28]). Furthermore, the geotechnical data and the geophysical tests of Vs30, Nakamura and down-hole tests, allow to build a geological section of the subsoil of the city of Jama, being the interface depth between quaternary soils and tertiary rocks (as to the volcanic basement) at 90 m depth. The response of the terrain has been modeled using the linear equivalent model (analysis of effective stresses), while the response of the soil columns was subsequently calculated for each layer [44,45]. Furthermore, we have used information of stratigraphic units and shear-wave velocity as these data have been required in order to model the spectra for the city of Jama, including soil profiles and the ground motion data in accordance with the national regulations entitled NEC-11 (Norma Ecuatoriana de la Construcción, [46]).

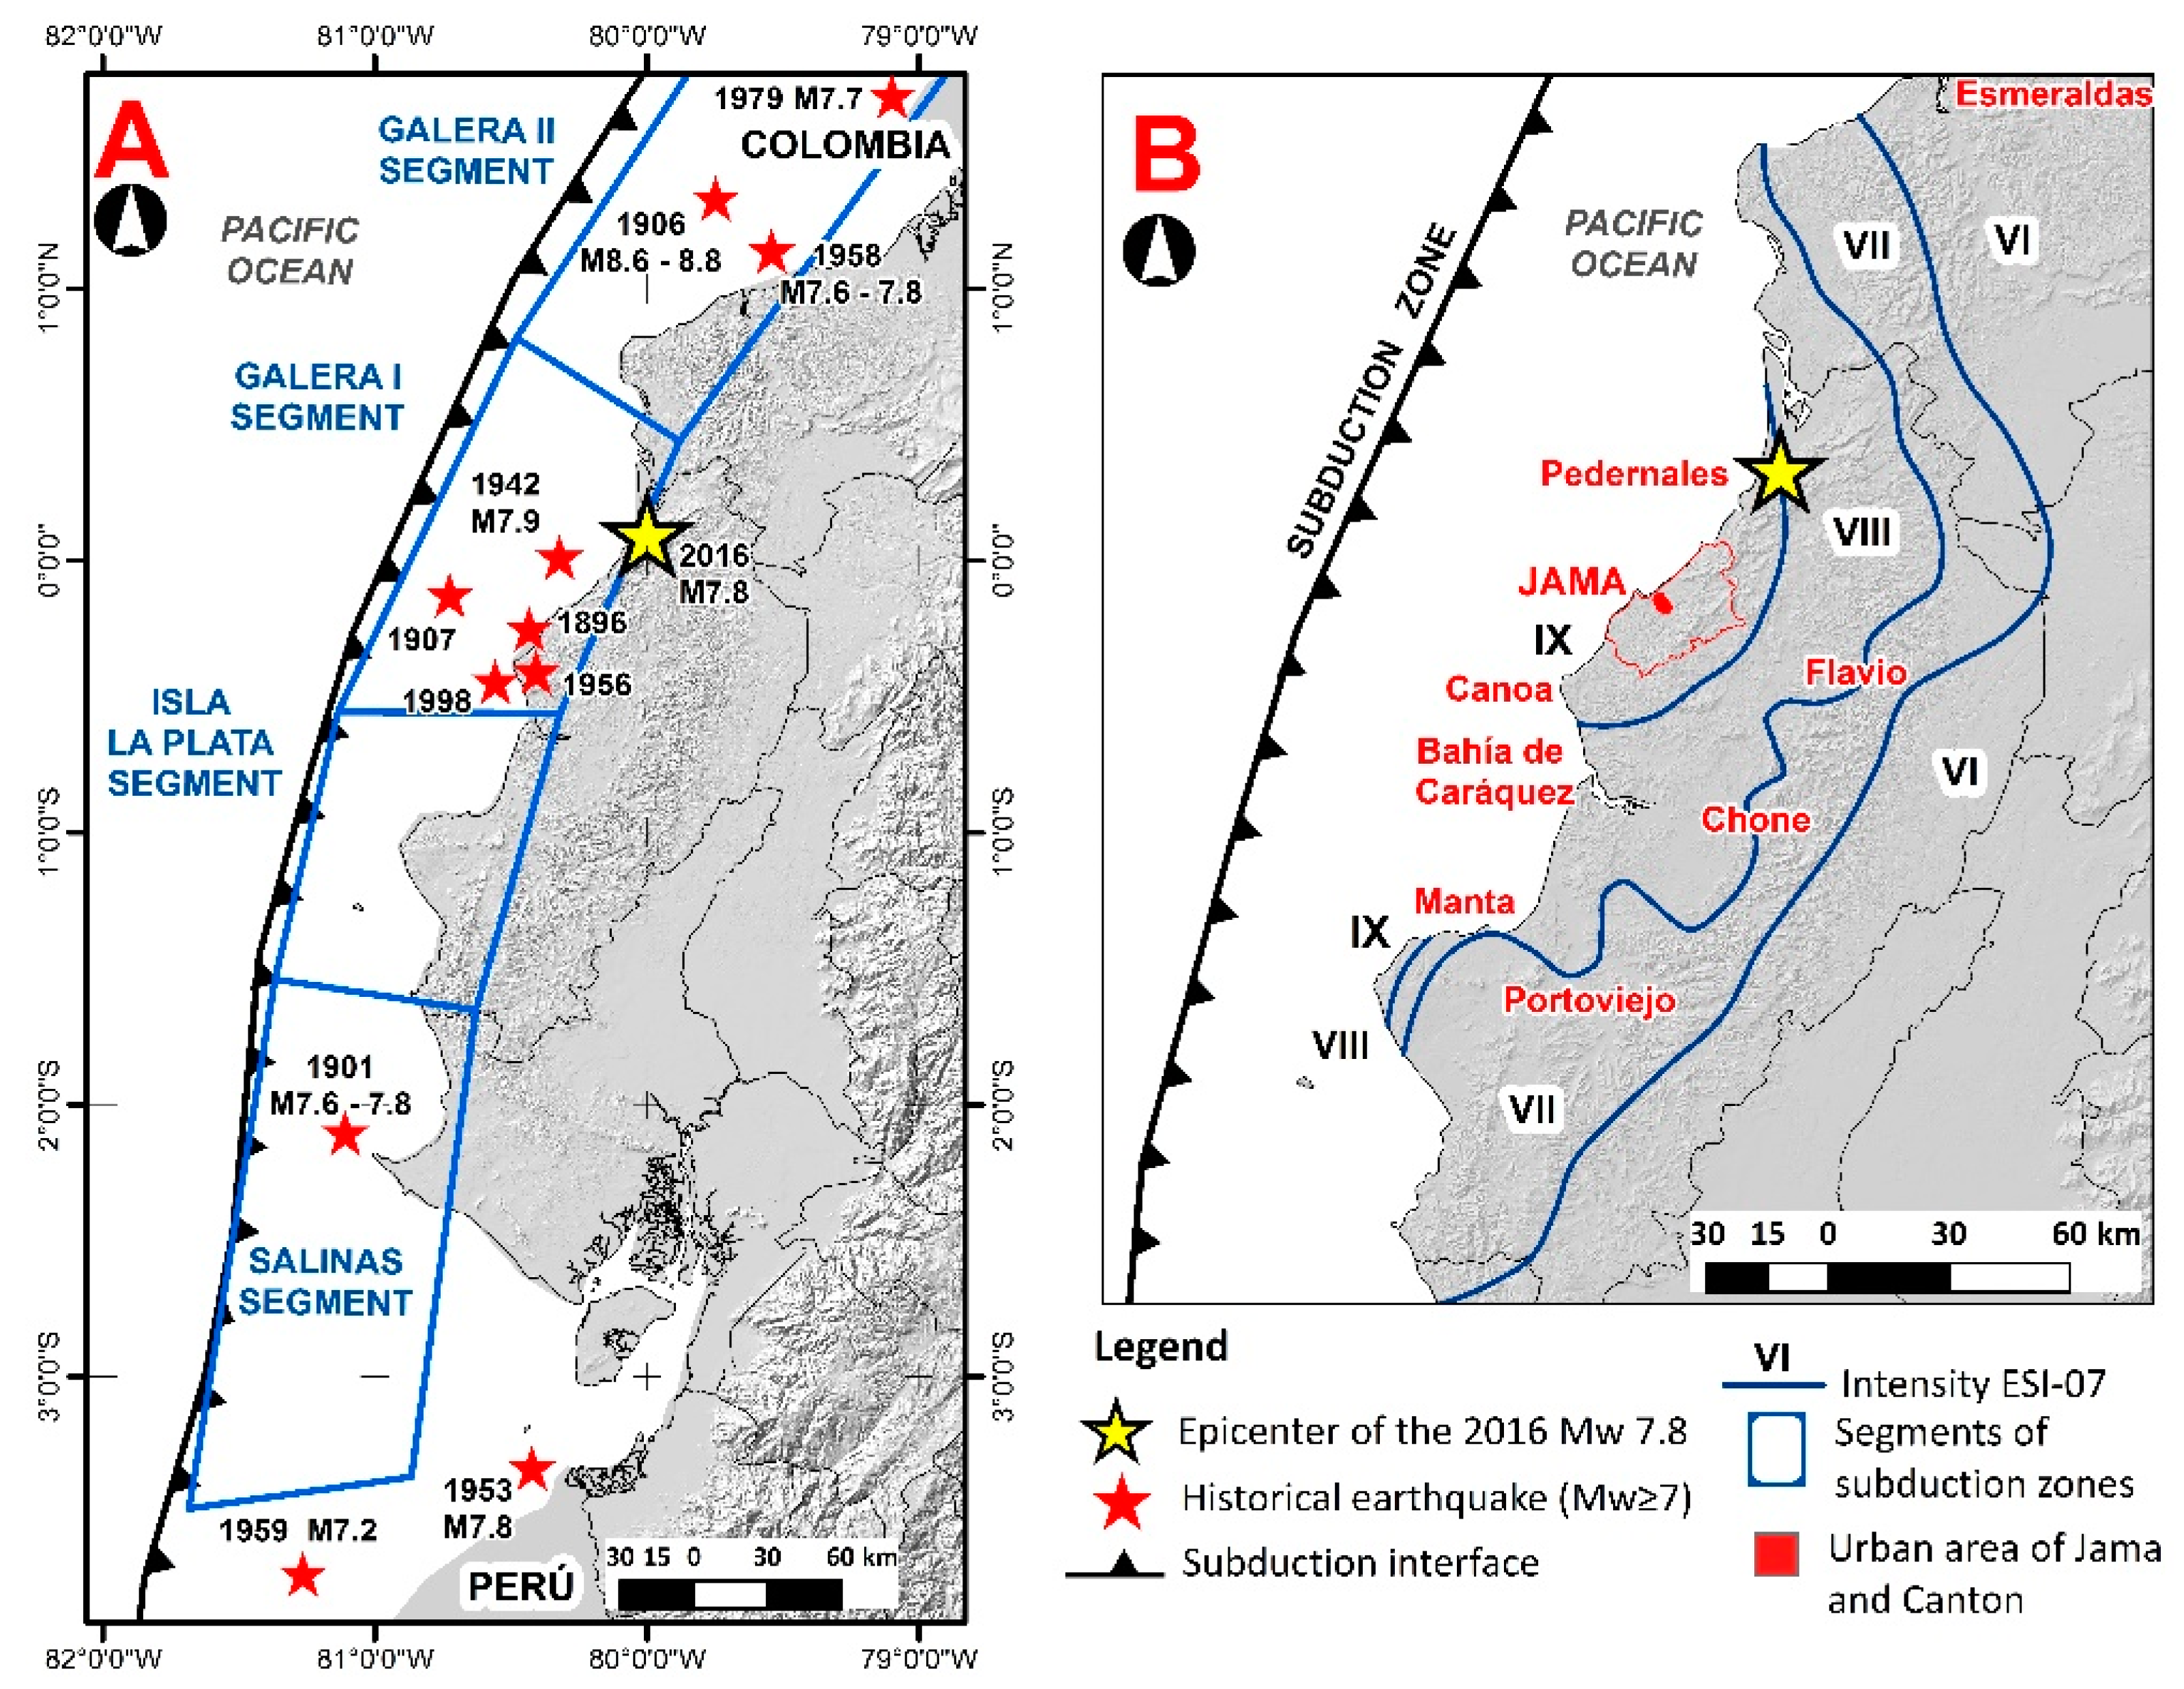
2. Geodynamic Setting and Description of the Study Area

In the northwestern edge of South America, the coast of Ecuador has a short record of historical earthquakes, which demonstrates the importance of studying seismogenic structures of both, subduction and geological faults, in order to estimate the maximum probable levels of seismicity [3,47]. Similar investigations about high seismic potential and PGA-rock faults have been conducted on the southern, central and northern coastal segments of Ecuador [6,35,47,48].
The predominant seismic source of the Pacific coastline of Ecuador is the process of subduction in the interface zone, which results from the Nazca plate moving below the continental segment formed by the South American and Caribbean plates which occurs at a rate of approximately 47 mm/year [49,50,51,52,53]. The dip variation of the subducting slab, as well as fracture zones of the oceanic crust, define the segments and the corresponding seismic behaviors [47,51,54,55,56,57].
For the continental coast of Ecuador, four main seismogenic segments have been recognized along the subduction convergent zone (Figure 1; Table 1; IOC [57]). The first segment is the southern coast, which includes the Santa Elena Province and the Gulf of Guayaquil with a rupture length estimated of about 200 to 220 km. This corresponds to the coastal zone from Salango in southern Ecuador up to the offshore area of Guayaquil Gulf, with a maximum estimated magnitude of M8.1, having a much longer recurrence than the other tectonic segments.
The second segment is the Isla de la Plata around the Manta peninsula with a rupture area of 100–120 km reaching from Bahia de Caráquez to Machalilla, where the estimated magnitude is about M7.8. This is followed by the third segment in the central coast around Manabí Province with a rupture area of 110–120 km, extending from San Vicente to Muisne.
The maximum magnitude of M7.9 was documented in Jama in 1942, and the recent M7.8 Pedernales earthquake in 2016 [1,18,33,34,58]. Finally, the fourth segment is located within the northern coast of the Province of Esmeraldas and southern Colombia with a rupture area over 450 km, reaching from the Galera peninsula to the Buenaventura Colombian villages, where the maximum estimated magnitude is about M 8.6 [18,35].
Several authors indicate that the third and fourth segments correspond to the same tectonic delineation (see Table 1, Galera I + II), where the maximum magnitude would reach M 8.9 [59,60,61].
Another morpho-structural feature off the coast of Manabí province is Carnegie, the subduction of this submarine mountain range, with an average thickness of 2.5 km, and has influenced the geodynamics of the coastal zone of Ecuador [51,62], as well as its coastal geomorphology [63,64] and seismogenic characteristics of moderate and high recurrence [35,51,54,55,65,66,67,68,69,70].
The city of Jama is situated within the third tectonic segment, where the Jama 1942 (M7.9) and Pedernales 2016 (M7.8) earthquakes are the strongest thrust earthquakes recorded during the last 120 years of seismic history [18] (Figure 1). Other earthquakes of lesser magnitude were documented in the same segment, such as the M7.1 earthquake of 3 May 1896, followed by the M7.4 earthquake of 1 June 1907, the earthquake M 7.4 of 16 January 1956 and the earthquake of M7.1 of 4 August 1998 (Figure 1). Historical seismicity suggests a recurrence period of 20 years for earthquakes M >7.0, and for larger earthquakes of M ≥7.6 a recurrence between 70 to 80 years [35].
Therefore, the NEC-11 seismic zonation map of Ecuador is comparable with the seismotectonic map of Ecuador, as both classify the coast of Ecuador as an area with high levels of seismicity associated with interplate earthquakes, indicating rock acceleration values between 0.45 and 0.55 g [46,47]. Due to its proximity to the subduction zone, the city of Jama is located in the province of Manabí within the central coast of continental Ecuador, whose territory is referred to the highest seismic zone with PGA-rock of ≥ 0.5 g [46].
The recent Pedernales earthquake reported in 2016, registered for the city of Jama a PGA-soil in the order of 1.0 to 1.05 g, while for the site of the epicenter in Pedernales a PGA-soil of 1.4 g was registered (IGEPN). Referring to the strongest aftershocks affecting the city of Jama, the most significant ones were registered on 18 May 2016 with M 6.7 and M 6.9 [18,58,71,72]. These seismic sequences allowed to establish that earthquakes from M6.9 can generate a liquefaction phenomenon in saturated soils where the water table is less than 10 m [18].
The second seismic source is represented by geological faults. In the current study, the seismic parameters of the faults have been consulted from the geometric parameters for each of the selected faults, including: (1) the spatial projection of the fault length on the ground, (2) type and kinematics of the fault, (3) the structural immersion and estimated angle of the fault displacement “in focal mechanism analysis”, and (4) the width of the seismogenic structure. With these parameters, and applying the equations most adaptable to the tectonics of the region, the magnitude, macroseismic intensity, and acceleration (PGA-rock, peak ground acceleration-horizontal) have been determined. Segmented faults have a lower magnitude, and therefore the slip rate of the fault requires many smaller earthquakes in order to accommodate a cumulative seismic moment [73,74,75].
The current study comprises an area of 579 km2, which considers to be deterministic about the seismic hazards on the entire canton of Jama. Meanwhile, the detailed geological analysis and geodynamic conditions of the subsoil is performed over the urban area of Jama with covering 2.48 km2. The Jama canton registers 20,230 inhabitants and represents 1.7% of the total inhabitants of the province of Manabi, with an annual growth of 6.4% [76]. The cantonal capital is the city of Jama with 4719 inhabitants. Most of their houses are built in lowlands of alluvial plains and abandoned terraces of floodplains. The altitudes are between 5 and 10 m a.s.l. The highest reliefs do not exceed 25 m in altitude, being located southeast of the urban area.

3. Data and Analytical Procedures

For a better understanding of the seismic hazard of Jama, we prepared a geological faults catalog, which included 27 active segments capable of generating earthquakes of 5.3 to 6.5 of moderade magnitudes (M) and PGA-rock in the order of 0.17 g to 0.32 g. The faults are abbreviated from F01 to F27 (Table 2). Larger faults, reaching lengths between 16 and 18 km, such as F01, F12, and F24, have been classified as reverse faults. These faults are prone to generate earthquakes between 6.4 and 6.5 with a PGA of 0.30 g to 0.32 g. Seismicity levels of M6.2 and M6.3 are associated with shear-type faults (F06, F09, F16, F18 and F19), with lengths between 5.7 and 6.8 km, and the accelerations in rock are in the order of 0.29 g.
In this context, the city of Jama is susceptible to two types of seismic sources, being large subduction earthquakes with regional coseismic effects, and local earthquakes of moderade magnitudes associated with the activation by geological faults. Hereby, local earthquakes may reach magnitudes of 6–6.9 and strong earthquakes between 7 and 7.9. For the city of Jama, an acceleration in rock of 0.5 g is determined, which may be amplified in soils reaching values of up to 1.05 g, as estimated for the 2016 Pedernales earthquake (Table 2; [35]).
The evaluation of the liquefaction potential and the earthquake site response in the city of Jama includes three distinctive stages:
(i) Field reconnaissance and outlining of Quaternary lithological units of the urban area, and their relationship with the field borehole. In-situ testing and laboratory experiments, allows the construction of a stratigraphic profile of the subsoil up to −45 m deep and determine the basement depth in Jama urban area using active seismic methods (Geotechnical and geophysical data available from Chunga [77] and Daza et al. [78].
(ii) Evaluation of the liquefaction potential index (LPI) through deterministic risk-based methods from SPT-based simplified procedure and shear wave velocity measurements, taking into consideration a seismic hazard scenario calculated for a return period of 475 years which is amax = 0.5 g. This technique supports the detection of the depth of the maximum deformations induced by liquefaction. The approach realized for the evaluation of the liquefaction potential index of soil units is based on results obtained from laboratory tests, has been based on the grain-size characteristics and Atterberg limits of the soil, considering geotechnical parameters proposed by several studies [29,30,41].
(iii) Determination of the geometric mean spectra in rock and soil using an one-dimensional model in the Deepsoil program, and has been compared with the seismic spectra of the NEC-11, for Jama D and E geotechnical soil profile types. Using the shear wave velocity values for the underlaying strata, the rock profile was found to be dense soil or soft rock (Supplementary Materials). Following the NEC-11 [46], for soil quality classification, this type of soil is categorized as C profile, meaning that the soil has bad quality making it prone to have considerable coseismic effects, so that the quality of the filtering is adjusted to the target spectrum, geotechnical parameters typical of the study scenarios were also entered into the PEER Ground Motion Database (Earthquake records from PEER NGA strong motion database, https://ngawest2.berkeley.edu/).
The faults delineation for Jama was generated considering the geomorphological features, direction, and hill reliefs intersections. After this, the dimension of the faults is approximated without oversizing the length of this seismogenic structure. The tectonic activity is associated to similar earthquakes of the upper plate geological faults with hypocentral distances less than 15 km [79].
The equations of Wells and Coppermish [73], used in the analysis of seismic hazard for the upper plate geological fault, are as follows:
Estimated magnitude   ( M ) = 5.08 + 1.16 × LOG   ( Lf )
Fault displacement   ( in   meters ) = EXP   ( 1.38 + 1.02 × LOG   ( Lf ) )
where Lf is the length of the capable geological fault.
We consider the equations proposed by Wesnosuky [73] and Leonard [80], as these define that a fault of the same length may have different magnitudes depending on the type of faults, being inverse, normal or shear. The spatial delineation of the faults were developed on a GIS platform as illustrated in Figure 2. Wesnousky [73], proposed modifications and corrections to the previous formula in order to estimate maximum magnitudes, such as:
Strike slip   faults :   M = 5.56 + 0.87 × Log   ( Lf )
Normal   faults :   M = 6.12 + 0.47 × Log   ( Lf )
Reverse   faults :   M = 4.11 + 1.88 × Log   ( Lf )
These regression equations indicate, that not all types of faults of the same dimension are able to generate earthquakes of the same degree of magnitude [47,74,75]. Such a concept is applied in the geological faults delineated for the city of Jama. However, we consider that these faults are inverse as well as potentially capable of generating earthquakes greater than others of the same length, but with different tectonic stresses such as shears and traction.
Furthermore, the values of the peak ground acceleration (PGA-rock) have been estimated using the equation proposed by Fukushima and Tanaka [81], expressed as:
PGA   rock = 10 ( 0.41 M l o g 10 ( H f + 0.032 × 10 0.41 M ) 0.0034 × H f + 1.3 ) 980
where Hf is the depth of fault and M the estimated magnitude.
The data obtained from magnitudes and PGA-rock have been interpolated using the ArcMap GIS and Surfer programs, applying the “gridding” method generating iso-value maps, while the PGA data interpolations in rock have been illustrated in Figure 2.

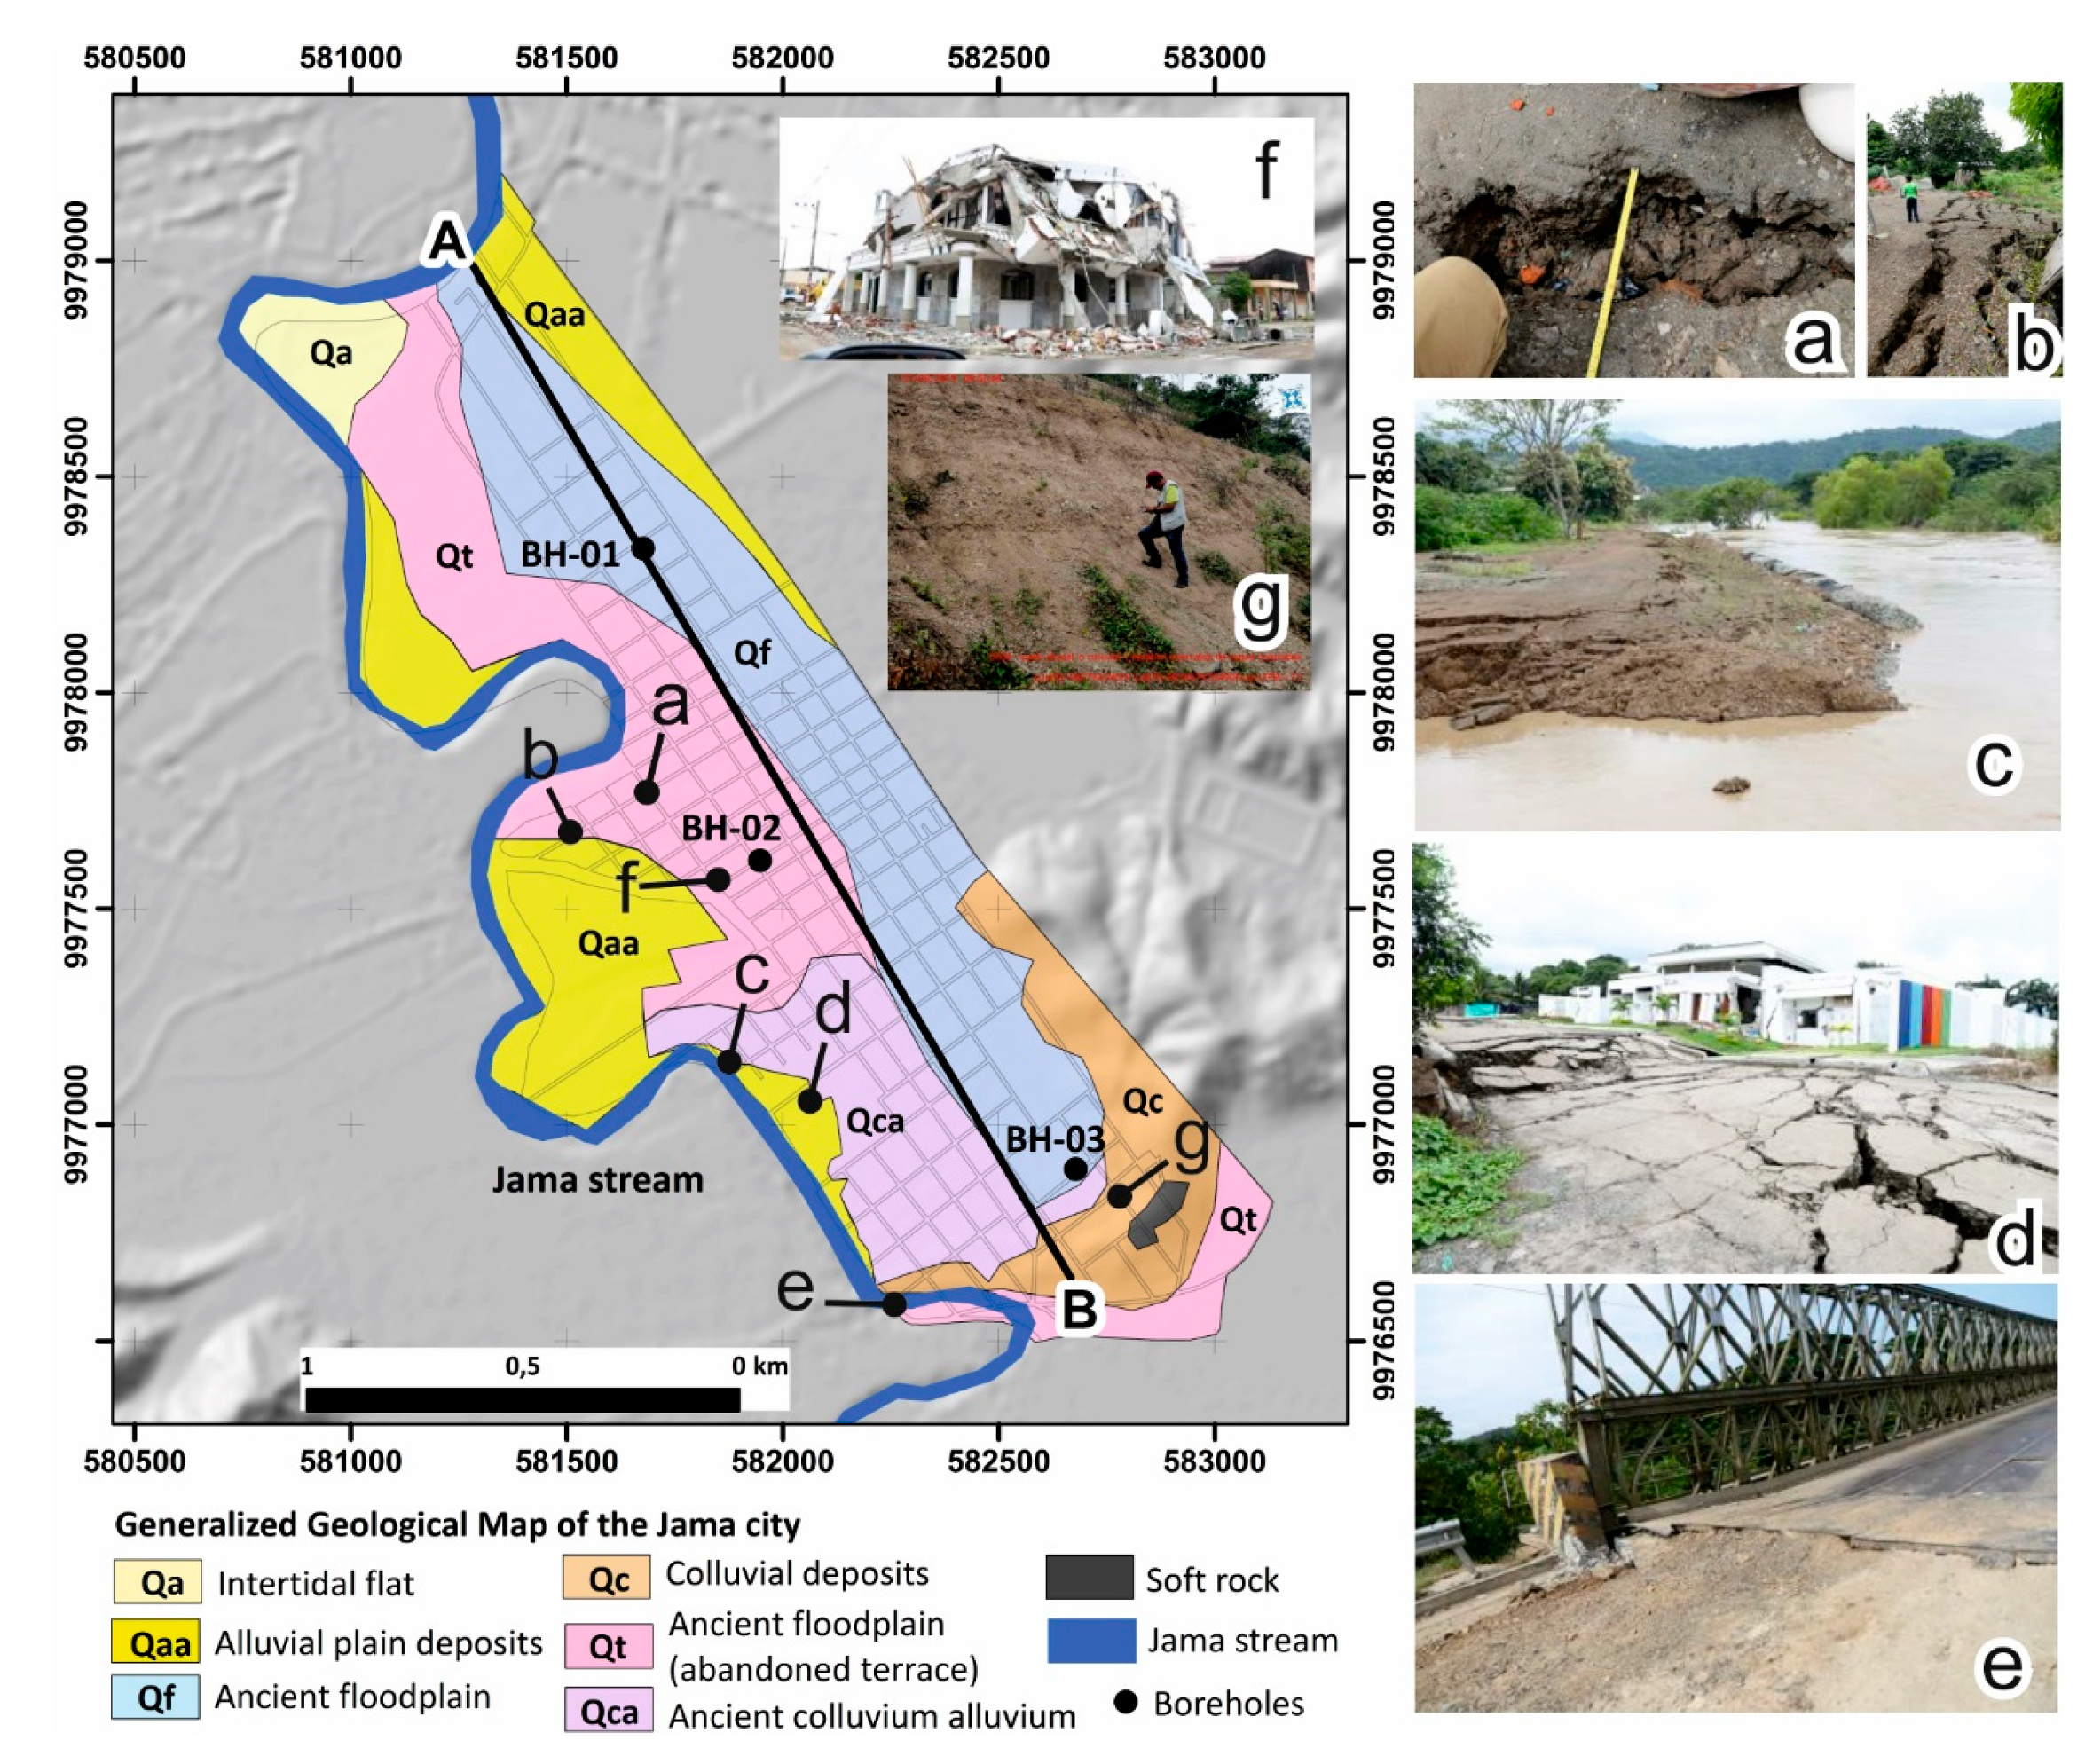
3.1. Geomorphological Conditions and Earthquake-Induced Environmental Effects

The Jama urban area has six well-delineated geomorphological features in the terrain such as: intertidal flat, alluvial plain, ancient floodplain, colluvial, abandoned floodplain and soft rocks. The soft rocks are composed of siltstones and claystones, from the Onzole and Borbon formations, in addition to other outcrops from the Punta Blanca, Tosagua, Dos Bocas, Villingota, Angostura formations, and some recently identified quaternary deposits. Their ages range from the Oligocene to the Pliocene, covered by unconsolidated sediments from the Pleistocene to the Holocene [82].
In the road cut of different hill slopes, the stratigraphic sequence of the colluvial soils with angular fragments of highly altered claystones is evidenced, interspersed at some levels by layers of distal rain triggered lahars [83]. The height of the slope reaches between 15 and 20 m. In the terraced areas, on the upper level there are sandy loamy soils, which are not very compact having desiccation cracks, there are some areas with less depressions and being flooded demonstrating anthropogenic subsidence (BH-03 in Figure 3). At the lower level, sandy soils of medium granulometry, somewhat silty, limit the floodplain soils of alluvial plains. In the riverbanks of the Jama River, appear in the alluvial plain areas silt layers with few intercalations of very fine sand, having moderate to high plasticity.
During the Pedernales earthquake of 16 April 2016, cracks in loose soil with a thickness of up to 20 cm are evidenced in the alluvial terrace area, while in other areas of the transitional limits of alluvial plain and terrace were reported lateral displacements with cracks that reached a 30 cm opening in loose soil. One of the most significant damages was the collapse of the CIBV, a nursery for children, located on sandy silty soils in an alluvial plain, where soil liquefaction and cracks of up to 25 cm opening in loose soils considerably deformed the access roads (Figure 3d).
Shrimp farms and their transition to the alluvial plain, where these types of unstable soils presented soil liquefaction and lateral displacements, occupy the intertidal flats to the north of the urban area (Figure 3). The areas most prone to coseismic deformations in the terrain are intertidal, alluvial plains, and ancient floodplains. Mixed construction and reinforced concrete buildings had partial and total damage, both located in areas of lower alluvial terrace in the urban area of Jama (Figure 3f).
In the lateral steps of the bridge over the river Jama, vertical displacements of the metal and concrete structure were evidenced, where the streets were filled with stone materials in order to gain access to the town of Pedernales, due to the emergency of the earthquake and the shipment of humanitarian aid (Figure 3e). In addition, asphalt and reinforced concrete roads had transverse fractures to the axis of the lateral access road to the city of Jama. There, the macroseismic intensity assigned was IX, when applying the environmental intensity scale ESI-2007 [13,18].

3.2. Geological and Geophysical Characterization of the Subsoil

A geological profile (A-B) with a length of 2.8 km, trending NW-SE has been performed for the urban area of the city of Jama, where most of the damage to buildings occurred during the M7.8 Pedernales earthquake in 2016 (Figure 4). The profile is located on alluvial plain deposits in the sedimentary deposition domain of an alluvial valley limited by hillside zones.
The first layer of artificial fill and waste materials is between 1 and 2 metershigh, being attributed to a modern anthropogenic soil. Different Quaternary geological units include the alluvium plain deposits (Qa) with thicknesses ranging between 2 to 4 m, conformed by MH and CL soils of Holocene age. The shear velocity from microtremor ranges from 110 to 150 m/s. The colluvium deposits (Qc) are constituted by ML soils, being of Late Pleistocene age, with thicknesses between 8 and 15 m, and a shear velocity from 200 to 260 m/s. This unit can be divided into two subunits, being more recent colluvial where the N60 reach values of 30, and older and more resistant sediments where the N60 reach values of 50.
The ancient alluvium plain deposits (Qaa) of Holocene to Late Pleistocene ages, are constituted by firm soft soils such as ML, MH and SM, having thicknesses between 6 to 8 m, while their shear velocities ranges from 160 to 210 m/s. In this unit, the rigid silt layer reaches 60 strokes, being the most resistant layer in the entire Middle-Upper Pleistocene sequence.
The loose silty sand layer, being 3 m thick, may indicate a phase of marine transgression. The colluvium alluvium deposits (Qca) of Late Pleistocene age, is between 10 to 25 m thick, with a soil type of MH and OH, while the shear velocity ranges between 130 to 200 m/s. At the base of this unit, a layer of firm to rigid silt may be associated with a progradational deposition being later eroded by the colluvial alluvial deposits. Here is where the number of blows reached values of 10 N60 and shear velocities in the range of 100 to 120 m/s. A layer of peat is differentiated in this geological unit. Finally, the alluvial valley-fill deposits (Qaf) have older soils of Middle Pleistocene age, being originated of probably marine fluvial deposition, of SM and SC type, from moderate dense to dense sand and rigid to hard clay sand, with a thickness between 15 and 40 m and vs. values between 260 and 450 m/s. The number of strokes reached values of 40 N60.
The rocky basement of Miocene age is constituted by siltstones and claystones of the Onzole and Borbon geological formation [82,84], where the shear velocity must be around 680 m/s. Results obtained from active seismic methods indicate that the Miocene rocks are between 40 and 100 m thick, delineating the lithological contact of the cretaceous basaltic basement between 90 and 100 m deep from the surface [77,78,85], and where the Vs reach 2800 m/s. Table 3, lists the characteristics of the geological materials of the six Quaternary units of Jama city and the Onzole, Bobon, and Piñon geological formations.

3.3. Geotechnical Soil Characterization and Liquefaction Susceptibility

The consequences of liquefaction may be very different according to site characteristics and being classified. Furthermore, liquefaction may occur due to cyclical mobility and flow [86]. Cyclic mobility is the phenomenon in which there is a progressive increase in pore pressure until it equals the effective restricting pressure, which means, that there is an accumulation of deformation but it does not fail and what exists is a loss of rigidity. Such a phenomenon is able to cause considerable damage to the structure [87].
The flow failure is generated by a sudden loss of resistance to an increase in pore pressure caused by the undrained stress. Furthermore, there are excessive deformations when considering flow failure, which refers to a loss of resistance in which the mass of soils is required to be subjected to a static shear stress greater than the undrained shear strength. Compared with that of cyclical mobility, the effects of flow failure can be classified as catastrophic [86].
In order for flow liquefaction to occur, the geotechnical criteria of having the soil saturated 100% need to be met. This tends to occur, if there is an undrained load which originates from different sources such as a seismic load from an earthquake of moderate to strong magnitude, or through waves that may be caused by construction systems such as an explosion or vibrations that are used for geotechnical improvement of soils or in the driving of piles that are also sources of waves. Other conditions are that the tendency of the soil during cutting is contractive and that the soil is susceptible to liquefy. These soils may be clean and uniform sands, usually non-plastic silts and, in rare cases, gravels and clays that are also able to liquefy but with little to none catastrophic effects [87].
In the current study, the liquefaction susceptibility was analyzed for soils that reported previously coseismic damage during the 2016 earthquake. The epicenter of the M7.8 earthquake was located some 50 km NE of the city of Jama. Several researchers of earthquake engineering have studied the liquefaction susceptibility of geologic units of recent environmental depositions, proposing criteria for their classification [23,31,37].
According to these guidelines, the Jama urban area is meeting the following criteria: (a) the urban area appears to have been constructed on the geological units such as alluvium plain and ancient floodplains (abandoned terrace) deposits, of Holocene to late Pleistocene age; (b) the groundwater is less than 5 m deep and the peak ground acceleration (PGA) has a 10% probability of being exceeded in 50 years in the range between 0.45 and 0.55 g [46,72,88,89]; (c) evidence of historical liquefaction surely were reported after the 13 May 1942 (M 7.9) and the 16 April 2016 (M7.8) megathrust earthquakes [1,34,35,58]. In liquefaction studies it is important to determine the depth of the potentially liquefiable strata, and of these, which layer may have greater probability of liquefaction [36]. In the current study, the maximum probability will be determined for liquefaction in deep strata.
As a first approach, particular attention is referred to the stratigraphy of the urban area, using a variety of study techniques [41,90,91,92]. Then, the empirical approach of these stratigraphic units are classified as “probably liquefiable”, when the liquid limit is less than 37% and its plasticity index is less than 12% [90], always that the water content is high (wc > 0.8 LL). Consequently, a re-evaluation of the geotechnical parameters from three boreholes was conducted (BH1, BH2 and BH3). The Municipality of Jama, and the University of Los Andes from Colombia and some private soil laboratories supplied the geotechnical data, which have been required to estimate the liquefaction potential according to the proposed methodologies [28,29,41,42] have provided these data [77,78].
Hereby, the majority of the drilling (boreholes) are delineated in the liquefiable area [90]. However, this criterion is not fully compatible with the low plasticity behavior of fine-sized soils of the Jama city, where historical evidence of liquefaction has been documented in the alluvium plain and ancient floodplain deposits. Figure 5 illustrates the results of the liquidity index and the water content of the soil of the city of Jama, used to determine the scale of the natural moisture content of the soil samples with reference to the liquid and plastic limits. Hereby, it provides an indicator of geological history presenting these soils with ultra-sensitive sand deposits.
The analysis for the urban area of the city of Jama demonstrates that there is a deep stratum of late Pleistocene age which may also be potentially liquefiable when the soils meet a saturation close to 100%. The statistical summary of all these geotechnical parameters for the city of Jama is given in Table 4. From the results listed in this table and the particle size distribution results (Figure 5), the following statements may be made: (a) the saturation in alluvium plain deposits is about 95% whilst for the ancient alluvium deposits it is about 85%; (b) the fraction of fines particles (Fc) ranges between 1% and 61% for alluvium plain deposits and from 75% to 97% for the ancient alluvium deposits; (c) the diameters with 50%, D50, is between 0.02 and 0.20 mm for alluvium plain and ancient alluvium; (d) the coefficient of uniformity (CU) lies between 1.7 and 2.1 and the degree of curvature between 0.8 and 2.5 for fine to coarse silt and fine sand according to the soil classification.
The analysis of the previous data indicates that the alluvium plain and ancient floodplain deposits are the liquefiable soils of the area (Figure 4). The distribution of the SPT values in function of depth in the urban area of the city of Jama is illustrated in Figure 5.

4. Results and Discussion

4.1. Evaluation of the Liquefaction Potential

In order to evaluate the earthquake-induced liquefaction potential of the Late Pleistocene - Holocene geological units in the city of Jama, some risk-based methods from an SPT-based simplified procedure and shear wave velocity seismic measurements were considered. These methods were originally developed by Seed and Idriss [28] and updated and modified later [30,93,94]. These deterministic methods comprise the calculation of the safety factor per layer (SF), defined as the ratio between cyclic resistance ratio (CRR) and the cyclic stress ratio (CSR).
F S = C R R C S R
The CRR, according to Youd and Idriss [93] has been calculated by using the following equation:
C R R = 1 34 ( N 1 )   60   +   ( N 1 ) 60 135 + 50 ( 10 × ( N 1 ) 60 + 45 ) 2 1 200
where (N1)60 is influenced by the measured standard penetration resistance N, relative to the overburden pressure factor (Cn), the correction for hammer energy ratio (ER) Ce, the correction for borehole diameter Cb, the correction factor for rod length Cr, and the correction for samplers with or without liners Cs. The Cn was calculated according to the equation proposed by Liao and Whitman [95], Cn = (Pa/σ’v)0.5 in function with (Pa) (atmospheric pressure) and the σ’v (effective vertical stress). This has been followed by the application of a “fine content” correction to the calculated N1(60) value in order to obtain a clean-sand-equivalent value N1(60) Cs given by the equations proposed by Youd et al. [94] as illustrated in Figure 5.
The CSR defines the seismic demand and is expressed as:
C S R = 0.65   ( a m a x ( g )   ) ( σ v σ v ) ( r d ) M S F
where σv is the total vertical stress at depth z, σ’v is the effective vertical stress at the same depth, amax is the peak horizontal ground acceleration, (g) is the acceleration due to gravity, and rd is the stress reduction factor. In this study, the term “rd” was estimated using the Liao and Whitman [95] equation:
rd = 1.0 0.00765 Z , Z 9.15   m
rd = 1.174 0.0267 Z , 9.15   m   Z     23   m
Then, the CSR values have been divided by the magnitude scaling factor (MSF), which is calculated by the following equation, Youd et al. [94]:
MSF = ( M / 7.5 ) 2.56
Furthermore, Chen and Juang [41] developed a simplified equation for CRR based on their neural network analysis of field observations:
CRR 7.5 = 0.241 { exp [ ( 0.032 + 0.004 FCI ) ( N 1 ) 60 ] } 0.182
where FCI is an index of fines content (FC) defined as follows: FCI = 1 for FC <5%, FCI = 2 for 5% < FC < 12%, FCI = 3 for 12% < FC < 35%, and FCI = 4 for FC >35%. The use of the ordinal scale to characterize the effect of fines content is consistent with current geotechnical knowledge (Chen and Juang [41]). The values of CSR and CRR will result in the estimation of the safety factor (SF). The results of the safety factor (SF), for the different geological units in the city of Jama are illustrated in Table 4. All the soil layers with a safety factor higher than 1.25 are considered as non-liquefiable soil layer according to Seed and Idriss [91]. Below the suggested value of 1.25, the soil layer has been considered to be prone to experiment liquefaction, when complying the liquefaction susceptibility criteria suggested by Chen and Juang [41] and Juang et al. [92].

4.2. Liquefaction Potential Mapping

Although the available stratigraphic information reaches 35 m of depth, the recorded coseismic deformations in the soils of Jama are less than 20 m deep. Therefore, a depth of 20 m has been considered for the liquefaction potential assessment. The liquefaction potential index (LPI) has been calculated in the urban area of Jama using the equation defined by Iwasaki [96] as:
L P I = 0 Z F ( z ) W ( z ) d z
where z is the depth below the ground surface in meters and is calculated as w(z) = 10–0.5z; F(z) is a function of the safety factor and the liquefaction factor, SF, where F(z) = 1-SF when SF < 1 and if SF > 1 than F(z) = 0. Iwasaki [96] calibrated the severity of liquefaction induced damages as, LPI = 0 as not prone to liquefaction and 0 < LPI < 2, 2 < LPI < 5, 5 < LPI < 15, and LPI ˃ 15 as low, moderate, high, and very high susceptibility to liquefaction, respectively.
The probability of liquefaction was calculated for all the boreholes using the logistic regression proposed by Chen and Juang [41] and by Juang et al. [92]:
Liquefaction probability = 1 1 + ( F s 0.96 ) 4.5
The results of the liquefaction probability for the different boreholes are listed in Table 4 and in Figure 5. The results indicated that in the urban area of Jama city there is a high probability that “almost certain” soil liquefaction will occur in the Holocene sedimentary layers according to the method proposed by Iwasaki [96]. Furthermore, there are very likely sectors where no soil liquefaction will occur.
The liquefaction susceptibility of the urban area of the city of Jama was calculated considering the data of the previous section. This result delineates the areas according to their probability of liquefaction. The liquefaction probability mapping of the area of study is obtained by interpolation of the liquefaction potential index (LPI) obtained for each borehole, and processed with the Arc-Map GIS and Surfer. The coseismic liquefaction evidences of the Pedernales earthquake (M7.8) are confronted with the results of the LPI data [96].
Regarding the geological section, the recent alluvium plain and ancient floodplain deposits have (referring to the location of BH-01) a very high probability of liquefaction up to 15 m depth (0.85 ≤ PL ≤ 1.00; 0.653 ≥ SF > 0.000). In the interface zone with the ancient alluvial plain deposits, the probability of liquefaction is moderate with up to 23 m depth (0.35 ≤ PL ≤ 0.65; 1.102 ≥ SF > 0.837), while beyond that depth, the ancient colluvium alluvium deposits, the probability of liquefaction is zero (0.00 ≤ PL ≤ 0.15; ∞ ≥ SF > 1.411).
In the central park of Jama (referred to the location of drilling BH-02), the lithological units of ancient floodplain and abandoned floodplain (terrace) deposits have greater thicknesses, as paleo-channels are evidenced in seismic refraction profiles. Recent alluvium plain deposits have a very high probability of liquefaction up to 6 m depth, leveed channels of silty sand one meter high have a big probability of liquefaction (0.65 ≤ PL ≤ 0.85; 0.837 ≥ SF > 0.653). The sedimentary depositions of greater thickness in paleo-channels are filled by ancient floodplain deposits. In this unit the probability of liquefaction is moderated, up to 25 m of depth, while beyond that depth the sediments are classified as very rigid to hard clay sands, having zero probability of liquefaction.
The colluvial soils have thicknesses between 8 and 15 m, while underlying this lithological unit occur ancient alluvial plain deposits (referring to its location to well BH-03). In these two units the probability of liquefaction is high to very high, within a depth of 23 m depth. Beyond that depth of up to 30 m, ancient colluvium alluvium deposits, from firm to rigid silt, have a low probability of liquefaction (0.15 ≤ PL ≤ 0.35; 1.411 ≥ SF > 1.102). The probability of liquefaction of soil strata and safety factors have been interpreted based on the classification proposed by Chen and Juang [41].
These results revealed that the urban area of Jama presents soils with high liquefaction probability. The liquefaction probability (PL) are delineated for those recent sedimentary depositions like alluvium plain, ancient floodplain and abandoned floodplain deposits of late Pleistocene–Holocene age, where the geological and hydrological conditions are favorable for ground-coseismic liquefaction (Table 4; Figure 5).

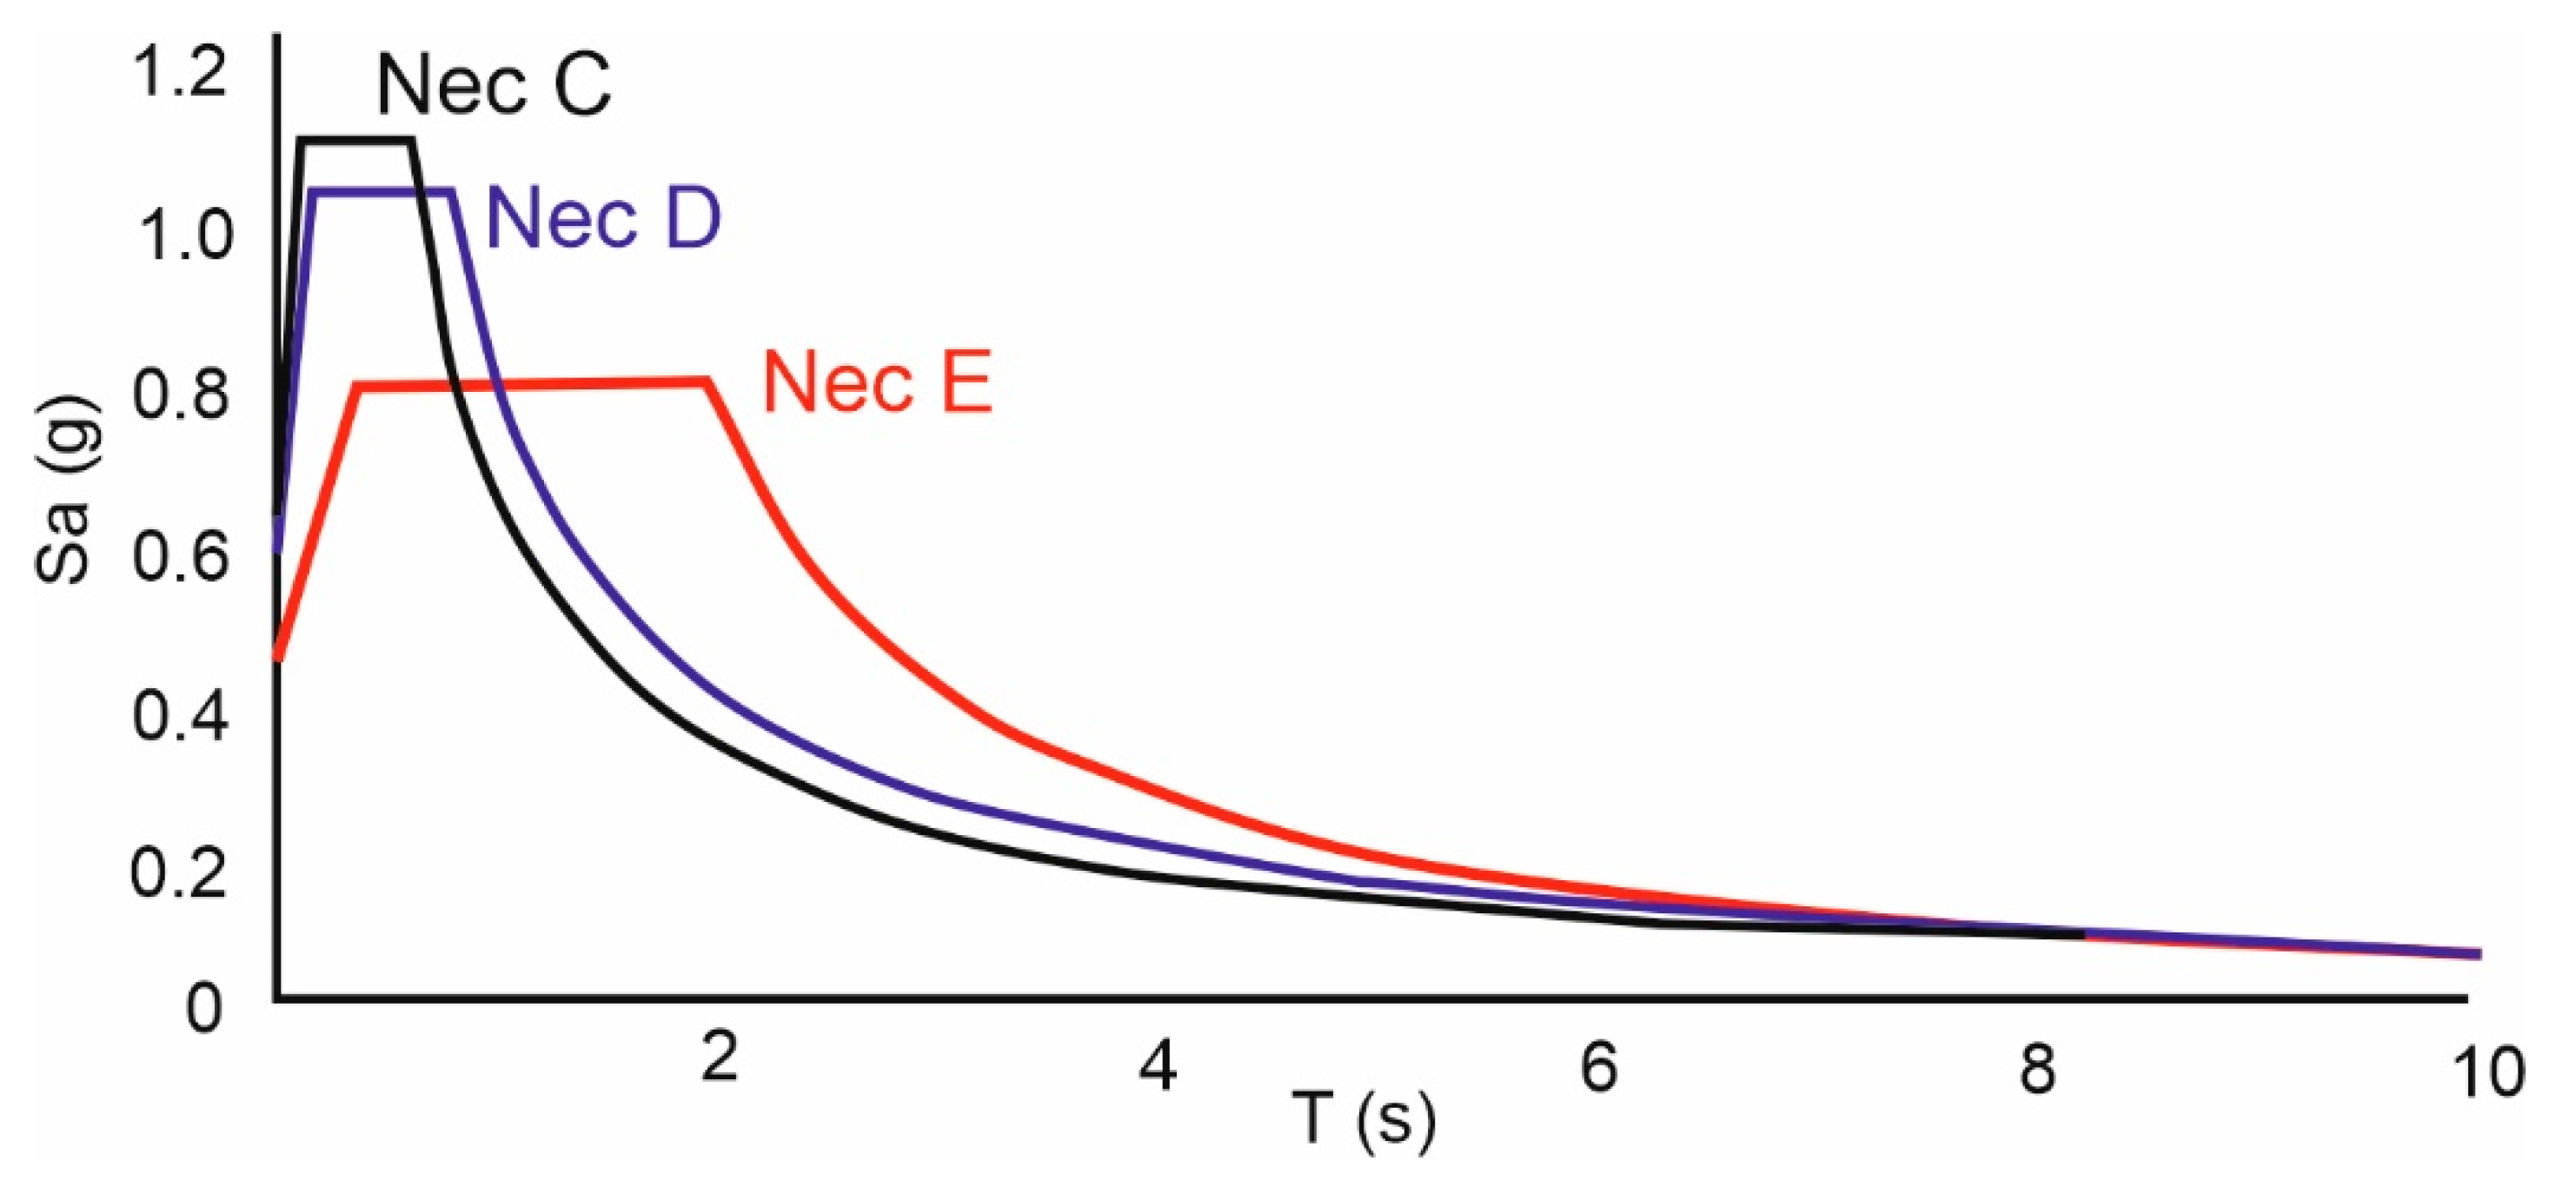
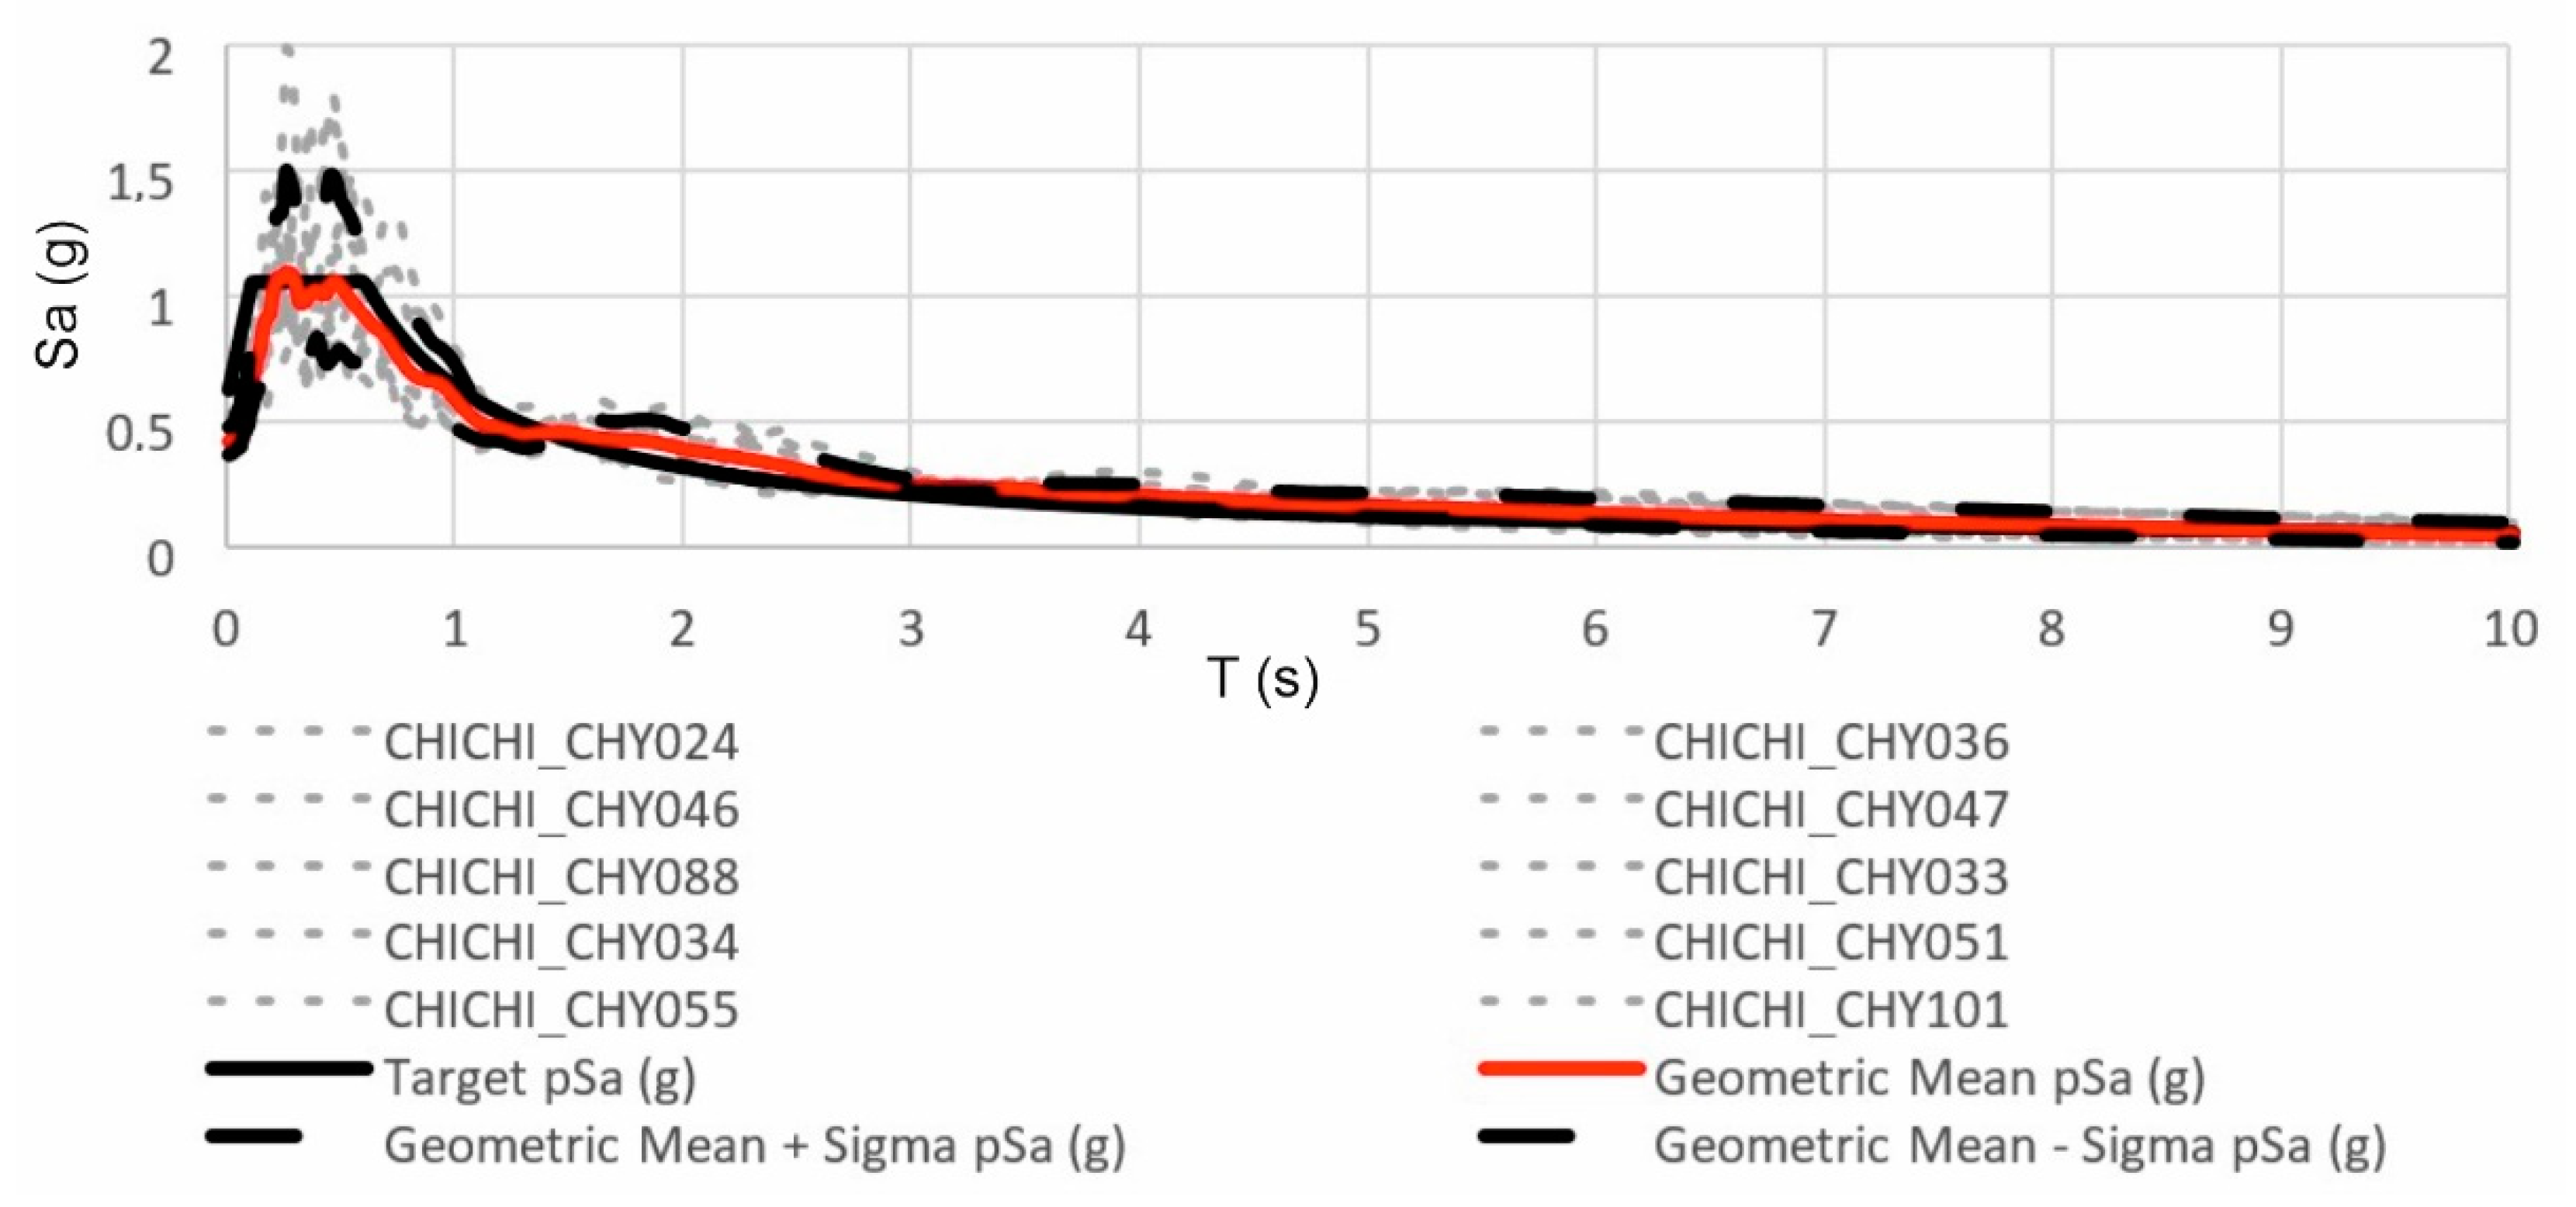
4.3. Site Response Analysis

The city of Jama is located in zone VI, indicating a high seismic level with a factor of 0.5 g, with a 10% exceedance in 50 years and a return period of 475 years (NEC-11, [46]). The V S 30 seismic data were obtained from downhole geophysical tests, indicating a better contrast in the stratigraphy of the alluvial and alluvial-colluvial soils of Jama. For colluvial soils, up to a depth of 15 m, shear wave velocities higher than 300 m/s were measured, while moving further below to older colluvium alluvium and alluvial valley deposits of medium consistency, where the soil velocity reached 440 m/s. Shear wave velocity is the most important variable when establishing how the ground will behave in the event of seismic excitation. Therefore, it is vital to have extensive information and knowledge of the shear wave velocity profiles for the different perforations.
With these geotechnical characteristics and corroborating the technical specifications of the NEC-11 [46], the soils of Jama are classified as geotechnical Type D. For recent alluvial and floodplain soils, there are granular levels between 10 and 15 m of depth, then up to 28 m their velocities are reduced to 120 m/s. In this interval, sediments of medium consistency begin with shear wave velocities up to 320 m/s. The geotechnical classification for this soil is type E (NEC-11 [46]).
Furthermore, the seismic zone factor Z has been obtained for more resistant soils (greater than 30 m in depth), designating the C profile for the geological units of ancient colluvium alluvium and alluvial valley fill deposits. These units meet the velocity criteria according to NEC-11, with values that fluctuate between 760 ≥ vs. ≥ 360 m/s, and the considerations of the soil amplification coefficients Fa, Fd , and SF reflect a layer with characteristics of dense to very dense non cohesive soil. With these, an elastic response spectrum of accelerations Sa is determined, expressed as a fraction of gravity for the different types of sedimentary units in the city of Jama (Figures S6–S10; Supplementary Materials).
The active seismic data allowed to estimate the soil/rock contact for Quaternary deposits, in a depth between 50 to 55 m, and for colluvial soils, in a depth between 8 and 15 m. The predominant rocks in the area are claystones from the Onzole formation of Tertiary age, below the volcanic basement of Cretaceous basalts of the Piñon formation [82,97].

4.4. Selection of Earthquakes with Compressive Tectonic Settings

For this earthquake analysis, ten earthquakes with similar tectonic characteristics have been selected for the Jama canton, central region of Manabí. Therefore, the PEER ground motion database was used, in which the period coordinates and spectral accelerations were entered as target spectrum, of the NEC-11 [46] spectrum (Figure 6), for soil types C (dense soil or soft rock). The Chi Chi earthquake in Taiwan of M 7.6, associated with a seismogenic structure with inverse tectonic stresses, and a rupture surface of 80 km [98], has been selected for our site response analysis, considering ten seismic records with different horizontal components. The seismic traces for the vertical components have not been considered in this study, due to its low probability of significant earthquake environmental effects. Subsequently, a calibration of the scale factors was performed for the selected earthquakes, maintaining at all times a scale factor of 1 to 3, for a return period (Tr) of 475 years, indicating the seismological characteristics of the scaled movements (Figure 7).
The seismogenic structures allow an estimation of the maximum magnitudes and accelerations as expected in rocks [99,100,101]. Hence, the prediction of the movement in the ground under the action of a seismic event is typically obtained by a one-dimensional site response analysis. This analysis is usually performed using equivalent linear models since it requires direct properties of the soils and a simple computational calculation. One of the most well-known and calibrated linear equivalent models is implemented in the software of Deepsoil [44], which calculates the response of a system of homogeneous, viscoelastic layers of an infinite horizontal limit, subjected to a motion of the shear wave traveling vertically.
The non-linearity of the soil is represented by the use of the equivalent linear soil properties through an iterative process. In the Linear Equivalent model process a rock outcrop motion, typically a recorded motion at the surface, is taken and converted into an “internal rock motion”. This “internal” rock movement is then converted from the time domain that is, a temporal evolution of accelerations, to the frequency domain, while adding harmonic waves of different frequencies, where each has its own amplitude. However, under a compatible base rock condition, where the impedance ratio is not infinite, an “internal” rock movement can be affected by the impedance ratio of the rock-soil interface, the mass of the soil deposit and its response characteristics, such as the characteristic period [102].
The appropriate shear modulus and damping value, which are dependent on deformations, are set for each layer during each iteration. When convergence is reached, the problem turns to a viscoelastic material with constant properties. With these constant shear modulus, damping, and unit weight values for each layer, the wave equation can be solved using a complex stiffness response method. A transfer function based on this model is calculated to relate the movement at the base level, that is, internal rock movement, to the movement at the ground surface.
Regarding the stress-strain cyclical hysterical behavior of the models, these can be validated with laboratory curves available in the literature, in this specific case [103], were used for the fine fraction and [28] for the coarse fraction, which provides the degradation curves of the shear modulus G/Gmax (-) and the % damping ratio are obtained with the program of Deepsoil V7.
The geometric mean of the spectra of elastic acceleration responses obtained for the horizontal components of the earthquakes compatible for the Profile D and E soils are presented. With return periods of 475 years for the Equivalent linear analysis for these spectra has been considered a structural damping equal to 5%. The inclusion of the geometric mean of the selected records allowed us to appreciate the amplification that occurs due to the diverse depositional environmental strata found at the site (Figure 8). For the units of colluvial sediments (referred to BH-03), spectral acceleration of 1.68 g was obtained for a period between 0.5 s and 0.7 s, while for the recent alluvial and floodplain sediments (referred to BH-01), a peak acceleration of 1.04 g was obtained for periods between 0.87 s and 1.11 s.
Finally, for the ancient alluvial and abandoned flooplain sediments (referred to BH-02, central park of Jama) yielded an acceleration of 1.03 g as obtained for periods between 1.3 and 1.5 s. In this context, the thickness of Quaternary deposits has a direct impact on the fundamental vibration period of the deposit, and therefore on the shape and the expected spectral amplification, being a variable that generates high sensitivity.
Therefore, we may conclude that the spectra obtained on the surface are greater than those of the acceleration plateau of the Ecuadorian Construction Regulations (NEC-11, [46]). Additional graphs were obtained, where the response spectra at the top of the rock is compared with the spectra of the soil profiles. Graphs were generated demonstrating the response comparison both on the surface and on the rock for the three boreholes.
The results highlighted the importance of geotechnical assessments of particular geological environments which have sediments prone to liquefaction. This tool provides a better understanding of how the constructions and buildings could be affected by an earthquake of high magnitude depending on the type of soil. This was a non-existing tool that could help engineers to improve urban area planification or buildings stabilization to lessen the severity on earthquake’s effects in the city of Jama and other areas with similar geological conditions. It is important to mention that the areas displayed in the liquefaction hazard map were contrasted with the on-site data collected after the Pedernales earthquake.
Furthermore, the elastic design spectra were analyzed for a return period of 475 years, considering a level of structural damping equal to 5% and corresponding to an on-site response, that is, the interaction between soil and soil has not been considered foundation of the structure. For the structural calculation, it would be recommended to use an envelope of the spectra obtained in each of the analysis. Site response analysis was performed using the linear equivalent method and in terms of effective vertical stress.

5. Conclusions

The city of Jama is located in a high sesmicity area, having rock accelerations, PGA-rock of 0.5 g and its ground amplification can be in the range of 1.05 and 1.68 g.
The obtained results based on the liquefaction potential assessment method demonstrated that the main urban area of Jama exhibits a high liquefaction potential and thereby a very high probability of liquefaction up to 15 m depth, when considering a maximum acceleration of 0.5 g.
It was also evidenced that the shear wave velocity is the variable with the greatest weight when establishing how the soil is going to behave due to seismic excitation. Thus, for colluvial soils there are higher spectral amplifications of 1.68 g with periods between 0.5 and 0.7 s. Therefore, the obtained results indicate that soil deposits tend to have important degradations at high acceleration levels.
As the intensity level of the input signal increases, the maximum spectral amplification peaks will be at higher structural periods and will have amplitudes lower due to the increased hysteretic damping of the soil. Thus, by presenting low wave velocity and clay soils with high plasticity soil profiles, a very high loss of shear stiffness will be common due to the deformations imposed by the input signals.

Supplementary Materials

The following are available online at https://0-www-mdpi-com.brum.beds.ac.uk/2076-3263/11/1/20/s1, Figure S1: SPT test results vs. depth. Figure S2: Results of the liquefaction potential index (LPI). Figure S3: Fine content. Figure S4: Plastic Index. Figure S5: LSN chart. Figure S6: Records time-history and dynamic parameters of one of the earthquakes considered for the analysis corresponding to 475 years of return period (PEER, Center for the Development of Seismic Engineering of the Pacific). Figure S7: Dynamic parameters of one of the earthquakes considered for the analysis corresponding to 475 years of return period (PEER, Center for the Development of Seismic Engineering of the Pacific). Figure S8: Comparison of acceleration spectra for the 5% structural damping for the horizontal components of the 10 earthquakes for coluvial deposits (ie. BH-03). Figure S9: Comparison of acceleration spectra for the 5% structural damping for the horizontal components of the 10 earthquakes for alluvial soils (ie, BH-01). Figure S10: Comparison of acceleration spectra for the 5% structural damping for the horizontal components of the 10 earthquakes for abandonated flooplain deposits (ie. BH-02). Figure S11: Rock response spectrum for JA-BH-03 and comparison with NEC C spectrum. Figure S12: Rock response spectrum for BH-01 and comparison with NEC C spectrum. Figure S13: Rock response spectrum for BH-02 and comparison with NEC C spectrum. Figure S14: Rock response spectrum for BH-03 and comparison with NEC D spectrum. Figure S15: Rock response spectrum for BH-01 and comparison with NEC E spectrum. Figure S16: Rock response spectrum for BH-02 and comparison with NEC E spectrum.

Author Contributions

D.A.-C. and E.O.-H. designed the study. E.V.-E. and T.T. analysed the geomorphologic features and liquefaction probability, D.A.-C. and D.D.-T. processed and analysed the site seismic response. K.C., T.T. and A.M.-D. prepared the manuscript with advice and feedback from all team members. All authors have read and agreed to the published version of the manuscript.

Funding

This research received no external funding.

Acknowledgments

We would like to acknowledge the editorial handling by Mayes Nie and Hans-Balder Havenith, as well as to two anonymous reviewers, who all allowed us to improve our manuscript considerably. This work was supported by the Geohazard Research Group of the Universidad Técnica de Manabí (UTM).

Conflicts of Interest

The authors wish to confirm that there are no known conflicts of interests associated with this publication. This research did not receive any specific grant from funding agencies in the public, commercial, or not-for-profit sectors.

Data and Resources

Seismicity and macroseismic data were collected from IGEPN (http://www.igepn.edu.ec/servicios/eq20160416, last accessed in June 2020), USGS (http://earthquake.usgs.gov/earthquakes/eventpage/us20005j32#dyfi, last accessed in May 2019) and the Geological Survey of Colombia (http://studylib.es/doc/6527439/informe-del-sismo-del-16-de-abril-de-2016-en, last accessed in June 2020). PEER Ground Motion Database (Earthquake records from PEER NGA strong motion database, https://ngawest2.berkeley.edu/, last accessed in September 2020). The DTM used for analysis is the NASA SRTM 3.0 global model, 1 arc second resolution: https://lpdaac.usgs.gov/news/nasa-shuttle-radar-topography-mission-srtm-version-30-srtm-plus-product-release/ (last accessed on 22 August 2020). Some of the figures were realized using Qgis and Arcmap® software.

References

  1. Swenson, J.L.; Beck, S.L. Historical 1942 Ecuador and 1942 Peru subduction earthquakes and earthquake cycles along Colombia-Ecuador and Peru subduction segments. Pure Appl. Geophys. 1996, 146, 67–101. [Google Scholar] [CrossRef]
  2. Obermeier, S.F. Use of Liquefaction-Induced Features for Paleo Seismic Analysis—An Overview of How Seismic Liquefaction Features Can Be Distinguished from Other Features and How Their Origin Can Be Used to Infer the Location and Strength of Holocene Paleo-Earthquakes. Eng. Geol. 1996, 44, 1–76. [Google Scholar] [CrossRef]
  3. Egred, J. Catálogo de Terremotos del Ecuador 1541–2009; Internal Report; Escuela Politecnica Nacional, Instituto Geofisico: Quito, Ecuador, 2009. [Google Scholar]
  4. Toulkeridis, T. Unexpected results of a seismic hazard evaluation applied to a modern hydroelectric plant in central Ecuador. J. Struct. Eng. 2016, 43, 373–380. [Google Scholar]
  5. Aguiar, R.; Mieles Bravo, Y. Análisis de los edificios que colapsaron en Portoviejo durante el terremoto del 16 de abril de 2016. Rev. Int. Ing. Estruct. 2016, 21, 257–282. [Google Scholar]
  6. Chunga, K.; Toulkeridis, T.; Vera-Grunauer, X.; Gutierrez, M.; Cahuana, N.; Alvarez, A. A review of earthquakes and tsunami records and characterization of capable faults on the northwestern coast of Ecuador. J. Sci. Tsunami Hazards 2017, 36, 100–127. [Google Scholar]
  7. Moncayo Theurer, M.; Velasco, G.; Mora Carlos Montenegro, M.; Cordova, J. Terremotos Mayores a 6.5 en Escala Richter Ocurridos en Ecuador Desde 1900 Hasta 1970. Ingeniería, 21. 2017. Available online: http://www.redalyc.org/articulo.oa?id=46753192005> (accessed on 1 October 2020).
  8. Navas, L.; Caiza, P.; Toulkeridis, T. An evaluated comparison between the molecule and steel framing construction systems—Implications for the seismic vulnerable Ecuador. Malays. Constr. Res. J. 2018, 26, 87–109. [Google Scholar]
  9. Cando-Jácome, M.; Martínez-Graña, A. Differential interferometry, structural lineaments and terrain deformation analysis applied in Zero Zone 2016 Earthquake (Manta, Ecuador). Environ. Earth Sci. 2019, 78, 499. [Google Scholar] [CrossRef]
  10. Serva, L. History of the Environmental Seismic Intensity Scale ESI-07. Geosciences 2019, 9, 210. [Google Scholar] [CrossRef] [Green Version]
  11. Vera-Grunauer, X.; Lopez-Zhindon, S.; Ordoñez-Rendon, J.; Chavez-Abril, M.A. Liquefaction case histories after the 2016 megathrust Pedernales earthquake in Ecuador. In Earthquake Geotechnical Engineering for Protection and Development of Environment and Constructions; Silvestri, F., Moraci, N., Eds.; Associazione Geotecnica Italiana: Rome, Italy, 2019; ISBN 978-0-367-14328-2. [Google Scholar]
  12. Giesecke, A.; Capera, A.G.; Leschiutta, I.; Migliorini, E.; Valverde, L.R. The CERESIS earthquake catalogue and database of the Andean Region: Background, characteristics and examples of use. Ann. Geophys. 2004, 47, 2–3. [Google Scholar]
  13. Michetti, A.M.; Esposito, E.; Guerrieri, L.; Porfido, S.; Serva, L.; Tatevossian, R.; Vittori, E.; Audemard, F.; Azuma, T.; Clague, J.; et al. Environmental Seismic Intensity Scale 2007—ESI 2007, Memorie Descrittive della Carta Geologica d’Italia; Servizio Geologico d’Italia—Dipartimento Difesa del Suolo, APAT: Rome, Italy, 2007; Volume 74, pp. 7–54. Available online: http://www.isprambiente.gov.it/en/publications/technical-periodicals/descriptive-memories-of-the-geological-map-of/intensity-scale-esi-2007?set_language=en (accessed on 1 August 2020).
  14. Berzhinskii, Y.A.; Ordynskaya, A.P.; Gladkov, A.S.; Lunina, O.V.; Berzhinskaya, L.P.; Radziminovich, N.A.; Radziminovich, Y.B.; Imayev, V.S.; Chipizubov, A.V.; Smekalin, O.P. Application of the ESI-2007 scale for estimating the intensity of the Kultuk earthquake, August 27, 2008 (south Baikal). Seism. Instrum. 2010, 46, 307–324. [Google Scholar] [CrossRef]
  15. Kelson, K.; Witter, R.C.; Tassara, A.; Ryder, I.; Ledezma, C.; Montalva, G.; Frost, D.; Sitar, N.; Moss, R.; Johnson, L. Coseismic tectonic surface deformation during the 2010 Maule, Chile, M 8.8 earthquake. Earthq. Spectra 2012, 28, S39–S54. [Google Scholar] [CrossRef]
  16. Wartman, J.; Dunham, L.; Tiwari, B.; Pradel, D. Landslides in Eastern Honshu induced by the 2011 off the Pacific Coast of Tohoku earthquake. Bull. Seismol. Soc. Am. 2013, 103, 1503–1521. [Google Scholar] [CrossRef]
  17. Serva, L.; Vittori, E.; Comerci, V.; Esposito, E.; Guerrieri, L.; Michetti, A.M.; Mohammadioun, B.; Mohammadioun, G.C.; Porfido, S.; Tatevossian, R.E. Earthquake Hazard and the Environmental Seismic Intensity (ESI) Scale. Pure Appl. Geophys. 2016, 173, 1479–1515. [Google Scholar] [CrossRef]
  18. Chunga, K.; Livio, F.; Mulas, M.; Ochoa-Cornejo Besenzon, D.; Ferrario, M.; Michetti, A.M. Earthquake ground effects and intensity of the 16 April 2016, Mw 7.8 Pedernales Earthquake (Ecuador): Implications for the source characterization of large subduction earthquakes. Bull. Seismol. Soc. Am. 2018, 108, 3384–3397. [Google Scholar] [CrossRef]
  19. Xu, C.; Ma, S.; Tan, Z.; Chao Xie, I.; Shinji, T.; Xueqiang, H. Landslides triggered by the 2016 Mj 7.3 Kumamoto, Japan, earthquake. Landslides 2018, 15, 551. [Google Scholar] [CrossRef]
  20. Mato, F.; Toulkeridis, T. An unsupervised K-means based clustering method for geophysical post-earthquake diagnosis. In Proceedings of the 2017 IEEE Symposium Series on Computational Intelligence (SSCI), Honolulu, HI, USA, 27 November–1 December 2017; pp. 1–8. [Google Scholar]
  21. Serey, A.; Piñero-Feliciangeli, L.; Sepúlveda, S.A.; Iveda, F.; Poblete, D.; Petley, I.; Murphy, W. Landslides induced by the 2010 Chile megathrust earthquake: A comprehensive inventory and correlations with geological and seismic factors. Landslides 2019, 16, 1153. [Google Scholar] [CrossRef]
  22. Dakshanamurthy, V. A simple method of identifying an expansive soil. Soils Found 1973, 13, 97–104. [Google Scholar] [CrossRef] [Green Version]
  23. CDMG. Guidelines for Analyzing and Mitigating Liquefaction Hazards; California Department Conservation, Division of Mines, Special Publication: Canonsburg, PA, USA, 1999; Volume 117, p. 63. [Google Scholar]
  24. Sana, H.; Nath, S.K. Liquefaction potential analysis of the Kashmir valley alluvium, NW Himalaya. Soil Dyn. Earthq. Eng. 2016, 85, 11–18. [Google Scholar] [CrossRef]
  25. Bahadori, H.; Hasheminezhad, A.; Karimi, A. Development of an integrated model for seismic vulnerability assessment of residential buildings: Application to Mahabad City, Iran. J. Build. Eng. 2017, 12, 118–131. [Google Scholar] [CrossRef]
  26. Cando-Jácome, M.; Martínez-Graña, A.; Chunga, K.; Ortíz-Hernández, E. Satellite radar interferometry for assessing coseismic liquefaction in Portoviejo city, induced by the M 7.8 2016 Pedernales, Ecuador Earthquake. Environ. Earth Sci. 2020, 79, 467. [Google Scholar] [CrossRef]
  27. Hazen, A. Hydraulic-fill dams. Trans. Am. Soc. Civ. Eng. 1919, 83, 1713–1745. [Google Scholar]
  28. Seed, H.B.; Idriss, I.M. Simplified procedure for evaluating soil liquefaction potential. J. Soil Mech. Found Div. ASCE 1971, 97, 1249–1273. [Google Scholar]
  29. Wang, W. Some Findings in Soil Liquefaction; Water Conservancy and Hydro-Electric Power Scientific Research Institute: Beijing, China, 1979; pp. 1–17. [Google Scholar]
  30. Seed, H.B.; Tokimatsu, K.; Harder, L.F.; Chung, R.M. The influence of SPT procedures in soil liquefaction resistance evaluations. J. Geotech. Eng. Div. ASCE 1985, 111, 1425–1445. [Google Scholar] [CrossRef]
  31. Wakamatsu, K. Evaluation of liquefaction susceptibility based on detailed geomorphological classification. In Proceedings of the Annual Meeting of Architectural Institute of Japan, Tokyo, Japan, 12–13 December 1992; pp. 1443–1444. (In Japanese). [Google Scholar]
  32. Bray, J.D.; Luque, R. Seismic performance of a building affected by moderate liquefaction during the Christchurch earthquake. Soil Dyn. Earthq. Eng. 2017, 102, 99–111. [Google Scholar] [CrossRef]
  33. Mendoza, C.; Dewey, J.W. Seismicity associated with the great Colombia–Ecuador earthquakes of 1942, 1958, and 1979: Implications for barrier models of earthquake rupture. Bull. Seismol. Soc. Am. 1984, 74, 577–593. [Google Scholar]
  34. Ye, L.; Kanamori, H.; Avouac, J.P.; Li, L.; Cheung, K.F.; Lay, T. The 16 April 2016, M 7.8 (Ms 7.5) Ecuador earthquake: A quasi-repeat of the 1942 M S 7.5 earthquake and partial re-rupture of the 1906 Ms 8.6 Colombia–Ecuador earthquake. Earth Planet. Sci. Lett. 2016, 454, 248–258. [Google Scholar]
  35. Chunga, K.; Livio, F.A.; Martillo, C.; Lara-Saavedra, H.; Ferrario, M.F.; Zevallos, I.; Michetti, A.M. Landslides Triggered by the 2016 M 7.8 Pedernales, Ecuador Earthquake: Correlations with ESI-07 Intensity, Lithology, Slope and PGA-h. Geosciences 2019, 9, 371. [Google Scholar] [CrossRef] [Green Version]
  36. Salocchi, A.C.; Minarelli, L.; Lugli, S.; Amoroso, S.; Rollins, K.M.; Fontana, D. Liquefaction source layer for sand blows induced by the 2016 megathrust earthquake (M 7.8) in Ecuador (Boca de Briceño). J. S. Am. Earth Sci. 2020, 103. [Google Scholar] [CrossRef]
  37. Youd, T.L.; Perkins, D.H. Mapping liquefaction-induced ground failure potential. J. Geotech. Eng. Div. ASCE 1978, 104, 433–446. [Google Scholar]
  38. Lombardi, D.; Bhattacharya, S. Liquefaction of soil in the Emilia-Romagna region after the 2012 Northern Italy earthquake sequence. Nat. Hazards 2014, 73, 1749–1770. [Google Scholar] [CrossRef]
  39. Bahadori, H.; Hasheminezhad, A. Standard Penetration Test-Based Assessment of Seismic Soil Liquefaction Potential of Urmia, Iran. 2016. Available online: https://www.issmge.org/uploads/publications/25/26/ISC5_078.pdf (accessed on 1 June 2020).
  40. Bourenane, H.; Bouhadad, Y.; Tas, M. Liquefaction hazard mapping in the city of Boumerdès, Northern Algeria. Bull. Eng. Geol. Environ. 2018, 77, 1473–1489. [Google Scholar] [CrossRef] [Green Version]
  41. Chen, C.J.; Juang, C.H. Calibration of SPT-and CPT-based liquefaction evaluation methods. In Innovation sand Application Sin Geotechnical Site Characterization; Mayne, P.W., Hryciw, R., Eds.; Geotechnical Special Publication: Reston, VA, USA, 2000; Volume 97, pp. 49–64. [Google Scholar]
  42. Juang, C.H.; Chen, C.J.; Jiang, T.; Andrus, R.D. Risk-based liquefaction potential evaluation using standard penetration tests. Can. Geotech. J. 2000, 37, 1195–1208. [Google Scholar] [CrossRef]
  43. Goharzay, M.; Noorzad, A.; Ahmadreza Mahboubi, A.; Mostafa, J. A worldwide SPT-based soil liquefaction triggering analysis utilizing gene expression programming and Bayesian probabilistic method. J. Rock Mech. Geotech. Eng. 2017, 9, 683–693. [Google Scholar] [CrossRef]
  44. Hashash, Y.M.A.; Musgrove, M.I.; Harmon, J.A.; Groholski, D.R.; Phillips, C.A.; Park, D. DEEPSOIL 6.1, User Manual; Board of Trustees of University of Illinois at Urbana-Champaign: Urbana, IL, USA, 2016. [Google Scholar]
  45. Lai, C.G.; Bozzoni, F.; Conca, D.; Famà, A.; Özcebe, A.; Zuccolo, E.; Meisina, C.; Bonì, R.; Bordoni, M.; Cosentini, R.M.; et al. Technical guidelines for the assessment of earthquake induced liquefaction hazard at urban scale. Bull. Earthq. Eng. 2020. [Google Scholar] [CrossRef]
  46. NEC-11. Norma Ecuatoriana de la Construcción. Registro Oficial No. 413 del 10 de Enero de 2015. Available online: http://www.normaconstruccion.ec/ (accessed on 11 August 2020).
  47. Chunga, K. Shallow Crustal Earthquakes and Seismic Zonation for Ecuador through the Integration of Geological, Seismological and Morphostructural Data. Ph.D. Thesis, University of Insubria, Varese, Italy, 2010; p. 165. (In Italian). [Google Scholar]
  48. Béjar-Pizarro, M.; Álvarez, G.J.; Staller, A.; Luna, M.; Pérez-López, R.; Monserrat, O.; Chunga, K. InSAR-Based Mapping to Support Decision-Making after an Earthquake. Remote Sens. 2018, 10, 899. [Google Scholar] [CrossRef] [Green Version]
  49. Pennington, W.D. Subduction of the eastern Panama Basin and seismotectonics of northwestern South America. J. Geophys. Res. B Solid Earth Planets 1981, 86, 10753–10770. [Google Scholar] [CrossRef]
  50. Hey, R. Tectonic evolution of the Cocos-Nazca spreading center. Geol. Soc. Am. Bull. 1977, 88, i–vi. [Google Scholar] [CrossRef]
  51. Gutscher, M.A.; Malavieille, J.S.L.; Collot, J.-Y. Tectonic segmentation of the North Andean margin: Impact of the Carnegie ridge collision. Earth Planet. Sci. Lett. 1999, 168, 255–270. [Google Scholar] [CrossRef]
  52. Aguiar, R.; Castro, C.; Garzón, C.; Yanchatuña, W.; Cumbal, L.; la Fave, J. Magnitud máxima en zonas fuentes para estudios de peligrosidad sísmica del Ecuador. Rev. Cienc. ESPE Univ. Fuerzas Armadas 2009, 12, 109–121. [Google Scholar]
  53. Veloza, G.; Styron, R.; Taylor, M.; Mora, A. Open-source archive of active faults for northwest South America. GSA Today 2012, 22, 4–10. [Google Scholar]
  54. White, S.M.; Trenkamp, R.; Kellogg, J.N. Recent crustal deformation and the earthquake cycle along the Ecuador–Colombia subduction zone. Earth Planet. Sci. Lett. 2003, 216, 231–242. [Google Scholar] [CrossRef]
  55. Chlieh, M.; Mothes, P.A.; Nocquet, J.-M.; Jarrin, P.; Charvis, P.; Cisneros, D.; Font, Y.; Collot, J.-Y.; Villegas-Lanza, J.-C.; Rolandone, F.; et al. Distribution of discrete seismic asperities and aseismic slip along the Ecuadorian megathrust. Earth Planet. Sci. Lett. 2014, 400, 292–301. [Google Scholar] [CrossRef]
  56. Nocquet, J.M.; Jarrin, P.; Vallée, M.; Mothes, P.A.; Grandin, R.; Rolandone, F.; Delouis, B.; Yepes, H.; Font, Y.; Fuentes, D.; et al. Supercycle at the Ecuadorian subduction zone revealed after the 2016 Pedernales earthquake. Nat. Geosci. 2016, 10, 145–149. [Google Scholar] [CrossRef]
  57. IOC Intergovernmental Oceanographic Commission. Tsunami Sources, Hazards, Risk and Uncertainties Associated with the Colombia-Ecuador Subduction Zone. Guayaquil, Ecuador, 27–29 January; UNESCO: Paris, France, 2020. [Google Scholar]
  58. Toulkeridis, T.; Chunga, K.; Rentería, W.; Rodriguez, F.; Mato, F.; Nikolaou, S.; Cruz D’Howitt, M.; Besenzon, D.; Ruiz, H.; Parra, H.; et al. The 7.8 M Earthquake and Tsunami of the 16th April 2016 in Ecuador—Seismic evaluation, geological field survey and economic implications. Sci. Tsunami Hazards 2017, 36, 197–242. [Google Scholar]
  59. Kanamori, H.; McNally, K. Variable rupture mode of the suduction zone along the Ecuador-Colombia coast. Bull. Seismol. Soc. Am. 1982, 72, 1241–1253. [Google Scholar]
  60. Yoshimoto, M.; Kumagai, H.; Acero, W.; Ponce, G.; Vasconez, F.; Arrais, S.; Ruiz, M.; Alvarado, A.; Pedraza Garcia, P.; Dionicio, V.; et al. Depth dependent rupture mode along the Ecuador-Colombia subduction zone. Geophys. Res. Lett. 2017, 44, 2203–2210. [Google Scholar] [CrossRef]
  61. Pulido, N.; Yoshimoto, M.; Sarabia, A.M. Broadband wavelength slip model of the 1906 Ecuador-Colombia megathrust-earthquake based on seismic intensity and tsunami data. Tectonophysics 2020, 774. [Google Scholar] [CrossRef]
  62. Michaud François Witt, C.; Royer, J.Y. Influence of the subduction of the Carnegie volcanic ridge on Ecuadorian geology: Reality and fiction. In Backbone of the Americas: Shallow Subduction, Plateau Uplift, and Ridge and Terrane Collision; Mahlburg Kay, S., Ramos, V., Dickinson, W., Eds.; The Geological Society of America: Boulder, CO, USA, 2009; pp. 217–228. ISBN 978-0-8137-1204-8. [Google Scholar]
  63. Blanco-Chao, R.; Pedoja, K.; Witt, C.; Martinod, J.; Husson, L.; Regard, V.; Audin, L.; Nexer, M.; Delcaillau, C.B.; Saillard, M.; et al. Chapter 10 The Rock Coast of South and Central America; Geological Society: London, UK, 2014; Volume 40, pp. 155–191. [Google Scholar] [CrossRef]
  64. Pedoja, K.; Dumont, J.F.; Lamothe, M.; Ortlieb, L.; Collot, J.-Y.; Ghaleb, B.; Auclair, M.; Alvarez, V.; Labrousse, B. Plio-Quaternary uplift of the Manta Peninsula and La Plata Island and the subduction of the Carnegie Ridge, central coast of Ecuador. J. S. Am. Earth Sci. 2006, 22, 1–21. [Google Scholar] [CrossRef]
  65. Graindorge, D.; Calahorrano, A.; Charvis, P.; Collot, J.Y.; Bethoux, N. Deep structures of the Ecuador convergent margin and the Carnegie Ridge, possible consequence on great earthquakes recurrence interval. Geophys. Res. Lett. 2004, 31, L04603. [Google Scholar] [CrossRef]
  66. Font, Y.; Segovia, M.; Vaca, S.; Theunissen, T. Seismicity patterns along the Ecuadorian subduction zone: New constraints from earthquake location in a 3-D a priori velocity model. Geophys. J. Int. 2013, 193, 263–286. [Google Scholar] [CrossRef] [Green Version]
  67. Nocquet, J.M.; Villegas-Lanza, J.C.; Chlieh, M.; Mothes, P.A.; Rolandone, F.; Jarrin, P.; Cisneros, D.; Alvarado, A.; Audin, L.; Bondoux, F.; et al. Motion of continental slivers and creeping subduction in the northern Andes. Nat. Geosci. 2014, 7, 287–291. [Google Scholar] [CrossRef]
  68. Alvarado, A.; Audin, L.; Nocquet, J.M.; Jaillard, E.; Mothes, P.; Jarrín, P.; Segovia, M.; Rolandone, F.; Cisneros, D. Partitioning of oblique convergence in the Northern Andes subduction zone: Migration history and the present-day boundary of the North Andean Sliver in Ecuador. Tectonics 2016, 35, 1048–1065. [Google Scholar] [CrossRef] [Green Version]
  69. Marcaillou, B.; Collot, J.Y.; Ribodetti, A.; d’Acremont, E.; Mahamat, A.A.; Alvarado, A. Seamount subduction at the North-Ecuadorian convergent margin: Effects on structures, inter-seismic coupling and seismogenesis. Earth Planet. Sci. Lett. 2016, 433, 146–158. [Google Scholar] [CrossRef]
  70. Collot, J.Y.; Sanclemente, E.; Nocquet, J.M.; Leprêtre, A.; Ribodetti, A.; Jarrin, P.; Chlieh, M.; Graindorges, D.; Charvis, P. Subducted oceanic relief locks the shallow megathrust in central Ecuador. J. Geophys. Res. B Solid Earth Planets 2017, 122, 3286–3305. [Google Scholar] [CrossRef]
  71. IGEPN. Instituto Geofísico Escuela Politécnica Nacional. Quito. Available online: http://www.igepn.edu.ec/solicitud-de-datos (accessed on 20 May 2020).
  72. Beauvalet, C.; Marinière, J.; Yepes, H.; Audin, L.; Nocquet, J.M.; Alvarado, A.; Baize, S.; Aguilar, J.; Singaucho, J.C.; Jomard, H.A. New Seismic Hazard Model for Ecuador. Bull. Seismol. Soc. Am. 2018, 108, 1443–1464. [Google Scholar] [CrossRef]
  73. Wells, D.L.; Coppersmith, K.J. New empirical relationships among magnitude, rupture length, rupture width, rupture area, and surface displacement. Bull. Seismol. Soc. Am. 1994, 84, 974–1002. [Google Scholar]
  74. Wesnousky. Displacement and geometrical characteristics of earthquake surface ruptures: Issues and implications for seismic-hazard analysis and the process of earthquake rupture. Bull. Seismol. Soc. Am. 2008, 98, 1609–1632. [Google Scholar] [CrossRef]
  75. Stirling, M.; Goded, T.; Berryman, K.; Litchfield, N. Selection of earthquake scaling relationships for seismic-hazard analysis. Bull. Seismol. Soc. Am. 2013, 103, 2993–3011. [Google Scholar] [CrossRef]
  76. INEC. Base de Datos—Censo de Población y Vivienda del Ecuador. 2010. Available online: http://www.ecuadorencifras.gob.ec/base-de-datos-censo-de-poblacion-y-vivienda/ (accessed on 1 July 2020).
  77. Chunga, K. Reconocimiento Geológico de la Ciudad de JAMA. Microzonificación Sísmica de Ciudades Prioritarias de la Costa Ecuatoriana de Conformidad con los Requisitos de la Norma Ecuatoriana de la Construcción NEC; Proyecto BID # EC-T1354. Reporte técnico 34 pág; Universidad de los Andes: Bogotá, Colombia, 2019. [Google Scholar]
  78. Daza, J.; Trstancho, J.; Caicedo, B. Caracterización Geotécnica y Geofísica de la Ciudad de JAMA. Microzonificación Sísmica de Ciudades Prioritarias de la Costa Ecuatoriana de Conformidad con los Requisitos de la Norma Ecuatoriana de la Construcción NEC; Proyecto BID # EC-T1354. Reporte técnico 94 pág; Universidad de los Andes: Bogotá, Colombia, 2019. [Google Scholar]
  79. Santibáñez, I.; Cembrano, J.; García-Pérez, T.; Costa, C.; Yáñez, G.; Marquardt, C.; Arancibia, G.; González, G. Crustal faults in the Chilean Andes: Geological constraints and seismic potential. Andean Geol. 2019, 46, 32–65. [Google Scholar] [CrossRef]
  80. Leonard, M. Earthquake fault scaling: Self consistent relating of rupture length width, average displacement, and moment release. Bull. Seismol. Soc. Am. 2010, 100, 1971–1988. [Google Scholar] [CrossRef]
  81. Fukushima, Y.; Tanaka, T. A New Attenuation Relation for Peak Horizontal Acceleration of Strong Earthquake Ground Motion in Japan. Bull. Seismol. Soc. Am. 1990, 80, 757–783. [Google Scholar]
  82. Stainforth, R.M. Applied micropaleontology in coastal Ecuador. J. Paleontol. 1948, 616, 113–151. [Google Scholar]
  83. Mulas, M.; Chunga, K.; Garces, D.; Escobar, K. Sedimentological study of distal rain-triggered lahars: The case of west coast of Ecuador. Lat. Am. J. Sedimentol. Basin Anal. 2019, 26, 32. [Google Scholar]
  84. Whittaker, J.E. Benthic Cenozoic Foraminifera from Ecuador. Taxonomy and Distribution of Smaller Benthic Foraminifera from Coastal Ecuador (Late Oligocene—Late Pliocene); British Museum (Nature History) Publisher: London, UK, 1988; 194p. [Google Scholar]
  85. Gómez-de la Torre, M.; Ríos, P.V.; Coello, D.S.; Briones, M. Determinación de zonas de peligrosidad Sísmica en la cuenca del río Jama con el uso de perfiles de respuesta del suelo. J. Sci. Res. 2018, 3, 74–80. [Google Scholar] [CrossRef]
  86. Kramer, S.L. Geotechnical Earthquake Engineering; Prentice-Hall: Upper Saddle River, NJ, USA, 1996. [Google Scholar]
  87. Osorio Gutiérrez, B. Resistencia Estática y Cíclica de Relaves Integrales. 2009. Available online: http://repositorio.uchile.cl/handle/2250/103414 (accessed on 1 May 2020).
  88. Garcia, J.; Weatherhill, G.; Pagani, M.; Rodriguez, L.; Poggi, V.; SARA Hazard Working Group 517. Building an open seismic hazard model for South America: The SARA-PSHA model. In Proceedings of the 16th World Conference on Earthquake Engineering, Santiago, Chile, 9–13 January 2017; p. 13. [Google Scholar]
  89. Parra, H.; Benito, M.; Gaspar-Escribano, J. Seismic Hazard Assessment in Continental Ecuador. Bull. Earthq. Eng. 2016, 14, 2129–2159. [Google Scholar] [CrossRef]
  90. Seed, R.B.; Cetin, K.O.; Moss, R.E.S.; Kammerer, A.M.; Wu, J.; Pestana, J.M.; Riemer, M.F.; Sancio, R.B.; Bray, J.D.; Kayen, R.E.; et al. Recent advances in soil liquefaction engineering: A unified and consistent framework. In Proceedings of the 26th annual ASCE L.A. Geotechnical Spring Seminar, Long Beach, CA, USA, 30 April 2003; p. 71. [Google Scholar]
  91. Seed, H.B.; Idriss, I.M. Ground Motions and Soil Liquefaction during Earthquakes; Earthquake Engineering Research Institute Monograph: Oakland, CA, USA, 1982. [Google Scholar]
  92. Juang, C.H.; Yuan, H.; Lee, D.-H.; Lin, P.S. Simplified cone penetration test-based method for evaluating liquefaction resistance of soils. J. Geotech. Geoenviron. Eng. 2003, 129, 66–80. [Google Scholar] [CrossRef]
  93. Youd, T.L.; Idriss, I.M. (Eds.) NCEER Workshop on Evaluation of liquefaction Resistance of Soils; National Center for Earthquake Engineering Research, State University of New York at Buffalo: Buffalo, NY, USA, 1997. [Google Scholar]
  94. Youd, T.L.; Idriss, I.M.; Andrus, R.D.; Arango, I.; Castro, G.; Christian, T.V.; Dobry, R.; Finn, W.D.L.; Harder, L.F.; Hynes, M.E.; et al. Liquefaction resistance of soils: Summary report from the 1996 NCEER and 1998 NCEER/NSF workshops on evaluation of liquefaction resistance of soils. J. Geotech. Geoenviron. Eng. ASCE 2001, 127, 817–833. [Google Scholar] [CrossRef] [Green Version]
  95. Liao, S.; Whitman, R. Overburden correction factor for SPT in sand. J. Geotech. Eng. ASCE 1986, 112, 373–377. [Google Scholar] [CrossRef]
  96. Iwasaki, T. Microzonation for soil liquefaction potential using simplified methods. Procrd Int. Conf. Microzonat. 1982, 3, 1310–1330. [Google Scholar]
  97. Baldock, J.W. The Northern Andes: A review of the Ecuadorian Pacific margin. In The Ocean Basins and Margins; Springer: Boston, MA, USA, 1985; pp. 181–217. [Google Scholar]
  98. Lee, J.-C.; Chu, H.-T.; Angelier, J.; Chan, Y.-C.; Hu, J.-C.; Lu, C.-Y.; Rau, R.-J. Geometry and structure of northern surface ruptures of the1999, M = 7.6 Chi-Chi Taiwan earthquake: Influence from inherited foldbelt structures. J. Struct. Geol. 2002, 24, 173–192. [Google Scholar]
  99. Romeo, R.; Pugliese, A. Seismicity, seismotectonics and seismic hazard of Italy. Eng. Geol. 2000, 55, 241–266. [Google Scholar] [CrossRef]
  100. Douglas, J. Earthquake ground motion estimation using strong-motion records: A review of equations for the estimation of peak ground acceleration and response spectral ordinates. Earth-Sci. Rev. 2003, 61, 43–104. [Google Scholar]
  101. Ambraseys, N.N.; Douglas, J.; Sarma, S.K.; Smit, P.M. Equations for the estimation of strong ground motions from shallow crustal earthquakes using data from Europe and the Middle East: Horizontal peak ground acceleration and spectral acceleration. Bull. Earthq. Eng. 2005, 3, 1–53. [Google Scholar] [CrossRef] [Green Version]
  102. Schnabel, P.B.; Lysmer, J.; Seed, H.B. SHAKE—A Computer Program for Earthquake Analysis of Horizontally Layered Sites; Report No. EERC 72-12; Earthquake Engineering Research Center, University of California: Berkeley, CA, USA, 1972. [Google Scholar]
  103. Vucetic, M.; Dobry, R. Effect of soil plasticity on cyclic response. J. Geotech. Eng. 1991, 117, 89–107. [Google Scholar] [CrossRef]
Figure 1. Location maps and seismotectonic setting. (A) Regional view of tectonic segments modified from IOC [57], where the stars indicate the epicenters of large subduction events occurred in the coastal zone of Ecuador within the last 120 years. (B) Record and extension of the ESI-2007 macroseismic Intensity of the 2016 Pedernales earthquake (M7.8).
Geosciences 11 00020 g001
Figure 2. Map of maximum magnitudes (left) and PGA-rock determination (right) obtained from the analysis of capable geological faults in the canton of Jama.
Geosciences 11 00020 g002
Figure 3. Geological map of the urban area of Jama city and earthquake environmental effects documented few days after the M7.8 2016 earthquake. (a) soil cracks on soil 120 m long and 38 cm wide, VIIIESI-07 intensity; (b) lateral spreading on filled sector on river side, VIIIESI-07 intensity; (c) lateral spreading in river bank, soil cracks in natural soil 20 to 25 cm wide, VIIESI-07 intensity; (d) ground deformation and subsidence, severe damage to the structure Sol de Oro (Economical and Social Inclusion Ministery), assigned IXESI-07 intensity; (e) Ground subsidence above bridge anchorage, vertical uplift of 10 cm, VIIIESI-07 intensity; (f) building damage due liquefaction, flaws in the structural design of the building and the poor quality of the construction, VIIIESI-07 intensity; and (g) debris and rocks falls, VIIESI-07 intensity.
Geosciences 11 00020 g003
Figure 4. Geological- geoseismic section in the profile A-B of Figure 3 within the urban area of Jama.
Geosciences 11 00020 g004
Figure 5. (a) Relationship between the Cyclic Stress Ratio (CSR) causing liquefaction and the value (N1) 60cs for silty sands. (b) Values obtained of liquefaction probability PL for sands from geoengineering drilling for the city of Jama. (c) Behaviour of S-velocity (Vs) to a depth of 35 m.
Geosciences 11 00020 g005
Figure 6. Elastic seismic spectra of NEC-11 [46] accelerations for soil and rock profiles.
Geosciences 11 00020 g006
Figure 7. Elastic seismic spectra Acceleration response spectrum (5% structural damping) for ten scaled seismic movements (gray lines) for inverse component earthquakes, with seismological characteristics similar to the expected uniform hazard spectrum, 10% probability of exceedance in 50 years, the median and median ± 1 standard deviation of the scaled movements for NEC-type rock profile.
Geosciences 11 00020 g007
Figure 8. Rock and coluvial strata surface response spectrum for the BH-03 well.
Geosciences 11 00020 g008
Table 1. List of the parameters of the tectonic segments along the coast of Ecuador, as modified from the IOC [57].
SegmentDepht (km)DIP (°)Strike (°)Rake (°)Width (km)Length (km)Slip (km/m)M
Galera I + II20163090120560120/148.9
100/16.8
Galera II20163090120450120/6.28.6
110/7.4
80/9.3
Galera I222127908011080/3.47.9
60/4.5
Isla Plata1514109080100/1202.67.8
Salinas2017590802003.78.1
Table 2. List of the present geological faults and their parameters within the canton of Jama based on the Geological Faults Catalog.
FaultMechanismFault Length (km)Fault Depth (km)Dip-Direction FaultRakeFault Width (km)Estimated Magnitude MLevels of ReliabilityPGA-Rock (g) *
F01Reverse16.3121409086.39deducible0.30
F02Reverse5.5123109065.50deducible0.19
F03Reverse10.3123309076.01true0.25
F04Shear fault Sx5.012-−566.17deducible0.27
F05Shear fault Sx10.012-−576.43true0.31
F06Shear fault Dx6.812-−17566.28deducible0.29
F07Reverse4.8121259055.39deducible0.17
F08Reverse7.6123359065.77true0.22
F09Shear fault Dx5.712-−17566.22deducible0.28
F10Shear fault Sx5.012-−566.17deducible0.27
F11Reverse13.7123059076.25true0.29
F12Reverse18.2123259086.48deducible0.32
F13Reverse6.3123229065.61deducible0.20
F14Shear fault Dx8.412-−17566.36deducible0.30
F15Shear fault Dx4.012-−17556.08deducible0.26
F16Shear fault Dx6.512-−17566.27deducible0.29
F17Shear fault Dx3.012-−17555.98true0.25
F18Shear fault Sx6.112-−566.24true0.28
F19Shear fault Dx6.312-−17566.26deducible0.29
F20Reverse4.5123289055.34deducible0.17
F21Shear fault Dx8.212-−17566.36deducible0.30
F22Reverse5.6121539065.52true0.19
F23Reverse8.5123389065.86true0.23
F24Reverse16.4123359086.39true0.31
F25Reverse4.8123309055.39deducible0.17
F26Shear fault Dx3.212-−17556.00true0.25
F27Reverse5.3122039065.47deducible0.18
Values determined based on Fukushima & Tanaka [81] * equations.
Table 3. Stratigraphic column of the canton of Jama.
Geologic UnitsThickness of SedimentsUSCS Soil TypeGeological AgeAverage Shear Velocity
Fill1 ≤ m ≤ 2CH/waste materialsModern100 ≤ vs. ≤ 140
Intertidal flat, alluvium plain and ancient floodplain deposits (Qa-Qaa-Qf)2 ≤ m ≤ 4MH, CLHolocene110 ≤ vs. ≤ 150
Terrace (abandoned floodplain deposits) (Qt)6 ≤ m ≤ 8ML, SMHolocene to Late Pleistocene160 ≤ vs. ≤ 210
Colluvium deposits (Qc)8 ≤ m ≤ 15MLHolocene to Late Pleistocene200 ≤ vs. ≤ 260
Ancient colluvium alluvium deposits (Qca)10 ≤ m ≤ 25MH, OHLate Pleistocene130 ≤ vs. ≤ 260
Alluvial valley fill deposits (qaf)15 ≤ m ≤ 40SC, SMMiddle Pleistocene260 ≤ vs. ≤ 450
Soft rock (Mab)40 ≤ m ≤ 100siltstone, claystoneMiocene380 ≤ vs. ≤ 680
Basement rock (Kp)˃40 mbasaltCretaceous1000 ≤ vs. ≤ 3000
Table 4. The classification of the probability of liquefaction as proposed by Chen and Juang [41].
Probability (PL)DescriptionSafety FactorLiquefaction Hazard Level
0.85 ≤ PL < 1.00Almost certain that it will liquefy0.653 ≥ SF > 0.000Very high
0.65 ≤ PL < 0.85Very likely0.837 ≥ SF > 0.653High
0.35 ≤ PL < 0.65Liquefaction/non liquefaction is equally likely1.102 ≥ SF > 0.837Moderate
0.15 ≤ PL < 0.35Unlikely1.411 ≥ SF > 1.102Low
0.00 ≤ PL < 0.15Almost certain that it will not liquefyα ≥ SF > 1.41Very low to null
Publisher’s Note: MDPI stays neutral with regard to jurisdictional claims in published maps and institutional affiliations.

