Article

Gas Seepage-Induced Features in the Hypoxic/Anoxic, Shallow, Marine Environment of Amfilochia Bay, Amvrakikos Gulf (Western Greece)

1
Laboratory of Marine Geology and Physical Oceanography, Department of Geology, University of Patras, 26504 Patras, Greece
2
Laboratory of Structural Geology & Tectonics, Department of Geology, University of Patras, 26504 Patras, Greece
3
Istituto Nazionale di Geofisica e Vulcanologia, Sezione Roma 2, 00143 Roma, Italy
*
Author to whom correspondence should be addressed.
Submission received: 15 October 2020 / Revised: 8 December 2020 / Accepted: 29 December 2020 / Published: 5 January 2021

Abstract

:
Amfilochia Bay (Eastern Amvrakikos Gulf, Western Greece), a complex marine area affected by tectonism, was investigated for seabed seepage manifestations and for possible inter-relationships between shallow gas accumulations and hypoxia. For this purpose, an integrated research methodology that combined geophysical, geochemical, and hydrographic surveys was applied. Marine geophysical and bathymetric surveys led to the discovery of a gas-induced pockmark group in the study area. Oceanographic surveying confirmed that the bay is hypoxic/anoxic below a depth of 15 m (dissolved oxygen from ~4 to 60 μM). Very weak CH4 seepage was detected in correspondence to the pockmark group that seemed to slightly enhance the hypoxic environment locally and close to the seabed, with no effect in shallower waters and the oxycline. Methane isotopic analysis showed variable carbon isotopic composition (from −41‰ to −86‰) which could be either related to differential CH4 oxidation or mixing between microbial and thermogenic gas. However, the pathway of degassing is clearly related to the fault-controlled pockmark group. A protrusion mound, which has erroneously been reported as a submarine “volcano” since 1876, could be the result of mud volcanism based on the geophysical data of this study.

1. Introduction

Amfilochia Bay is located in the eastern-southernmost margin of the Amvrakikos Gulf on the north-western coast of Greece. The Amvrakikos Gulf has been widely studied because of its specific features, i.e., high ecological value combined with a particular oceanographic regime and intense environmental pressures that make it both valuable and fragile, e.g., [1,2,3,4,5,6,7,8].
Amvrakikos is a shallow (<65 m), semi-enclosed, narrow (~35 km long and ~6 to 15 km wide) gulf, with a strongly stratified water column, and a seasonally anoxic bottom layer [4]. To the west, the Amvrakikos Gulf is connected to the Ionian Sea through a narrow, elongated (~8 m deep, 6 km long, ~0.8–2 km wide) channel (Figure 1b). The Amvrakikos Gulf has been characterized as the only Mediterranean fjord-type system [4,9] due to its fjord-like water circulation and morphology. The Gulf’s water column is stratified in two layers: a surface layer with brackish water that is out-flowing, and a dense, cold, saline water bottom layer that is inflowing from the narrow channel that connects the Gulf to the open sea. The channel seasonally oxygenates the western part of the Gulf. This density driven stratification of the water column prevents the vertical distribution of the dissolved oxygen and, coupled with anthropogenic pressures, leads to hypoxia and seasonal anoxia of the bottom layer, particularly in the eastern, innermost part of the Gulf, where Amfilochia Bay is located [4]. Based on studies that took place in the early 2010s, anoxic conditions in the Amvrakikos Gulf appeared during the 1980s [3,4,10].
The hypoxic/anoxic environment of the Amvrakikos Gulf has caused several fish mortality events, with the most recent and massive occurring in February 2008, when a mortality of ~900 t of fish was reported north of Amfilochia Bay [4,11]. Moreover, events of enormous sulfur releases from a submarine “volcano” in the bay were reported in November 1847 and February 1866 by Miaoulis [12]. According to Miaoulis [12], those events were triggered by earthquakes, causing massive fish mortality events.
Several studies have reported the presence of gas-charged marine sediments [13,14] as well as anoxic/hypoxic conditions [4,9] in the Amvrakikos Gulf in general. Nevertheless, investigations of gas seepage in the water column and seepage-induced geomorphological features have never been carried out before this work, let alone examinations of the relationship between seepage and anoxia/hypoxia.
Thus, the purpose of this work is to explore the seabed of Amfilochia Bay, the most anoxic part of the Amvrakikos Gulf [4], for gas seepage (CH4 and H2S) and related geomorphological features. Moreover, possible links between oxygen deficiency and gas seepage (e.g., O2 concentration decrease, oxycline variations) were investigated to evaluate the possible contribution of geological drivers to the hypoxic/anoxic environment. To this end, a combination of geophysical and geochemical means, combined with a multiparameter platform for measurements in the water column, was employed. Finally, the origin of the seeping gas was assessed for the first time.

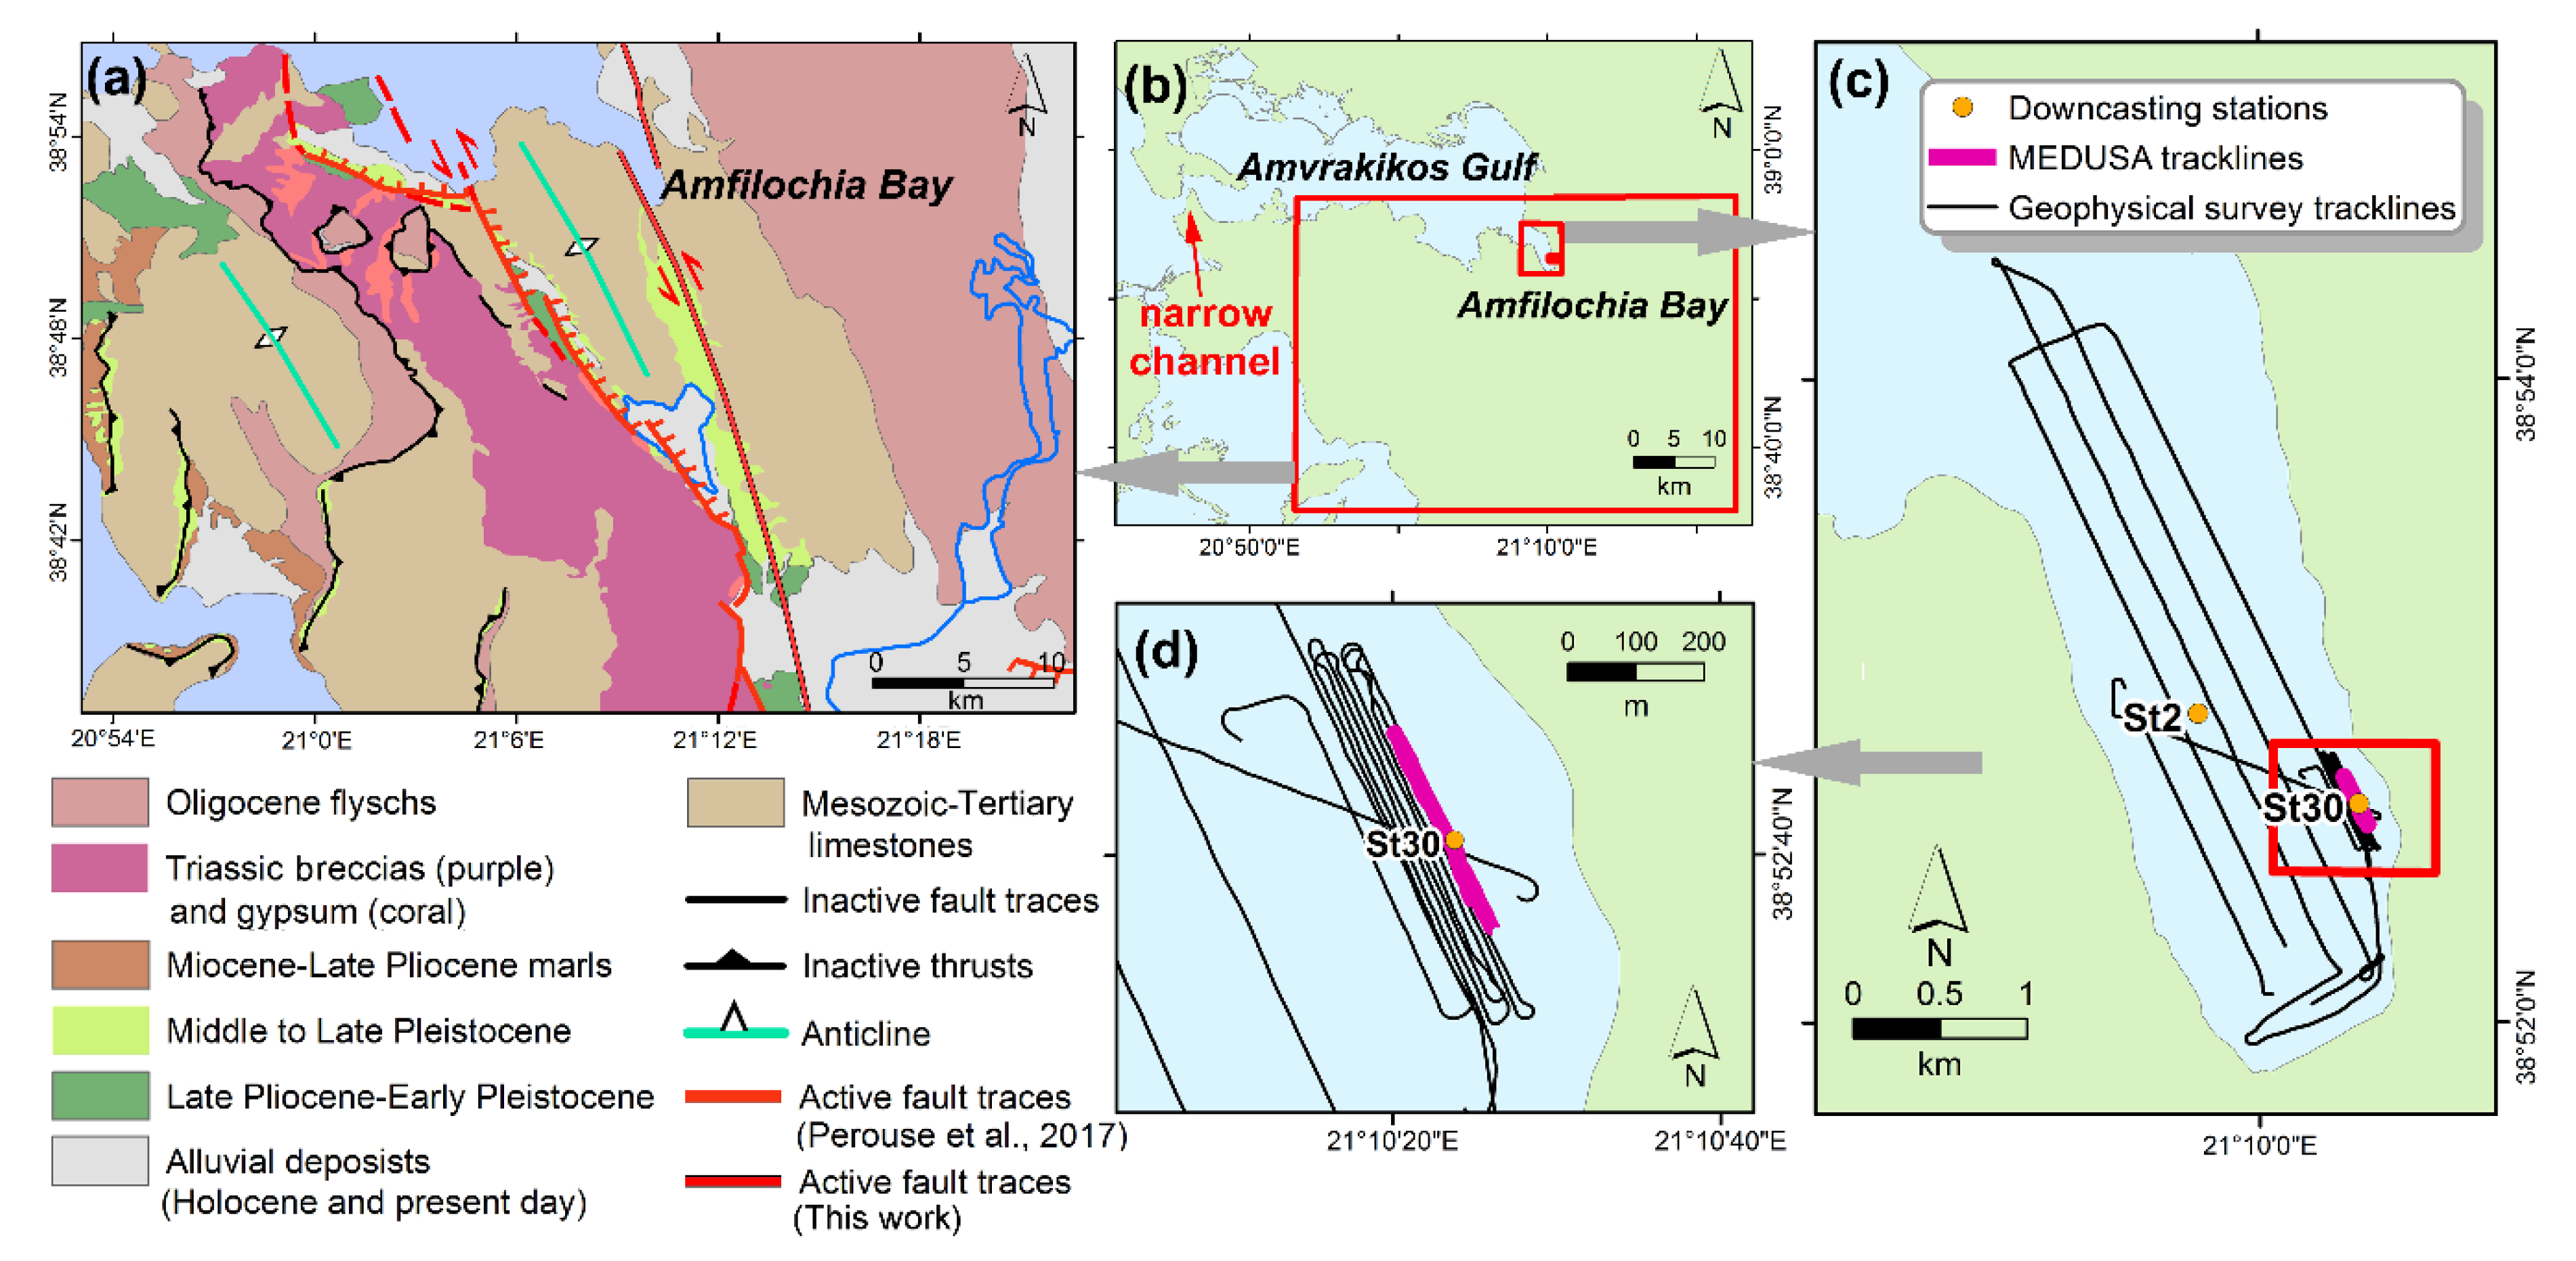
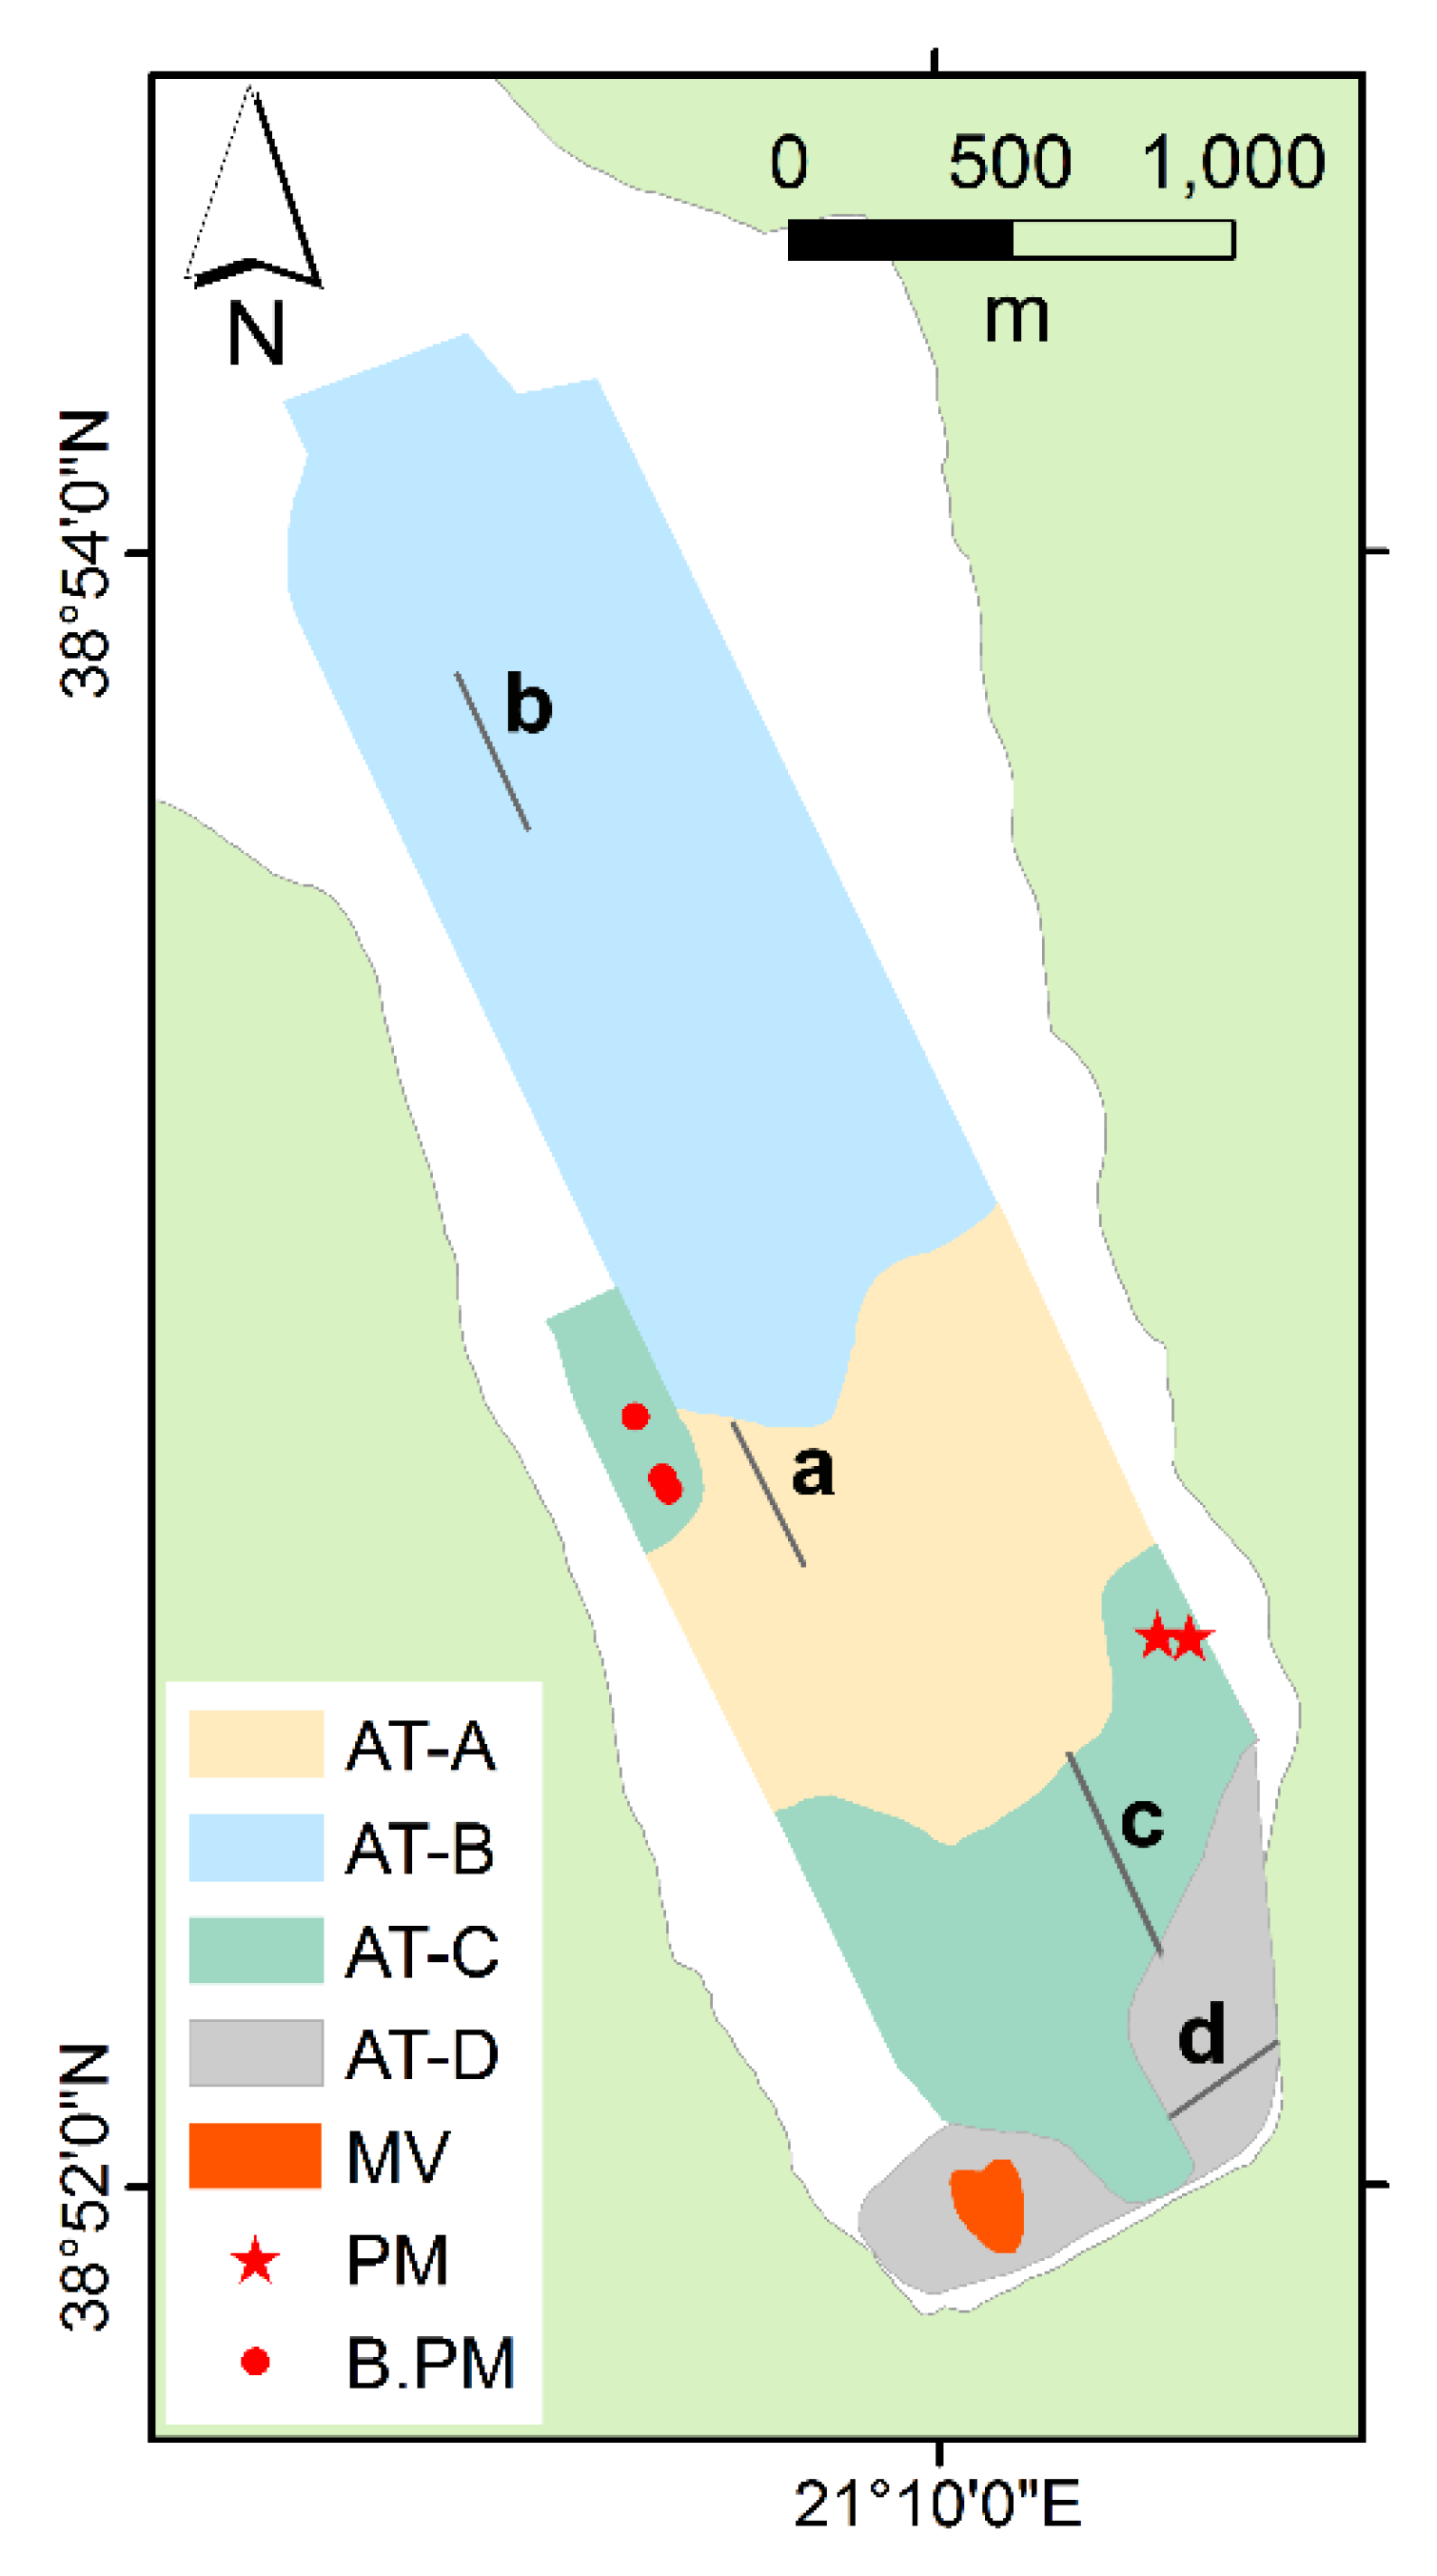
Geological and Physiographic Setting of Survey Area

Western Greece is dominated by a fairly complex geological history and structure characterized by along-strike changes in the subduction zone composition, geometry, and stress regime (see [15] and references therein). Several studies have suggested that the area of Western Greece, and specifically the Aitolo-Akarnania region, forms a unique and rigid crustal block with different strain rates, GPS estimated velocities, crustal rotation, and levels of seismicity compared to the surrounding crustal blocks [16,17,18,19]. This crustal block is bound to the west by the Kephalonia transform fault (KTF), to the north by the Amvrakikos half-graben and to the east by the Katouna (KFZ) and Amfilochia (AFZ) fault zones (Figure 1a).
The Katouna-Amfilochia fault zones (FZ) forms a composite NW-trending left-lateral fault zone, with a length of approximately 50 km, and is considered as one of the major tectonic features in the broader area (Figure 1a) [20,21,22]. The KFZ is highly segmented, and along the left-stepping fault segments, the relay zones host several elongated depressions along the Amfilochia valley which are filled with sediments or morphotectonically-controlled lakes.
Although the geomorphological expression of the Katouna and Amfilochia FZ is impressive, its left-lateral kinematics comes mainly from seismological data [23] and GPS estimated sense of motion [17,24]. Focal mechanisms from the region around the fault system are consistent with N-S extension and left-slip on steep NW-trending faults (Figure 1a). Rock types exposed near the FZ are primarily Oligocene-Early Miocene Ionian flysch to the east, while to the west and beneath the Amfilochia valley the Triassic evaporites have been remobilized in Plio-Quaternary time. This salt tectonics deformation produced small depressions filled with sediments and gypsum [21,25] which can look similar to pull-apart structures formed by oblique strike-slip motion along the fault zone (Figure 1).
Towards the north, the AFZ coincides with the eastern edge of the Amvrakikos Basin, which is an active morphologic depression bounded by roughly E-W trending normal faults that control the Upper Pliocene to recent sedimentation (Figure 1a). In the isotopic stages of MIS3 and MIS2 (ca. 50 to 11 ka BP), when the sea level was 55 m below the current level, the western part of the gulf was shallow, while its eastern part was occupied by a lake [14]. The invocation of the sea took place at 11 ka BP and the bay took its present form in 4 ka BP [14]. From an environmental aspect, Amvrakikos is one of the most important gulfs of Greece due its ecological richness and productivity.
In the Amvrakikos Gulf the Pleistocene/Holocene boundary seems to be a gas accumulation horizon. The Holocene sequence is characterized by anomalous acoustic characters indicative of gas charged sediments and upward gas migration features (acoustic turbid zones or ATZ, gas plumes, gas plumes, doming). Moreover, the central basin of the gulf is characterized by buried pockmarks developed on the Pleistocene/Holocene gas accumulation interface [13,14].
The study area, Amfilochia Bay, is located at the east-southeast end of the Amvrakikos Gulf. It is a narrow and elongated bay (Figure 1a,b) with tectonically controlled steep slopes near the coast and depths ranging between ~35–40 m. In February 1866, a major sulfur release event was reported in Amfilochia Bay. Sulfur, as identified by its “rotten egg” smell, was released at such large quantities that it reached the coasts of Preveza, a small port town on the other end (western) of the Amvrakikos Gulf. Miaoulis [12] reported that the sulfur was seeping from an underwater “volcano” whose “crater” was located ~270 m off the Amfilochia coast. According to Miaoulis [12], the “volcano” was distinct due to its shallow water depth (~5 m) in relation to the surrounding waters. Furthermore, Miaoulis [12] reported testimonies from local fishermen who claimed that every time they recovered their gear from the “volcano” location it was covered in sulfur.

2. Materials and Methods

The field work in Amfilochia Bay took place between 2010 and 2015, and was organized in three distinct phases following a downscale approach.
During the first phase (Phase 1), a marine geophysical survey was carried out throughout the bay (Figure 1c,d), so as to investigate the area for gas-related morphological features, and possible anomalous acoustic characters within the sediments that may serve as proxies for the presence of gas seepage. The marine geophysical survey (Phase 1A) was combined with a small-scale hydrographic survey (Phase 1B) for data collection of physicochemical parameters of the water column, for the study of the anoxic/hypoxic zone, in Amfilochia Bay. Phase 2 of the survey consisted of specific site investigations on spatial concentration of dissolved gases, planned on the results of the first phase, using the MEDUSA plarform [26]. Phase 3 of the survey included sea bottom water and sediment sampling by divers in one of the specific sites to determine the isotopic composition of methane (δ13CCH4).

2.1. Phase 1A: Marine Geophysical Survey

The marine geophysical survey used: (i) an ELAC Nautic Seabeam 1185 multibeam echosounder system (MBES), (ii) an E.G. & G. Model 272-TD side scan sonar tow-fish in association with an EG & G Model 260 processor, and (iii) a 3.5 kHz subbottom profiling system with Geopulse transmitter and a four-array transducer. Positional and navigation data were provided by a Differential Global Positioning System (DGPS) with an accuracy of 1–2 m.
The side scan sonar survey was conducted with an operating frequency of 100 kHz and a range of 100 m per channel (swath width of 200 m). Slant-range correction was applied to the side scan sonar data during the survey. Mosaicing of the side scan sonar data was carried out with Triton Map software (Triton Imaging Inc.), while the final resolution of the mosaic was set to 30 cm × 30 cm pixel size. Light tones in the side scan sonar mosaic represent high reflectivity (hard substrate or coarse grained sediments) and the dark tones represent low reflectivity (soft substrate).
The subbottom profiler data were acquired using 3.5 kHz frequency, 1 ms pulse duration with a pulse rate of 10 s−1. The vertical resolution of the system is about 0.5 m which is the minimum distance between the distinguishable reflectors. The geophysical survey tracklines that have taken place have a length of 11.733 km, covering a total area of 4.3 km2 (Figure 1c).
The operational frequency of MBES was 180 kHz with a beamwidth of 131°, providing a vertical resolution of about 0.1 m. MBES acquisition supported by a Real Time Kinematics (RTK) GPS obtaining 10 cm position accuracy, vessel motion was acquired using a SMC IMU-108 MRU, sound velocity (SV) in the surface water was recorded using Valeport MiniSVS and in the water column using a Valeport MIDAS SVP.
MBES tracklines having a total length of 37.5 km covered a total area of 10 km2. Acquisition and processing of MBES data were performed using Hypack and Hysweep software. The processing of MBES data included the following stages: (i) Data Review: The first stage included the review of the navigation tracklines, heave-pitch-roll, tide-and-draft and sound velocity profile information; (ii) Swath-by-swath editing: Precise examination of bottom detail, clear spikes and errors; and (iii) Cube: CUBE provides a near-automated editing of MBES data, allowing for rapid turn-around data.

2.2. Phase 1Β: Small-Scale Hydrographic Survey

During the small-scale hydrographic survey in Amfilochia Bay, measurements of physicochemical parameters of the seawater (downcasts), i.e., temperature, salinity, dissolved oxygen (DO), pH, and H2S were carried out on two hydrographic stations (Figure 1c; Station 2 and Station 30) during summer. For the hydrographic survey, an underwater multiparameter CTD (In-situ Inc. TROLL 9500), and a hydrogen sulfide sensor (Sea & Sun Technology—ATM) were used. Density was calculated based on the equation of state formula. One of the stations (Figure 1b,c; Station 30) was located over one of the specific sites that emerged through the geophysical survey, and the second one (Figure 1c; Station 2) at the centre of the bay at water depth of 43 m and 35 m, respectively.

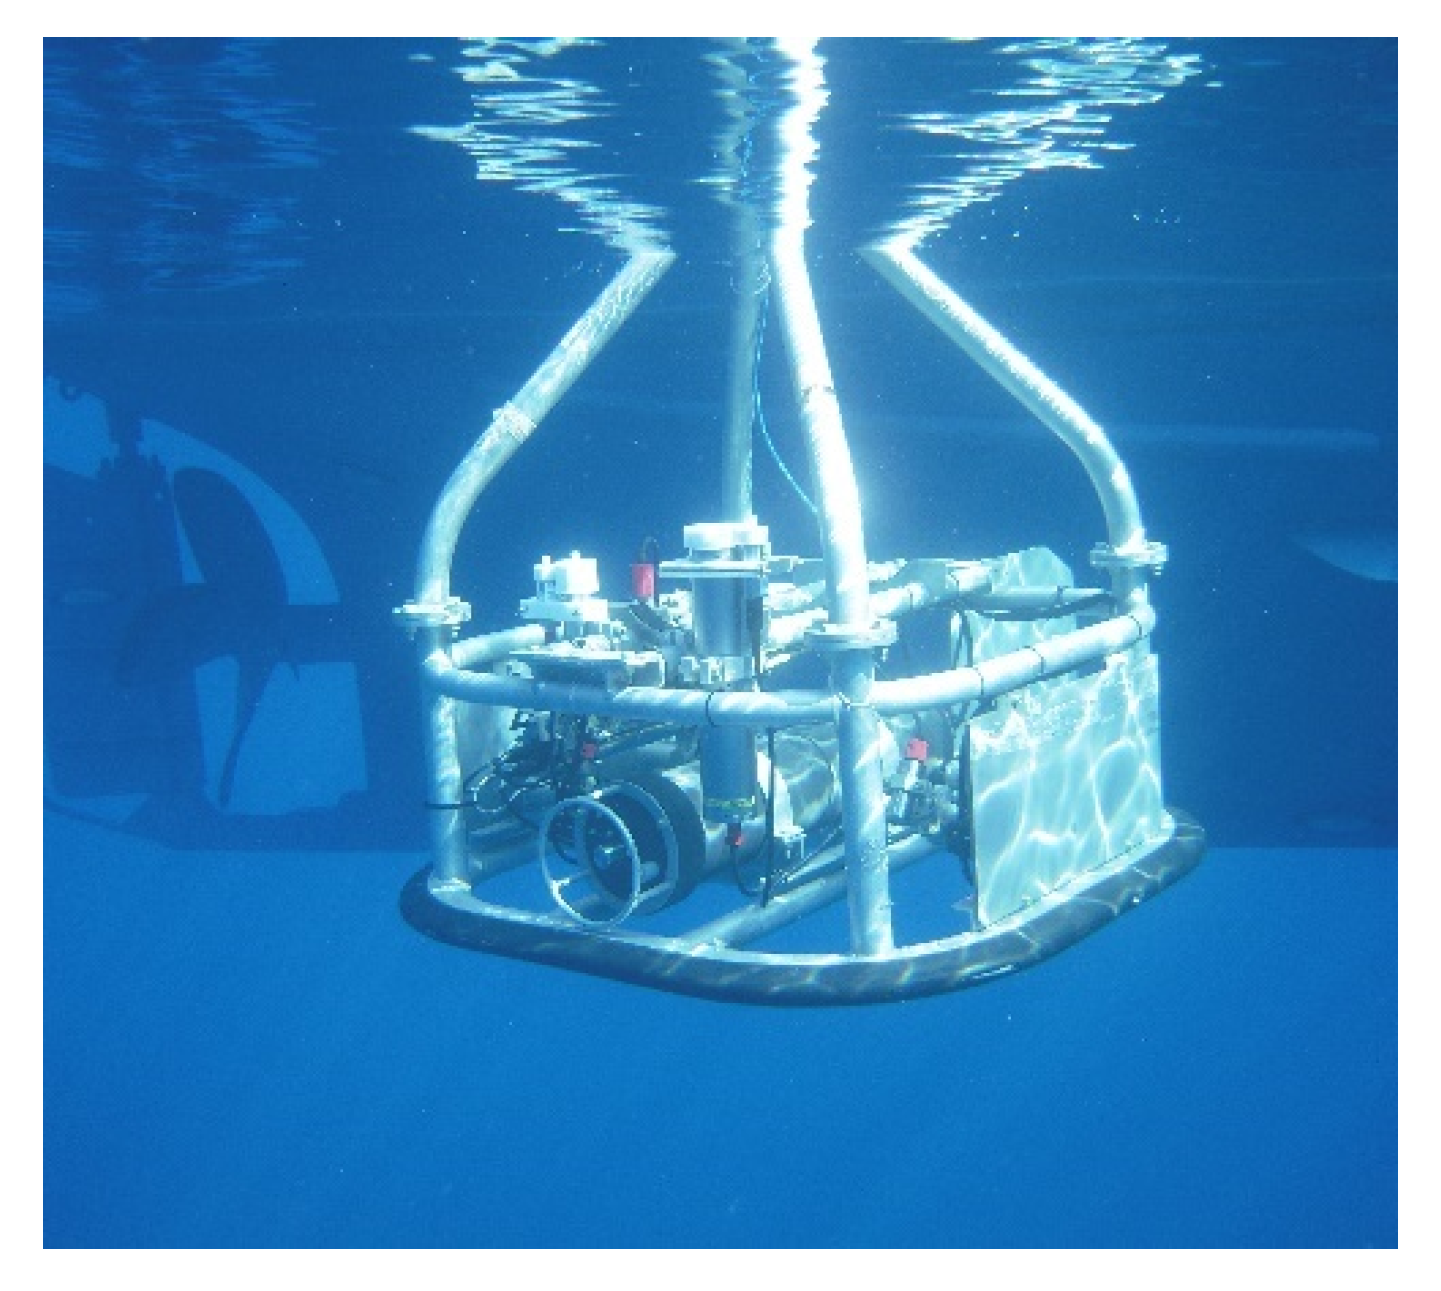
2.3. Phase 2: MEDUSA Underwater Tow Multi-Parameter Platform

Focused measurements over the gas seeping morphological features were performed with the MEDUSA underwater tow multiparameter platform (Figure 1d and Figure 2) [27], which includes sensors for the measurement of dissolved methane (semiconductor METS by Franatech), and oxygen, CTD, altimeter, and camera. All data were transmitted through a cable to the surface acquisition unit and recorded at a rate of 1 Hz at the same time as data from a DGPS differential positioning system for georeferencing data [26]. With the MEDUSA platform, the same trackline of ~250 m was repeatedly carried out, with the system towing at different water depths (4, 8, 15 m) and at fixed elevation of less than one meter above the seabed (towing water depth 29–42 m). Methane concentration data were corrected with regard to DO concentration with a formula provided by the methane sensor manufacturer (Franatech). The formula and the relative calculations can be found in Spreadsheet S2 of the Supplementary Material.

2.4. Phase 3: Sediment and Water Sampling

Eight water and six sediment samples were collected by divers from outside and inside of one of the gas seeping morphological features (Station 30 in Figure 1c,d) in Amfilochia Bay. Water samples were collected close to the seabed, directly into 250 mL glass bottles which were sealed underwater with PTFE (polytetrafluoroethylene) butyl rubber septa and aluminum caps. Sediment samples were collected by divers in 500 mL aluminum cans. All samples were sealed at the sampling point to prevent contamination with atmospheric air. A bactericide (mercuric chloride solution) was injected to the water samples through the septa using a syringe as well as to the sediment samples, immediately after the samples were acquired.
Equal numbers of water and sediment samples were analyzed at Isotech Labs Inc. (Champaign, IL, USA) and at the Stable Isotope Facility of the University of California, Davis (Davis, CA, USA) in order to confirm the validity of the results. Analyses included complete compositional and isotopic composition analysis of δ13CCH4 of the gas in the water and sediment samples (at Isotech Labs Inc. by Finnigan Delta Plus XL mass spectrometer, precision ±0.3‰ (1σ) for 13C; at UC Davis by ThermoScientific PreCon concentration system interfaced to a ThermoScientific Delta V Plus isotope ratio mass spectrometer; ThermoScientific, Bremen, DE; http://stableisotopefacility.ucdavis.edu). Methane concentrations were too low for δ2HCH4.

3. Results

The examination of high resolution seismic, side scan sonar and MBES data from Amfilochia Bay, revealed the existence of anomalous acoustic characters and negative, and possibly positive, morphological features, indicative of gas in the interstitials of the sediments.

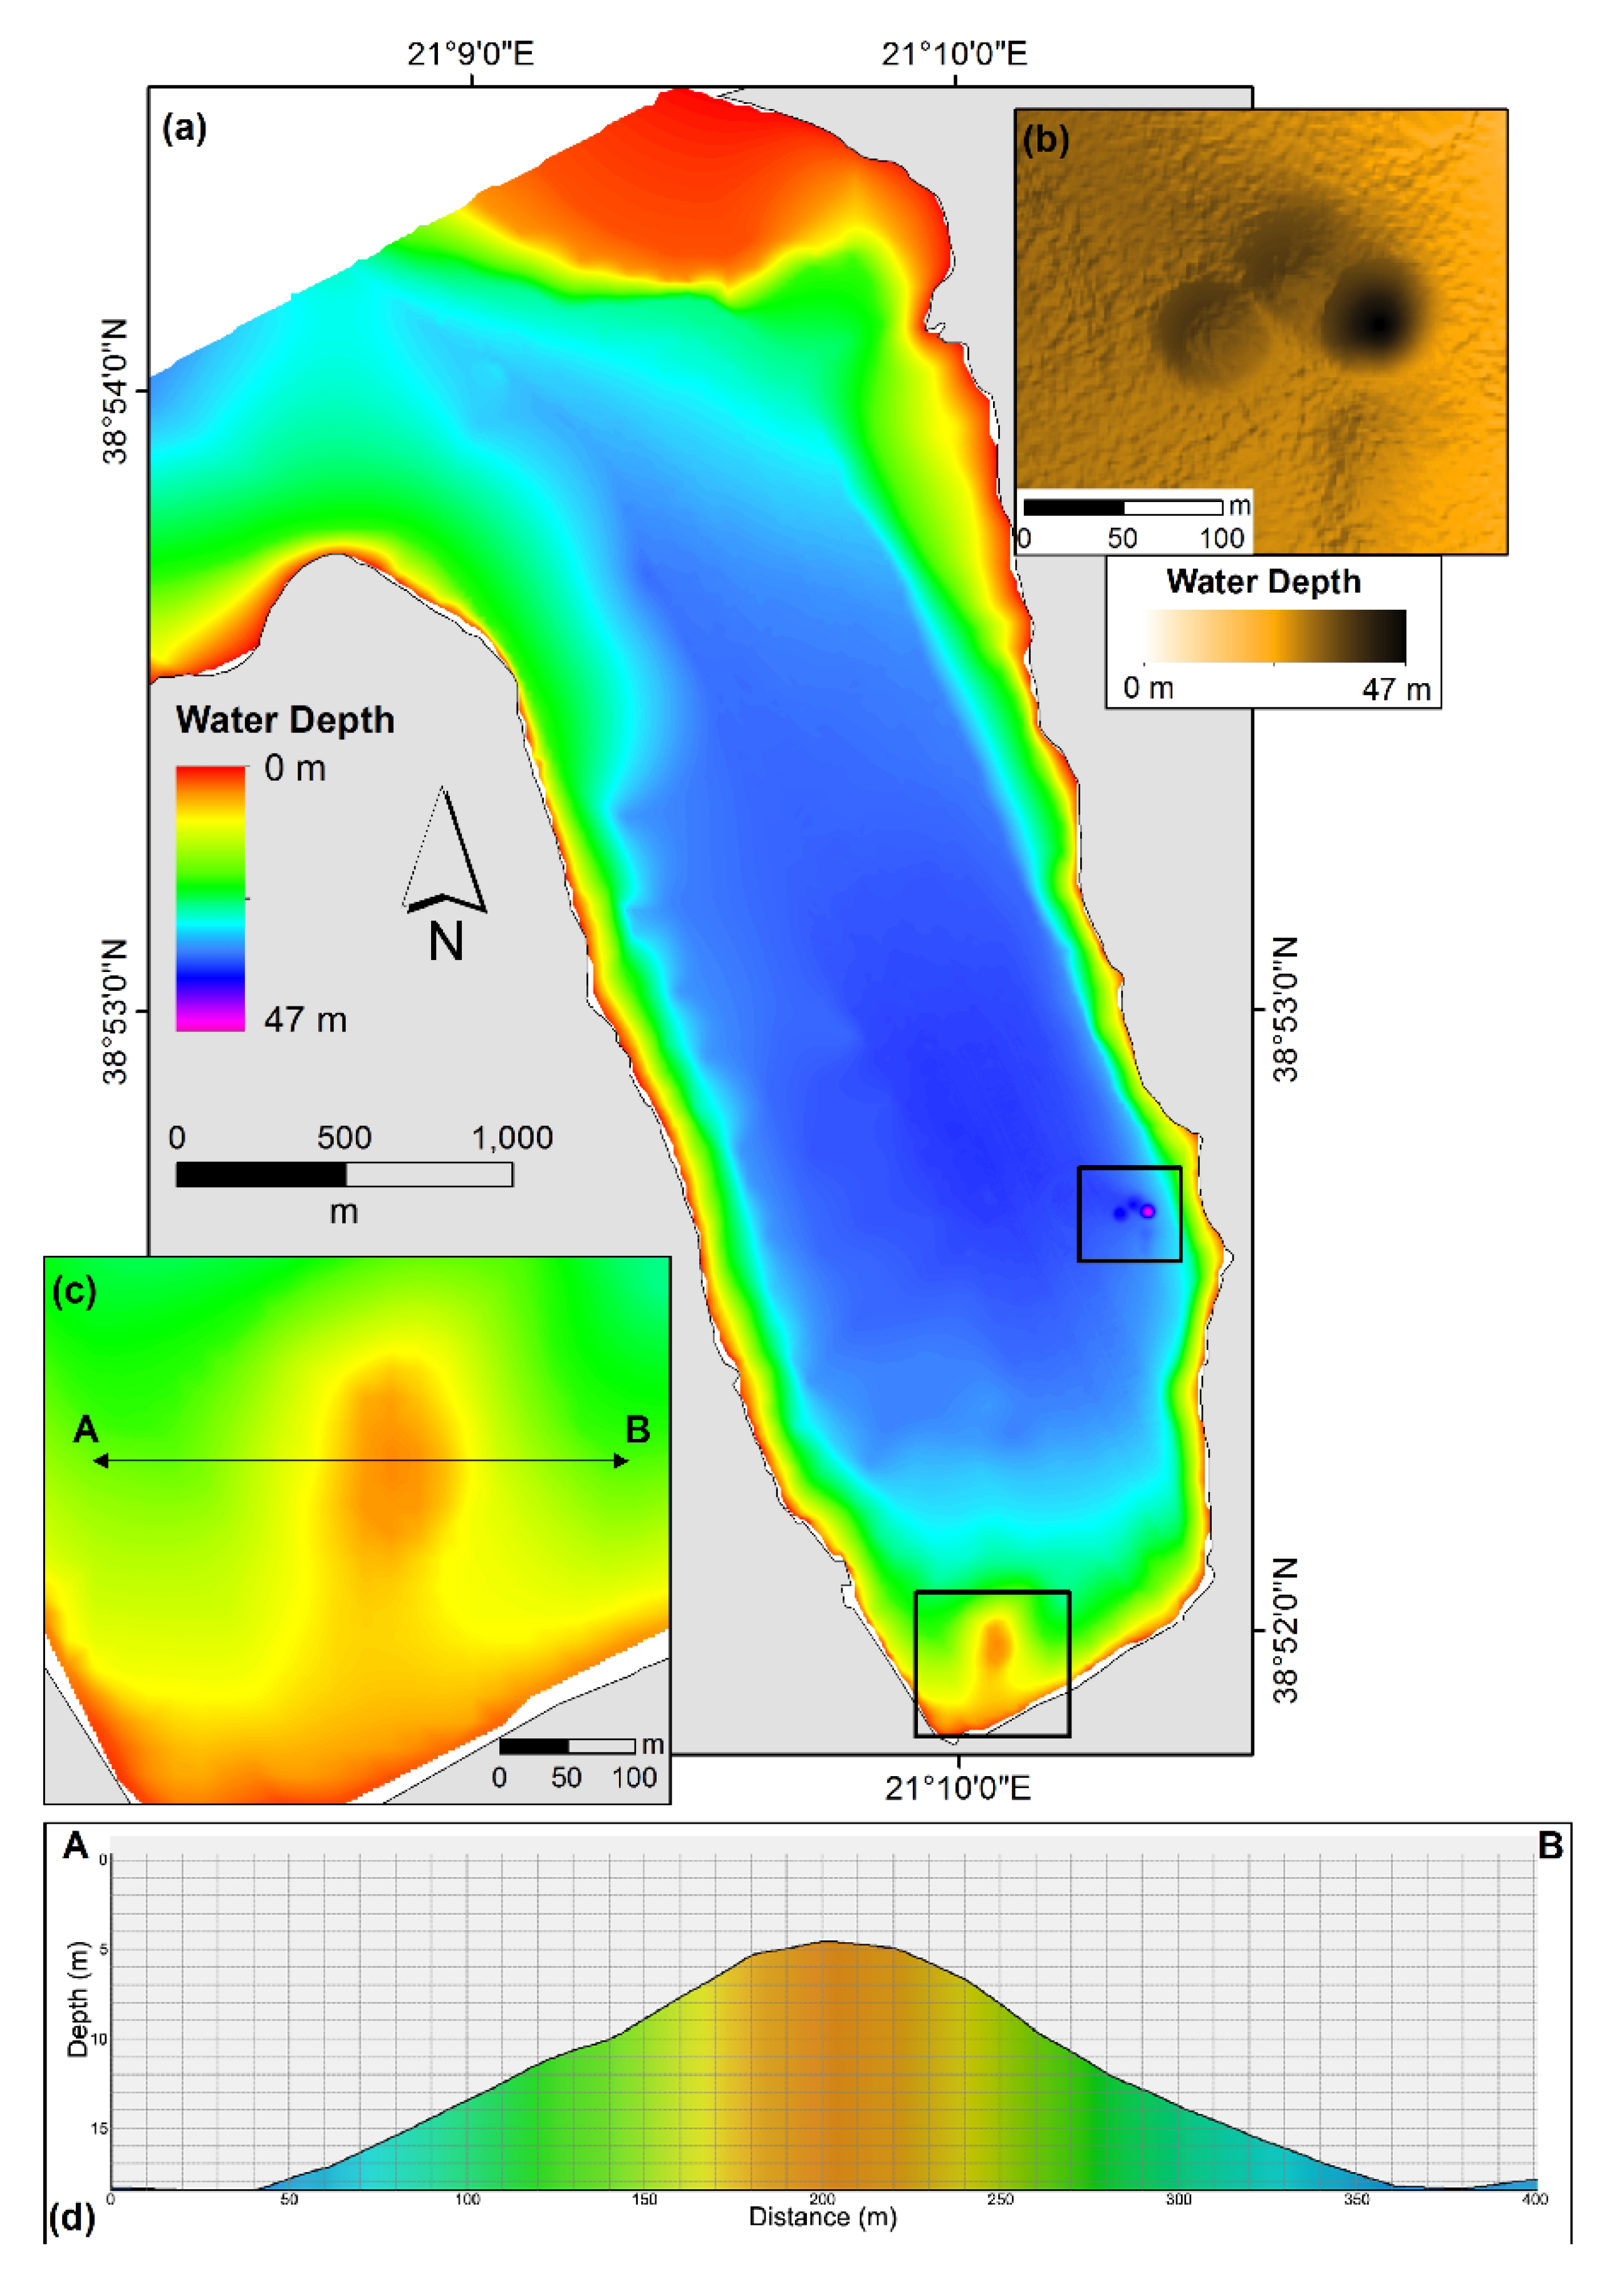
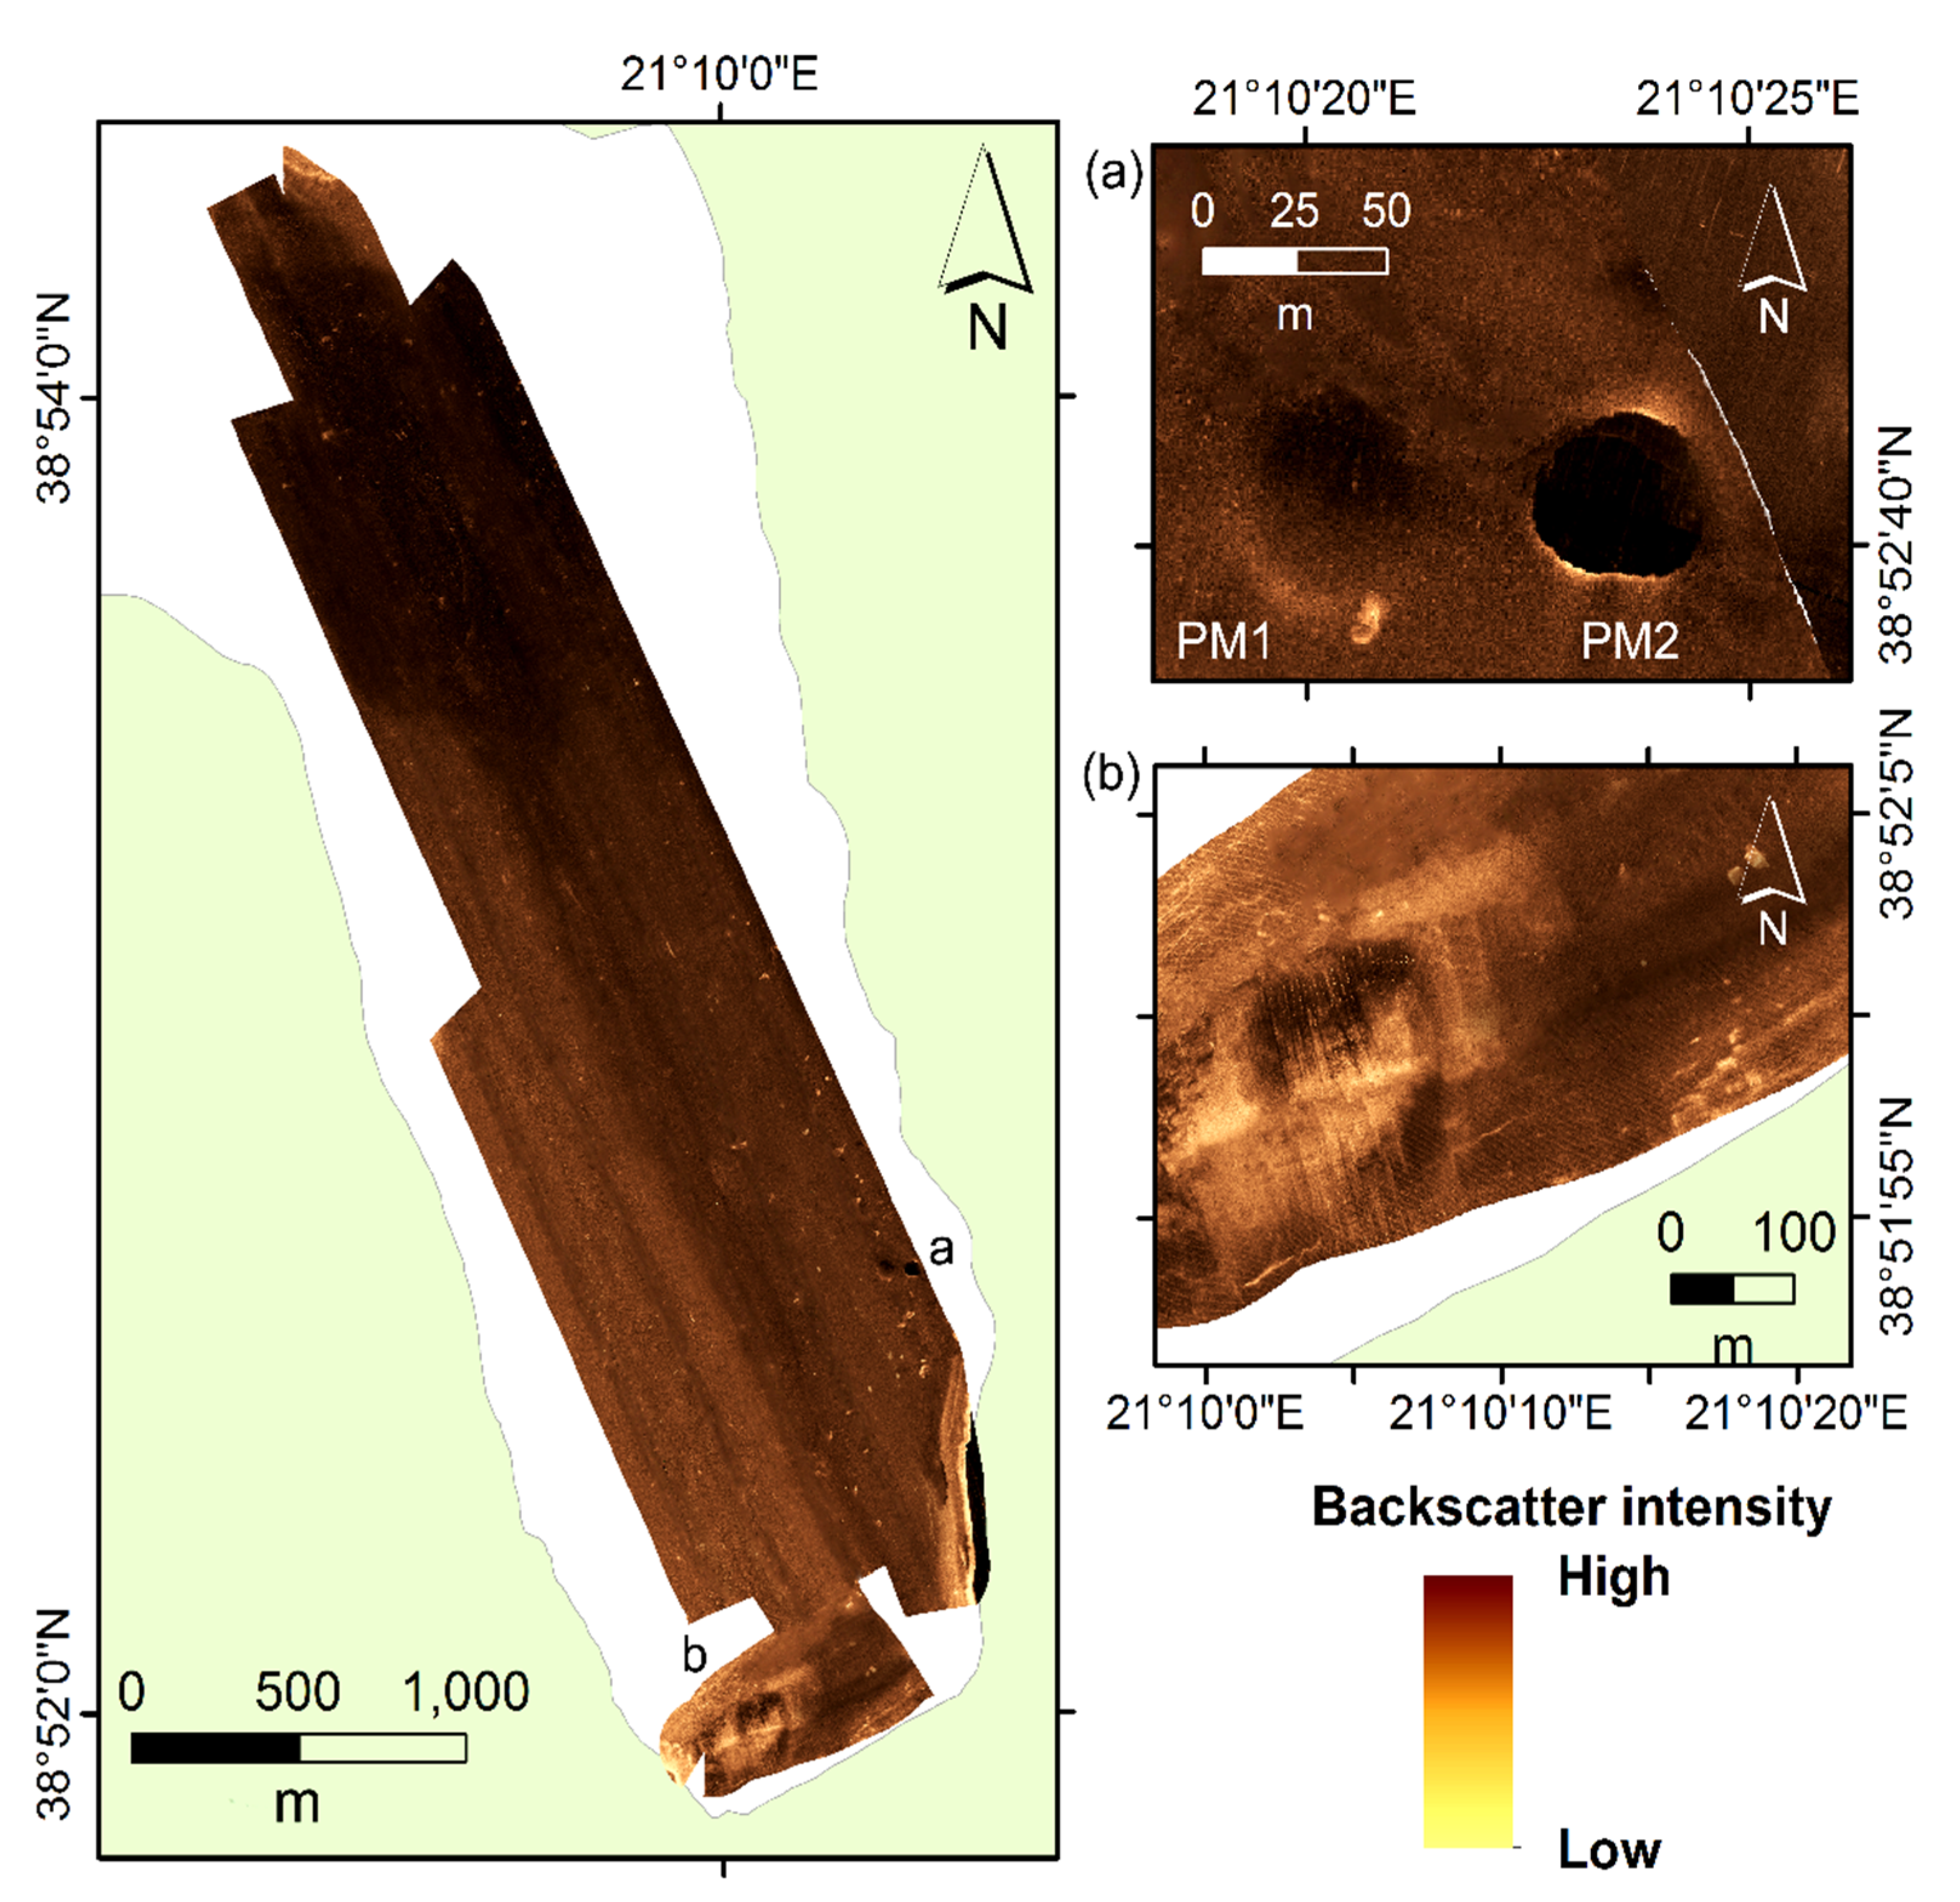
3.1. Multibeam Bathymetric Data and Seafloor Morphology

The MBES bathymetric data showed that the seafloor of Amfilochia Bay is almost flat, with a maximum depth of 47 m (Figure 3). The deepest part of the bay forms a very shallow elongated basin in a NNW-SSE direction, similar to the orientation of the NNW-trending oblique-normal faults that control the topographic relief on the eastern side of the bay (Figure 1a). The seafloor is almost featureless with the exception of two almost circular, dish-shaped shallow depressions that were recorded at the southern-eastern part of the bay (Figure 3b). These depressions were interpreted as pockmarks based on their general appearance that is identically described in many other areas worldwide, e.g., [28].
The two pockmarks are located in proximity to each other and to the eastern coastline of the bay. The first (Figure 3b; PM1) is the largest of the two and has an aerial extent of 1,500 m2. Its diameter is about 40 m, and the maximum depth is 38 m, which is 8 m deeper than the surrounding seafloor. PM1 can be considered a composite pockmark, since it was formed comprising a main and a secondary crater as recorded by the MBES data. The second pockmark (PM2) has an aerial extent of 2,600 m2, a diameter of about 53 m, a maximum water depth of 35 m and is 2 m deeper than the surrounding seafloor (Figure 3a). Pockmark PM1 was the specific site that was chosen to be further investigated through the small-scale hydrographic survey and by the MEDUSA platform (Figure 1c,d; Station 30).
MBES data revealed the presence of a small protruding seafloor mound that has a ~100 m radius and ~6–14 m height compared to the surrounding seafloor, which is ~20–10 m deep (Figure 3c). The mound is located very close to the coast, at the southern end of Amfilochia Bay and in the approximate location that Miaoulis [12] indicated the existence of a “volcano”.
The 100 kHz side scan sonar mosaic also showed that the seafloor of Amfilochia Bay is flat and almost featureless. The side scan sonar data revealed that the seafloor of Amfilochia Bay is characterized, in general, by low reflectivity which is indicative of the fine texture of the sediments (fine-grained sediments). Areas of high reflectivity at the southernmost end on the bay represent the protruding mound (Figure 4b) and the rocky coastal slopes on the south-east. Very low reflectivity areas were recorded at the northern part of Amfilochia Bay (Figure 4). The two pockmarks were apparent also in the side scan sonar records, off the south-eastern coast of the bay (Figure 4a), exhibiting acoustic signal similar to that occurring in other worldwide sites [28].

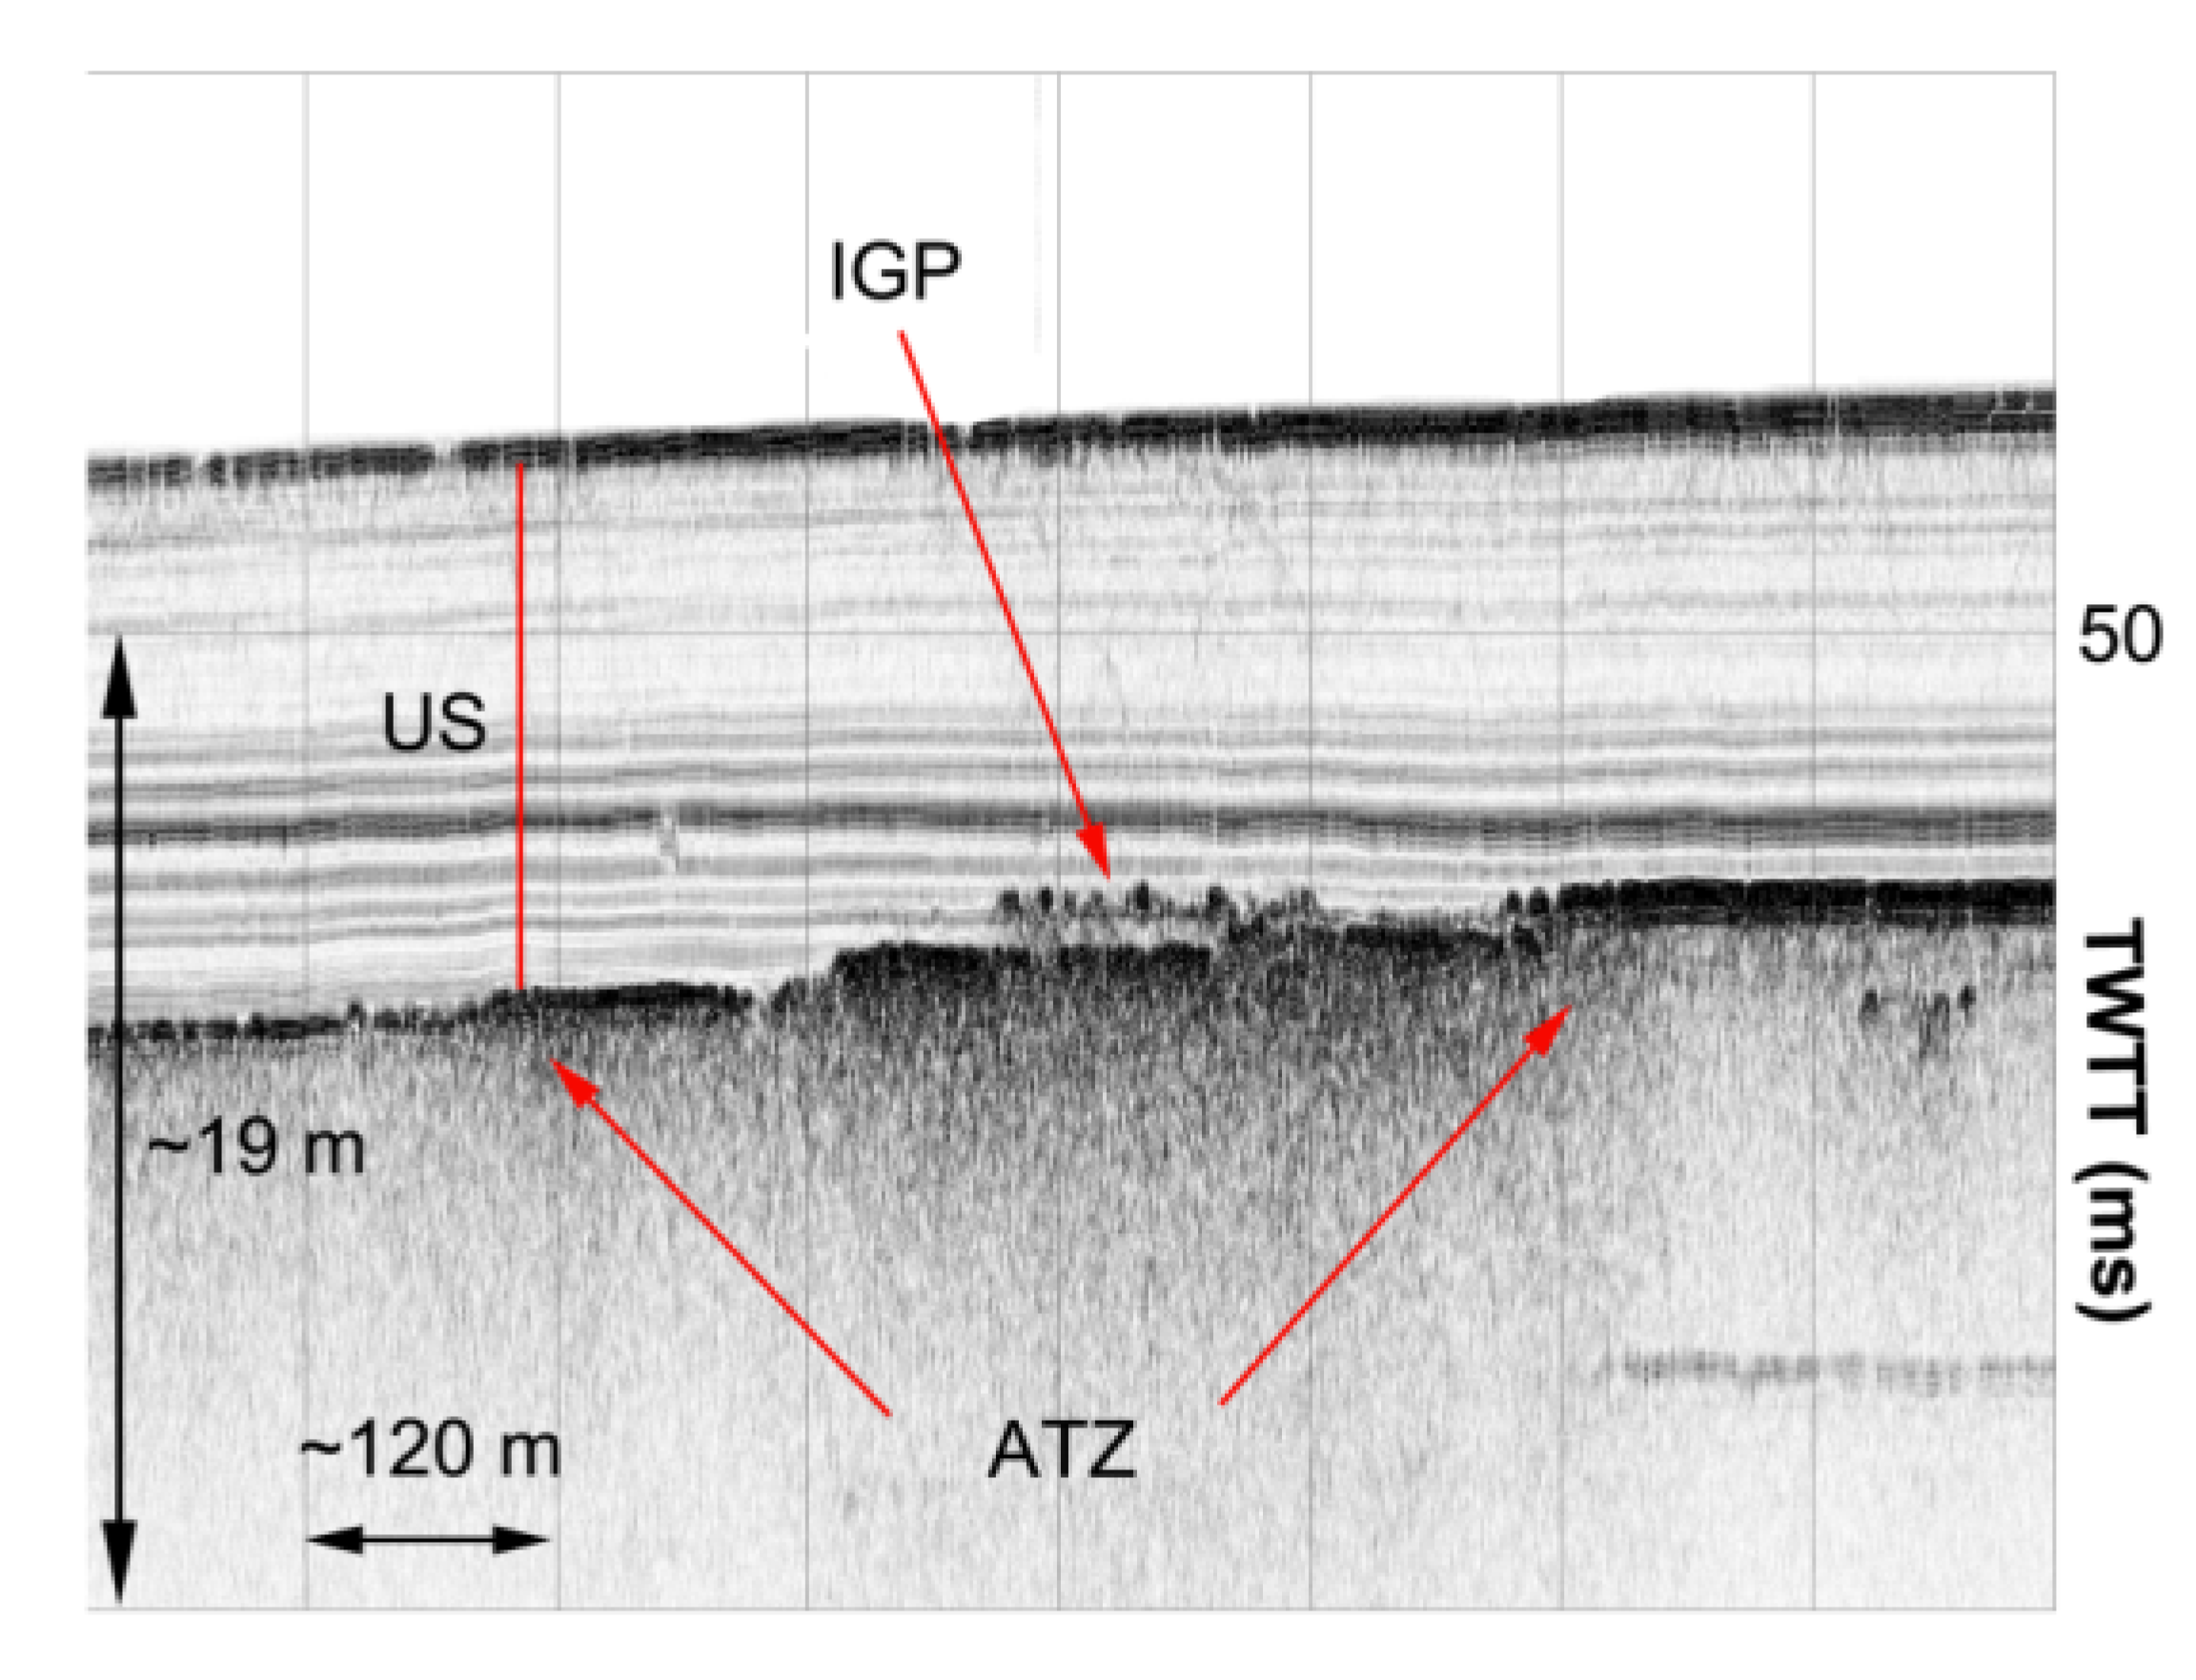
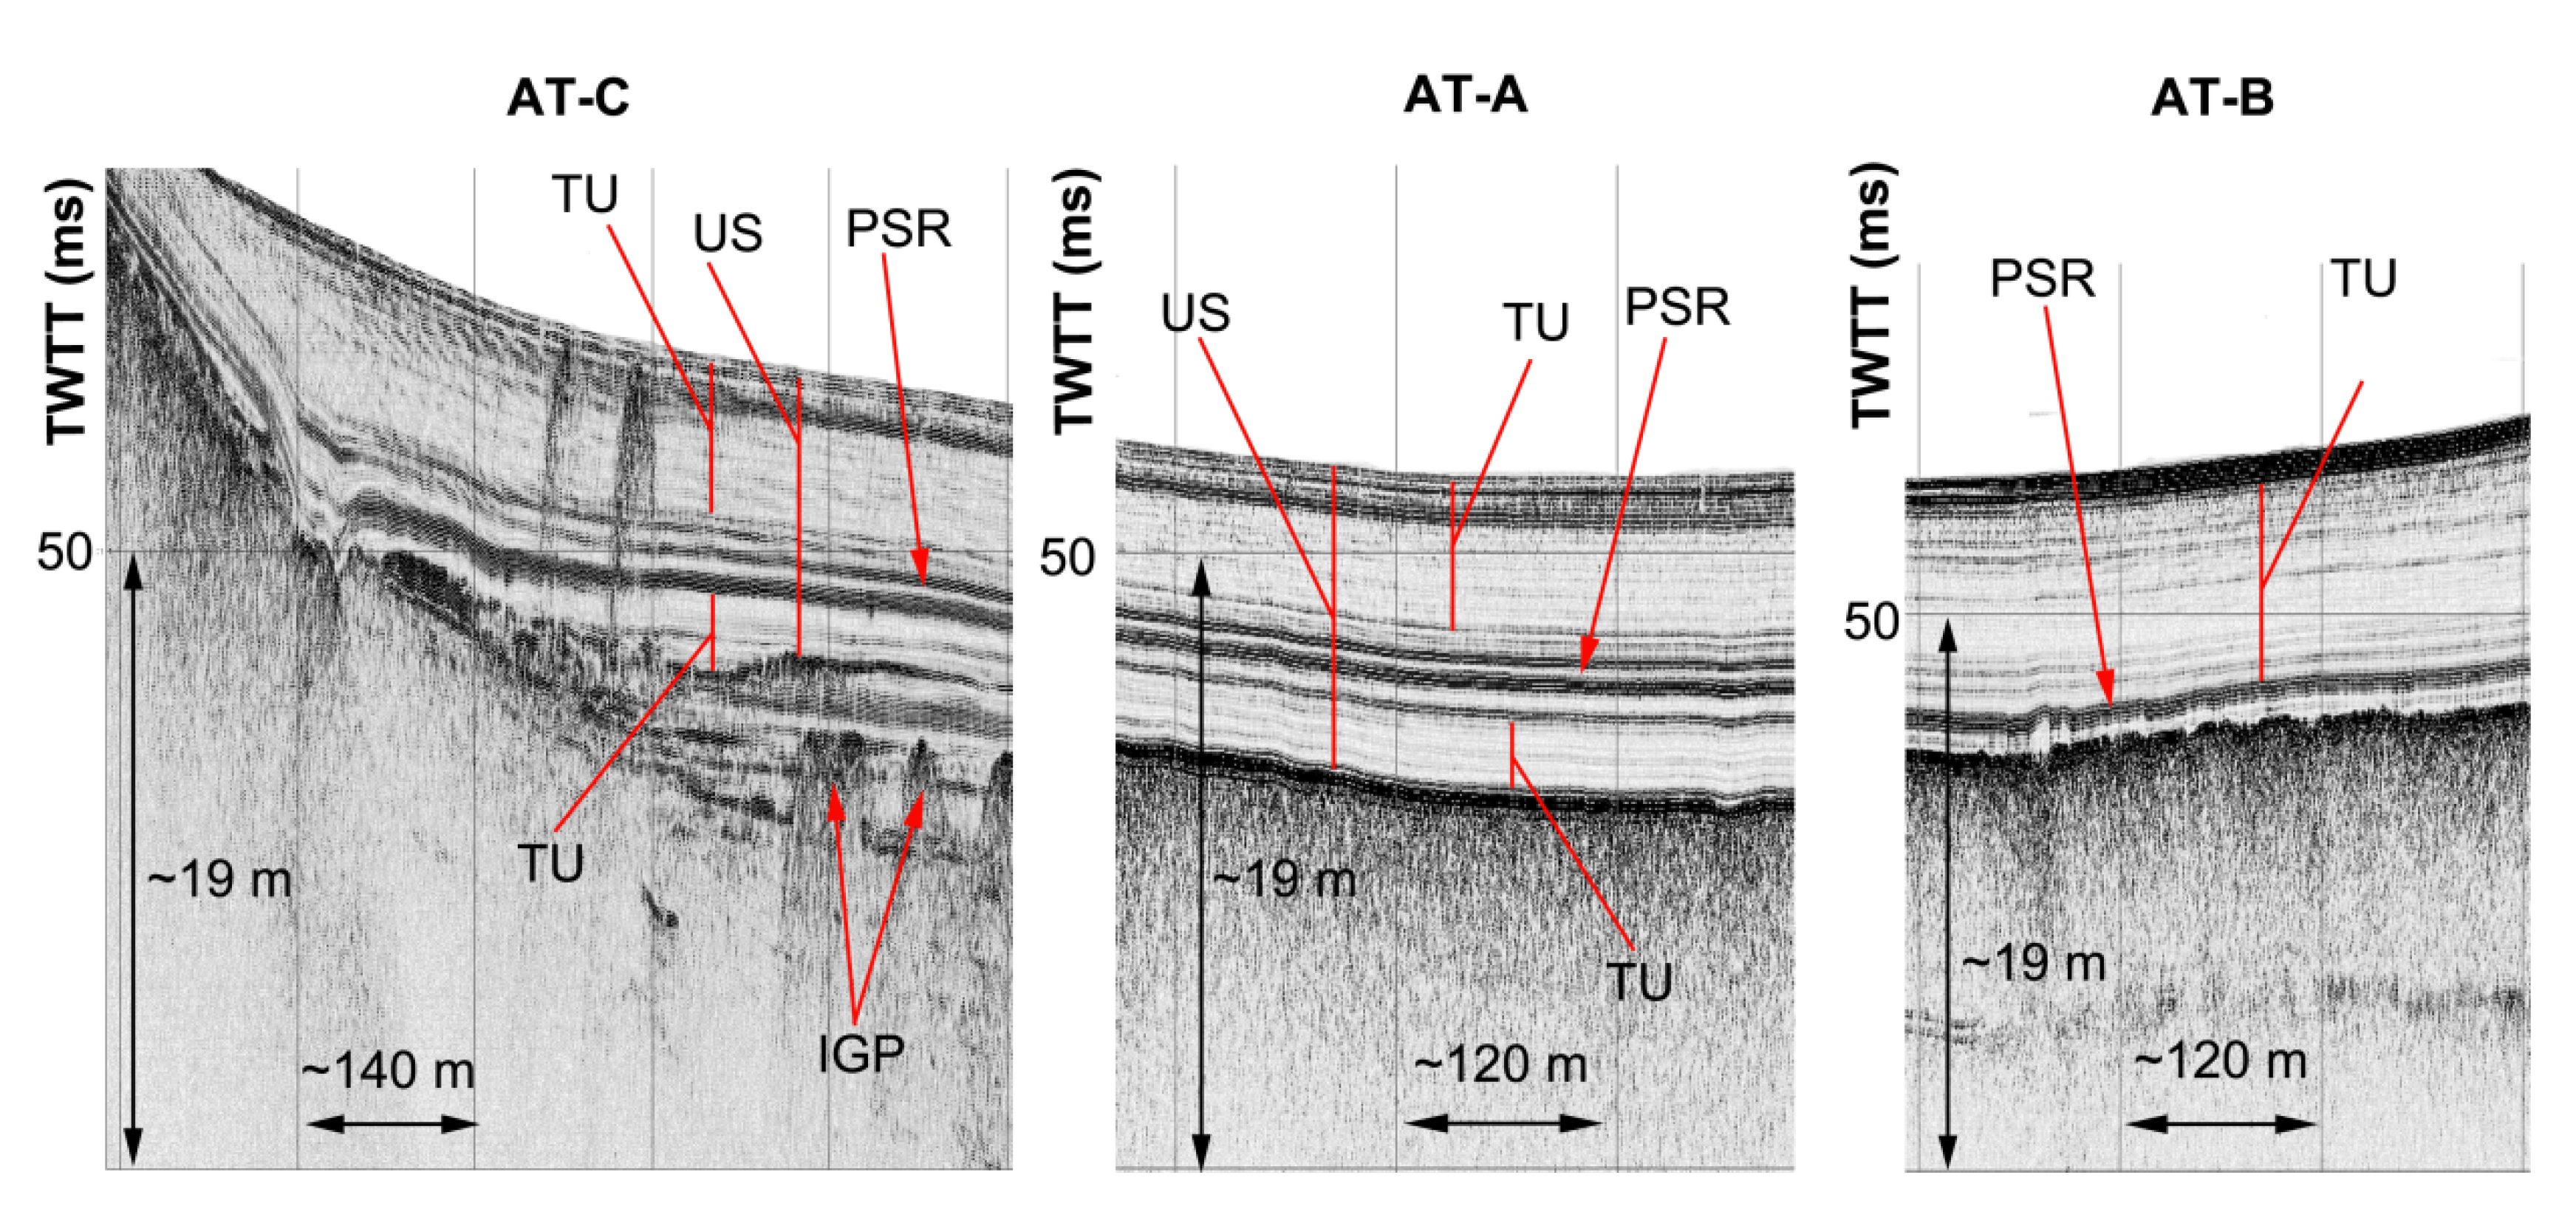
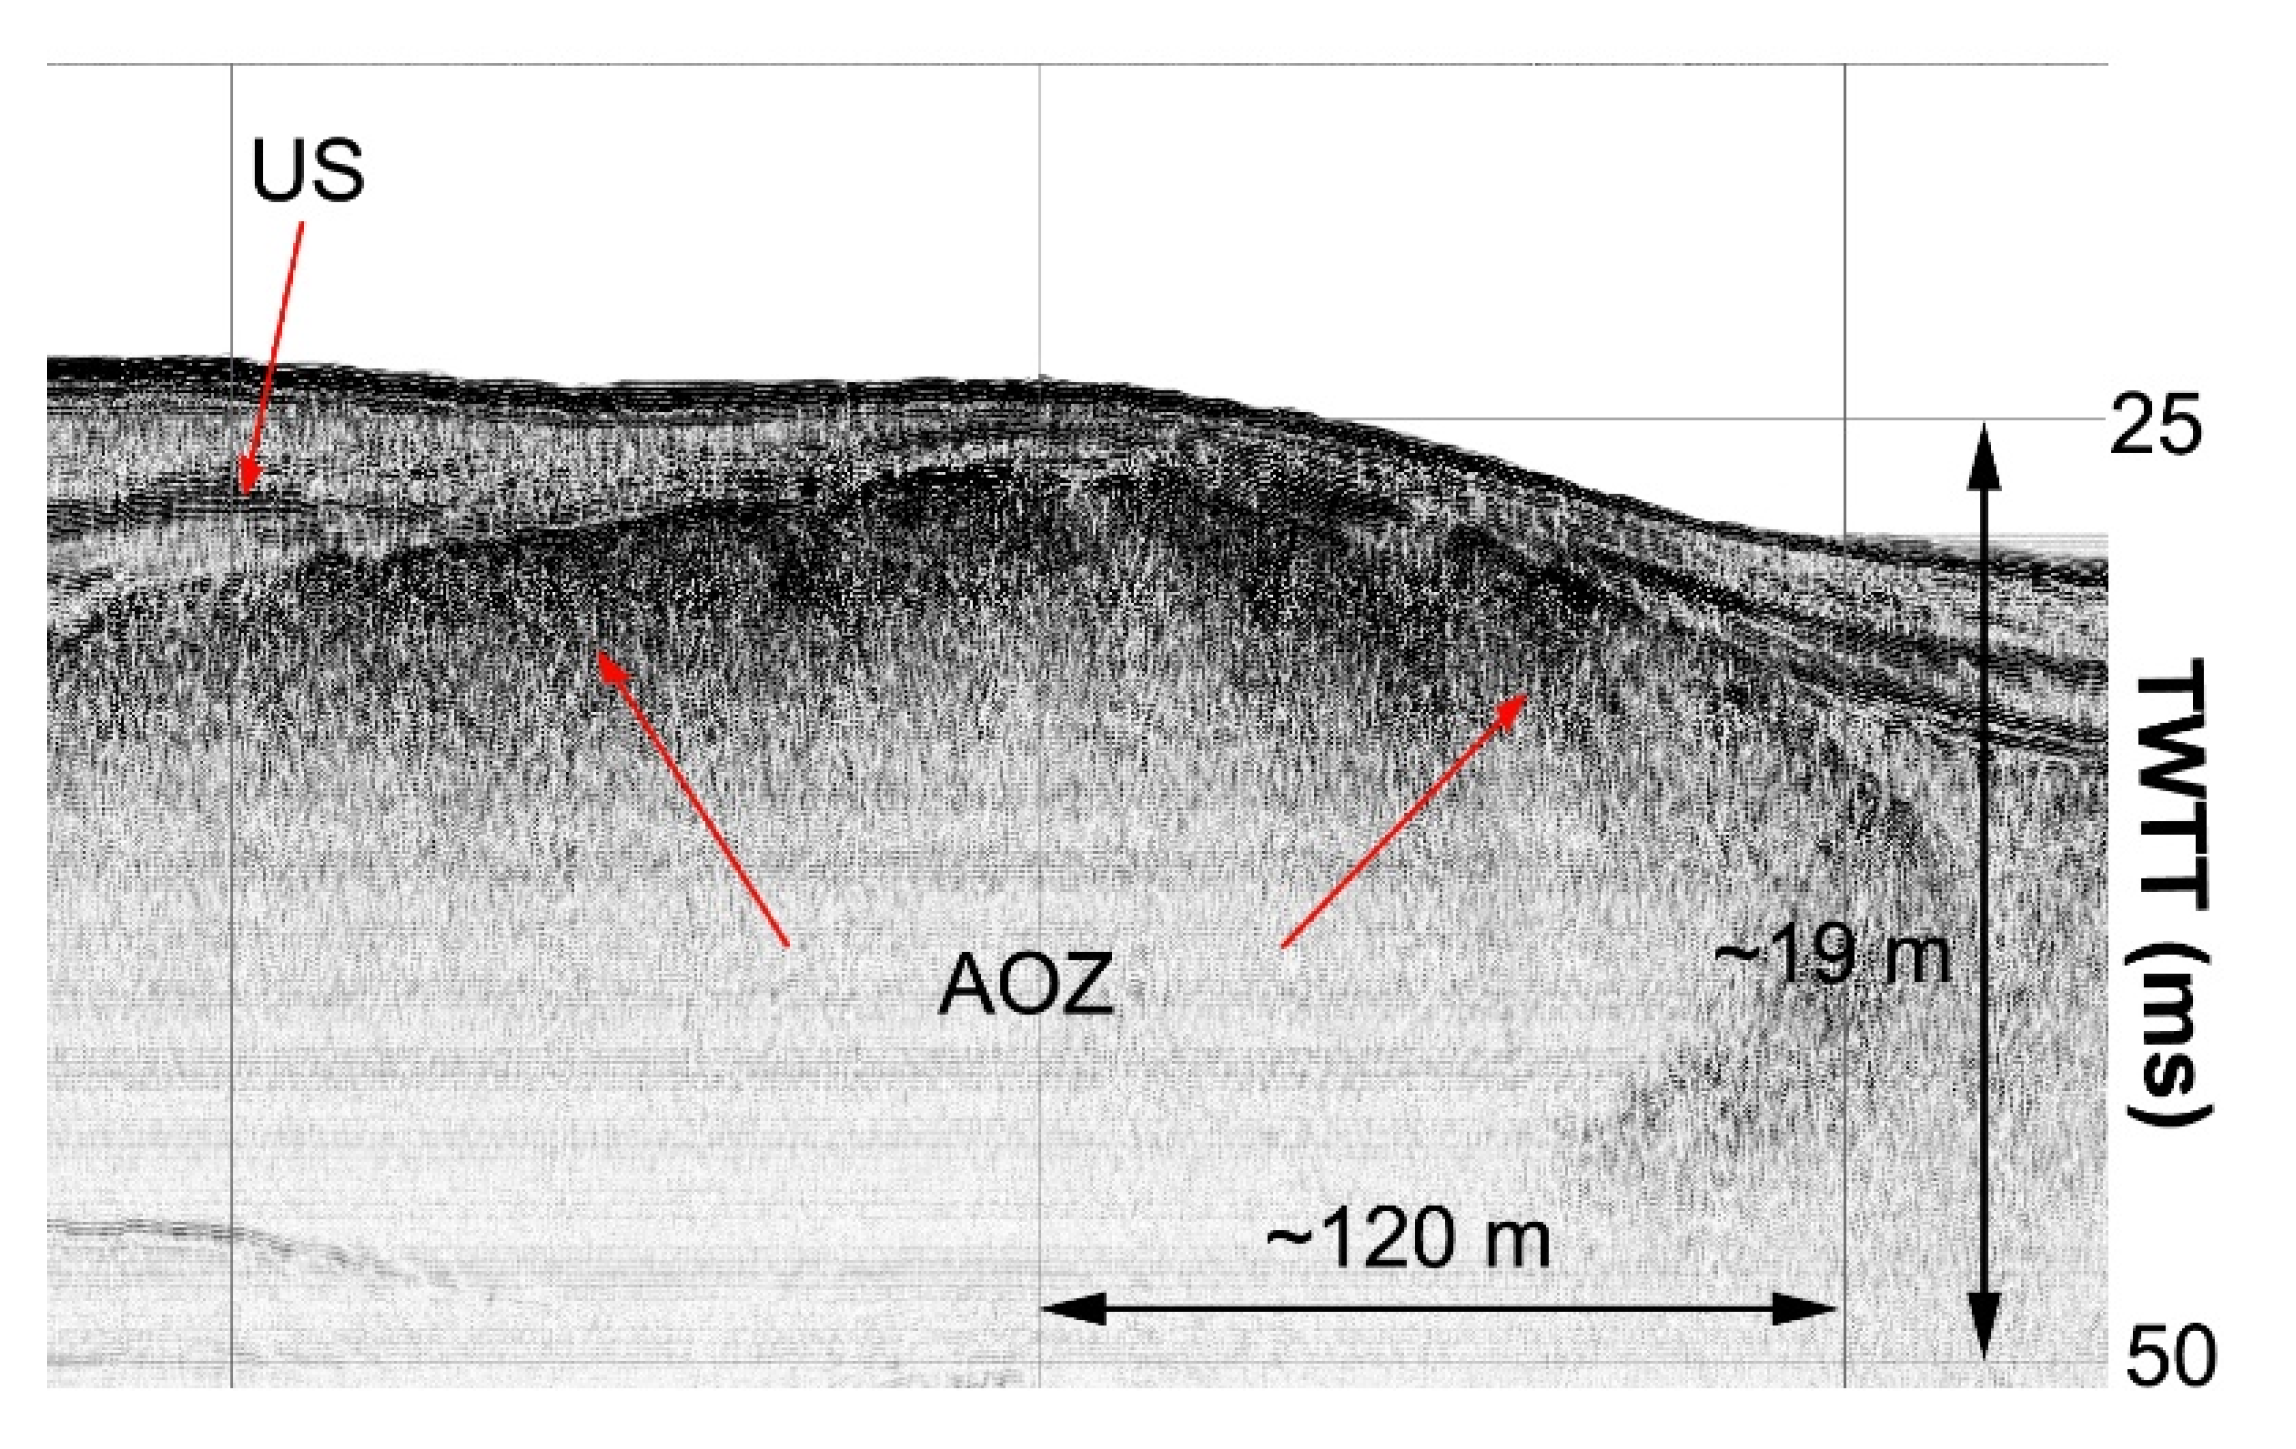
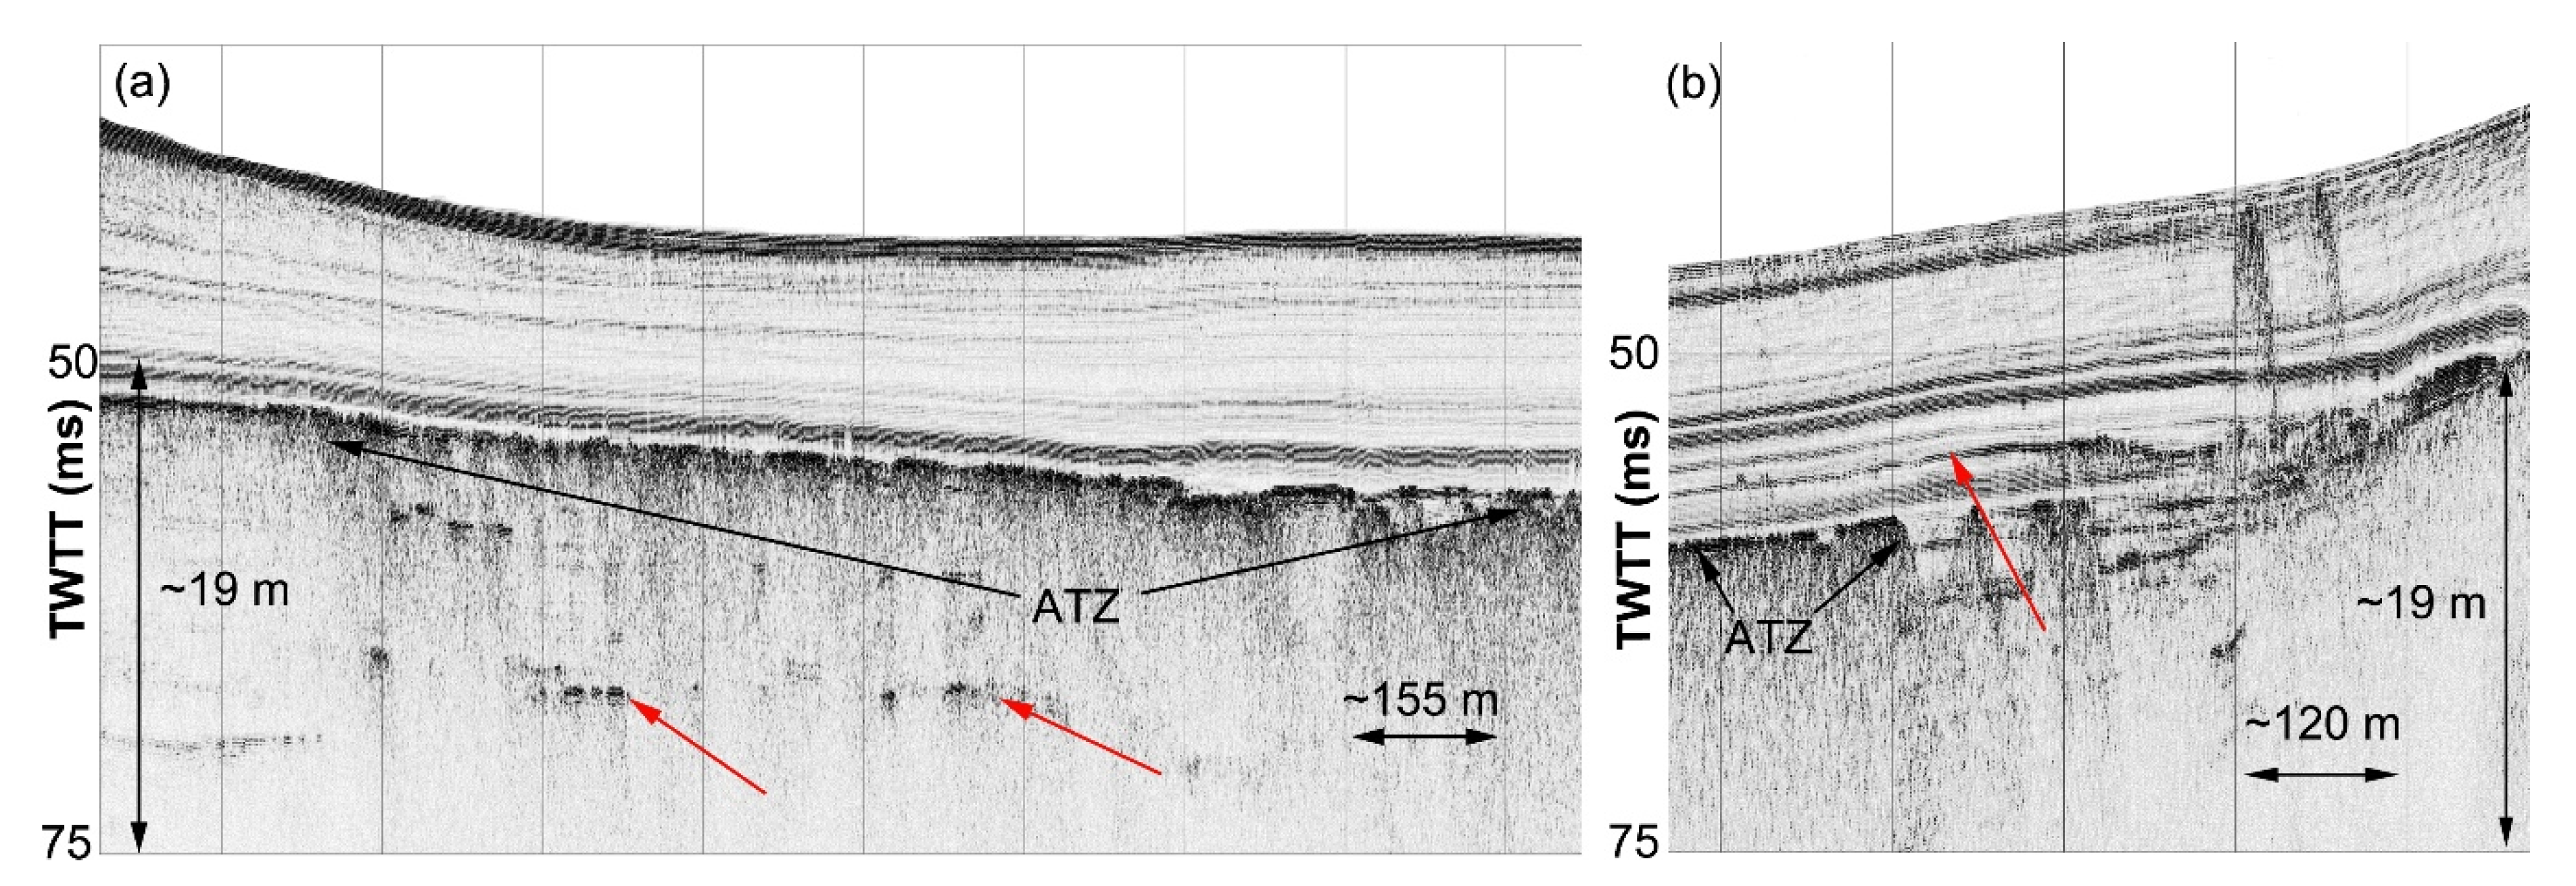
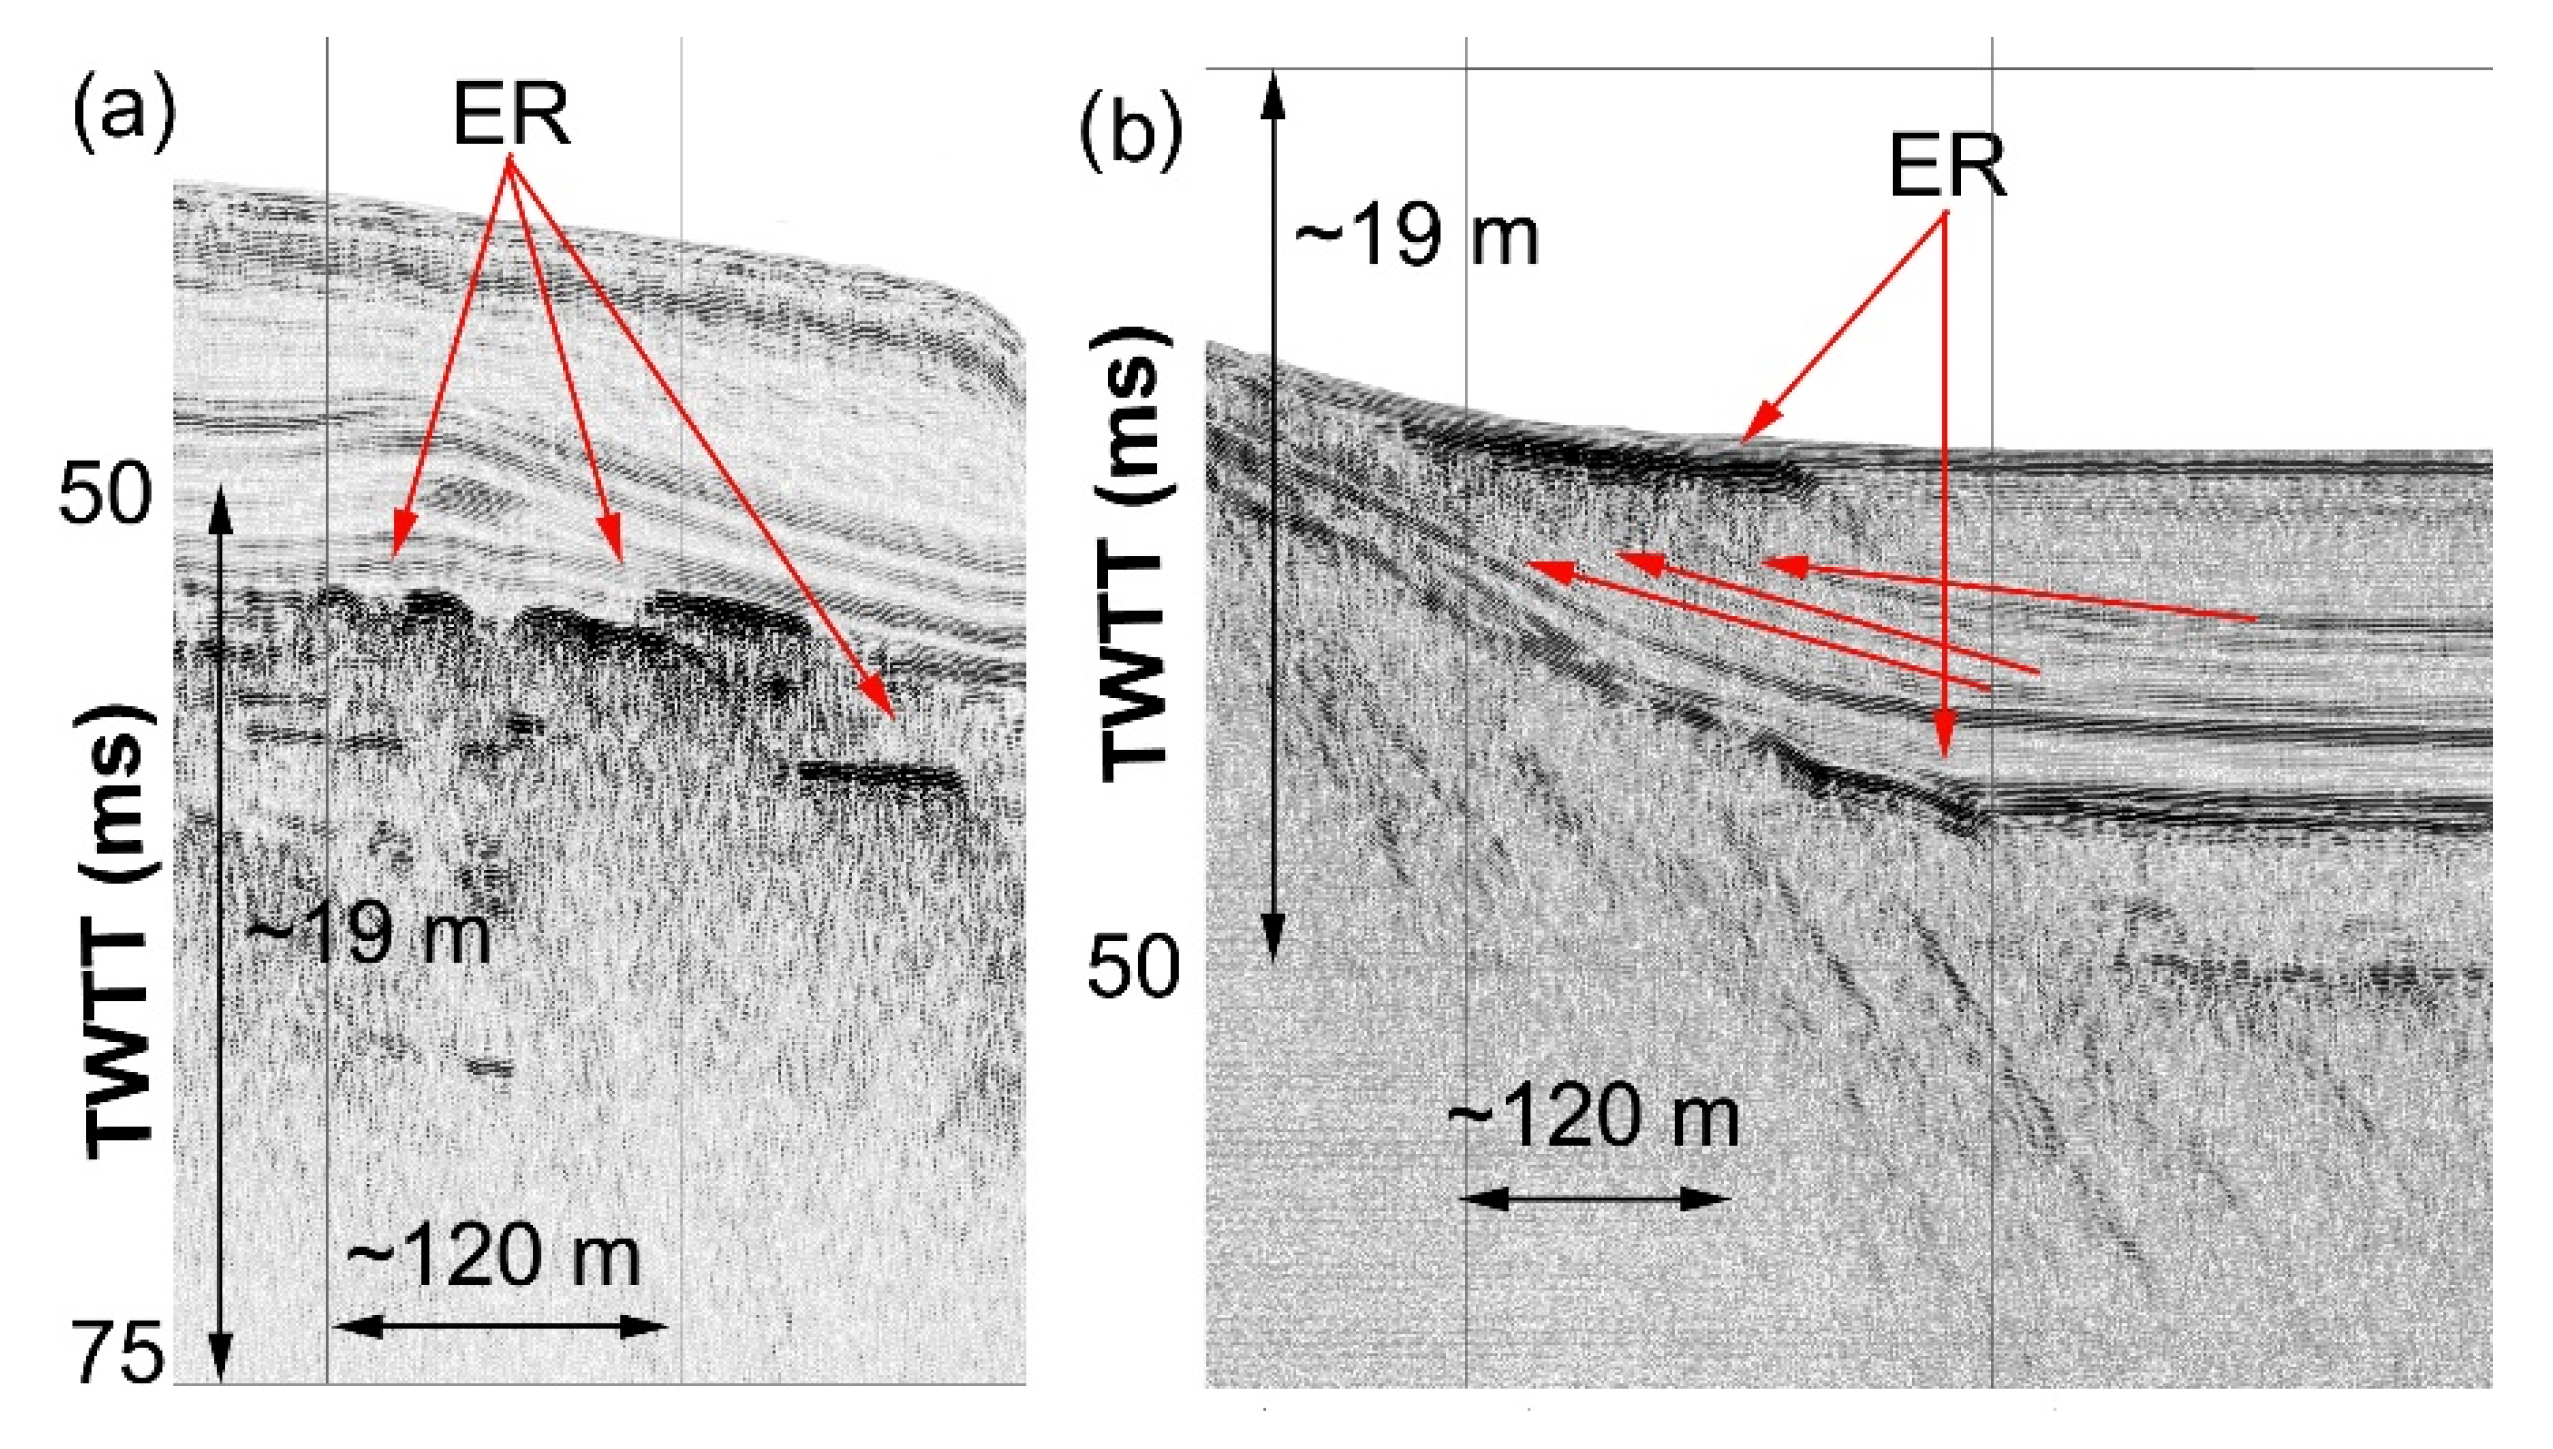
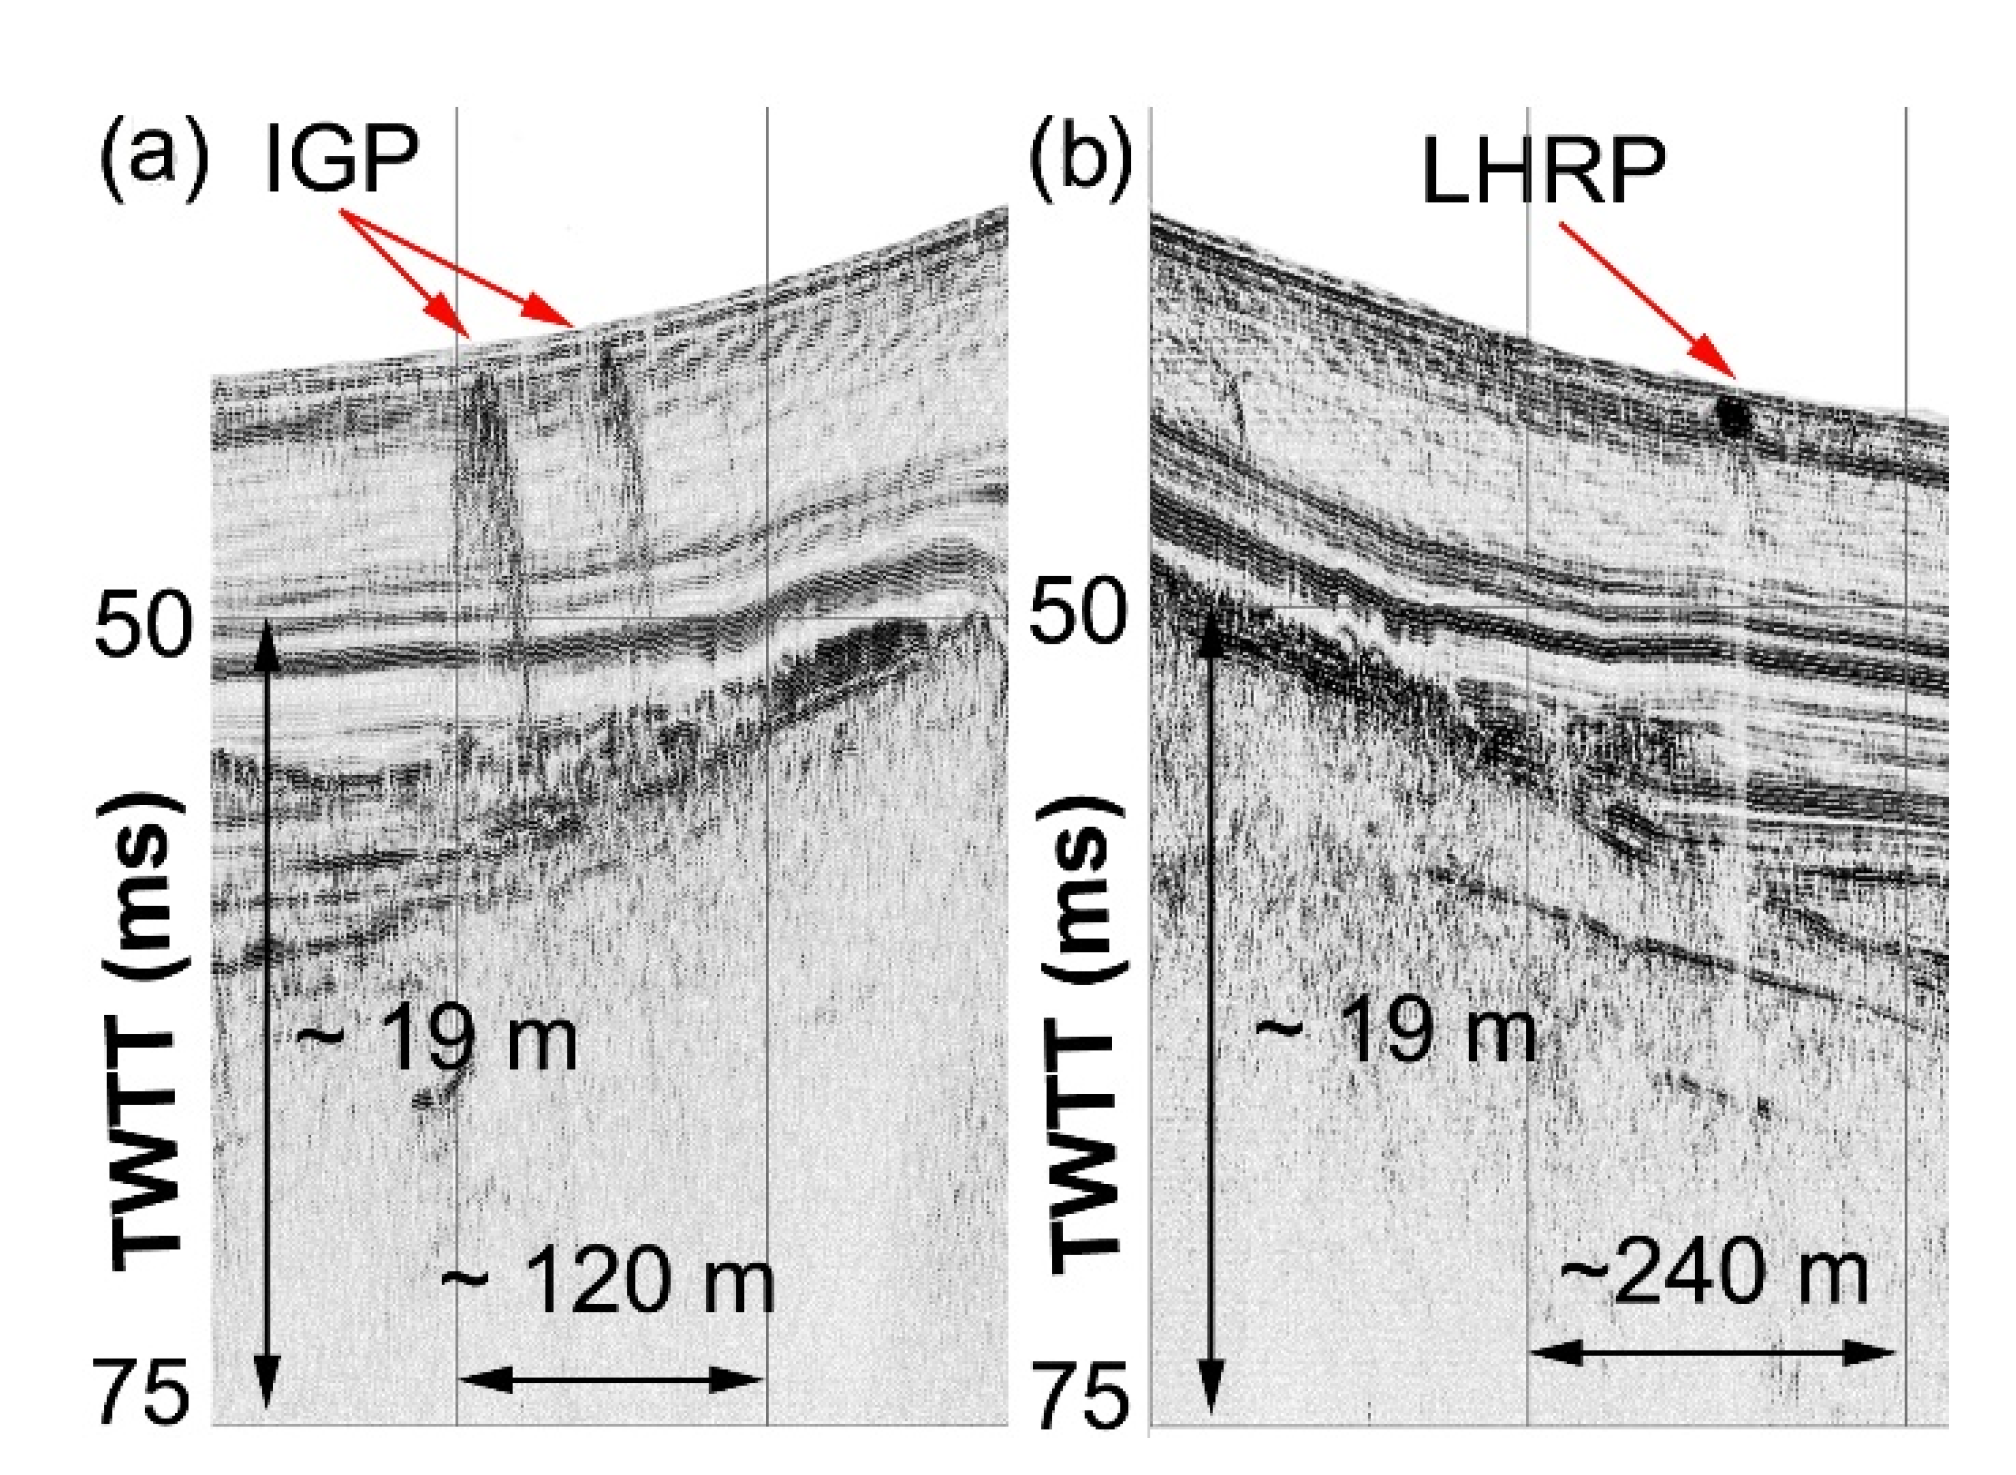
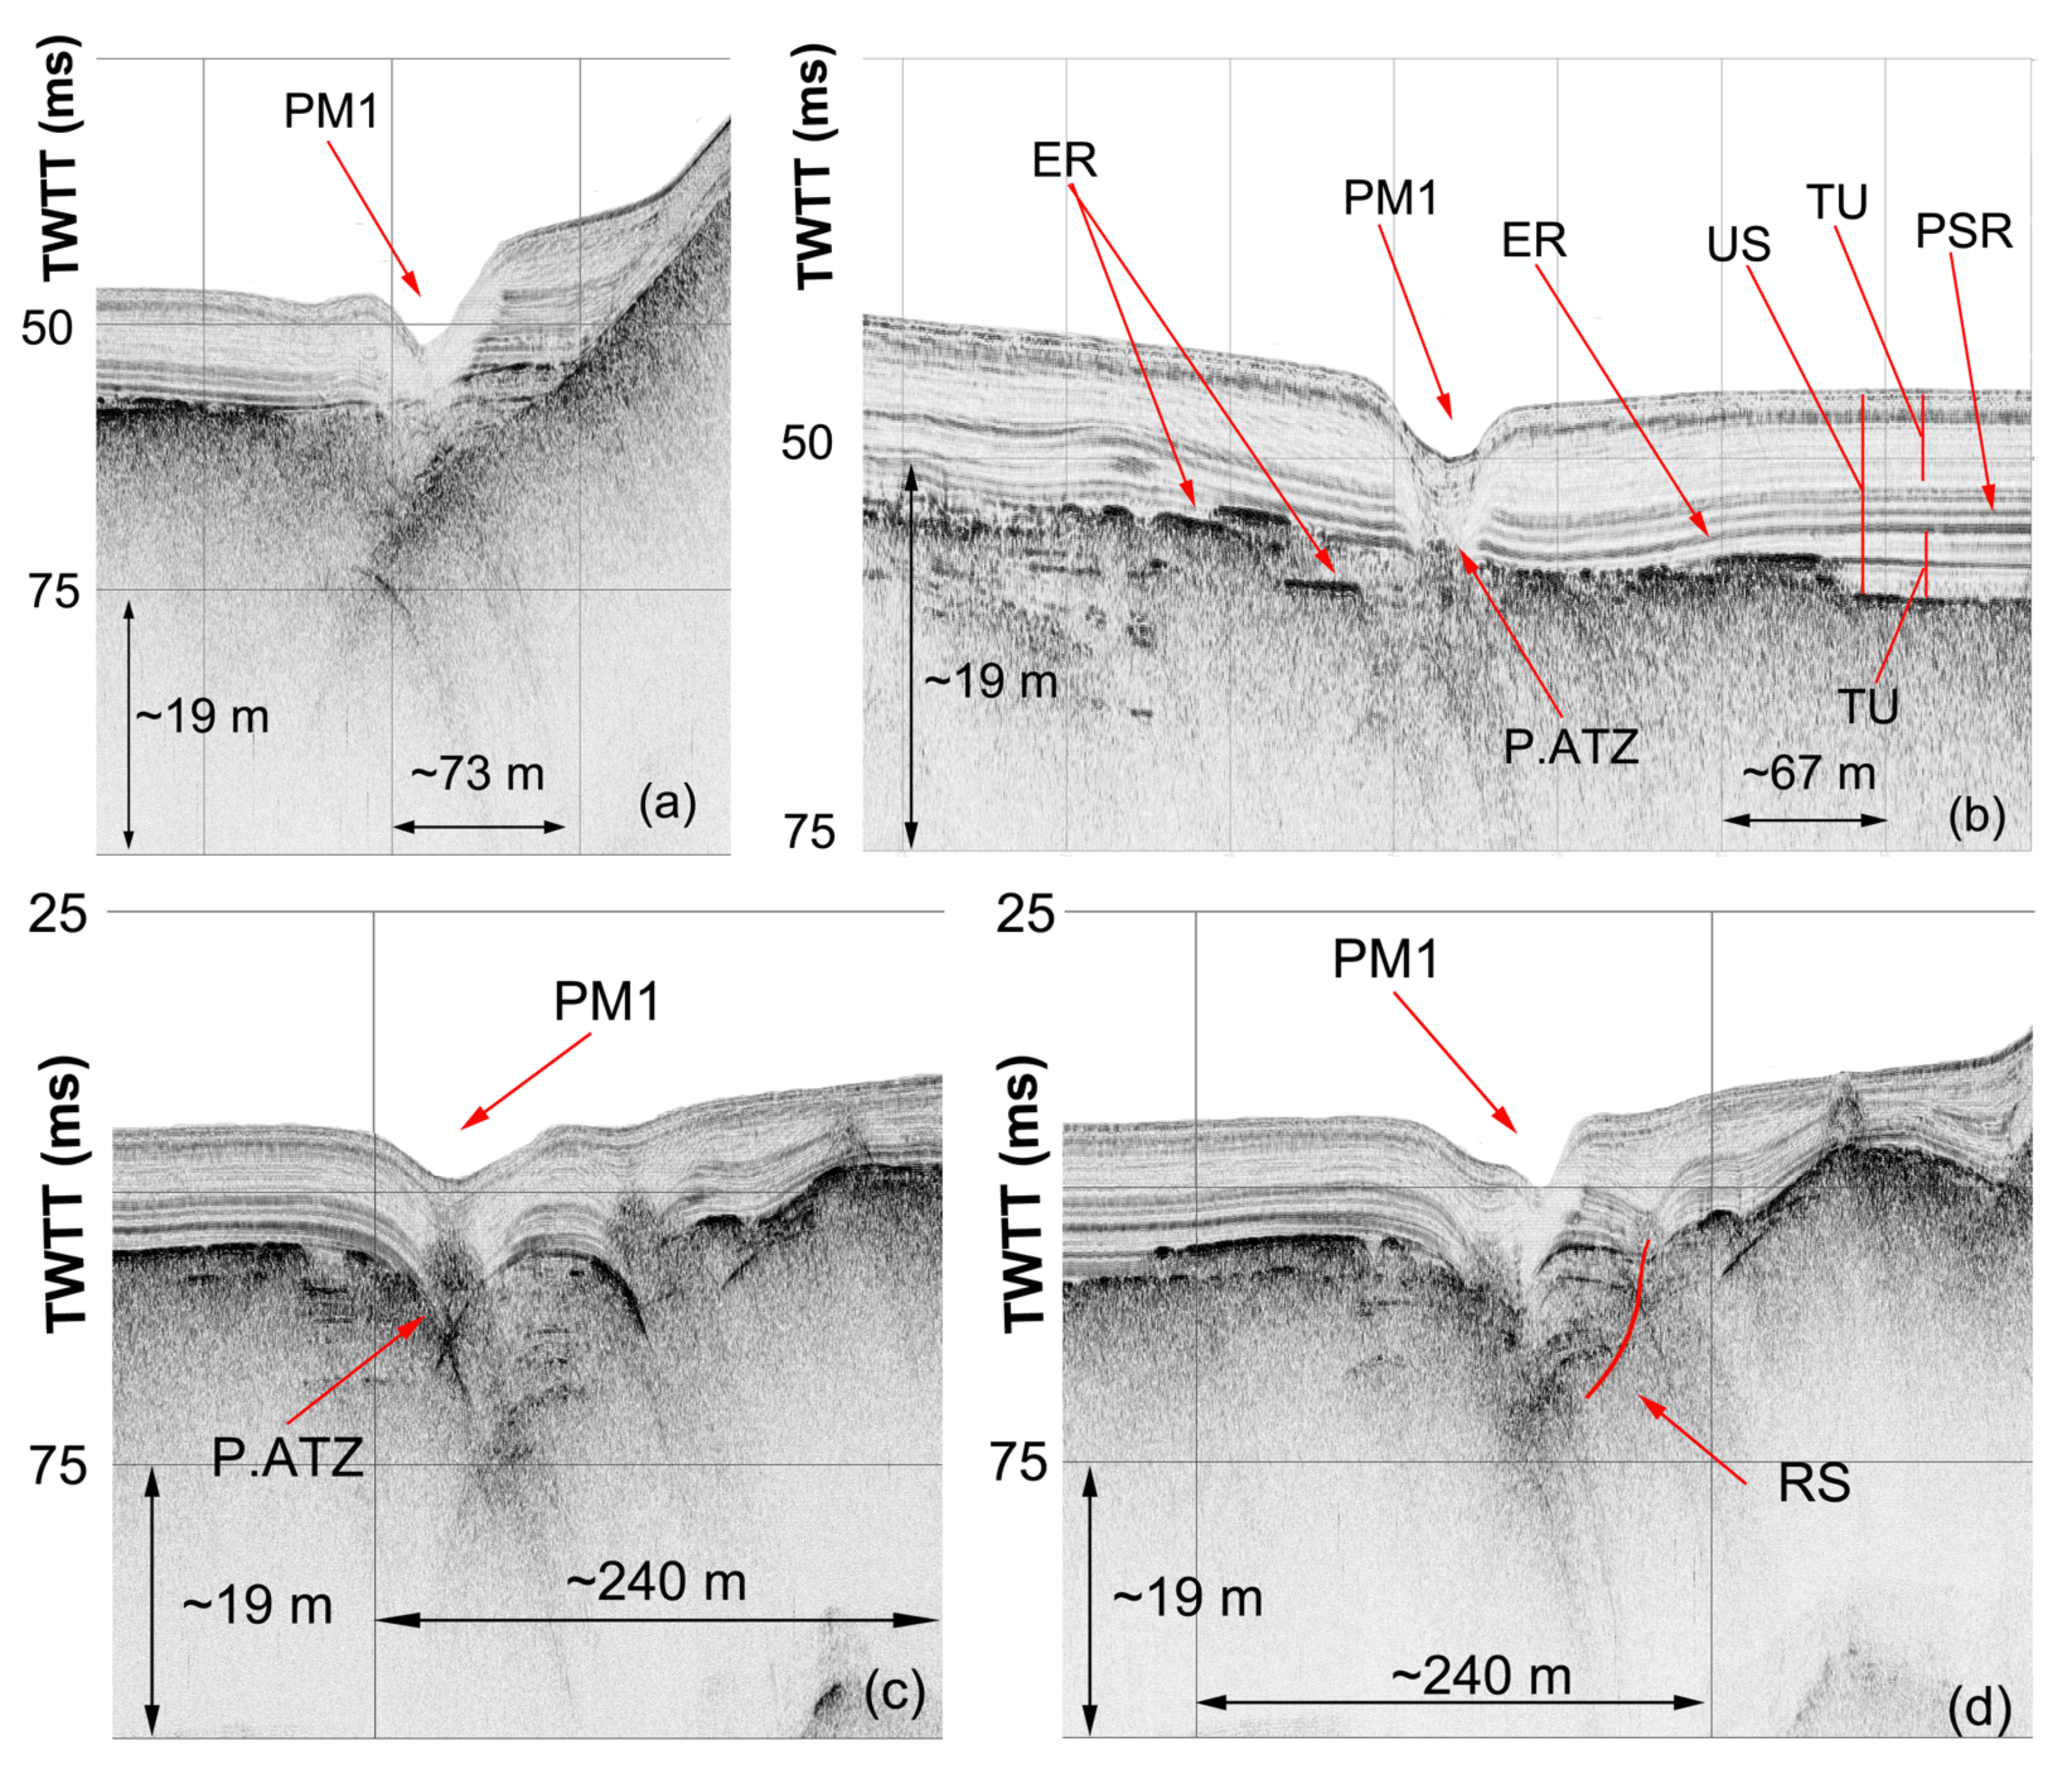
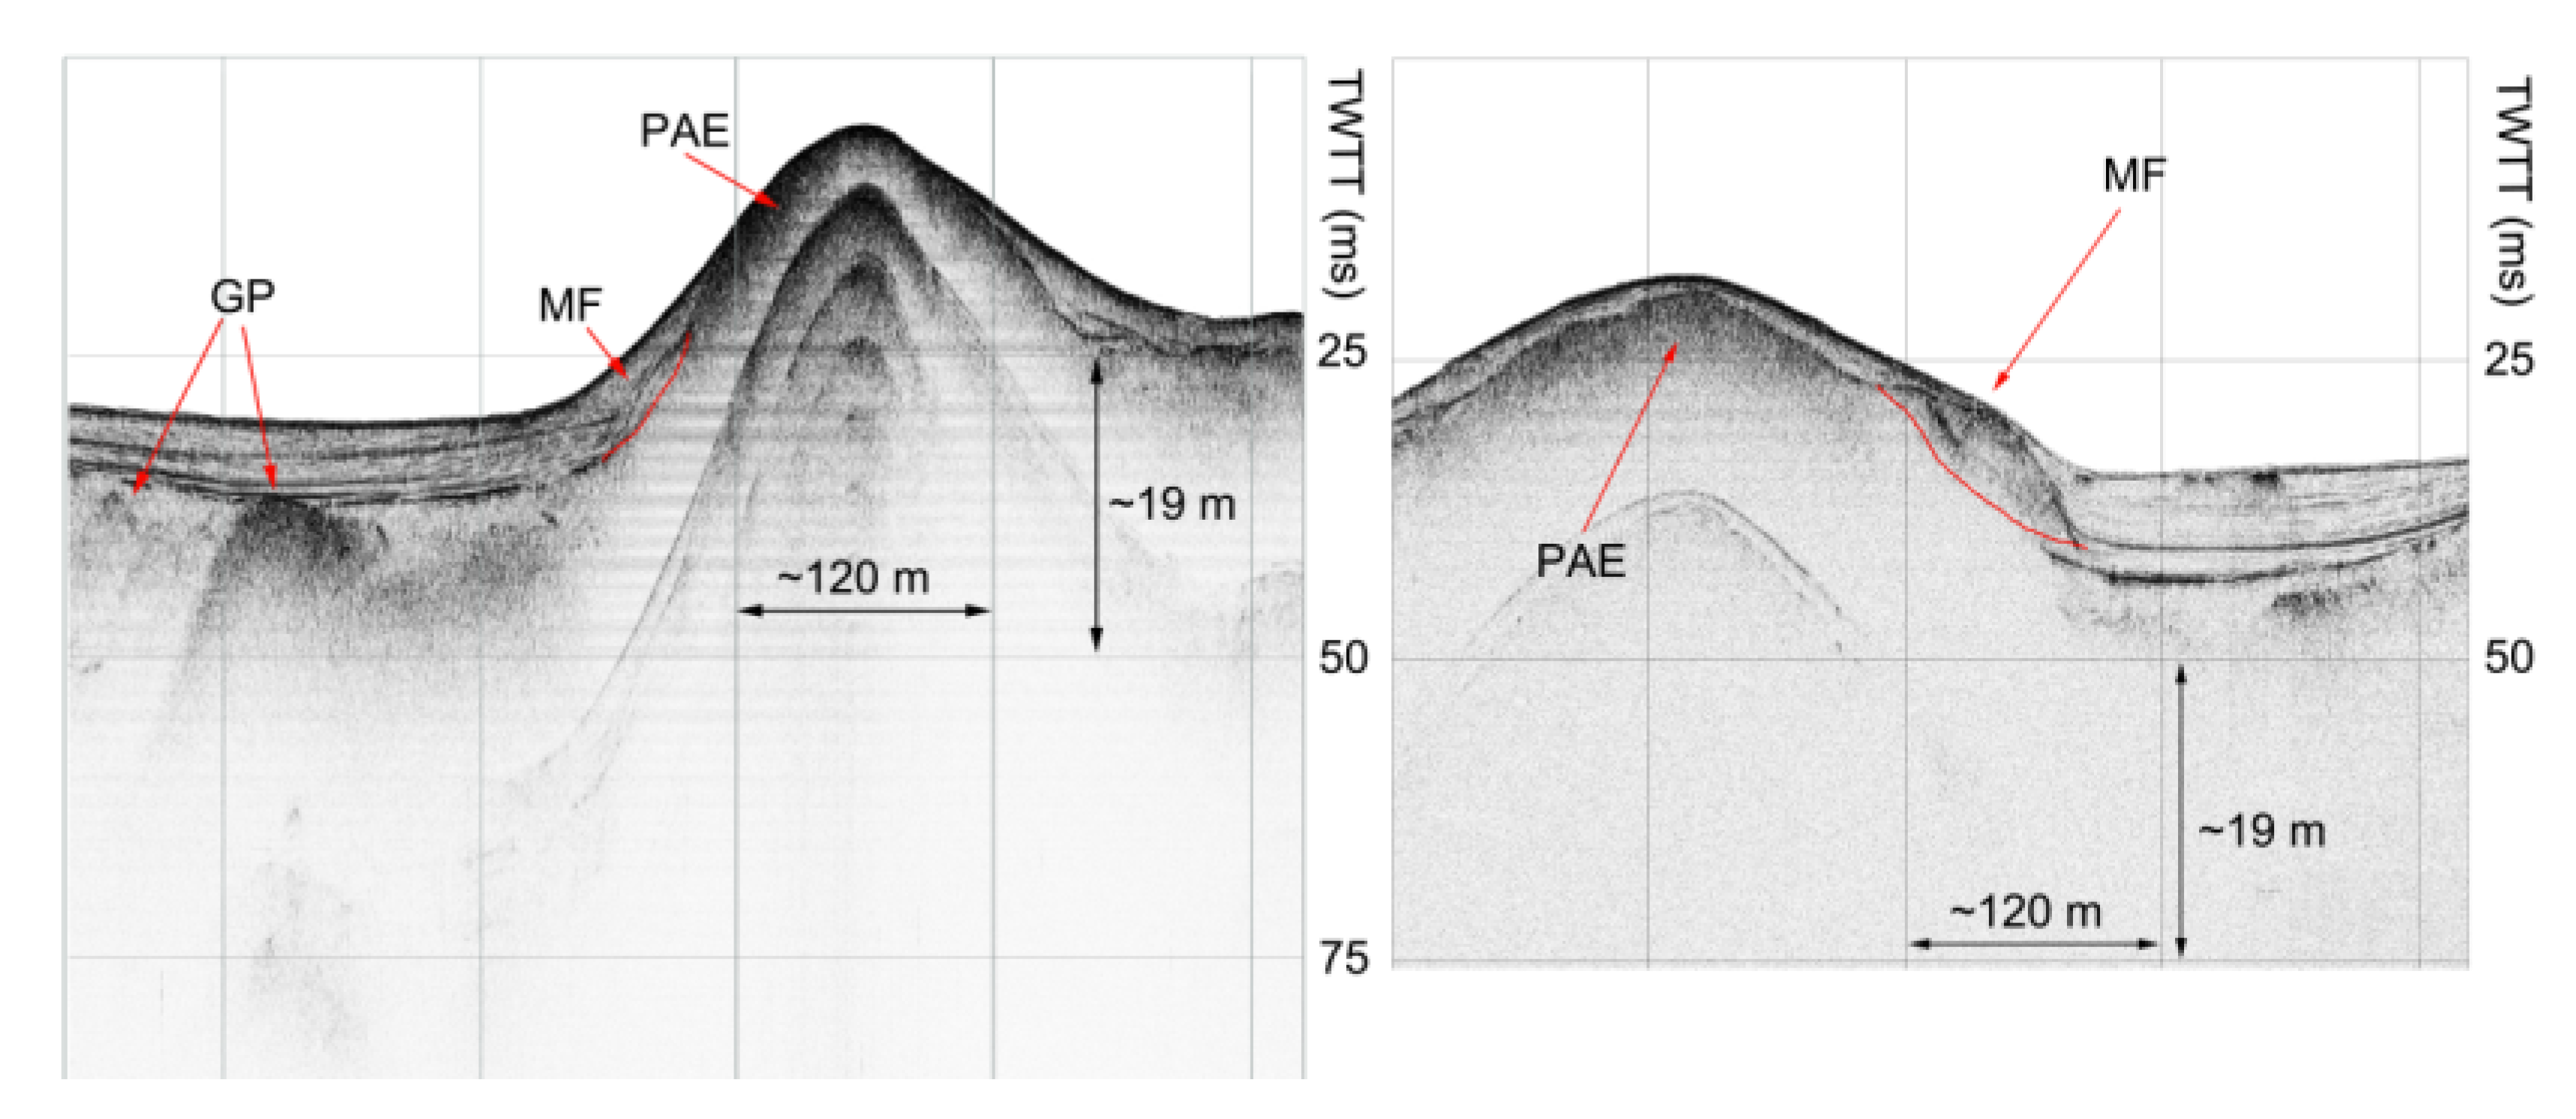
3.2. Seismic Stratigraphy and Gas-Bearing Acoustic Characteristics

A variety of acoustic anomalies associated with shallow gas charged sediments, such as acoustic turbid zones (ATZ), enhanced reflectors (ER), and intrasedimentary gas plumes (ΙGP) [29], which have been recorded on the high resolution seismic profiles, confirmed that the two shallow depressions in the southern-eastern part of Amfilochia Bay represent pockmarks.
The presence of gas in the subseafloor sediments seems not to be limited to the area of the pockmarks, but rather, it affects the entire bay. The seismic profiles show a semitransparent upper sequence with weak and strong internal parallel to subparallel reflectors overlying an acoustically-opaque, high reflective surface (Figure 5). The acoustically-opaque horizon, which further blocks the sound penetration, can be attributed either to sharp interface in sediment texture or to gas in the interstitials of the sediments. However, there are various anomalous acoustic characters which are indicative of gas-charged sediments (enhanced reflectors; ER), gas migration (gas plumes; GP), and seepage on the seabed (pockmarks; PM). These suggest that the acoustically-opaque zone can be considered as a gas accumulation horizon and consequently it can be defined as ATZ (Figure 5).
Based on the thickness of the upper sequence, the acoustic characteristics of the seabed and the acoustically-opaque zone, four distinct acoustic types were defined. The spatial distribution of the acoustic types is shown in Figure 6.
Acoustic type A (AT-A) consists of an upper semitransparent sequence that overlies an acoustically-opaque zone (Figure 7). The upper sequence is further separated in three discrete units based on the amplitude of the internal reflectors. It consists of two almost transparent units with very weak internal reflectors separated by a package of strong reflectors (Figure 7; PSR). The seabed inside the AT-A area is characterized by very weak return. The AT-A province covers the southern part of the bay (Figure 6).
Acoustic type B (AT-B) consists, similarly to AT-A, of an upper semitransparent sequence that overlies an acoustically-opaque zone (Figure 7). In contrast to AT-A, the upper sequence of AT-B consists of two units; an almost transparent unit with very weak internal reflectors overlying the package of the strong reflectors (Figure 7). The lower almost transparent unit of the upper sequence is absent in the AT-B. The acoustically-opaque zone of AT-B has almost the same appearance as the opaque zone of AT-A. This type is characterized by a highly reflective seabed. AT-B occurs at the northern part of the bay (Figure 6).
Acoustic type C (AT-C) is characterized, similarly to AT-A, by an upper semitransparent sequence, divided into three units, overlying a sequence consisting of (a) a weak ATZ that allows further sound penetration, or (b) enhanced reflectors and intrasedimentary gas plumes (Figure 7). This type is located southern of AT-A, where the pockmarks have been observed (Figure 6).
The acoustic type D (AT-D) is characterized by a thin semitransparent upper unit with weak internal reflectors overlying an acoustically-opaque surface (Figure 8). AT-D is the less common type and is restricted at the southern end of the bay where the small protruding seafloor mound has been observed (Figure 6).
ATZ in AT-A and AT-B appears with diffuse and chaotic character masking almost all other seismic reflections. ATZ, in most cases, is sharply cutting across the stratification, indicating that it is probably not lithology-related (Figure 9). Locally, ATZ appears weak, as indicated by the fact that the seismic reflectors underlying at the top of the ATZ are not entirely hidden, allowing their identification (Figure 9). The top of the acoustic turbid zone is located ~10 m, ~9 m and ~11–12 m below the seabed surface, in AT-A, AT-B, and AT-C, respectively.
Enhanced reflectors appear as anomalous high-amplitude reflections with abrupt terminations (Figure 10). They have been observed in certain stratigraphic levels usually above the top of the ATZ (Figure 10). In one case, at the southeastern part of the bay and within the AT-C, enhanced reflector seems to be the result of the accumulation of gas due to migration through the underlain upward curving sedimentary strata (Figure 10). A similar migration pattern was observed by Papatheodorou et al. [13] in the Ionian Sea.
Intrasedimentary gas plumes (IGP) were observed almost exclusively in AT-A and AT-C (Figure 11a,b). These features show different acoustic signatures in the seismic profiles, more specifically appear as: (a) chaotic character with hyperbolic configuration (Figure 11a); (b) local high reflectivity patches (LHRP) accompanied by acoustic blanking (Figure 11b). ΙGPs have been detected just above the ATZ and within the upper semitransparent sequence. In some cases, gas plumes reached the seabed surface (Figure 11a,b). The relative position of ΙGPs clearly suggests that these features were coming out of ATZs.
The area with the lowest reflectivity in the side scan sonar mosaic is located at the northern part of Amfilochia Bay (Figure 4), and coincides well with the spatial appearance of AT-B (Figure 7) in which the seabed reflector is very strong in seismic profiles. In contrast, higher reflectivity on the side scan sonar mosaic (Figure 4) was recorded at the southern part of the bay, where AT-A and AT-C are dominant (Figure 7). The seabed reflector in that area is very weak in the seismic profiles. This contradiction was probably due to the existence of large amount of gas in the surface sediments because of the upward gas migration from the underlying ATZ. The gas-charged surface sediments increase the backscatter on side scan sonar data, but the seabed return on seismic profiles remains very weak probably due to continuous disturbance of the sediment texture by the gas seepage.
Two types of pockmarks were detected in the seismic profiles: present-day pockmarks on the seafloor and paleo-pockmarks or v-shaped amplitude anomalies in the substrata. Seismic profiles across the pockmarks which are located at the southeastern part of the bay, inside the AT-C area, show the pockmarks as v-shaped and/or dish shaped incisions truncating all the three units of the upper acoustically semitransparent sequence (Figure 12a).
Buried pockmarks were observed at the western part of the bay, within the AT-C area, suggesting past seepage-induced manifestations (Figure 13). The stratigraphic correlation of present day and buried pockmarks has clearly shown that the buried ones have truncated older strata than the present day pockmarks (Figure 13). This interpretation implies that gas release and pockmark development occur at least since the Holocene in the southern part of Amfilochia Βay. The two groups of pockmarks (present-day and buried) seem to be linked with the same ATZ horizon, suggesting that both groups recharge the same gas accumulation horizon (Figure 13). The spatial distribution of the two pockmark groups shows an eastward migration of pockmark formation in the bay. Although vertical stacking of buried pockmarks caused by reactivation of a specific fluid leakage through time is well studied, pockmark migration has not been addressed in detail yet. The occurrence of this pockmark migration through time is possibly caused by seismic fault activity driven changes.
The stratigraphic relationships between the three acoustic types (AT-A, AT-B, and AT-C) suggest that either the ATZ is migrating upward inside the AT-B province or a substantial amount of gas has migrated upward, escaping in the water column and lowering the level of ATZ within the AT-A and AT-C (Figure 7). The latter hypothesis is considered more likely, as it is further supported by the existence of important morphological features (PM) and acoustic characters (IGP, ER) indicative of gas upward migration at the AT-A and AT-C areas.

3.3. The “Volcano” of Amfilochia Bay

At the approximate location that Miaoulis [12] erroneously reported an underwater “volcano” the acoustic signal obtained from subbottom profiling and side scan imagery (Figure 4, Figure 6 and Figure 14) points to a conical shaped feature (protrusion mound), suggesting that most probably the site is associated with sediment build-up processes such as mud domes and carbonate mounds [30,31].
The protrusion mound has been recorded in all the acquired acoustic data; it has ~100 m diameter of and a height of 16 m, compared to the surrounding seabed which is 20 m deep.
The profiles collected across the mound are characterized by a prolonged acoustic surface echo suggesting hard seafloor (Figure 14) in agreement with the sonographs. The prolonged surface reflector could represent rocky outcrops on the seafloor or gas-induced sedimentary buildup causing acoustic blanking and/or preventing of the acoustic penetration. Downslope from its top, the mound is covered by a thin veneer of sediments, which gradually exhibits stratification as indicated by parallel to subparallel, weak, and discontinuous internal seismic reflectors (Figure 14). At the flanks of the mound, sedimentary deposits, free of reflections, having lens shapes and convex tops, and presenting sharp transitions to the stratified sediments have been observed (Figure 14). The acoustic characteristics suggest that these deposits are most likely sedimentary debris flows, originated from the center of the mound. This latter observation, together with the circular shape of the high-low reflectivity alternation on the sonographs (described previously), imply that the site could be the result of a mud volcano, and the debris flows could be attributed to mud flows (mud breccia).

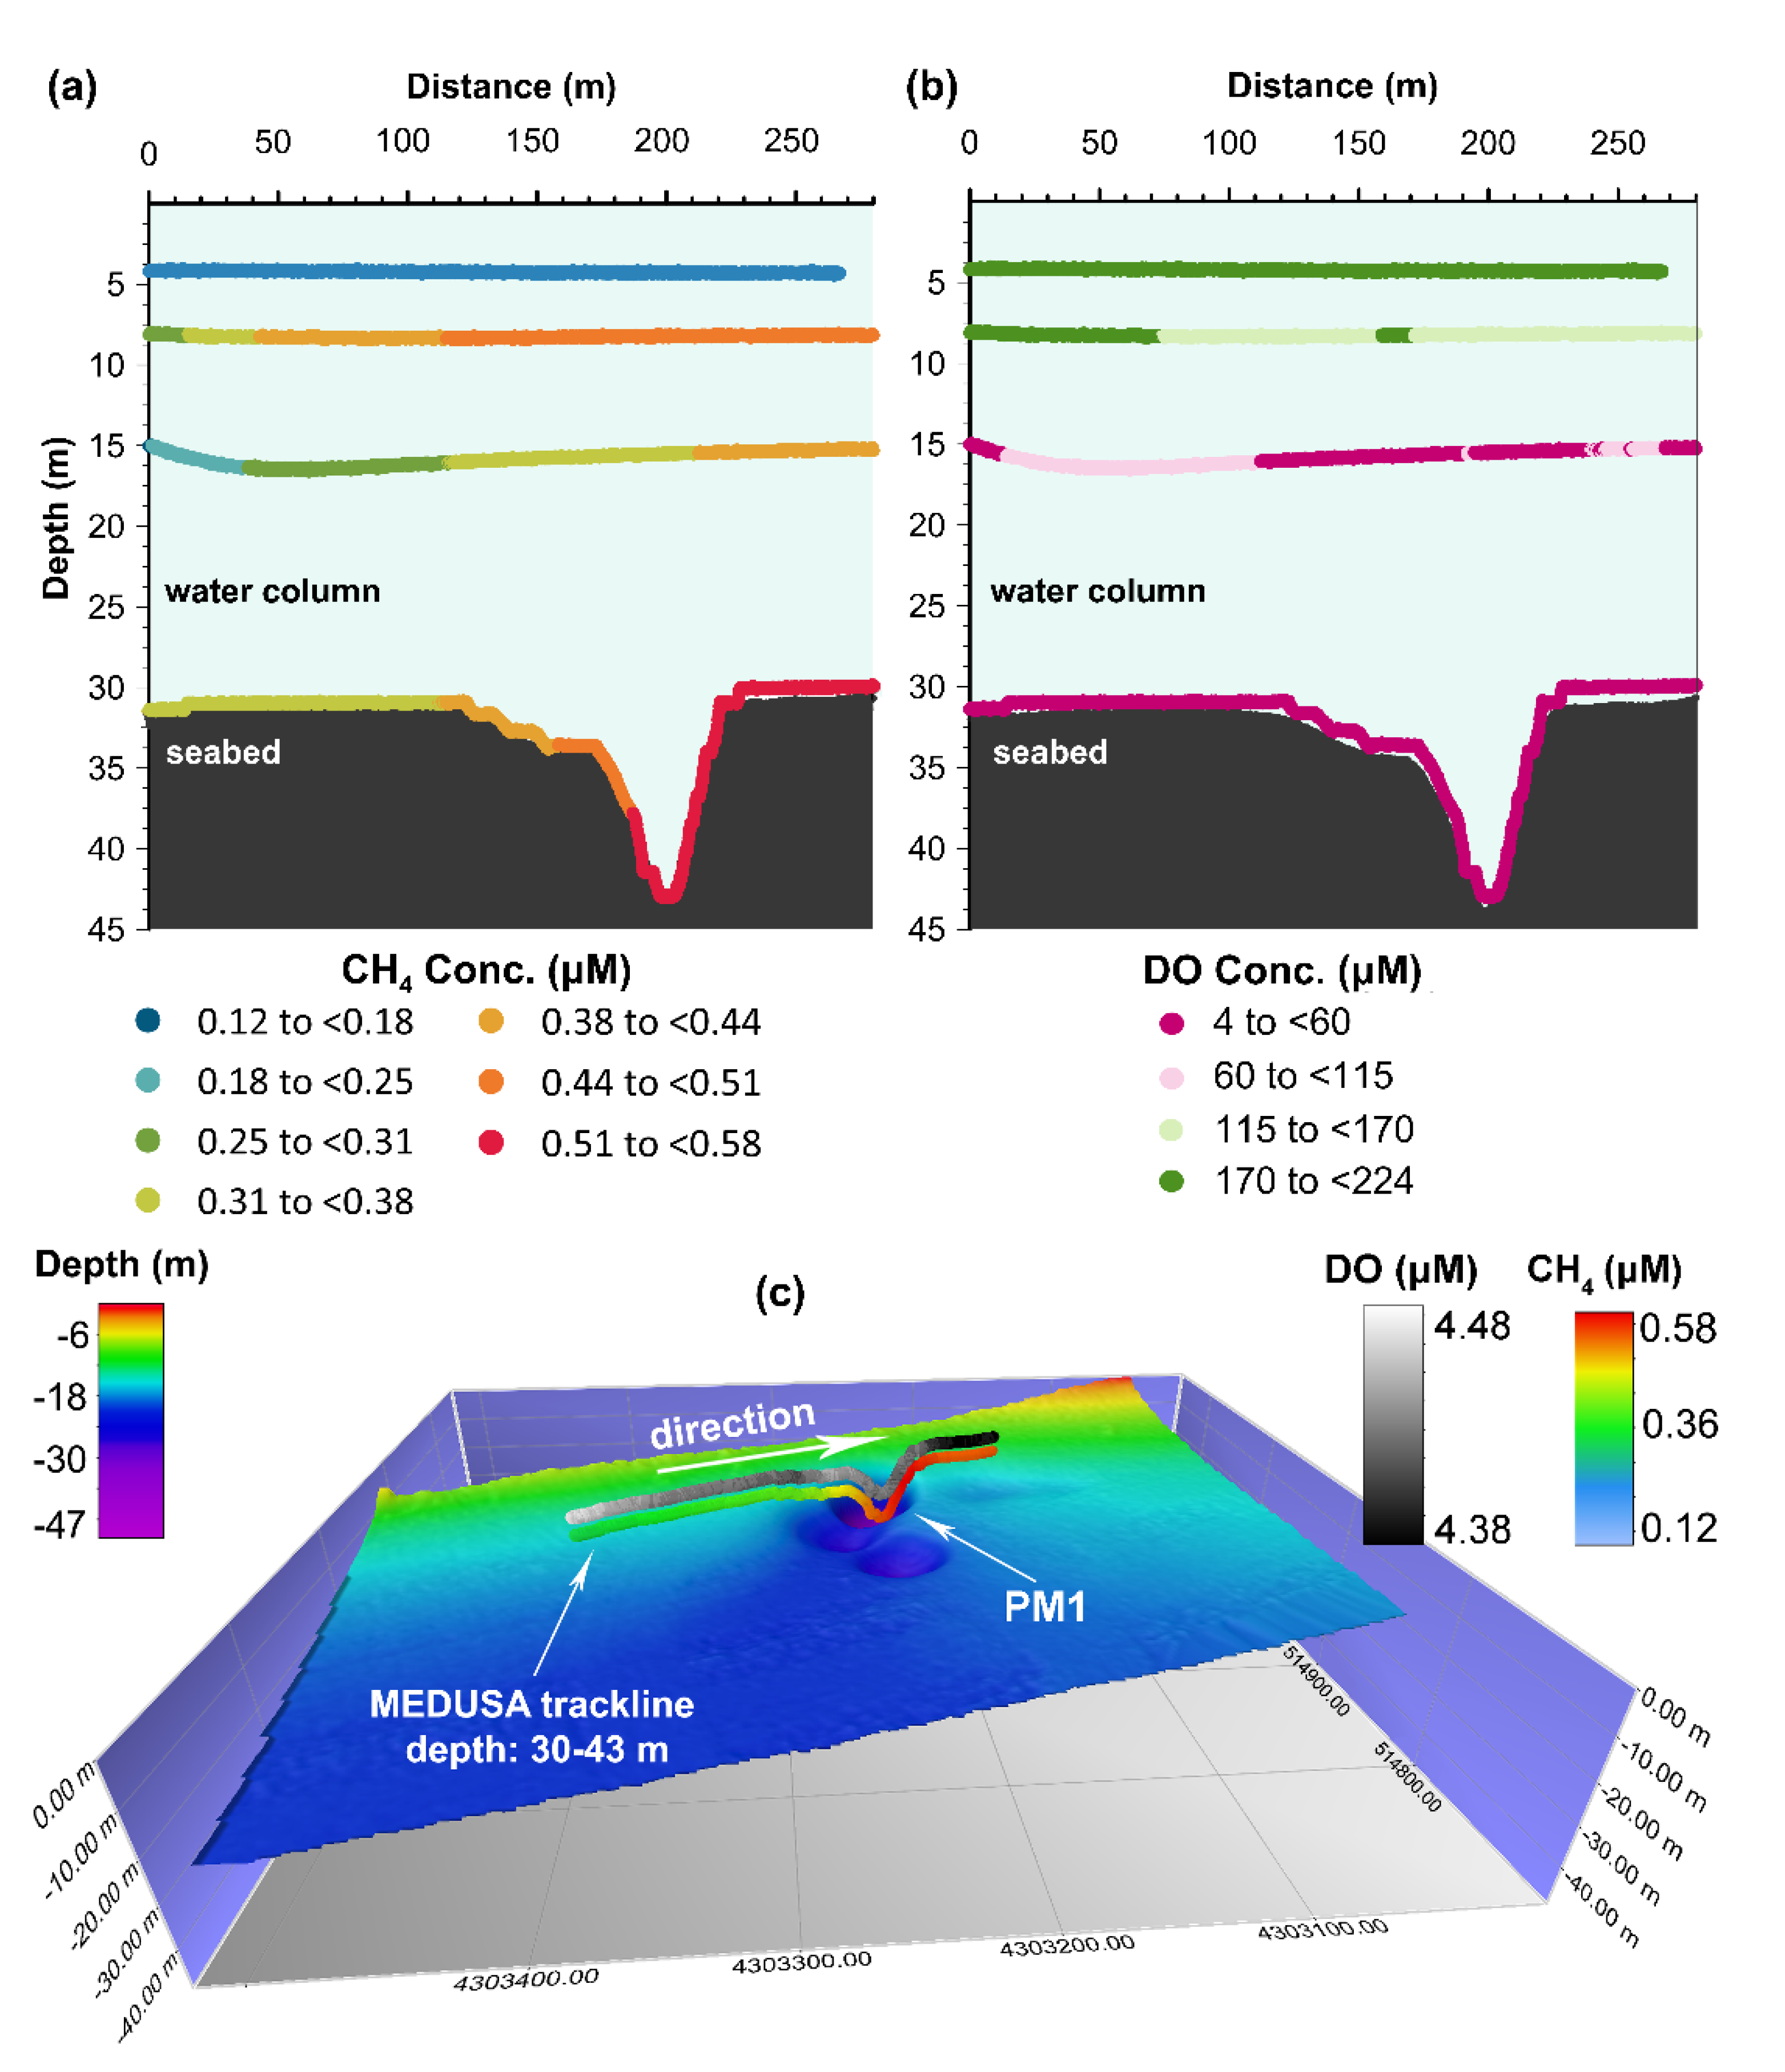
3.4. Physicochemical Parameters of the Amfilochia Bay Water Column

The physiography of the Amvrakikos Gulf with its limited connection to the open Ionian Sea and the freshwater supply by the two main rivers is reflected also in its innermost part, Amfilochia Bay. The downcast measurements in the vertical profiles of Stations 2 and 30 (Figure 3), during summer, present the general temperature, salinity, and density conditions of the water column in the central part of Amfilochia Bay, accompanied by DO, pH, and H2S concentrations (Figure 15; Spreadsheet S1 of the Supplementary Material). The vertical profiles showed that the water column of the bay is divided in two well defined layers; a brackish surface layer (Figure 15) and a saline bottom layer (Figure 15), which are separated by a strong pycnocline (Figure 15). The surface brackish layer is homogenous with a temperature of between 29 and 30 °C and salinity between 28 and 29 PSU. The bottom layer is also homogenous with a temperature of between 16 and 17 °C and salinity between 37 and 38 PSU. The thermocline develops between 5 and 18 m, whilst the halocline is very sharp and develops between 5 and 10 m in Station 2, and 8 and 10 m in Station 30.
The intense stratification prevents the vertical diffusion of oxygen, from the oxygenated, surface layer to the bottom layer. Thus, the vertical profile of DO is also controlled by the two layer structure of the water column. The brackish surface layer is well oxygenated with a concentration of about 6.5–7 mg/L. Within the thermocline/halocline, the DO content continuously decreases reaching a concentration of ~0 mg/L below ~18 m water depth in Station 2 and below 20 m in Station 30.
The pH distribution in the water column seems to be affected by the two layer structure only in Station 30, which is located above the pockmark PM1. In the surface layer the pH is just above 8, reflecting the entrainment and consequently the mixing of the inflowing sea water with the surface layer. Below the halocline, the pH is about 7.6, indicating that the water is more acidic in the bottom layer of the water column over the largest pockmark of Amfilochia Bay.
Hydrogen sulfide concentrations were low at both sampling sites, ranging between 0 and 0.02 mg/L at the brackish surface layer, and 0.03 mg/L near the sea bottom (Figure 15).

3.5. MEDUSA Underwater Tow Multi-Parametric Platform

The MEDUSA platform on adjacent floats at different depths above the PM1 pockmark, showed increasing concentrations of dissolved methane in correspondence with depth and the pockmark (Figure 16a,c, Spreadsheet S2 of the Supplementary Material). The shallowest float, at ~4 m, showed an almost constant dissolved methane concentration of about 0.12 μΜ. The floats at ~8 m and~15 m water depth, showed elevated dissolved methane concentrations that range between 0.26–0.49 μΜ. The deepest float (>0.5 m distance from seabed) that crossed pockmark PM1, showed even more CH4 concentration values, from 0.32 μΜ, reaching up to 0.58 μΜ right after the MEDUSA exited the pockmark. Thus, an increase in the methane concentration was recorded by the MEDUSA at the bottom layer of the stratified water column of the bay close to the detected halocline (Figure 15), while at the surface layer the CH4 concentration was low and constant. Higher CH4 concentrations were detected after the crossing of PM1 and always under the halocline, but the highest detected values occurred near the seabed, inside and right after exiting the pockmark. The methane concertation increase is attributed to weak gas seepage from the pockmark (Figure 16a,c; Spreadsheet S2 of the Supplementary Material) since it was the only site in the bay where significant methane variation was detected. The fact that the highest values were measured above and after the crossing of the pockmark could be attributed to a combination of slow response of the methane sensor [32] and currents. Bubbles were detected neither by the MEDUSA camera nor by the divers.
Dissolved oxygen concentration declined with depth, reaching very low values (>5 μΜ) in the bottom layer (Figure 16b,c). But whilst approaching PM1, the increase in the methane concentration was accompanied by an even greater decline in dissolved oxygen in and around the pockmark (Figure 16b).
The full dataset from the MEDUSA dives presented in this work can be found in Spreadsheet S2 of the Supplementary Material.

3.6. Isotopic Data from Sediment and Water Samples

Isotopic analyses of the CH4 carbon atoms (δ13CCH4) in samples of water and sediments collected from the interior of and around PM1 pockmark showed values from −41‰ to −86‰ (Table 1), which can be attributed (a) to a different degree of oxidation of CH4 of microbial origin from methanotrophic bacteria [33] or (b) mixed gases of mostly microbial and secondarily thermogenic origin.

4. Discussion

A comprehensive oceanographic survey using remote sensing, hydrographic and geochemical means together with a multiparameter platform was carried out at Amfilochia Bay in the southeastern end of the Amvrakikos Gulf.
Although a plethora of gas seepage-related features, such as ATZ, enhanced reflectors (ER), and intrasedimentary gas plumes (IGP) were detected in the subbottom profiles of Amfilochia Bay, the MEDUSA platform (Figure 16) detected weak gas seepage from the largest, composite pockmark (PM1) at the south-eastern part of the Bay. In addition, H2S concentration inside PM1 was too low to result in escape into the atmosphere.
However, in case of intense seismic events, the possibility of emission of larger amounts of CH4 and H2S from the two pockmarks should not be ruled out. Similar seismic stratigraphic patterns have been observed in locations with confirmed gas-charged sediments, e.g., in Patraikos Gulf, Greece [34], Eckernforde Bay, Germany [35]. In Patraikos Gulf, seismic activity triggered gas escape pockmark activations [34,36], and similar phenomena could occur and should be explored in Amfilochia Bay.
Based on the subbottom profiler data, the floor of the pockmark PM1 reaches the interface between the upper semitransparent sequence and the underlying acoustically opaque ATZ but without penetrating through it. PM1 is characterized by the existence of an ATZ, which is located under the floor of the pockmark (Figure 12b,c). This suggests that: (i) there is a continuous upward migration of gas towards the floor of the pockmarks, and (ii) the sediments below the floor and within the gas migration path are gas-charged. The sidewalls of the PM1 are characterized by a transparent acoustic character suggesting that the sediment texture has been disturbed by the gas venting (Figure 12a). This, consequently, means that gas venting is not restricted only at the central part of the pockmark floor, but it also takes place through sidewalls. Sidewall gas venting was also suggested by Hasiotis et al. [34] in the active pockmark field of Patras Gulf, Greece. The seismic profile across PM1 shows a rotational slide that affected the sidewall of the pockmark (Figure 12d). This evidence may suggest that gas venting can be temporally blocked. Furthermore, this probably suggests that the development of a pockmark is a combined process of sediment removal by gas venting and sediment displacement by sliding, producing a more complex shape. Evidence of pockmark infilling by sidewall slumping has been documented in many cases worldwide [34]. A protrusion mound has been detected, approximately at the same area in which Miaoulis [12] discovered a submarine “volcano” related to vast sulfur emissions. The side scan sonar mosaic showed that the mound is characterized by a high back-scattering center reflecting hard substrates and low back-scattering rim reflecting accumulation of soft, fine grained material (Figure 4b). This locally intense backscatter contrast could correspond to: (i) seepage-related carbonate-cemented sediments [37,38], (ii) loose and/or consolidated mud deposits (breccias) [39], (iii) bioconstructions, formed by corals, sponges or coralline algae on cemented sediments [37,38,40,41,42], or (iv) local gas bubbling [39,43,44] at the center of the mound. The possibility of bioconstructions and/or gas bubbling as responsible factors for the high reflectivity at the center of the mound appears rather weak at the study area, because of the homogenous acoustic pattern and the absence of any evidence for gas seepage over the mound, at least during the survey period.
Although there is no direct evidence (sediment cores, visual inspection) that the protrusion mound is a mud volcano, the collected geophysical data strongly suggest this hypothesis. Yin et al. [45] suggested that any positive relief on the seafloor related to fluid expulsion can be considered a submarine mud volcano. Milkov [46] suggests two additional criteria for a more precise identification of submarine mud volcanoes: (i) the presence of specific submarine mud volcanic sediments in cores (mud breccia) and (ii) the presence of strong backscatter defined from side scan sonar images. Etiope and Martinelli [47] challenged the misuse of the “mud volcano” term and proposed, four rigorous criteria in the definition of mud volcanoes, emphasized to (i) the discharge of at least a three-phase system (gas, water, sediment), and (ii) the geotectonic setting (involvement of sedimentary rocks with a gravitative instability leading to the formation of mobile shales, diapirs or diatremes).
The possible mud volcano of Amfilochia Βay shows a clear positive relief with very high backscattering acoustic facies at the position of the mound. This can be interpreted either as (i) very consolidated mud deposits consisting of mud breccia transported from underlying deposits [39] or (ii) carbonate-cemented sediments, due to the presence of hydrocarbon within the escaping fluids [37,38].
No gas seepage or fluid expulsion was recorded during the survey above the mound-like feature. On the other hand, the active and buried pockmarks that were observed adjacent to the possible mud volcano mound suggest recent or even presently active gas seepage reaching the seafloor of the southern part of the bay. The absence of gas bubbles in the water column over the mound from subbottom profiling and most importantly from side scan sonar data does not necessarily imply that this mound is not a mud volcano. It should be noted that the detection of gas bubbles depends on the resonance frequency of the bubbles, which increases with water depth. The 100 kHz side scan sonar that has been used in the Amfilochia Bay survey detects bubbles greater than 0.006 cm diameter in 10 to 20 m water depth, while subbottom profiler only detects bubbles in excess of 0.10 cm diameter [48]. The nondetection of gas seepage over the mound, as indicated by side scan sonar data, suggests that gas expulsion might be intermittent. Yin et al. [45] also mentioned the absence of gas plumes over mud volcanoes in the East China Sea and they suggested that those mud volcanoes were not active, because, among other reasons, the gas emission was not continuous but could be intermittent.
The debris flow deposits that have been observed at the base of the mound and are interpreted as mud flow deposits (mud breccias), based on acoustic criteria, further support the hypothesis that the mound is a mud volcano. Similar debris flows have been found in numerous mud volcanos worldwide, indicating the mud volcano activity [49,50].
The existence of the Amfilochia strike slip fault zone and the Triassic evaporites beneath the Amfilochia valley that were remobilized in Plio-Quaternary time may point towards fossil (either thermogenic or microbial) gas seepage which may have caused the erosional and piercement morphological structures such like pockmarks and mud volcanoes. Mazzini and Etiope [51] mentioned that mud volcanoes are distributed, among others, in compressional zones of accretionary complexes and thrust and overthrust belts, as well as in strike-slip and normal faults.
Methane isotopic analyses from the composite pockmark PM1 1.4 km northeast of the possible mud volcano have been interpreted as (i) a different degree of oxidation of CH4 of microbial origin from methanotrophic bacteria [33] or (ii) mixed gases of mostly microbial and secondarily thermogenic origin. Methane isotopic composition shows variable carbon isotopic ratios, from −41‰ to −86‰, which could be related to differential CH4 oxidation or mixing between microbial and thermogenic gas. Nevertheless, the degassing is clearly determined by a geologic structure: a fault-controlled pockmark. Radiocarbon dating of CH4 could clarify if the gas is modern or fossil, e.g., [52].
This study also confirmed the intense stratification of the water column during the summer in Amfilochia Bay. The bottom layer showed hypoxic/anoxic DO levels (4–60 μM) and an anoxic seabed (DO < 4.5 μΜ). The above is consistent with the observations made by other researchers [4,9] who suggested that the main mechanisms for the formation of hypoxia in Amfilochia Bay and in the wider Amvrakikos Gulf are oceanographic and anthropogenic [4]. This can be considered as an effect of many years of continuous input of agricultural [2], aquaculture, and municipal waste in Gulf of Amvrakikos, coupled with limited input of well oxygenated sea water from the Ionian Sea.
The MEDUSA underwater tow multiparameter system, in sequential floats, recorded weak methane seepage and even lower seepage of hydrogen sulfide, over the PM1 gas escape pockmark. Methane concentration increase was accompanied by an additional decrease in the already low dissolved oxygen concentration close and inside the PM1 pockmark. This additional dissolved oxygen depletion could be attributed to the rapid oxidation of methane (Figure 16), e.g., [53,54]. Although this process has been reported bibliographically, it is difficult to observe in the field [54,55]. Thus, the MEDUSA platform successfully testified to the reduction of dissolved oxygen in the seawater due to methane seepage from a pockmark. Nevertheless, the reported CH4 seepage is too local and too weak to be considered as a driver of hypoxia in Amfilochia Bay.

5. Conclusions

The integrated oceanographic survey that took place in Amfilochia Bay showed that the bay is characterized by gas-charged sediments, while the southern part is affected by gas seepage and related erosional and piercement morphological features.
This study resulted in the discovery of a pockmarks group and a possible mud volcano off the southern coast of Amfilochia Bay. These are the only pockmarks found in the Amvrakikos Gulf, a marine area extensively studied and eminent for its shallow gas accumulations [13,14,56]. A small protruding mound which was described as a submarine “volcano” by Miaoulis [12] is suggested as a possible mud volcano based on geophysical characteristics. The development of erosional and piercement morphological features in the southern part of Amfilochia Bay seems to be controlled by the acoustic turbid zone fault zone and therefore could be considered as fault-controlled features.
The main drivers of hypoxia-anoxia in Amfilochia Bay were confirmed to be oceanographic and anthropogenic [4] since the detected methane seepage was weak and local, at least during the surveying period. Based on the results of this work, methane seepage can further contribute to oxygen reduction, but only locally, i.e., in the interior and/or near PM1 pockmark (Figure 16c). Methane seepage was too weak to cause DO perturbations in shallower waters or affect the depth of the oxycline over the pockmark (Station 30 in Figure 15 and Figure 16b), which is similar to the other nonseepage area in Amfilochia Bay (Station 2 in Figure 15 and Figure 16b).
Methane shows variable carbon isotopic ratios, from −41‰ to −86‰, which could be related to differential CH4 oxidation or mixing between microbial and thermogenic gas. However, the degassing seems to be determined by a geologic structure: a fault-controlled pockmark. Radiocarbon dating of CH4 would help deciphering its either modern or fossil nature, e.g., [53].
Nevertheless, a well-organized, integrated study, that combines a geophysical, a geochemical and a two-dimension (vertical and horizontal) hydrographic survey is considered the most effective method to study marine areas with shallow gas accumulations, since they complement each other, shedding light in all aspects of a case study.

Supplementary Materials

The following are available online at https://0-www-mdpi-com.brum.beds.ac.uk/2076-3263/11/1/27/s1, Spreadsheet S1: Downcast data from Stations 2 and 30, Spreadsheet S2: The full dataset acquired with the MEDUSA platform.

Author Contributions

Conceptualization, G.P.; methodology, G.P., G.F., M.G., D.C., G.M., S.K. (Stavroula Kordella); software, S.K. (Stavroula Kordella), E.F., D.C.; formal analysis, S.K. (Stavroula Kordella); MBES data formal analysis, D.C.; investigation, S.K. (Stavroula Kordella), D.C., E.F., S.K. (Sotiris Kokkalas), M.I., G.P., M.G., G.M., G.F.; data curation, S.K. (Stavroula Kordella), D.C., E.F., G.M., M.I.; writing—original draft preparation, S.K. (Stavroula Kordella), G.P., S.K. (Sotiris Kokkalas); writing—review and editing, S.K. (Stavroula Kordella), M.G., S.K. (Sotiris Kokkalas); supervision, G.P.; funding acquisition, G.P., M.G. All authors have read and agreed to the published version of the manuscript.

Funding

This study was funded by the European Union FP7 project “HYPOX—In situ monitoring of oxygen depletion in hypoxic ecosystems of coastal and open seas and landlocked water bodies” (EC grant 226213). Additional funding was provided by the project “IDENTIFICATION, CONSEQUENCES AND MANAGEMENT OF THE ANOXIC ZONE OF AMVRAKIKOS GULF (NW GREECE)”, EEA Grants, GR02-0010 and by the Laboratory of Marine Geology & Physical Oceanography, University of Patras internal funds.

Acknowledgments

The authors gratefully acknowledge the valuable contribution of Giuseppe Etiope, in charge of the geochemical research and the MEDUSA platform measurements during the HYPOX project. Thanks go to the captains and crew of “RS EIRINI, NP464”, “FV BARBANTONIS II, NP470” for their help during the research cruises. We appreciate the comments and suggestions of three anonymous reviewers that improved the manuscript.

Conflicts of Interest

The authors declare no conflict of interest.

References

  1. Diamantopoulou, A.T.; Kalavrouziotis, I.K.; Varnavas, S.P. Geochemical investigations regarding the variability of metal pollution in the Amvrakikos Bay, Greece. Glob. Nest J. 2018, 21, 7–13. [Google Scholar] [CrossRef] [Green Version]
  2. Papaefthymiou, H.; Athanasopoulos, D.; Papatheodorou, G.; Iatrou, M.; Geraga, M.; Christodoulou, D.; Kordella, S.; Fakiris, E.; Tsikouras, B. Uranium and other natural radionuclides in the sediments of a Mediterranean fjord-like embayment, Amvrakikos Gulf (Ionian Sea), Greece. J. Environ. Radioact. 2013, 122, 43–54. [Google Scholar] [CrossRef] [PubMed]
  3. Tsabaris, C.; Evangeliou, N.; Fillis-Tsirakis, E.; Sotiropoulou, M.; Patiris, D.L.; Florou, H. Distribution of natural radioactivity in sediment cores from Amvrakikos Gulf (Western Greece) as a part of IAEA’s campaign in the Adriatic and Ionian Seas. Radiat Prot. Dosimetry 2012, 150, 474–487. [Google Scholar] [CrossRef] [PubMed] [Green Version]
  4. Ferentinos, G.; Papatheodorou, G.; Geraga, M.; Iatrou, M.; Fakiris, E.; Christodoulou, D.; Dimitriou, E.; Koutsikopoulos, C. Fjord water circulation patterns and dysoxic/anoxic conditions in a Mediterranean semi-enclosed embayment in the Amvrakikos Gulf, Greece. Estuar. Coast. Shelf. Sci. 2010, 88, 473–481. [Google Scholar] [CrossRef]
  5. Tsangaris, C.; Cotou, E.; Papathanassiou, E.; Nicolaidou, A. Assessment of contaminant impacts in a semi-enclosed estuary (Amvrakikos Gulf, NW Greece): Bioenergetics and biochemical biomarkers in mussels. Environ. Monit. Assess. 2010, 161, 259–269. [Google Scholar] [CrossRef] [PubMed]
  6. Kormas, K.A.; Nicolaidou, A.; Reizopoulou, S. Temporal variations of nutrients and chlorophyll a and particulate matter in three coastal lagoons of Amvrakikos Gulf (Ionian Sea, Greece). Mar. Ecol. 2001, 22, 201–213. [Google Scholar] [CrossRef]
  7. Piper, D.J.W.; Panagos, A.G.; Kontopoulos, N. Some observations on surficial sediments and physical oceanography of the Gulf of Amvrakia. Thalassographica 1982, 5, 63–80. [Google Scholar]
  8. Friligos, N.; Koussouris, T. Preliminary chemical, physical and biological observations in the Gulf of Amvrakikos (April 1974). Thalas. Jugosl. 1977, 13, 53–58. [Google Scholar]
  9. Kountoura, K.; Zacharias, I. Temporal and spatial distribution of hypoxic/seasonal anoxic zone in Amvrakikos Gulf, Western Greece. Estuar Coast. Shelf Sci. 2011, 94, 123–128. [Google Scholar] [CrossRef]
  10. Tsabaris, C.; Kaberi, H.; Alexakis, S.; Georgopoulos, D.; Kalfas, C. Environmental radioactivity applications in the Hellenic Centre for Marine Research. In Proceedings of the 9th Hellenic Symposium on Oceanography and Fisheries, Patras, Greece, 13–16 May 2009; pp. 105–108. [Google Scholar]
  11. Friedrich, J.; Janssen, F.; Aleynik, D.; Bange, H.W.; Boltacheva, N.; Çagatay, M.N.; Dale, A.W.; Etiope, G.; Erdem, Z.; Geraga, M.; et al. Investigating hypoxia in aquatic environments: Diverse approaches to addressing a complex phenomenon. Biogeosciences 2013, 11, 1215–1259. [Google Scholar] [CrossRef] [Green Version]
  12. Miaoulis, A.A. Report to the Naval Ministry. Regarding the Karvasaras (Amfilochia) volcanic phenomenon. Protocol number 17, 1876. In A Trip to Forgotten Years, Amfilochia (Karvasaras) 1829; Telonas, N.H., Ed.; Amfilochia Public Library: Amfilochia, Greece, 2017; Volume A, pp. 703–704. [Google Scholar]
  13. Papatheodorou, G.; Hasiotis, T.; Ferentinos, G. Gas charged sediments in the Aegean and Ionian Seas, Greece. Mar. Geol. 1993, 112, 171–184. [Google Scholar] [CrossRef]
  14. Kapsimalis, V.; Pavlakis, P.; Poulos, S.E.; Alexandri, S.; Tziavos, C.; Sioulas, A.; Filippas, D.; Lykousis, V. Internal structure and evolution of the Late Quaternary sequence in a shallow embayment: The Amvrakikos Gulf, NW Greece. Mar. Geol. 2005, 399–418. [Google Scholar] [CrossRef]
  15. Kokkalas, S.; Xypolias, P.; Koukouvelas, I.; Doutsos, T. Post-collisional contractional and extensional deformation in the Aegean region. In Post-Collisional Tectonics and Magmatism in the Mediterranean region and Asia, 1st ed.; Dilek, Y., Pavlides, S., Eds.; Special Paper of Geological Society of America: Boulder, CO, USA, 2006; Volume 409, pp. 97–123. [Google Scholar] [CrossRef]
  16. Le Pichon, X.; Chamot-Rooke, N.; Lallemand, S.; Noomen, R.; Veis, G. Geodetic determination of the kinematics of central Greece with respect to Europe: Implications for eastern Mediterranean tectonics. J. Geophys. Res. Atmos 1995, 100, 12675–12690. [Google Scholar] [CrossRef]
  17. Hollenstein, C.; Mόller, M.D.; Geiger, A.; Kahle, H.G. Crustal motion and deformation in Greece from a decade of GPS measurements 1993–2003. Tectonophysics 2008, 449, 17–40. [Google Scholar] [CrossRef]
  18. Vassilakis, E.; Royden, L.; Papanikolaou, D. Kinematic links between subduction along the Hellenic trench and extension in the Gulf of Corinth, Greece: A multidisciplinary analysis. Earth Planet Sci. Lett. 2011, 303, 108–120. [Google Scholar] [CrossRef]
  19. Pérouse, E.; Sébrier, M.; Lebatard, A.-E.; Chamot-Rooke, N.; Bourles, D.L.; Briole, P.; Sorel, D.; Dimitrov, D.; Arsenikos, S. Transition from collision to subduction in Western Greece: The Katouna–Stamna active fault system and regional kinematics. Int. J. Earth Sci. 2017, 106, 967–989. [Google Scholar] [CrossRef] [Green Version]
  20. Clews, J.E. Structural controls on basin evolution: Neogene to Quaternary of the Ionian Zone, Western Greece. J. Geol. Soc. 1989, 146, 447–457. [Google Scholar] [CrossRef]
  21. Underhill, J.R. Late Cenozoic deformation of the Hellenide foreland, Western Greece. Geol. Soc. Am. Bull. 1989, 101, 613–634. [Google Scholar] [CrossRef]
  22. Haddad, A.; Ganas, A.; Kassaras, I.M.; Lupi, M. Seismicity and geodynamics of western Peloponnese and central Ionian Islands: Insights from a local seismic deployment. Tectonophysics 2020, 778, 228353. [Google Scholar] [CrossRef]
  23. Hatzfeld, D.; Nord, J.; Paul, A.; Guiguet, R.; Briole, P.; Ruegg, J.C.; Cattin, R.; Meyer, B.; Hubert, A.; Bernard, P.; et al. The Kozani-Grevena (Greece) earthquake of May 13, 1995, Ms = 6.6. Preliminary results of a field multidiscipliuary survey. Seism. Res. Lett. 1995, 66, 61–70. [Google Scholar] [CrossRef]
  24. Ganas, A.; Serpelloni, E.; Drakatos, G.; Kolligri, M.; Adamis, I.; Tsimi, C.; Batsi, E. The Mw 6.4 SW Achaia (Western Greece) Earthquake of 8 June 2008: Seismological, Field, GPS Observations, and Stress Modeling. J. Earthq. Eng. 2009, 13, 1101–1124. [Google Scholar] [CrossRef]
  25. Vött, A.; Brückner, H.; Brockmüller, S.; Handl, M.; Maya, S.M.; Gaki-Papanastassiou, K.; Herd, R.; Lang, F.; Maroukian, H.; Nelle, O.; et al. Traces of Holocene tsunamis across the Sound of Lefkada, NW Greece. Glob. Planet Chang. 2009, 66, 112–128. [Google Scholar] [CrossRef]
  26. Marinaro, G.; Etiope, G.; Gasparoni, F.; Furlan, F.; Bruni, F. Gas seepage detection and monitoring at seafloor. In Proceedings of the 10th Offshore Mediterranean Conference and Exhibition, Ravenna, Italy, 23–25 March 2011. [Google Scholar]
  27. Etiope, G.; Christodoulou, D.; Kordella, S.; Marinaro, G.; Papatheodorou, G. Offshore and onshore seepage of thermogenic gas at Katakolo Bay (Western Greece). Chem. Geol. 2013, 339, 115–126. [Google Scholar] [CrossRef]
  28. Judd, A.G.; Hovland, M. Submarine Fluid Flow. In The Impact on Geology, Biology, and the Marine Environment, 1st ed.; Cambridge University Press: Cambridge, UK, 2007; p. 475. [Google Scholar] [CrossRef]
  29. Iglesias, J.; García-Gil, S. High-resolution mapping of shallow gas accumulations and gas seeps in San Simón Bay (Ría de Vigo, NW Spain). Some quantitative data. Geo Mar. Lett. 2007, 27, 103–114. [Google Scholar] [CrossRef]
  30. Loncke, L.; Mascle, J. Fanil Scientific Parties. Mud volcanoes, gas chimneys, pockmarks and mounds in the Nile deep-sea fan (Eastern Mediterranean): Geophysical evidences. Mar. Pet. Geol. 2004, 21, 669–689. [Google Scholar] [CrossRef]
  31. Coleman, D.F.; Ballard, R.D. A highly concentrated region of cold hydrocarbon seeps in the southeastern Mediterranean Sea. Geo Mar. Lett. 2001, 21, 162–167. [Google Scholar] [CrossRef]
  32. Marinaro, G.; Etiope, G.; Lo Bue, N.; Favali, P.; Papatheodorou, G.; Christodoulou, D.; Furlan, F.; Gasparoni, F.; Ferentinos, G.; Masson, M.; et al. Monitoring of a methane-seeping pockmark by cabled benthic observatory (Patras Gulf, Greece). Geo Mar. Lett. 2006, 26, 297–302. [Google Scholar] [CrossRef]
  33. Schubert, C.; Durisch-Kaiser, E.; Klauser, L.; Vazquez, F.; Wehrli, B.; Holzner, C.; Kipfer, R.; Schmale, O.; Greinert, J.; Kuypers, M. Recent studies on sources and sinks of methane in the Black Sea. In Past and Present Water Column Anoxia, 1st ed.; Neretin, L.N., Ed.; Springer: Dordrecht, The Netherlands, 2006; pp. 419–441. [Google Scholar]
  34. Hasiotis, T.; Papatheodorou, G.; Kastanos, N.; Ferentinos, G. A pockmark field in the Patras Gulf (Greece) and its activation during the 14/7/1993 seismic event. Mar. Geol. 1996, 130, 333–344. [Google Scholar] [CrossRef]
  35. Wever, T.F.; Abegg, F.; Fiedler, H.M.; Fechner, G.; Stender, I.H. Shallow gas in the muddy sediments of Eckernförde Bay, Germany. Cont. Shelf Res. 1998, 18, 1715–1739. [Google Scholar] [CrossRef]
  36. Christodoulou, D.; Papatheodorou, G.; Fakiris, E.; Etiope, G.; Ferentinos, G. The activation of a fluid escape pockmark field after the Μw = 6.4R earthquake on 8 June 2008, NW Peloponnesus. In In Proceedings of the 9th Symposium of Oceanography & Fisheries Vol. Ι, Patras, Greece, 13–16 May 2009; pp. 3–8. [Google Scholar]
  37. Vogt, P.R.; Cherkashev, G.A.; Ginsburg, G.D.; Ivanov, G.I.; Milkov, A.; Crane, K.; Lein, A.; Sundvor, E.; Pimenov, N.V.; Egorov, A.V. Haakon Mosby Mud Volcano provides unusual example of venting. Eos. Trans. AGU 1997, 78, 549–557. [Google Scholar] [CrossRef] [Green Version]
  38. Hovland, M.; Judd, A.G. Seabed Pockmarks and Seepages: Impact on Geology, Biology and Marine Environment, 1st ed.; Graham and Trotman: London, UK, 1988; p. 293. [Google Scholar]
  39. Vogt, P.; Gardner, J.; Crane, K. The Norwegian–Barents–Svalbard (NBS) continental margin: Introducing a natural laboratory of mass wasting, hydrates, and ascent of sediment, pore water, and methane. Geo Mar. Lett. 1999, 19, 2–21. [Google Scholar] [CrossRef]
  40. Hovland, M.; Thomsen, E. Cold-water corals—Are they hydrocarbon seep related? Mar. Geol. 1997, 137, 159–164. [Google Scholar] [CrossRef]
  41. Hovland, M.; Mortensen, P.B. Norske korallrev og prosesser i havbunnen, 1st ed.; John Grieg forlag: Bergen, Norway, 1999. [Google Scholar]
  42. Bouriak, S.; Vanneste, M.; Saoutkine, A. Inferred gas hydrates and clay diapirs near the Storegga Slide on the southern edge of the Voring Plateau, Offshore Norway. Mar. Geol. 2000, 163, 125–148. [Google Scholar] [CrossRef]
  43. Hovland, M. Do carbonate reefs form due to fluid seepage? Terra Nova 1990, 2, 8–18. [Google Scholar] [CrossRef]
  44. Lyons, A.P.; Duncan, M.E.; Anderson, A.L. Predictions of the acoustic scattering response of free-methane bubbles in muddy sediments. J. Acoust. Soc. Am. 1996, 99, 163–172. [Google Scholar] [CrossRef]
  45. Yin, P.; Berne, S.; Vagner, P.; Loubrieu, B.; Liu, Z. Mud volcanoes at the shelf margin of the East China Sea. Mar. Geol. 2003, 194, 135–149. [Google Scholar] [CrossRef]
  46. Milkov, A.V. Worldwide distribution of submarine mud volcanoes and associated gas hydrates. Mar. Geol. 2000, 167, 29–42. [Google Scholar] [CrossRef]
  47. Etiope, G.; Martinelli, G. “Pieve Santo Stefano” is not a mud volcano: Comment on structural controls on a carbon dioxide-driven mud volcano field in the Northern Apennines (by Bonini, 2009). J. Struct. Geol. 2009, 31, 1270–1271. [Google Scholar] [CrossRef]
  48. Guinasso, N.L.; Schink, D.R. A Simple Physicochemical Acoustic Model of Methane Bubbles Rising in the Sea; Report Reference 73-15-T; College of Geosciences, Texas A&M University: College Station, TX, USA, 1973. [Google Scholar]
  49. Van Rensbergen, P.; Depreiter, D.; Pannemans, B.; Moerkerke, G.; Van Rooij, D.; Marsset, B.; Akhmanov, G.; Blinova, V.; Ivanov, M.; Rachidi, M.; et al. The El Arraiche mud volcano field at the Moroccan Atlantic slope, Gulf of Cadiz. Mar. Geol. 2005, 219, 1–17. [Google Scholar] [CrossRef]
  50. Somoza, L.; Vázquez, J.T.; González-Aller, D.; Dañobeitia, J.J.; Medialdea, T.; Moya, A.J.; Fernández-Salas, L.M.; León, R.; Jurado, M.J.; Paredes, M.; et al. Geophysical and hydroacoustic study of the active submarine volcanism in the El Hierro Island (Canarian Archipelago). In Proceedings of the VIII Congreso Geológico de España, Oviedo, Spain, 17–19 July 2012. [Google Scholar]
  51. Mazzini, A.; Etiope, G. Mud volcanism: An updated review. Earth Sci. Rev. 2017, 16, 81–112. [Google Scholar] [CrossRef] [Green Version]
  52. Botner, E.C.; Townsend-Small, A.; Nash, D.B.; Xu, X.; Schimmelmann, A.; Miller, J.H. Monitoring concentration and isotopic composition of methane in groundwater in the Utica Shale hydraulic fracturing region of Ohio. Environ. Monit. Assess. 2018, 190, 322. [Google Scholar] [CrossRef] [PubMed]
  53. Yamamoto, A.; Yamanaka, Y.; Oka, A.; Abe-Ouchi, A. Ocean oxygen depletion due to decomposition of submarine methane hydrate. Geophys. Res. Lett. 2014, 41, 5075–5083. [Google Scholar] [CrossRef]
  54. Kessler, J.D.; Valentine, D.L.; Redmond, M.C.; Du, M.; Chan, E.W.; Mendes, S.D.; Quiroz, E.W.; Villanueva, C.J.; Shusta, S.S.; Werra, L.M.; et al. A Persistent Oxygen Anomaly Reveals the Fate of Spilled Methane in the Deep Gulf of Mexico. Science 2011, 331, 312–315. [Google Scholar] [CrossRef] [PubMed] [Green Version]
  55. Schmale, O.; Beaubien, S.E.; Rehder, G.; Greinert, J.; Lombardi, S. Gas seepage in the Dnepr paleo-delta area (NW-Black Sea) and its regional impact on the water column methane cycle. J. Mar. Syst. 2010, 80, 90–100. [Google Scholar] [CrossRef]
  56. Poulos, S.E.; Lykousis, V.; Collins, M.B. Late Quaternary Evolution of Amvrakikos Gulf, Western Greece. Geo Mar. Lett. 1995, 15, 9–16. [Google Scholar] [CrossRef]
Figure 1. (a) Geological map of Amfilochia Gulf and surrounding area based on [19]; (b) map showing the Amvrakikos Gulf and the narrow channel through which the gulf is connected to the Ionian Sea; (c,d) Geophysical survey tracklines, MEDUSA tracklines and downcasting stations carried out in Amfilochia Bay.
Geosciences 11 00027 g001
Figure 2. The MEDUSA system while towed from the research vessel at Amfilochia Bay.
Geosciences 11 00027 g002
Figure 3. (a) MBES-bathymetric map of Amfilochia Gulf. Inset bathymetric maps showing (b) the two pockmarks, PM1 composite and PM2 single pockmark, and (c) the small protruding seafloor mound and its intersection (AB), (d) bathymetric cross-section of the seafloor mound.
Geosciences 11 00027 g003
Figure 4. 100 kHz side scan sonar mosaic of Amfilochia Bay (a) the two pockmarks (PM1 and PM2) at the south-eastern part of Amfilochia Bay, (b) the small protruding seafloor mound.
Geosciences 11 00027 g004
Figure 5. High resolution seismic profile showing typical stratigraphic pattern of Amfilochia Bay. A semitransparent upper sequence (US) with weak and strong internal parallel to subparallel reflectors overlying an acoustically-opaque, highly reflective surface (IGP: intrasedimentary gas plume, ATZ: acoustic turbid zone).
Geosciences 11 00027 g005
Figure 6. Map of Amfilochia Bay showing the spatial distribution of the acoustic types defined by 3.5 kHz subbottom profiler. (MV: mud volcano?; PM: pockmark; B.PM: buried pockmark; AT-A to D: acoustic type A to D). Lines a, b, c correspond to the location of representative subbottom profiles of AT-A,B,C presented in Figure 7 and d of a profile indicative of AT-D shown in Figure 8.
Geosciences 11 00027 g006
Figure 7. Representative high resolution seismic profile showing the acoustic types AT-A, AT-B and AT-C and the stratigraphic relationship between them (US: upper sequence, TU: transparent unit, PSR: package of strong reflectors, IGP: intrasedimentary gas plumes).
Geosciences 11 00027 g007
Figure 8. Representative high resolution seismic profiles showing AT-D, (US: upper sequence, AOZ: acoustically opaque zone).
Geosciences 11 00027 g008
Figure 9. High resolution profiles showing (a) ATZ sharply cutting across the stratification (indicated by red arrows) and (b) ATZ appears weak as indicated by the fact that the seismic reflectors (red arrows) underlying the top of the ATZ are not entirely hidden.
Geosciences 11 00027 g009
Figure 10. High resolution profiles showing (a,b) enhanced reflectors and (b) enhanced reflectors due to gas migration through the underlain upward curving sedimentary strata (ER: enhanced reflector).
Geosciences 11 00027 g010
Figure 11. High resolution profiles showing: (a) ΙGPs reaching the seabed surface and exhibiting chaotic character with hyperbolic configuration (b) local high reflectivity patches (LHRP) accompanied by acoustic blanking.
Geosciences 11 00027 g011
Figure 12. High resolution profiles showing (a) PM1 truncating all the three units of the upper acoustically semitransparent sequence, (b,c) ATZ which is located under the floor of the pockmark PM1 (P.ATZ), (d) a rotational slide (RS) affecting the sidewall of the pockmark PM1 (US: upper sequence, TU: transparent unit, PSR: package of strong reflectors, ER: enhanced reflector, ATZ: acoustic turbid zone).
Geosciences 11 00027 g012
Figure 13. High resolution profiles showing active (PM1) and buried (B.PM) pockmarks (PFL: pockmark’s floor elevation).
Geosciences 11 00027 g013
Figure 14. High resolution seismic profiles showing the protruding mound which possibly represents a mud volcano (PAE: prolonged acoustic echoes, MF: mud flow deposits, GP: gas plume).
Geosciences 11 00027 g014
Figure 15. Downcasting data collected from two stations (Station 2 and Station 30) during the summer period. Station 30 is located just above PM1 pockmark. Full dataset can be found in Spreadsheet S1 of the Supplementary Material.
Geosciences 11 00027 g015
Figure 16. The MEDUSA system tracklines at depths 4, 8, 16 and 30–43 m, plotted in combination with the corresponding (a) methane and (b) dissolved oxygen measured concentrations; (c) 3-D representation of the Amfilochia Bay pockmarks showing the position of the closest to the seabed MEDUSA system trackline (30–43 m) and the corresponding dissolved oxygen concentration and dissolved methane concentration. Vertical exaggeration: 3.
Geosciences 11 00027 g016
Table 1. Isotopic analyses results from different samples that were collected from near and inside PM1 pockmark.
δ13CCH4UC DavisIsotech
Outside pockmark sediment−83.5‰-
Inside pockmark sediment−84.7‰−87‰
Outside pockmark water−41.5‰-
Inside pockmark water−52.3‰-
Publisher’s Note: MDPI stays neutral with regard to jurisdictional claims in published maps and institutional affiliations.

