
Tracing δ18O and δ2H in Source Waters and Recharge Pathways of a Fractured-Basalt and Interbedded-Sediment Aquifer, Columbia River Flood Basalt Province

 , , , , ,
Abstract
:
1. Introduction


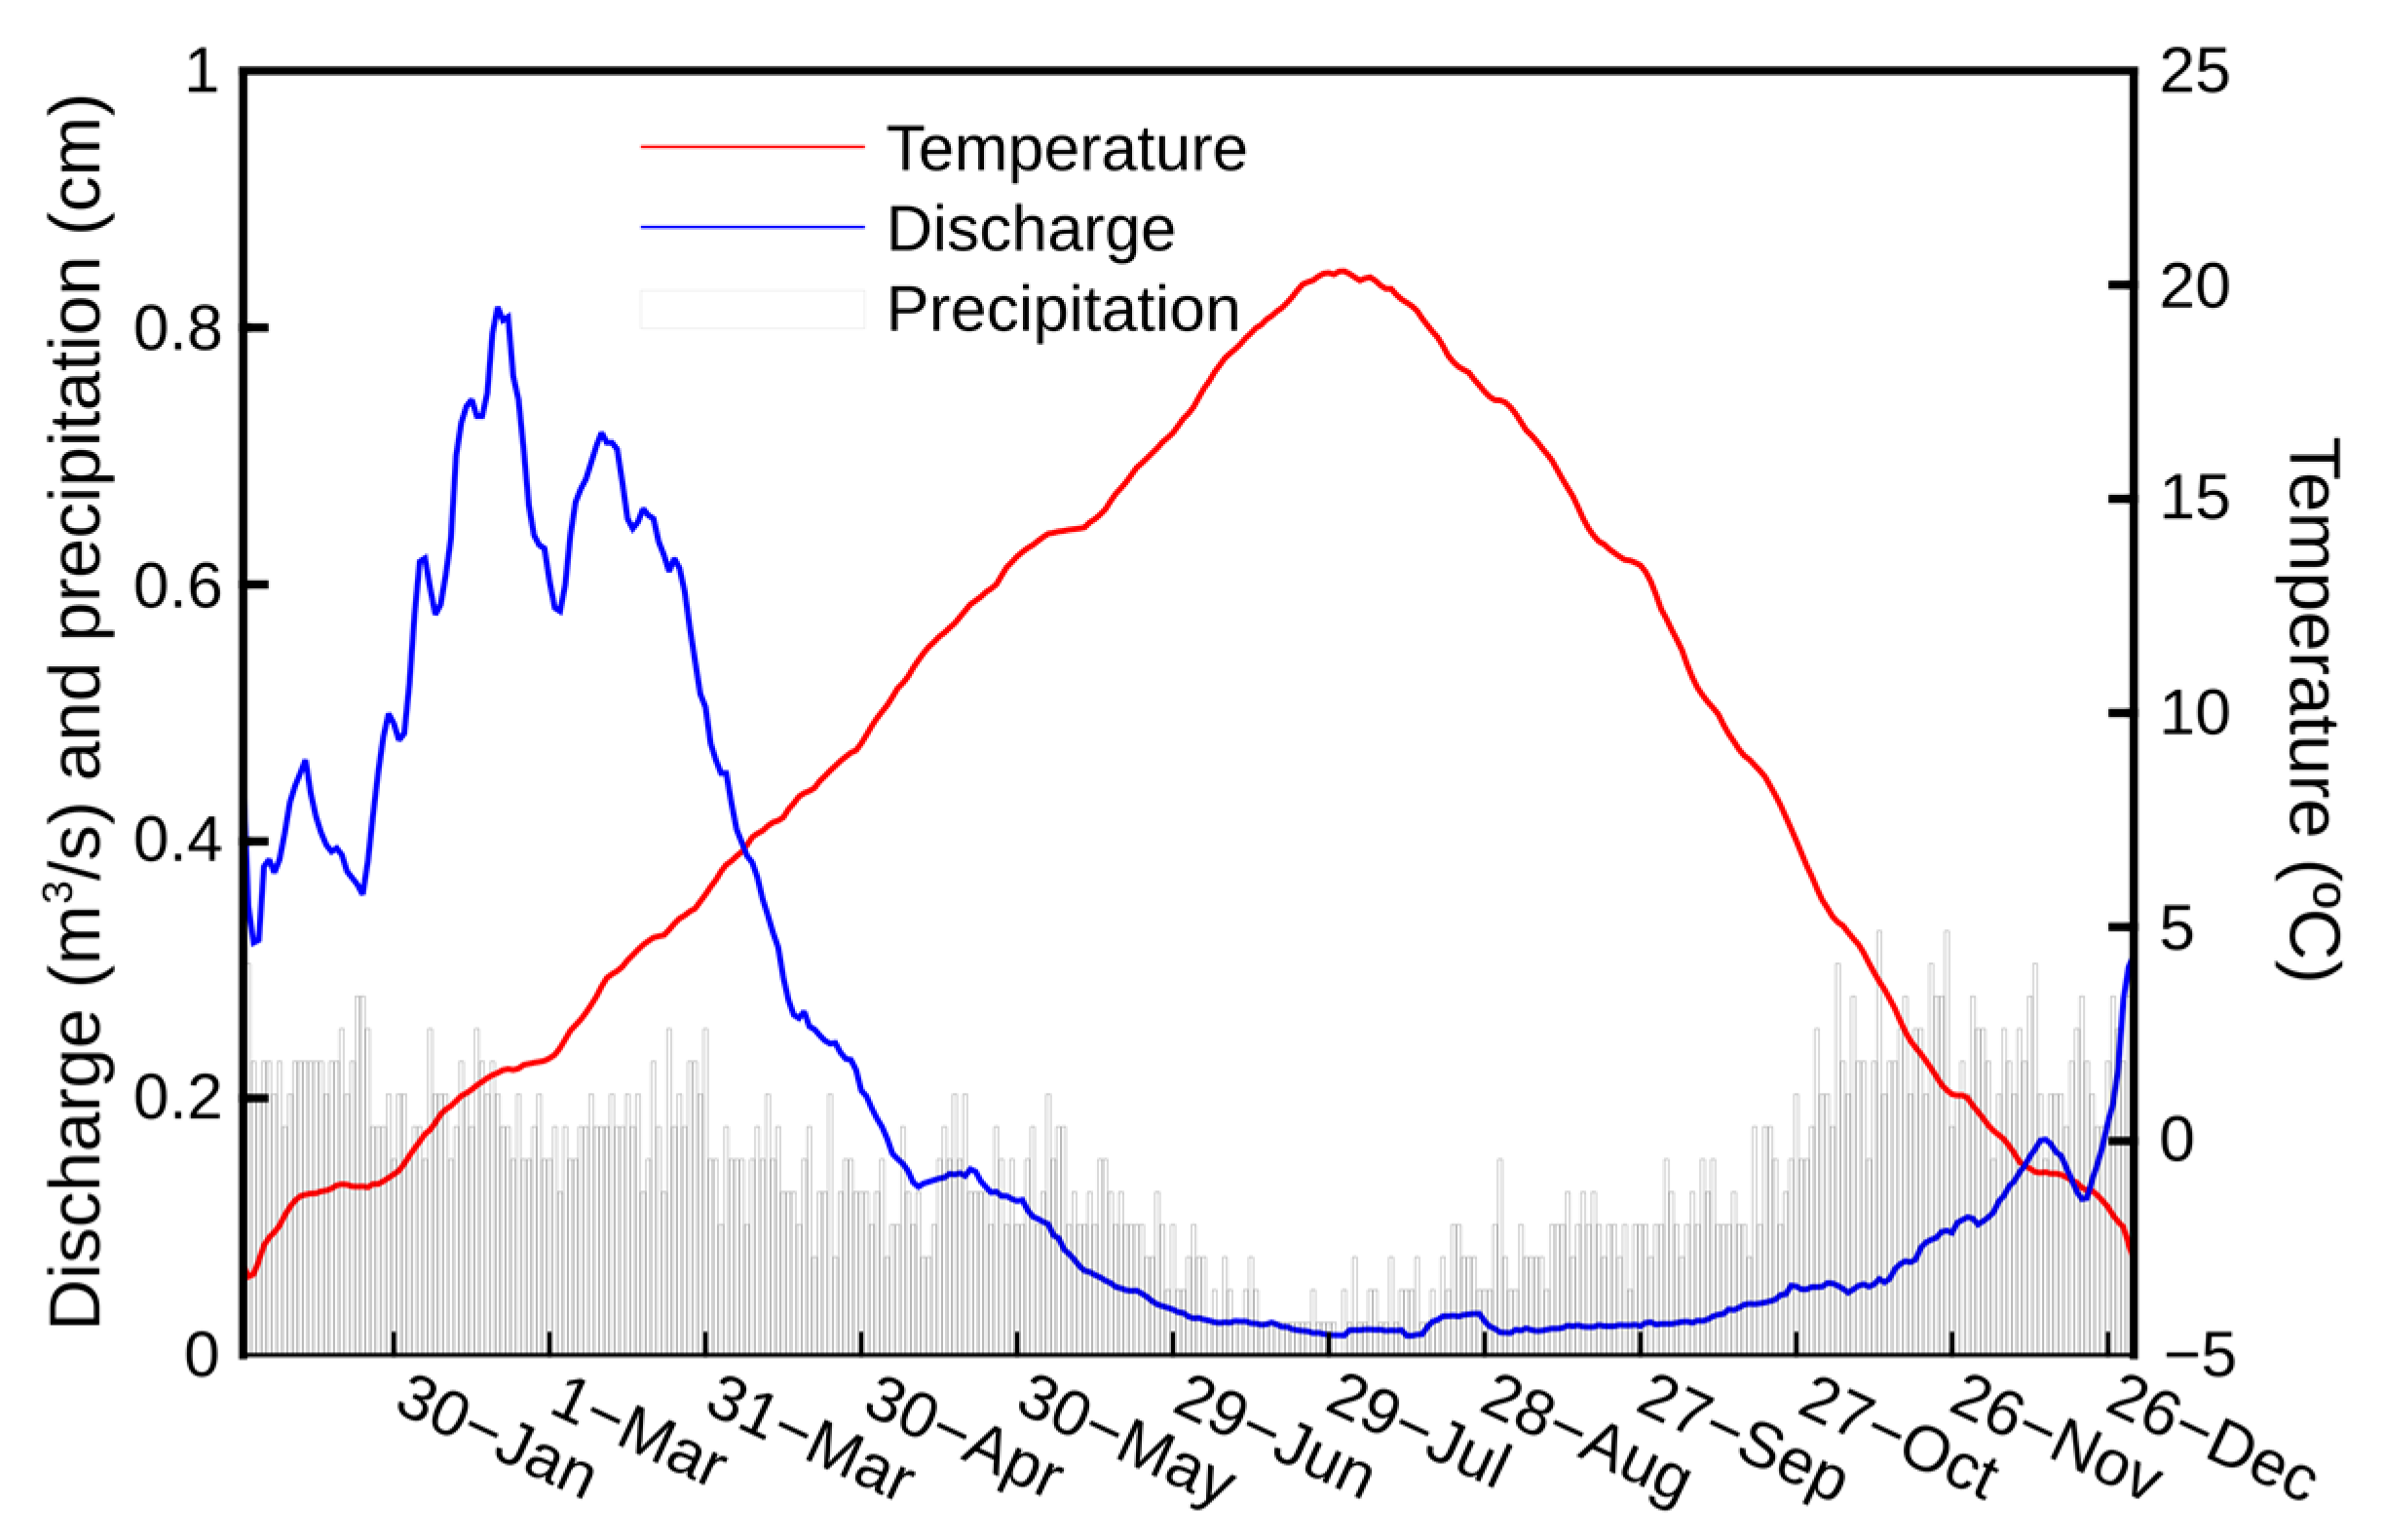
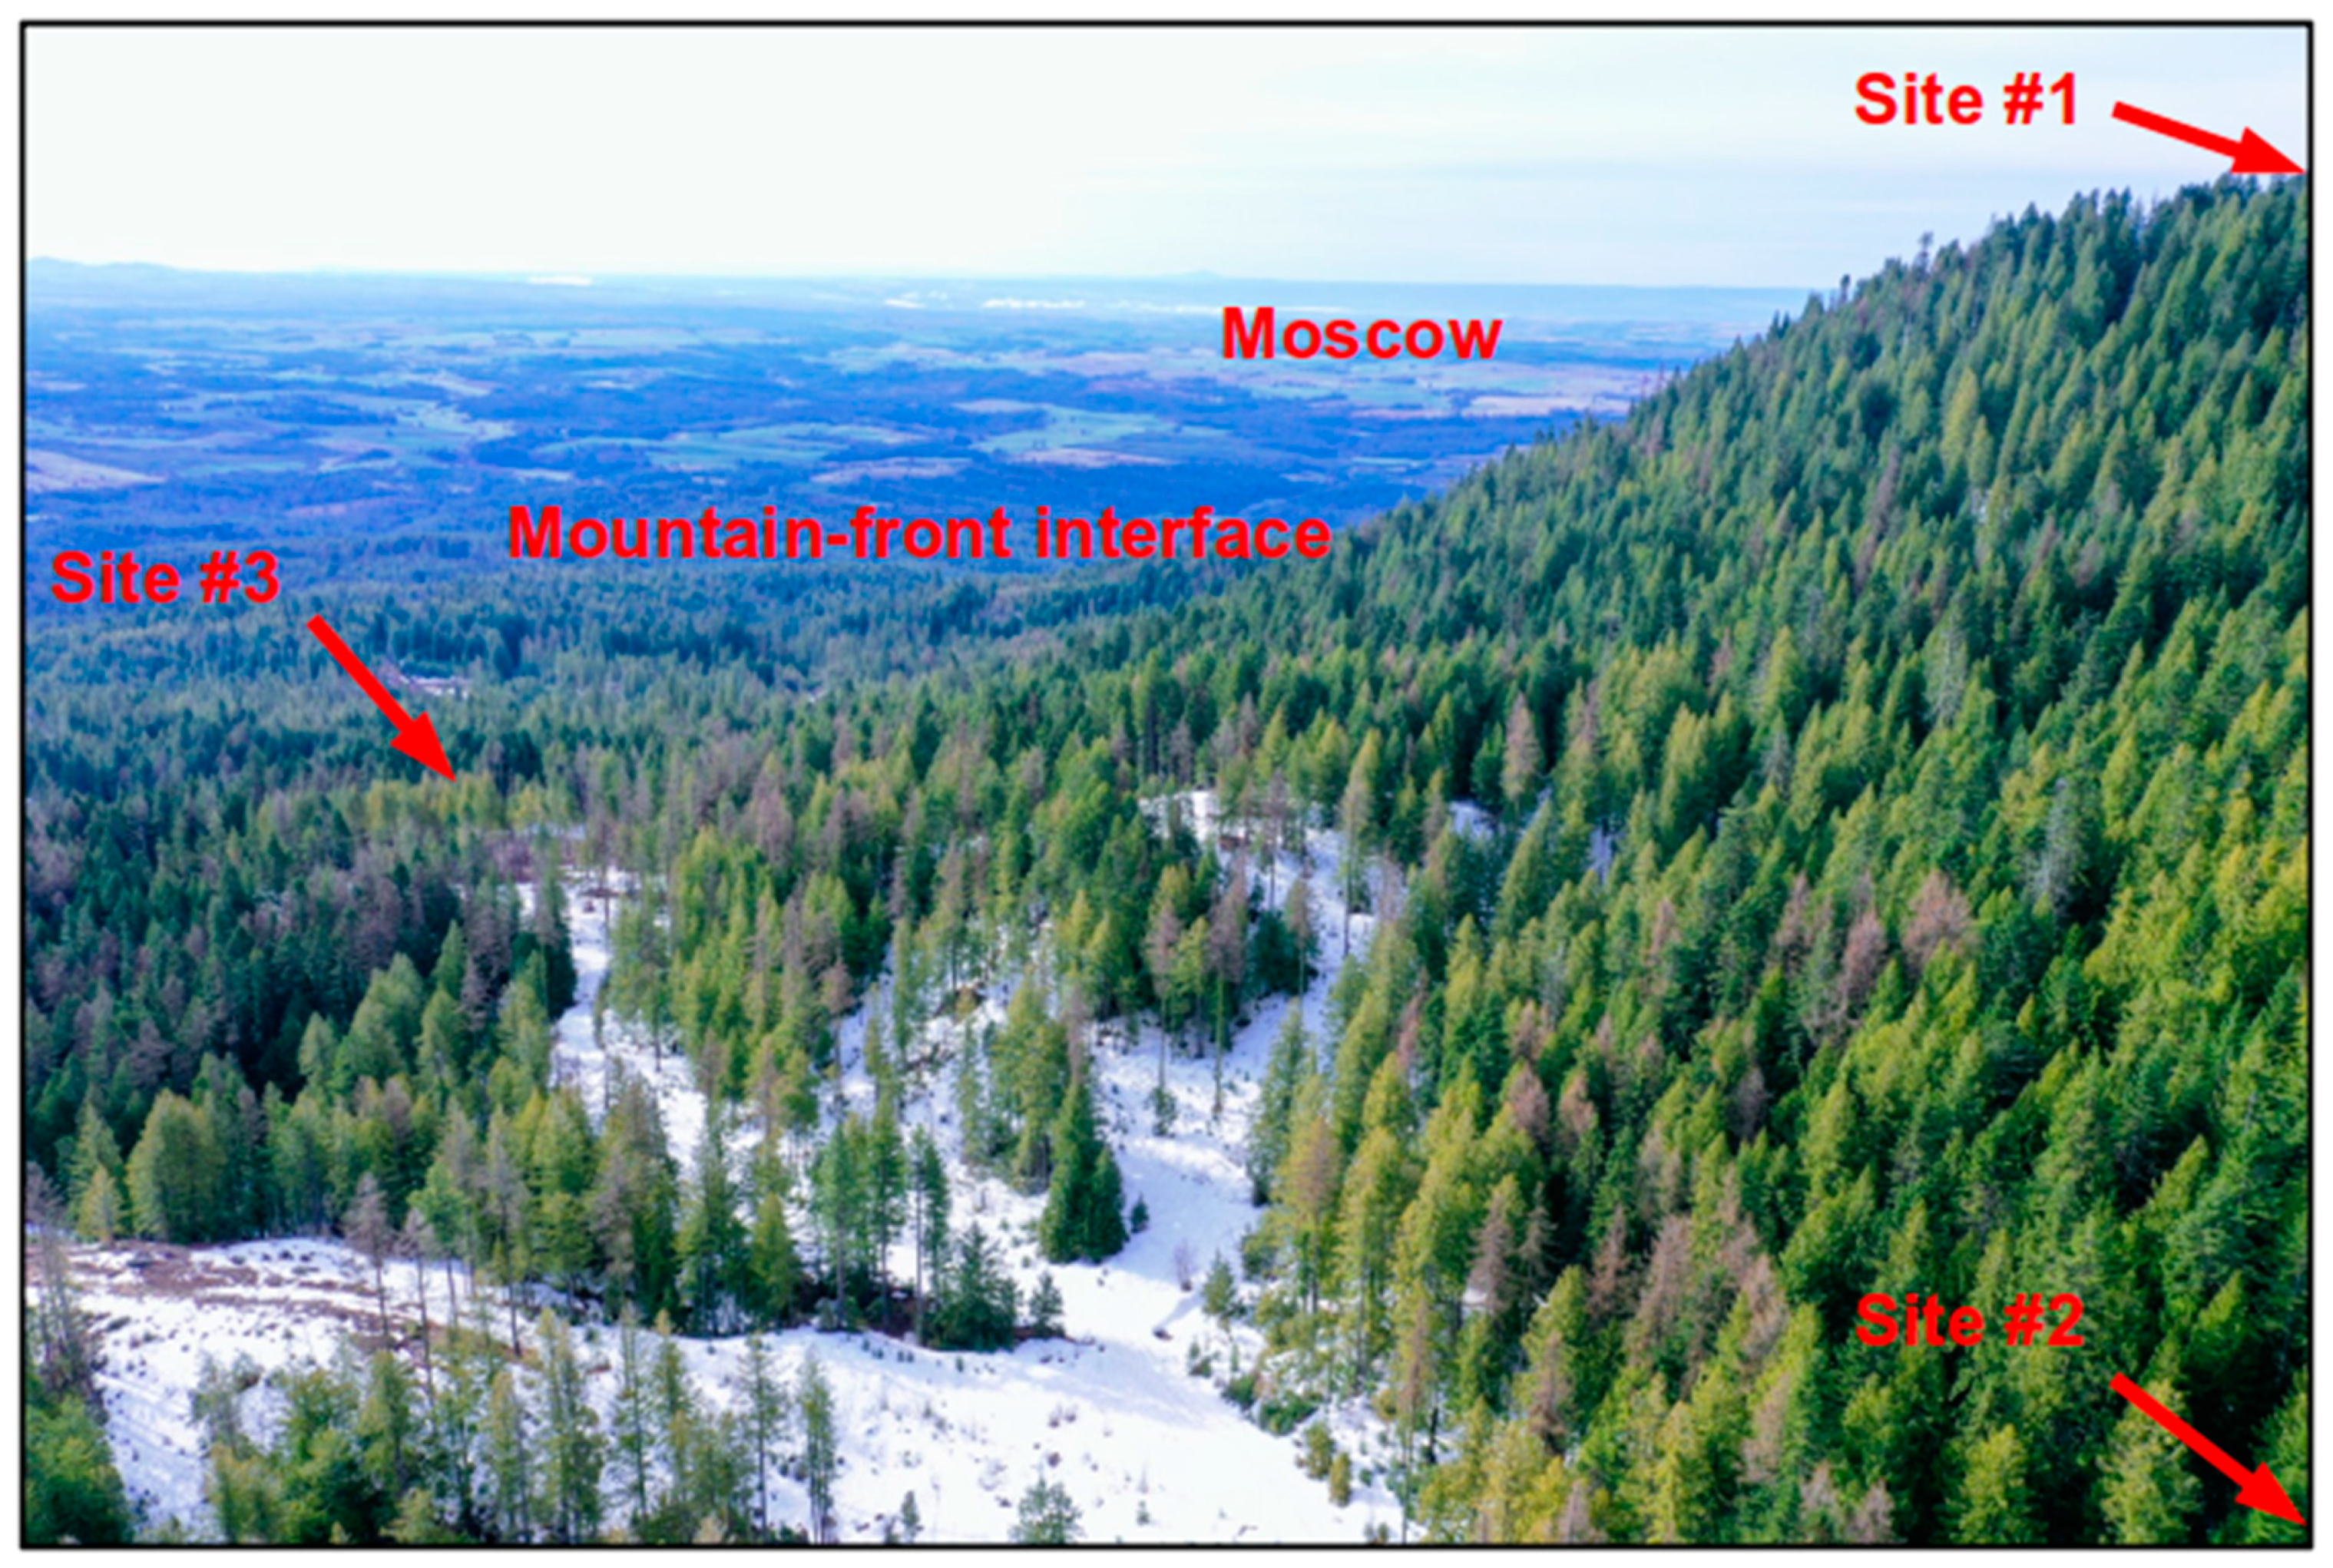
2. Study Area Climate, Hydrology, and Potential Recharge
3. Design, Materials, and Methods
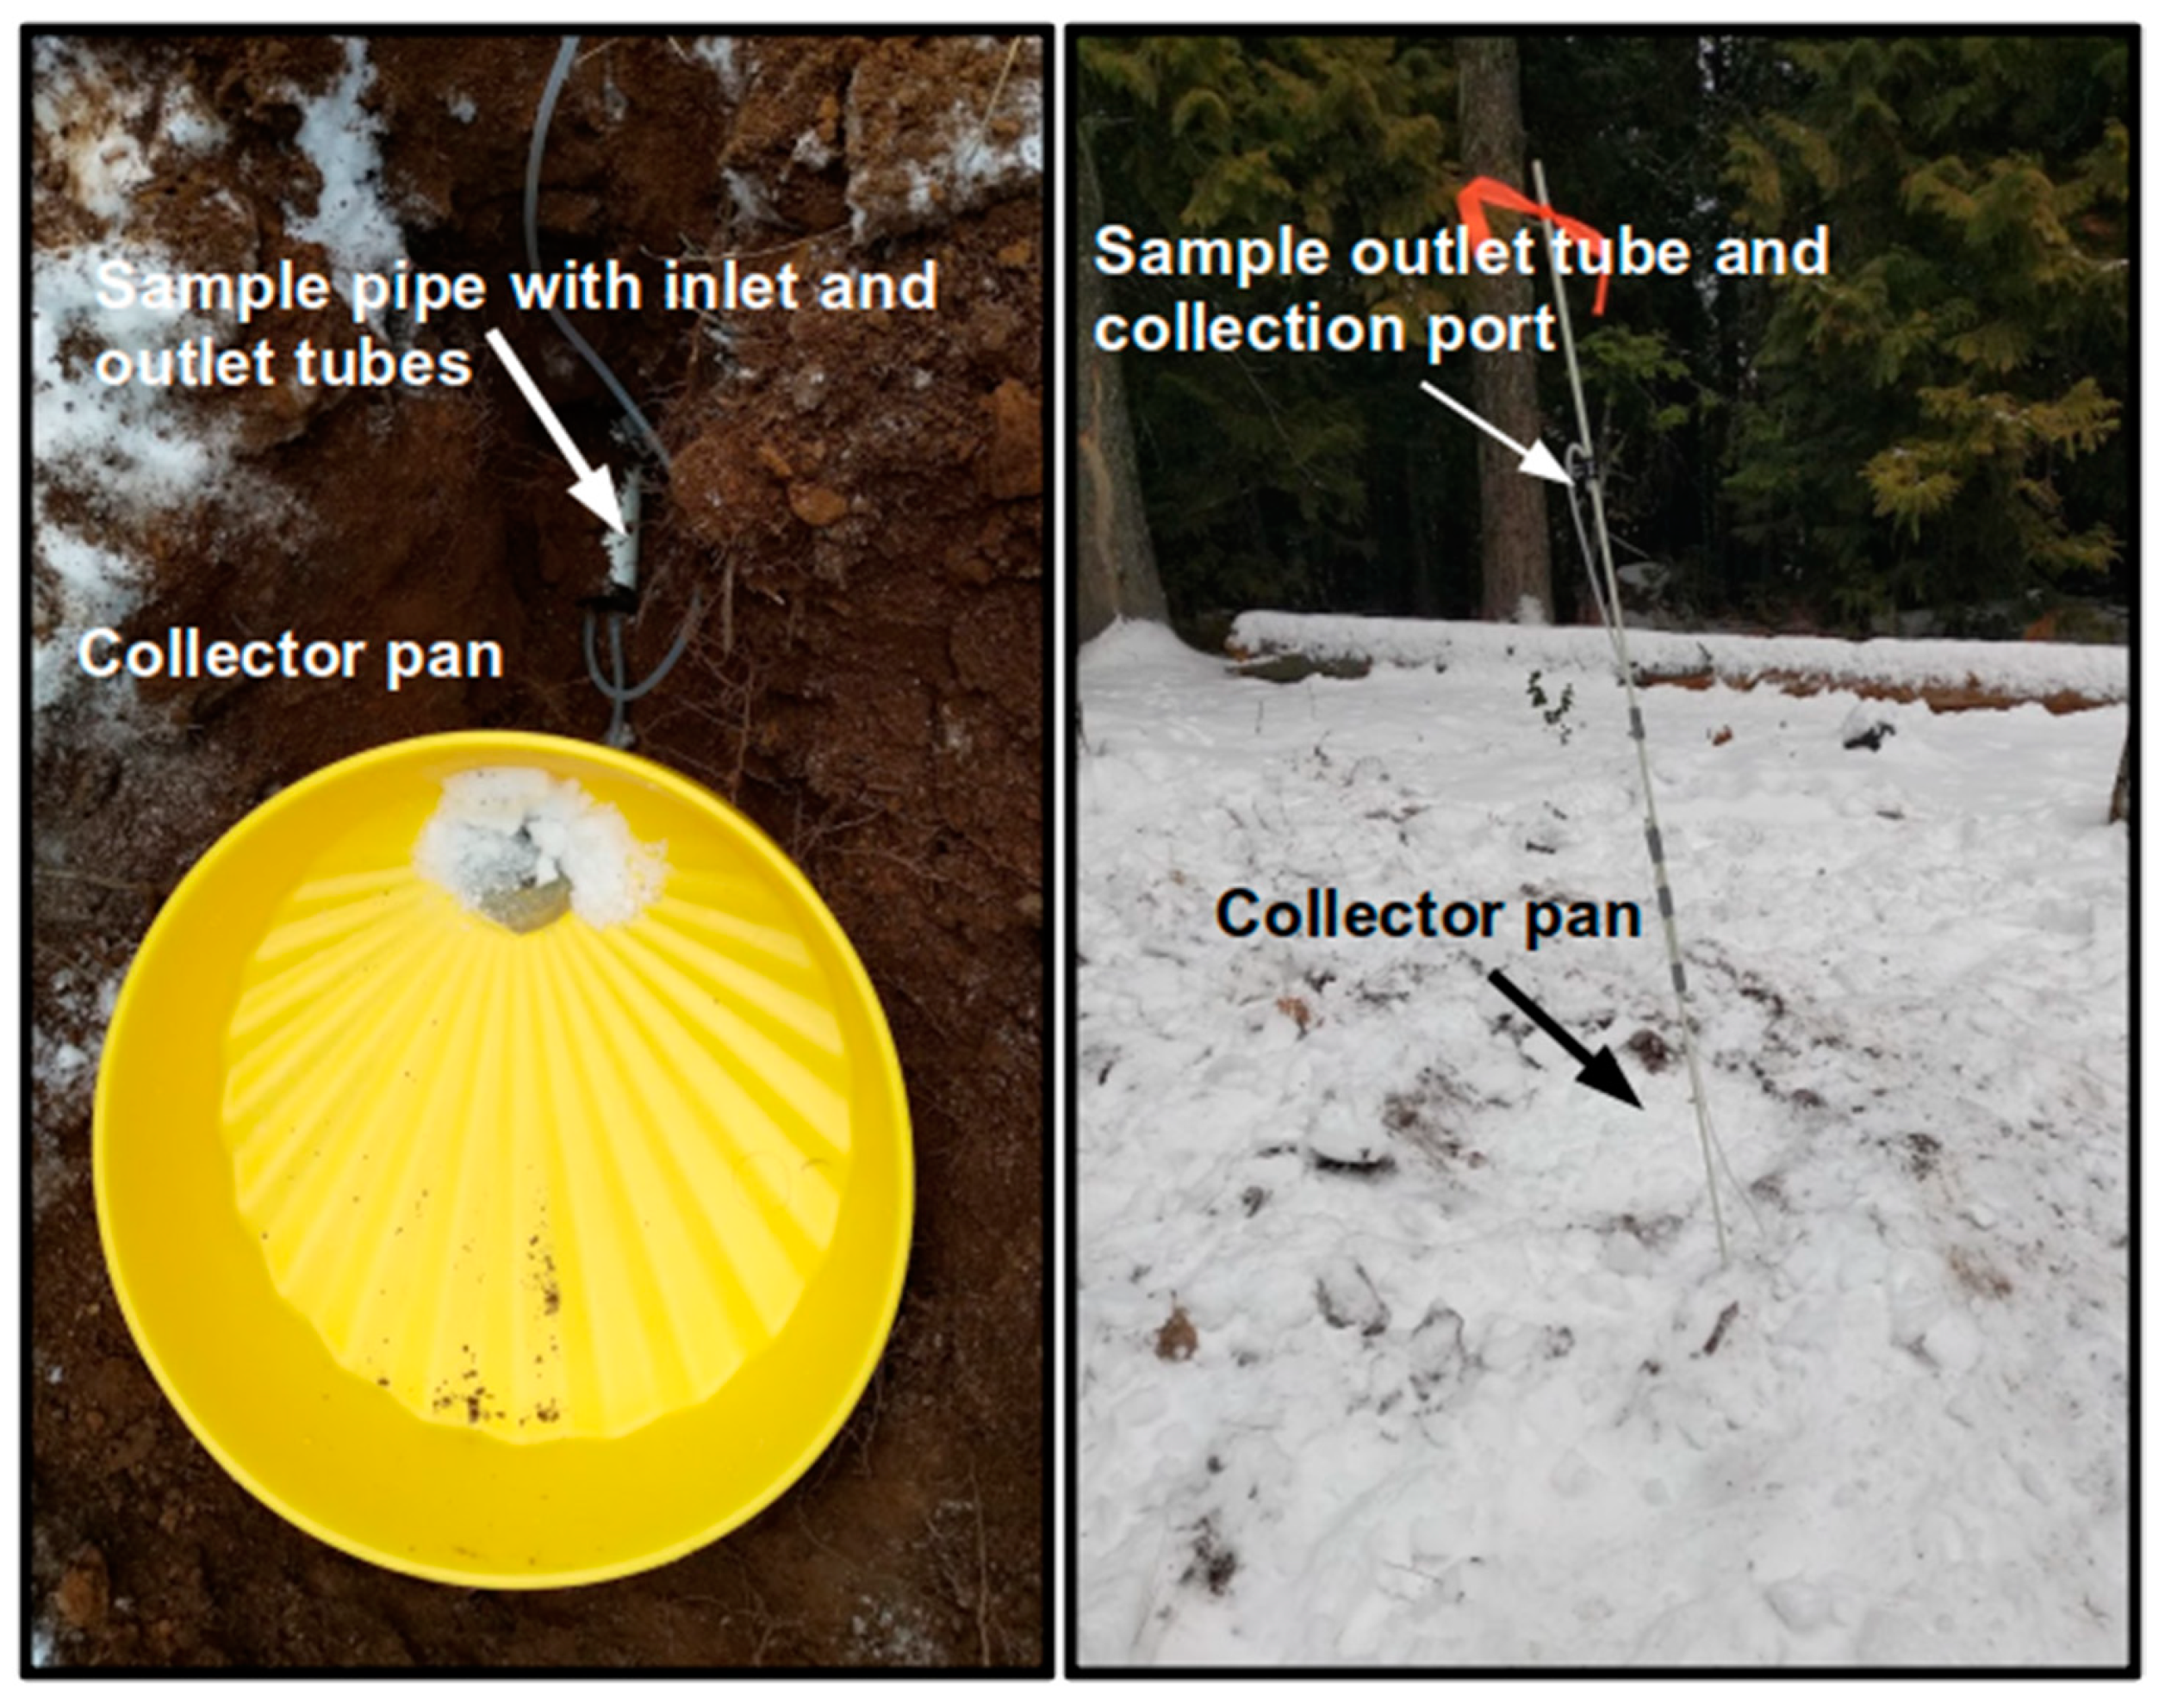
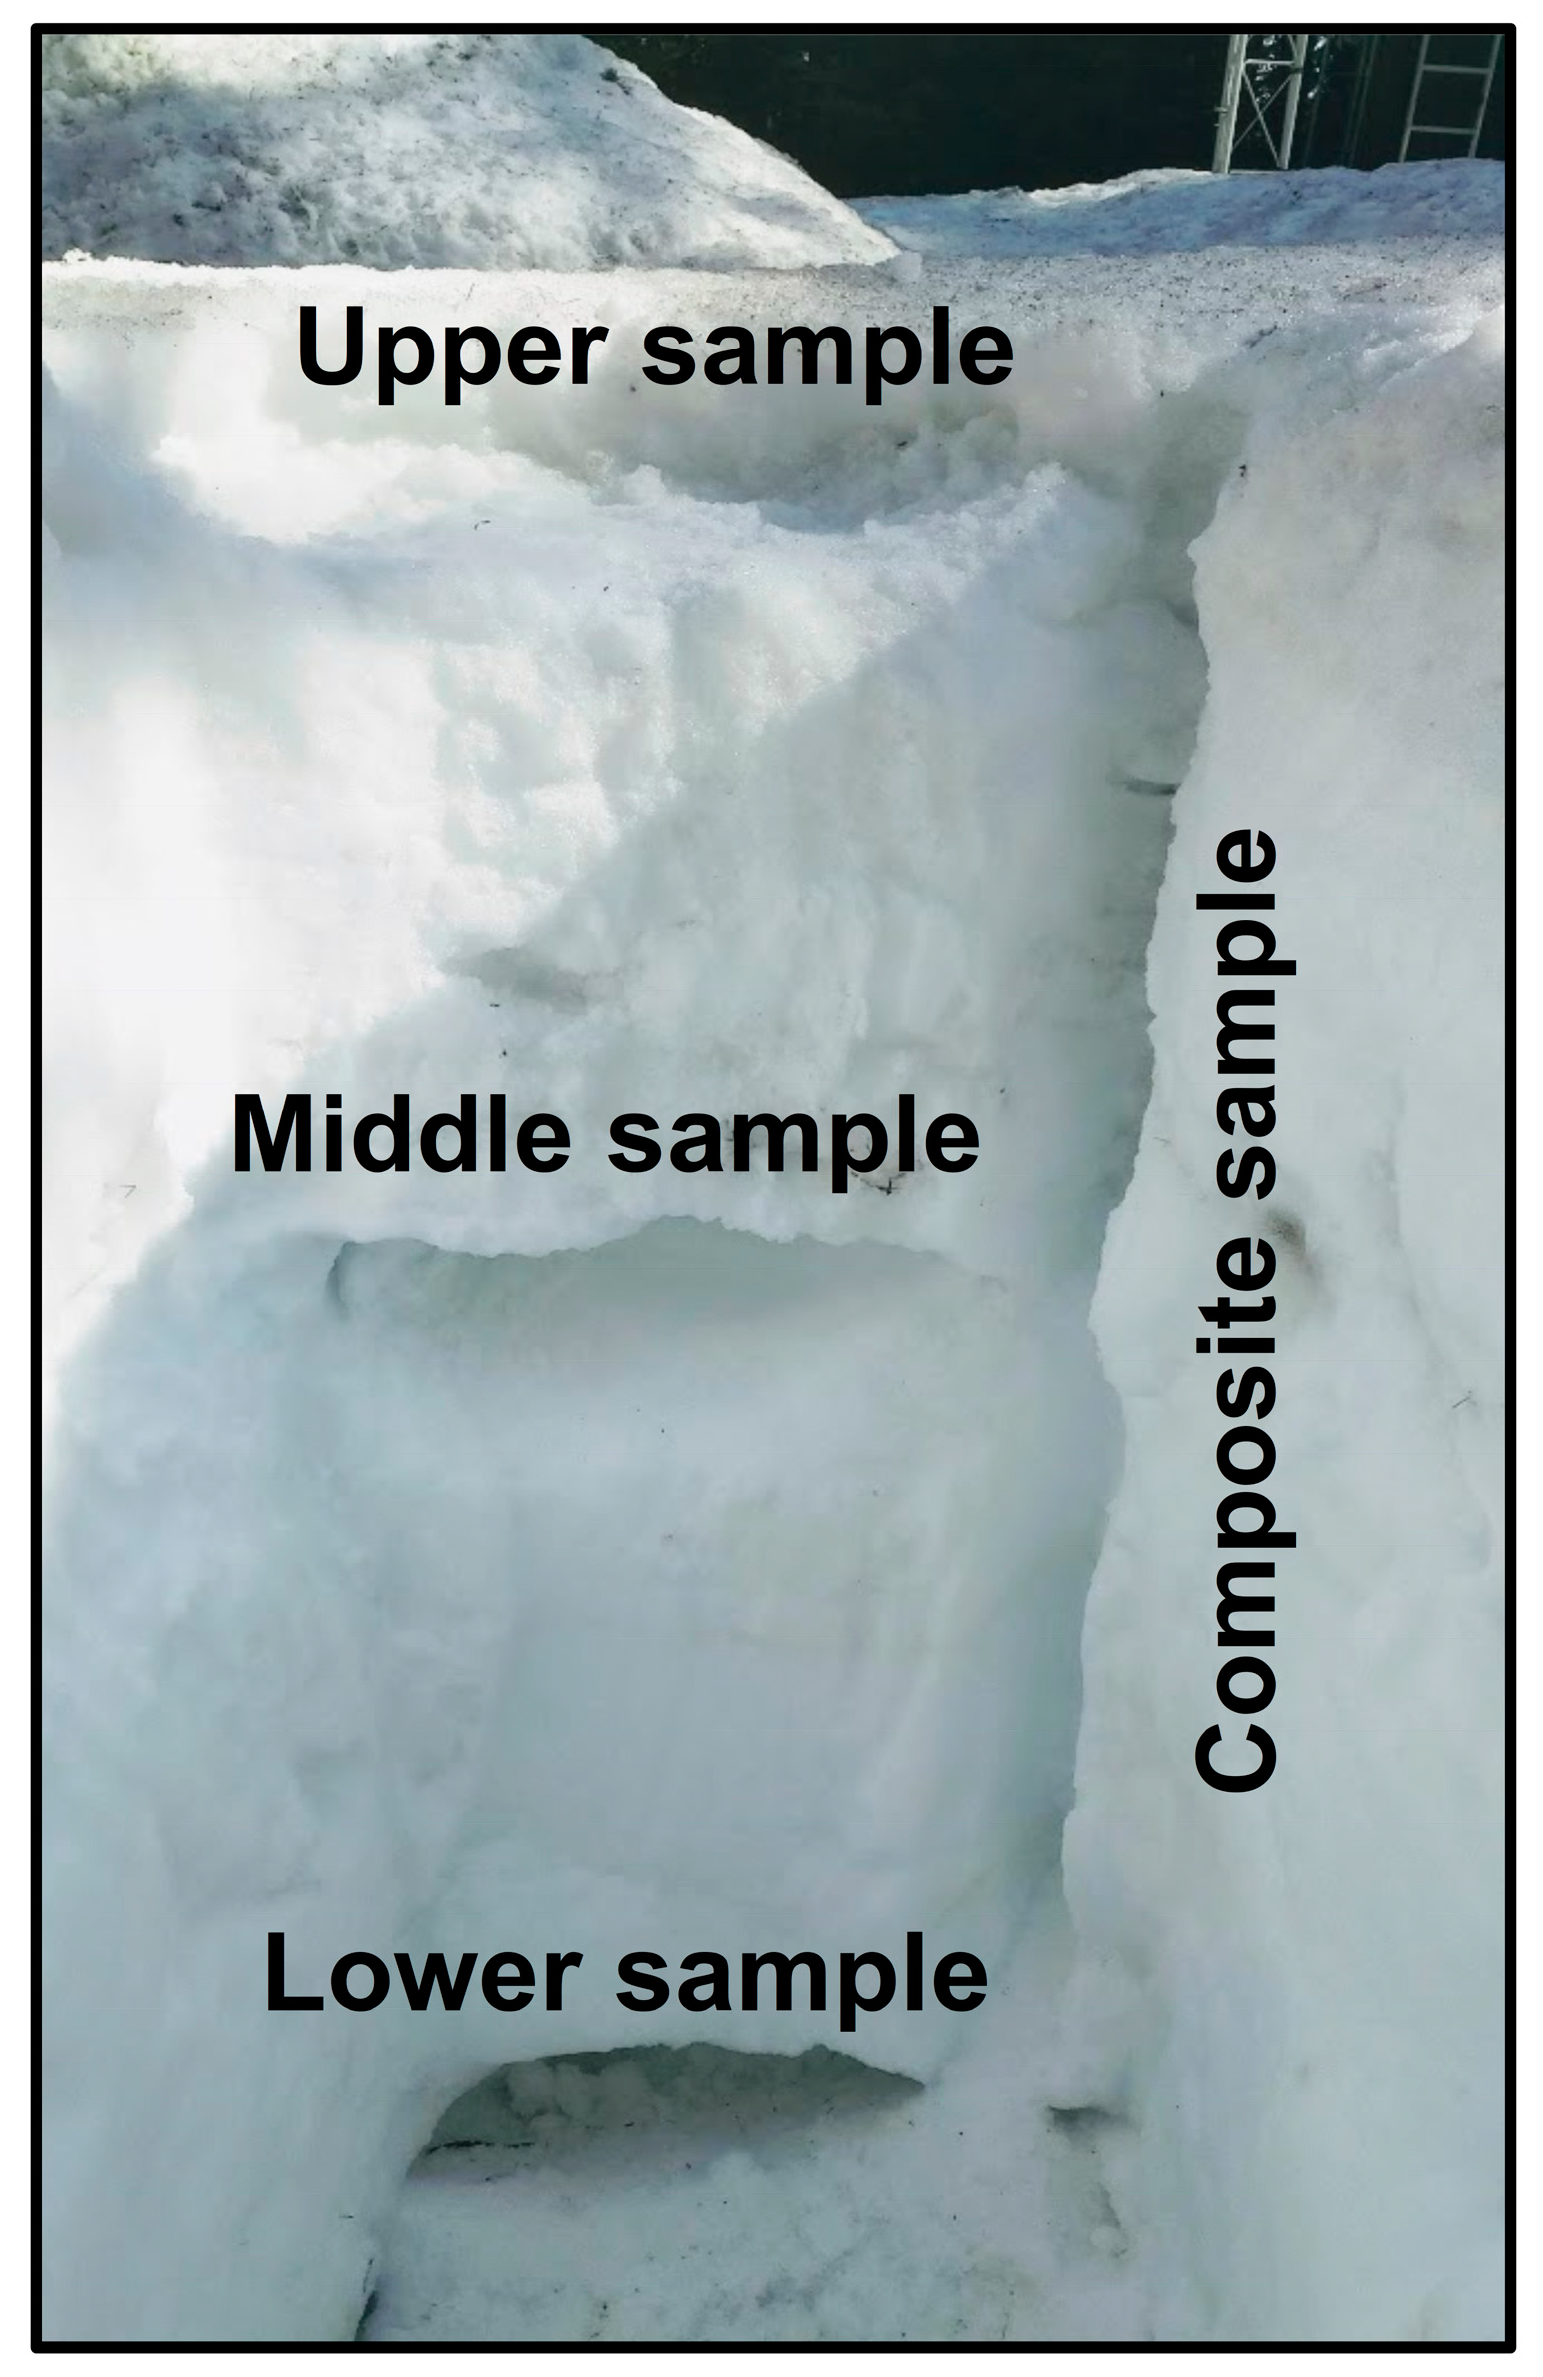
3.1. Snowpack, Snowmelt, Rain Isotopes
3.2. Creek Isotopes
3.3. Groundwater Isotopes
3.4. Isotope Distribution Analyses
3.5. Isotope Inverse Modeling
4. Results and Discussion
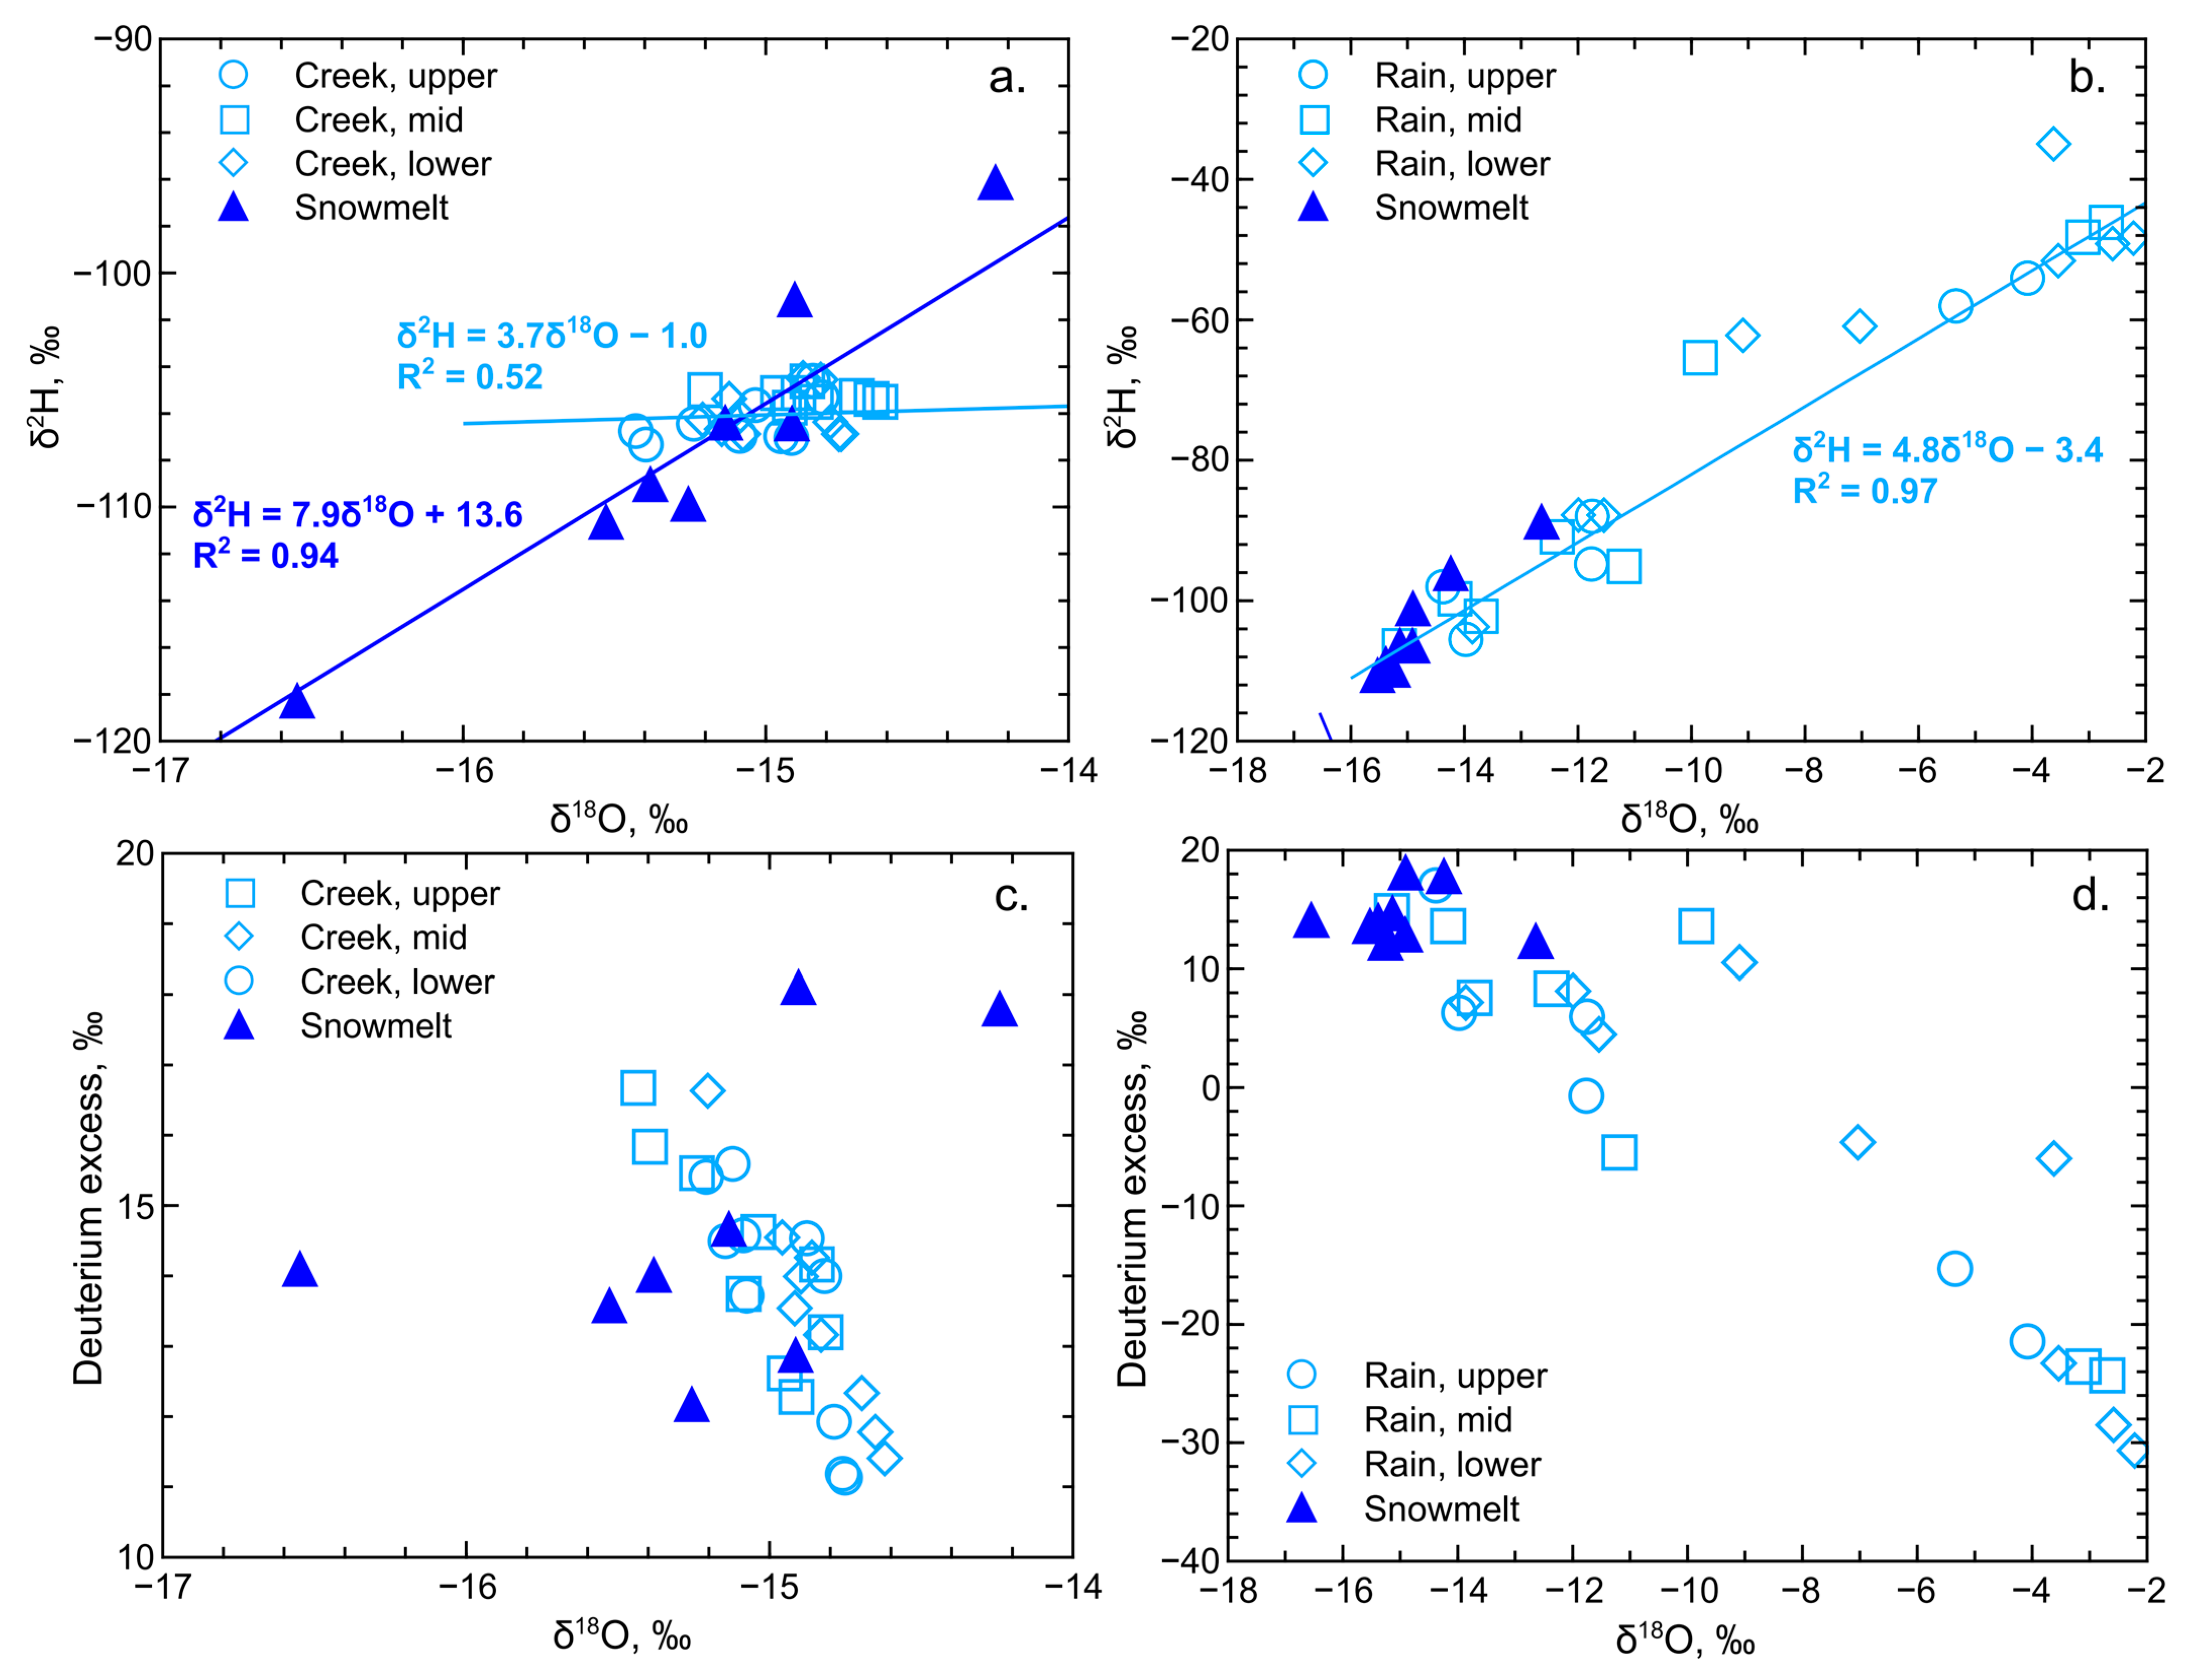
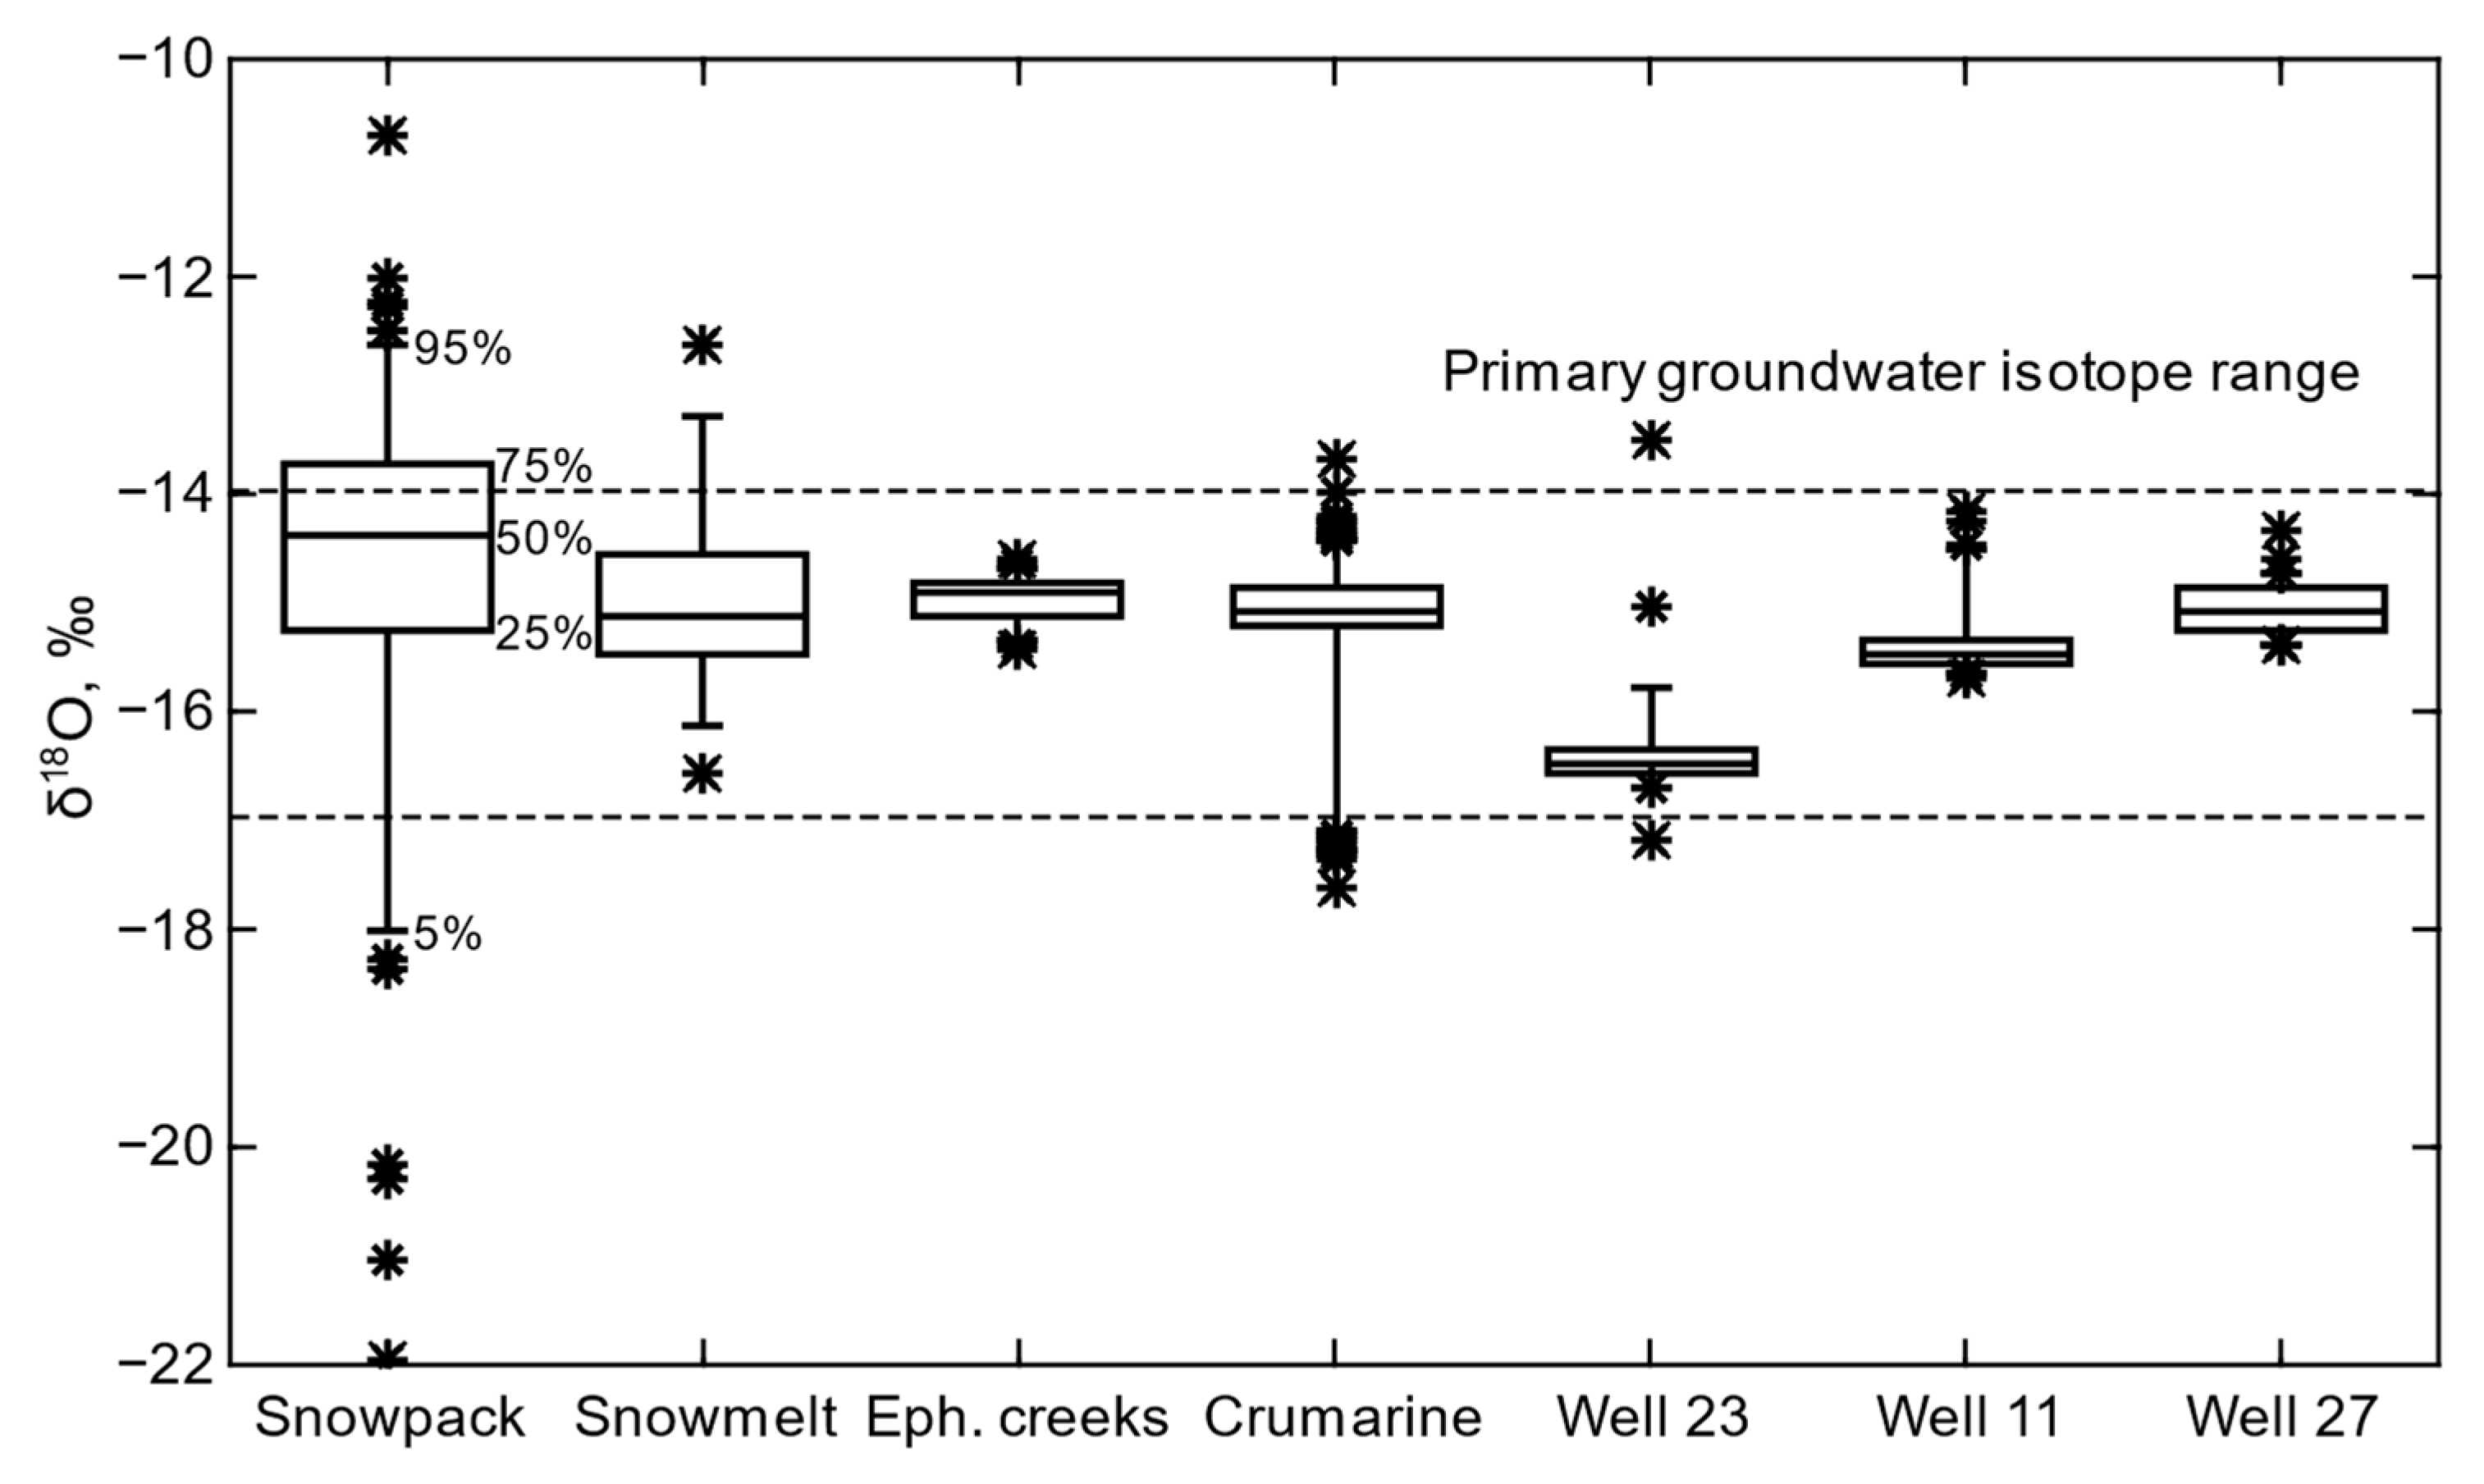
4.1. Basin Source Waters and Isotope Signals
4.2. Source Waters and Deuterium Excess
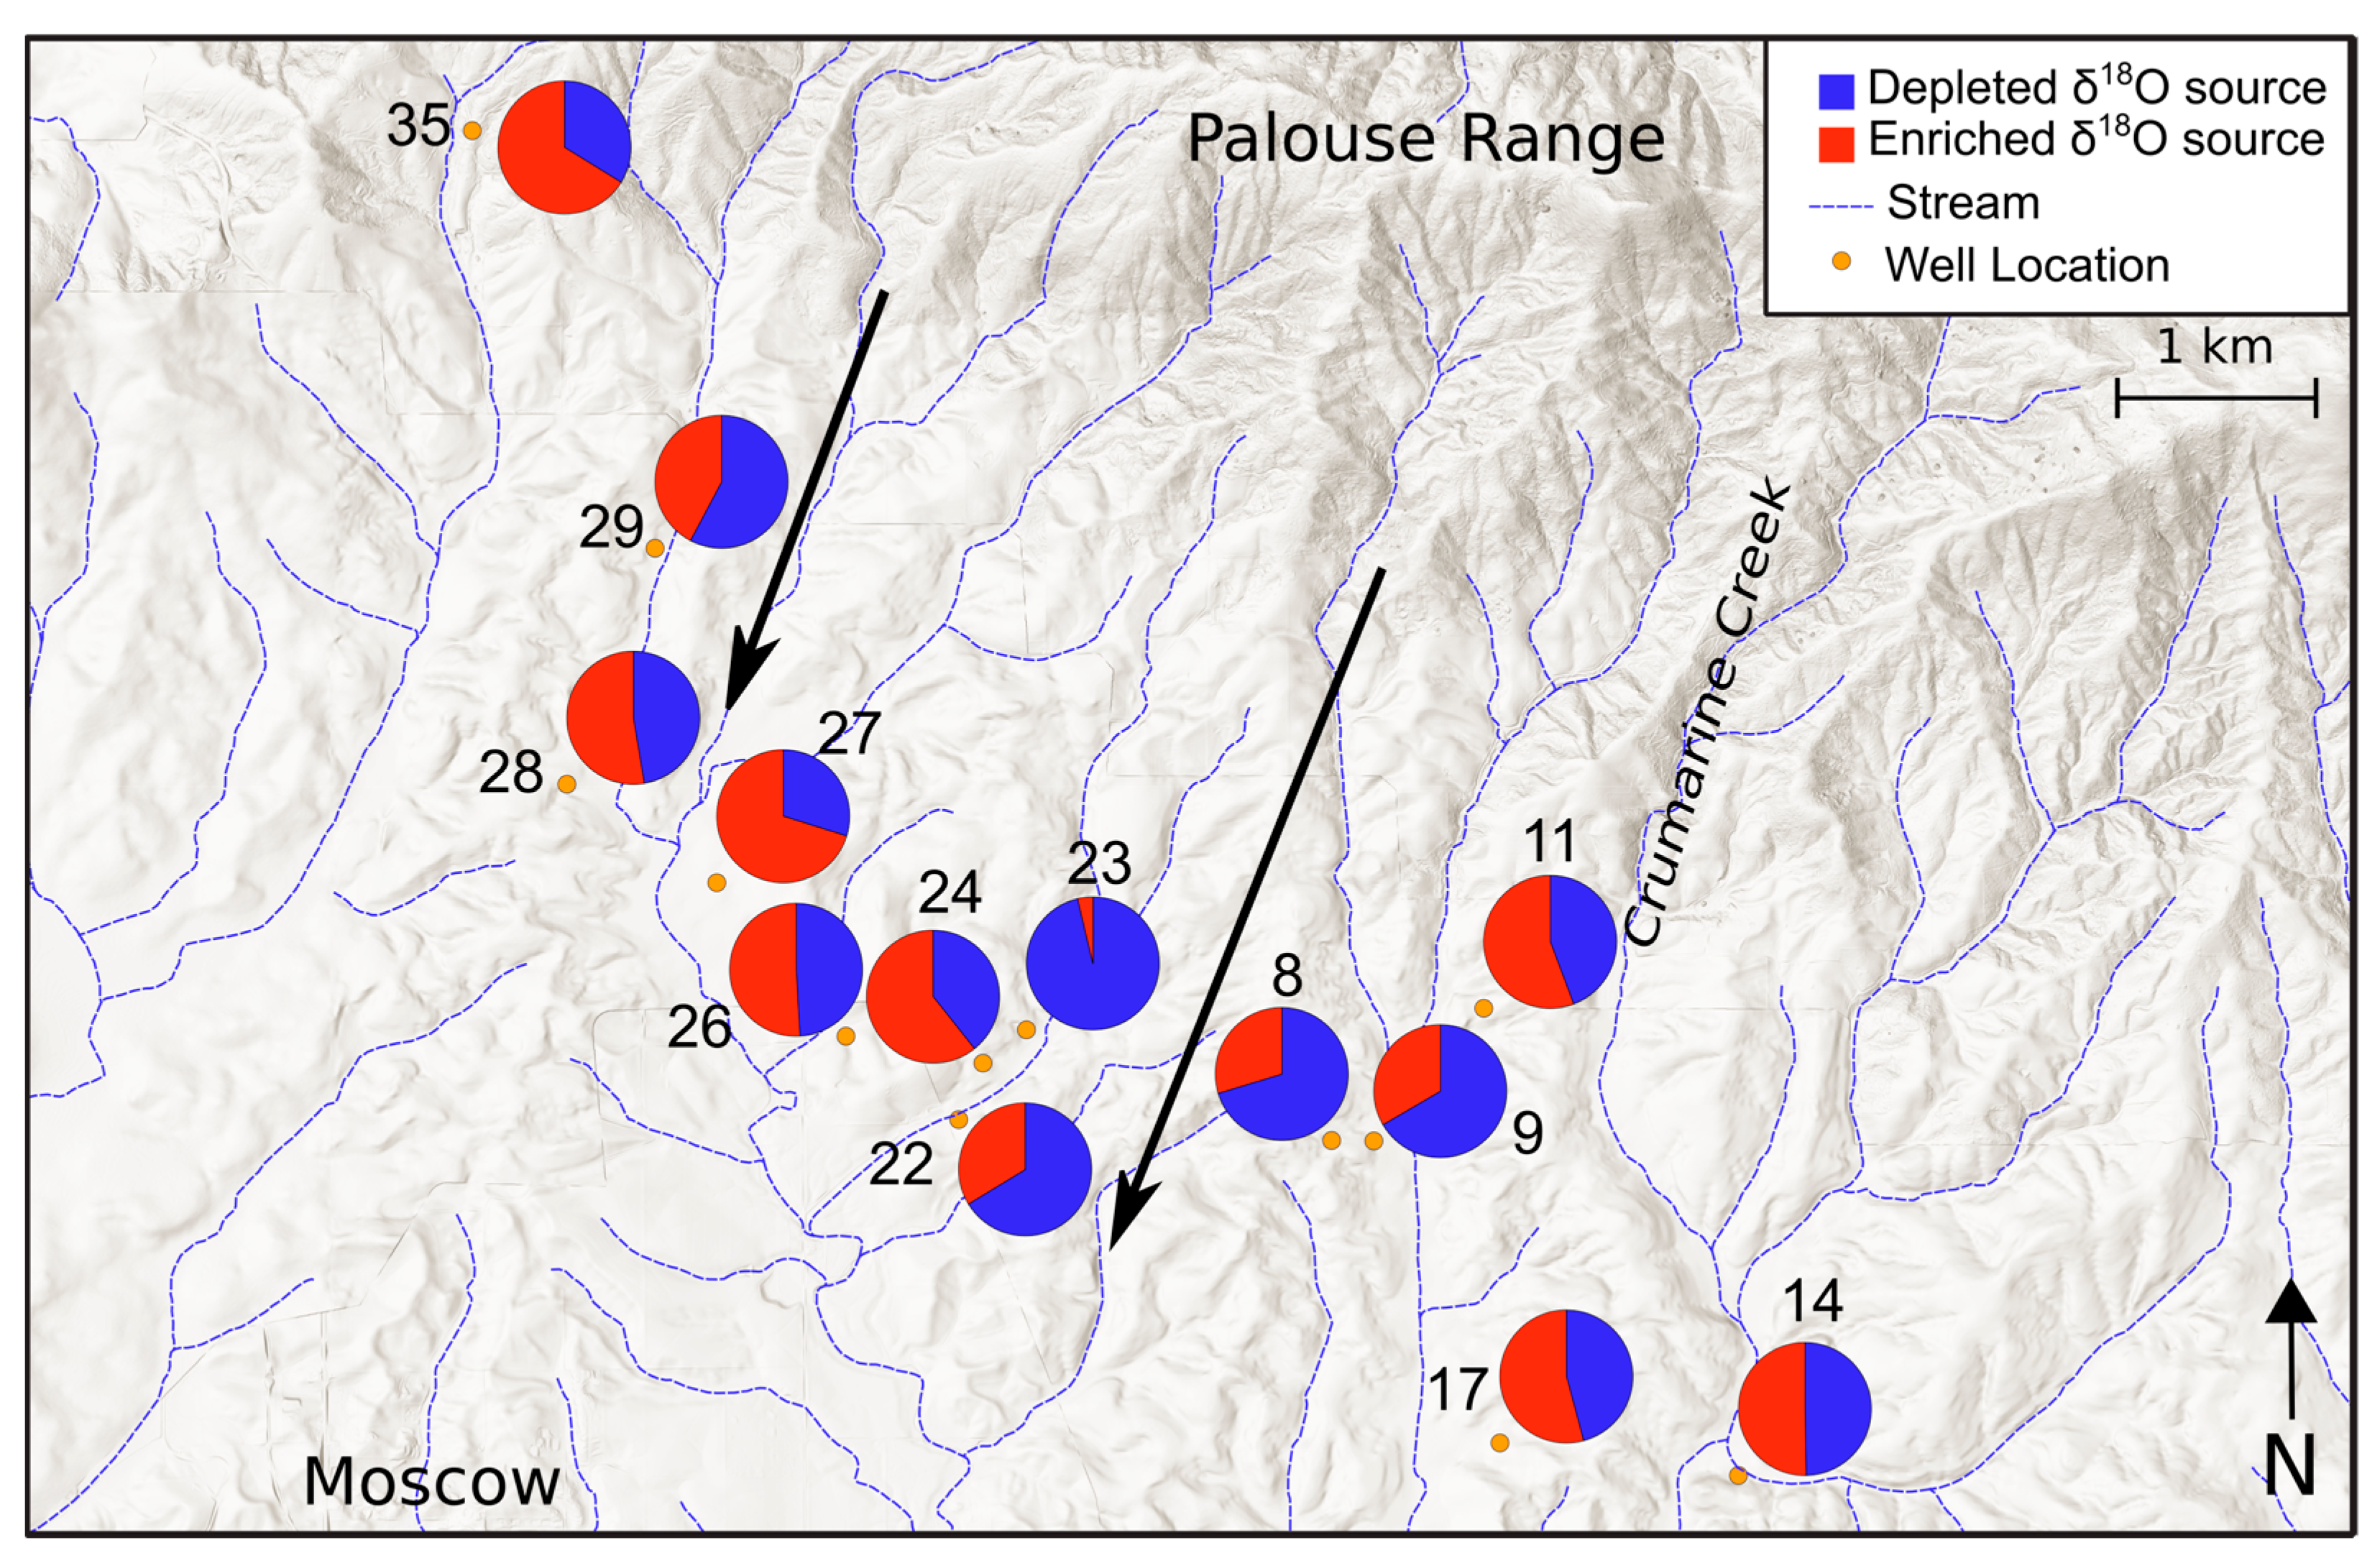
4.3. Source Water Groupings
5. Inverse Modeling
6. Conclusions
Supplementary Materials
Author Contributions
Funding
Institutional Review Board Statement
Informed Consent Statement
Data Availability Statement
Acknowledgments
Conflicts of Interest
References
- Meixner, T.; Manning, A.H.; Stonestrom, D.A.; Allen, D.M.; Ajami, H.; Blasch, K.W.; Brookfield, A.E.; Castro, C.L.; Clark, J.F.; Gochis, D.J.; et al. Implications of Projected Climate Change for Groundwater Recharge in the Western United States. J. Hydrol. 2016, 534, 124–138. [Google Scholar] [CrossRef] [Green Version]
- Frisbee, M.D.; Tolley, D.G.; Wilson, J.L. Field Estimates of Groundwater Circulation Depths in Two Mountainous Watersheds in the Western U.S. and the Effect of Deep Circulation on Solute Concentrations in Streamflow. Water Resour. Res. 2017, 53, 2693–2715. [Google Scholar] [CrossRef]
- Dhungel, R.; Fiedler, F. Water Balance to Recharge Calculation: Implications for Watershed Management Using Systems Dynamics Approach. Hydrology 2016, 3, 13. [Google Scholar] [CrossRef] [Green Version]
- Ely, D.M.; Burns, E.R.; Morgan, D.S.; Vaccaro, J.J. Numerical Simulation of Groundwater Flow in the Columbia Plateau Regional Aquifer System, Idaho, Oregon, and Washington; Scientific Investigations Report; U.S. Geological Survey: Reston, VA, USA, 2014; Volume 2014—5127, p. 102.
- Vaccaro, J.J. Summary of the Columbia Plateau Regional Aquifer-System Analysis, Washington, Oregon, and Idaho; Professional Paper; U.S. Geological Survey: Reston, VA, USA, 1999; p. 64.
- Douglas, A.A.; Osiensky, J.L.; Keller, C.K. Carbon-14 Dating of Ground Water in the Palouse Basin of the Columbia River Basalts. J. Hydrol. 2007, 334, 502–512. [Google Scholar] [CrossRef]
- Carey, L. Evaluation of Oxygen and Hydrogen Isotopes in Groundwater of the Palouse Basin and Moscow Sub-Basin. Master’s Thesis, University of Idaho, Moscow, ID, USA, 2011. [Google Scholar]
- Moxley, N. Stable Isotope Analysis of Surface Water and Precipitation in the Palouse Basin: Hydrologic Tracers of Aquifer Recharge. Master’s Thesis, Washington State University, Pullman, WA, USA, 2012. [Google Scholar]
- Lum, W.E., II; Smoot, J.L.; Ralston, D.R. Geohydrology and Numerical Model Analysis of Ground-Water Flow in the Pullman-Moscow Area, Washington and Idaho; U.S. Geological Survey: Reston, VA, USA, 1990; Volume 79.
- Owsley, D. Characterization of Grande Ronde Aquifers in the Palouse Basin Using Large Scale Aquifer Tests. Master’s Thesis, University of Idaho, Moscow, ID, USA, 2003. [Google Scholar]
- Folnagy, A.J.B. Long-Term Grande Ronde Aquifer Stress Testing to Delineate Compartmentalization and Water Level Responses in the Palouse Basin. Master’s Thesis, University of Idaho, Moscow, ID, USA, 2012. [Google Scholar]
- Moran, K. Interpretation of Long-Term Grande Ronde Aquifer Testing in the Palouse Basin of Idaho and Washington. Master’s Thesis, University of Idaho, Moscow, ID, USA, 2011. [Google Scholar]
- Folnagy, A.J.B.; Osiensky, J.L.; Kobayashi, D.; Sprenke, K.F. Specific Storage from Sparse Records of Groundwater Response to Seismic Waves. J. Hydrol. 2013, 503, 22–28. [Google Scholar] [CrossRef]
- Medici, G.; Engdahl, N.B.; Langman, J.B. A Basin-Scale Groundwater Flow Model of the Columbia Plateau Regional Aquifer System in the Palouse (USA): Insights for Aquifer Vulnerability Assessment. Int. J. Environ. Res. 2021, 15, 299–312. [Google Scholar] [CrossRef]
- Duckett, K.A.; Langman, J.B.; Bush, J.H.; Brooks, E.S.; Dunlap, P.; Welker, J.M. Isotopic Discrimination of Aquifer Recharge Sources, Subsystem Connectivity and Flow Patterns in the South Fork Palouse River Basin, Idaho and Washington, USA. Hydrology 2019, 6, 15. [Google Scholar] [CrossRef] [Green Version]
- Larson, K.R.; Keller, C.K.; Larson, P.B.; Allen-King, R.M. Water Resource Implications of 18O and 2H Distributions in a Basalt Aquifer System. Ground Water 2000, 38, 947–953. [Google Scholar] [CrossRef]
- Brown, K.B.; McIntosh, J.C.; Baker, V.R.; Gosch, D. Isotopically-Depleted Late Pleistocene Groundwater in Columbia River Basalt Aquifers: Evidence for Recharge of Glacial Lake Missoula Floodwaters? Geophys. Res. Lett. 2010, 37, L21402. [Google Scholar] [CrossRef]
- Bush, J.H.; Dunlap, P. Geologic Interpretations of Wells and Important Rock Outcrops in the Moscow-Pullman Basin and Vicinity, Idaho and Washington; Technical Report; Idaho Geological Survey: Moscow, ID, USA, 2018; p. 1993.
- Bush, J.H.; Dunlap, P. Structure Contours on the Top of the Grande Ronde Basalt in the Moscow-Pullman Basin and Vicinity, Idaho and Washington; Technical Report; Idaho Geological Survey: Moscow, ID, USA, 2018; p. 1.
- Bush, J.H.; Dunlap, P.; Reidel, S.P. Miocene Evolution of the Moscow-Pullman Basin, Idaho and Washington; Technical Report; Idaho Geological Survey: Moscow, ID, USA, 2018; p. 44.
- Duckett, K.A.; Langman, J.B.; Bush, J.H.; Brooks, E.S.; Dunlap, P.; Stanley, J.R. Noble Gases, Dead Carbon, and Reinterpretation of Groundwater Ages and Travel Time in Local Aquifers of the Columbia River Basalt Group. J. Hydrol. 2020, 581, 124400. [Google Scholar] [CrossRef]
- Scheliga, B.; Tetzlaff, D.; Nuetzmann, G.; Soulsby, C. Groundwater Isoscapes in a Montane Headwater Catchment Show Dominance of Well-Mixed Storage. Hydrol. Process. 2017, 31, 3504–3519. [Google Scholar] [CrossRef]
- Koeniger, P.; Gaj, M.; Beyer, M.; Himmelsbach, T. Review on Soil Water Isotope-Based Groundwater Recharge Estimations. Hydrol. Process. 2016, 30, 2817–2834. [Google Scholar] [CrossRef]
- Barnett, T.P.; Adam, J.C.; Lettenmaier, D.P. Potential Impacts of a Warming Climate on Water Availability in Snow-Dominated Regions. Nature 2005, 438, 303–309. [Google Scholar] [CrossRef]
- Carroll, R.W.H.; Deems, J.S.; Niswonger, R.; Schumer, R.; Williams, K.H. The Importance of Interflow to Groundwater Recharge in a Snowmelt-Dominated Headwater Basin. Geophys. Res. Lett. 2019, 46, 5899–5908. [Google Scholar] [CrossRef] [Green Version]
- Gat, J.R. Oxygen and Hydrogen Isotopes in the Hydrologic Cycle. Annu. Rev. Earth Planet. Sci. 1996, 24, 225–262. [Google Scholar] [CrossRef] [Green Version]
- Birkel, C.; Soulsby, C. Advancing Tracer-Aided Rainfall–Runoff Modelling: A Review of Progress, Problems and Unrealised Potential. Hydrol. Process. 2015, 29, 5227–5240. [Google Scholar] [CrossRef]
- Beria, H.; Larsen, J.R.; Ceperley, N.C.; Michelon, A.; Vennemann, T.; Schaefli, B. Understanding Snow Hydrological Processes through the Lens of Stable Water Isotopes. Wiley Interdiscip. Rev. Water 2018, 5, e1311. [Google Scholar] [CrossRef] [Green Version]
- Penna, D.; Ahmad, M.; Birks, S.J.; Bouchaou, L.; Brenčič, M.; Butt, S.; Holko, L.; Jeelani, G.; Martínez, D.E.; Melikadze, G.; et al. A New Method of Snowmelt Sampling for Water Stable Isotopes. Hydrol. Process. 2014, 28, 5637–5644. [Google Scholar] [CrossRef]
- Ala-aho, P.; Tetzlaff, D.; McNamara, J.P.; Laudon, H.; Kormos, P.; Soulsby, C. Modeling the Isotopic Evolution of Snowpack and Snowmelt: Testing a Spatially Distributed Parsimonious Approach. Water Resour. Res. 2017, 53, 5813–5830. [Google Scholar] [CrossRef]
- Earman, S.; Campbell, A.R.; Phillips, F.M.; Newman, B.D. Isotopic Exchange between Snow and Atmospheric Water Vapor: Estimation of the Snowmelt Component of Groundwater Recharge in the Southwestern United States. J. Geophys. Res. Atmos. 2006, 111. [Google Scholar] [CrossRef]
- Moser, H.; Stichler, W. Deuterium and Oxygen-18 Contents as an Index of the Properties of Snow Covers. Int. Assoc. Hydrol. Sci. 1974, 114, 122–135. [Google Scholar]
- Zongxing, L.; Qi, F.; Wei, L.; Tingting, W.; Xiaoyan, G.; Zongjie, L.; Yan, G.; Yanhui, P.; Rui, G.; Bing, J.; et al. The Stable Isotope Evolution in Shiyi Glacier System during the Ablation Period in the North of Tibetan Plateau, China. Quat. Int. 2015, 380, 262–271. [Google Scholar] [CrossRef]
- Winograd, I.J.; Riggs, A.C.; Coplen, T.B. The Relative Contributions of Summer and Cool-Season Precipitation to Groundwater Recharge, Spring Mountains, Nevada, USA. Hydrogeol. J. 1998, 6, 77–93. [Google Scholar] [CrossRef]
- Jasechko, S.; Perrone, D.; Befus, K.M.; Bayani Cardenas, M.; Ferguson, G.; Gleeson, T.; Luijendijk, E.; McDonnell, J.J.; Taylor, R.G.; Wada, Y.; et al. Global Aquifers Dominated by Fossil Groundwaters but Wells Vulnerable to Modern Contamination. Nat. Geosci. 2017, 10, 425–429. [Google Scholar] [CrossRef] [Green Version]
- Sophocleous, M. Interactions between Groundwater and Surface Water: The State of the Science. Hydrogeol. J. 2002, 10, 52–67. [Google Scholar] [CrossRef]
- Bush, J.H.; Garwood, D.L.; Dunlap, P. Geology and geologic history of the Moscow-Pullman basin, Idaho and Washington, from late Grande Ronde to late Saddle Mountains time. In Exploring the Geology of the Inland Northwest; Lewis, R.S., Schmidt, K.L., Eds.; Geological Society of America Field Guide; Geological Society of America: Boulder, CO, USA, 2016; pp. 151–174. ISBN 978-0-8137-0041-0. [Google Scholar]
- Ryu, J.H.; Contor, B.; Johnson, G.; Allen, R.; Tracy, J. System Dynamics to Sustainable Water Resources Management in the Eastern Snake River Plain Aquifer under Water Supply Uncertainty. JAWRA J. Am. Water Resour. Assoc. 2012, 48, 1204–1220. [Google Scholar] [CrossRef]
- Royer, P.D.; Tonkin, M.; Hammond, T. Conjunctive Water Use in Confined Basalt Aquifers: An Evaluation Using Geochemistry, a Numerical Model, and Historical Water Level. JAWRA J. Am. Water Resour. Assoc. 2014, 50, 963–976. [Google Scholar] [CrossRef]
- Niraula, R.; Meixner, T.; Ajami, H.; Rodell, M.; Gochis, D.; Castro, C.L. Comparing Potential Recharge Estimates from Three Land Surface Models across the Western US. J. Hydrol. 2017, 545, 410–423. [Google Scholar] [CrossRef] [PubMed] [Green Version]
- Alley, W.M.; Clark, B.R.; Ely, D.M.; Faunt, C.C. Groundwater Development Stress: Global-Scale Indices Compared to Regional Modeling. Groundwater 2018, 56, 266–275. [Google Scholar] [CrossRef] [PubMed]
- Ackerman, D.J. Transmissivity of the Snake River Plain Aquifer at the Idaho National Engineering Laboratory, Idaho; U.S. Geological Survey: Reston, VA, USA, 1991; Volume 39.
- Hernandez, H.P. Observations of Recharge to the Wanapum Aquifer System in the Moscow Area, Latah County, Idaho. Master’s Thesis, University of Idaho, Moscow, ID, USA, 2007. [Google Scholar]
- Dijksma, R.; Brooks, E.S.; Boll, J. Groundwater Recharge in Pleistocene Sediments Overlying Basalt Aquifers in the Palouse Basin, USA: Modeling of Distributed Recharge Potential and Identification of Water Pathways. Hydrogeol. J. 2011, 19, 489–500. [Google Scholar] [CrossRef] [Green Version]
- Bush, J.H.; Dunlap, P.; Reidel, S.P.; Kobayashi, D. Geologic Cross Sections across the Moscow-Pullman Basin, Idaho and Washington; Technical Report; Idaho Geological Survey: Reston, VA, USA, 2018; p. 3.
- Candel, J.; Brooks, E.; Sánchez-Murillo, R.; Grader, G.; Dijksma, R. Identifying Groundwater Recharge Connections in the Moscow (USA) Sub-Basin Using Isotopic Tracers and a Soil Moisture Routing Model. Hydrogeol. J. 2016, 24, 1739–1751. [Google Scholar] [CrossRef] [Green Version]
- Brooks, E.S.; Boll, J.; McDaniel, P.A. Distributed and Integrated Response of a Geographic Information System-Based Hydrologic Model in the Eastern Palouse Region, Idaho. Hydrol. Process. 2007, 21, 110–122. [Google Scholar] [CrossRef]
- Frankenberger, J.R.; Brooks, E.S.; Walter, M.T.; Walter, M.F.; Steenhuis, T.S. A GIS-Based Variable Source Area Hydrology Model. Hydrol. Process. 1999, 13, 805–822. [Google Scholar] [CrossRef]
- Moravec, B.G.; Keller, C.K.; Smith, J.L.; Allen-King, R.M.; Goodwin, A.J.; Fairley, J.P.; Larson, P.B. Oxygen-18 Dynamics in Precipitation and Streamflow in a Semi-Arid Agricultural Watershed, Eastern Washington, USA. Hydrol. Process. 2010, 24, 446–460. [Google Scholar] [CrossRef]
- Sánchez-Murillo, R.; Brooks, E.S.; Elliot, W.J.; Boll, J. Isotope Hydrology and Baseflow Geochemistry in Natural and Human-Altered Watersheds in the Inland Pacific Northwest, USA. Isotopes Environ. Health Stud. 2015, 51, 231–254. [Google Scholar] [CrossRef] [Green Version]
- Finklin, A.I. Climate of Priest River Experimental Forest, Northern Idaho; General Technical Report INT-159 Ogden UT; U.S. Department of Agriculture, Forest Service, Intermountain Forest and Range Experimental Station: Ogden, UT, USA, 1983; Volume 159, 53p. [CrossRef] [Green Version]
- Western Regional Climate Center. Cooperative Climatological Data Summaries, NOAA Cooperative Stations, Pullman Experimental Station—Climate Summary. Available online: https://wrcc.dri.edu/cgi-bin/cliMAIN.pl?id6152 (accessed on 9 January 2019).
- Northwest River Forecast Center. Temperature and Precipitation Monthly Means. Available online: https://www.nwrfc.noaa.gov/snow/snowplot.cgi?MSCI1 (accessed on 19 April 2021).
- Clark, I.D.; Fritz, P.; Fritz, P. Environmental Isotopes in Hydrogeology; CRC Press: Boca Raton, FL, USA, 2013; ISBN 978-0-429-06957-4. [Google Scholar]
- Kendall, C.; Caldwell, E.A. Chapter 2—Fundamentals of Isotope Geochemistry. In Isotope Tracers in Catchment Hydrology; Kendall, C., McDonnell, J.J., Eds.; Elsevier: Amsterdam, The Netherlands, 1998; pp. 51–86. ISBN 978-0-444-81546-0. [Google Scholar]
- Ingraham, N.L. Chapter 3—Isotopic Variations in Precipitation. In Isotope Tracers in Catchment Hydrology; Kendall, C., McDonnell, J.J., Eds.; Elsevier: Amsterdam, The Netherlands, 1998; pp. 87–118. ISBN 978-0-444-81546-0. [Google Scholar]
- Bowen, G.J.; Putman, A.; Brooks, J.R.; Bowling, D.R.; Oerter, E.J.; Good, S.P. Inferring the Source of Evaporated Waters Using Stable H and O Isotopes. Oecologia 2018, 187, 1025–1039. [Google Scholar] [CrossRef] [PubMed]
- Bowen, G.J. Spatial Analysis of the Intra-Annual Variation of Precipitation Isotope Ratios and Its Climatological Corollaries. J. Geophys. Res. Atmos. 2008, 113. [Google Scholar] [CrossRef]
- Bowen, G.J. Statistical and Geostatistical Mapping of Precipitation Water Isotope Ratios. In Isoscapes: Understanding Movement, Pattern, and Process on Earth Through Isotope Mapping; West, J.B., Bowen, G.J., Dawson, T.E., Tu, K.P., Eds.; Springer: Dordrecht, The Netherlands, 2010; pp. 139–160. ISBN 978-90-481-3354-3. [Google Scholar]
- Ellis, A.W.; Barton, N.P. Characterizing the North Pacific Jet Stream for Understanding Historical Variability in Western United States Winter Precipitation. Phys. Geogr. 2012, 33, 105–128. [Google Scholar] [CrossRef]
- Zhang, W.; Villarini, G. Uncovering the Role of the East Asian Jet Stream and Heterogeneities in Atmospheric Rivers Affecting the Western United States. Proc. Natl. Acad. Sci. USA 2018, 115, 891–896. [Google Scholar] [CrossRef] [PubMed] [Green Version]
- Welker, J.M. Isotopic (δ18O) Characteristics of Weekly Precipitation Collected across the USA: An Initial Analysis with Application to Water Source Studies. Hydrol. Process. 2000, 14, 1449–1464. [Google Scholar] [CrossRef]
- Froehlich, K.; Gibson, J.J.; Aggarwal, P.K. Deuterium Excess in Precipitation and Its Climatological Significance; International Atomic Energy Agency (IAEA): Wienna, Austria, 2002; pp. 54–66. [Google Scholar]
- Dansgaard, W. Stable Isotopes in Precipitation. Tellus 1964, 16, 436–468. [Google Scholar] [CrossRef]
- Kendall, C.; Coplen, T.B. Distribution of Oxygen-18 and Deuterium in River Waters across the United States. Hydrol. Process. 2001, 15, 1363–1393. [Google Scholar] [CrossRef]
- Lyon, S.W.; Ploum, S.W.; van der Velde, Y.; Rocher-Ros, G.; Mörth, C.-M.; Giesler, R. Lessons Learned from Monitoring the Stable Water Isotopic Variability in Precipitation and Streamflow across a Snow-Dominated Subarctic Catchment. Arct. Antarct. Alp. Res. 2018, 50, e1454778. [Google Scholar] [CrossRef] [Green Version]
- Welker, J.M. ENSO Effects on Δ18O, Δ2H and d-Excess Values in Precipitation across the U.S. Using a High-Density, Long-Term Network (USNIP): Precipitation Isotopes across the USA. Rapid Commun. Mass Spectrom. 2012, 26, 1893–1898. [Google Scholar] [CrossRef]
- Unnikrishna, P.V.; McDonnell, J.J.; Kendall, C. Isotope Variations in a Sierra Nevada Snowpack and Their Relation to Meltwater. J. Hydrol. 2002, 260, 38–57. [Google Scholar] [CrossRef]


| Well No. 1 | LS Elev. 2 (m) | TOS Elev. 2 (m) | BOS Elev. 2 (m) | TD Elev. 2 (m) | Geology of the Screen Interval(s) (Formation Sequences) |
|---|---|---|---|---|---|
| 8 | 841.5 | 655.0 | 628.0 | 628.0 | Basement rock: fractured/weathered granite |
| 9 | 832.0 | 794.0 | 758.0 | 755.0 | Sediments of Bovill 3: sand and clay |
| 11 | 848.5 | 828.5 | 824.0 | 821.0 | Basement rock: fractured/weathered granite |
| 14 | 823.5 | 760.0 4 | 750.0 4 | 721.0 | Basement rock: fractured/weathered granite 5 |
| 17 | 829.0 | 791.5 | 785.0 | 785.0 | Sediments of Bovill: sand and gravel |
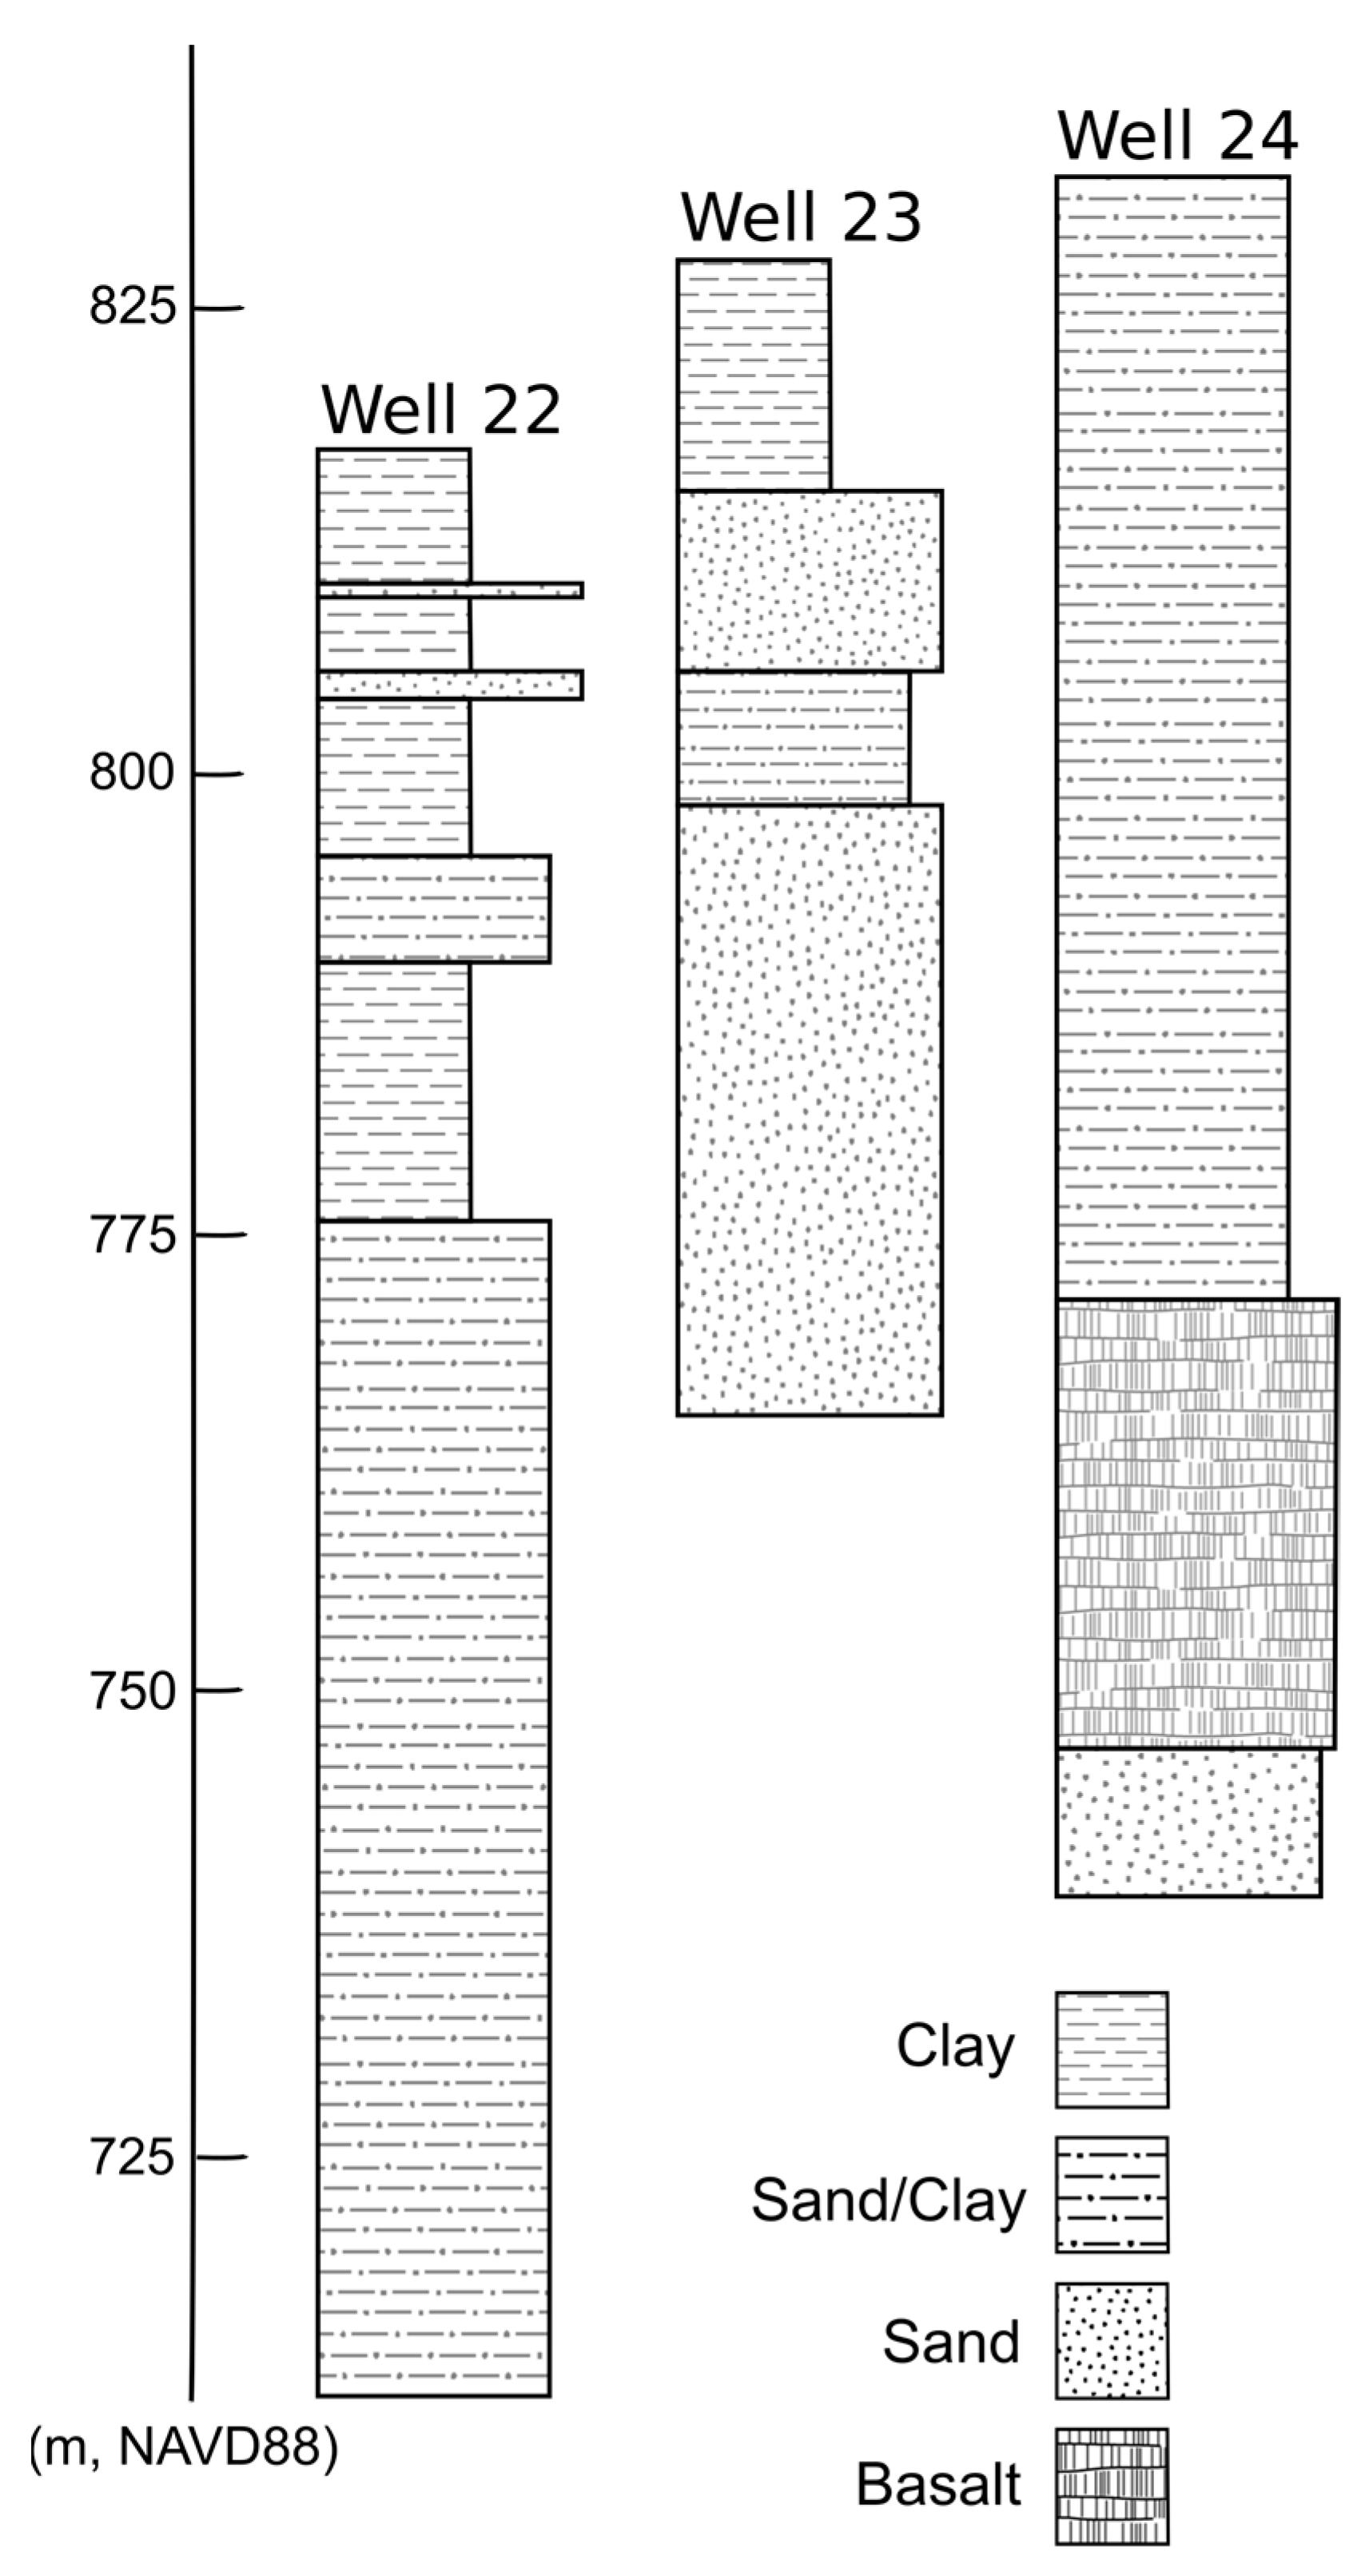
| 22 | 817.5 | 775.0 | 712.0 | 712.0 | Vantage member 6: sand and clay |
| 23 | 827.5 | 805.0 | 798.0 | 765.0 | Sediments of Bovill: sand and clay |
| 24 | 832.0 | 780.0 | 771.0 | 739.0 | Vantage member: sand with fingers of Lolo basalt |
| 26 | 817.5 | 800.0 | 792.0 | 771.0 | Vantage member: clay and sand with fingers of Lolo basalt |
| 27 | 824.0 | 771.0 | 760.0 | 757.0 | Sediments of Bovill: clay, sand, weathered granite (basement) |
| 28 | 832.0 | 763.5 | 759.5 | 759.5 | Vantage member: sand and clay |
| 29 | 839.0 | 755.0 | 751.0 | 746.0 | Basement rock: fractured/weathered granite |
| 35 | 950.0 | 880.0 4 | 856.0 | 856.5 | Basement rock: fractured/weathered granite 7 |
| Group | Well Number | No. of Samples | Median (‰) | Mean Rank | Bottom of Screen Elev. (NAVD 88) | Screen Matrix | Group Median (‰) | Group Mean Rank |
|---|---|---|---|---|---|---|---|---|
| PCA, 1st component loading: | 0.78 | 0.78 | 0.48 | 48% of variance explained | ||||
| Depleted δ18O source(s) | 23 | 38 | −16.48 | 57 | 798 | sand | −15.85 | 166 |
| 8 | 60 | −15.93 | 146 | 628 | granite | |||
| 22 | 57 | −15.84 | 157 | 712 | mixed | |||
| 9 | 52 | −15.85 | 173 | 758 | sand | |||
| 29 | 58 | −15.66 | 258 | 751 | granite | |||
| Mixed δ18O source(s) | 26 | 44 | −15.47 | 373 | 792 | clay | −15.42 | 393 |
| 14 | 50 | −15.48 | 374 | 750 | clay | |||
| 28 | 59 | −15.43 | 384 | 760 | sand | |||
| 17 | 14 | −15.40 | 415 | 785 | clay | |||
| 11 | 58 | −15.37 | 427 | 824 | granite | |||
| Enriched δ18O source(s) | 24 | 58 | −15.26 | 467 | 771 | sand | −15.17 | 526 |
| 35 | 56 | −15.14 | 556 | 856 | granite | |||
| 27 | 47 | −15.06 | 562 | 760 | granite | |||
Publisher’s Note: MDPI stays neutral with regard to jurisdictional claims in published maps and institutional affiliations. |
© 2021 by the authors. Licensee MDPI, Basel, Switzerland. This article is an open access article distributed under the terms and conditions of the Creative Commons Attribution (CC BY) license (https://creativecommons.org/licenses/by/4.0/).
Share and Cite
Behrens, D.; Langman, J.B.; Brooks, E.S.; Boll, J.; Waynant, K.; Moberly, J.G.; Dodd, J.K.; Dodd, J.W. Tracing δ18O and δ2H in Source Waters and Recharge Pathways of a Fractured-Basalt and Interbedded-Sediment Aquifer, Columbia River Flood Basalt Province. Geosciences 2021, 11, 400. https://0-doi-org.brum.beds.ac.uk/10.3390/geosciences11100400
Behrens D, Langman JB, Brooks ES, Boll J, Waynant K, Moberly JG, Dodd JK, Dodd JW. Tracing δ18O and δ2H in Source Waters and Recharge Pathways of a Fractured-Basalt and Interbedded-Sediment Aquifer, Columbia River Flood Basalt Province. Geosciences. 2021; 11(10):400. https://0-doi-org.brum.beds.ac.uk/10.3390/geosciences11100400
Chicago/Turabian StyleBehrens, David, Jeff B. Langman, Erin S. Brooks, Jan Boll, Kristopher Waynant, James G. Moberly, Jennifer K. Dodd, and John W. Dodd. 2021. "Tracing δ18O and δ2H in Source Waters and Recharge Pathways of a Fractured-Basalt and Interbedded-Sediment Aquifer, Columbia River Flood Basalt Province" Geosciences 11, no. 10: 400. https://0-doi-org.brum.beds.ac.uk/10.3390/geosciences11100400