Article

Evaluation of Nine Operational Models in Forecasting Different Types of Synoptic Dust Events in the Middle East

1
Atmospheric Science & Meteorological Research Center (ASMERC), Tehran 14977-16385, Iran
2
Institute for Environmental Research and Sustainable Development, National Observatory of Athens, Palaia Penteli, 15236 Athens, Greece
3
Environmental Chemical Processes Laboratory, Department of Chemistry, University of Crete, 70013 Heraklion, Greece
4
Department of Desert and Arid Zones Management, Ferdowsi University of Mashhad, Mashhad 91779-48974, Iran
*
Author to whom correspondence should be addressed.
Submission received: 24 August 2021 / Revised: 1 November 2021 / Accepted: 5 November 2021 / Published: 7 November 2021
(This article belongs to the Collection Early Career Scientists’ (ECS) Contributions to Geosciences)

Abstract

:
This study investigates four types of synoptic dust events in the Middle East region, including cyclonic, pre-frontal, post-frontal and Shamal dust storms. For each of these types, three intense and pervasive dust events are analyzed from a synoptic meteorological and numerical simulation perspective. The performance of 9 operational dust models in forecasting these dust events in the Middle East is qualitatively and quantitatively evaluated against Terra-MODIS observations and AERONET measurements during the dust events. The comparison of model AOD outputs with Terra-MODIS retrievals reveals that despite the significant discrepancies, all models have a relatively acceptable performance in forecasting the AOD patterns in the Middle East. The models enable to represent the high AODs along the dust plumes, although they underestimate them, especially for cyclonic dust storms. In general, the outputs of the NASA-GEOS and DREAM8-MACC models present greater similarity with the satellite and AERONET observations in most of the cases, also exhibiting the highest correlation coefficient, although it is difficult to introduce a single model as the best for all cases. Model AOD predictions over the AERONET stations showed that DREAM8-MACC exhibited the highest R2 of 0.78, followed by NASA_GEOS model (R2 = 0.74), which both initially use MODIS data assimilation. Although the outputs of all models correspond to valid time more than 24 h after the initial time, the effect of data assimilation on increasing the accuracy is important. The different dust emission schemes, soil and vegetation mapping, initial and boundary meteorological conditions and spatial resolution between the models, are the main factors influencing the differences in forecasting the dust AODs in the Middle East.

1. Introduction

Dust storms are considered environmental hazards due to their high impact on climate change, widespread environmental degradation, financial and human losses [1,2,3]. The impacts of dust aerosols on radiative forcing, atmospheric circulation and climate, especially in the Middle East, have been well recognized in previous studies (e.g., [4,5,6]). Air pollution arising from dust storms poses an extra threat to public health with serious respiratory and heart diseases [7,8,9]. The relationship between mortality or morbidity and the occurrence of dust storms has been extensively studied even in areas outside the dust belt such as Korea [10], Taiwan [11] and Greece [12] among many others [13]. Decreased horizontal visibility due to massive dust storms, causes traffic accidents and increases the death rate every year [14,15,16,17]. Furthermore, land degradation by wind erosion affects many parts of the world [18,19,20,21,22], and therefore, the occurrence of dust storms has destructive effects on crop growth, livestock production, agricultural infrastructure and ecosystem health [23,24].
According to global data from satellite observations, ground stations and model simulations, the amount of dust that enters the atmosphere reaches several hundred to several thousand tons each year [25]. For example, Zender et al. [26] calculated the annual average of global dust emissions in the 1990s to be 1490 ± 160 (Tg yr−1), while Ginoux et al. [27] estimated the total annual dust emissions between 1604 and 1960 Tg yr−1 in a 5-year simulation study. Huneeus et al. [28], based on global model ensemble simulations, estimated the global dust emissions to about 500–4000 (Tg yr−1), of which 400–2200 (Tg yr−1) is related to North Africa and 26–526 (Tg yr−1) is emitted from the Middle East. Many studies have been conducted to identify dust sources in the Middle East, mainly across the Arabian Peninsula, Syria, Egypt, Iraq and Iran [29,30,31,32]. Moridnejad et al. [33] used MODIS images of 70 dust storms that occurred between 2001 and 2012 to develop a new map of the main dust sources in the Middle East. Their results showed that 247 different points were involved in the dust production in the Middle East; among them, Iraq and Syria have the most dust sources in the region.
Synoptic analysis of meteorological patterns and weather clustering techniques during dust storms in the Middle East has been studied by many researchers [34,35,36,37]. Alamodi [38] studied a severe dust storm in Saudi Arabia on 13 May 2005. He reported that the low-pressure movement from Europe to the southeast, over Turkey, along with Sudan low-pressure shift to the northeast toward central Saudi Arabia, caused strong pressure and temperature gradients and high-speed winds triggering a severe dust storm over Saudi Arabia. Hamidi et al. [39] examined 60 dust storms over a period of 9 years (2003 to 2011) in the Middle East and 12 of them were analyzed from a synoptic perspective. They concluded that dust storms in the Middle East can be divided into two main categories i.e., Shamal and frontal dust storms [39]. Other studies have divided dust activity in the Middle East into three main types (i) Shamal, (ii) frontal and (iii) convective dust storms [40,41,42,43], while many of them have focused on Shamal dust storms (e.g., [44,45,46]). On the other hand, one of the main factors for the formation of dust storms, especially in winter and spring, is the presence of atmospheric fronts. Strong winds accompanied by cold or warm fronts and low humidity levels facilitate intense dust emissions. Hamzeh et al. [47] investigated six frontal dust storms in the Middle East. They concluded that the presence of a deep trough over Turkey, Syria and northern Iraq plays a key role in the formation and transport of frontal dust. Karami et al. [48] studied the frontal dust storm on 19 January 2018 over Syria, Iraq and Iran. In that dust event, the presence of a cold front over the region caused high dust emissions from the deserts in Iraq and Syria and transport of dust over long distances. On the other hand, some dust events are due to formation of a dynamic low-pressure system and are not necessarily associated with atmospheric fronts (e.g., [35,43,49]). Al-Jumaily and Ibrahim [50] analyzed two severe dust storms on 22 February 2010 and 10 December 2011 in Iraq, indicating the presence of a deep low-pressure system that was formed in the area during these dust storms. This type of synoptic dust storm is mentioned here as cyclonic dust. More recently, Mohammadpour et al. [36,37] examined the synoptic meteorological conditions and the dominant weather clusters that are associated with dust accumulation over specific parts of Iran, with more emphasis on the western parts that are affected by dust storms of various types from the Iraqi plains.
Due to the importance of forecasting dust storms in order to mitigate their negative impacts, many studies have been conducted to evaluate the performance of numerical dust forecasting models in the Middle East [47,51,52,53]. Beegum et al. [34] investigated the predictability of seven dust events in the Arabian Peninsula using the CHIMERE model coupled with the WRF weather forecast model. Five of those dust events were associated with synoptic-scale meteorological dynamics, such as frontal systems and summer Shamal winds, while two of them were meso-scale convective storms. Kontos et al. [54] parameterized the dust emissions in the Middle East, while Karami et al. [55] compared the outputs of DREAM-MACC, CAMS and WRF-Chem models during two dust storms originated from the desiccated Aral Sea and Hamoon lakes. That study showed that the CAMS model represented better the AOD values, likely related to MODIS data assimilation, although all models underestimated the high AODs compared to Terra-MODIS retrievals, especially near the dust source. There are some difficulties in calculating AOD by dust forecasting models, with the uncertainties mostly related to the complex refractive index (scattering and absorbing properties of dust), as well as to the size distribution (relative partitioning of the fine and coarse modes) [56]. So, for satisfactory predictions of the dust-AOD, scattering, absorption processes and particle size distribution should be accurately parameterized in the model, as they have different responses to AOD values. Ukhov et al. [56] revealed this challenging issue and the effect of fine particles in dust AOD calculations for the WRF-Chem model. Huneeus et al. [28] compared the outputs of 15 global aerosol models in the AeroCom project. The compared outputs included different parameters such as AOD and dust deposition. Since AOD is highly dependent on the particle load, refractive index and size distribution, their results were so different in various areas, since some models overestimated the AOD values in some areas and underestimated them in others. Flaounas et al. [57] showed that the model AOD outputs were more realistic when dust emissions were over-estimated and more accurate dust concentrations were obtained when the AOD values were less than the observational ones.
In this study, the performance of nine operational dust forecasting models included in the WMO Sand and Dust Storm Warning Advisory and Assessment System (WMO SDS-WAS; https://sds-was.aemet.es/, accessed on 12–14 April 2021) is examined over the Middle East during several dust events (3 in each case, 12 in total) of different types (mechanisms) of dust outbreaks such as (i) cyclonic dust, (ii) post-frontal dust, (iii) pre-frontal dust and (iv) Shamal dust. The performance of the model forecasting is examined against Terra-MODIS AOD observations and via statistical indicators and Taylor diagrams. Furthermore, ground measurements of AODs at AERONET stations over the region affected by these dust storms were also used for the evaluation process. Selected dust events of each type are also analyzed from the meteorological perspective in order to reveal the different mechanisms that triggered the dust emission and transport. This work provides a comprehensive evaluation of the dust forecasts over the Middle East, aiming to reveal the challenges and biases of each model. An important aspect of this study is the model evaluation during four different types of dust events in the Middle East, aiming to identify which model is more reliable for a certain dust type.

2. Study Area, Materials and Methods

The Middle East includes vast deserts and is strongly affected by dust throughout the year. Syrian Desert, Al-Nafud, Al-Dahna, Rub Al-Khali, Dasht-e Kavir and Dasht-e Lut are the most important desert areas in the Middle East. The prevailing wind regime in the Middle East region is north and northwesterly, especially during the summer season, which in local language is referred to as “Shamal wind”. Shamal is a strong low-level northwesterly wind blowing over Iraq, Saudi Arabia and Kuwait, often strong during the day, but decreasing at night. Sometimes, Shamal blows also in winter and is associated with a cold front over the eastern Mediterranean and western parts of the Middle East [47,58], facilitating severe dust storms that may affect many countries [59,60,61]. Abdi Vishkaee et al. [44] analyzed a severe dust storm over Iraq and northwest Iran in 22–23 February 2010 which resulted from a strong winter Shamal after the passage of a cold front.
In general, dust storms are divided into two main categories based on the factors affecting their formation and their spatial extent, namely (i) synoptic and (ii) mesoscale [62]. In the Middle East, one of these effective factors is Shamal wind, which triggers intense dust storms [46,63]. In summer, a low-pressure system develops over northwestern India and Pakistan, extending into Afghanistan, south Iran and the eastern Arabian Peninsula [64], which in conjunction with the high-pressure system over the eastern Mediterranean [36,65], causes a strong pressure gradient and northwesterly winds across the Iraqi plains [66]. Furthermore, in summer, a dominant high-pressure system is usually observed over the central-eastern part of the Mediterranean Basin, which leads to a prevalence of dry conditions over the region [65]. The summer Shamal wind is strengthened by the Zagros Mountains in southwest Iran, via the channeling effect of the northwesterly currents [46]. In winter, the presence of atmospheric fronts causes strong surface winds, which in the absence of sufficient moisture, may cause massive dust emissions. In these cases, a dust storm may occur in front of or behind the frontal system, characterized as pre-frontal or post-frontal dust, respectively [47,67]. Sometimes a dynamic low-pressure center that is not necessarily associated with a front may also cause dust emissions [43,68]. In this case, the presence of high relative vorticity, convergence and upward motions at the surface initiate the dust outbreak [69].
In this study, four types of synoptic dust events in the Middle East (cyclonic, pre-frontal, post-frontal and Shamal dust) are investigated. The first mechanism for the dust emission is due to the presence of a surface low-pressure associated with intense near-surface winds [43,68,69]. In these cases, the rotation of dust particles is observed around the low-pressure closed center, and due to the upward movements in the center of the cyclone, the dust particles are transported to higher altitudes. The main difference from this dust type against Shamal dust storms is that cyclonic dust is driven only by strong winds around a cyclone (mostly thermal) over the desert terrain and not by large-scale pressure gradients that trigger the Shamal wind, which covers a large area in the Middle East. In post-frontal and pre-frontal dust storms, dust is emitted from the surface due to strong winds behind and in front of the frontal areas, respectively, and the dust mass is mainly observed as a strip parallel to the atmospheric fronts [47]. Because of the greater instability in the cold front, dust is usually seen in front or back of the cold front. If the position of the front is such that the dust-producing areas are located behind it, the dust occurs behind the front and if it is in front of it, the dust occurs before the front. The prevailing wind direction in the post-frontal areas is northwesterly and in the pre-frontal areas is south or southwesterly. The Shamal dust storms, as discussed above, mainly occur during the summer season, as a large part of Iraq and Saudi Arabia is under the influence of the strong northwesterly Shamal wind [46,52,63]. This wind is the result of the low-pressure tongue from the Arabian Sea into the northern regions of Iraq, the return branch of which causes the northwesterly winds to blow.
Three cases of intense and pervasive dust events of each type were identified and analyzed from a synoptic perspective, in total 12 dust events, summarized in Table 1. We chose these synoptic dust events with criteria for the different mechanisms (4 types), the spatial extend, focusing on dust events that occurred on a large scale and lasted more than one day, and the availability of model predictions. Furthermore, the model AOD forecasting for these dust events is compared against the MODIS spatial AOD distribution in order to evaluate the performance of each model.
In order to determine the dust-affected areas, true-color images and AOD retrievals from Terra-MODIS observations over the Middle East are examined. Global Forecast Grids (GFS) re-analysis data (https://rda.ucar.edu/datasets/ds084.1/, accessed on 17 April 2021) with 0.5° × 0.5° horizontal resolution are used to prepare synoptic maps of the mean sea level pressure (MSLP), temperature and geopotential heights at 850 and 500 hPa levels during the dust storms. Due to the impact of various factors (dust schemes, initial and boundary conditions, soil characteristics, dynamic processes, spatial resolution) that affect the forecasting and simulations of dust events from numerical models [43,51,53,70], the outputs of 9 operational dust forecasting models included in https://sds-was.aemet.es (accessed on 12–14 April 2021) are examined and inter-compared during the selected dust storms in the Middle East. The AOD outputs of the models related to their forecasting (initial time 24 h before the valid time) were extracted from the archives of their data. The models that are examined in this study are BSC-DREAM8b-V2 [71,72], DREAM8-MACC [25], DREAMABOL [73], EMA-RegCM4 [74], MACC-ECMWF [75], NASA-GEOS [76], NCEP-NGAC [77], NMMB-BSC [78] and NOA-WRF-Chem [79]. The main characteristics and numerical equations of these models (dust schemes, initial, boundary conditions, etc.) are briefly described in Appendix A. To evaluate the performance of these models in forecasting the examined dust storms, the AOD outputs over a selected spatial domain in the Middle East are qualitatively and quantitatively evaluated against the Terra-MODIS satellite data with 1° × 1° spatial resolution (level 3), retrieved by combined Dark Target and Deep Blue algorithms. MODIS AOD550 from Collection 6.1 and level 3 [80] are derived from the Giovanni tool for data access and visualization (https://giovanni.gsfc.nasa.gov, accessed on 15 April 2021). Since the resolution of all model outputs is finer than that of the observational data, the satellite pixels are considered as the basis, and the AOD values are compared pixel by pixel, after rescaling the model outputs. There are 2386 pixels in the study domain, but some of them may not be valid on certain dust events due to cloud contamination. Taylor diagrams, including statistical indicators of Pearson correlation coefficient (r) and standard deviation, are used to evaluate the performance of each model for the different types of dust storms. Furthermore, ground-based AOD data from 3 AERONET stations mostly affected by these dust storms, i.e., Kuwait University (29.32° N, 47.97° E), KAUST-campus in Saudi Arabia (22.305° N, 39.103° E) and Masdar Institute (24.442° N, 54.617° E) in the United Arab Emirates, were used during the dust-event days, collocated in time with satellite and model-forecasting outputs, in order to evaluate the model’s performance.

3. Results and Discussion

The results section is separated into three sub-sections including satellite observations, synoptic analysis of the selected dust storms and evaluation of the numerical model outputs for dust forecasting.

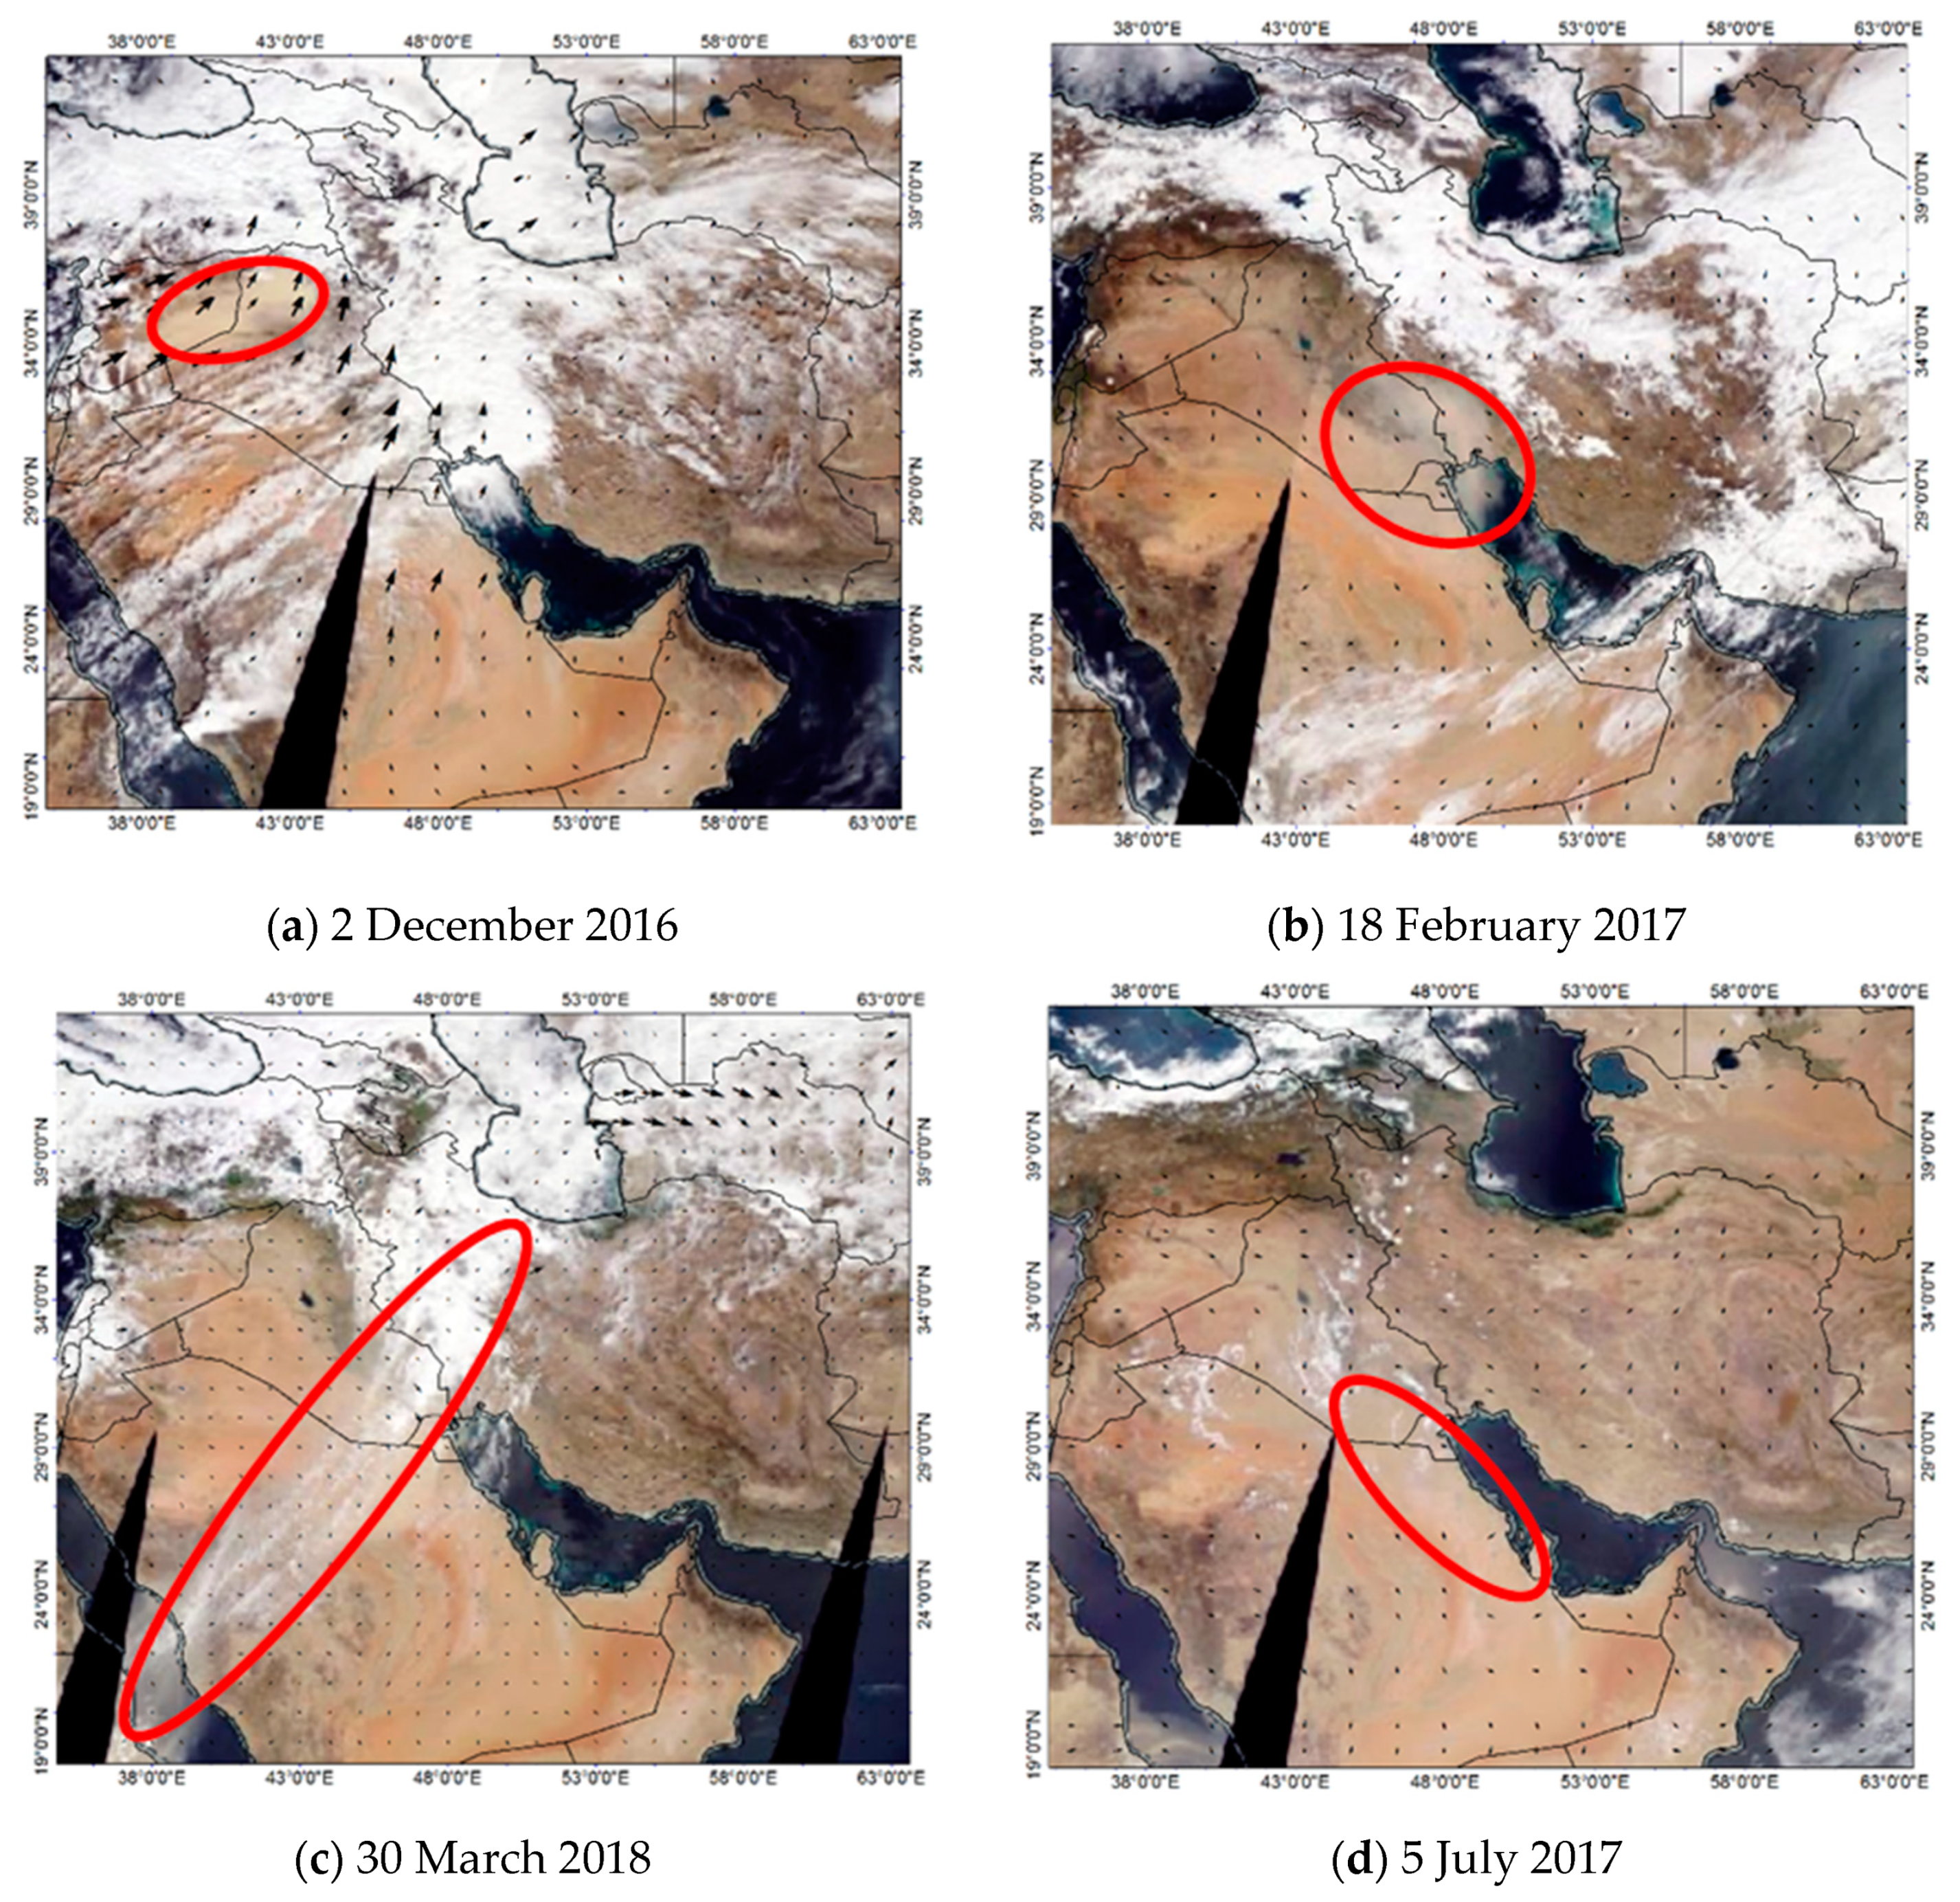
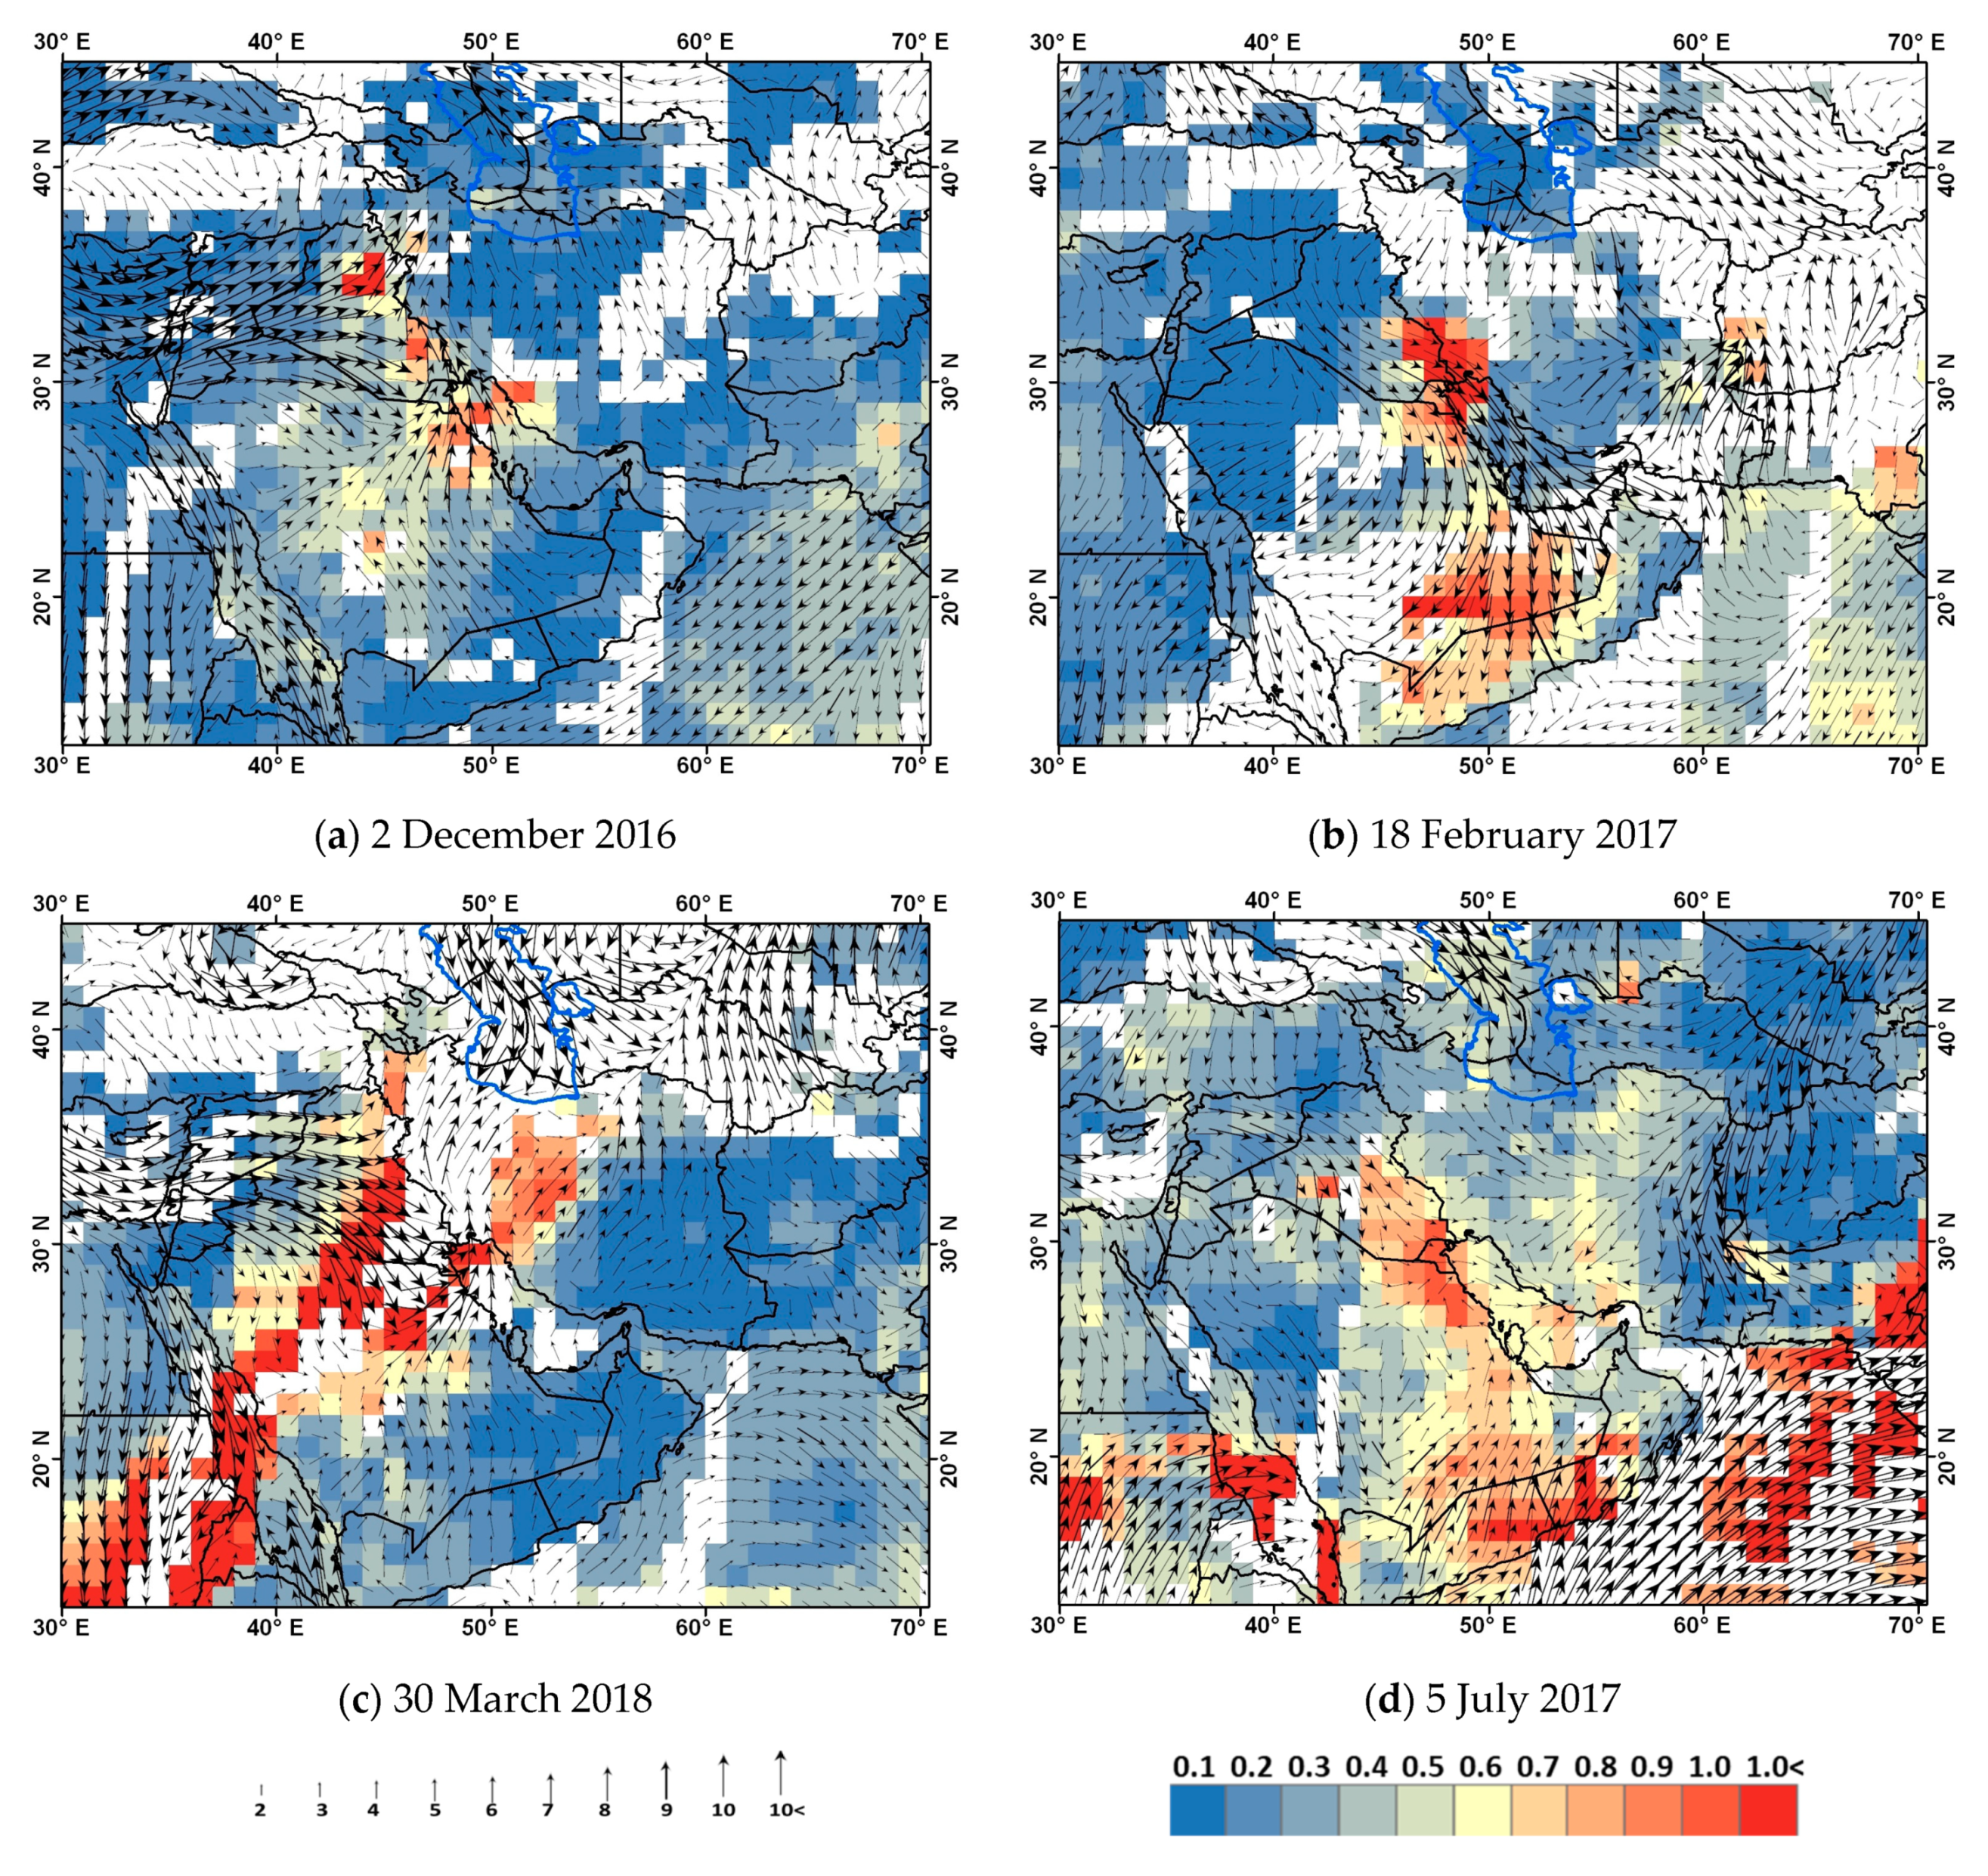
3.1. Satellite Observations

Figure 1 shows the Terra-MODIS true color imagery during selected dust storms of each type, while the rest cases are included in Figure S1 (in the Supplementary Materials). In the first case of a cyclonic dust storm (Figure 1a: 2 December 2016), intense dust plumes existed over the eastern regions of Syria and north Iraq. More or less similar dust-covered areas in north Iraq are observed in the other cyclonic-dust days (Figure S1), while common characteristics of these dust storms are their relative narrow expansion and the oval shape due to strong rotation of wind around a deep low-pressure center [43]. The post-frontal dust storm (Figure 1b) was mainly observed over the mid-south part of the Iraqi plains and affected south Iraq, southwest parts of Iran and northeast Saudi Arabia. In the pre-frontal dust storm of 30 March 2018 (Figure 1c), dust covered a large area from west Arabia to south Iraq and west Iran, lying in front of or below cloud masses that were associated with a frontal system. These dust storms were caused by cold fronts that usually stretched from southeast Turkey and northern Iraq to northeast Saudi Arabia [44]. The Shamal dust storm during 5 July 2017 (Figure 1d), stretched across the Iraqi-plains to southwest Iran and Kuwait, also affecting the eastern part of Saudi Arabia and the northern Persian Gulf. The other Shamal dust storms (Figure S1) affected similar areas in the Middle East and the Arabian Peninsula.
Figure 2 shows the spatial distribution of the Terra-MODIS AODs during four dust events (rest are included in Figure S2), indicating a remarkable spatial heterogeneity of the AOD values and the contribution of various sources in dust emissions, which are mostly detected in the Iraqi plains (Tigris-Euphrates alluvial plain), along the eastern part of the Arabian Peninsula, Rub-Al-Khali and Oman Deserts. The cyclonic dust storm on 2 December 2016 showed a dust hotspot over northern Iraq due to cyclonic conditions that will be analyzed in the following, while the spatial AOD distribution in this case shows increased dust loading over Kuwait and parts of the Persian Gulf and coastal Iran as well (Figure 2a), attributed to other local dust plumes.
On 18 February 2017 (Figure 2b), the maximum AOD is observed in southwest Iran and southern Iraq, associated with a frontal system over this area, which is analyzed in the next section. On this day, increased AOD values were also observed in southern Saudi Arabia, Oman and Yemen.
A characteristic pre-frontal dust storm occurred on 30 March 2018 (Figure 2c), when high AODs were observed from Sudan to west Iran, indicating the presence of a huge and long-expanded frontal dust storm.
The examined Shamal dust storm (Figure 2d) exhibited increased dust AODs along the corridor from the Iraqi plains to the east Saudi Arabia, which is the area affected by the summer Shamal wind [46,63], and over parts of the southern Arabian Peninsula and the south Red Sea.

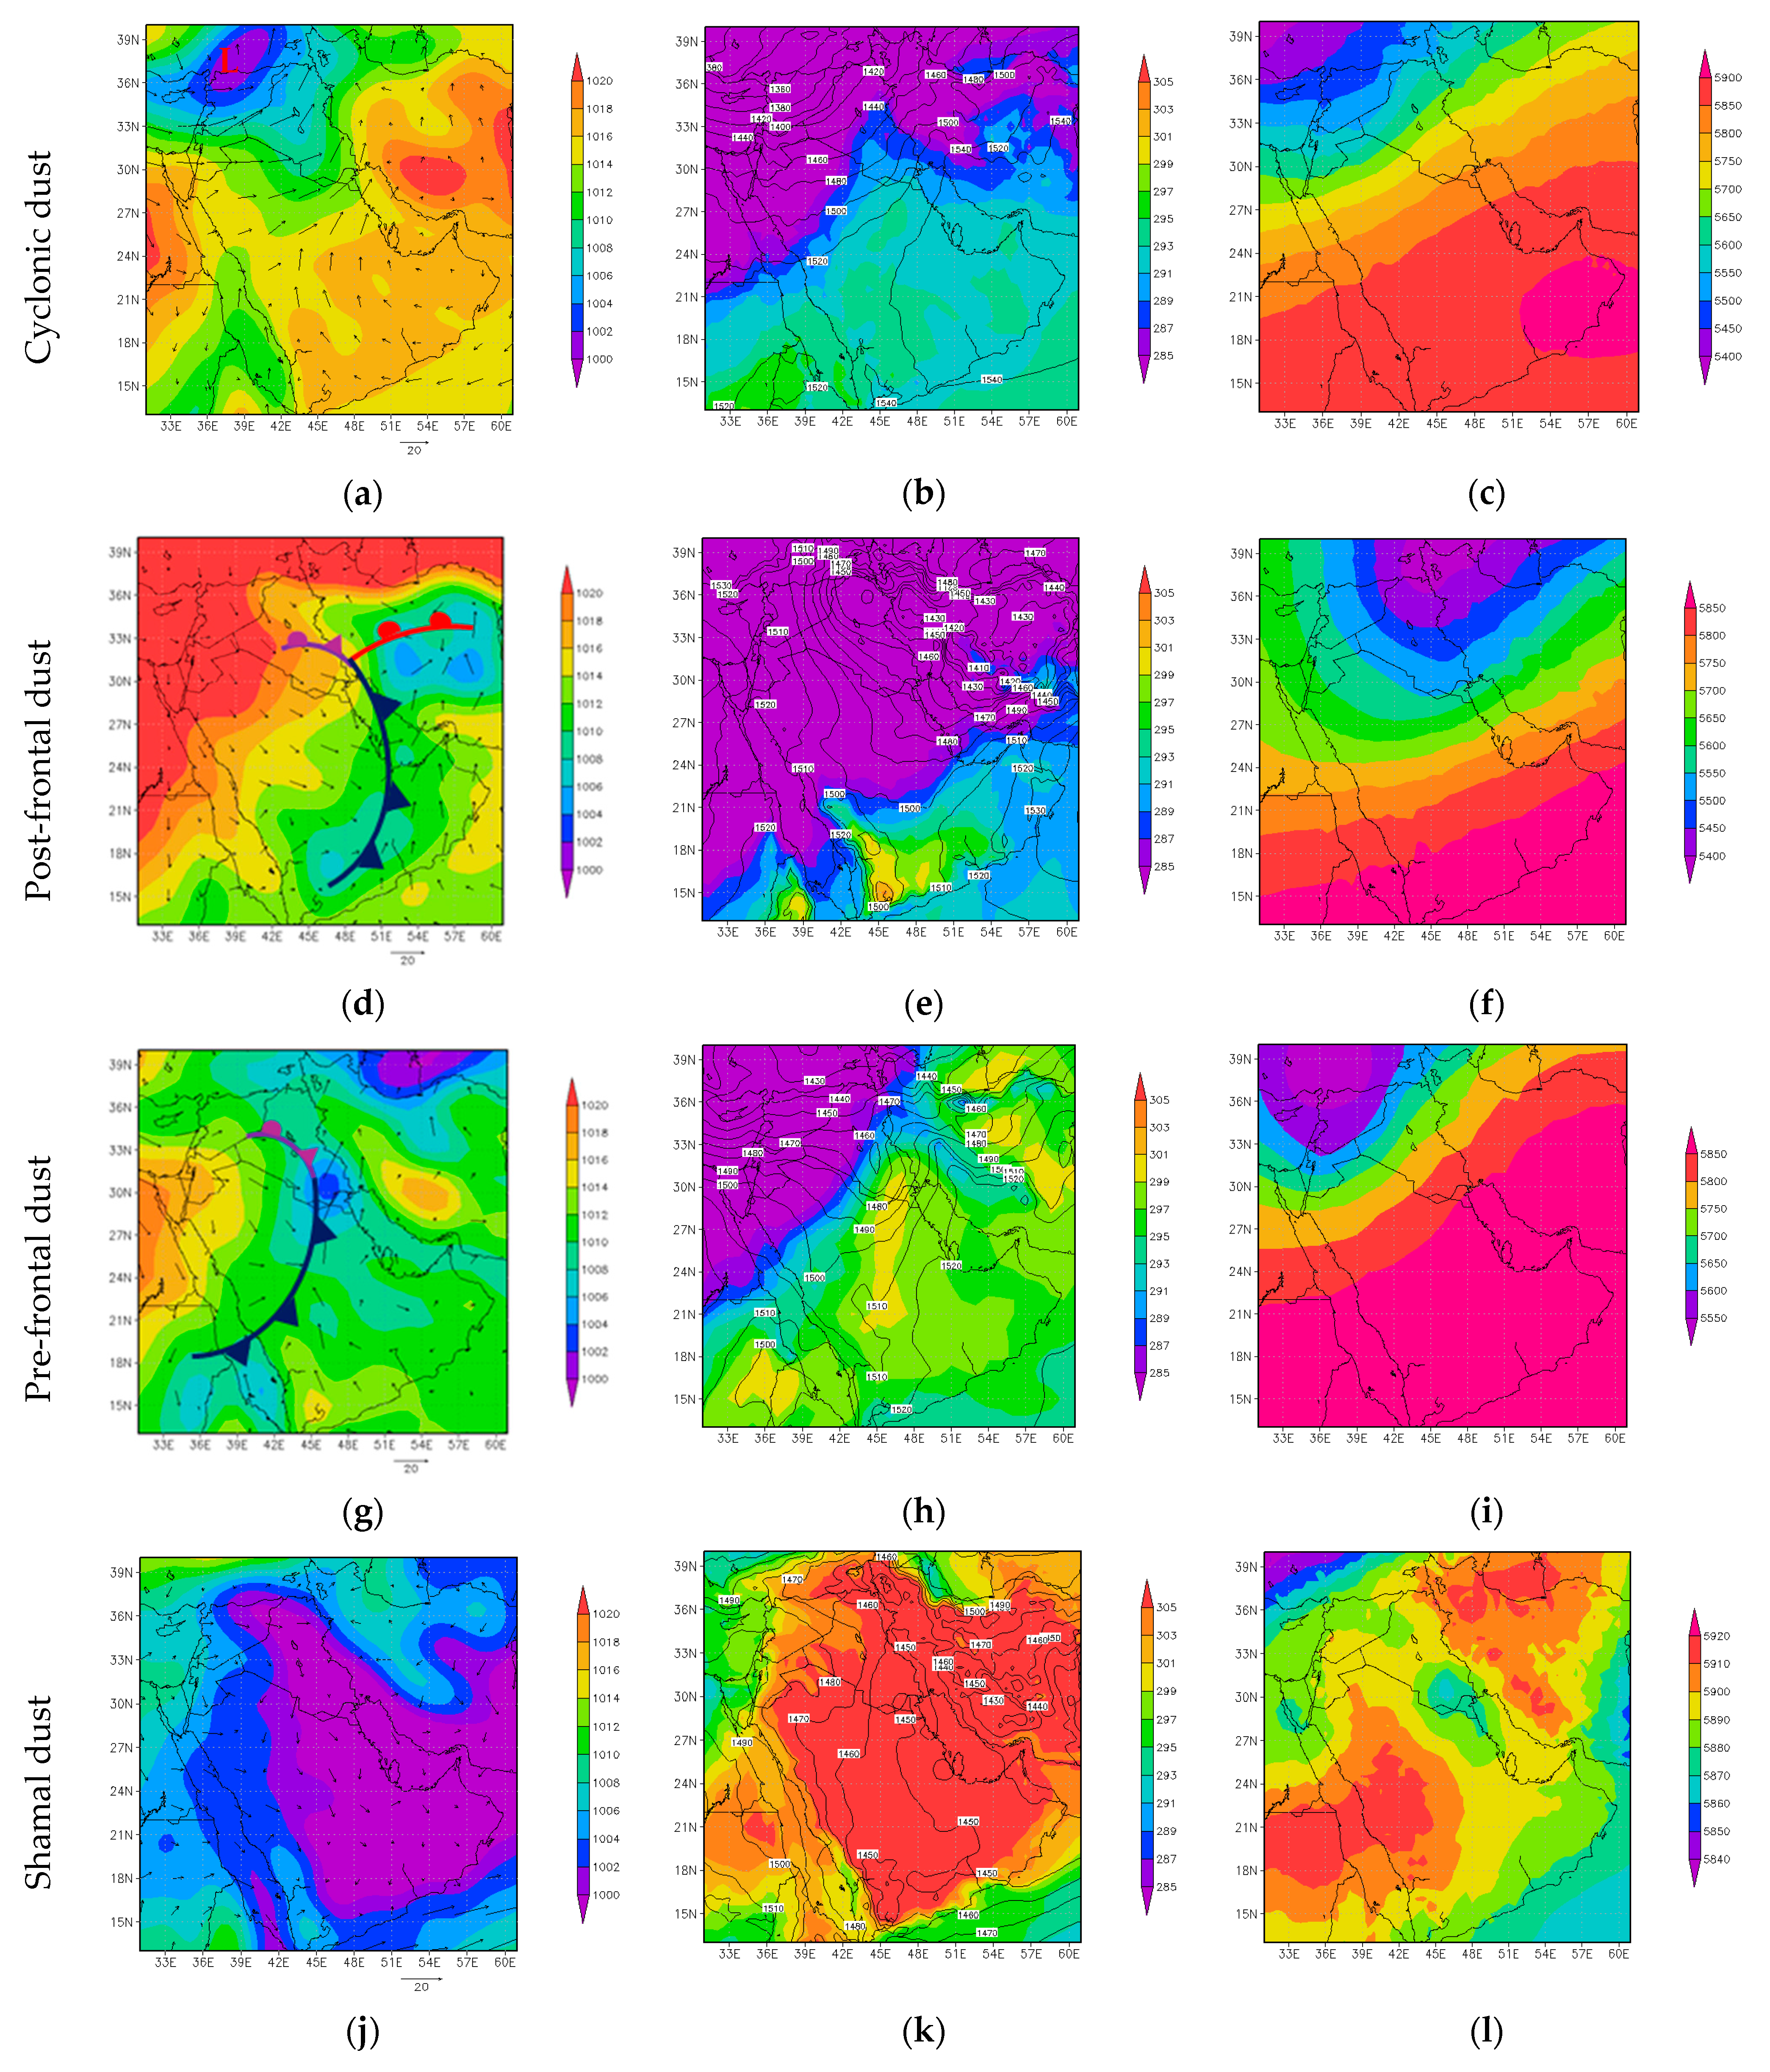
3.2. Synoptic Meteorology

In this section, the synoptic meteorological patterns of selected dust events of each type are analyzed, while the rest of the cases are included in Figures S3–Figure S6. Figure 3 shows the MSLP patterns superimposed with 10-m vector winds, the geopotential heights and temperature at 850 hPa level and geopotential heights at 500 hPa level for the selected dust events.
In the case of the cyclonic dust storm on 2 December 2016 (00:00 UTC), the MSLP pattern shows a low-pressure center in eastern Turkey and northern Syria, while its southern expansion affected central Iraq (Figure 3a). This low-pressure center facilitated cyclonic winds around it and dust advection over the western part of Syria and northern part of Iraq (Figure 1a and Figure 2a). Deep low-pressure centers are responsible for massive dust storms of this type over Syria and Iraq, as was the case in September 2015 [43]. At 850 hPa level (Figure 3b), a low-altitude closed center (cut-off low) was formed over northern Syria, southeast Turkey, with a 1340 gpm contour at the center, while its trough reached southeast Iraq. A strong temperature gradient was observed over central Iraq, while at 500 hPa (Figure 3c), a relatively deep trough was observed over the eastern Mediterranean and western part of the Middle East, with surface low-pressure in front of its axis in eastern Turkey and northern Syria. The upward motions in front of the trough axis caused surface low-pressure reinforcement in this area.
Synoptic analysis of the post-frontal dust storm on 17 February 2017 (12:00 UTC) shows that a low-pressure system with two closed centers at the surface was formed in the central regions of Iran (Figure 3d). The cold front of this system was stretched from central Iraq to eastern Saudi Arabia, associated with extensive cloudiness in its northern part (Figure 1b). High-pressure conditions dominated behind the frontal system over Syria and northwest Iraq, associated with strong northwesterlies over the area, which were shifted to southwesterlies in front of the frontal system over central Iran and southeastern Arabian Peninsula. This is a typical MSLP pattern for post-frontal dust storms in the Middle East, mostly affecting the Tigris-Euphrates Basin and the northern Persian Gulf [47]. At 850 hPa geopotential height (Figure 3e), a low-altitude system (cut-off low) was observed over the northern parts of Iraq (Kurdish cut-off low), which was characteristic for dust events affecting southwest Iran in late winter and spring [37,81]. This “cut-off” low was further intensified by the deep trough at 500 hPa level (Figure 3f) extended from the Caspian Sea and northwest Iran towards central Iraq, where the low surface pressure was located in front of its axis and was strengthened by the upward motions, thus triggering the frontal dust storm [47,82].
At 00 UTC on 30 March 2018, the MSLP pattern demonstrated a narrow low-pressure center formed over southern Iraq, accompanied by a cold front extended from Iraq to the west of Saudi Arabia (strong pressure gradient at 850 hPa level) (Figure 3g,h). The pre-frontal dust storm revealed large AODs just ahead of the frontal area covering a large part of the Middle East with a southwest to northeast axis (Figures S1 and S2, in the Supplementary Materials). At 850 hPa level, a low-altitude center was formed just above the surface low-pressure over southern Iraq, whose trough penetrated as far as the Persian Gulf. Baroclinicity and cold advection were observed over central Iraq. At 500 hPa (Figure 3i), the trough of a low-altitude center over eastern Turkey reached the northern parts of Saudi Arabia, while advection of warm air occurred ahead, from southeast Arabia to central Iran. Mid-troposphere troughs over the northwest parts of the Middle East (eastern Turkey, northern Syria) are a major dynamic force for pre-frontal dust storms over southern Iraqi plains [47].
Shamal dust storms usually occur in summer [46,63,83], when the Indian thermal low expanded over southern Iran and the Arabian Peninsula dominates [34,37]. This was also the case on 5 July 2017 (Figure 3j), since the Iraqi plains and the eastern part of the Arabian Peninsula were under the influence of an extended low-pressure system associated with the Indian summer monsoon. Nearly the whole Middle East land exhibited very high temperatures favoring the presence of thermal lows in the surface and the lower troposphere (850 hPa), while over the eastern Mediterranean and North Africa higher pressure conditions dominated (Figure 3k), which caused a strong pressure gradient and low-troposphere winds over the eastern Syria and Iraq. The 10-m wind field showed strong northerly and northwesterly winds over the southern half of Iraq and a large part of eastern Saudi Arabia, associated with enhanced dust AODs over these areas (Figure 2d). At 500 hPa geopotential height map (Figure 3l), two high-altitude centers were seen. One was located in the northern part of Iran and the Caspian Sea and the other was extended from the west of the Red Sea to Saudi Arabia, which is a characteristic 500 hPa atmospheric pattern in summer [84]. A low-altitude center (cut-off low) was located between these high-pressure systems over southern Iraq, which was a rather rare situation, as the Red Sea/Iranian trough is usually continuous [36,37,84].

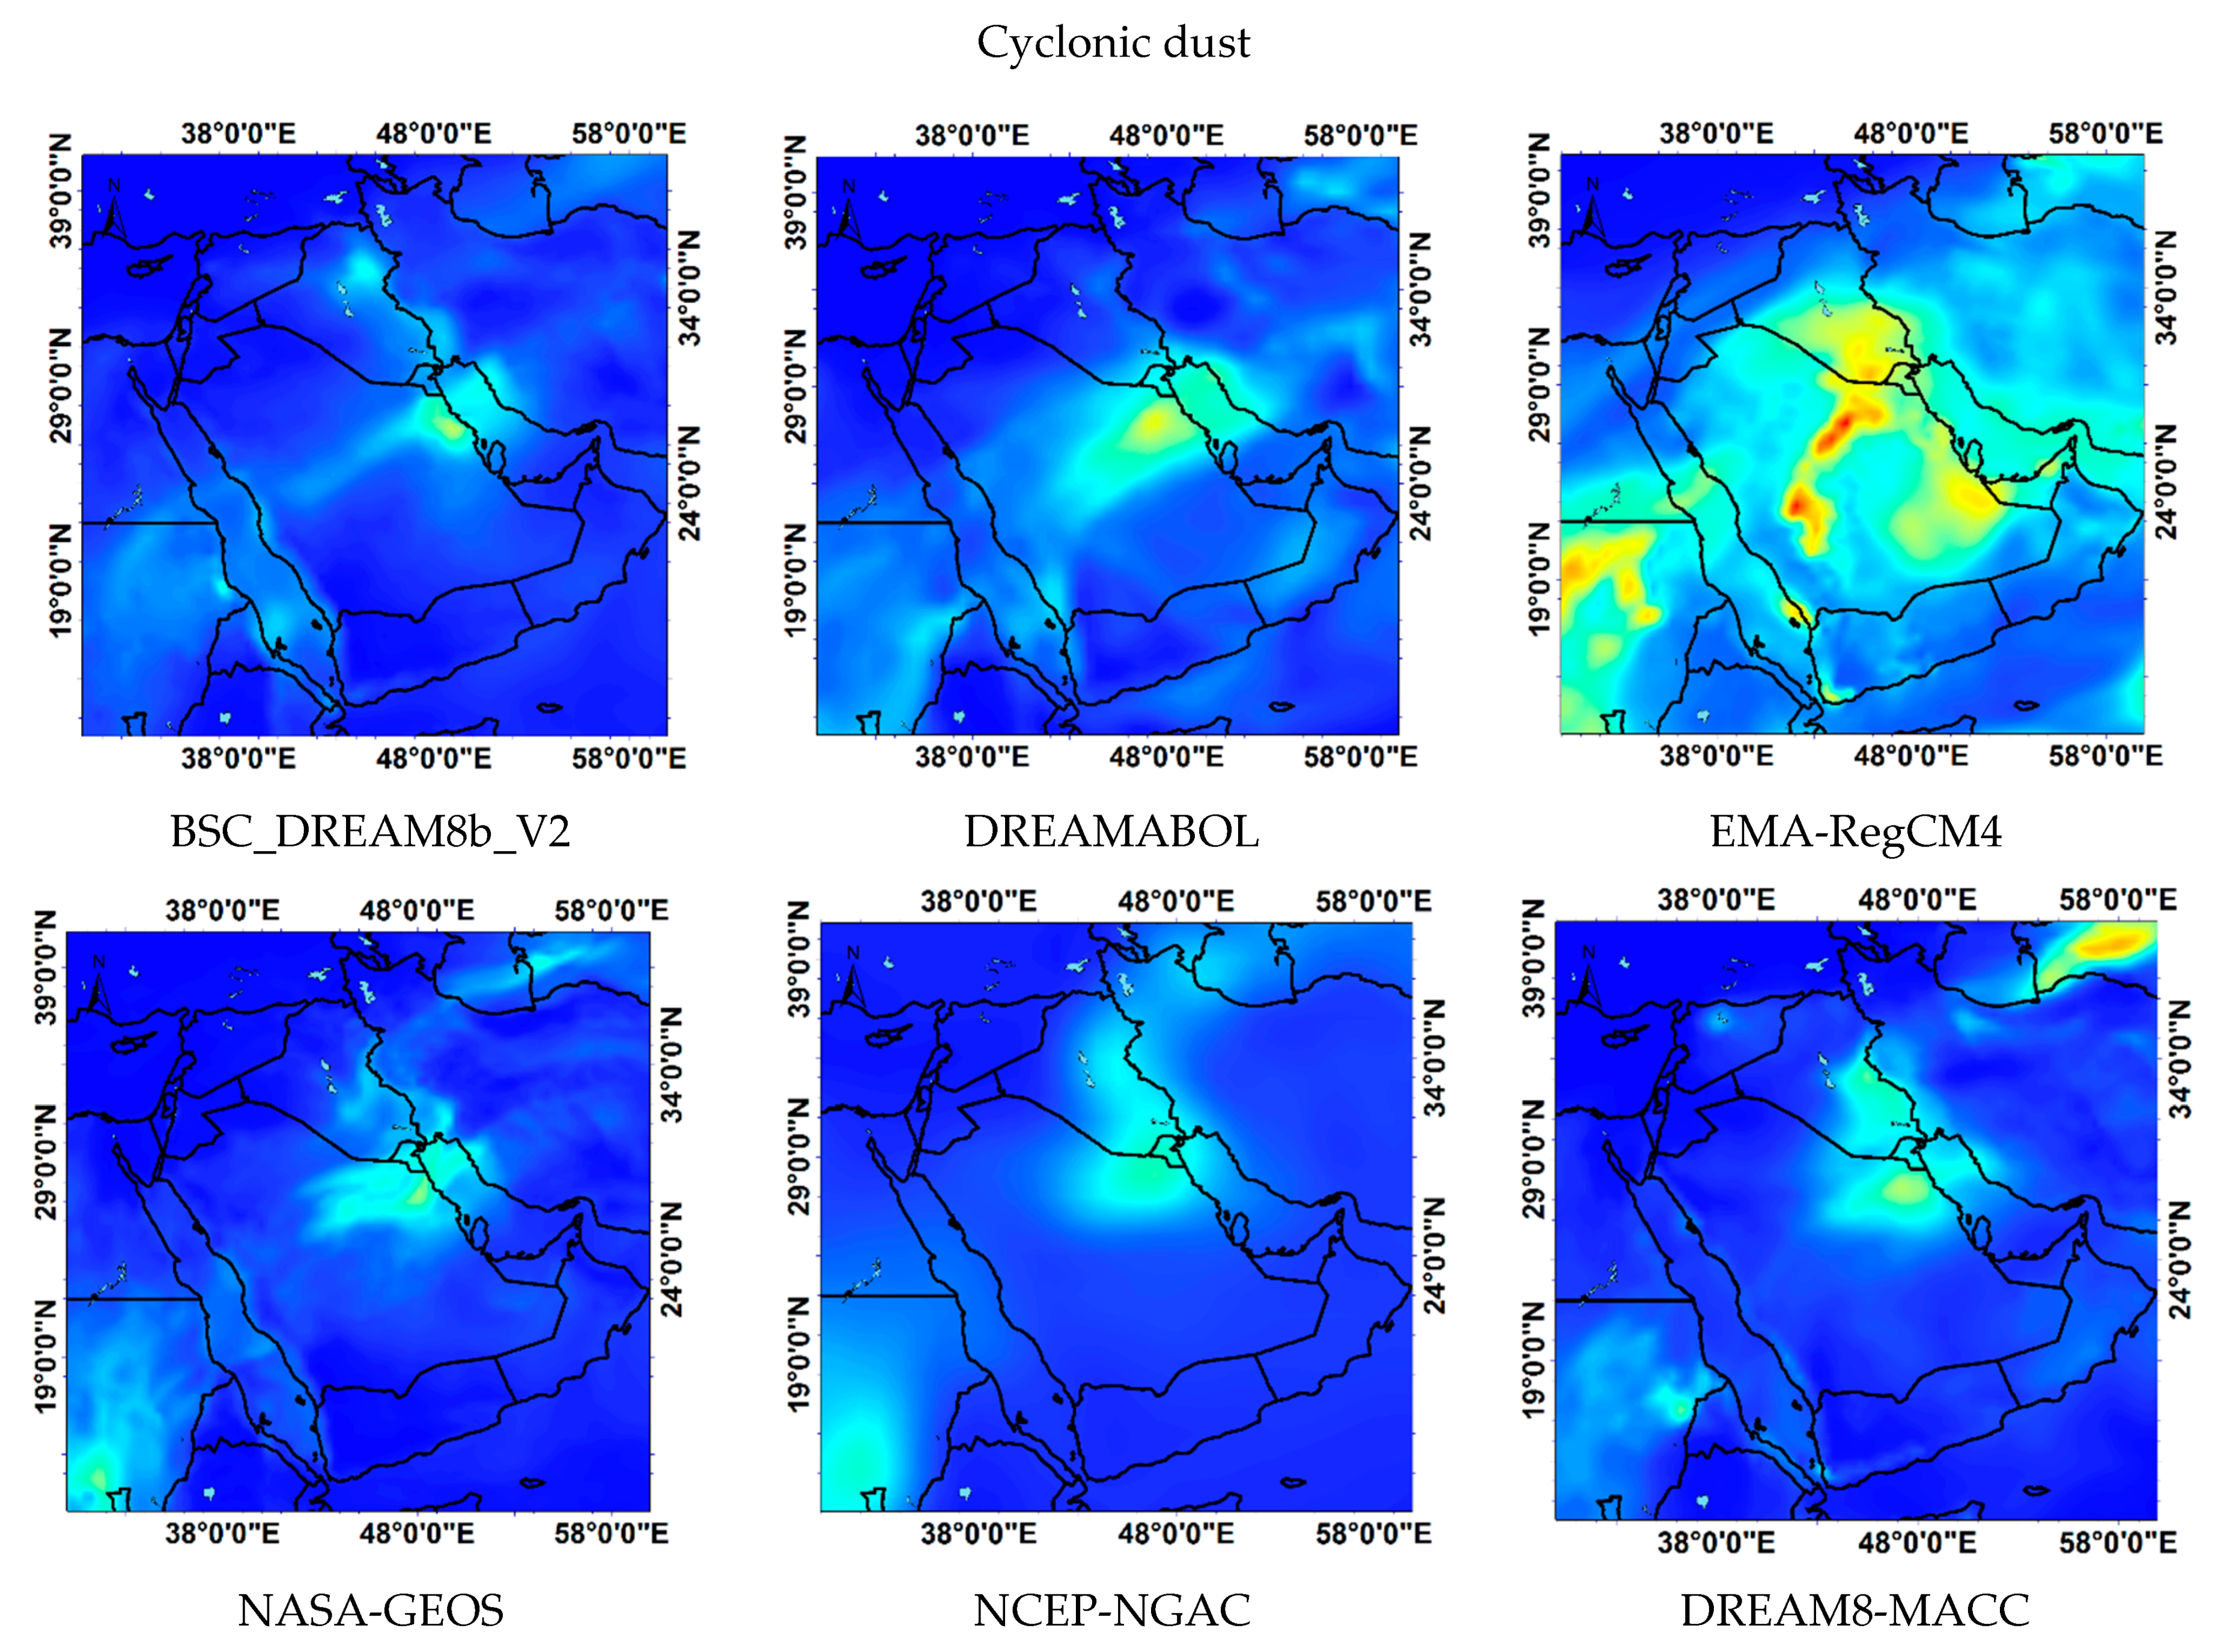
3.3. Model Simulations of AOD during Dust Events

This section presents the model forecasting of the AOD spatial distribution for selected events of each dust type, aiming to qualitatively compare the outputs from the 9 models. For this evaluation, one case was selected for each dust type, same as those in Figure 1, Figure 2 and Figure 3, while the model results for the remaining case studies are included in the Supplementary Materials. The model AOD distributions are presented at 7:00 UTC (10:30 LST) close to Terra-MODIS overpass time.

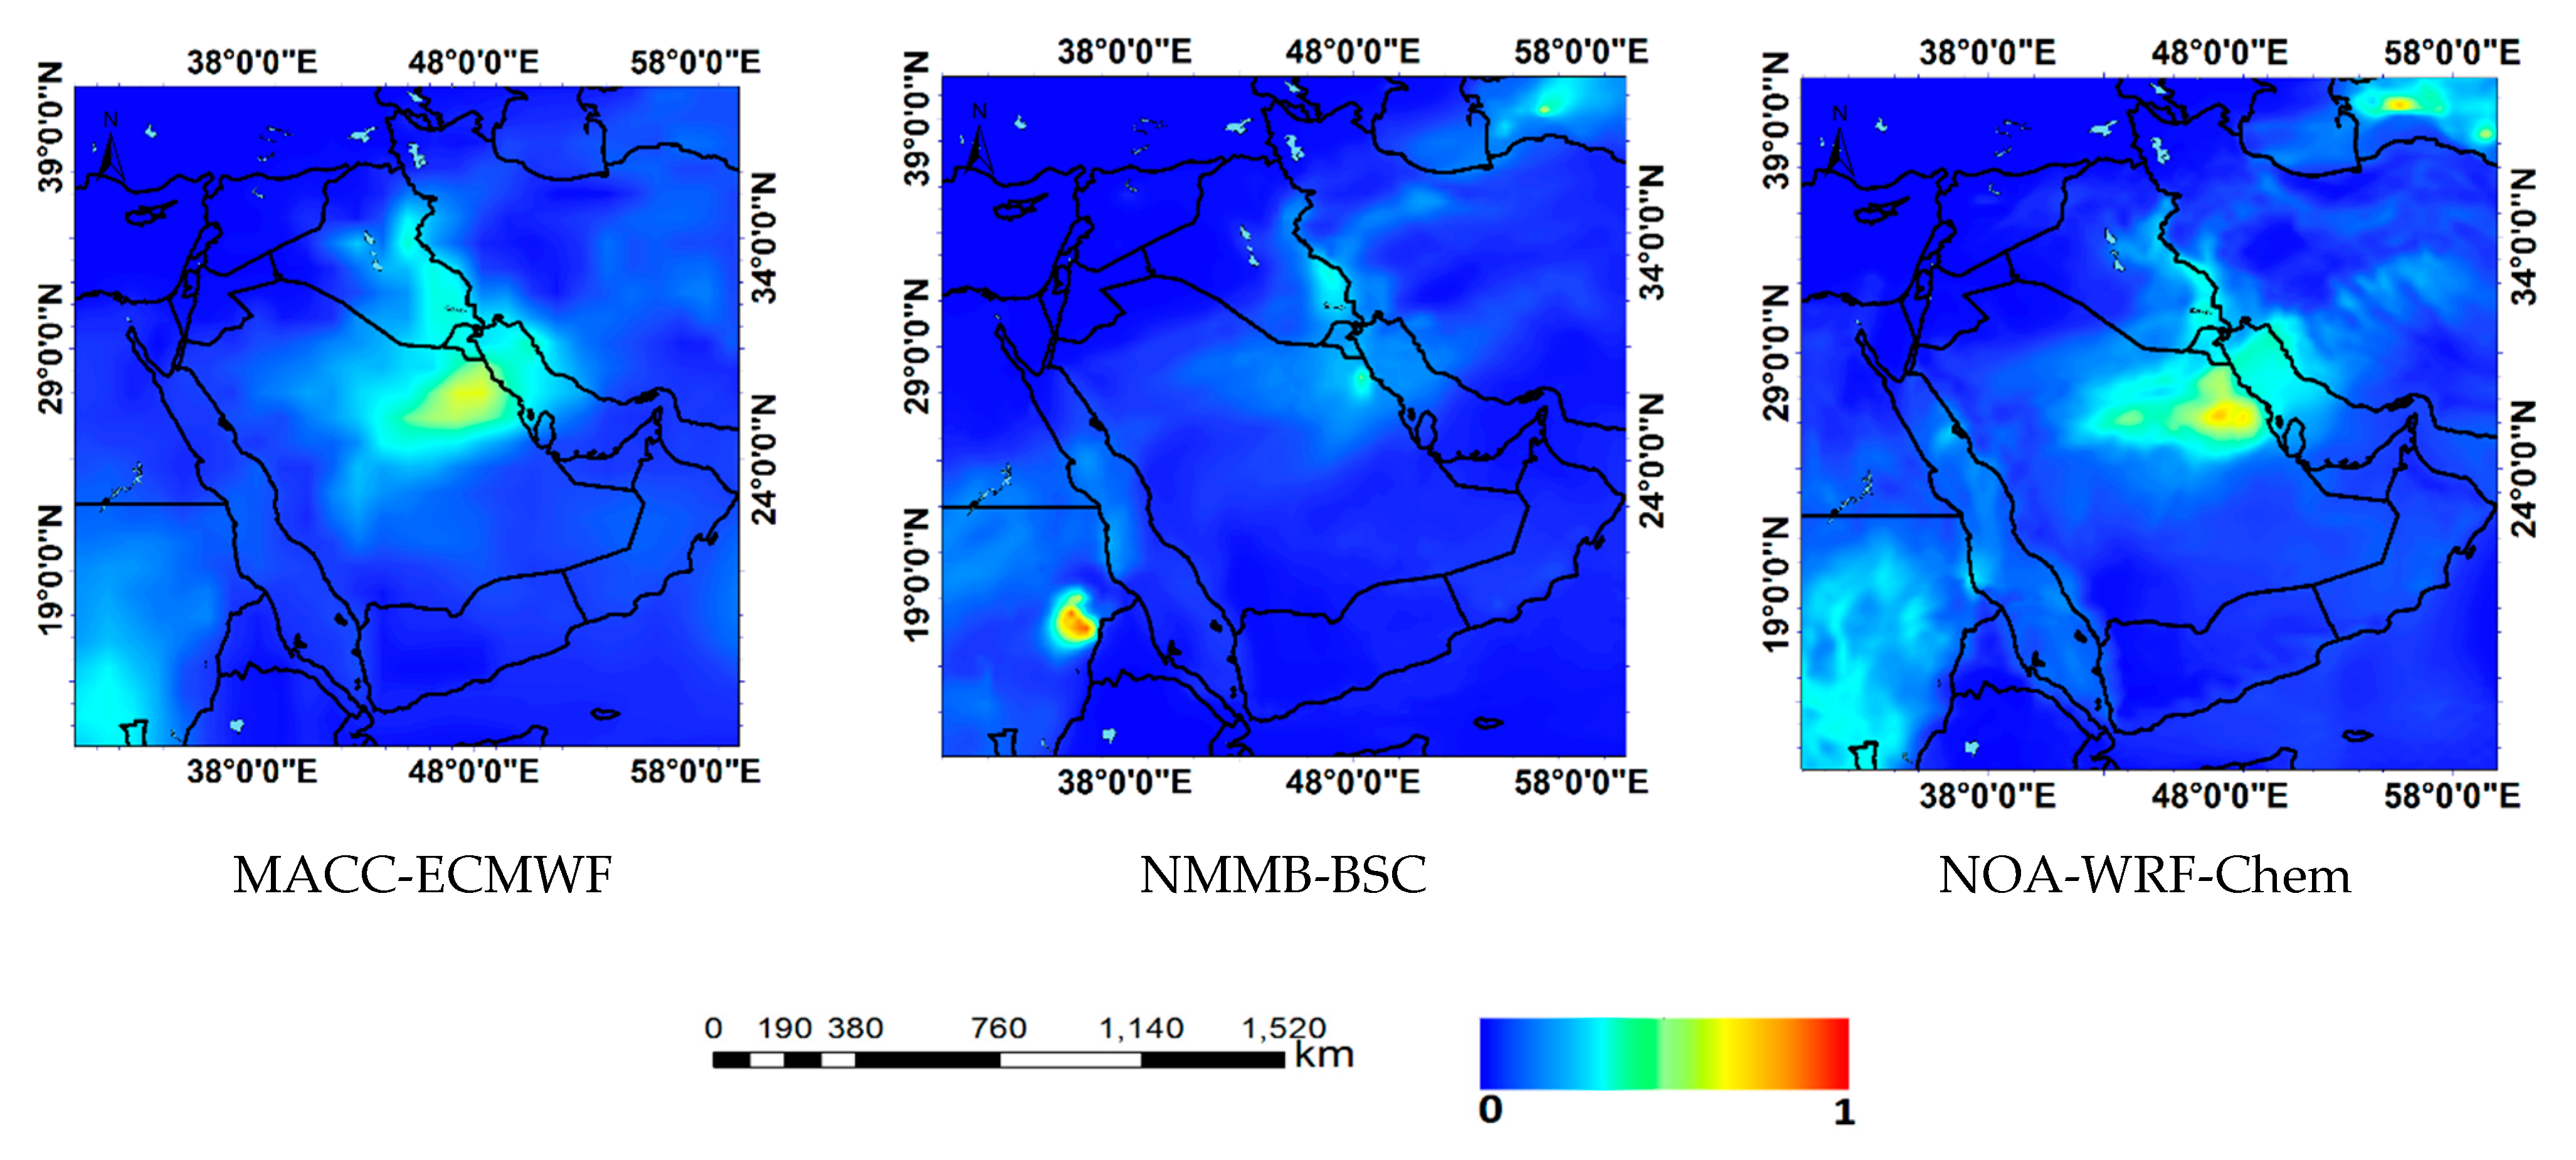
3.3.1. Cyclonic Dust Storms

On 2 December 2016 (Figure 4), all models except the EMA-RegCM4 predicted much lower AODs than those observed by MODIS over the Middle East and especially over the dust-source regions that were located in the northern part of Iraq (cyclonic dust storm) and in a vast area in southern Iraq, Kuwait and northeast Saudi Arabia (Figure 2a). In general terms, all models, despite the differences between them, forecasted enhanced AODs over these regions, indicating a satisfactory representation at least for the spatial distribution of the AOD. However, DREAMABOL and NMMB-BSC models did not forecast well the enhanced AOD over north Iraq and showed dust presence only over the surrounding areas of the northern Persian Gulf.
On the other hand, MACC-ECMWF, NOA-WRF-Chem, BSC_DREAM8b and DREAM8-MACC models exhibited greater similarity with MODIS regarding the spatial distribution of AOD. Among these models, the BSC_DREAM8b_V2 underestimated the AOD values especially over Saudi Arabia but showed a closed center of dust mass in northern Iraq, which was related to surface low pressure and originated from arid regions around Tharthar Lake [32]. The failure of some models to identify this closed dust center could be likely attributed to underestimation of wind speed and dynamic processes around the low-pressure center that triggered the cyclonic dust storm. Since the wind speed and threshold wind speed significantly affect the surface dust emissions, and dust flux is usually proportional to the third power of wind speed, errors in the forecasting of the wind regime may lead to large uncertainties in predicting dust emissions and concentrations [85,86]. Tegen and Miller [87] compared the surface wind speed of two models and resulted that the differences in dust emissions between the models were also dependent on the model resolution and parametrizations of the atmospheric boundary layer. In general, many studies have indicated that the accuracy of the atmospheric/meteorological model plays an important role in forecasting/simulating dust events (e.g., [88,89]). Global models are known to underestimate the dust-lifting power of the wind [90,91], thus predicting generally lower dust emissions and related AODs. In our case, the presence of smaller dust sources in the northern part of Iraq [92] compared to the vast deserts in Saudi Arabia is another factor that models produce larger discrepancies in forecasting dust in north Iraq and east Syria. In some dust emission schemes such as that in EMA-RegCM4 model, larger dust emissions and AODs are considered over the arid regions dominated by sand, such as the Arabian Desert, than areas covered with fine clay and silt particles in central Iraq [47,54]. Based on the Food and Agriculture Organization (FAO) soil map, which is widely used in dust forecast models, there is more clay fraction in vast parts of Iran and north half of Iraq but there is more sand fraction in the whole Saudi Arabia and Turkmenistan [47]. The model forecasts of the AOD distributions during the other two cyclonic dust storms are included in Figures S7 and S8 (in the Supplementary Materials), indicating similar results about the models’ performance in forecasting the dust storms, also exhibiting an AOD overestimation from EMA-RegCM4 compared to other models.

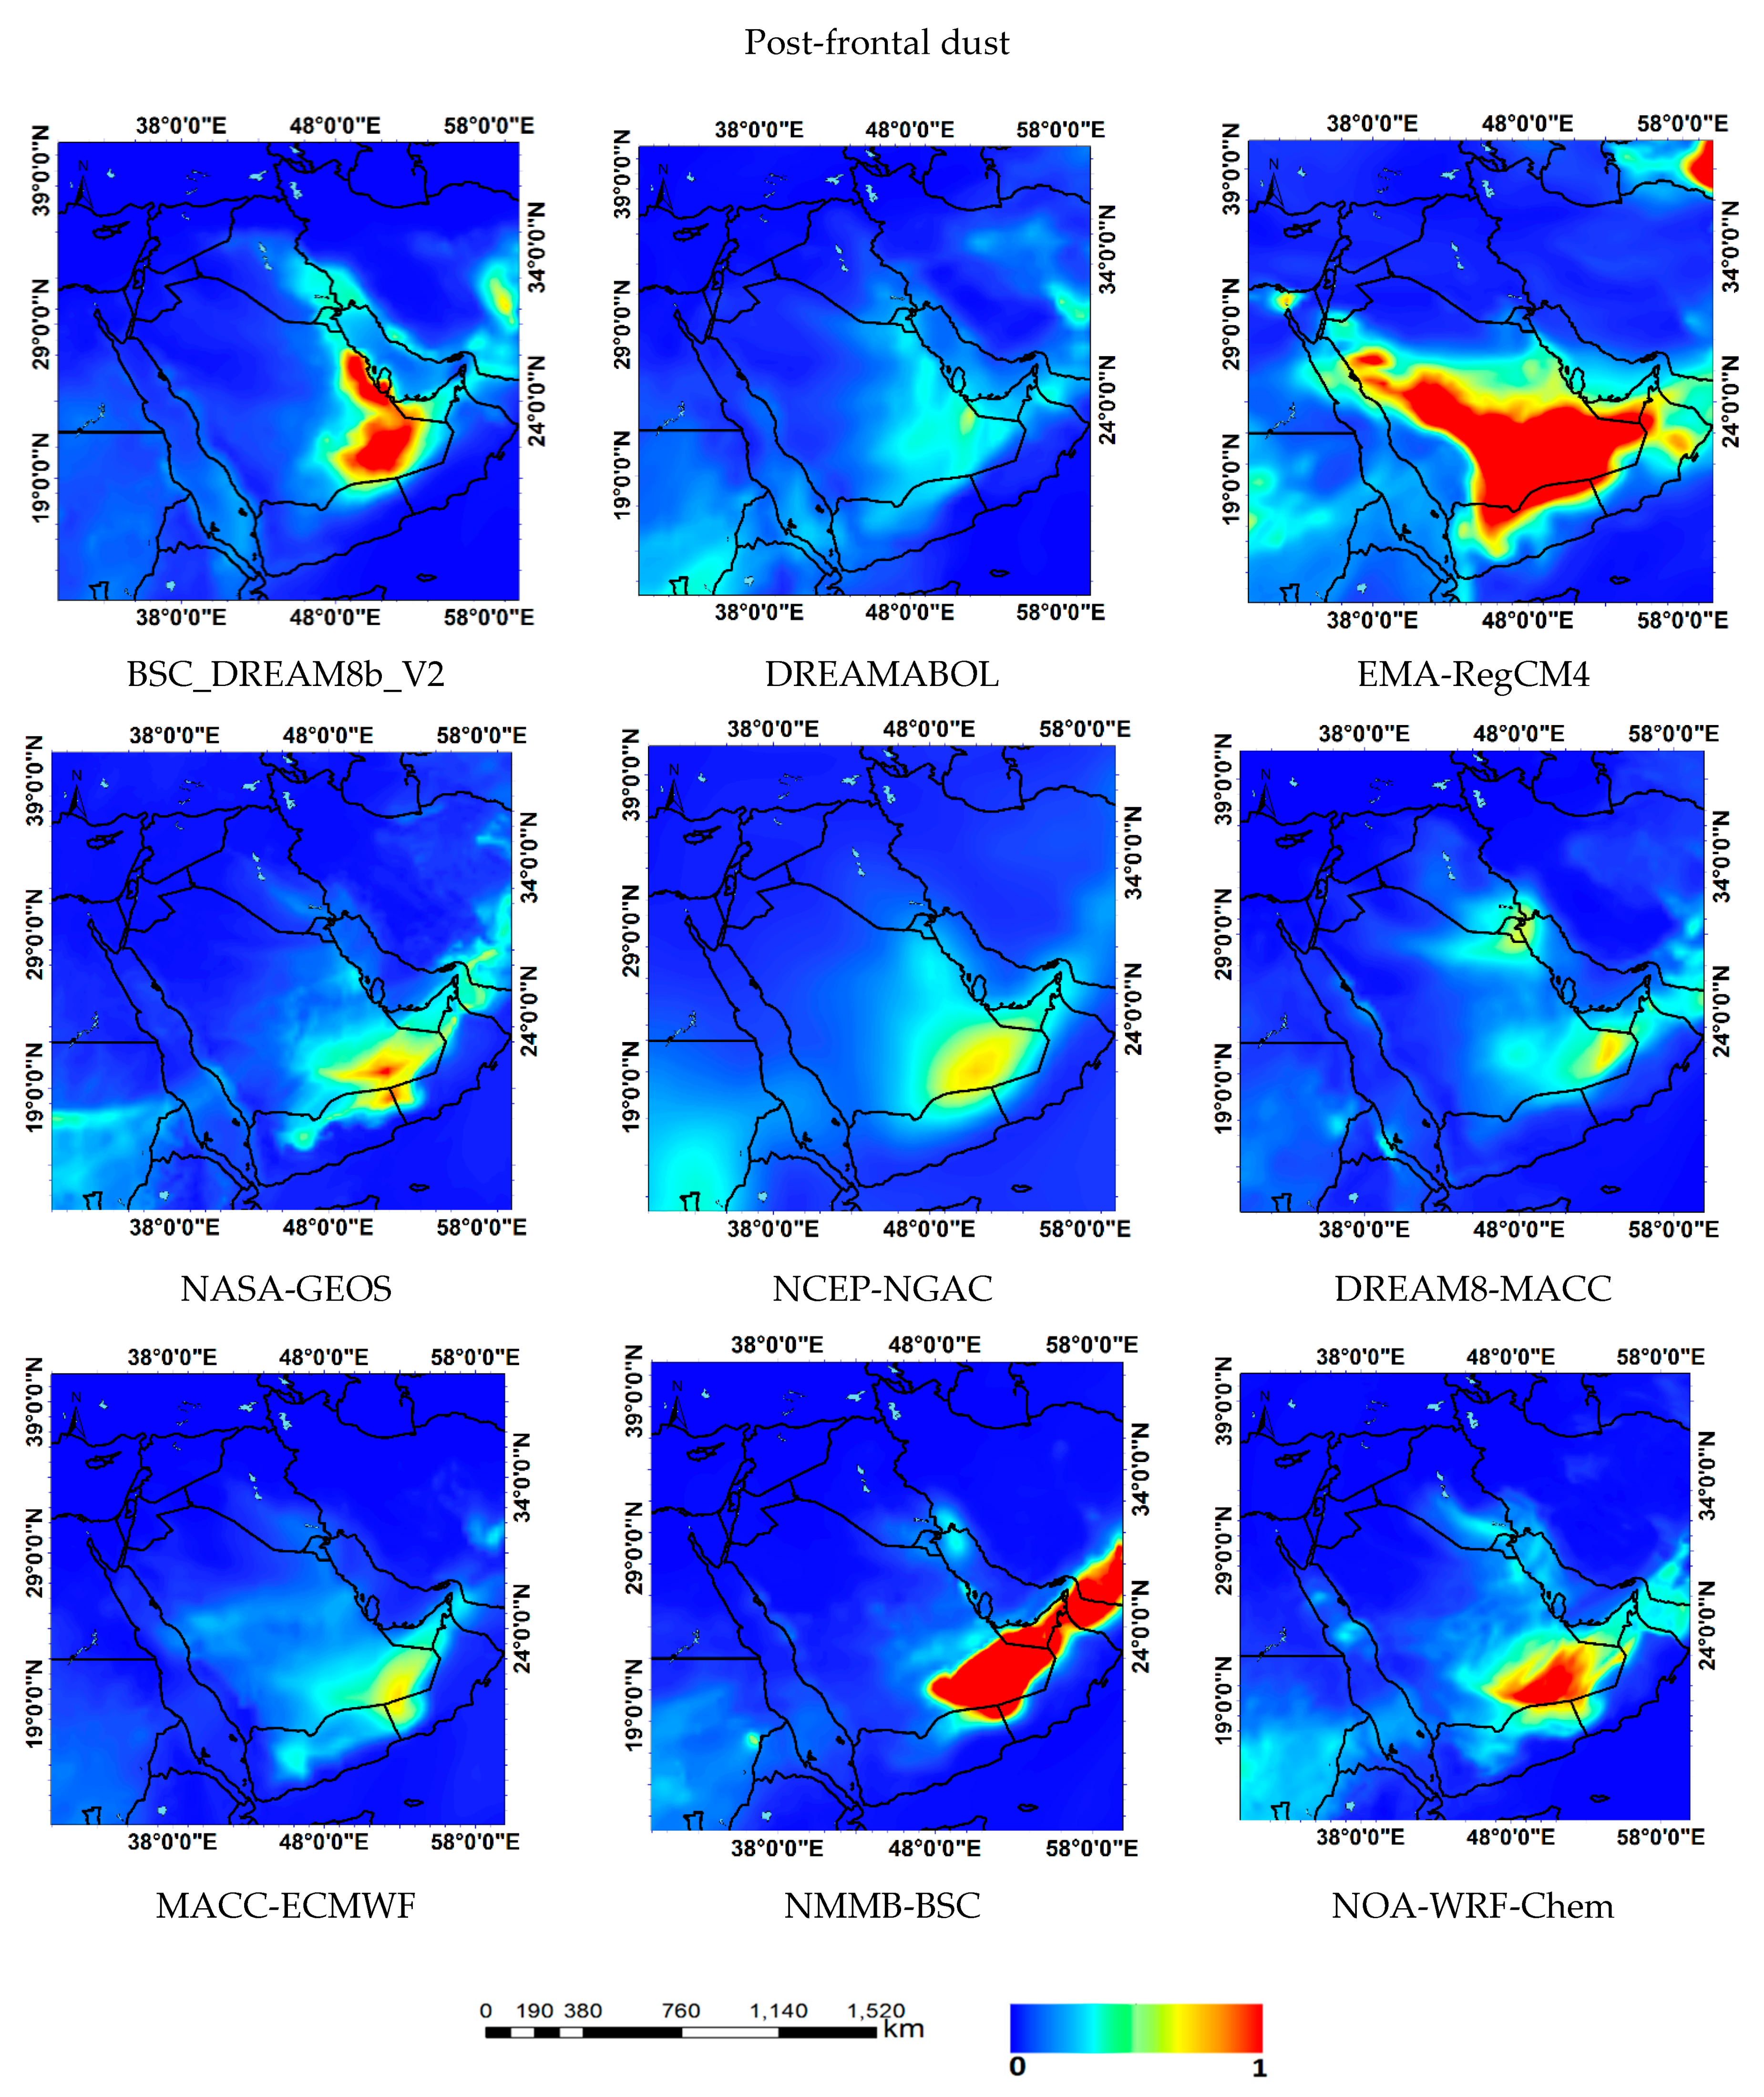
3.3.2. Post-Frontal Dust Storms

The AOD outputs from the 9 models during the post-frontal dust storm on 18 February 2017 (Figure 5) showed that all models underestimated the MODIS AODs (Figure 2b) in southwest Iran, south Iraq, Kuwait and north part of the Persian Gulf, the areas that were most impacted by the post-front dust storm and exhibited the maximum AODs (Figure 2b). However, most models predicted the highest AODs over southern Saudi Arabia (Rub-Al-Khali Desert), in general agreement with MODIS, although the differences in the AOD values and spatial distribution between the models are especially high, indicating large discrepancies. Therefore, the models present some difficulties in forecasting of this post-frontal dust storm over southern Iraq and southwest Iran, as also noted by Hamzeh et al. [47]. BSC_DREAM8b_V2 and DREAM8-MACC models represent satisfactorily the post-frontal dust storm, whereas EMA-RegCM4 highly overestimated the dust emissions from Saudi Arabian Deserts. Furthermore, NMMB-BSC predicted very high AODs, corresponding to intense dust storm transported from Rub-Al-Khali to southern Iran. NOA-WRF-Chem model also forecasted significant emissions from the Rub-Al-Khali Desert but not from the southern Iraqi plains. The surface dust flux in many models is calculated by Ginoux et al. [27] dust source function, which simulates enhanced emissions from the most erodible regions [26,93]. So, it’s necessary to use modified source functions to get more agreement with the observational data [94]. The use of dust source functions based on topographic depressions [27] or remote sensing dust load [95] improves the forecasting of the dust life cycle [26,96], but the use of these semi-empirical source functions cause missing of dust particle physics. Other models do not consider the availability of sediment and soil properties in the calculation of dust flux [28]. On the other hand, discrepancies in the detection of the position and strength of the frontal system is a main source of error in frontal-dust prediction [47]. The results for the other two post-frontal dust storms are included in Figures S9 and S10 (in the Supplementary Materials). Some models highly underestimated the MODIS AODs, while significant discrepancies and differences in dust forecasting were observed between the models.

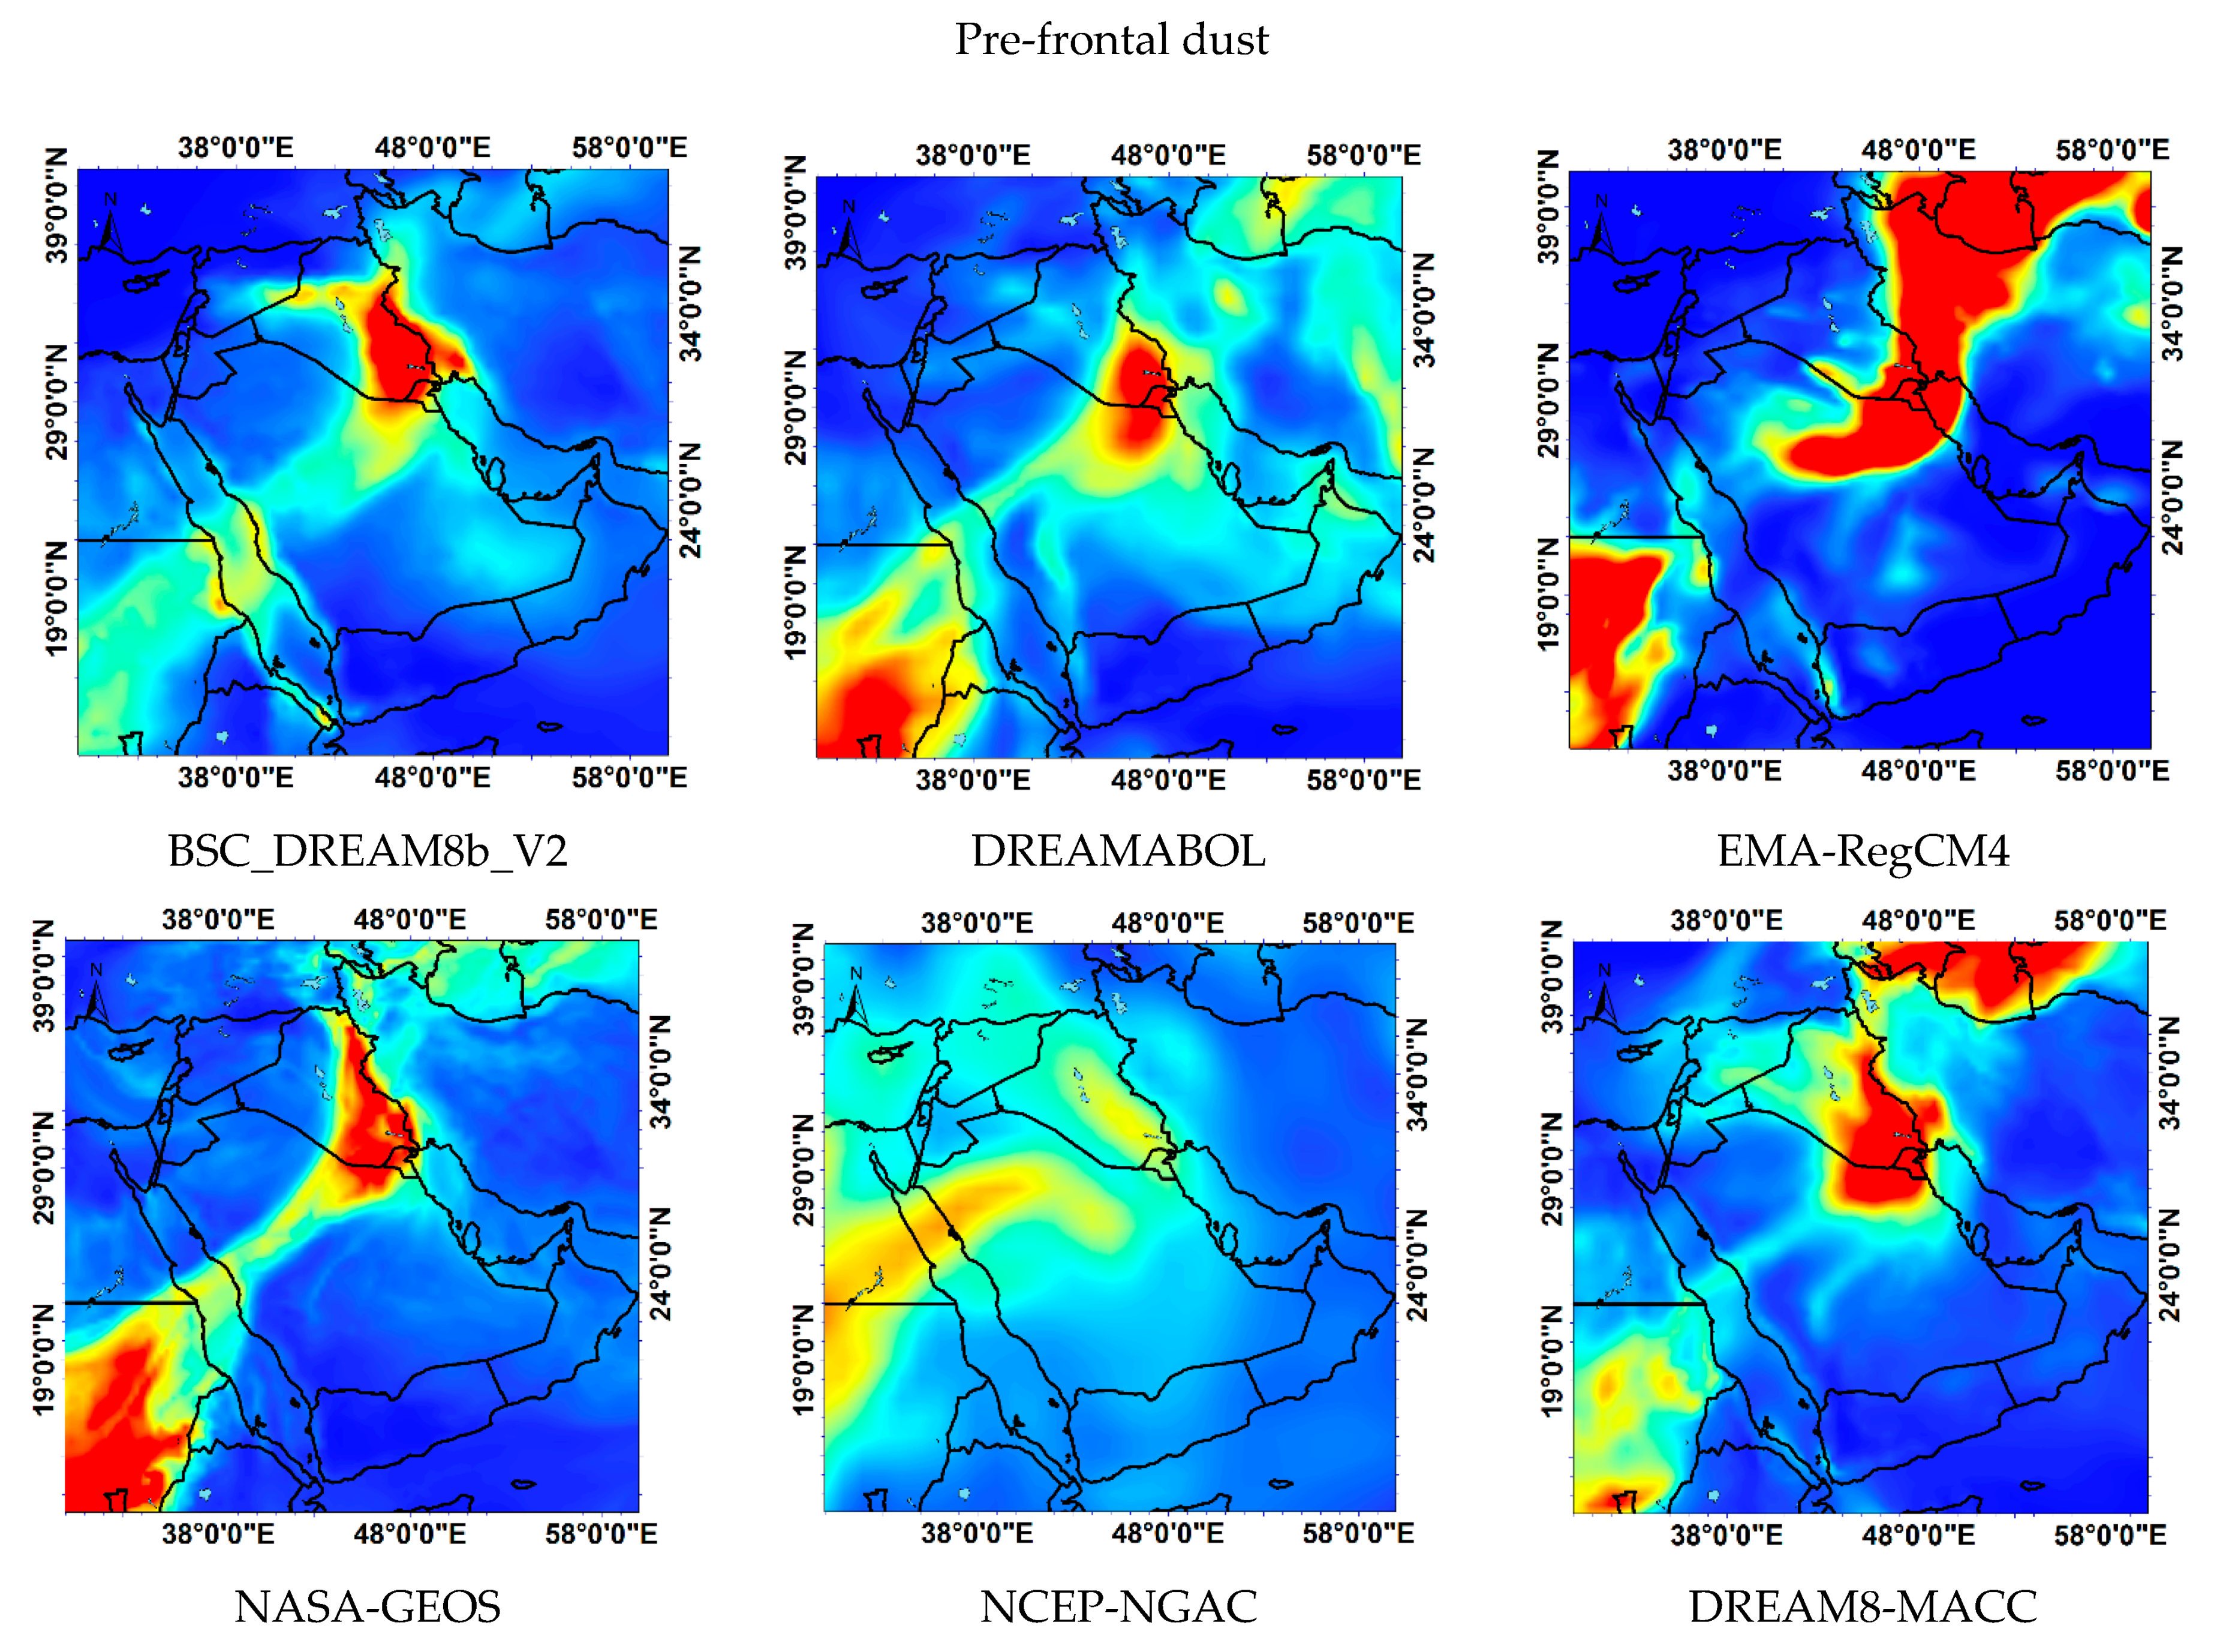
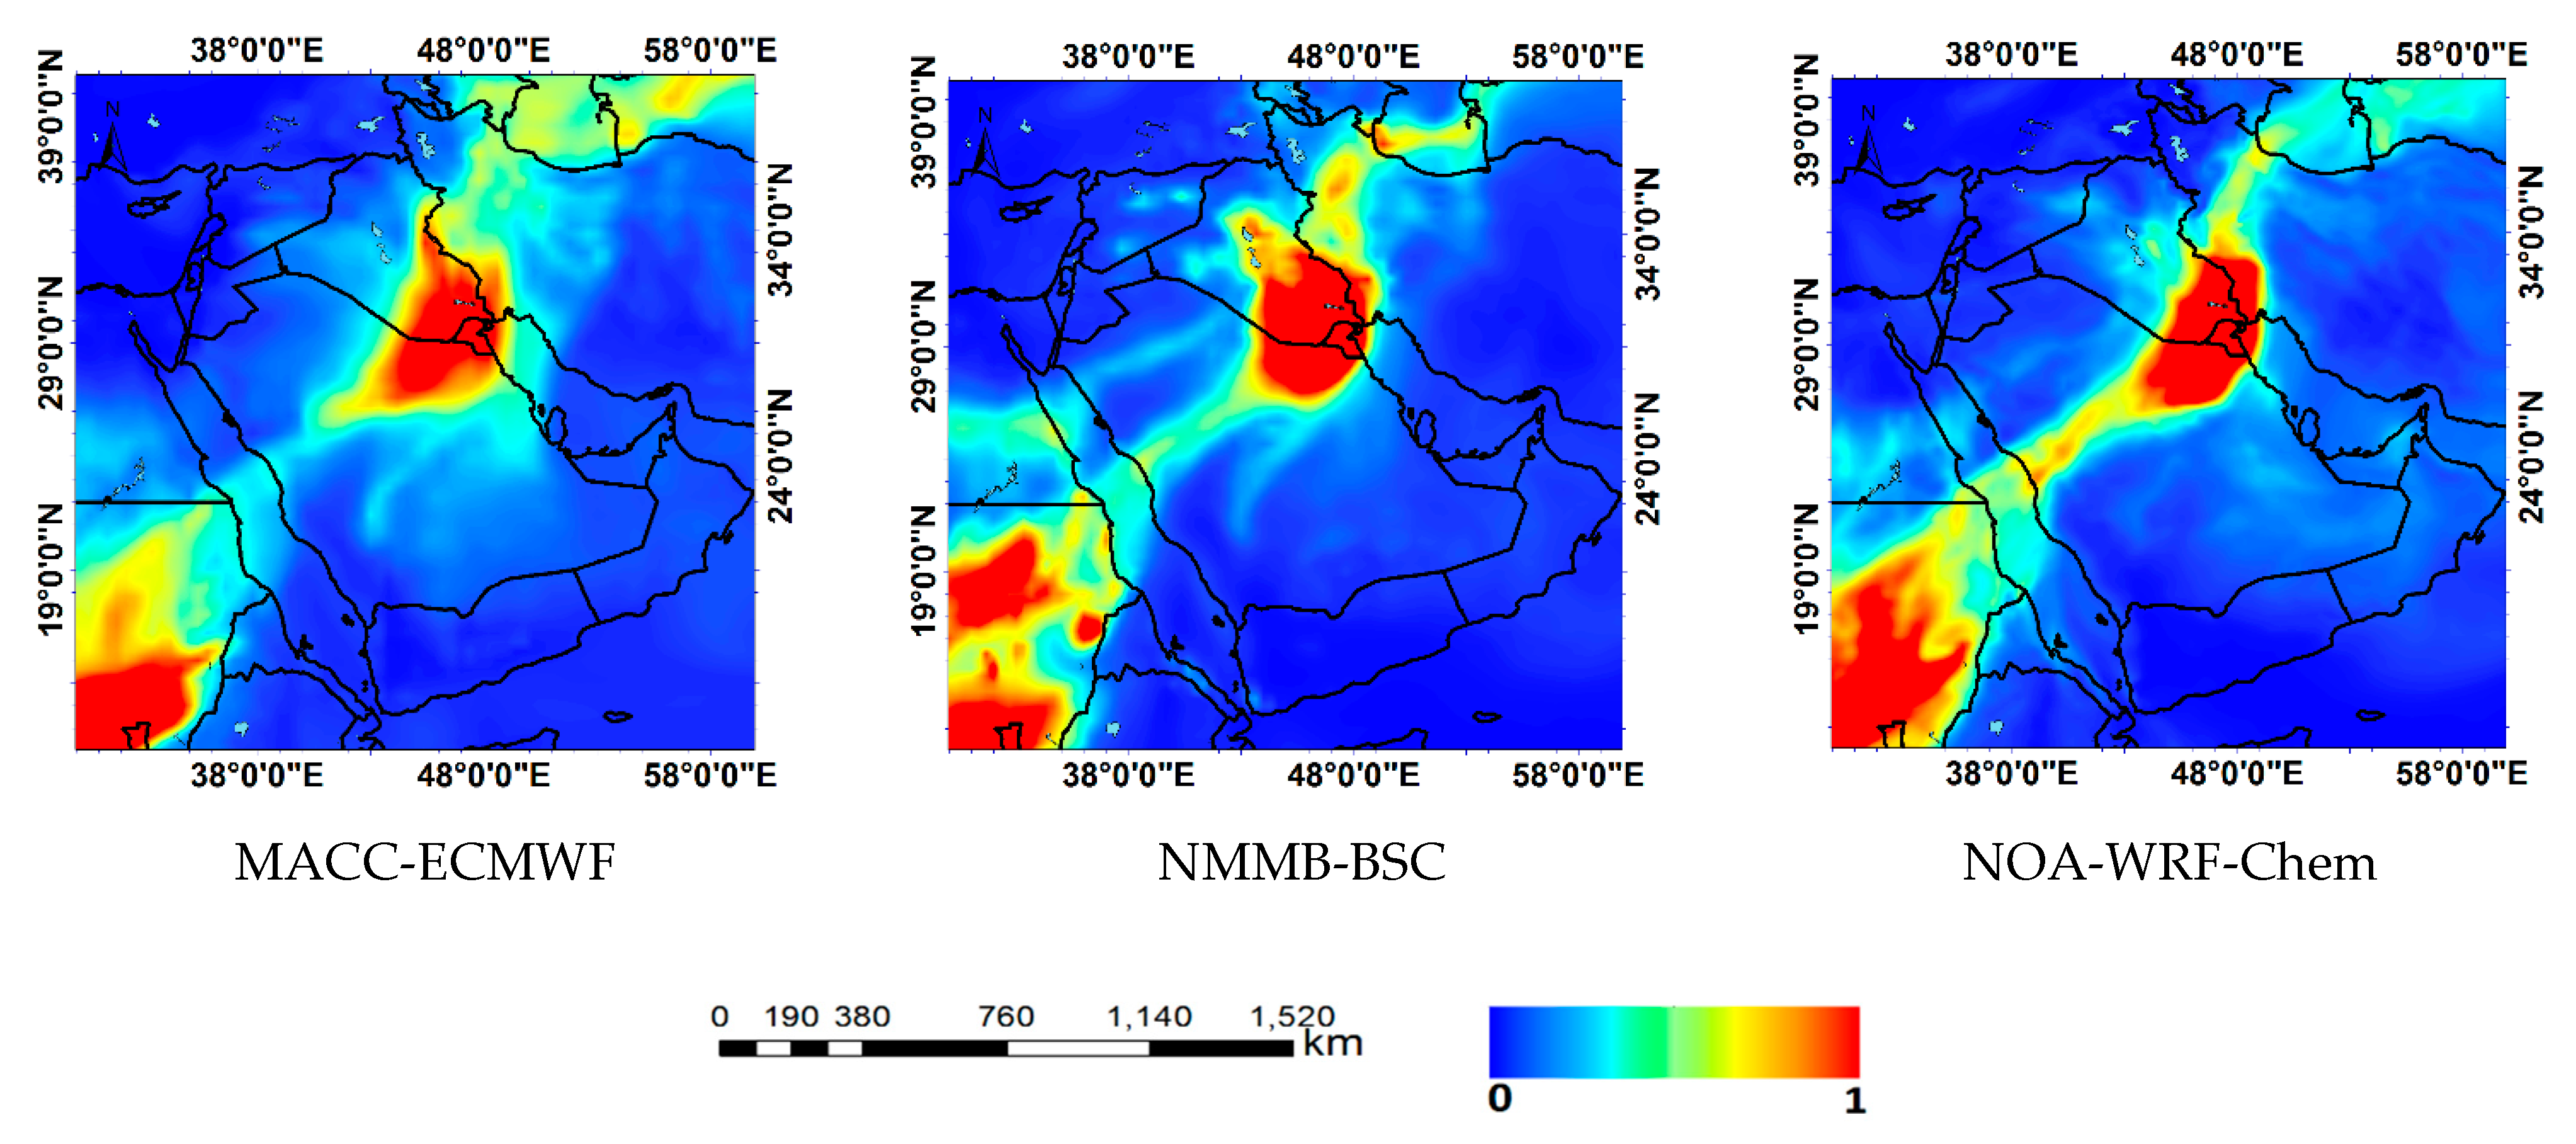
3.3.3. Pre-Frontal Dust Storms

All dust models revealed similar outputs regarding the spatial distribution of the AOD during the pre-frontal dust storm on 30 March 2018 (Figure 6). The models generally forecasted high AODs in the zone covered by the extended dust plume on that day, starting from Sudan and the Red Sea till northwest Iran and the Caspian Sea, although cloud cover along the dust plume prevented satellite retrievals (Figure 2c). However, the large expansion of this intense dust plume was not represented equally by all models, since several revealed much fewer dust AODs over the central parts of the Arabian Peninsula. Furthermore, the dust AODs may be underestimated by some models (i.e., BSC_DREAM8b_V2, NASA-GEOS, NCEP-NGAC) in the central part of Iran. In general, qualitative comparison with the satellite observations revealed that the dust AOD patterns obtained by the MACC-ECMWF and NOA-WRF-Chem models exhibited good performance. One of the effective factors in forecasting and simulating atmospheric dust is the surface wind speed. Most models consider that the amount of dust flux is proportional to the higher powers of surface wind speed or friction velocity. Because of the rapid change in wind speed and direction during the passage of frontal systems, many models are incapable or face difficulties in representing such sudden changes, leading to large biases in dust forecast [97]. The Zagros mountains in the west and southwest Iran and the rough topography of the Middle East are other factors that lead to uncertainties in the simulations of dust life cycle and concentrations due to their impact on the wind regime [51,98,99]. Model forecasts for the rest pre-frontal dust storms are included in the Supplement (Figures S11 and S12).

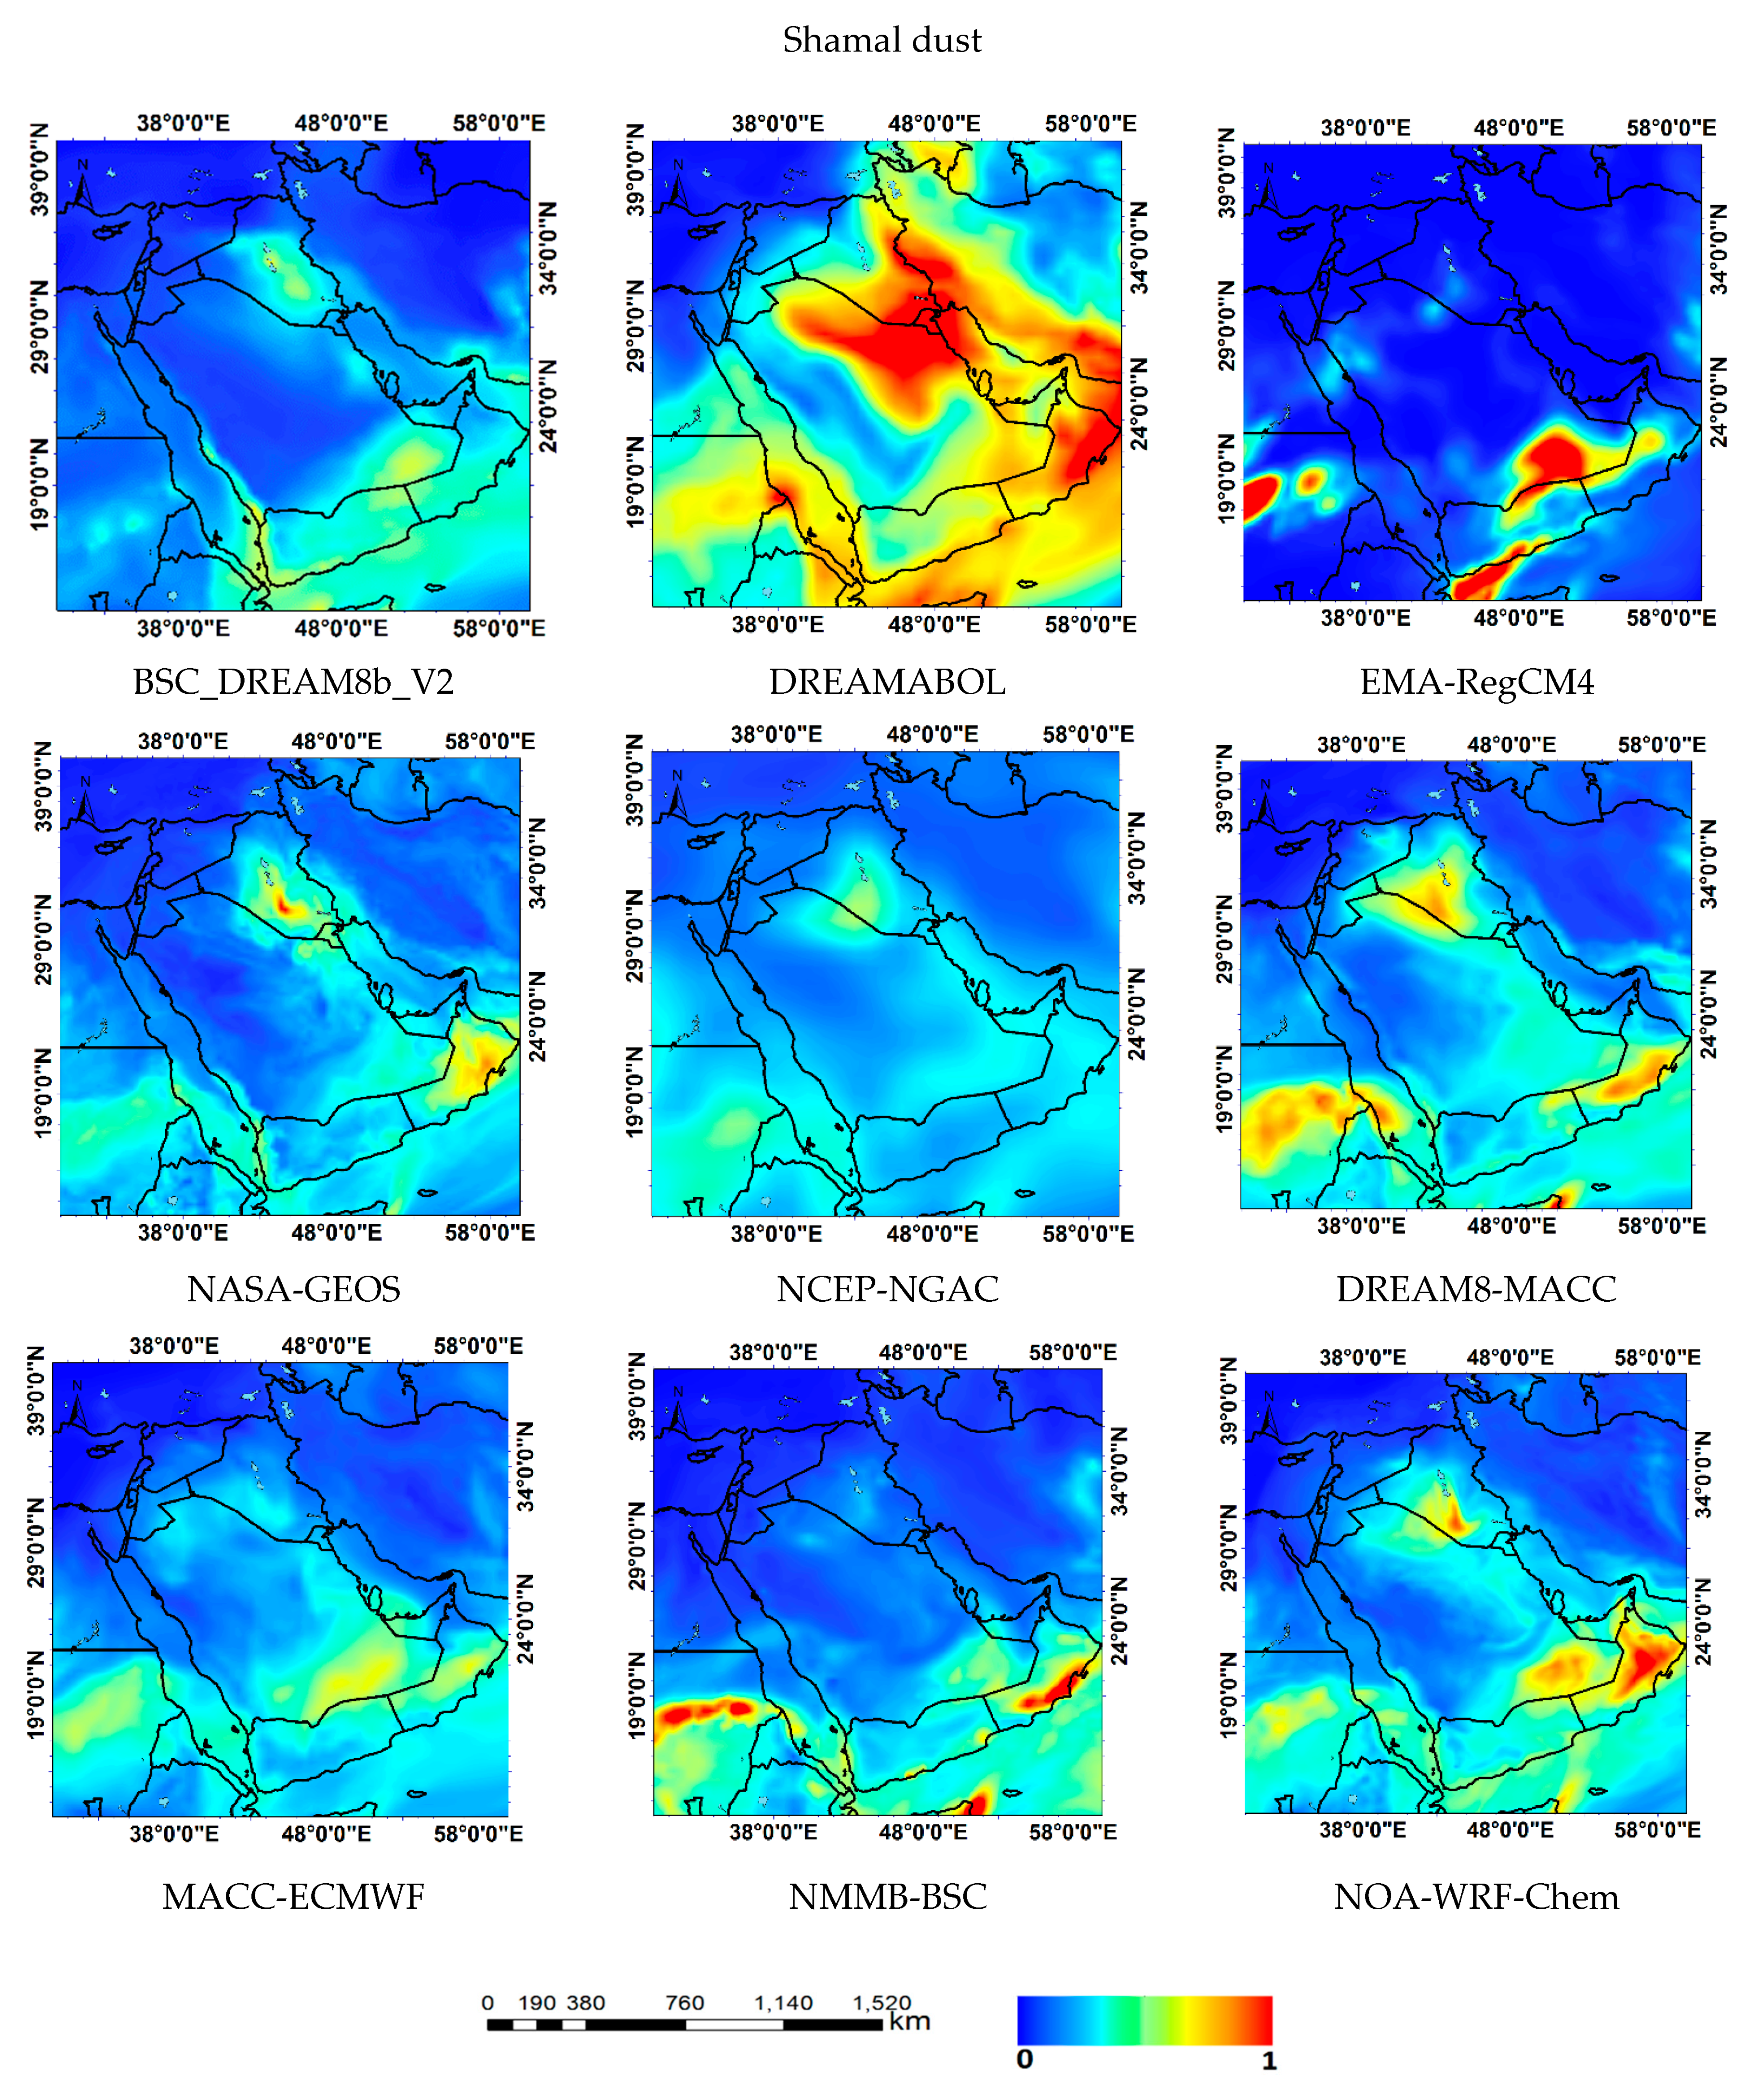
3.3.4. Shamal Dust Storms

As stated above, the Shamal dust storms mainly occur in summer, when higher AODs dominate over the southern Arabian Peninsula and the Arabian Sea due to increased dust activity as a result of low-pressure conditions and strong winds [83,100].
On 5 July 2017 (Figure 7), the comparison of all model outputs revealed very high variability and differences in the AOD spatial distribution. All models, except DREAMABOL, underestimated the AOD values, especially over Iraq, in the source area of the Shamal dust storm. The AOD outputs of the NASA-GEOS model were mostly similar to the observational data except over Oman. Other models showed increased AODs of various intensity over specific regions such as Iraqi plains, Rub-Al-Khali Desert, Nubian Desert in Sudan and in Oman Desert, while MODIS observations also revealed enhanced AODs due to dust plumes over these regions (Figure 2d). There are several factors that affect critical parameters for dust emissions such as surface heat flux [101], land use [102], topography [103] and surface viscosity properties [104]. On the other hand, pressure gradient [63], orography [51,105] and sea-breeze circulation [106] are the main factors controlling the variability of Shamal wind, which can lead to considerable errors in predicting dust emissions from Shamal dust storms, in case of inaccurate representation [42,107]. The model forecasts during this Shamal dust storm, as well as those shown in the rest cases (Figures S13 and S14, in the Supplementary Materials), indicated that accurate representation of temperature, pressure gradients, wind speed and direction is the most important and challenging issue in numerical predictions of Shamal dust storms.

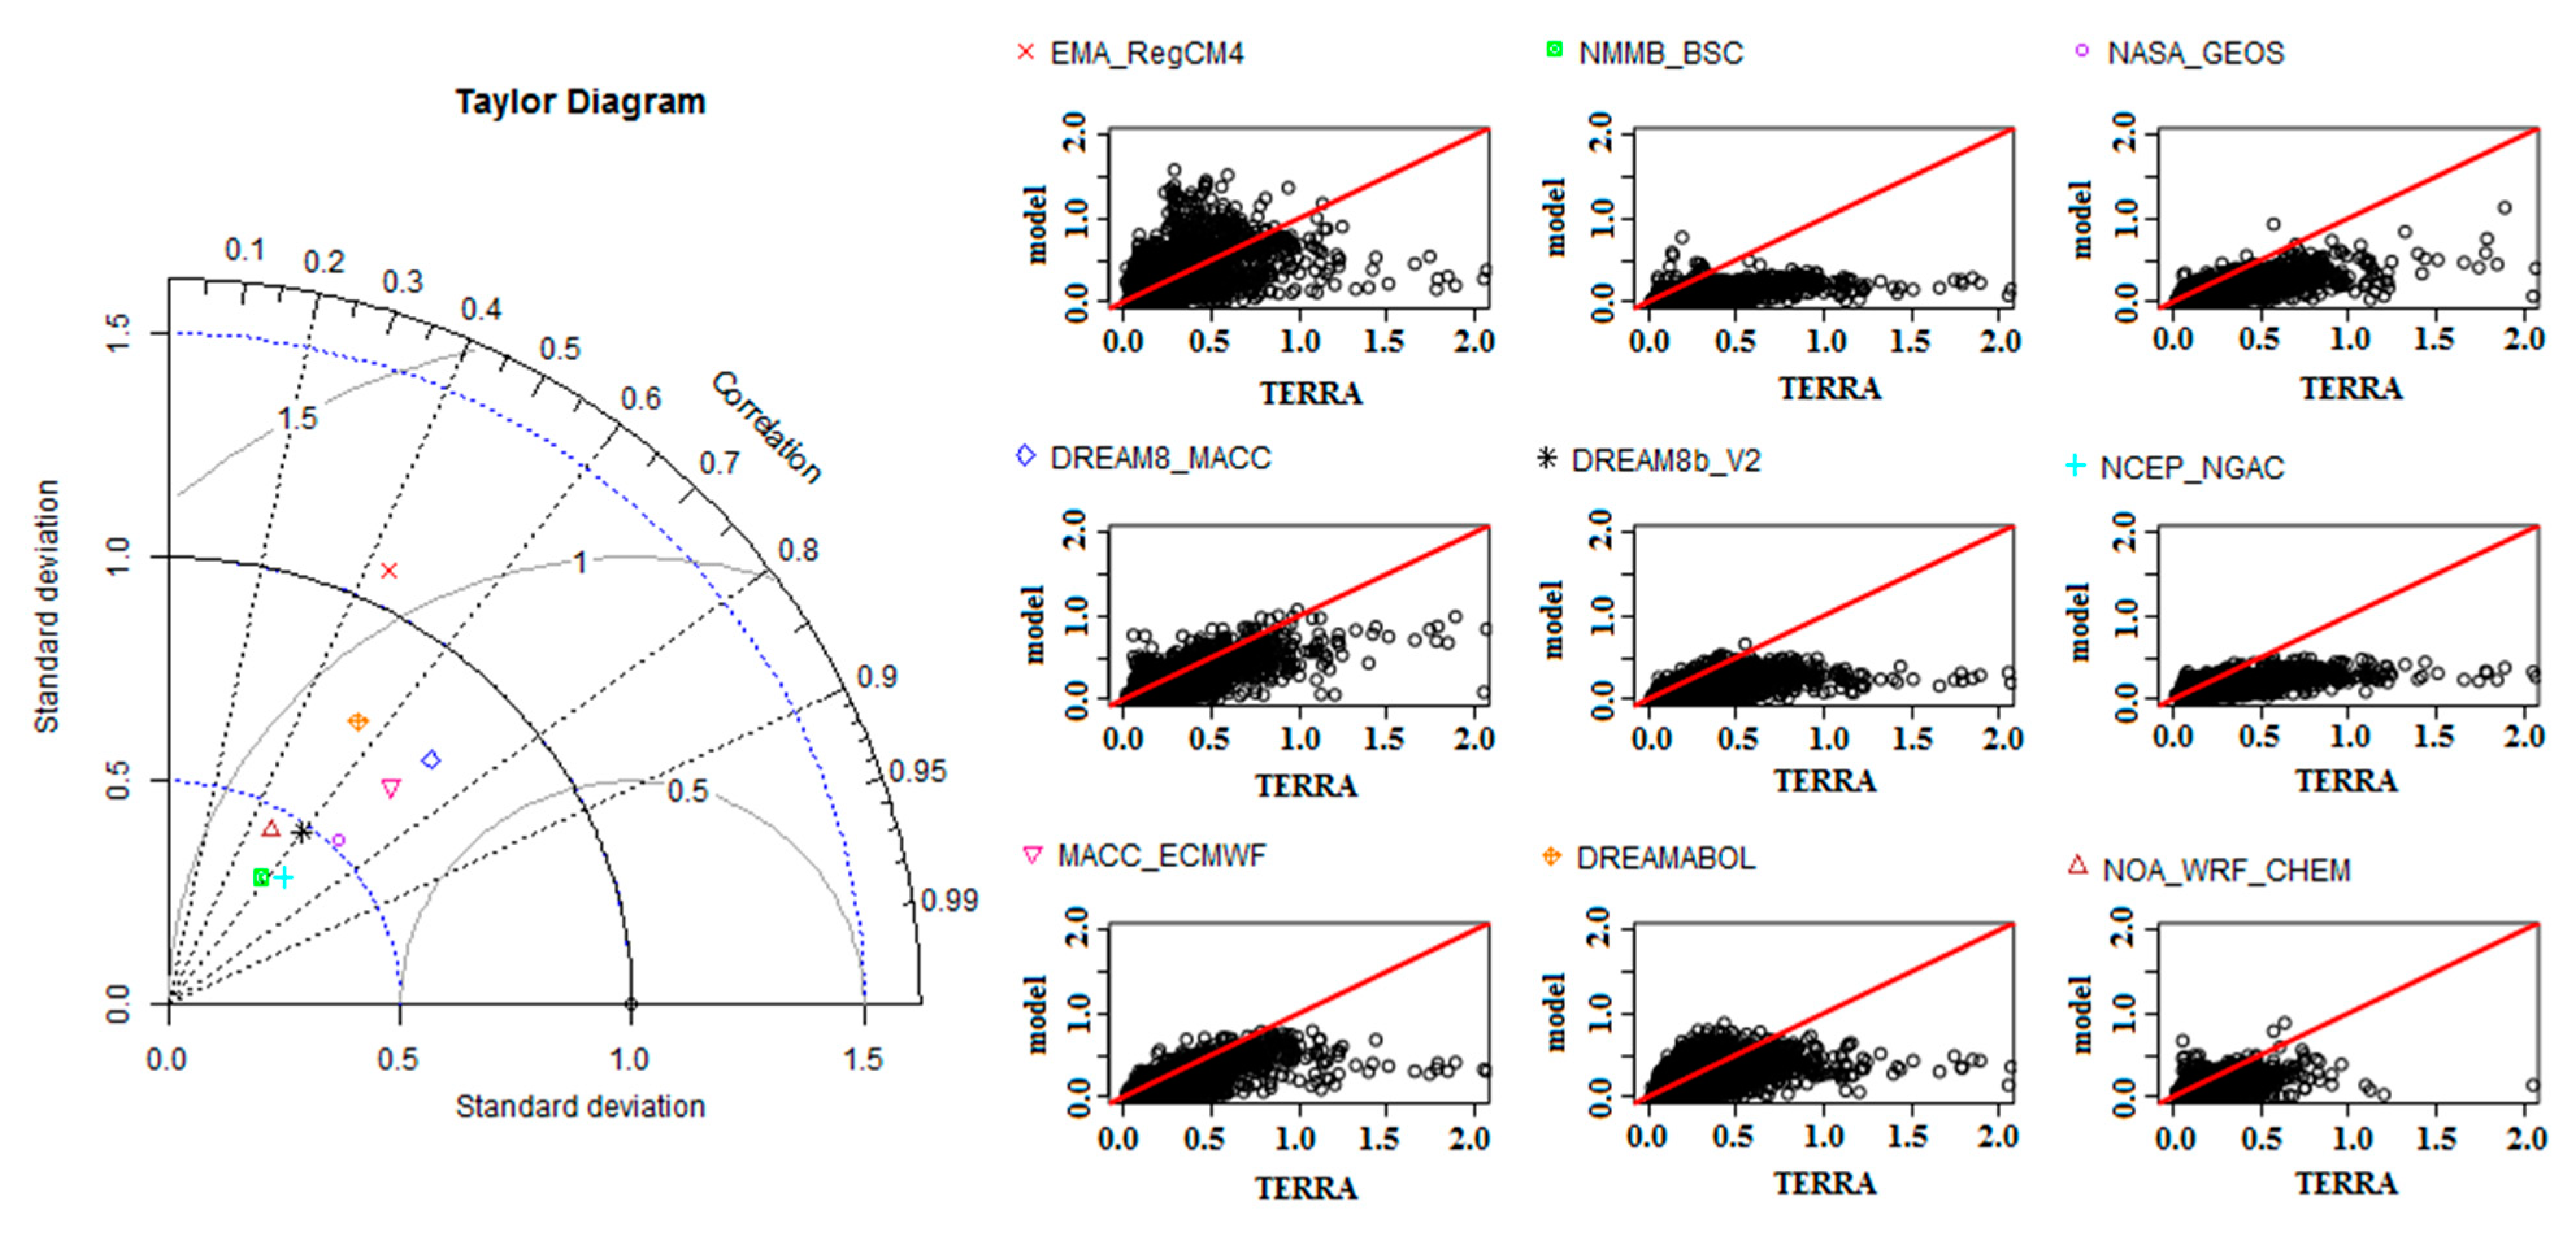
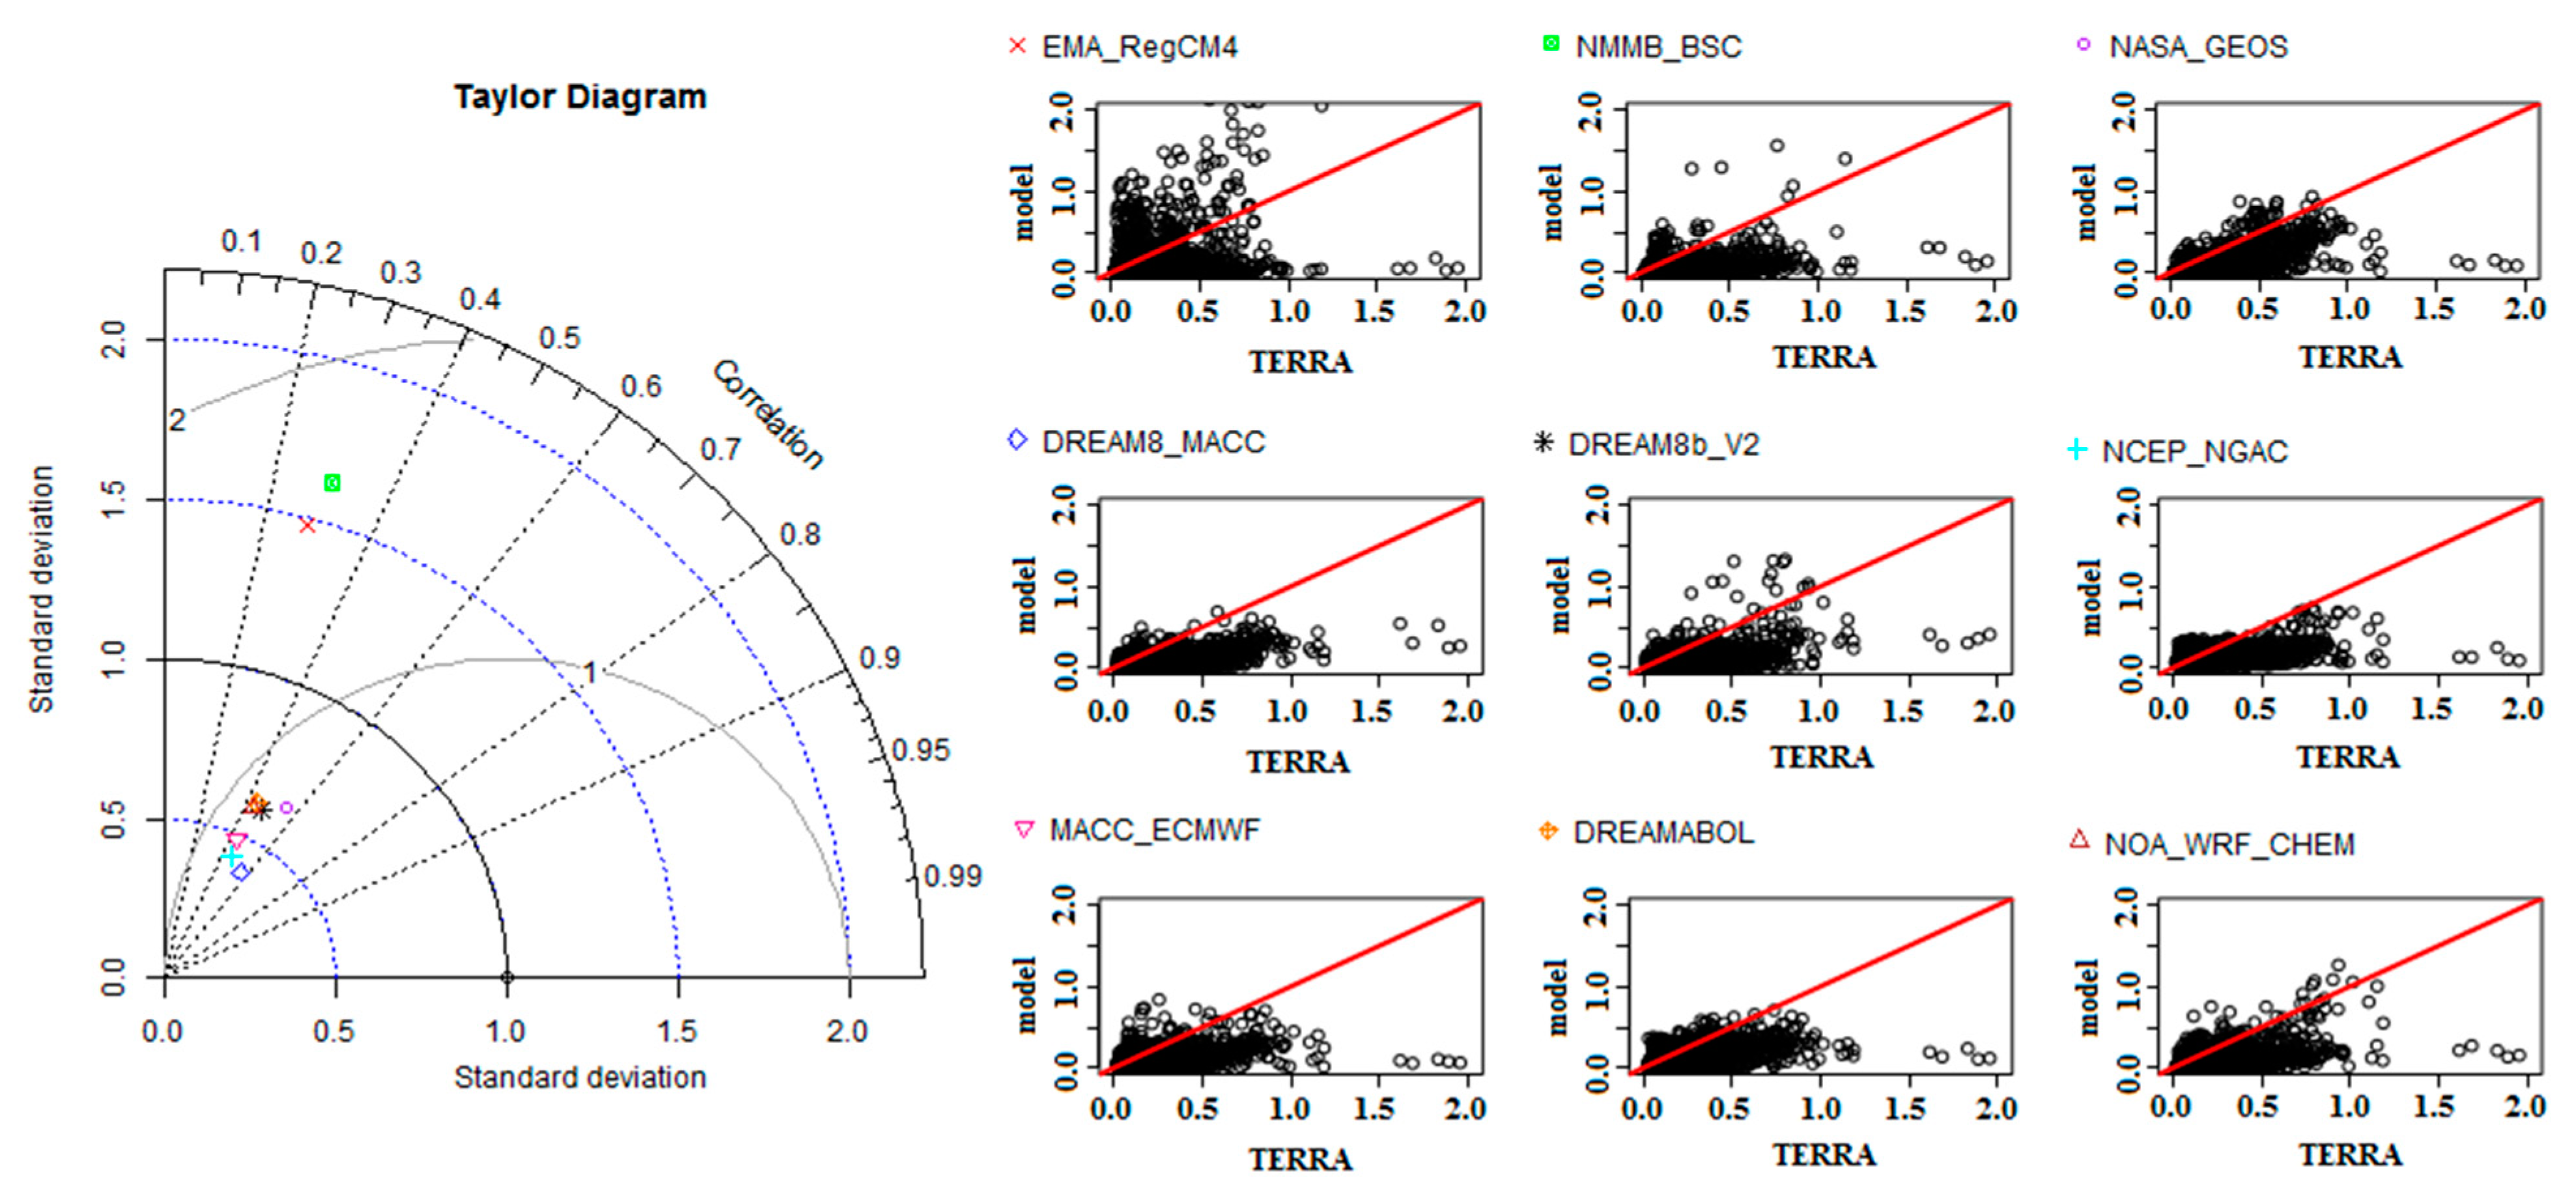
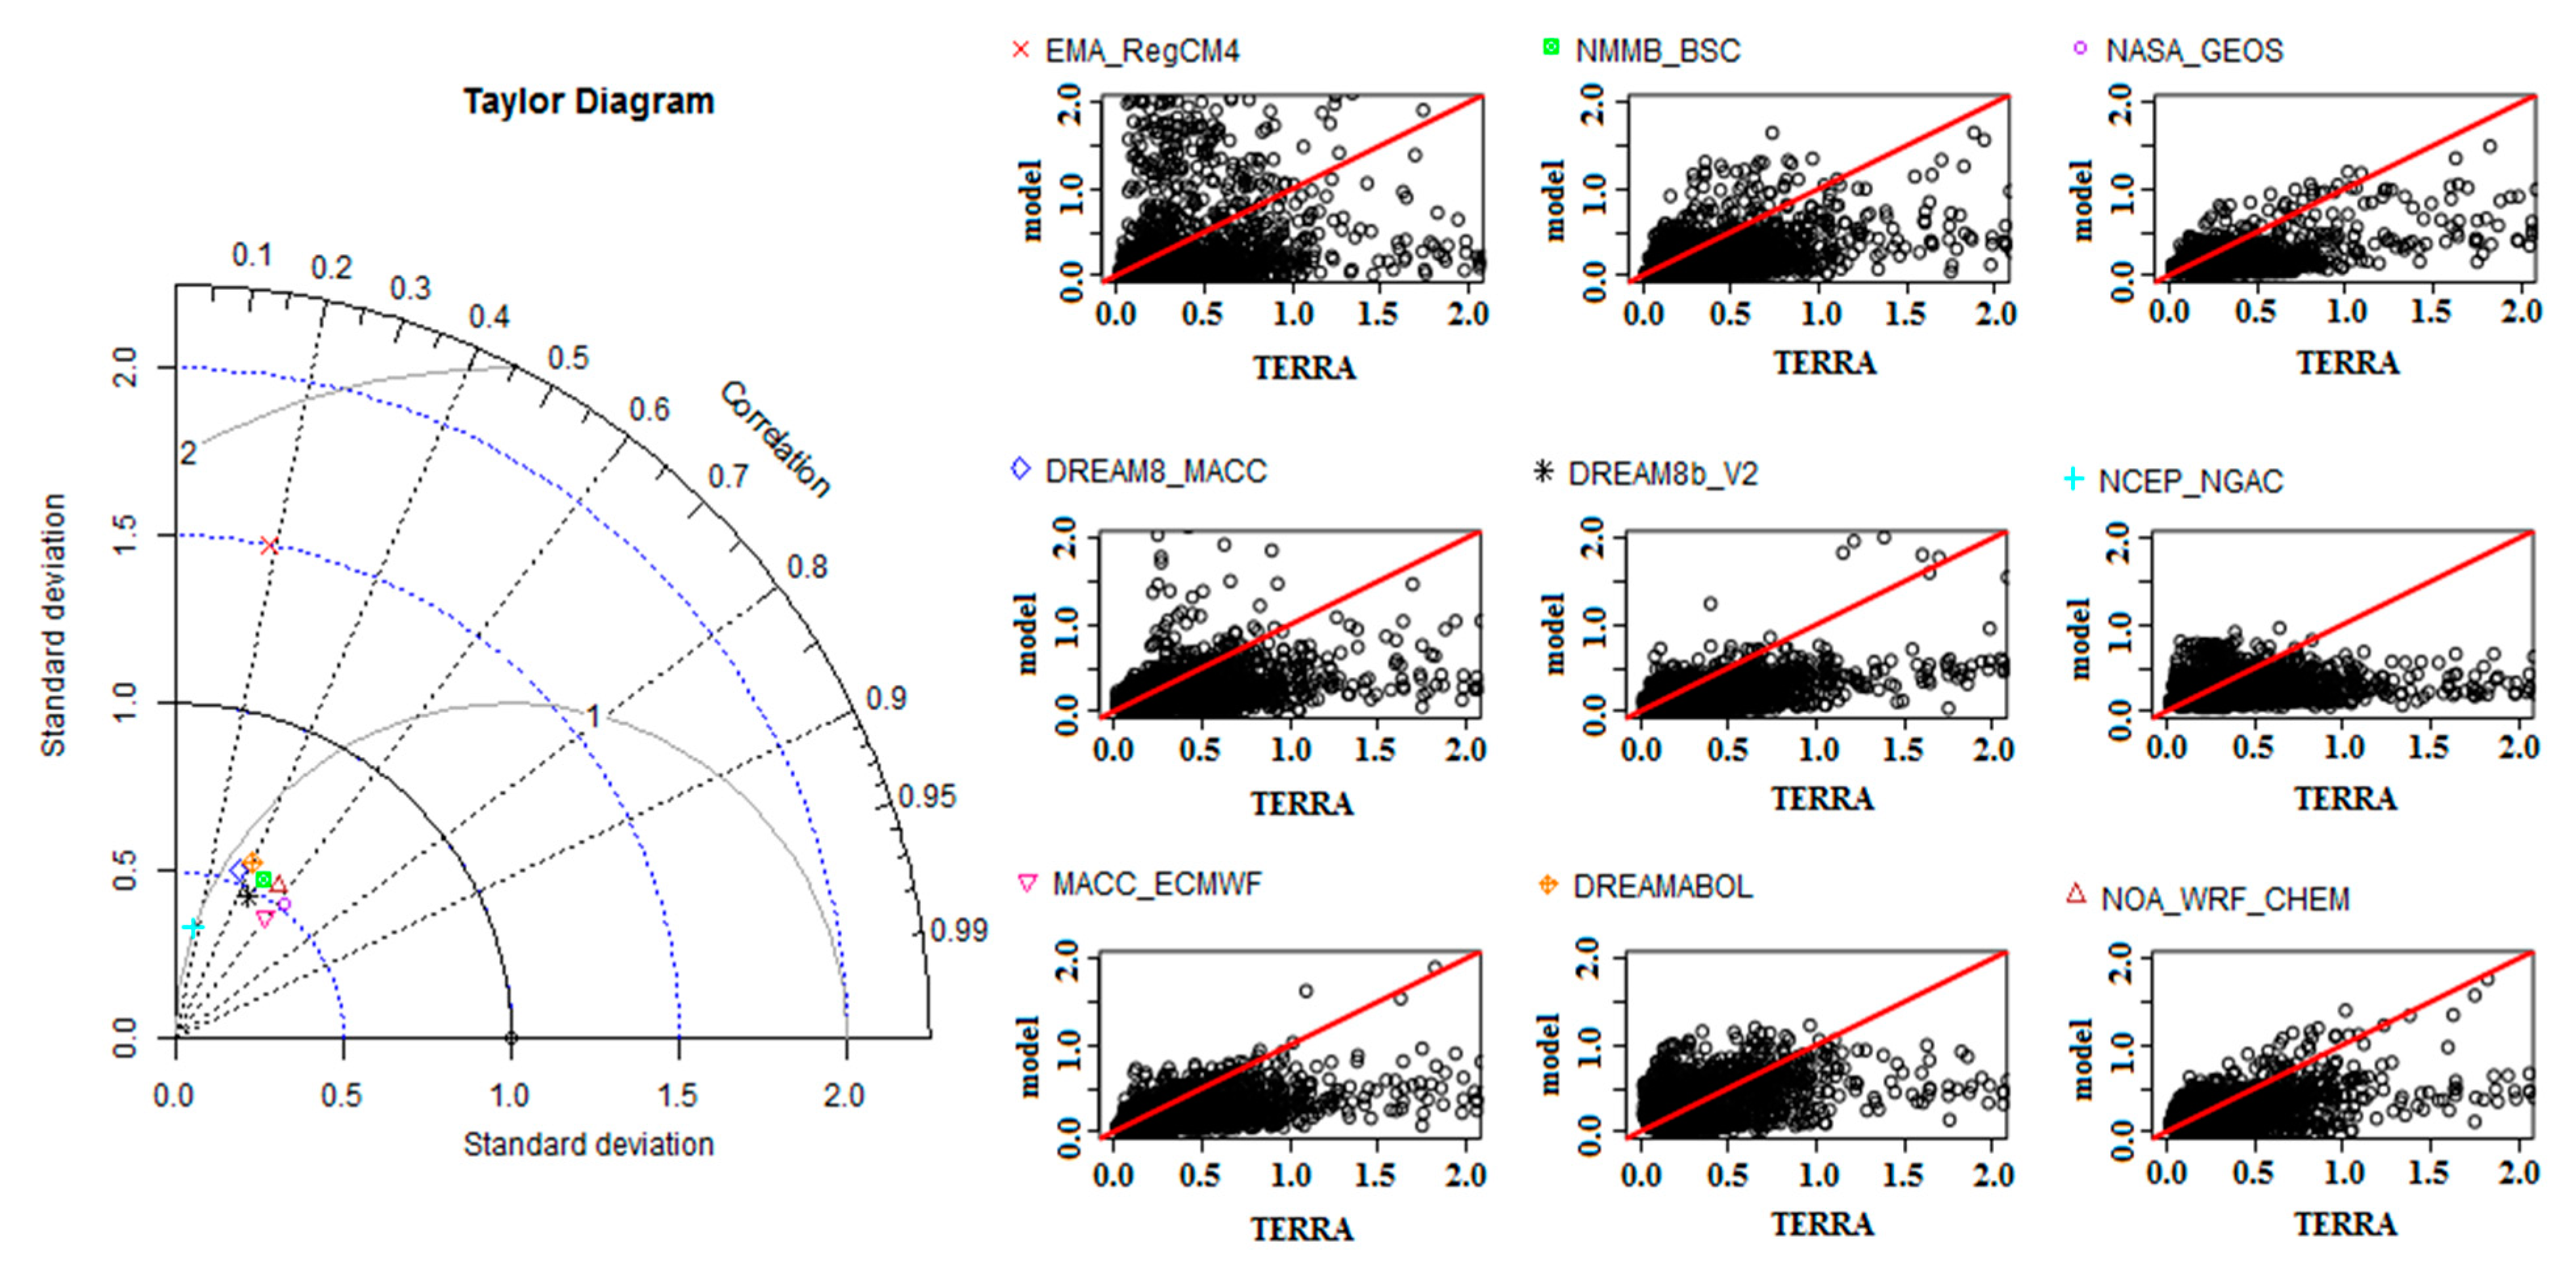
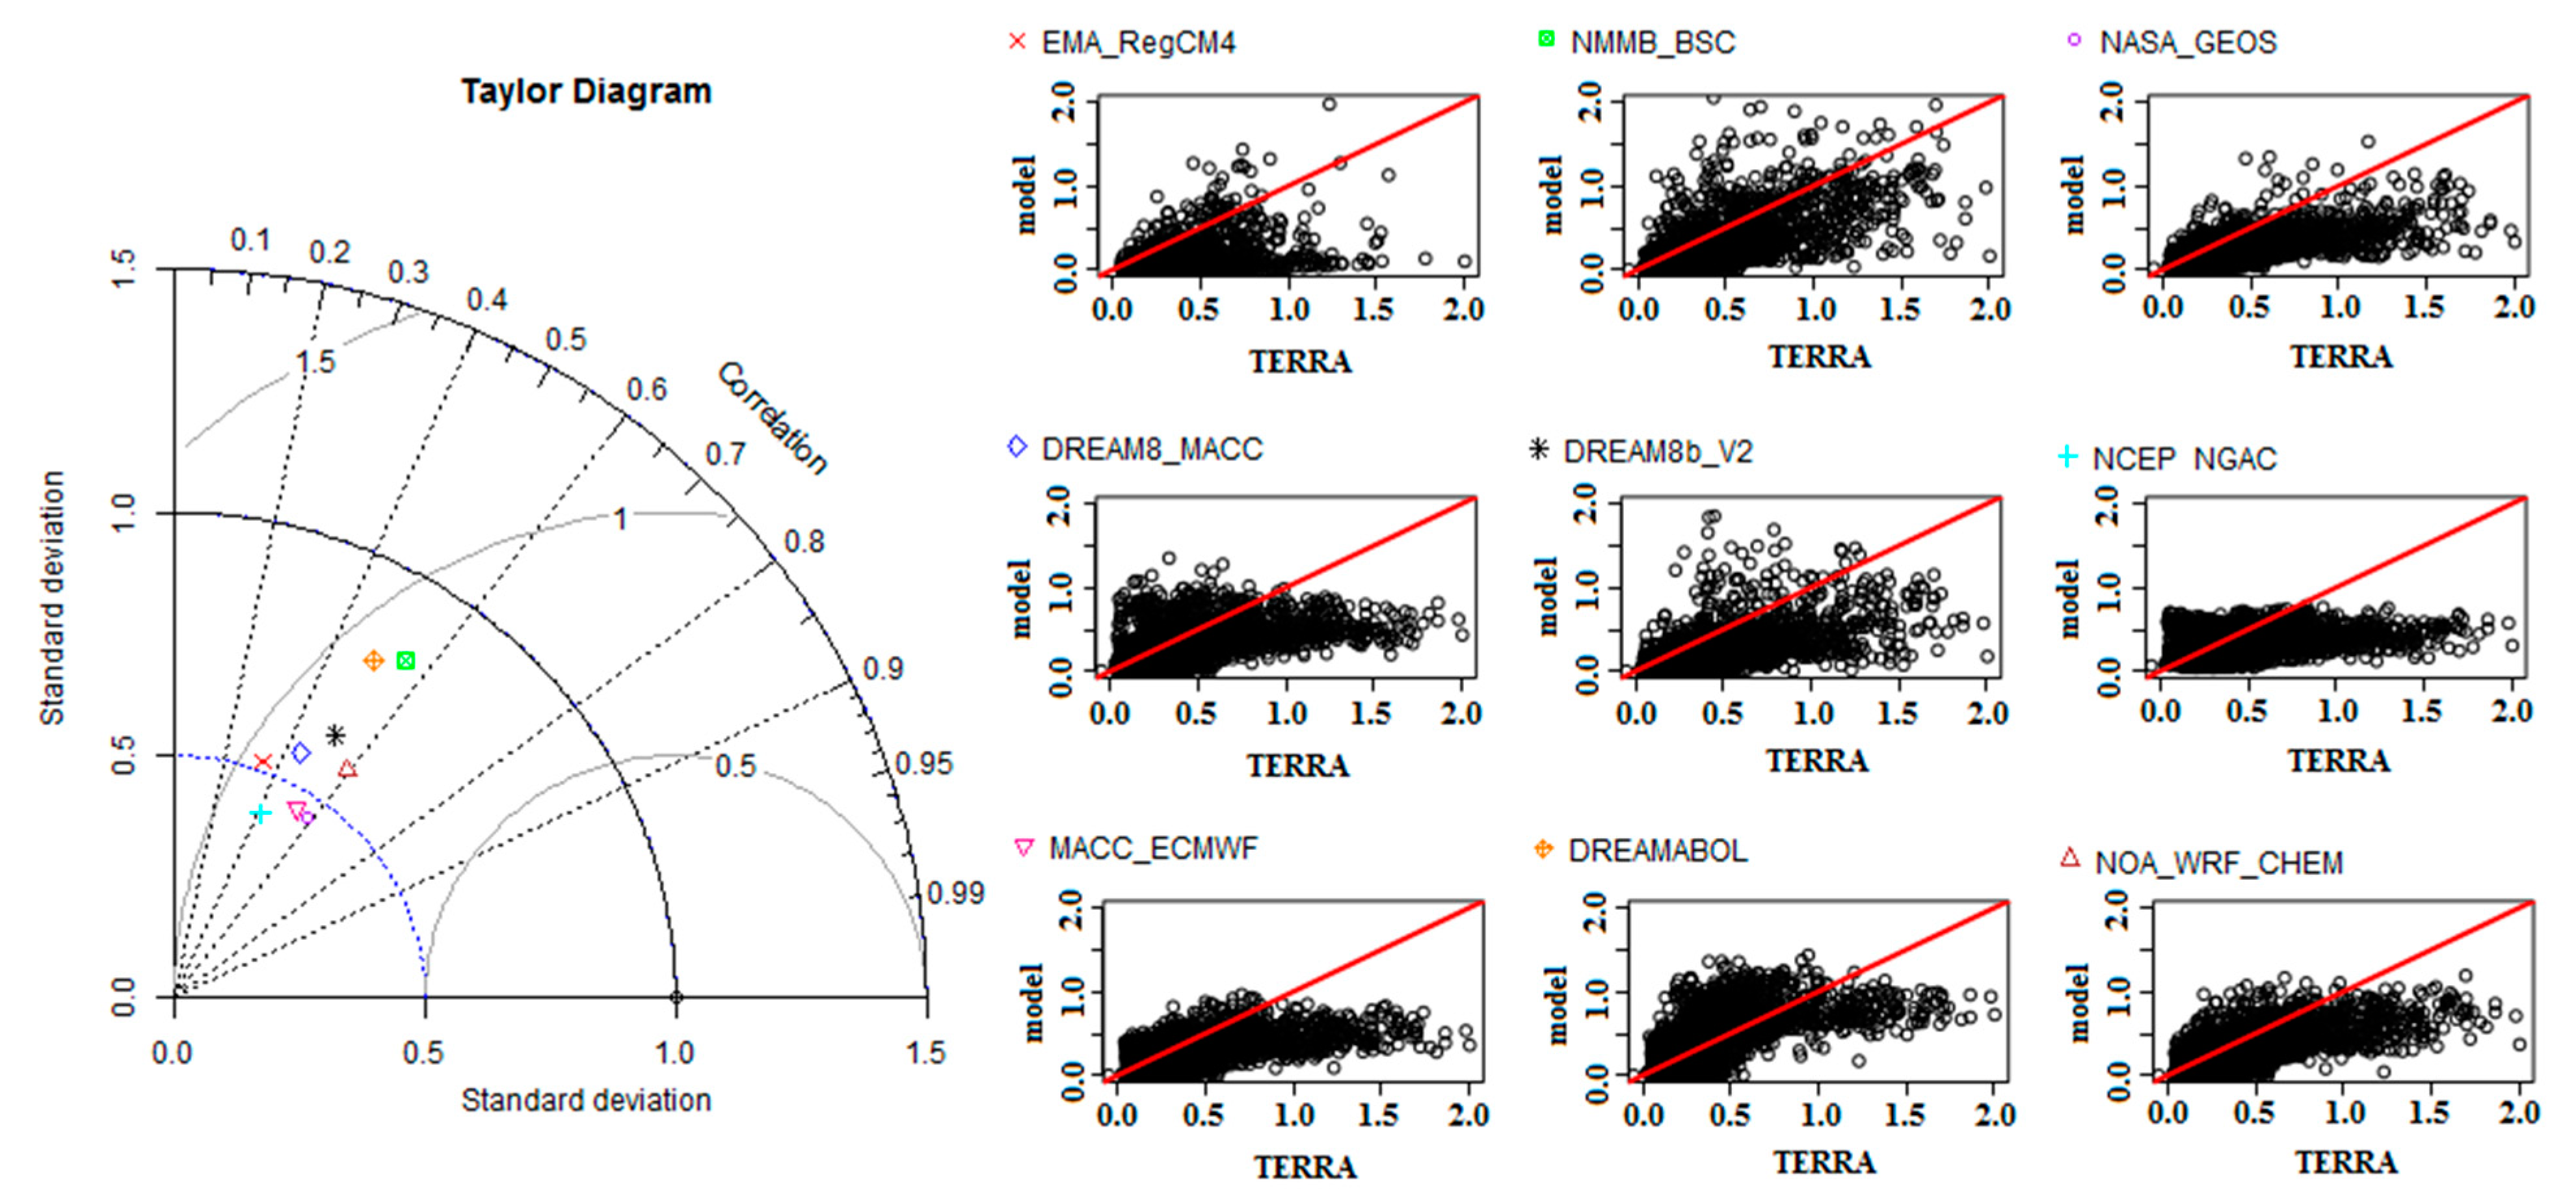
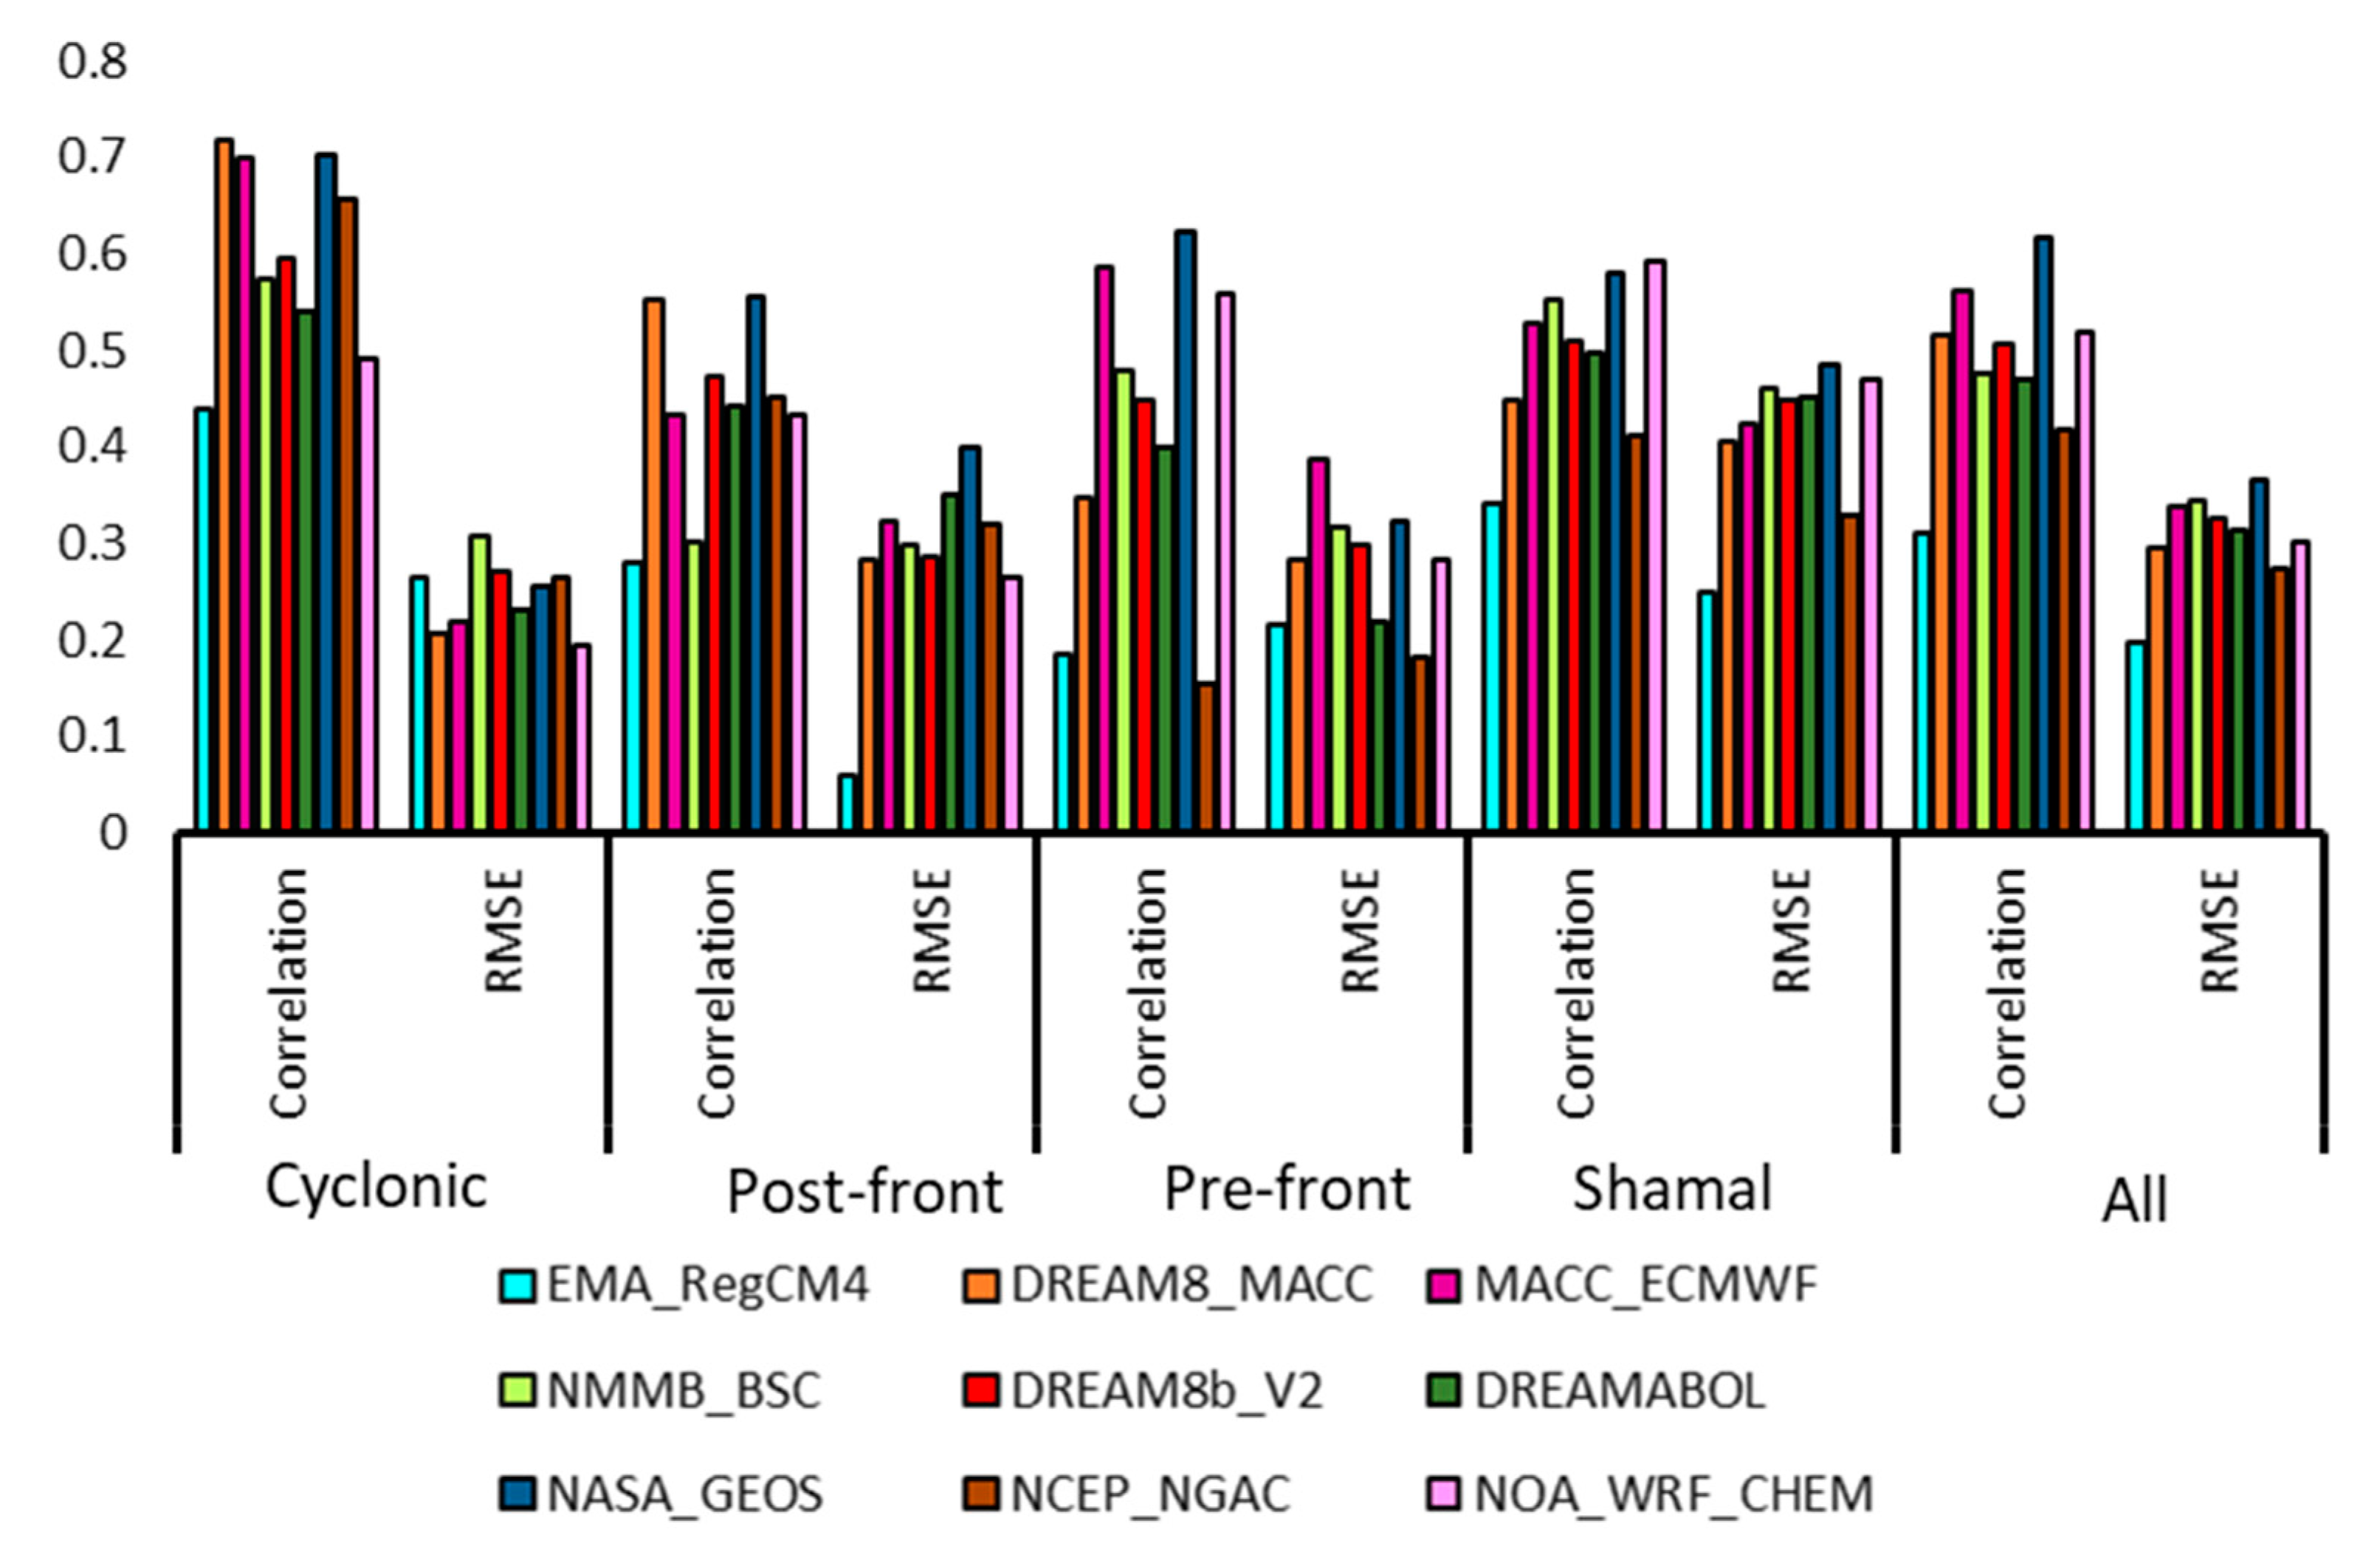
3.4. Model Evaluation

This section evaluates the models’ performance in forecasting the spatial AOD distributions against Terra-MODIS observations, including all 12 dust events over the Middle East (main text and Supplementary Materials). In this respect, the Taylor diagrams of Pearson correlation coefficient (r) and standard deviation, along with root mean square error (RMSE) values are used (Equation (1)):
RMSE = i = 1 N ( I m I c ) 2 N t ,
where Im and Ic are the measured (observed) and forecasted AODs, respectively and Nt is the total number of valid pixels in the studied model domain. Taylor diagram is used to determine the similarity between the modeled and observational data in the form of three statistical quantities: the Pearson correlation coefficient, the standard deviation and the root-mean-square error (RMSE). The Pearson correlation coefficient is associated with the azimuthal angle in the diagram; the standard deviation is related to the radial distance from the origin point and the RMSE is proportional to the distance from the observed point on the x-axis.
Figure 8 shows the scatter diagrams of AODs over the studied domain between model predictions and Terra-MODIS retrievals for the three cases of cyclonic dust storms. The results show that all models underestimated the AODs, and this difference increased with increasing AOD values, indicating less model performance near the dust source. Among the models, EMA_RegCM4 presents a high fraction of overestimated AODs compared to MODIS, while NMMB_BSC model systematically underestimated the MODIS-AODs. The DREAM8_MACC and NASA_GEOS models exhibited the largest r values (0.718, 0.703), while NOA-WRF-Chem exhibited the lowest RMSE value (Table 2; Figure 8). According to the Taylor diagram (Figure 8), the points related to these three models as well as MACC_ECMWF are closer to the observation point, indicating satisfactory performance in forecasting the examined cyclonic dust storms. The MACC and NASA-GEOS models assimilate MODIS AOD and generally provide satisfactory performance compared to other models. The closer the points to the diameter of the circle, the more accurate the model outputs. The point of the EMA_RegCM4 model is far beyond those of the other models, indicating a very different behavior in dust simulations, as shown in the AOD spatial distribution patterns (Figure 4).
Figure 9 shows the respective scatter plots and Taylor diagram for the model forecasts of post-frontal dust storms in the Middle East. The results show a rather similar model performance as in the previous cases, since EMA_RegCM4 exhibited a large possibility of AOD overestimation for the lower values, while NMMB_BSC highly underestimated the high AODs. Among the studied models, DREAM8_MACC and NASA_GEOS exhibited the highest r values (0.55), while NOA-WRF-Chem presented low RMSE (Table 2; Figure 9). The Taylor diagram shows that among the studied models, the DREAM8_MACC, NCEP_NGAC, MACC_ECMWF and NASA_GEOS outputs were closer to the MODIS observations.
The models’ evaluation for the pre-frontal dust storms (Figure 10) also shows that most of the models underestimated the MODIS AODs. The AOD outputs of DREAM8_MACC, NASA_GEOS and MACC_ECMWF models were more similar to MODIS, exhibiting higher r values due to MODIS data assimilation as mentioned above, while the NOA-WRF-Chem model performed also satisfactorily (Table 2; Figure 10). Based on the Taylor diagram, the outputs of all models, except EMA-RegCM4, were similar to each other, indicating a similar capability of the models for forecasting pre-frontal dust storms in the Middle East.
In the case of Shamal dust storms (Figure 11), the models exhibit different performances and a general underestimation for the high AODs. However, there is evidence that models are capable to forecast the synoptic conditions and pressure gradients that trigger the Shamal dust storms over the Middle East [45,107,108] than the frontal systems, which are fast-moving and the changing winds and temperatures are more difficult to be accurately represented [47]. The outputs of the NCEP_NGAC model were more uncertain compared to the other models and NMMB_BSC exhibited good performance (Figure 11). NASA_GEOS and NOA-WRF-Chem exhibit the highest r values (close to some other models), while NCEP_NGAC exhibited low RMSE (Table 2, Figure 11). The Taylor diagram for Shamal dust storms shows that NOA-WRF-Chem, NASA-GEOS and MACC-ECMWF outputs were closer to MODIS observations.
According to the combined results summarized in Table 2 and Figure 12, in general, the highest correlation coefficient is related mostly to NASA_GEOS and DREAM8_MACC models, both of which used MODIS data assimilation schemes (Appendix A). These results indicate that even though the model forecasts correspond to valid time more than 24 h after the initial time, the effect of data assimilation increases the accuracy of the forecasts. These two models also have a relatively high resolution compared to other examined models. NOA-WRF-Chem also presented satisfactory results with lower RMSE values compared to other models. Although the NCEP_NGAC model has finer resolution than MACC_ECMWF model, its outputs were less accurate. The various models exhibited higher correlation coefficients and lower RMSE values (Table 2, Figure 12) for the cyclonic dust storms compared to frontal dust storms. The larger inaccuracies in the predictions of the dust AODs during pre- and post-frontal dust storms may be explained by difficulties in accurate representation/forecasting of the frontal systems and the change of wind in the frontal areas, which triggers the dust storms. On the other hand, high RMSE values between the models were also found for the Shamal dust storms, which are likely attributed to the large coverage of the high dust-AODs during Shamal dust storms (Figure 2 and Figure S2). On the contrary, during cyclonic dust storms, the dust covers a relatively small area around the cyclonic center and its representation by the models was generally satisfactory, while a large part of the study domain was usually free of dust.
In general, the model forecasts for several dust events of different types and meteorological conditions over the Middle East revealed specific difficulties in representing the AOD over the dust source regions, which may be related to topography, surface and dynamic meteorological parameters [51,53]. Therefore, the source of the errors in dust forecasting models is very diverse including surface parameters such as soil texture, vegetation, land use and soil moisture, as well as atmospheric parameters such as wind, precipitation, and the instability associated with boundary layer related quantities. Furthermore, the relative coarse spatial resolution of the model AODs could explain the generally reduced level of verified performance of these numerical models, since especially over the complex topography of the Middle East, the finer model resolution increased the accuracy of the dust predictions [51,53,55]. On the other hand, since wind regime is an important factor for dust emissions and transportation, the accuracy in simulations of wind speed and direction in each model plays a major role in model performance [107,108,109]. Overall, the results show that there is not a single model that can be characterized as “better” or “more accurate” in all dust cases.
Finally, ground-based AOD data from 3 AERONET stations (Kuwait University, KAUST-campus and Masdar Institute), during the 12 examined dust storms revealed a satisfactory agreement with MODIS data (R2 = 0.75) collocated in time and space over these stations (Table 3). Model AOD forecasts over the AERONET stations, showed that DREAM8-MACC exhibited the highest R2 of 0.78, followed by NASA_GEOS model (R2 = 0.74) and MACC-ECMWF (R2 = 0.73), considering available data during the 12 dust events. These results agree with the model’s performance against MODIS observations, indicating the positive feedback of data assimilation in the forecasting process. On the other hand, the AOD forecasts from other models such as EMA-RegCM4 and NMMB-BSC highly departed from the AERONET measurements (Table 3), justifying the complexity of various parameters such as size distribution, in model AOD estimates [56].

4. Conclusions

This study analyzed four types of synoptic dust events over the Middle East region, including cyclonic, pre-frontal, post-frontal and Shamal dust storms. For each of these types, three intense and pervasive dust events were examined in view of meteorological dynamics and the capability of numerical models to forecast the spatial distribution of dust. True-color imagery and AOD retrievals from Terra-MODIS observations were analyzed over the region, in order to determine the dust sources and affected areas in each case study. Since various factors affect the outputs of the dust forecasting models, the performance of 9 operational dust models was qualitatively and quantitatively evaluated during these dust events in the Middle East.
The synoptic meteorological analysis showed the presence of low-pressure systems over parts of Iraq and Syria, in all three cases of cyclonic dust storms, along with cyclonic winds around them. The upward motion at the center of the low pressure caused dust emission. In pre-frontal and post-frontal dust storms, low-pressure systems associated with warm and cold fronts triggered the dust events. The change of wind direction and the rotation of isobars were signs of the presence of fronts in the area. The intersection of geopotential height contours and isotherms well showed the baroclinic area and thermal advection, which helped in the determination of the exact location of atmospheric fronts. In the three Shamal dust events, the thermal-low troughs entered parts of Iraq and Syria from the southeast, and associated with ridges of high-pressure systems dominated over the Mediterranean Sea, caused strong pressure gradients and lower-troposphere winds that initiated the dust storms.
The comparison of the models’ AOD outputs with Terra-MODIS AODs showed that all models had a relatively acceptable performance in forecasting the AOD patterns over the region. The studied models were able to forecast the higher AODs along the dust-affected areas, although most of them underestimated the values compared to MODIS, especially near the dust source areas with the maximum AODs. Regarding the frontal dust storms, it can be concluded that all models were able to represent the position of atmospheric fronts to some extent, but in most cases, they underestimated the large AODs around the fronts. This bias can be likely attributed to discrepancies in representing the wind intensity in the area or the amount of atmospheric moisture and wind profiles. By comparing the model outputs in all studied cases, it can be concluded that the models performed satisfactorily in forecasting the cyclonic dust storms. Examination of the Taylor diagrams showed that the performance of the models in forecasting the frontal dust storms was similar to each other except for the EMA-RegCM model, which exhibited large uncertainties. The highest correlation coefficients between the model outputs and the satellite AODs referred to cyclonic dust storms and BSC-DREAM8b-V2, DREAM8-MACC, MACC-ECMWF, NASA-GEOS, NCEP-NGAC and NMMB- BSC models, with r values of about 0.6–0.7. Regarding the other dust types, in most cases, the correlation coefficient was between 0.4 to 0.6, which can be considered acceptable. Although it is not possible to introduce a single model as the best for all the dust storms, it can be said that the outputs of the MACC and NASA-GEOS models that used MODIS data assimilation showed greater similarity with MODIS observations and AERONET measurements in most of the cases.
Accurate forecasting of dust phenomena, which is one of the main preconditions for the development of early warning systems, can highly reduce dust impacts. However, there are relatively large uncertainties between the outputs of different dust forecasting models that could be due to differences in their inputs, including statistical data related to the land surface such as topography, vegetation cover and soil texture, atmospheric data, initial and boundary conditions, as well as the use of data assimilation. Overall, this study revealed that various models are capable in forecasting dust storms of various types in the Middle East, although accurate representation of dust AODs remains a challenge. Using more accurate land surface data, better parameterization schemes, data assimilation and ensemble forecasting are some of the solutions to improve the outputs of dust forecasting models.

Supplementary Materials

The following are available online at https://0-www-mdpi-com.brum.beds.ac.uk/article/10.3390/geosciences11110458/s1, Figure S1: Terra-MODIS true color images on (a) 1 September 2015 (b) 29 September 2016, (c) 3 November 2017, (d) 8 January 2020, (e) 13 April 2017, (f) 14 March 2020, (g) 29 June 2018, (h) 26 July 2018, Figure S2: Terra-MODIS AOD550 retrievals over the Middle East on (a) 1 September 2015 (b) 29 September 2016, (c) 3 November 2017, (d) 8 January 2020, (e) 13 April 2017, (f) 14 March 2020, (g) 29 June 2018, (h) 26 July 2018, Figure S3: Mean sea level pressure (MSLP) with 10-m vector winds (a,d), geopotential heights and temperature at 850 hPa level (b,e) and geopotential heights at 500 hPa level (c,f) on 31 August 2015 at 00UTC (a–c) and 28 September 2016 at 00UTC (d–f), Figure S4: Mean sea level pressure (MSLP) with 10-m vector winds (a,d), geopotential heights and temperature at 850 hPa level (b,e) and geopotential heights at 500 hPa level (c,f) on 2 November 2017 at 12UTC (a–c) and 8 January 2020 at 12UTC (d–f), Figure S5: Mean sea level pressure (MSLP) with 10-m vector winds (a,d), geopotential heights and temperature at 850 hPa level (b,e) and geopotential heights at 500 hPa level (c,f) on 13 April 2017 at 12UTC (a–c) and 13 March 2020 at 12UTC (d–f), Figure S6: Mean sea level pressure (MSLP) with 10-m vector winds (a,d), geopotential heights and temperature at 850hPa level (b,e) and geopotential heights at 500 hPa level (c,f) on 29 June 2018 at 12UTC (a–c) and 26 July 2018 at 12UTC (d–f), Figure S7: Spatial distribution of AOD retrieved from eight dust forecast models on 1 November 2015, Figure S8: Spatial distribution of AOD retrieved from nine dust forecast models on 29 September 2016, Figure S9: Spatial distribution of AOD retrieved from nine dust forecast models on 3 November 2017, Figure S10: Spatial distribution of AOD retrieved from eight dust forecast models on 8 January 2020, Figure S11: Spatial distribution of AOD retrieved from eight dust forecast models on 13 April 2017, Figure S12: Spatial distribution of AOD retrieved from seven dust forecast models on 14 March 2020, Figure S13: Spatial distribution of AOD retrieved from eight dust forecast models on 29 June 2018, Figure S14: Spatial distribution of AOD retrieved from eight dust forecast models on 26 July 2018.

Author Contributions

Conceptualization, S.K. and D.G.K.; methodology, S.K. and D.G.K.; software, S.K., A.R.; validation, S.K., D.G.K. and M.R.; formal analysis, S.K., S.S.K., A.R. and D.G.K.; investigation, S.K., A.R. and D.G.K.; resources, S.K., A.R. and D.G.K.; data curation, S.K.; writing—original draft preparation, S.K.; writing—review and editing, D.G.K., S.S.K. and A.R.; visualization, S.K., A.R. and D.G.K.; supervision, D.G.K. and S.S.K.; project administration, S.K., S.S.K. and D.G.K. All authors have read and agreed to the published version of the manuscript.

Funding

This research received no external funding.

Data Availability Statement

Data sets supporting reported results are: MODIS True color images from https://worldview.earthdata.nasa.gov/, accessed on 15 April 2021, MODIS AOD via Giovanni (https://giovanni.sci.gsfc.nasa.gov/giovanni/, accessed on 15 April 2021). Dust model outputs from the Sand and Dust Storm Warning Advisory and Assessment System (SDS-WAS; https://sds-was.aemet.es, accessed on 12–14 April 2021). GFS data from NCEP/NOAA.

Acknowledgments

The GFS and NCEP/NCAR reanalysis teams are gratefully acknowledged for providing the meteorological maps. We are also thankful for MODIS AOD retrievals via Giovanni (https://giovanni.sci.gsfc.nasa.gov/giovanni/, accessed on 15 April 2021). All models outputs were taken from the Sand and Dust Storm Warning Advisory and Assessment System (SDS-WAS; https://sds-was.aemet.es, accessed on 15 April 2021). D.G.K. acknowledges the support of the project “PANhellenic infrastructure for Atmospheric Composition and climatE change” PANACEA (MIS 5021516), funded by the Operational Program “Competitiveness, Entrepreneurship and Innovation” (NSRF 2014–2020) and co-financed by Greece and the European Union. A.R acknowledges support by Iran National Science Foundation (INSF) under project No 99003984.

Conflicts of Interest

The authors declare no conflict of interest.

Appendix A

Table A1. Some specifications of the used operational dust forecasting models.
ModelBSC-DREAM8b-V2DREAM8-MACCDREAMABOLEMA-RegCM4MACC-ECMWFNASA-GEOSNCEP-NGACNMMB-BSCNOA-WRF-Chem
Reference[71,109][25][73][74][75][76][77][78][79]
Meteorological driverEta/NCEPNMMEBOLAMRegCM4ECMWFGEOS-5NEMS
GFS
NMMB/
NCEP
WRF
Meteorological initial conditionNCEP/GFSECMWFNCEP (GFS)NCEP/GFSECMWF/IFSGEOS-5
Atmospheric Data
Assimilation System
NCEP
GDAS
NCEP/GFSGFS
Emission scheme[25,110,111][25,110,111][25,110][74,85,112][27,75,113][27][27][25,85,111,114]GOCART [27]
Horizontal resolution 1 3 ° × 1 3 ° 1 3 ° × 1 3 ° 0.4 ° × 0.4 ° 45 × 45 k m 8–10 km 0.25 ° × 0.31 ° 1 ° × 1 ° 1 3 ° × 1 3 ° 0.19 ° × 0.22 °
Data AssimilationNoNoNoNoYes
AOD550/MODIS
Yes
MODIS
NoNoNo

Appendix A.1. BSC-DREAM8b-V2

This model solves the Euler-type partial differential non-linear equation for dust mass continuity, and it is embedded as one of the prognostic equations in the NCEP/Eta atmospheric model. In the operational model, the dust emission scheme calculates the vertical dust flux F k according to Shao et al. [110] for each particle size bin k is calculated with Equation (A1).
F k = C · S · β k · u * 3 [ 1 ( u * tk u * ) 2 ] ,   for   u * >   u * tk
where C is a constant, u * is the friction velocity, u * t is the threshold friction velocity (all in ms−1), S is the source function, β k   represents the mass fraction of bin k in the soil. DREAM considers a viscous sublayer between the surface and the lowest atmospheric model layer [111]. The model includes a simple wet scavenging scheme with a constant washout ratio [25]. Dry deposition velocity is a function of particle size [115]. The Dry deposition scheme includes deposition by turbulent and Brownian diffusion, gravitational settling and it considers the surface roughness elements.
In DREAM, the source function S is calculated by remapping of the arid and semi-arid categories with 10min resolution to the regional model domain. For soil texture, the FAO/UNESCO soil units with 4-km resolution is used and for each class, the fractions of clay, small silt, large silt and sand are calculated by the soil texture triangle [116].
The AOD is calculated with the Equation (A2)
AOD ( λ ) = k = 1 8 AOD k ( λ ) = k = 1 8 3 4 ρ k r k M k Q ext ( λ ) k
where ρ k is the mass density, r k is the effective radius, M k is the mass loading and Q ext ( λ ) k is the extinction factor at wavelength λ estimated by Mie scattering theory for each size bin k.

Appendix A.2. DREAM8-MACC

In this model the dust surface flux is estimated by Equation (A3) based on wind tunnel experiment [110].
F S = const   ×   u * 3 [ 1 ( u * t u * ) 2 ] ,   for   u * >   u * t
This equation is used as a basis to develop the dust emission scheme used in DREAM model. The dust emission factor is defined as Equation (A4).
δ k = α γ k β k
Here the subscript k represents particle size categories. The impact of soil texture is considered in surface vertical flux with α, β and γ (for more information about these coefficients please see Table 1, Table 2 and Table 3 and Equation 4 in Nickovic et al. [25]).
Finally, the vertical dust flux is defined as Equation (A5).
F Sk EFF = δ k F S

Appendix A.3. DREAMABOL

The DREAMABOL model is an online regional dust model developed at the Institute of Atmospheric Sciences and Climate, Bologna, Italy, as part of BOLCHEM model [117,118]. The atmospheric component is the BOLAM hydrostatic model [119]. The dust forecast is required for the air quality models since the dust particles affect the ozone formation, change the atmospheric radiation budget and contribute substantially to the total aerosol mass usually employed in developing the EU regulations. The dust model part is based on DREAM [25] but is rewritten and has differences in the model source.

Appendix A.4. EMA-RegCM4

In this model the horizontal flux for each saltating particle of size D p is calculated by Equation (A6).
dH F ( D p ) = E   ·   ρ a g   ·   u * 3 · ( 1 + R ( D p ) )   · ( 1 R 2 ( D p ) )   ·   dS rel ( D p )
where E is the ratio of erodible to total surface; dS rel ( D p ) is the relative surface of soil particles of diameter D p to the total surface aggregates. R ( D p ) is the ratio of the threshold u * t to the friction velocity u * , calculated in each grid cell. The total horizontal flux is then obtained by the integration of Equation (A6) over D p .
The emission of each soil aggregate of diameter D p depends on its kinetic energy. The flux of kinetic energy dF kin ( D p ) is proportional to the horizontal flux [112] according to Equation (A7).
dF kin ( D p ) = β   ·   dH F ( D p )
with β = 16,300   cm / s 2 and H F ( D p ) is calculated by Equation (A6).
The vertical flux of dust particle number of size D p in mode i is determined by Equation (A8).
dN i ( D p ) = dF kin ( D p ) ·   p i ( D p ) / e i
where e i is a binding energy of the emission mode i and p i ( D p ) is a fraction of the saltating aggregate kinetic energy consumed to emit the ith mode. p i ( D p ) is given by comparing the kinetic energy of aggregate e c ( D p ) (Equation A9) to the binding energy of ith mode e c as stated by Alfaro and Gomes [112].
e c ( D p ) = ρ p · ( π / 12 ) · ( D p ) 3 · ( 20 · u * ) 2
The mass emission flux of each mode is calculated by Equation (A10).
F dust , i ( D p ) = ( π / 6 ) ·   ρ p ·   D i 3 ·   N i
where N i is calculated by the integration of Equation (A8) over the all soil aggregate sizes and D i is the median diameter of mode i. In the operation three dust emission modes are considered with 12 discrete sub-bins.

Appendix A.5. MACC-ECMWF

For considering dust in ECMWF model, the dust flux is calculated according to Ginoux et al. [27] in source areas by Equation (A11). The source areas are identified as snow-free land with minimum of 10% bare soil, and the soil moisture below the wilting point.
F i ( u 10 ) = { S u 10 2 ( u 10 u t ) i f     u 10 > u t 0 otherwise
where u t is threshold wind speed which depends on soil moisture and particle size and S is the source function and equals to 2 × 10 11   kg   s 2   m 5 . Here, S depends on wind speed at 10-m level, vegetation cover, soil moisture and snow cover and is independent of the soil morphology. In this respect, it is different from Marticorena and Bergametti [85].

Appendix A.6. NASA-GEOS

In this model the dust emission is calculated according to Ginoux et al. [27]. The potential dust sources are identified based on topographic depressions. Dust emission from each grid box at each time step is computed by Equation (A12).
E i , j = S r   · C   ·   S i , j   · u i , j 2 ( u i , j u t )   if   u i , j > u t
where S i , j is potential efficiency of the grid box i,j to be a dust source and u i , j is 10-m wind speed. u t   is threshold wind speed which depends on particle size and soil moisture. S r is fraction of dust particles at each size bin according to Colarco et al. [120]. This model discretizes the dust particle size distribution into eight size bins with 0.1–10 µm radius. Since a constant distribution is assumed for silt particles (1 μm < r < 10 μm), for each size bin in this range S r = 0.25 . The clay-sized particle mass (radius < 1 µm) is assumed that to be 10% of the silt mass and S r is determined based on Tegen and Lacis [121], for all four bins in this range. C is a tuning constant with C = 0.35 µg s2 m−5. After emission dust particles transport by advection, turbulence and convection. Dust is removed by sedimentation, turbulent dry deposition and wet removal. The sedimentation fall speed is calculated by Stokes’ law for each size bin and considers the effects of low Reynold’s number [122]. This formula just considers spherical particles. Dry deposition after Wesely and Lesht [123] accounts for sedimentation, surface type, and meteorological conditions.
Wet removal parameterizes in-cloud scavenging based on rainfall rate and below-cloud scavenging based on precipitation fluxes and scavenging in convective situations as a function of the upward mass flux [124]. Here, as with some previous studies (e.g., [120]) the scavenging efficiency for dust is equal to 0.3 while it is 1.0 for the sea-salt aerosols.
To calculate optical properties of each size bin dust particles it is assumed that for the distribution of particles the relation of d(Mass)/d(lnr) = constant is true [121]. Assuming the particles are spherical and considering a constant density for each size bin, the relation of d(Number)/dr∼r −4 is obtained. Mie scattering theory [125] is applied for dust particles as other aerosol species.

Appendix A.7. NCEP-NGAC

NEMS GFS Aerosol Component (NGAC) is a global online aerosol forecast system. The atmospheric component of the NGAC is the Global Forecast System (GFS) and the aerosol component of the NGAC is Goddard Chemistry Aerosol Radiation and Transport Model (GOCART). The GOCART model was developed to forecast atmospheric aerosols (including sulfate, black carbon (BC), organic carbon (OC), dust, and sea salt), CO, and sulfur gases. The interfaces coupling GOCART and NEMS GFS have been separated to coupler components. Coupler components are developed to transfer the data between NEMS GFS and GOCART. GOCART is included in NEMS GFS as a column process such as ozone. It updates 3-D aerosol concentration after physic and dynamic components at the same grid and is fully coupled with them at every time step.
The global scaling constant for dust emissions [27] has been changed from C = 0.375 µg s2 m−5 in GEOS to C = 1 µg s2 m−5 in NGAC because of some differences in meteorology and resolution. sensitivity experiments make this adjustment Such a way that NGAC model calculates dust emission budget comparable to GEOS.

Appendix A.8. NMMB-BSC

Dream is a model for forecasting dust in the atmosphere. It is embedded in the NCEP/Eta atmospheric model as a prognostic equation and solves mass continuity equation. The atmospheric dust cycle is completely considered in the model. The surface dust fluxes are calculated in each grid cell during the model implementation. After entrance of dust particles into the atmosphere, dust particles are transported by some atmospheric variables. In the early phase, when dust is injected to the upper levels from surface, turbulence is very important. In the latter phase, wind transport dust particles away from the sources. Finally, some thermodynamic processes and rainfall of atmospheric model output in addition to landcover affect dry and wet deposition of dust. One of the most important parts of dust models is emission. The error in estimating dust production leads to many errors in all other processes in the dust cycle. So, the parametrization of dust emission is very important phase in the dust model development. In DREAM model soil type, vegetation cover, soil moisture and atmospheric turbulence are considered in the wind erosion parametrization.
Land cover is used to identify the dust source areas and soil texture is important to determine dust particle size parameters. In the model, for each soil texture class four particle size classes (clay, small silt, large silt and sand) with radius of 0.73, 6.1,18, and 38 μm are estimated. only the first two dust classes are responsible for synoptic transport of dust because their life time is more than 12 h.
In the new version of DREAM model dust is considered as radiatively active with both short and long wave radiation. In order to estimate radiation effects of dust particles, a radiative transfer scheme which includes aerosols is embedded into NCEP/Eta atmospheric model.
In the new model version, dust is treated as a radiatively active substance interacting with both short and long-wave radiation. Within every model time step both aerosol and atmospheric fields are updated due to their mutual influences. In order to couple dust and radiation processes, a radiative transfer model including aerosol effects developed at the Goddard Climate and Radiation Branch has been implemented into the NCEP/Eta atmospheric model replacing the current Geophysical Fluid Dynamics Laboratory radiation package.
For each atmospheric layer and spectral band (Δλ) the mean optical thickness (τ), single scattering albedo (w) and asymmetry factor (g) are calculated by Equations (A13)–(A15), respectively.
τ ( Δ λ ) = k = 1 8 τ k ( Δ λ ) = 1 8 3 4 ρ k r k M k Q ext ( Δ λ ) k
w ( Δ λ ) = k = 1 8 w k ( Δ λ ) τ k ( Δ λ ) k = 1 8 τ k ( Δ λ )
g ( Δ λ ) = k = 1 8 g k ( Δ λ ) w k ( Δ λ ) τ k ( Δ λ ) k = 1 8 τ k ( Δ λ ) w k ( Δ λ )
where ρ is the particle mass density, r is the effective radius, M is the layer mass loading, and Q ext is the extinction efficiency in that spectral band for each size bin k.

Appendix A.9. NOA-WRF-Chem

WRF-Chem model is the fully atmospheric/chemistry model that the air quality part is completely consistent with atmospheric part. Both of them use the same grid with the same horizontal and vertical resolution and the same time step. So, there is no need to spatial and temporal interpolation. Furthermore, the physics schemes used by chemistry and atmospheric components are the same. There are different modules in chemistry package such as different mineral dust emission schemes, biogenic emission, aerosol module, chemical mechanism, photolysis scheme and dry and wet deposition.
The GOCART-WRF dust emission scheme is based on the GOCART scheme after Ginoux et al. [27], some important modifications are done in WRF-Chem related to original GOCART. The scheme has been changed from its original version several times. The most important modification is changing the threshold wind velocity equation in such a way that includes soil moisture.
In the original GOCART the dust flux for each bin is calculated by Equation (A16).
F p = { C S s p U 2 ( U U t ( D p , θ s ) ) i f   U > U t ( D p , θ s ) 0 i f   U U t ( D p , θ s )
where C is a dimensional constant set to 10−6 g s2 m−5 (in the WRF-Chem model the unit of kg s2 m−5 change the value to order 10−9), S is a dust source function, s p is the mass fraction of dust can emit from the soil classes (sand, silt, or clay) of size p at the surface, U is 10m horizontal wind speed, and U t ( D p , θ s ) is the threshold wind speed required for starting emission.
In the original scheme, threshold wind speed for dry soil, U t ( D p ) , is determined by Equation (A17).
U t ( D p ) = A ρ p ρ a ρ a gD p
where A = 6.5 is a dimensionless parameter, ρ p , ρ a are the density of particle and air, respectively, g is gravitational acceleration and D p is the particle diameter [27]. This original GOCART scheme has been changed to use soil moisture in calculating threshold wind speed and if the soil moisture is above 0.5 the emission won’t happen. The adjusted threshold wind speed is estimated for dry soil at first and then is determined for soil surface with different degree of saturation (Equation (A18)).
U t ( D p , θ s ) = { U t ( D p ) × ( 1.2 + 0.2 log 10 θ s ) i f   θ s < 0.5 i f   θ s 0.5  
The correction factor based on Equation (A18) varies from 0 to 1.2 and equals to 1 at 10% soil moisture content. This formula calculates threshold wind speed in different soil moisture contents.
Dust source function S in Equation (A19) for each grid cell is estimated based on topography of it related to surrounding grid cells because dust material often accumulates in low elevation areas.
S = ( z max z i z max z min ) 5
where z i is the cell elevation, and z max and z min are the maximum and minimum elevation in the surrounding area (10° × 10°), respectively. S equals to zero where the bare soil doesn’t exist based on AVHRR (Advanced Very High-Resolution Radiometer) data [126]. For estimation of dust concentration in different vertical levels of the model, other modules, which considers transport and removal of dust particles, are used. F p is surface dust flux which enters to the lowest level of atmospheric model.

References

  1. Gavrouzou, M.; Hatzianastassiou, N.; Gkikas, A.; Lolis, C.J.; Mihalopoulos, N.A. Climatological Assessment of Intense Desert Dust Episodes over the Broader Mediterranean Basin Based on Satellite Data. Remote Sens. 2021, 13, 2895. [Google Scholar] [CrossRef]
  2. Middleton, N.; Kang, U. Sand and dust storms: Impact mitigation. Sustainability 2017, 9, 1053. [Google Scholar] [CrossRef] [Green Version]
  3. Schepanski, K. Transport of mineral dust and its impact on climate. Geosciences 2018, 8, 151. [Google Scholar] [CrossRef] [Green Version]
  4. Jin, Q.; Wei, J.; Lau, W.K.M.; Pu, B.; Wang, C. Interactions of Asian mineral dust with Indian summer monsoon: Recent advances and challenges. Earth-Sci. Rev. 2021, 215, 103562. [Google Scholar] [CrossRef]
  5. Jin, Q.; Wei, J.; Yang, Z.-L. Positive response of Indian summer rainfall to Middle East dust. Geophys. Res. Lett. 2014, 41, 4068–4074. [Google Scholar] [CrossRef]
  6. Vinoj, V.; Rasch, P.J.; Wang, H.L.; Yoon, J.H.; Ma, P.L.; Landu, K.; Singh, B. Short-term modulation of Indian summer monsoon rainfall by West Asian dust. Nat. Geosci. 2014, 7, 308–313. [Google Scholar] [CrossRef]
  7. Middleton, N.; Yiallouros, P.; Kleanthous, S.; Kolokotroni, O.; Schwartz, J.; Dockery, D.W.; Demokritou, P.; Koutrakis, P. A 10-year time-series analysis of respiratory and cardiovascular morbidity in Nicosia, Cyprus: The effect of short-term changes in air pollution and dust storms. Environ. Health 2008, 7, 39. [Google Scholar] [CrossRef] [Green Version]
  8. De Longueville, F.; Hountondji, Y.-C.; Henry, S.; Ozer, P. What do we know about effects of desert dust on air quality and human health in West Africa compared to other regions? Sci. Total Environ. 2010, 409, 1–8. [Google Scholar] [CrossRef] [Green Version]
  9. Zhang, X.; Zhao, L.; Tong, D.Q.; Wu, G.; Dan, M.; Teng, B. A systematic review of global desert dust and associated human health effects. Atmosphere 2016, 7, 158. [Google Scholar] [CrossRef] [Green Version]
  10. Kwon, H.-J.; Cho, S.-H.; Chun, Y.; Lagarde, F.; Pershagen, G. Effects of the Asian dust events on daily mortality in Seoul, Korea. Environ. Res. 2002, 90, 1–5. [Google Scholar] [CrossRef] [PubMed]
  11. Chen, Y.-S.; Sheen, P.-C.; Chen, E.-R.; Liu, Y.-K.; Wu, T.-N.; Yang, C.-Y. Effects of Asian dust storm events on daily mortality in Taipei, Taiwan. Environ. Res. 2004, 95, 151–155. [Google Scholar] [CrossRef]
  12. Nastos, P.T.; Kampanis, N.A.; Giaouzaki, K.N.; Matzarakis, A. Environmental impacts on human health during a Saharan dust episode at Crete Island, Greece. Meteorolog. Z. 2011, 20, 517–529. [Google Scholar] [CrossRef]
  13. Goudie, A.S. Desert dust and human health disorders. Environ. Intern. 2014, 63, 101–113. [Google Scholar] [CrossRef] [PubMed]
  14. Ashley, W.S.; Strader, S.; Dziubla, D.C.; Haberlie, A. Driving blind: Weather-related vision hazards and fatal motor vehicle crashes. Bull. Amer. Meteorol. Soc. 2015, 96, 755–778. [Google Scholar] [CrossRef]
  15. Call, D.A.; Wilson, C.S.; Shourd, K.N. Hazardous weather conditions and multiple-vehicle chain-reaction crashes in the United States. Meteorol. Appl. 2018, 25, 466–471. [Google Scholar] [CrossRef] [Green Version]
  16. Li, J.; Kandakji, T.; Lee, J.A.; Tatarko, J.; Blackwell III, J.; Gill, T.E.; Collins, J.D. Blowing dust and highway safety in the southwestern United States: Characteristics of dust emission “hotspots” and management implications. Sci. Total Environ. 2018, 621, 1023–1032. [Google Scholar] [CrossRef] [PubMed]
  17. Bhattachan, A.; Okin, G.S.; Zhang, J.; Vimal, S.; Lettenmaier, D.P. Characterizing the role of wind and dust in traffic accidents in California. GeoHealth 2019, 3, 328–336. [Google Scholar] [CrossRef] [Green Version]
  18. He, X.; Zhou, J.; Zhang, X.; Tang, K. Soil erosion response to climatic change and human activity during the Quaternary on the Loess Plateau, China. Reg. Environ. Chang. 2006, 6, 62–70. [Google Scholar] [CrossRef]
  19. Chen, L.; Gao, J.; Ji, Y.; Bai, Z.; Shi, M.; Liu, H. Effects of particulate matter of various sizes derived from suburban farmland, woodland and grassland on air quality of the central district in Tianjin, China. Aeros. Air Qual. Res. 2014, 14, 829–839. [Google Scholar] [CrossRef] [Green Version]
  20. Jarrah, M.; Mayel, S.; Tatarko, J.; Funk, R.; Kuka, K. A review of wind erosion models: Data requirements, processes, and validity. Catena 2020, 187, 104388. [Google Scholar] [CrossRef]
  21. Gholami, H.; Rahimi, S.; Fathabadi, A.; Habibi, S.; Collins, A.L. Mapping the spatial sources of atmospheric dust using GLUE and Monte Carlo simulation. Sci. Total Environ. 2020, 723, 138090. [Google Scholar] [CrossRef] [PubMed]
  22. Gholami, H.; Mohamadifar, A.; Collins, A.L. Spatial mapping of the provenance of storm dust: Application of data mining and ensemble modelling. Atmos. Res. 2019, 233, 104716. [Google Scholar] [CrossRef]
  23. Sivakumar, M.V.K. Impacts of sand storms/dust storms on agriculture. In Natural Disasters and Extreme Events in Agriculture; Springer: Berlin/Heidelberg, Germany, 2005; pp. 159–177. [Google Scholar]
  24. Hojan, M.; Rurek, M.; Więcław, M.; Krupa, A. Effects of extreme dust storm in agricultural areas (Poland, the Greater Lowland). Geosciences 2019, 9, 106. [Google Scholar] [CrossRef] [Green Version]
  25. Nickovic, S.; Kallos, G.; Papadopoulos, A.; Kakaliagou, O. A model for prediction of desert dust cycle in the atmosphere. J. Geophys. Res. Atmos. 2001, 106, 18113–18129. [Google Scholar] [CrossRef] [Green Version]
  26. Zender, C.S.; Bian, H.; Newman, D. Mineral Dust Entrainment and Deposition (DEAD) model: Description and 1990s dust climatology. J. Geophys. Res. Atmos. 2003, 108, D14. [Google Scholar] [CrossRef] [Green Version]
  27. Ginoux, P.; Chin, M.; Tegen, I.; Prospero, J.M.; Holben, B.; Dubovik, O.; Lin, S.-J. Sources and distributions of dust aerosols simulated with the GOCART model. J. Geophys. Res. Atmos. 2001, 106, 20255–20273. [Google Scholar] [CrossRef]
  28. Huneeus, N.; Schulz, M.; Balkanski, Y.; Griesfeller, J.; Prospero, J.; Kinne, S.; Bauer, S.; Boucher, O.; Chin, M.; Dentener, F.; et al. Global dust model intercomparison in AeroCom phase I. Atmos. Chem. Phys. 2011, 11, 7781–7816. [Google Scholar] [CrossRef] [Green Version]
  29. Shao, Y.; Ishizuka, M.; Mikami, M.; Leys, J.F. Parameterization of size-resolved dust emission and validation with measurements. J. Geophys. Res. Atmos. 2011, 116, D8. [Google Scholar] [CrossRef]
  30. Alizadeh-Choobari, O.; Sturman, A.; Zawar-Reza, P. Global distribution of mineral dust and its impact on radiative fluxes as simulated by WRF-Chem. Meteorol. Atmos. Phys. 2015, 127, 635–648. [Google Scholar] [CrossRef]
  31. Rashki, A.; Kaskaoutis, D.G.; Sepehr, A. Statistical evaluation of the dust events at selected stations in Southwest Asia: From the Caspian Sea to the Arabian Sea. Catena 2018, 165, 590–603. [Google Scholar] [CrossRef]
  32. Boloorani, A.D.; Papi, R.; Soleimani, M.; Karami, L.; Amiri, F.; Samany, N.N. Water bodies changes in Tigris and Euphrates basin has impacted dust storms phenomena. Aeol. Res. 2021, 50, 100698. [Google Scholar] [CrossRef]
  33. Moridnejad, A.; Karimi, N.; Parisa, A. Newly desertified regions in Iraq and its surrounding areas: Significant novel sources of global dust particles. J. Arid Environ. 2015, 116, 1–10. [Google Scholar] [CrossRef]
  34. Beegum, S.N.; Gherboudj, I.; Chaouch, N.; Temimi, M.; Ghedira, H. Simulation and analysis of synoptic scale dust storms over the Arabian Peninsula. Atmos. Res. 2018, 199, 62–81. [Google Scholar] [CrossRef]
  35. Francis, D.; Chaboureau, J.-P.; Nelli, N.; Cuesta, J.; Alshamsi, N.; Temimi, M.; Pauluis, O.; Xue, L. Summertime Dust Storms over the Arabian Peninsula and Impacts on Radiation, Circulation, Cloud Development and Rain. Atmos. Res. 2021, 250, 105364. [Google Scholar] [CrossRef]
  36. Mohammadpour, K.; Sciortino, M.; Kaskaoutis, D.G. Classification of weather clusters over the Middle East associated with high atmospheric dust-AODs in West Iran. Atmos. Res. 2021, 259, 105682. [Google Scholar] [CrossRef]
  37. Mohammadpour, K.; Sciortino, M.; Saligheh, M.; Raziei, T.; Boloorani, A.D. Spatiotemporal regionalization of atmospheric dust based on multivariate analysis of MACC model over Iran. Atmos. Res. 2021, 249, 105322. [Google Scholar] [CrossRef]
  38. Alamodi, A.O. Synoptic and Dynamic Study of a Dust Storm Affected the Kingdom of Saudi Arabia. J. King Abdulaziz Univ. Meteorol. Environ. Arid Land Agric. Sci. 2011, 22, 209–226. [Google Scholar] [CrossRef]
  39. Hamidi, M.; Kavianpour, M.R.; Shao, Y. Synoptic analysis of dust storms in the Middle East. Asia-Pac. J. Atmos. Sci. 2013, 49, 279–286. [Google Scholar] [CrossRef]
  40. Middleton, N.J. A geography of dust storms in South-west Asia. J. Climatol. 1986, 6, 183–196. [Google Scholar] [CrossRef]
  41. Wilderson, W.D. Dust and Sand Forecasting in Iraq and Adjoining Countries. 1991. Available online: https://apps.dtic.mil/sti/citations/ADA247588 (accessed on 22 May 2021).
  42. Hermida, L.; Merino, A.; Sánchez, J.L.; Fernández-González, S.; García-Ortega, E.; López, L. Characterization of synoptic patterns causing dust outbreaks that affect the Arabian Peninsula. Atmos. Res. 2018, 199, 29–39. [Google Scholar] [CrossRef]
  43. Francis, D.; Alshamsi, N.; Cuesta, J.; Gokcen Isik, A.; Dundar, C. Cyclogenesis and Density Currents in the Middle East and the Associated Dust Activity in September 2015. Geosciences 2019, 9, 376. [Google Scholar] [CrossRef] [Green Version]
  44. Abdi Vishkaee, F.; Flamant, C.; Cuesta, J.; Oolman, L.; Flamant, P.; Khalesifard, H.R. Dust transport over Iraq and northwest Iran associated with winter Shamal: A case study. J. Geophys. Res. Atmos. 2012, 117, D3. [Google Scholar] [CrossRef] [Green Version]
  45. Saeed, T.M.; Al-Dashti, H.; Spyrou, C. Aerosol’s optical and physical characteristics and direct radiative forcing during a shamal dust storm, a case study. Atmos. Chem. Phys. 2014, 14, 3751–3769. [Google Scholar] [CrossRef] [Green Version]
  46. Yu, Y.; Notaro, M.; Kalashnikova, O.V.; Garay, M.J. Climatology of summer Shamal wind in the Middle East. J. Geophys. Res. Atmos. 2016, 121, 289–305. [Google Scholar] [CrossRef] [Green Version]
  47. Hamzeh, N.H.; Karami, S.; Kaskaoutis, D.G.; Tegen, I.; Moradi, M.; Opp, C. Atmospheric dynamics and numerical simulations of six frontal dust storms in the Middle East region. Atmosphere 2021, 12, 125. [Google Scholar] [CrossRef]
  48. Karami, S.; Hamzeh, N.H.; Alam, K.; Ranjbar, A. The study of a rare frontal dust storm with snow and rain fall: Model results and ground measurements. J. Atmos. Sol. -Terr. Phys. 2020, 197, 105149. [Google Scholar] [CrossRef]
  49. Boloorani, A.D.; Nabavi, S.O.; Bahrami, H.A.; Mirzapour, F.; Kavosi, M.; Abasi, E.; Azizi, R. Investigation of dust storms entering Western Iran using remotely sensed data and synoptic analysis. J. Environ. Health Sci. Engin. 2014, 12, 124. [Google Scholar] [CrossRef] [PubMed] [Green Version]
  50. Al-Jumaily, K.J.; Ibrahim, M.K. Analysis of synoptic situation for dust storms in Iraq. Int. J. Energ. Env. 2013, 4, 851–858. [Google Scholar]
  51. Basart, S.; Vendrell, L.; Baldasano, J.M. High-resolution dust modelling over complex terrains in West Asia. Aeol. Res. 2016, 23, 37–50. [Google Scholar] [CrossRef]
  52. Hamidi, M.; Kavianpour, M.R.; Shao, Y. A quantitative evaluation of the 3–8 July 2009 Shamal dust storm. Aeol. Res. 2017, 24, 133–143. [Google Scholar] [CrossRef]
  53. Solomos, S.; Abuelgasim, A.; Spyrou, C.; Binietoglou, I.; Nickovic, S. Development of a dynamic dust source map for NMME-DREAM v1. 0 model based on MODIS Normalized Difference Vegetation Index (NDVI) over the Arabian Peninsula. Geosci. Model Develop. 2019, 12, 979–988. [Google Scholar] [CrossRef] [Green Version]
  54. Kontos, S.; Liora, N.; Giannaros, C.; Kakosimos, K.; Poupkou, A.; Melas, D. Modeling natural dust emissions in the central Middle East: Parameterizations and sensitivity. Atmos. Environ. 2018, 190, 294–307. [Google Scholar] [CrossRef]
  55. Karami, S.; Hamzeh, N.H.; Kaskaoutis, D.G.; Rashki, A.; Alam, K.; Ranjbar, A. Numerical simulations of dust storms originated from dried lakes in central and southwest Asia: The case of Aral Sea and Sistan Basin. Aeol. Res. 2021, 50, 100679. [Google Scholar] [CrossRef]
  56. Ukhov, A.; Ahmadov, R.; Grell, G.; Stenchikov, G. Improving dust simulations in WRF-Chem v4. 1.3 coupled with the GOCART aerosol module. Geosci. Model Dev. 2021, 14, 473–493. [Google Scholar] [CrossRef]
  57. Flaounas, E.; Kotroni, V.; Lagouvardos, K.; Klose, M.; Flamant, C.; Giannaros, T.M. Sensitivity of the WRF-Chem (V3. 6.1) model to different dust emission parametrisation: Assessment in the broader Mediterranean region. Geosci. Model Dev. 2017, 10, 2925–2945. [Google Scholar] [CrossRef] [Green Version]
  58. Thoppil, P.G.; Hogan, P.J. Persian Gulf response to a wintertime shamal wind event. Deep Sea Res. Part I Oceanogr. Res. Pap. 2010, 57, 946–955. [Google Scholar] [CrossRef] [Green Version]
  59. Shao, Y. A model for mineral dust emission. J. Geophys. Res. Atmos. 2001, 106, 20239–20254. [Google Scholar] [CrossRef]
  60. Goudie, A.S.; Middleton, N.J. Desert Dust in the Global System; Springer: Berlin, Germany, 2006; ISBN 978-3-642-06890-4. [Google Scholar]
  61. Notaro, M.; Alkolibi, F.; Fadda, E.; Bakhrjy, F. Trajectory analysis of Saudi Arabian dust storms. J. Geophys. Res. Atmos. 2013, 118, 6028–6043. [Google Scholar] [CrossRef]
  62. Vukmirović, Z.; Unkašević, M.; Lazić, L.; Tošić, I.; Rajšić, S.; Tasić, M. Analysis of the Saharan dust regional transport. Meteorol. Atmos. Phys. 2004, 85, 265–273. [Google Scholar] [CrossRef]
  63. Francis, D.; Flamant, C.; Chaboureau, J.-P.; Banks, J.; Cuesta, J.; Brindley, H.; Oolman, L. Dust emission and transport over Iraq associated with the summer Shamal winds. Aeol. Res. 2017, 24, 15–31. [Google Scholar] [CrossRef]
  64. Saeed, S.; Müller, W.A.; Hagemann, S.; Jacob, D. Circumglobal wave train and the summer monsoon over northwestern India and Pakistan: The explicit role of the surface heat low. Clim. Dyn. 2011, 37, 1045–1060. [Google Scholar] [CrossRef]
  65. Giorgi, F.; Lionello, P. Climate change projections for the Mediterranean region. Glob. Planet. Chang. 2008, 63, 90–104. [Google Scholar] [CrossRef]
  66. Hamidi, M.; Kavianpour, M.R.; Shao, Y. Numerical simulation of dust events in the Middle East. Aeolian Res. 2014, 13, 59–70. [Google Scholar] [CrossRef]
  67. Alharbi, B.H.; Maghrabi, A.; Tapper, N. The March 2009 Dust Event in Saudi Arabia: Precursor and Supportive Environment. Bull. Amer. Meteorol. Soc. 2013, 94, 515–528. [Google Scholar] [CrossRef]
  68. Fonseca, R.; Francis, D.; Weston, M.; Nelli, N.; Farah, S.; Wehbe, Y.; AlHosari, T.; Teixido, O.; Mohamed, R. Convection-Aerosol Interactions in the United Arab Emirates: A Sensitivity Study. Atmos. Chem. Phys. Discuss. 2021, 2021, 1–76, preprint. [Google Scholar] [CrossRef]
  69. Vukovic Vimic, A.; Cvetkovic, B.; Giannaros, T.M.; Shahbazi, R.; Sehat Kashani, S.; Prieto, J.; Kotroni, V.; Lagouvardos, K.; Pejanovic, G.; Petkovic, S.; et al. Numerical Simulation of Tehran Dust Storm on 2 June 2014: A Case Study of Agricultural Abandoned Lands as Emission Sources. Atmosphere 2021, 12, 1054. [Google Scholar] [CrossRef]
  70. Li, L.; Sokolik, I.N. Analysis of dust aerosol retrievals using satellite data in Central Asia. Atmosphere 2018, 9, 288. [Google Scholar] [CrossRef] [Green Version]
  71. Pérez, C.; Nickovic, S.; Pejanovic, G.; Baldasano, J.M.; Özsoy, E. Interactive dust-radiation modeling: A step to improve weather forecasts. J. Geophys. Res. Atmos. 2006, 111, D16206. [Google Scholar] [CrossRef] [Green Version]
  72. Basart, S.; Pérez, C.; Nickovic, S.; Cuevas, E.; Baldasano, J.M. Development and evaluation of the BSC-DREAM8b dust regional model over Northern Africa, the Mediterranean and the Middle East. Tellus B Chem. Phys. Meteor. 2012, 64, 18539. [Google Scholar] [CrossRef] [Green Version]
  73. Binietoglou, I.; Basart, S.; Alados-Arboledas, L.; Amiridis, V.; Argyrouli, A.; Baars, H.; Baldasano, J.M.; Balis, D.; Belegante, L.; Bravo-Aranda, J.A.; et al. A methodology for investigating dust model performance using synergistic EARLINET/AERONET dust concentration retrievals. Atmos. Measur. Techn. 2015, 8, 3577–3600. [Google Scholar] [CrossRef] [Green Version]
  74. Zakey, A.S.; Solmon, F.; Giorgi, F. Implementation and testing of a desert dust module in a regional climate model. Atmos. Chem. Phys. 2006, 6, 4687–4704. [Google Scholar] [CrossRef] [Green Version]
  75. Morcrette, J.-J.; Boucher, O.; Jones, L.; Salmond, D.; Bechtold, P.; Beljaars, A.; Benedetti, A.; Bonet, J.W.; Kaiser, M.; Razinger, M.; et al. Aerosol analysis and forecast in the European Centre for medium-range weather forecasts integrated forecast system: Forward modeling. J. Geophys. Res. Atmos. 2009, 114, D06206. [Google Scholar] [CrossRef]
  76. Colarco, P.; da Silva, A.; Chin, M.; Diehl, T. Online simulations of global aerosol distributions in the NASA GEOS-4 model and comparisons to satellite and ground-based aerosol optical depth. J. Geophys. Res. Atmos. 2010, 115, D14207. [Google Scholar] [CrossRef] [Green Version]
  77. Lu, S.; Huang, H.-C.; Hou, Y.-T.; Tang, Y.; McQueen, J.; da Silva, A.; Chin, M.; Joseph, E.; Stockwell, W. Development of NCEP Global Aerosol Forecasting System: An overview and its application for improving weather and air quality forecasts. In NATO Science for Peace and Security Series: Air Pollution Modelling and Its Application XX; Springer: Dordrecht, The Netherlands, 2010; p. 451454. [Google Scholar]
  78. Pérez, C.; Haustein, K.; Janjic, Z.; Jorba, O.; Huneeus, N.; Baldasano, J.M.; Black, T.; Basart, S.; Nickovic, S.; Miller, R.L.; et al. Atmospheric dust modeling from meso to global scales with the online NMMB/BSC-Dust model–Part 1: Model description, annual simulations and evaluation. Atmos. Chem. Phys. 2011, 11, 13001–13027. [Google Scholar] [CrossRef] [Green Version]
  79. Grell, G.A.; Peckham, S.E.; Schmitz, R.; McKeen, S.A.; Frost, G.; Skamarock, W.C.; Eder, B. Fully coupled “online” chemistry within the WRF model. Atmos. Environ. 2005, 39, 6957–6975. [Google Scholar] [CrossRef]
  80. Sayer, A.M.; Hsu, N.C.; Lee, J.; Kim, W.V.; Dutcher, S.T. Validation, stability, and consistency of MODIS Collection 6.1 and VIIRS Version 1 Deep Blue aerosol data over land. J. Geophys. Res. Atmos. 2019, 124, 4658–4688. [Google Scholar] [CrossRef]
  81. Salmabadi, H.; Khalidy, R.; Saeedi, M. Transport routes and potential source regions of the Middle Eastern dust over Ahvaz during 2005–2017. Atmos. Res. 2020, 241, 104947. [Google Scholar] [CrossRef]
  82. Ledari, D.G.; Hamidi, M.; Shao, Y. Evaluation of the 13 April 2011 frontal dust storm in west Asia. Aeol. Res. 2020, 44, 100592. [Google Scholar] [CrossRef]
  83. Rashki, A.; Kaskaoutis, D.G.; Mofidi, A.; Minvielle, F.; Chiapello, I.; Legrand, M.; Dumka, U.C.; Francois, P. Effects of Monsoon, Shamal and Levar winds on dust accumulation over the Arabian Sea during summer–The July 2016 case. Aeol. Res. 2019, 36, 27–44. [Google Scholar] [CrossRef]
  84. Kaskaoutis, D.G.; Houssos, E.E.; Rashki, A.; Francois, P.; Legrand, M.; Goto, D.; Bartzokas, A.; Kambezidis, H.D.; Takemura, T. The Caspian Sea–Hindu Kush Index (CasHKI): A regulatory factor for dust activity over southwest Asia. Glob. Planet. Chang. 2016, 137, 10–23. [Google Scholar] [CrossRef]
  85. Marticorena, B.; Bergametti, G. Modeling the atmospheric dust cycle: 1. Design of a soil-derived dust emission scheme. J. Geophys. Res. Atmos. 1995, 100, 16415–16430. [Google Scholar] [CrossRef] [Green Version]
  86. Cowie, S.M.; Marsham, J.H.; Knippertz, P. The importance of rare, high-wind events for dust uplift in northern Africa. Geophys. Res. Lett. 2015, 42, 8208–8215. [Google Scholar] [CrossRef]
  87. Tegen, I.; Miller, R. A general circulation model study on the interannual variability of soil dust aerosol. J. Geophys. Res. Atmos. 1998, 103, 25975–25995. [Google Scholar] [CrossRef]
  88. Menut, L. Sensitivity of hourly Saharan dust emissions to NCEP and ECMWF modeled wind speed. J. Geophys. Res. Atmos. 2008, 113, D16201. [Google Scholar] [CrossRef] [Green Version]
  89. Heinold, B.; Knippertz, P.; Marsham, J.H.; Fiedler, S.; Dixon, N.S.; Schepanski, K.; Laurent, B.; Tegen, I. The role of deep convection and nocturnal low-level jets for dust emission in summertime West Africa: Estimates from convection-permitting simulations. J. Geophys. Res. Atmos. 2013, 118, 4385–4400. [Google Scholar] [CrossRef] [PubMed] [Green Version]
  90. Marsham, J.H.; Knippertz, P.; Dixon, N.S.; Parker, D.J.; Lister, G.M.S. The importance of the representation of deep convection for modeled dust-generating winds over West Africa during summer. Geophys. Res. Lett. 2011, 38. [Google Scholar] [CrossRef] [Green Version]
  91. Knippertz, P.; Todd, M.C. Mineral dust aerosols over the Sahara: Meteorological controls on emission and transport and implications for modeling. Rev. Geophys. 2012, 50, RG1007. [Google Scholar] [CrossRef]
  92. Hashim, B.M.; Ajmi, R.N.; Abduljabbar, S.A. Identification of dust sources in Iraq using meteorological surface data and satellite data. J. Environ. Sci. Engin. 2013, 2, 299. [Google Scholar]
  93. Tegen, I.; Harrison, S.P.; Kohfeld, K.; Prentice, I.C.; Coe, M.; Heimann, M. Impact of vegetation and preferential source areas on global dust aerosol: Results from a model study. J. Geophys. Res. Atmos. 2002, 107, AAC-14. [Google Scholar] [CrossRef] [Green Version]
  94. Kok, J.F.; Albani, S.; Mahowald, N.M.; Ward, D.S. An improved dust emission model–Part 2: Evaluation in the Community Earth System Model, with implications for the use of dust source functions. Atmos. Chem. Phys. 2014, 14, 13043–13061. [Google Scholar] [CrossRef] [Green Version]
  95. Prospero, J.M.; Ginoux, P.; Torres, O.; Nicholson, S.E.; Gill, T.E. Environmental characterization of global sources of atmospheric soil dust identified with the Nimbus 7 Total Ozone Mapping Spectrometer (TOMS) absorbing aerosol product. Rev. Geophys. 2002, 40, 1002. [Google Scholar] [CrossRef]
  96. Cakmur, R.V.; Miller, R.L.; Perlwitz, J.; Geogdzhayev, I.V.; Ginoux, P.; Koch, D.; Kohfeld, K.E.; Tegen, I.; Zender, C.S. Constraining the magnitude of the global dust cycle by minimizing the difference between a model and observations. J. Geophys. Res. Atmos. 2006, 111, D06207. [Google Scholar] [CrossRef]
  97. Singh, C.; Singh, S.K.; Chauhan, P.; Budakoti, S. Simulation of an extreme dust episode using WRF-CHEM based on optimal ensemble approach. Atmos. Res. 2021, 249, 105296. [Google Scholar] [CrossRef]
  98. Sahraei, J.; Hassan, E.M.; Mohammadi, N. The Effect of the Zagros Mountain Range on Transporting Iraqi Dust to Western Iran using the WRF/Chem Model (Case Study). J. Geogr. Environ. Hazards 2020, 8, 119–134. [Google Scholar]
  99. Gandham, H.; Dasari, H.P.; Langodan, S.; Karumuri, R.K.; Hoteit, I. Major changes in extreme dust events dynamics over the Arabian Peninsula during 2003–2017 driven by atmospheric conditions. J. Geophys. Res. Atmos. 2020, 125, e2020JD032931. [Google Scholar] [CrossRef]
  100. Shaheen, A.; Wu, R.; Aldabash, M. Long-term AOD trend assessment over the Eastern Mediterranean region: A comparative study including a new merged aerosol product. Atmos. Environ. 2020, 238, 117736. [Google Scholar] [CrossRef]
  101. Carton, J.A.; Chepurin, G.A.; Chen, L.; Grodsky, S.A. Improved global net surface heat flux. J. Geophys. Res. Ocean. 2018, 123, 3144–3163. [Google Scholar] [CrossRef]
  102. Wu, J.; Zha, J.; Zhao, D. Estimating the impact of the changes in land use and cover on the surface wind speed over the East China Plain during the period 1980–2011. Clim. Dyn. 2016, 46, 847–863. [Google Scholar] [CrossRef]
  103. Chock, G.Y.K.; Cochran, L. Modeling of topographic wind speed effects in Hawaii. J. Wind Engin. Ind. Aerodyn. 2005, 93, 623–638. [Google Scholar] [CrossRef]
  104. Archer, C.L. An introduction to meteorology for airborne wind energy. In Airborne Wind Energy; Springer: Berlin/Heidelberg, Germany, 2013; pp. 81–94. [Google Scholar]
  105. Giannakopoulou, E.M.; Toumi, R. The Persian Gulf summertime low-level jet over sloping terrain. Quart. J. R. Meteorol. Soc. 2012, 138, 145–157. [Google Scholar] [CrossRef]
  106. Malakooti, H.; Pakhirehzan, M.; Hassani, V.S. Observational and synoptic behavior of Shamal wind in the north west coast of Persian Gulf: Bushehr, Iran. Phys. Geogr. Res. Q. 2016, 48, 159–174. [Google Scholar]
  107. Jish Prakash, P.; Stenchikov, G.; Kalenderski, S.; Osipov, S.; Bangalath, H. The impact of dust storms on the Arabian Peninsula and the Red Sea. Atmos. Chem. Phys. 2015, 15, 199–222. [Google Scholar] [CrossRef] [Green Version]
  108. Yu, Y.; Notaro, M.; Liu, Z.; Wang, F.; Alkolibi, F.; Fadda, E.; Bakhrjy, F. Climatic controls on the interannual to decadal variability in Saudi Arabian dust activity: Toward the development of a seasonal dust prediction model. J. Geophys. Res. Atmos. 2015, 120, 1739–1758. [Google Scholar] [CrossRef]
  109. Konsta, D.; Binietoglou, I.; Gkikas, A.; Solomos, S.; Marinou, E.; Proestakis, E.; Basart, S.; Pérez García-Pando, C.; El-Askary, H.; Amiridis, V. Evaluation of the BSC-DREAM8b regional dust model using the 3D LIVAS-CALIPSO product. Atmos. Environ. 2018, 195, 46–62. [Google Scholar] [CrossRef]
  110. Shao, Y.; Raupach, M.R.; Findlater, P.A. Effect of saltation bombardment on the entrainment of dust by wind. J. Geophys. Res. Atmos. 1993, 98, 12719–12726. [Google Scholar] [CrossRef] [Green Version]
  111. Janjić, Z.I. The step-mountain eta coordinate model: Further developments of the convection, viscous sublayer, and turbulence closure schemes. Mon. Weather Rev. 1994, 122, 927–945. [Google Scholar] [CrossRef] [Green Version]
  112. Alfaro, S.C.; Gomes, L. Modeling mineral aerosol production by wind erosion: Emission intensities and aerosol size distributions in source areas. J. Geophys. Res. Atmos. 2001, 106, 18075–18084. [Google Scholar] [CrossRef]
  113. Morcrette, J.-J.; Beljaars, A.; Benedetti, A.; Jones, L.; Boucher, O. Sea-salt and dust aerosols in the ECMWF IFS model. Geophys. Res. Lett. 2008, 35, L24813. [Google Scholar] [CrossRef]
  114. White, B.R. Soil transport by winds on Mars. J. Geophys. Res. Solid Earth 1979, 84, 4643–4651. [Google Scholar] [CrossRef]
  115. Giorgi, F. A particle dry-deposition parameterization scheme for use in tracer transport models. J. Geophys. Res. Atmos. 1986, 91, 9794–9806. [Google Scholar] [CrossRef]
  116. Hillel, D. Introduction to Soil Physics; Academic Press: New York, NY, USA, 1982. [Google Scholar]
  117. Mircea, M.; D’Isidoro, M.; Maurizi, A.; Tampieri, F.; Facchini, M.C.; Decesari, S.; Fuzzi, S. Saharan Dust Over Italy: Simulations with Regional Air Quality Model BOLCHEM. In Air Pollution Modeling and Its Application XIX; Springer: Dordrecht, The Netherlands, 2008; pp. 687–688. [Google Scholar]
  118. Maurizi, A.; Russo, F.; D’Isidoro, M.; Tampieri, F. Nudging technique for scale bridging in air quality/climate atmospheric composition modelling. Atmos. Chem. Phys. 2012, 12, 3677–3685. [Google Scholar] [CrossRef] [Green Version]
  119. Buzzi, A.; Ceccarelli, F.; Corazza, M.; Malguzzi, P.; Ratto, C.; Sacchetti, D.; Trovatore, E. Three dimensional forecast verification of the limited area model BOLAM using radiosoundings of MAP-SOP dataset. In EGS-AGU-EUG Joint Assembly; European Geophysical Society: Katlenburg-Lindau, Germany, 2003; p. 9588. [Google Scholar]
  120. Colarco, P.R.; Toon, O.B.; Holben, B.N. Saharan dust transport to the Caribbean during PRIDE: 1. Influence of dust sources and removal mechanisms on the timing and magnitude of downwind aerosol optical depth events from simulations of in situ and remote sensing observations. J. Geophys. Res. Atmos. 2003, 108, 8589. [Google Scholar] [CrossRef]
  121. Tegen, I.; Lacis, A.A. Modeling of particle size distribution and its influence on the radiative properties of mineral dust aerosol. J. Geophys. Res. Atmos. 1996, 101, 19237–19244. [Google Scholar] [CrossRef] [Green Version]
  122. Pruppacher, H.R.; Klett, J.D. Microphysics of Clouds and Precipitation, Kluwer Acad; Springer: Dordrecht, The Netherlands, 1997; ISBN 978-0-306-48100-0. [Google Scholar]
  123. Wesely, M.L.; Lesht, B.M. Comparison of RADM dry deposition algorithms with a site-specific method for inferring dry deposition. Water Air Soil Pollut. 1989, 44, 273–293. [Google Scholar] [CrossRef]
  124. Liu, H.; Jacob, D.J.; Bey, I.; Yantosca, R.M. Constraints from 210Pb and 7Be on wet deposition and transport in a global three-dimensional chemical tracer model driven by assimilated meteorological fields. J. Geophys. Res. Atmos. 2001, 106, 12109–12128. [Google Scholar] [CrossRef] [Green Version]
  125. Wiscombe, W.J. Improved Mie scattering algorithms. Appl. Opt. 1980, 19, 1505–1509. [Google Scholar] [CrossRef]
  126. Defries, R.S.; Townshend, J.R.G. Global land cover characterization from satellite data: From research to operational implementation? GCTE/LUCC Research Review. Glob. Ecol. Biogeogr. 1999, 8, 367–379. [Google Scholar] [CrossRef]
Figure 1. Terra-MODIS true color images and wind vectors at 850 hPa on (a) 2 December 2016 (cyclonic dust storm), (b) 18 February 2017 (post-frontal dust storm), (c) 30 March 2018 (pre-frontal dust storm), (d) 5 July 2017 (Shamal dust storm). The overlaid wind vectors were taken from ERA-Interim reanalysis, while the red ovals show the position of the dust plumes.
Geosciences 11 00458 g001
Figure 2. Terra-MODIS AOD550 retrievals over the Middle East on (a) 2 December 2016 (cyclonic dust storm), (b) 18 February 2017 (post-frontal dust storm), (c) 30 March 2018 (pre-frontal dust storm), (d) 5 July 2017 (Shamal dust storm). White areas denote lack of data due to cloud contamination. The overlaid wind vectors correspond to surface winds taken from ERA-Interim reanalysis.
Geosciences 11 00458 g002
Figure 3. Mean sea level pressure (MSLP) with 10-m vector winds (left column), geopotential height and temperature at 850 hPa level (mid column) and geopotential height at 500 hPa (right column) during dust storms over the Middle East on 2 December 2016 at 00 UTC (ac), 17 February 2017 at 12UTC (df), 30 March 2018 at 00UTC (gi), and 5 July 2017 at 12UTC (jl).
Geosciences 11 00458 g003
Figure 4. Spatial distribution of AOD forecasts from the nine examined models at 07:00 UTC on 2 December 2016 (cyclonic dust storm). AODs higher than 1 are also plotted in red here and in the following figures.
Geosciences 11 00458 g004aGeosciences 11 00458 g004b
Figure 5. Spatial distribution of AOD forecasts from the nine examined models at 07:00 UTC on 18 February 2017 (post-frontal dust storm).
Geosciences 11 00458 g005
Figure 6. Spatial distribution of AOD forecasts from the nine examined models at 07:00 UTC on 30 March 2018 (pre-frontal dust storm).
Geosciences 11 00458 g006aGeosciences 11 00458 g006b
Figure 7. Spatial distribution of AOD forecasts from the nine examined models at 07:00 UTC on 5 July 2017 (Shamal dust storm).
Geosciences 11 00458 g007
Figure 8. Taylor diagram and scatter plots of AOD values from model outputs and Terra-MODIS observations over the Middle East during cyclonic dust storms.
Geosciences 11 00458 g008
Figure 9. Taylor diagram and scatter plots of AOD values from model outputs and Terra-MODIS observations over the Middle East during post-frontal dust storms.
Geosciences 11 00458 g009
Figure 10. Taylor diagram and scatter plots of AOD values from model outputs and Terra-MODIS observations over the Middle East during pre-frontal dust storms.
Geosciences 11 00458 g010
Figure 11. Taylor diagram and scatter plots of AOD values from model outputs and Terra-MODIS observations over the Middle East during Shamal dust storms.
Geosciences 11 00458 g011
Figure 12. Pearson correlation coefficient and RMSE values of the performance of various models during dust storms of different types in the Middle East.
Geosciences 11 00458 g012
Table 1. Case studies of the synoptic dust events examined here.
Type/MechanismDate
Cyclonic1 September 2015; 29 September 2016; 3 December 2016
Pre-Frontal13 April 2017; 30 March 2018; 14 March 2020
Post-Frontal17–18 February 2017; 2–3 November 2017; 8 January 2020
Shamal 5 July 2017; 29 June 2018; 26 July 2018
Table 2. Statistical results (r, p-value and RMSE) from the evaluation of the forecasted AODs of each model against MODIS-AODs over the Middle East during dust events of various types.
ModelCyclonicPost-FrontPre-FrontShamal
Correlationp-ValueRMSECorrelationp-ValueRMSECorrelationp-ValueRMSECorrelationp-ValueRMSE
EMA_RegCM40.439<0.0010.2650.281<0.0010.0580.186<0.0010.2160.340<0.0010.249
DREAM8_MACC0.718<0.0010.2060.553<0.0010.2830.348<0.0010.2830.447<0.0010.404
MACC_ECMWF0.70<0.0010.2200.433<0.0010.3230.586<0.0010.3860.529<0.0010.424
NMMB_BSC0.572<0.0010.3070.301<0.0010.2980.478<0.0010.3150.552<0.0010.461
DREAM8b_V20.596<0.0010.2700.472<0.0010.2860.449<0.0010.2980.510<0.0010.448
DREAMABOL0.541<0.0010.2320.442<0.0010.3510.398<0.0010.2200.497<0.0010.453
NASA_GEOS0.703<0.0010.2540.555<0.0010.3990.623<0.0010.3230.579<0.0010.485
NCEP_NGAC0.655<0.0010.2630.452<0.0010.3200.155<0.0010.1820.412<0.0010.330
NOA-WRF-Chem0.492<0.0010.1940.433<0.0010.2630.557<0.0010.2820.593<0.0010.469
Table 3. Statistical results (R2) from the evaluation of the forecasted AODs of each model against AODs at 3 AERONET stations in the Middle East (Kuwait University, KAUST-campus and Masdar Institute) during the 12 dust storms.
BSC_DREAM8b_V2DREAMABOLEMA-RegCM4NASA-GEOSNCEP-NGACDREAM8-MACCMACC-ECMWFNMMB-BSCNOA-WRF-CHEMTERRA
R20.480.610.040.740.620.780.730.350.210.75
Publisher’s Note: MDPI stays neutral with regard to jurisdictional claims in published maps and institutional affiliations.

