Article

Assessing Thermal Maturity through a Multi-Proxy Approach: A Case Study from the Permian Faraghan Formation (Zagros Basin, Southwest Iran)

1
Department of Physics and Geology, University of Perugia, 06123 Perugia, Italy
2
Department of Geology and Petroleum Geology, School of Geosciences, University of Aberdeen, Aberdeen AB24 3FX, UK
3
Department of Animal and Plant Sciences, University of Sheffield, Sheffield S10 2TN, UK
4
Department of Sciences, University of Roma Tre, 00154 Rome, Italy
5
Centro de Investigacão Marinha e Ambiental (CIMA), Universidade do Algarve, 8005-139 Faro, Portugal
6
Paläontologisches Institut und Museum, University of Zurich, 8006 Zürich, Switzerland
7
Laboratório Nacional de Energia e Geologia (LNEG), 2610-999 Amadora, Portugal
8
Geochemistry Department, Exploration Directorate, National Iranian Oil Company (NIOC), Tehran 1994814695, Iran
*
Author to whom correspondence should be addressed.
Submission received: 30 August 2021 / Revised: 9 November 2021 / Accepted: 16 November 2021 / Published: 23 November 2021
(This article belongs to the Collection Early Career Scientists’ (ECS) Contributions to Geosciences)

Abstract

:
This study focuses on the thermal maturity of Permian deposits from the Zagros Basin, Southwest Iran, employing both optical methods (Thermal Alteration Index, Palynomorph Darkness Index, Vitrinite Reflectance, UV Fluorescence) and geochemical analyses of organic matter (Rock Eval Pyrolysis and MicroRaman spectroscopy) applied to the Faraghan Formation along two investigated Darreh Yas and Kuh e Faraghan surface sections. Furthermore, an integrated palynofacies and lithofacies analysis was carried out in order to integrate the few studies on the depositional environment. The Faraghan Formation, which is widely distributed in the Zagros area, generally consists of shale intercalated with sandstones and pebble conglomerates in the lower part, followed by a succession of sandstone, siltstone and shaly intercalations and with carbonate levels at the top. The integrated palynofacies and lithofacies data confirm a coastal depositional setting evolving upwards to a shallow marine carbonate environment upwards. Rock Eval Pyrolysis and Vitrinite Reflectance analysis showed that the organic matter from samples of the Darreh Yas and Kuh e Faraghan sections fall in the mature to postmature range with respect to the oil to gas generation window, restricting the thermal maturity range proposed by previous authors. Similar results were obtained with MicroRaman spectroscopy and optical analysis such as Thermal Alteration Index and UV Fluorescence. Palynomorph Darkness Index values were compared with Rock Eval Pyrolysis and vitrinite reflectance values and discussed for the first time in the late stage of oil generation.

1. Introduction

The Paleozoic and Mesozoic successions of the Middle East and North Africa are well-known and have been extensively studied for the potential of their petroleum systems [1,2,3,4,5]. In the last forty years, many gas accumulations were found in Paleozoic and Triassic terrigenous and carbonate reservoirs in Saudi Arabia (Qalibah, Jauf, Unayzah and Khuff formations [6,7]) and Iran (Sarchahan, Dalan and Kangan formations [8,9,10,11,12]). Nonetheless, despite its increasing importance in hydrocarbon exploration, few studies have yielded data concerning the thermal maturity of organic matter (OM) in Iran’s Permian sequences [9,13]. In the present paper, we try to fill this gap by focusing on the Faraghan Formation which is widely distributed in the Zagros area (SW Iran; Figure 1 [14,15,16,17,18,19,20] and was recently attributed to the middle Permian (Guadalupian [21,22]). The Zagros area is a laterally extensive basin with a complex geodynamic and paleotectonic history. In view of this, thermal maturity studies need to be performed also at local scale considering the peculiar variability in terms of intrabasinal sediment thickness and subsidence rates.
In order to determine the hydrocarbon potential of the Faraghan Formation, two surface sections from the High Zagros were selected for optical and geochemical analyses. Optical observations are typically either used as a ‘screening technique’, or to supply a qualitative to quantitative control on the interpretation of geochemical bulk rock parameters. Accordingly, palynofacies analyses of dispersed OM are often integrated with vitrinite reflectance studies and Rock Eval Pyrolysis with the aim of constraining the thermal maturity of sedimentary successions. Among the optical methods, Vitrinite Reflectance (VR) is the most widely used optical parameter for the determination of the rank of coals and the maturation levels of other lithologies in sedimentary basins [23]. Vitrinite is derived from the cell walls of land plants, which are chemically composed of cellulose and lignin. Chemical reactions affecting vitrinite particles during organic maturation are irreversible [24,25,26,27,28]. Limitations of this method are the strong dependence on the operator’s experience (e.g., bias in recognition of reworked vitrinite, other macerals, etc.), its inapplicability to pre-Devonian sedimentary successions that are devoid of higher plant fragments, and the suppression/retardation of its reflectance (e.g., [29,30,31,32,33,34,35,36,37,38]). In this case, the use of other optical approaches, with a different applicability, could represent a valid alternative to determine the thermal maturity of OM and the integration with geochemical results [39,40].
Many optical methods based on palynomorphs’ color sensitivity and their progressive evolution with increasing temperature in the lower range of thermal maturity were proposed in the palynological literature in the last decades (e.g., [41]) and have been reviewed by Hartkopf-Fröder et al. [42]. Some of the most commonly used schemes are Thermal Alteration Index (TAI [43,44]), Spore Color Index (SCI [41,42,43,44,45]) and Acritarch Alteration Index (AAI [46]). Goodhue and Clayton [47] suggested a quantitative method for the assessment of thermal maturity of OM, based on simple digital image analysis (Palynomorph Darkness Index—PDI). Recently, Spina et al. [36] provided a good calibration of PDI values against Rock Eval and its general applicability within the early oil to oil mature stage.
Besides Rock Eval Pyrolysis, other geochemical methods have potential in maturation studies. For example, MicroRaman spectroscopy can be used to analyze the structural order of carbonaceous material in metamorphism [48,49,50,51], and into the diagenetic realm in different geodynamic settings [33,52,53,54,55,56,57,58,59,60].
This study aims to determine the hydrocarbon source rock potential of the Faraghan Formation in terms of its thermal maturity combining different geochemical (Rock Eval Pyrolysis and MicroRaman spectroscopy) and optical methods (VR, TAI, PDI and UV Fluorescence) applied to OM [42,61,62]. The results obtained here are also discussed in terms of each method’s advantages and disadvantages and their reliable applicability for the recognition of the various stages of oil and gas generation.

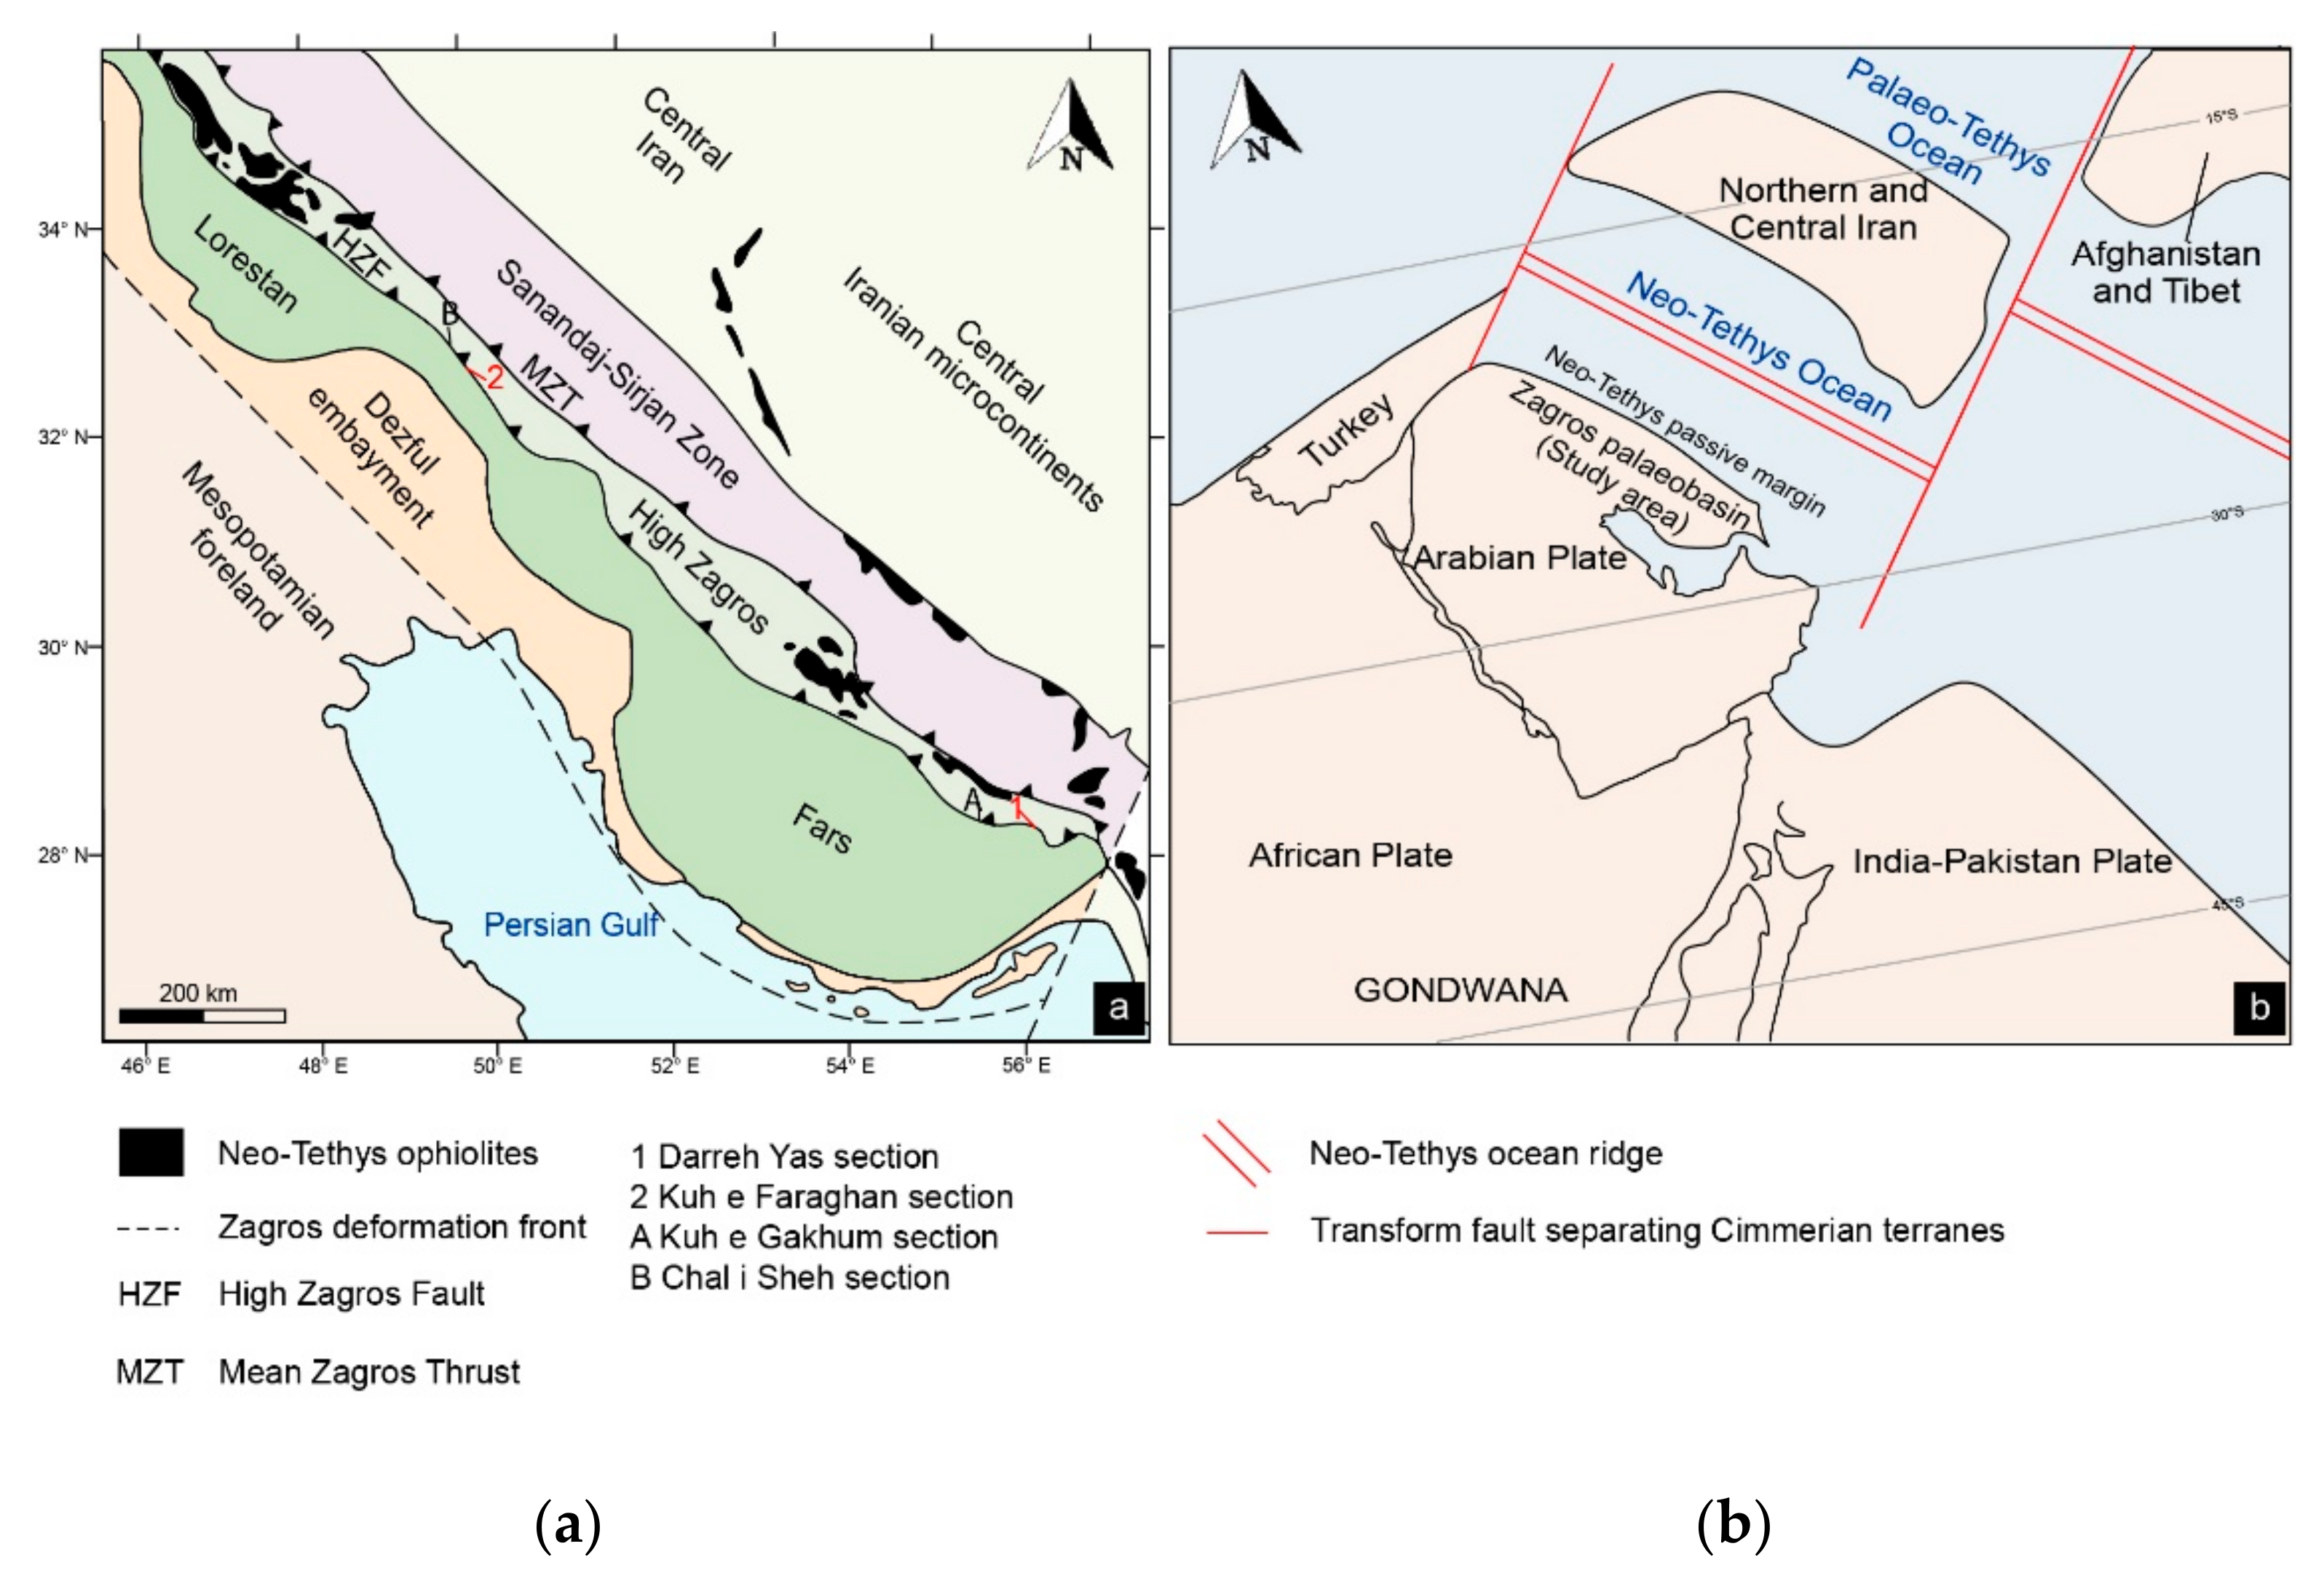
2. Regional Geological Setting

The studied area is located in the Zagros fold and thrust belt, a prolific petroleum province in southwestern Iran (Figure 1; [5,9,63,64]). This mountain chain resulted from the convergence of the Arabian and Iranian plates along the Neo-Tethys suture zone [65,66]. Attached to the Arabian Platform throughout its geological history, the Zagros area experienced a series of geodynamic events, leading to the development of long-lasting and extended paleo-basins with a significant thickness of sedimentary fill (more than 14 km) deposited over the Upper Proterozoic igneous and metamorphic basement [65,66,67,68].
Together with the Arabian Peninsula and the Middle East terranes (e.g., Turkey, Caucasus, northwestern and central Iran, Alborz, Afghanistan, western Pakistan and southeast Turkmenistan), the Zagros region was part of the northeastern margin of Gondwana paleocontinent throughout the Paleozoic [69,70,71,72,73,74,75,76]. After an extensional rifting event from the latest Precambrian to the early Cambrian, which resulted in deposition of widespread evaporites (e.g., Hormuz Formation [8,76,77], the northeastern Gondwanan margin was characterized by relative tectonic quiescence representing the continental passive margin of the Proto-Tethys Ocean from Cambrian to mid-Silurian [64,71,77].
Figure 1. (a) Structural map of the Zagros range (modified and redrawn from [78]) and location of the studied and mentioned sections; (b) Paleogeographic map of the northeastern Gondwana margin (southern Pangea) during the Guadalupian age (drawn based on paleogeographic reconstructions of [77,79]).
Geosciences 11 00484 g001
During this aforementioned time interval, the Zagros region migrated from the equator to southern higher latitudes. Together with this change in latitude, eustatic sea-level variations led to deposition of both carbonate (e.g., Soltanieh and Mila formations) and siliciclastic deposits (e.g., Zaigun, Lalun, Ilbeyk, Zard Kuh, Seyahoo and Sarchahan formations [8,63,64,66,71,77,80].
From the late Silurian to the Carboniferous, the Zagros area moved northward to equatorial latitudes. This time interval is stratigraphically poorly represented in the Zagros Basin, rocks of this age having been extensively eroded after the Hercynian orogenesis, except for rare cases such as the Devonian Zakeen Formation that crops out in the SE High Zagros and Fars domains [8,12,71,76,81]. An extensional tectonic regime led to the rifting (from Carboniferous) and spreading (from early Permian) of the Neo-Tethys Ocean along the eastern margin of Gondwana [73,82,83]. This tectonic regime initiated a gradual marine transgression with deposition of continental to shallow marine siliciclastic deposits of Guadalupian age (Faraghan Formation [14,21,67,76] passing to shallow carbonate platform deposition during late Permian to Triassic time (Dalan and Kengan formations [84]). As the ocean spreading continued, shallow to deep marine sequences were deposited on the continental passive margin up to the Late Cretaceous. From Paleocene time, the Neo-Tethys Ocean began to close with the development of active margin settings in the Zagros region and the following deposition in a foreland basin system [63,64].
The basin evolution related to these two phases (opening and closure of Neo-Tethys Ocean) and the subsequent deposition of a thick pile of shallow to deep marine successions which led to a progressive subsidence of the Paleozoic and Mesozoic units before they were uplifted during the Zagros orogenesis. Within this framework, different burial history reconstructions and associated thermal models were proposed in order to evaluate the hydrocarbon potential of the various lithostratigraphic units in the various areas of the Zagros Basin [9,13]. These models are mainly focused on the Mesozoic and Cenozoic successions which are more productive and have been penetrated by exploration boreholes [8]. Zeinalzadeh [85] modeled the burial history of the Faraghan Formation on the basis of data from the Finu-1 borehole, located 25 km far from the Kuh e Faraghan section of the present study. According to his model, during the first stage of its burial history (late Permian), the Faraghan Formation underwent rapid subsidence, reaching a burial depth of about 2000 m, mostly related to the deposition of the overlying thick Dalan and Kangan formations.
During the Middle Triassic to Early Cretaceous interval, the subsidence rate was relatively slower, and the burial depth estimated for the Faraghan Formation was about 4000 m.
The next increase in subsidence rate was probably related to the Neo-Tethys tectonic inversion, with a progressive shift of the Zagros Basin into foreland conditions. During this phase, the Faraghan Formation reached its maximum burial depth of ca. 4200 m in the early Oligocene. According to Zamanzadeh et al. [13] at this burial depth, the Faraghan Formation attained its peak heating temperature in the range of 78 °C to 138 °C, based on saddle dolomite cements in the dolostone beds that alternate with sandstones in the upper part of the formation. Data from clay minerals (i.e., chlorite, illite and dickite) restrict the range of temperature to 90–120 °C, corresponding to the oil generation and wet gas zones.

3. Stratigraphy of the Faraghan Formation

The Permian Faraghan and Dalan formations host the major Paleozoic hydrocarbon reservoirs in SW Iran [9,86,87]. In the Zagros region, these formations crop out extensively in several areas along the High Zagros Fault, thrusting over Mesozoic and Cenozoic rocks (Chalisheh, Zard Kuh, Darreh-Yas, Oshtoran Kuh, Ghali Kuh [88]. In the eastern High Zagros, the Faraghan and Dalan formations constitute the core of the Kuh-e-Faraghan and Kuh-e-Gahkum anticlines [79]. The Faraghan Formation rests unconformably on lower Paleozoic lithostratigraphic units which consist of terrigenous rocks and minor carbonates of lower Cambrian to Upper Ordovician age (e.g., Zagun, Lalun, Mila, Ilbeyk, Zard Kuh and Seyahou formations), glaciogenic-related deposits of latest Ordovician (Dargaz Formation), Silurian “hot shales” (Sarchahan Formation) and fluvial to tidal Devonian siliciclastics (Zakeen Formation; [63,64,76,81,89]).The complete Paleozoic sedimentary succession of the Zagros Basin includes several unconformities associated with sedimentary hiatuses caused by a combination of factors such as: (i) sea level drops linked to the Hirnantian Northern Gondwana [90] and to Carboniferous Southern Hemisphere glaciation events [91]; (ii) uplift of the Middle East area during Přídolí time (late Silurian) related to epeirogenic movements and sea level fall [8,66,77,86,92]; and (iii) the Hercynian orogeny spanning from the Late Devonian to Carboniferous interval [8,77,93,94]. The Faraghan Formation ranges from 10 m to 300 m in thickness and mostly consists of sandstones, siltstones and shales, intercalated with conglomerates at the base and, locally, with thin sandy dolostones more common at the top. The boundary with the overlying middle-upper Permian (Capitanian to Lopingian) Dalan Formation was considered to represent a break-up unconformity related to the Neo-Tethys drifting [63,64,76,89]. The age of the Faraghan Formation was previously attributed to the early Permian, Sakmarian-Artinskian [18] and more recent, to the middle Permian (Guadalupian) on the base of palynological data [21]. The two palynozones recorded are referring to the palynozonal schemes established for the Northern Gondwana regions (OSPZ: Oman and Saudi Arabia palynozone [95,96,97,98,99] and are attributed to Roadian-Wordian (OSPZ5) and Wordian-Capitanian (OSPZ6). The latter biozone was also documented in the basal part of the Dalan Formation in other sections and boreholes of the Zagros Basin [21], confirming a conformable boundary between the two formations. In this study, the Faraghan Formation was sampled and analyzed in two sections, whose lithofacies and stratigraphic architecture are summarized as follows.

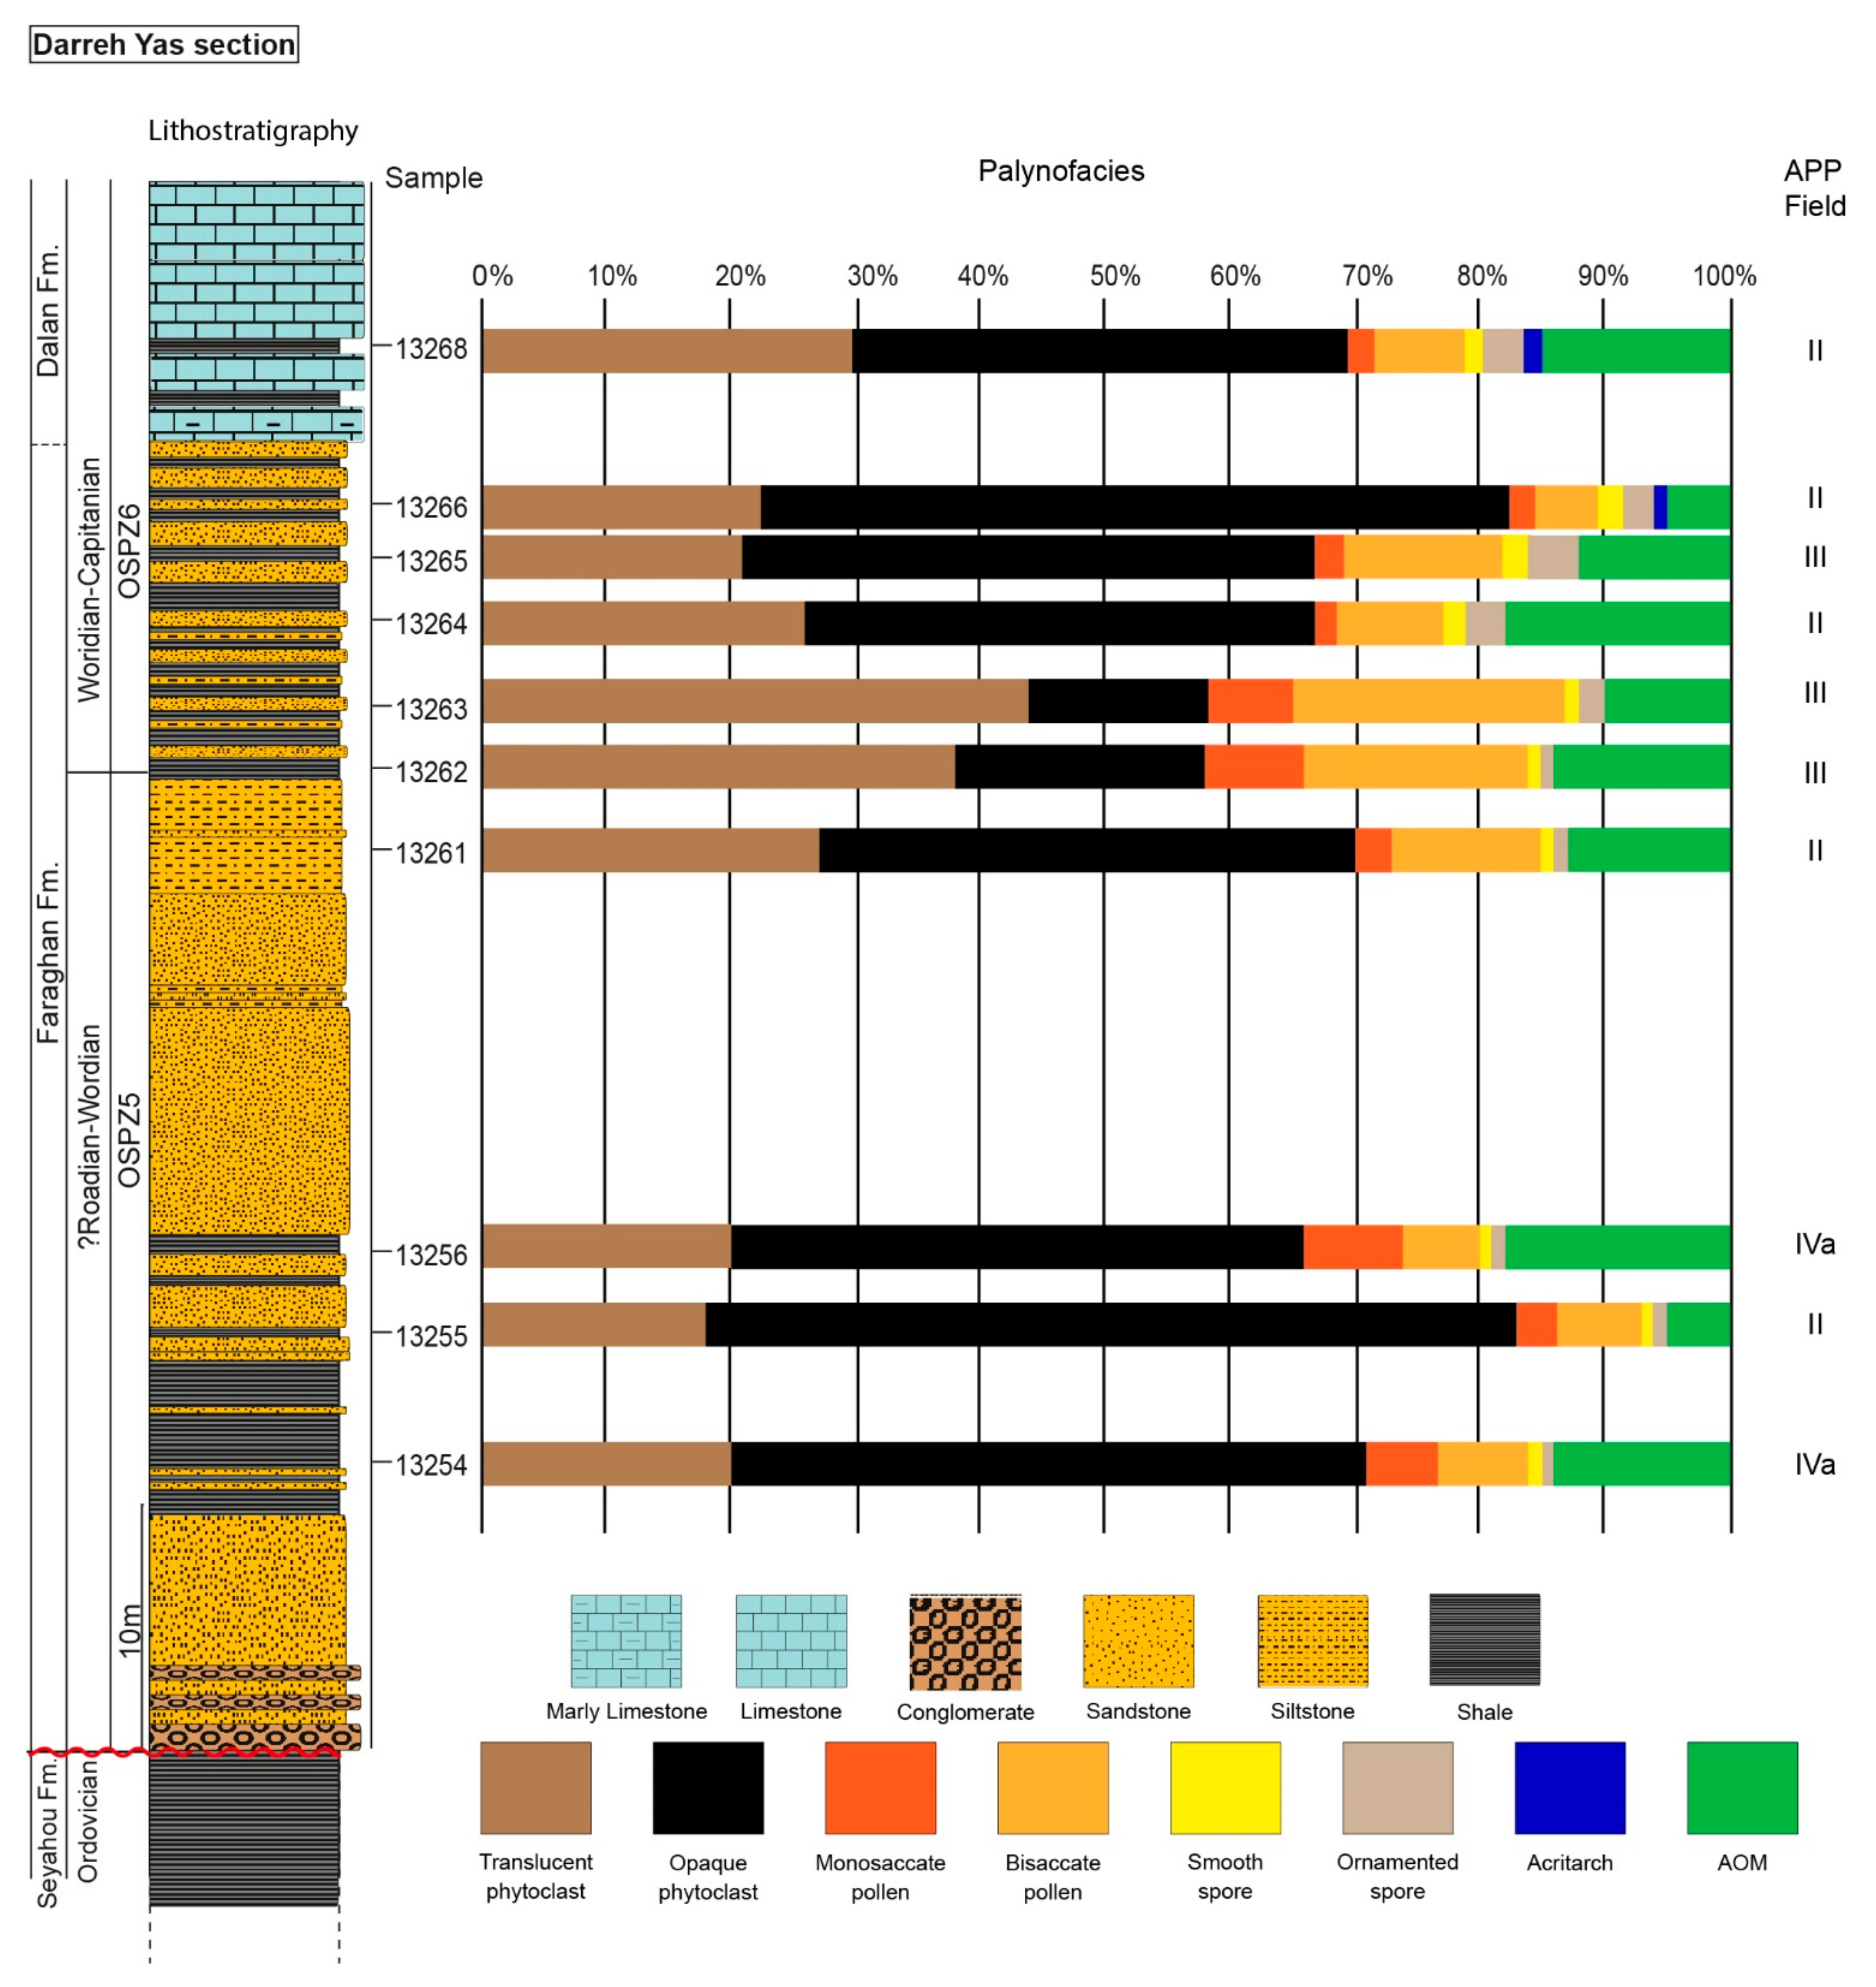
3.1. The Darreh Yas Section

The section is located in the southwestern Shahr-e Kurd and northern Ardal City, NW High Zagros). In this area (Kuh e Lajin Mountains), the Faraghan Formation, ca. 60 m thick, unconformably overlies the arenaceous to shaly Seyahou Formation of Ordovician age and with a depositional paleoenvironment attributed to a storm-dominated siliciclastic shelf [21,22,81,88,89] (Figure 1a and Figure 2). The basal part of the Faraghan Formation consists of an alternation of brown conglomerates and coarse-grained arkosic sandstones containing trough, hummocky and swaley cross-stratification (HCS and SCS) and plane parallel stratification. This unit passes upward into siliciclastic mudstones interlayered with thin-bedded, lenticular fine-grained sandstones with small-scale HCS.
The middle part of the formation contains a fining upward succession (thick ca. 25 m) made up of coarse-grained arkosic sandstones with grading of medium and thin-bedded siltstones. The former are characterized by common amalgamated HCS and SCS. The upper portion records an increase in the dark shale content intercalated with fine-grained sandstone and siltstone showing badly preserved HCS, SCS and plane parallel lamination.
The transition to the Dalan Formations occurs through about 5 m of thin bedded limestones, often dolomitized, and marly limestones interlayered with dark shales. In the carbonate layers of this interval, when not dolomitized, scattered poorly preserved bioclasts were recorded. This interval is overlain by thick bioclastic limestones, mainly containing corals, bryozoans, crinoids, brachiopods, gastropods and foraminifers.
Spina et al. [21] dated the lower-middle part of the succession as Roadian-Wordian (OSPZ5) and the upper part as Wordian-Capitanian (OSPZ 6; Figure 2).

3.2. The Kuh e Faraghan Section

The Faraghan Formation, in its type locality at Kuh e Faraghan, about 80 km N of Bandar Abbas, in the SW High Zagros, is ca. 55 m thick and unconformably overlies the alluvial to tidal Zakeen Formation of Devonian age [21,22,81,89,100] (Figure 1 and Figure 3). In this section, the lower part of the Faraghan Formation consists of green medium to thick-bedded sandstones with herringbone and heterolithic structures. These are capped by an alternation of thin to medium-bedded sandstones with black shale intercalations in the middle portion. The sandstone beds, mainly arenites, show planar and trough cross-bedding with common erosive bases [89]. Similar sedimentary structures and thicker sandstone layers, mainly of brown arkoses, characterize the middle part of the Faraghan Formation [89], passing upward into an about 15 m interval of mixed carbonate-siliciclastic beds. The latter is characterized by calcareous sandstones interbedded with shales grading upwards into sandy dolostone and sandstone couplets [89]. The contact with the overlying Dalan Formation is marked by the disappearance of sandstones and by the occurrence of fossiliferous (mainly bryozoans and brachiopods) medium-bedded limestones and dolostones with thin shaly intercalations.
Spina et al. [21] attributed the lower to middle portion of the formation to the Roadian-Wordian (OSPZ5 biozone) and the upper part to Wordian-Capitanian (OSPZ6 Biozone; Figure 3).

4. Materials and Methods

Fourteen samples, including shales, marly limestone and fine-grained sandstones, were collected from the Faraghan Formation: ten from the Darreh Yas section and four from the Kuh e Faraghan section.

4.1. Concentration of Organic Matter

Samples were processed at the Sedimentary Organic Matter Laboratory of the Department of Physics and Geology of University of Perugia (Italy) and at the Centro de Investigação Marinha e Ambiental (CIMA), University of Algarve (Portugal) following the technical procedures proposed by Traverse [101] and Buratti and Cirilli [102]. Twenty grams of each sample were crushed and processed using hydrochloric acid (HCl, 37%) and hydrofluoric acid (HF, 50%). The organic residue was then split in two parts, one of which was treated in 30% boiling hydrochloric acid for 1 h for removal of fluorosilicates and sieved with a 10 mm filter. This residue was used for palynofacies study, whereas the unboiled part of the residue was used for organic matter studies. The palynological slides are stored at the Sedimentary Organic Matter Laboratory of the Department of Physics and Geology of University of Perugia (Italy).

4.2. Palynofacies Analysis and Graphical Representation

The concept of palynofacies refers to a distinctive assemblage of OM palyno-debris dispersed or concentrated within sedimentary deposits. Palynofacies analysis can be applied for a preliminary qualitative or semi-quantitative determination of hydrocarbon source rock potential, and qualification of bulk rock geochemical parameters [101,103]. The use of palynofacies, integrated with lithofacies, can highlight particular environmental conditions, for example, the onshore-offshore directions or paleoecological conditions including salinity, oxygen content, redox potential and productivity [61,104,105,106,107,108,109,110,111,112,113]. In the present study, palynofacies analyses were also used for this purpose, although only a limited number of samples were collected using a strategy based on potential palynomorphs content. As a consequence, there was a bias in favor of shaly and silty lithologies.
The main organic components commonly found in the palynofacies of the Faraghan Formation are listed below:
(1)
Phytoclasts: microscopic particles of lignin-cellulosic tissues of terrestrial macrophytes-derived kerogen including opaque and translucent phytoclasts. The first group, being carbonized black woody tissues (including charcoal), are the most stable and can be transported for a long distance;
(2)
Palynomorphs are organic-walled microfossils, including sporomorphs (i.e., spores and saccate pollens) and phytoplankton (i.e., acritarchs). High sporomorph/phytoplankton ratio, as well as the abundance of ornamented spores, reflects proximity of the sedimentary environment to the land masses. Saccate pollen grains and small thin-walled smooth spores and non-saccate pollens, due to their buoyancy, can be dispersed over long distances by wind and water currents;
(3)
AOM (Amorphous Organic Matter) is fine-grained OM mainly resulting from bacterial degradation of particulate organic matter. It can be abundant in dysoxic to anoxic environments.
The organic debris content of the Faraghan Formation was measured quantitatively: at least 300 particles per sample were counted and converted to relative proportions.

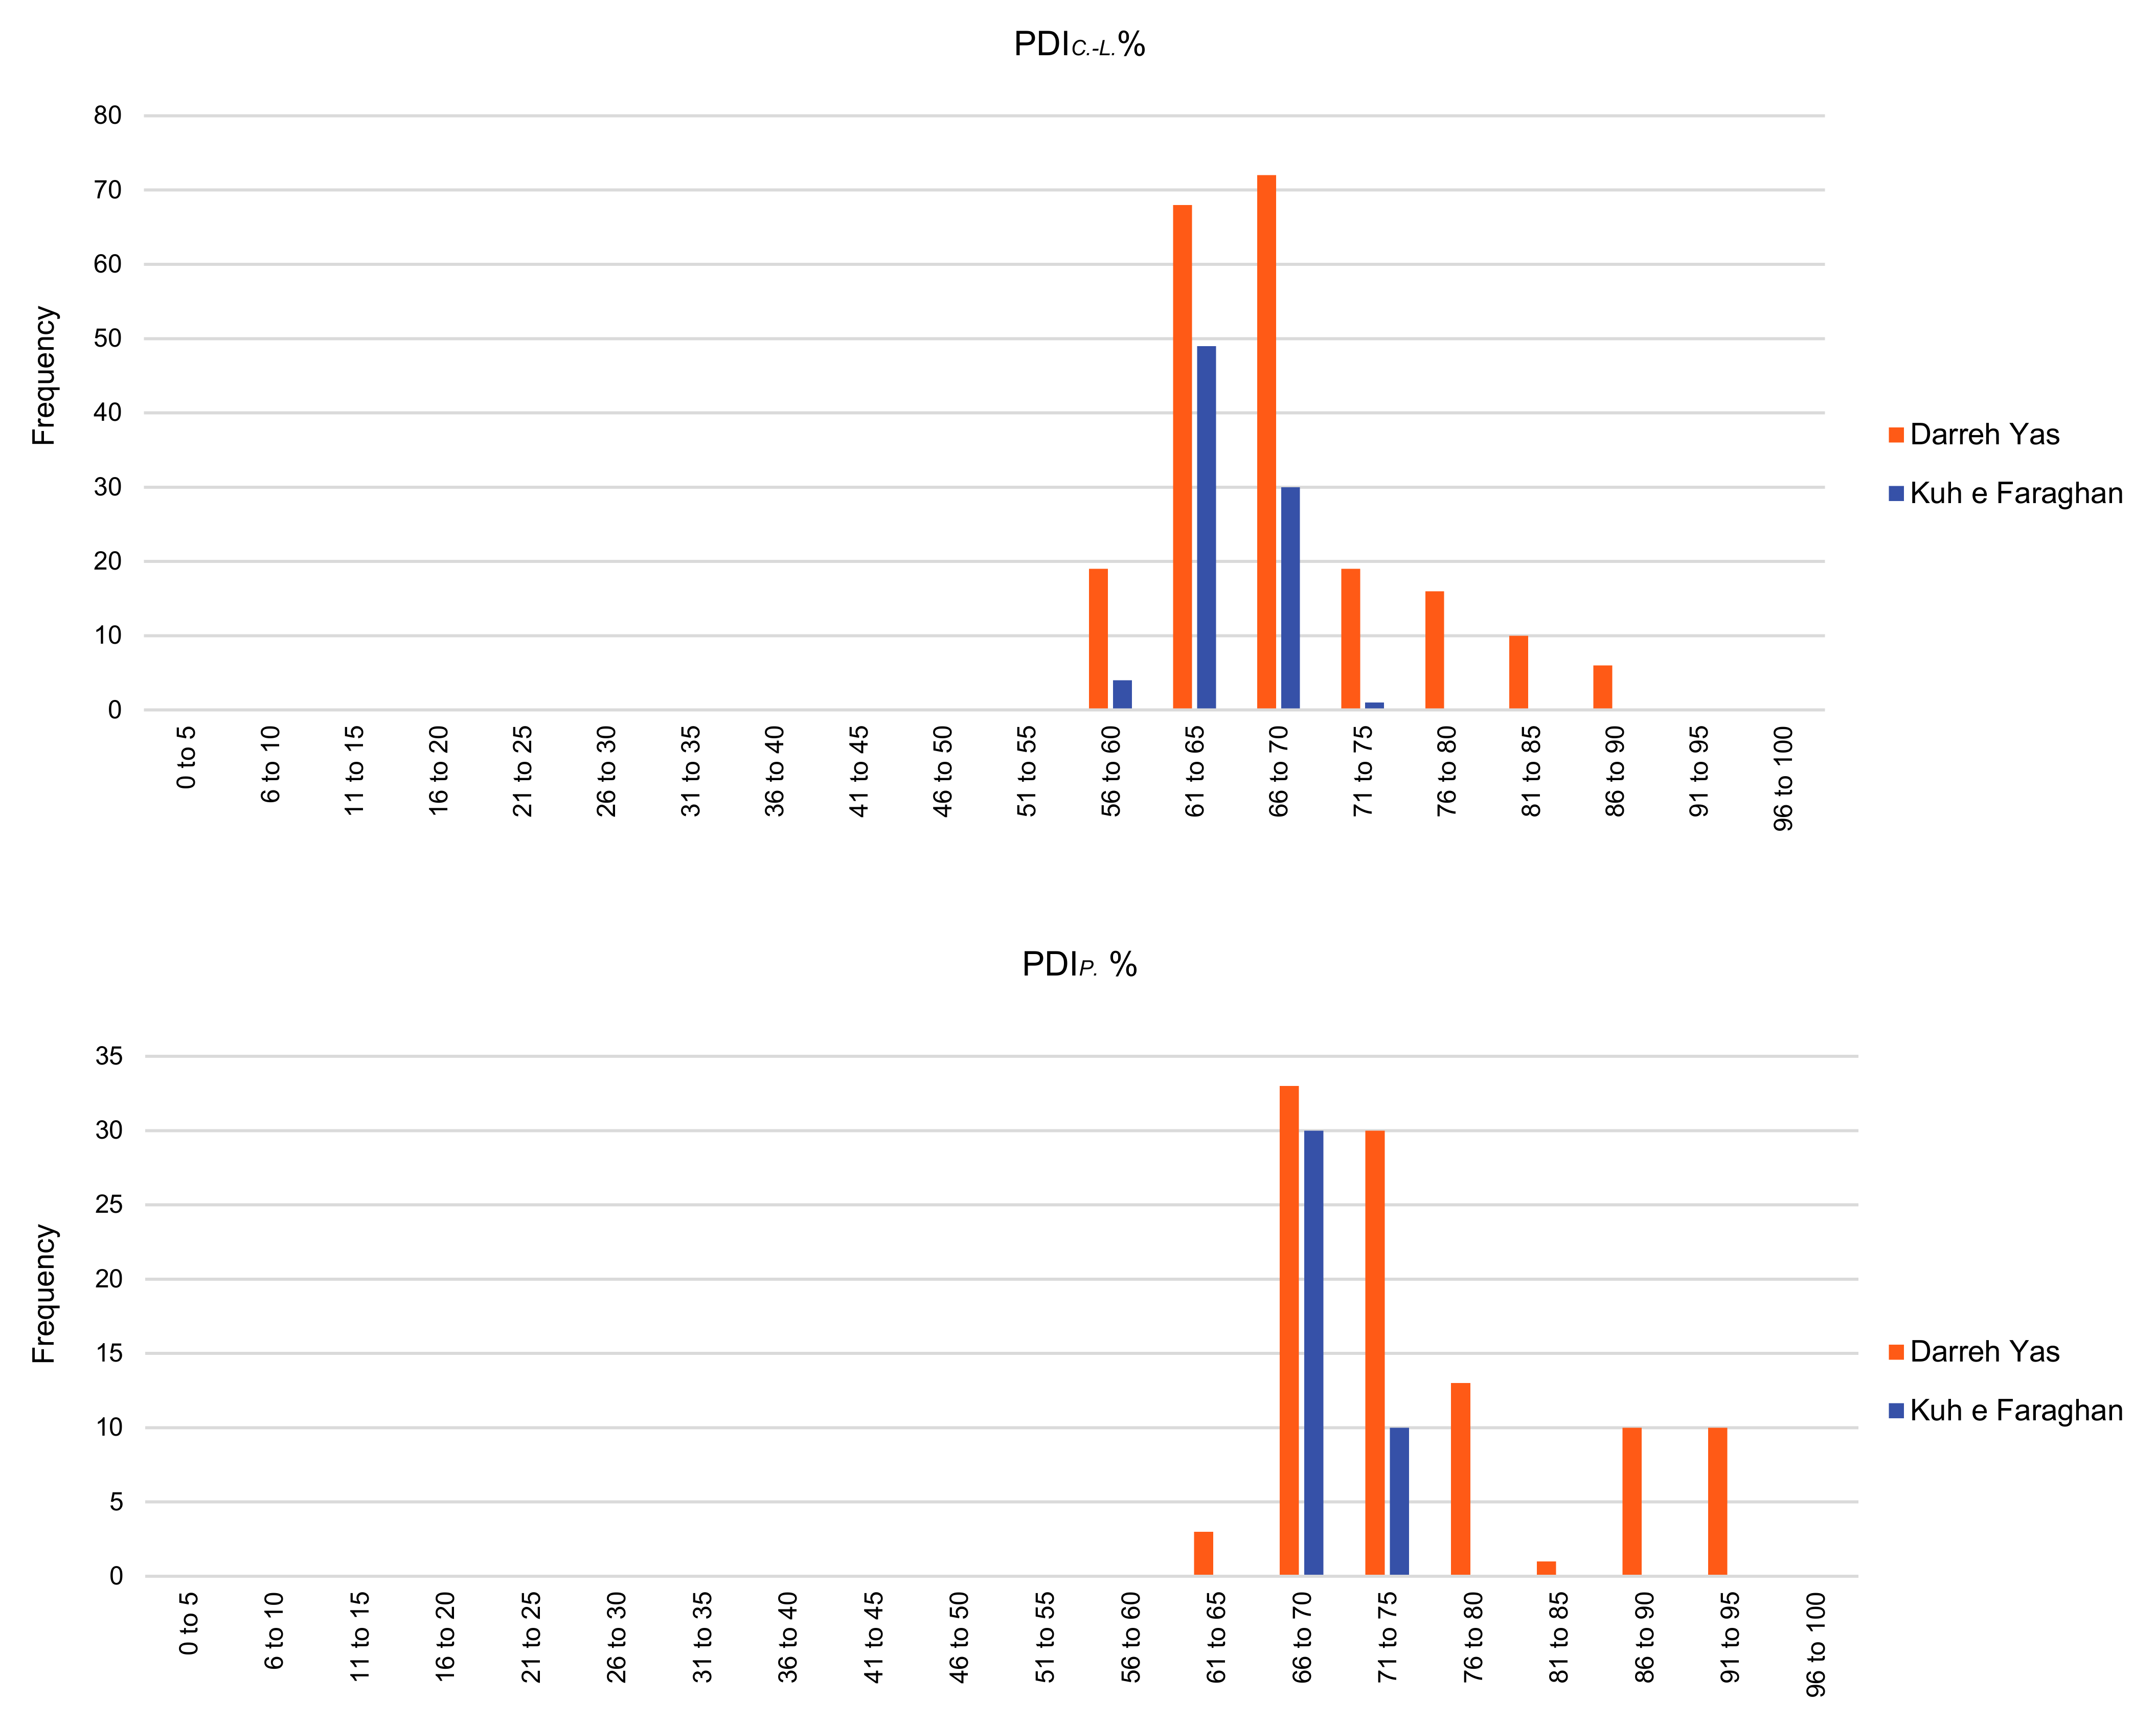
4.3. Palynomorph Darkness Index (PDI)

PDI is calculated from the measurement of the red, green and blue (RGB) intensities of light transmitted through palynomorphs to compute a single grayscale value [47]. In the present study, sporomorphs were digitally imaged using a Leica DM1000® microscope, with a LeicaICC50® with 3.1 mpx resolution digital camera, and LAS EZ® image acquisition software. The palynomorph content obtained from the Faraghan Formation was suitable for PDI analysis. Unornamented, smooth and unaltered spores were selected for PDI studies (Table 1). PDI has previously been applied in several geological settings, at different maturation levels and on different palynological assemblages [35,38,114,115], though more research is still clearly needed to calibrate PDI against VR. The main limitation of this technique is that, at the same thermal maturity level, PDI differs among different types of palynomorphs, mainly due to differences in wall thickness and composition [36,38,114,116]. To circumvent this problem in this work, PDI values from Calamospora-Laevigatosporites (PDIC.L.) and Puntactisporites (PDIP) were recorded separately. Approximately forty spores (ca. 20 Punctatisporites spp. and ca. 20 Calamospora spp. and Laevigatosporites spp.) per sample were selected. Ten measurements of ca. 16 μm2 areas were performed for each spore. Images were collected at a constant illumination setting, using 40× magnification. These images were analyzed using ImageJ, an open-source Java image processing program (http://imagej.net/ImageJ, accessed on 25 August 2021).

4.4. Thermal Alteration Index (TAI) and Spore Color Index (SCI)

In the present study, thermal maturity of OM was also analyzed using other optical microscopy methods such as the Thermal Alteration Index (TAI) [43] and the Spore Color Index (SCI) [117,118,119,120,121]. These methods are essentially based on the change in color (from yellow pale to black) of organic particulate debris with increasing thermal increments in the lower range of thermal maturity. As with PDI, only routine palynological preparations are required to use optical methods such as TAI and SCI. With proper standardization of techniques, arbitrary numerical values (e.g., TAI, a five-point scale and SCI, a ten-point scale) were applied to the color change sequence. In the present study, TAI and SCI were assessed from the color of smooth, unfolded and unornamented miospore specimens in unoxidized residues based on a visual comparison to Munsell color standards as proposed by Pearson [122] in Traverse [101]. Approximately fifty miospores per sample were analyzed in order to estimate TAI and SCI (Table 1).

4.5. Spore UV Fluorescence

Qualitative spore UV Fluorescence colors are an indicator of thermal maturity of OM useful for low-rank rocks up to the beginning of the oil window (Ro ≈ 1.35–1.50%; e.g., [38,123,124,125,126,127,128]. Fluorescence microscopy is used to evaluate the level of maturation of a rock from fluorescence colors and spectra [126,129,130]. Organic maturation causes a gradual shift in fluorescence colors (red shift) from shorter to longer wavelengths, that varies from blue and green to yellow, orange and finally, red. Sporinite (a liptinite maceral originating from the outer cell walls of spores and pollens) displays consistent changes in fluorescence color spectra and intensity with increasing organic maturation. The sporomorph exine’s fluorescence shifts from green through yellow, orange and finally, red to dark brown, with increasing maturity up to the condensate stage, after which it no longer fluoresces.
In this study, the qualitative analysis of fluorescence colors of in situ spores was made in the University of the Algarve using an Olympus BX 51 microscope equipped with a metal halide lamp fluorescence unit (XCite Series 120Q) and with a violet and Blue +12 filter block that generates a wavelength band of 390–490 nm. This system was allowed to stabilize for 5 min before any observation of the fluorescence of palynomorphs was attempted. Suitable spore species with smooth and medium thick exine, were subjected to 5 min of excitation, after which their fluorescence colors were recorded. The qualitative fluorescence colors are indicated as blue (B), green (G), yellow (Y), dark yellow (DY), orange (O), dark orange (DO) and red (R). Results are shown in Table 1.

4.6. Vitrinite Reflectance (VR)

VR is a well-established technique and parameter for organic maturation assessment of coals and sedimentary rocks (e.g., [42]). The measurement of VR was made on polished slides, mounted according to the method described by Hillier and Marshall [131]. Mean random vitrinite reflectance in oil immersion (%Ro) was the VR parameter selected for organic maturation assessment. VR identification and measurements followed the ASTM D7708-14 (2014), ISO 7404-5 (2009) and the International Committee for Coal and Organic Petrology (1998) recommendations. VR measurements were performed at the CIMA, Portugal, using an Olympus BX-51 microscope with a 50× oil-immersion objective lens and equipped with a black and white Olympus XC-50 digital camera. The grayscale (8-bit) microphotographs of the vitrinite particles were analyzed using a graphical tool, named VITRINITE, which runs within the open source Mirone program (http://joa-quim.pt/mirone/, accessed on 25 August 2021) and calibrates the scale of 256 gray levels with standards of known reflectivity [28]. The standards used in this study had the following reflectance values: 0.00%, 0.428%, 0.595%, 0.897%, 1.314%, 1.715%, 3.15% and 5.37%. VR was measured in non-polarized incident light with a wavelength of 546 nm and immersion oil with a refractive index of 1.518 at a room temperature of 20 °C. VR is mainly used as an indicator of maturity in hydrocarbon source rocks. VR was performed on 6 samples, 4 from Kuh e Faraghan section and 2 from Darreh Yas section. When possible, at least one hundred reflectance values were measured across the polished thin sections and their arithmetic mean and standard deviation were calculated (Table 1). The arithmetic mean was considered to be the true %Ro for the sample. Paleotemperatures were calculated using the empirical equation of Barker [132] that computes peak paleotemperature from VR value ([T(°C) = 104ln(Ro) + 148], where T(°C) is the maximum paleotemperature attained by the rock and Ro was the VR value measured in the rock.

4.7. Raman Spectroscopy

Raman spectroscopy is a powerful non-destructive tool that is used to quantitatively evaluate thermal maturity of OM through a wide range of maturity ranks [33,35,50,52,57,133].
MicroRaman spectra were acquired using a Jobin Yvon MicroRaman LabRam system in a backscattering geometry, in the range of 700–2300 cm−1 (first order Raman spectrum) using a 600 grooves/mm spectrometer gratings and CCD detector under a maximum of 50× optical power at the Department of Sciences of Roma Tre University, Italy.
A laser source Neodimium-Yag at 532 nm (green laser) was used as the light source and optical filters adjusted the power of the laser (<0.6 mW). The Raman backscattering was recorded after an integration time of 20 s for 6 repetitions for each measurement. The laser was focused on the sample under transmitted illumination and the Raman signal was collected between 1000 and 2000 cm−1. The first analysis performed on the spectra is the removal of the high fluorescence background by baseline subtraction procedure using a third order polynomial curve that best followed the real trend of the fluorescence in the most immature samples with high fluorescence background. The baseline point was fixed at 1000 and 1850 cm−1 for all spectra, according to Schito et al. [33]. After removal of background, the spectra were deconvoluted using LabSpec 5 software by Horiba according to the procedure described in Schito et al. [33]. Raman bands in the first order consist of two bands known as the D (disorder) and G (graphite) bands [134] and other bands depending on the thermal maturity degree. Raman thermal maturity parameters were derived from changes in relative position and intensity and area of the main bands that composed the spectrum (see [133] for a complete review).

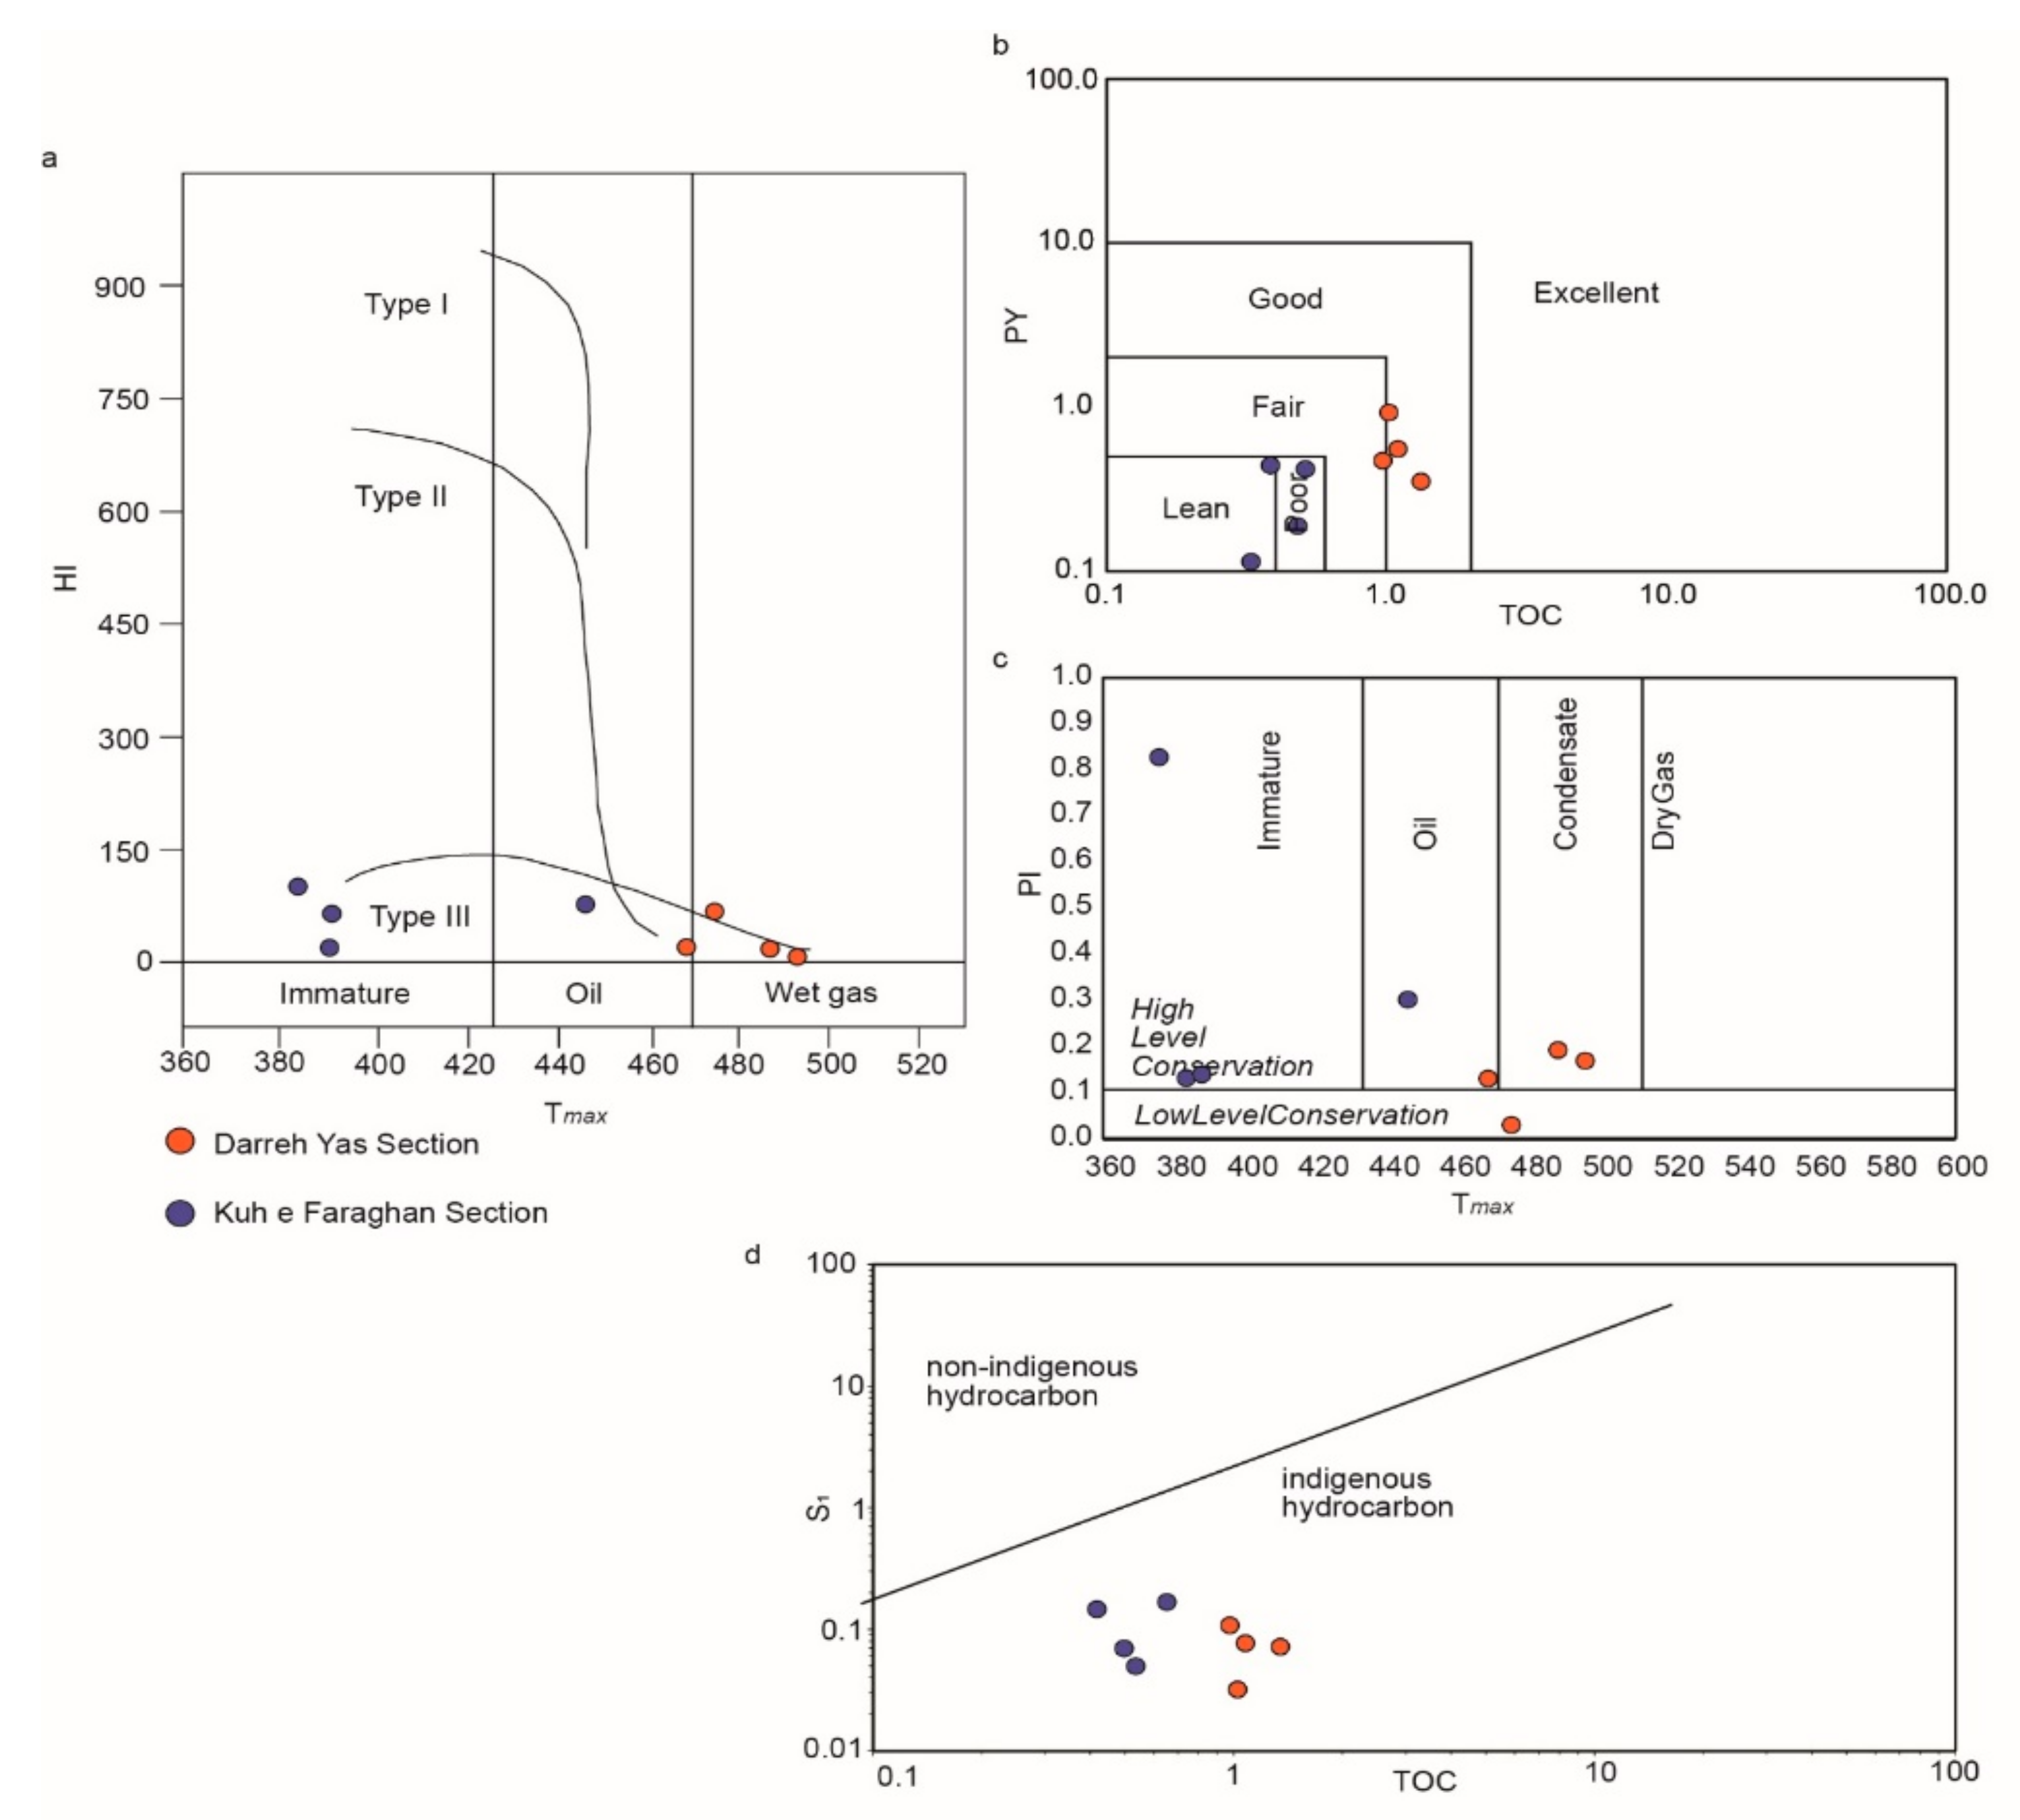
4.8. Rock Eval Pyrolysis

Rock Eval pyrolysis aims to determine the type and maturity of the OM and to characterize the petroleum potential of the sedimentary rocks (e.g., [135,136,137,138]). Rock Eval pyrolysis was performed for four surface samples of Darreh Yas and Kuh e Faraghan sections, respectively (Table 1). The parameters given by the Rock Eval are the total organic carbon content (TOC, in weight %), the volatile hydrocarbon (HC) content (S1 in mg HC/g rock), the petroleum potential (S2 in mg HC/g of rock), the volatile carbon dioxide (CO2) content (S3 in mg HC/g rock), the production index (PI = S1/(S1 + S2)); the hydrogen index (HI = S2 × 100/TOC in mg HC/g TOC), depending on the origin and state of preservation of the OM; the Oxygen Index (OI = S3 × 100/TOC in mg HC/g TOC) and temperature at maximum of S2 peak (Tmax in °C), an indicator of thermal maturity of the OM, and the potential yield (PY = S1 + S2 in mg/g). Rock Eval Pyrolysis analysis (REVI) was performed at the Amirkabir University of Technology (Tehran, Iran).

5. Results

Palynofacies data are presented as bar charts (Figure 2 and Figure 3) and are also plotted in the ternary AOM-Phytoclast-Palynomorph diagram of Tyson [113] (Figure 4), where each one of the nine kerogen assemblage areas represents different palynofacies and paleoenvironment. This also suggests relative proximity to terrestrial OM sources, the redox status of the depositional sub-environments controlling AOM preservation and the kerogen type.
The results obtained by thermal maturity analyses (Rock Eval pyrolysis, MicroRaman spectroscopy, TAI and SCI, PDI, Vitrinite Reflectance and Spore UV Fluorescence) are shown in Table 1.
Table 1. Summary of PDI, TAI, SCI, Rock-Eval Pyrolysis, Ro, MicroRaman and UV Fluorescence data.
SamplePDIC.-L.%PDIP.%TAISCITmaxHIOITOCS1S2S3PIPY%RoSDPaleotemp.%Ro RA2SDFluorescence
Darreh Yas
1326864693848849160.980.110.480.160.190.59-----DO
1326666763.38---------1.240.12170.4--B
1326577893.3949427101.320.070.350.130.170.42-----B
1326478903.39------------1.2450.03B
1326367743.38/946950161.090.080.550.170.130.631.230.12170.00.990.17B
1326267723.38/9------------1.070.15B
1326165703847591241.030.030.940.250.030.97-----DO
13256636938--------------DO
13255636938--------------DO
13254697138--------------DO
Kuh e
Faraghan
RE-2519646938383102860.490.070.5-0.120.571.060.13154.0--DO
RE-2518677039446621180.660.170.41-0.290.581.130.12160.5--DO
RE-2517657138/937471000.420.150.03-0.810.181.060.16154.0--DO
RE-2516636938/9377561110.540.050.3-0.130.351.040.11152.0--DO

5.1. Palynofacies Analysis

5.1.1. Darreh Yas Section

The lower-middle portion of the Faraghan Formation, included in the OSPZ5 zone (from 10 m to about 40 m) and mostly composed of sandstones and minor shales, contains abundant phytoclasts (Figure 2; Scheme 1).
Among these, the percentage of opaque phytoclasts is 51% at the base, increasing upward (65%) in the lower part of the thick package of sandstones, and then decreasing upward in the siltstone intervals (43%). The translucent phytoclast content slightly increases upward passing from 20% to 27%. Among the sporomorphs, the percentage of smooth and ornamented spores is constantly low (1%), while pollen slightly increases upward, from 13% to 15%. Among the pollen, the monosaccate percentage slightly fluctuates through the interval (from a minimum of 3% to a maximum of 8%) and bisaccates increase was upwards, from 8% to 12%. A low to moderate percentage of AOM is present through the whole interval, never exceeding 18%, a value corresponding to the lowest amount of phytoclasts. The level recording the lowest amount of AOM (5%) is at the base of the thick sandstone interval, where the phytoclast group reaches its maximum value (83%). The upper portion of the succession, lying within the lower OSPZ6 zone (from 40 to 57 m), mostly consisting of shale, siltstone and rare sandstone intercalations, displays different palynofacies. The total phytoclast amount is always high, ranging from 58% to 67%, reaching the maximum at the top (82.6%). It decreases (69.5%) within the shales intercalated with limestones at the transition with the overlying Dalan Formation. The amount of opaque phytoclasts gradually increases in the upper part of the Faraghan Formation (from 20% to 59.8%), then decreases (39.8%) in the lower part of Dalan Formation. The translucent phytoclasts show an opposite trend, decreasing upwards (38% to 22.8%) and slightly increasing (29.7%) within the Dalan Formation. Among the pollen, bisaccates are more abundant than monosaccates and their percentage is higher in the thick shaly interval (18% to 22%), and lower in the transitional interval to the Dalan Formation (5–7.9%). The amount of monosaccate decreases upwards ranging from 8% to 2%. Spores (mainly ornamented) are slightly more abundant than the underlying portion of succession. The AOM shows the same values recorded in the lower part of the formation and reaches its maximum (18%) at the top of the thick package of shales and within the shale interval at the base of the Dalan Formation (15%). Among marine elements, rare acritarchs, less than 1%, occur only in the upper part of the Faraghan formation and in the lower interval of the Dalan Formation (Figure 2).

5.1.2. Kuh e Faraghan Section

The interval of the Faraghan Formation bracketing the uppermost OSPZ5 zone and the lower OSPZ6 zone (from 16 m to 24 m; Figure 3) is characterized by thin-bedded shale and sandstone alternations that evolve upwards into a thick package of sandstones. This interval shows palynofacies dominated by phytoclasts, although the overall percentage is lower than that recorded in the lower-middle portion of the Faraghan Formation in the Darreh Yas section. Opaque phytoclasts are consistently more abundant than the translucent ones across the whole interval slightly diminishing upwards (from 41.8% to 38.6%). Among the sporomorphs, bisaccate pollen dominate over monosaccates with percentages ranging from 16% to 21%, in the lower sampled interval to 19% upwards, compared to the lower percentage of monosaccates (6–9% on average). Spores, both ornamented and smooth, are rare through the whole sampled interval, with a relatively higher percentage (5%) in the lower part of the shale and siltstone intervals. The AOM values are generally moderate but increase in the lower-mid part of the sampled interval (from 10% to 25%) and slightly decrease upwards (20%). The highest value is recorded at the top of the thick package of shaly-siltstone intercalations. Very few acritarchs (less than 1%) are present throughout all the sampled succession (Figure 3; Scheme 1).

5.2. Thermal Alteration Index (TAI) and Spore Color Index (SCI)

As shown in Table 1 and Figure 5, the Darreh Yas section samples show TAI and SCI values ranging from 3.0 to 3.3 and from 8 to 9, respectively, falling within the mature stage of hydrocarbon generation. TAI and SCI values from Kuh e Faraghan section correspond to 3 and to 8/9, respectively, indicating a mature to postmature stage (end of oil to condensate window) of OM, with similar results from the Darreh Yas section (Table 1).

5.3. Palynomorph Darkness Index (PDI)

PDI values from Calamospora-Laevigatosporites (PDIC-L) and Punctatisporites (PDIP) specimens obtained from the Darreh Yas section are generally higher than from the Kuh e Faraghan section ones (Table 1). In the Darreh Yas section, PDIC-L values range from 63% to 66%, except for the samples from 13264 and 13265 (78% and 89%, respectively). Different results were obtained for PDI measures of Punctatisporites ranging from 69% to 76% with maxima of 90% and 89% at 13264 and 13265 samples, respectively. Smooth spores belonging to Calamospora, Laevigatosporites and Punctatisporites from the Kuh e Faraghan section generally have lower PDI values ranging from 54% to 58% (PDIC-L) and from 60% to 62% (PDIP).

5.4. Spore UV Fluorescence

Fluorescence colors of miospores observed from the Darreh Yas samples ranged from dark orange (samples 13,254 to 13,261 and 13,268) to brown (samples 13,262 to 13,266), whereas from the Kuh e Faraghan section a UV fluorescence color of dark orange was observed (Table 1).

5.5. Vitrinite Reflectance (VR)

In the Darreh Yas, VR values, from 13,263 and 13,266 samples, are about 1.23% Ro and 1.24% Ro, corresponding to ca. 170 °C and 170.4 °C, respectively. Lower values were documented in the Kuh e Faraghan section, where VR is around 1%Ro. The related paleotemperature corresponded to ca. 140 °C (Table 1).

5.6. Rock Eval Pyrolysis

In the Darreh Yas section, TOC values ranged from 0.98% to 1.32%. Tmax obtained by Rock Eval Pyrolysis ranged from 469 °C and 494 °C, S1 from 0.03 mg/g to 0.11 mg/g, S2 from 0.35 mg/g to 0.94 mg/g and S3 from 0.13 mg/g to 0.25 mg/g. The values of HI obtained range from 27 to 91, OI from 10 to 24, PY from 0.42 to 0.97 and PI from 0.03 to 0.19. In the Kuh e Faraghan section, TOC values are lower, ranging from 0.42% to 0.66% as well as Tmax varying from 374 °C to 446 °C. Other parameters such as S1 ranged from 0.05 mg/g to 0.17 mg/g; S2 from 0.03 mg/g to 0.5 mg/g. The values of HI obtained range from 7 to 102, OI from 86 to 118, PY from 0.18 to 0.58 and PI from 0.12 to 0.81 (Table 1 and Figure 5).

5.7. MicroRaman Spectroscopy

Raman spectra were acquired from palynological organic residues used for fluorescence and PDI analyses in order to identify the same palynomorphs. Sufficient palynomorphs for a reliable thermal maturity estimation based on Raman spectra were only obtained from three samples. Spectra generally show typical features of the high diagenetic realm and can be fitted by a six-band deconvolution according to Guedes et al. [139] and Schito et al. [33]. The most used Raman parameters for thermal maturity assessment are, in general, the distance width ratio between D and G bands [133], and the area ratio between bands in the D band region and those in the G band region, namely RA2 parameter [33,49]. The distance between D and G bands shows values between about 230 and 240 cm−1, while the width ratio lies at around 1.6–1.7 and the RA2 parameters between 0.9 and 1.0. Conversion of the RA2 parameter into vitrinite reflectance equivalent, according to Schito et al. [33], indicates values between ca. 1.00 and 1.30 %Ro (Table 1).

6. Discussion

6.1. Depositional Setting

There are few previous studies on sedimentary facies analysis and depositional environment of the Faraghan Formation [13,14,81,89]. The integration of lithofacies and palynofacies analyses from the two studied sections offers additional data for paleoenvironmental interpretation. In the Darreh Yas section, the overall high ratio of continental organic microflora and debris to marine ones, points to a depositional environment near to the continental area inhabited by the parent plants. The basal portion of the Faraghan Formation could be referred to an initial transgressive phase (related to the opening of Neo-Tethys Ocean). The lithofacies and sedimentary structures, e.g., the basal conglomerates and the coarse-grained sandstones characterized by trough cross-stratification, plane parallel bedding, HCS and SCS suggest a shoreface depositional environment. In this setting, the organic matter is commonly absent or badly preserved because of the constant high energy and oxygenation. This is the reason why this interval proved not promising for palynological investigations. The increase in siliciclastic mudstone intercalations and the thinning of sandstone beds, together with the presence of small-scale HCS, suggests a basinward shift of the depositional environment where the sedimentation occurred between the fair-weather and storm wave bases (FWWB and SWB; e.g., upper offshore). In this interval, the lower energy conditions favored OM preservation, showing small-scale shifts from dysoxic shelf to basin transition to marginal dysoxic basin and return to dysoxic shelf to basin transition (Figure 4a).
The thick sandstone-dominated interval of the middle portion records the return of a depositional setting above the FWWB, characterized by higher energy currents temporarily induced by storms (e.g., amalgamated HCS and SCS). This interval, like the basal part, lacks preserved organic matter, except for the uppermost siltstone beds where palynofacies suggest deposition in marginal dysoxic-anoxic condition (field II, Figure 4a). As in the lower portion, the depositional environment changes towards distal and relative deeper conditions as highlighted by an overall increase of mudstone intercalations and occurrence of small-scale HCS and plane parallel lamination. This interpretation is also confirmed by the palynofacies that indicate a shift from distal heterolithic oxic shelf to marginal dysoxic-anoxic condition (Figure 4a). More distal conditions are indicated by the increase of opaque phytoclasts and by the moderate amount of bisaccate pollen that, due to their buoyancy, can be transported also far from their continental source area. The contemporaneous increase in AOM also suggests an anoxic-dysoxic upper offshore.
The gradual appearance of carbonate deposits at the base of the overlying Dalan Formation reveals the first stage in the development of a carbonate platform that became successful in the late middle Permian and Triassic sedimentary record of the Zagros Basin [64,76,84,89].
The shaly intercalations in this interval can be interpreted as being to the initial suppression of carbonate production, inducing an increase of water turbidity and preventing the flourishing of the carbonate benthic community. This is documented also by the palynofacies from the last shaly interval referring to a marginal anoxic-dysoxic condition that temporarily inhibited the carbonate production. Therefore, based on the lithofacies and palynofacies, the overall depositional setting is attributed to a coastal environment spanning from the shoreface to the upper offshore. The sediments feeding this siliclastic shelf were probably delivered by nearby deltaic systems such as that reconstructed by Szabo and Kheradpir [14] in the Chal i Sheh area.
In the Kuh e Faraghan section, Ashgari [89] interpreted the bidirectional and lenticular sandstone of the lower Faraghan Formation as having been deposited in a sandy tidal flat evolving through time into deeper conditions in an overall transgressive regime. In this interpretation, the middle part, including erosive bases and trough cross-bedded sandstones with shale intercalations, is referred to as shoreface and upper offshore settings. Despite the low number of productive samples, palynofacies data are consistent with this interpretation, referring this interval to a depositional environment ranging from heterolithic oxic distal shelf to dysoxic shelf to basin transition (Figure 4b).
Regressive deposits characterize the upper part of the Faraghan Formation, generating a shallowing upward trend spanning the upper offshore up to a mixed carbonate-siliciclastic shoreface environment. The transition with the Dalan Formation is marked by the disappearance of sandstones and a gradual increase in carbonate deposits, intercalated with shales. As in the Darreh Yas section, these lithological features record the progressive attempts for the onset of a carbonate-dominated environment. This was favored by the increasing water transparency due to the reducing siliciclastic supply. The new ecological conditions allowed the bloom of carbonate shell organisms (mainly bryozoans and brachiopods) and the definitive development of the carbonate factory of the Dalan Formation.

6.2. Thermal Maturity Assessment and Source Rock Characterization

In the Darreh Yas section, TOC values are close to 1%. VR values are ca. 1.23% and Tmax values lie between 469 °C and 494 °C, indicating a late mature stage (boundary between oil and wet gas windows) according to Tissot and Welte [24] and Espitaliè et al. [140]. Low HI values suggest Type II or III and gas prone kerogen (Figure 5a) corresponding to altered OM of marine origin and/or to terrestrial OM. Moreover, the palynofacies data (Figure 2 and Figure 4a) match these results confining the origin of OM as continental (Figure 4a). The source rock quality is variable and classified as moderate to good source rock richness, with the majority of samples showing medium source potential [141] (Figure 5b).
In contrast to the aforementioned, in the Kuh e Faraghan section, the TOC value is low and the PY-TOC plot suggests lean to poor source rock potential (Figure 5b). Analogously, the Tmax (from 374 °C to 446 °C) is low and, according to the Espitaliè et al. [140] and PI-Tmax diagrams, indicates the diagenesis to low catagenesis stage of OM (Figure 5a,c).
This large Tmax discrepancy recorded in the two sections cannot be explained by different thermal histories, in view of the similar burial and tectonic evolution throughout the Zagros Basin [63,76]. It is highly possible that the low Tmax values from the Kuh e Faraghan section could be the results of a ‘mineral matrix effect’ caused by the low amount of organic carbon (TOC ~ 0.5%) [62,137,140,142,143,144]. On the other hand, it has also been suggested that in samples whose S2 < 0.2 mg/g, Tmax values could be unreliable [145]. Very low pyrolysate weights can characterize overmature samples. The S2 peaks of such samples can be marked by multimodal patterns [144,146] in which diverse peaks represent the cracking of organic matter with diverse kinetics (e.g., pyrobitumen, solid bitumen or kerogen). Consequently, Rock Eval Pyrolysis data as S1 and TOC were plotted in the diagram of Hunt [147] in order to distinguish between impregnation and contamination from indigenous hydrocarbons (Figure 5d). Based on values of S1-TOC parameters from the Faraghan Formation in both Kuh e Faraghan and Darreh Yas sections, the values, above the diagonal line, indicate non-indigenous hydrocarbons whereas values below the line are indigenous (Figure 5d). According to the criteria proposed by Hunt [147], all samples analyzed are non-contaminated.
However, data from Rock Eval Pyrolysis analyses from material collected in outcrops should be treated with caution. The rocks sampled could have been subjected to processes including surface weathering and oxidation that have affected the Rock Eval Pyrolysis and TOC results [137,148,149,150,151].
In the Darreh Yas section, data from optical analysis such as SCI and TAI, range from 8 to 9 and from 3 to 3.3, respectively, suggesting thermal maturity spanning the end of the oil window to the gas condensate zone [42,119], whereas VR and VR equivalent data from Raman parameters indicate a thermal maturity just at the floor of the wet gas window (%Ro RA2 ca. 1.2). VR values (Table 1; Figure 6; Scheme 2) are consistent with TAI, SCI and UV Fluorescence data obtained from in situ sporomorphs which indicate a similar stage of maturity (floor of the oil window).
Figure 5. (a) Relationship between HI and Tmax plotted in the diagram of Espitalié et al. [140]; (b) Cross-plot of the relationship between TOC vs. PY; (c) Cross-plot of the relationship between the pyrolysis Tmax vs. PI; (d) Cross-plot of the relationship between the pyrolysis TOC vs. S1 of the Faraghan Formation at the Darreh Yas and Kuh e Faraghan sections.
Geosciences 11 00484 g005
In the Kuh e Faraghan section, TAI and SCI values from in situ and well-preserved sporomorphs, indicate a late oil/early wet gas stage. VR values of Ro 1.04–1.01% are consistent with TAI/SCI and indicate a position just below the onset of wet gas generation (Table 1). These optical data confirm the unreliability of the Tmax values.
A further constraint for thermal maturity estimation of the Darreh Yas section can also be obtained by combining measured Ro (%) results with Ro (%) eq derived from Raman parameters that indicate thermal maturity at the boundary between the oil and wet gas windows. These data mostly agree with a recent work on VR data and Rock Eval Pyrolysis in NW High Zagros by a preliminary study [152] that classified the Faraghan Formation as a poor, gas-prone source rock within a post-mature interval. Moreover, the burial history model of Saberi and Rabbani [9], performed in the Coastal Fars and Iranian sector of the Persian Gulf, pointed out that the Faraghan Formation is in the same stage (wet gas) of hydrocarbon generation. The integrated results of the present study constrain the thermal maturity range of Faraghan Formation proposed by Zamanzadeh et al. [13], Rashidi [152] and Saberi and Rabbani [9], suggesting the ceiling of the oil window to the dry gas zone.
The present optical and geochemical data were correlated with PDI values, here studied for the first time in this OM maturity stage. PDIC.L. values range between 63 and 69% in the Darreh Yas section and 63–67% in the Kuh e Faraghan section, while PDIP. ranges between 69–76% in Darreh Yas and 69–71% in Kuh Faraghan (Figure 7). The higher values in samples 13265 and 13264 (between 85 and 91%) probably resulted from oxidation of the OM. (Table 1; Figure 7)
Conversion of PDI into %Ro equivalent values was tentatively proposed by Clayton et al. [115] for immature Carboniferous miospores through a very limited maturity range, while Riboulleau et al. [116] and Spina et al. [36] show consistent correlation of PDI against SCI and AAI within the oil window. In the present study, although based only on a very small dataset from the Faraghan Formation, PDI was calibrated in higher thermal maturity range than in previous investigations. Based on data from both the Darreh Yas and Kuh e Faraghan sections, PDIC.L. values between 63 and 69% and PDIP. values between 69–76% correspond to a level of thermal maturity spanning the boundary between the oil window and wet gas windows (ca 1–1.35 %Ro; Figure 8).

7. Conclusions

A multidisciplinary strategy based on geochemical (MicroRaman spectroscopy and Rock Eval Pyrolysis) and optical methods (VR, TAI, SCI, PDI and UV Fluorescence) has established that the Faraghan Formation spans the floor of the oil window, ranging from the ceiling of the oil window into the floor of the wet gas window in terms of thermal maturity, further constraining the conclusions of previous workers.
The PDI results obtained are the first to have been published from the wet gas window. They also confirm that PDI depends not only on thermal maturity but also on the thickness and structure of palynomorph, with recorded PDIC-L. values ranging from 63 to 69% and PDIP from 69–76%. These PDI ranges bracket the boundary between the oil and wet gas windows (Ro ca. 1.0–1.35%), providing a new tool for the recognition for this important maturity level. However, much more data will be needed in order to achieve good calibration of PDI against Ro and to establish PDI as an independent and rigorous method for determining thermal maturity.
Although relatively few samples were investigated, integration of lithofacies and palynofacies analyses confirmed a depositional environment for the Faraghan Formation of siliciclastic shelf, spanning the coastal (sandy tidal flat in Kuh e Faraghan and upper shoreface in Darreh Yas) to the upper offshore environments. In both sections, this terrigenous-dominated setting evolved upward into a mixed carbonate-siliciclastic system with alternating periods of enhancement and suppression of carbonate production. The former became predominant in late middle Permian time with the development of a widespread carbonate platform (e.g., the Dalan Formation).

Author Contributions

Conceptualization, A.S. (Amalia Spina), S.C. (Simonetta Cirilli), A.S. (Andrea Sorci), A.S. (Andrea Schito), G.C. and P.F.; methodology, A.S. (Amalia Spina), A.S. (Andrea Schito), Z.P., G.M., F.G., P.F. and G.C.; software, A.S. (Amalia Spina), A.S. (Andrea Sorci) and A.S. (Andrea Schito); formal analysis, A.S. (Amalia Spina), A.S. (Andrea Schito), S.C. (Simonetta Cirilli), P.F., G.M. and M.R.; investigation, A.S. (Amalia Spina), A.S. (Andrea Schito), S.C. (Simonetta Cirilli), P.F., G.M. and M.R.; writing—original draft preparation, A.S. (Amalia Spina), S.C. (Simonetta Cirilli), A.S. (Andrea Sorci), A.S. (Andrea Schito), G.C., P.F., S.C. (Sveva Corrado), Z.P., M.R. and R.R.; writing—review and editing, A.S. (Amalia Spina), S.C. (Simonetta Cirilli), A.S. (Andrea Sorci), A.S. (Andrea Schito), G.C., P.F., S.C. (Sveva Corrado), Z.P., M.R. and R.R; project administration, A.S. (Amalia Spina); funding acquisition, A.S. (Amalia Spina), A.S. (Andrea Sorci), S.C. (Simonetta Cirilli) and R.R. All authors have read and agreed to the published version of the manuscript.

Funding

This research was funded by PRIN (2017RX9XXXY-CIRILLI), by Fondo Ricerca di Base Department of Physics and Geology, University of Perugia (SPIRICBAS2018-SPINA), by the project “Paleontological Studies and Biozonation of Paleozoic Sediments in Central Iran and Zagros Basins” (coordinator R. Rettori) and MIUR grants-SORCI to PhD School of Science and Technology for Physics and Geology (XXXIV Cycle), University of Perugia; Project “Paleontological Studies and Biozonation of Paleozoic Sediments in Central Iran and Zagros Basins” (RETTORI).

Data Availability Statement

The presented data are available on request from the corresponding author.

Acknowledgments

Mansour Ghorbani (Arianzamin Pars Geological Centre) is deeply thanked for the field activity and support in each step of this research. The authors would like to thank NIOC and Arianzamin for logistical support and unlimited access to analytical facilities.

Conflicts of Interest

The authors declare that they have no competing interest.

References

  1. Bordenave, M.L. The Paleozoic Petroleum System in the Zagros Foldbelt of Iran and Contiguous Offshore. J. Pet. Geol. 2008, 33, 3–42. [Google Scholar] [CrossRef]
  2. Maurer, F.; Martini, R.; Rettori, R.; Hillgärtner, H.; Cirilli, S. The Geology of Khuff Outcrop Analogues in the Musandam Peninsula, United Arab Emirates and Oman. GeoArabia 2009, 14, 125–158. [Google Scholar] [CrossRef]
  3. Kamali, M.R.; Rezaee, M.R. Burial History Reconstruction and Thermal Modelling at Kuh-e Mond, SW Iran. J. Pet. Geol. 2003, 26, 451–464. [Google Scholar] [CrossRef]
  4. Opera, A.; Sarafdokht, H.; Janbaz, M.; Fouladvand, R.; Heidarifard, M.H. Burial History Reconstruction and Thermal Maturity Modeling for the Middle Cretaceous-Early Miocene Petroleum System, Southern Dezful Embayment, SW Iran. Int. J. Coal Geol. 2013, 120, 1–14. [Google Scholar] [CrossRef]
  5. Aldega, L.; Bigi, S.; Carminati, E.; Trippetta, F.; Corrado, S.; Kavoosi, M.A. The Zagros Fold-and-Thrust Belt in the Fars Province (Iran): II. Thermal Evolution. Mar. Pet. Geol. 2018, 93, 376–390. [Google Scholar] [CrossRef]
  6. Mahmoud, M.D.; Vaslet, D.; Husseini, M.I. The Lower Silurian Qalibah Formation of Saudi Arabia: An Important Hydrocarbon Source Rock. AAPG Bull. 1992, 76, 1491–1506. [Google Scholar] [CrossRef]
  7. Ertug, K.; Vecoli, M.; İnan, S. Palynofacies, Paleoenvironment and Thermal Maturity of Early Silurian Shales in Saudi Arabia (Qusaiba Member of Qalibah Formation). Rev. Palaeobot. Palynol. 2019, 270, 8–18. [Google Scholar] [CrossRef]
  8. Konert, G.; Afifi, A.M.; Al-Hajri, S.I.A.; Droste, H.J. Paleozoic Stratigraphy and Hydrocarbon Habitat of the Arabian Plate. GeoArabia 2001, 6, 407–442. [Google Scholar]
  9. Saberi, M.H.; Rabbani, A.R. Origin of Natural Gases in the Permo-Triassic Reservoirs of the Coastal Fars and Iranian Sector of the Persian Gulf. J. Nat. Gas Sci. Eng. 2015, 26, 558–569. [Google Scholar] [CrossRef]
  10. Saberi, M.H.; Rabbani, A.R.; Ghavidel-syooki, M. Hydrocarbon Potential and Palynological Study of the Latest Ordovician—Earliest Silurian Source Rock (Sarchahan Formation) in the Zagros Mountains, Southern Iran. Mar. Pet. Geol. 2016, 71, 12–25. [Google Scholar] [CrossRef]
  11. Jafarian, A.; Javanbakht, M.; Koeshidayatullah, A.; Pimentel, N.; Hersi, O.S.; Yahyaei, A.; Beigi, M. Paleoenvironmental, Diagenetic, and Eustatic Controls on the Permo–Triassic Carbonate–Evaporite Reservoir Quality, Upper Dalan and Kangan Formations, Lavan Gas Field, Zagros Basin. Geol. J. 2018, 53, 1442–1457. [Google Scholar] [CrossRef]
  12. Tavakoli, V.; Jamalian, A. Microporosity Evolution in Iranian Reservoirs, Dalan and Dariyan Formations, the Central Persian Gulf. J. Nat. Gas Sci. Eng. 2018, 52, 155–165. [Google Scholar] [CrossRef]
  13. Zamanzadeh, S.M.; Amini, A.; Kamali, M.R. Burial history reconstruction using late diagenetic products in the early Permian Siliciclastics of the Faraghan Formation, Southern Zagros, Iran. J. Pet. Geol. 2009, 32, 171–192. [Google Scholar] [CrossRef]
  14. Szabo, F.; Kheradpir, A. Permian and Triassic Stratigraphy, Zagros Basin, South-West Iran. J. Pet. Geol. 1978, 1, 57–82. [Google Scholar] [CrossRef]
  15. Ghavidel-syooki, M. Palynological Study and Age Determination of Faraghan in Kuhe-Faraghan, Southeast of Iran. J. Sci. Univ. Tehran 1984, 1984, 41–50. [Google Scholar]
  16. Ghavidel-syooki, M. Palynostratigraphy and Paleoecology of the Faraghan Formation of Southeastern Iran. Ph.D. Thesis, Michigan State University, East Lansing, MI, USA, 1988. [Google Scholar]
  17. Ghavidel-syooki, M. Acritarch Biostratigraphy of the Palaeozoic Rock Units in the Zagros Basin, Southern Iran. Acta-Univ. Carol. Geol. 1996, 40, 385–412. [Google Scholar] [CrossRef]
  18. Ghavidel-syooki, M. Palynostratigraphy and Palaeogeography of Early Permian Strata in the Zagros Basin, Southeast-Southwest Iran. J. Sci. Islamic Repub. Iran 1997, 8, 243–261. [Google Scholar]
  19. Ghavidel-Syooki, M. Peri-Gondwanan Acritarchs, Chitinozoans, and Miospores from Paleozoic Succession in the High Zagros Mountains, Southern Iran: Regional Stratigraphic Significance and Paleogeographic Implications. Rev. Palaeobot. Palynol. 2021, 292, 104457. [Google Scholar] [CrossRef]
  20. Ghavidel-Syooki, M. Biostratigraphy and paleobiogeography of some Paleozoic rocks at Zagros and Alborz mountains. In Treatise on the Geology of Iran; Geological Survey of Iran: Teheran, Iran, 1994; Volume 18, pp. 1–168. [Google Scholar]
  21. Spina, A.; Stephenson, M.H.; Cirilli, S.; Aria-Nasab, M.; Rettori, R. Palynostratigraphy of the Permian Faraghan Formation in the Zagros Basin, Southern Iran. Riv. Ital. Paleontol. Stratigr. 2018, 124, 573–595. [Google Scholar] [CrossRef]
  22. Spina, A.; Cirilli, S.; Sorci, A.; Clayton, G.; Gennari, V.; Ghorbani, M.; Ghorbani, M.; Ovissi, M.; Rettori, G.; Rettori, R. Palynology of the Permian Succession from the Ajabshir Area (Azerbaijan, Central Iran): A Preliminary Report. Geopersia 2020, 10, 211–225. [Google Scholar] [CrossRef]
  23. Dow, W.G. Kerogen Studies and Geological Interpretations. J. Geochem. Explor. 1977, 7, 79–99. [Google Scholar] [CrossRef]
  24. Tissot, B.P.; Welte, D.H. From Kerogen to Petroleum. Pet. Form. Occur. 1984, 160–198. [Google Scholar] [CrossRef]
  25. Hood, A.; Gutjahr, C.C.M.; Heacock, R.L. Organic Metamorphism and the Generation of Petroleum. AAPG Bull. 1975, 59, 986–996. [Google Scholar] [CrossRef]
  26. Mukhopadhyay, P.K. Vitrinite Reflectance as Maturity Parameter: Petrographic and Molecular Characterization and Its Applications to Basin Modeling; ACS: Washington, DC, USA, 1994. [Google Scholar]
  27. Suárez-Ruiz, I.; Flores, D.; Mendonça Filho, J.G.; Hackley, P.C. Review and Update of the Applications of Organic Petrology: Part 1, Geological Applications. Int. J. Coal Geol. 2012, 99, 54–112. [Google Scholar] [CrossRef]
  28. Fernandes, P.; Cogné, N.; Chew, D.M.; Rodrigues, B.; Jorge, R.C.G.S.; Marques, J.; Jamal, D.; Vasconcelos, L. The Thermal History of the Karoo Moatize-Minjova Basin, Tete Province, Mozambique: An Integrated Vitrinite Reflectance and Apatite Fission Track Thermochronology Study. J. Afr. Earth Sci. 2015, 112, 55–72. [Google Scholar] [CrossRef]
  29. Price, L.C.; Baker, C.E. Supperssion of Vitrinite Reflectance in Amorphous rich kerogen—A major unrecognized problem. J. Pet. Geol. 1985, 8, 59–84. [Google Scholar] [CrossRef]
  30. Barker, C.E.; Lewan, M.D.; Pawlewicz, M.J. The Influence of Extractable Organic Matter on Vitrinite Reflectance Suppression: A Survey of Kerogen and Coal Types. Int. J. Coal Geol. 2007, 70, 67–78. [Google Scholar] [CrossRef]
  31. Caricchi, C.; Corrado, S.; di Paolo, L.; Aldega, L.; Grigo, D. Thermal Maturity of Silurian Deposits in the Baltic Syneclise (on-Shore Polish Baltic Basin): Contribution to Unconventional Resources Assessment. Ital. J. Geosci. 2016, 135, 383–393. [Google Scholar] [CrossRef]
  32. Schito, A.; Corrado, S.; Aldega, L.; Grigo, D. Overcoming Pitfalls of Vitrinite Reflectance Measurements in the Assessment of Thermal Maturity: The Case History of the Lower Congo Basin. Mar. Pet. Geol. 2016, 74, 59–70. [Google Scholar] [CrossRef]
  33. Schito, A.; Corrado, S.; Trolese, M.; Aldega, L.; Caricchi, C.; Cirilli, S.; Grigo, D.; Guedes, A.; Romano, C.; Spina, A.; et al. Assessment of Thermal Evolution of Paleozoic Successions of the Holy Cross Mountains (Poland). Mar. Pet. Geol. 2017, 80, 112–132. [Google Scholar] [CrossRef]
  34. Schito, A.; Andreucci, B.; Aldega, L.; Corrado, S.; di Paolo, L.; Zattin, M.; Szaniawski, R.; Jankowski, L.; Mazzoli, S. Burial and Exhumation of the Western Border of the Ukrainian Shield (Podolia): A Multi-Disciplinary Approach. Basin Res. 2018, 30, 532–549. [Google Scholar] [CrossRef] [Green Version]
  35. Schito, A.; Spina, A.; Corrado, S.; Cirilli, S.; Romano, C. Comparing Optical and Raman Spectroscopic Investigations of Phytoclasts and Sporomorphs for Thermal Maturity Assessment: The Case Study of Hettangian Continental Facies in the Holy Cross Mts. (Central Poland). Mar. Pet. Geol. 2019, 104, 331–345. [Google Scholar] [CrossRef]
  36. Spina, A.; Vecoli, M.; Riboulleau, A.; Clayton, G.; Cirilli, S.; di Michele, A.; Marcogiuseppe, A.; Rettori, R.; Sassi, P.; Servais, T.; et al. Application of Palynomorph Darkness Index (PDI) to Assess the Thermal Maturity of Palynomorphs: A Case Study from North Africa. Int. J. Coal Geol. 2018, 188, 64–78. [Google Scholar] [CrossRef]
  37. Lucca, A.; Storti, F.; Molli, G.; Muchez, P.; Schito, A.; Artoni, A.; Balsamo, F.; Corrado, S.; Mariani, E.S. Seismically Enhanced Hydrothermal Plume Advection through the Process Zone of the Compione Extensional Fault, Northern Apennines, Italy. GSA Bull. 2019, 131, 547–571. [Google Scholar] [CrossRef]
  38. Sorci, A.; Cirilli, S.; Clayton, G.; Corrado, S.; Hints, O.; Goodhue, R.; Schito, A.; Spina, A. Palynomorph Optical Analyses for Thermal Maturity Assessment of Upper Ordovician (Katian-Hirnantian) Rocks from Southern Estonia. Mar. Pet. Geol. 2020, 120, 104574. [Google Scholar] [CrossRef]
  39. Tricker, P.M.; Marshall, J.E.A.; Badman, T.D. Chitinozoan reflectance: A Lower Palaeozoic thermal maturity indicator. Mar. Pet. Geol. 1992, 9, 302–307. [Google Scholar] [CrossRef]
  40. Deaf, A.S.; Tahoun, S.S.; Gentzis, T.; Carvajal-Ortiz, H.; Harding, I.C.; Marshall, J.E.A.; Ocubalidet, S. Organic geochemical, palynofacies, and petrographic analyses examining the hydrocarbon potential of the Kharita Formation (Albian) in the Matruh Basin, northwestern Egypt. Mar. Pet. Geol. 2020, 112, 104087. [Google Scholar] [CrossRef]
  41. Marshall, J.E.A. Quantitative Spore Colour. J. Geol. Soc. 1991, 148, 223–233. [Google Scholar] [CrossRef]
  42. Hartkopf-Fröder, C.; Königshof, P.; Littke, R.; Schwarzbauer, J. Optical Thermal Maturity Parameters and Organic Geochemical Alteration at Low Grade Diagenesis to Anchimetamorphism: A Review. Int. J. Coal Geol. 2015, 150–151, 74–119. [Google Scholar] [CrossRef]
  43. Staplin, F.L. Sedimentary Organic Matter, Organic Metamorphism, and Oil and Gas Occurrence. Bull. Can. Pet. Geol. 1969, 17, 47–66. [Google Scholar]
  44. Waples, D.W. Predicting thermal maturity. In Geochemistry in Petroleum Exploration; Springer: Cham, Switzerland, 1985; pp. 121–154. [Google Scholar]
  45. Smith, P.M.R. Spectral Correlation of Spore Coloration Standards. Geol. Soc. Spec. Publ. 1983, 12, 289–294. [Google Scholar] [CrossRef]
  46. Williams, H.; Colman-Sadd, S.P.; Swinden, H.S. Tectonic-Stratigraphic Subdivisions of Central Newfoundland. Curr. Res. Part B 1998, 1322, 91–98. [Google Scholar]
  47. Goodhue, R.; Clayton, G. Palynomorph Darkness Index (PDI)—A New Technique for Assessing Thermal Maturity. Palynology 2010, 34, 147–156. [Google Scholar] [CrossRef]
  48. Beyssac, O.; Goffé, B.; Chopin, C.; Rouzaud, J.N. Raman Spectra of Carbonaceous Material in Metasediments: A New Geothermometer. J. Metamorph. Geol. 2002, 20, 859–871. [Google Scholar] [CrossRef]
  49. Lahfid, A.; Beyssac, O.; Deville, E.; Negro, F.; Chopin, C.; Goffé, B. Evolution of the Raman Spectrum of Carbonaceous Material in Low-Grade Metasediments of the Glarus Alps (Switzerland). Terra Nova 2010, 22, 354–360. [Google Scholar] [CrossRef]
  50. Ferralis, N.; Matys, E.D.; Knoll, A.H.; Hallmann, C.; Summons, R.E. Rapid, Direct and Non-Destructive Assessment of Fossil Organic Matter via MicroRaman Spectroscopy. Carbon 2016, 108, 440–449. [Google Scholar] [CrossRef] [Green Version]
  51. Lünsdorf, N.K.; Dunkl, I.; Schmidt, B.C.; Rantitsch, G.; von Eynatten, H. Towards a Higher Comparability of Geothermometric Data Obtained by Raman Spectroscopy of Carbonaceous Material. Part 2: A Revised Geothermometer. Geostand. Geoanalytical Res. 2017, 41, 593–612. [Google Scholar] [CrossRef]
  52. Liu, D.; Xiao, X.; Tian, H.; Min, Y.; Zhou, Q.; Cheng, P.; Shen, J. Sample Maturation Calculated Using Raman Spectroscopic Parameters for Solid Organics: Methodology and Geological Applications. Chin. Sci. Bull. 2012, 58, 1285–1298. [Google Scholar] [CrossRef] [Green Version]
  53. Hinrichs, R.; Brown, M.T.; Vasconcellos, M.A.Z.; Abrashev, M.V.; Kalkreuth, W. Simple Procedure for an Estimation of the Coal Rank Using Micro-Raman Spectroscopy. Int. J. Coal Geol. 2014, 136, 52–58. [Google Scholar] [CrossRef]
  54. Schmidt, J.S.; Hinrichs, R.; Araujo, C.V. Maturity Estimation of Phytoclasts in Strew Mounts by Micro-Raman Spectroscopy. Int. J. Coal Geol. 2017, 173, 1–8. [Google Scholar] [CrossRef]
  55. Hackley, P.C.; Lünsdorf, N.K. Application of Raman Spectroscopy as Thermal Maturity Probe in Shale Petroleum Systems: Insights from Natural and Artificial Maturation Series. Energy Fuels 2018, 32, 11190–11202. [Google Scholar] [CrossRef]
  56. Khatibi, S.; Ostadhassan, M.; Tuschel, D.; Gentzis, T.; Bubach, B.; Carvajal-Ortiz, H. Raman Spectroscopy to Study Thermal Maturity and Elastic Modulus of Kerogen. Int. J. Coal Geol. 2018, 185, 103–118. [Google Scholar] [CrossRef]
  57. Schito, A.; Corrado, S. An Automatic Approach for Characterization of the Thermal Maturity of Dispersed Organic Matter Raman Spectra at Low Diagenetic Stages. In Application of Analytical Techniques to Petroleum Systems; Dowey, P.J., Osborne, M., Volk, H., Eds.; Geological Society of London Special Publications: London, UK, 2020; Volume 484, pp. 107–119. [Google Scholar] [CrossRef]
  58. Corrado, S.; Schito, A.; Romano, C.; Grigo, D.; Poe, B.T.; Aldega, L.; Caricchi, C.; di Paolo, L.; Zattin, M. An Integrated Platform for Thermal Maturity Assessment of Polyphase, Long-Lasting Sedimentary Basins, from Classical to Brand-New Thermal Parameters and Models: An Example from the on-Shore Baltic Basin (Poland). Mar. Pet. Geol. 2020, 122, 104547. [Google Scholar] [CrossRef]
  59. Muirhead, D.K.; Bond, C.E.; Watkins, H.; Butler, R.W.H.; Schito, A.; Crawford, Z.; Marpino, A. Raman Spectroscopy: An Effective Thermal Marker in Low Temperature Carbonaceous Fold–Thrust Belts. In Fold and Thrust Belts: Structural Style, Evolution and Exploration; Hammerstein, J.A., Di Cuia, R., Cottam, M.A., Zamora, G., Butler, R.W.H., Eds.; Geological Society of London Special Publications: London, UK, 2020; Volume 490, pp. 135–151. [Google Scholar] [CrossRef]
  60. Nirrengarten, M.; Mohn, G.; Schito, A.; Corrado, S.; Gutiérrez-García, L.; Bowden, S.A.; Despinois, F. The Thermal Imprint of Continental Breakup during the Formation of the South China Sea. Earth Planet. Sci. Lett. 2020, 531, 115972. [Google Scholar] [CrossRef]
  61. Tyson, R.V. Sedimentary Organic Matter; Springer: Dordrecht, The Netherlands, 1995. [Google Scholar]
  62. Batten, D.J. Palynofacies and Petroleum Potential. Palynol. Princ. Appl. 1996, 3, 1065–1084. [Google Scholar]
  63. Alavi, M. Regional Stratigraphy of the Zagros Fold-Thrust Belt of Iran and Its Proforeland Evolution. Am. J. Sci. 2004, 304, 1–20. [Google Scholar] [CrossRef]
  64. Heydari, E. Tectonics versus Eustatic Control on Supersequences of the Zagros Mountains of Iran. Tectonophysics 2008, 451, 56–70. [Google Scholar] [CrossRef]
  65. Stöcklin, J. Structural History and Tectonics of Iran: A Review. AAPG Bull. 1968, 52, 1229–1258. [Google Scholar] [CrossRef]
  66. Berberian, M.; King, G.C.P. Towards a Paleogeography and Tectonic Evolution of Iran. Can. J. Earth Sci. 1981, 18, 210–265. [Google Scholar] [CrossRef]
  67. Setudehnia, A. The Paleozoic Sequence at Zard Kuh and Kuh-e-Dinar. Bull. Iran. Pet. Inst. 1975, 60, 16–33. [Google Scholar]
  68. Bahroudi, A.; Talbot, C.J. The Configuration of the Basement beneath the Zagros Basin. J. Pet. Geol. 2003, 26, 257–282. [Google Scholar] [CrossRef]
  69. Gaetani, M.; Garzanti, E.; Polino, R.; Kiricko, Y.; Korsakhov, S.; Cirilli, S.; Nicora, A.; Rettori, R.; Larghi, C.; Palliani, R.B. Stratigraphic Evidence for Cimmerian Events in NW Caucasus (Russia). Bull. Soc. Géol. Fr. 2005, 176, 283–299. [Google Scholar] [CrossRef]
  70. Gaetani, M.; Nicora, A.; Henderson, C.; Cirilli, S.; Gale, L.; Rettori, R.; Vuolo, I.; Atudorei, V. Refinements in the Upper Permian to Lower Jurassic Stratigraphy of Karakorum, Pakistan. Facies 2012, 59, 915–948. [Google Scholar] [CrossRef]
  71. Ruban, D.A.; Al-Husseini, M.I.; Iwasaki, Y. Review of Middle East Paleozoic Plate Tectonics. GeoArabia 2007, 12, 35–56. [Google Scholar] [CrossRef]
  72. Angiolini, L.; Checconi, A.; Gaetani, M.; Rettori, R. The Latest Permian Mass Extinction in the Alborz Mountains (North Iran). Geol. J. 2010, 45, 216–229. [Google Scholar] [CrossRef]
  73. Berra, F.; Angiolini, L. The Evolution of the Tethys Region throughout the Phanerozoic: A Brief Tectonic Reconstruction; AAPG: Tulsa, OK, USA, 2014. [Google Scholar]
  74. Aria-Nasab, M.; Spina, A.; Cirilli, S.; Daneshian, J. The Palynostratigraphy of the Lower Carboniferous (Middle Tournaisian–Upper Viséan) Shishtu Formation from the Howz-e-Dorah Section, Southeast Tabas, Central Iranian Basin. Palynology 2015, 40, 247–263. [Google Scholar] [CrossRef]
  75. Gennari, V.; Rettori, R. Globigaetania angulata Gen. n. Sp. n.(Globivalvulininae, Foraminifera) from the Wordian (Middle Permian) of NW Iran. Riv. Ital. Paleontol. Stratigr. 2019, 125, 1–11. [Google Scholar]
  76. Ghorbani, M. Lithostratigraphy of Iran; Springer: Cham, Switzerland, 2019. [Google Scholar]
  77. Sharland, P.R.; Casey, D.M.; Davies, R.B.; Simmons, M.D.; Sutcliffe, O.E. Arabian Plate Sequence Stratigraphy; Gulf PetroLink: Manama, Bahrain, 2001; Volume 2. [Google Scholar]
  78. Casciello, E.; Vergés, J.; Saura, E.; Casini, G.; Fernández, N.; Blanc, E.; Homke, S.; Hunt, D.W. Fold Patterns and Multilayer Rheology of the Lurestan Province, Zagros Simply Folded Belt (Iran). J. Geol. Soc. 2009, 166, 947–959. [Google Scholar] [CrossRef] [Green Version]
  79. Muttoni, G.; Gaetani, M.; Kent, D.V.; Sciunnach, D.; Angiolini, L.; Berra, F.; Garzanti, E.; Mattei, M.; Zanchi, A. Opening of the Neo-Tethys Ocean and the Pangea B to Pangea A Transformation during the Permian. GeoArabia 2009, 14, 17–48. [Google Scholar] [CrossRef]
  80. Spina, A.; Cirilli, S.; Ghorbani, M.; Rettori, R.; Sorci, A.; Servais, T. Middle–late Cambrian acritarchs of the Zagros Basin, southwestern Iran. Palynology 2021, 45, 171–186. [Google Scholar] [CrossRef]
  81. Vennin, E.; Kolodka, C.; Asghari, A.; Thomazo, C.; Buoncristiani, J.F.; Goodarzi, H.; Desaubliaux, G. Discussion on Palaeozoic Discontinuities in the Kuh-e Surmeh Area (Zagros, Iran). Mar. Pet. Geol. 2015, 66, 1073–1092. [Google Scholar] [CrossRef]
  82. Garzanti, E.; Sciunnach, D. Early Carboniferous Onset of Gondwanian Glaciation and Neo-Tethyan Rifting in South Tibet. Earth Planet. Sci. Lett. 1997, 148, 359–365. [Google Scholar] [CrossRef]
  83. Angiolini, L.; Balini, M.; Garzanti, E.; Nicora, A.; Tintori, A. Gondwanan Deglaciation and Opening of Neotethys: The Al Khlata and Saiwan Formations of Interior Oman. Palaeogeogr. Palaeoclimatol. Palaeoecol. 2003, 196, 99–123. [Google Scholar] [CrossRef]
  84. Insalaco, E.; Virgone, A.; Courme, B.; Gaillot, J.; Kamali, M.; Moallemi, A.; Lotfpour, M.; Monibi, S. Upper Dalan Member and Kangan Formation between the Zagros Mountains and Offshore Fars, Iran: Depositional System, Biostratigraphy and Stratigraphic Architecture. GeoArabia 2006, 11, 75–176. [Google Scholar] [CrossRef]
  85. Zeinalzadeh, A. Burial History and Thermal Modeling of Dehram, Khami and Bangestan Groups in the Fars Area, South Iran. Master’s Thesis, University of Tehran, Tehran, Iran, 2000. [Google Scholar]
  86. Alsharhan, A.S.; Nairn, A.E.M. Sedimentary Basins and Petroleum Geology of the Middle East; Elsevier: Amsterdam, The Netherlands, 1997; ISBN 0444824650. [Google Scholar]
  87. Alsharhan, A.S.; Kendall, C.G.S.C. Paleozoic Sequence Stratigraphy, Depositional Systems, and Hydrocarbon Habitats across the Arabian Plate. AAPG Bull. 2021, 105, 1149–1198. [Google Scholar] [CrossRef]
  88. Tavakoli-Shirazi, S.; de Lamotte, D.F.; Wrobel-Daveau, J.-C.; Ringenbach, J.-C. Pre-Permian uplift and diffuse extensional deformation in the High Zagros Belt (Iran): Integration in the geodynamic evolution of the Arabian plate. Arab. J. Geosci. 2013, 6, 2329–2342. [Google Scholar] [CrossRef]
  89. Asghari, A. Sedimentary Environment, Sequence Stratigraphy and Paleogeography of Paleozoic Pre-Khuff Succession in Southern Iran (Zagros and Persian Gulf). Ph.D. Thesis, Universitè de Bourgogne, Dijon, France, 2014. [Google Scholar]
  90. Ghavidel-syooki, M.; Hassanzadeh, J.; Vecoli, M. Palynology and Isotope Geochronology of the Upper Ordovician–Silurian Successions (Ghelli and Soltan Maidan Formations) in the Khoshyeilagh Area, Eastern Alborz Range, Northern Iran; Stratigraphic and Palaeogeographic Implications. Rev. Palaeobot. Palynol. 2011, 164, 251–271. [Google Scholar] [CrossRef]
  91. Golonka, J. Plate-Tectonic Maps of the Phanerozoic; AAPG: Tulsa, OK, USA, 2002. [Google Scholar]
  92. Haq, B.U.; Al-Qahtani, A.M. Phanerozoic Cycles of Sea-Level Change on the Arabian Platform; Gulf PetroLink: Manama, Bahrain, 2005; Volume 10. [Google Scholar]
  93. Husseini, M.I. Upper Palaeozoic Tectono-Sedimentary Evolution of the Arabian and Adjoining Plates. J. Geol. Soc. 1992, 149, 419–429. [Google Scholar] [CrossRef]
  94. Faqira, M.; Rademakers, M.; Afifi, A.M. New Insights into the Hercynian Orogeny, and Their Implications for the Paleozoic Hydrocarbon System in the Arabian Plate. GeoArabia 2009, 14, 199–228. [Google Scholar] [CrossRef]
  95. Stephenson, M.H.; Osterloff, P.L.; Filatoff, J. Palynological Biozonation of the Permian of Oman and Saudi Arabia: Progress and Challenges. GeoArabia 2003, 8, 467–496. [Google Scholar] [CrossRef]
  96. Stephenson, M.H. Stratigraphic Note: Update of the Standard Arabian Permian Palynological Biozonation; Definition and Description of OSPZ5 and 6. GeoArabia 2006, 11, 173–178. [Google Scholar] [CrossRef]
  97. Stephenson, M.H. Spores and Pollen from the Middle and Upper Gharif Members (Permian) of Oman. Palynology 2008, 32, 157–182. [Google Scholar] [CrossRef]
  98. Stolle, E. Regional Permian Palynological Correlations: Southeast Turkey-Northern Iraq. Comun. Geol. 2007, 94, 125–143. [Google Scholar]
  99. Stolle, E.; Yalçin, M.N.; Kavak, O. The Permian Kas Formation of SE Turkey—Palynological Correlation with Strata from Saudi Arabia and Oman. Geol. J. 2011, 46, 561–573. [Google Scholar] [CrossRef]
  100. Ghavidel-Syooki, M.; Popov, L.E.; Javier Álvaro, J.; Pour, M.G.; Tolmacheva, T.Y.; Ehsani, M.H. Dapingian-Lower Darriwilian (Ordovician) Stratigraphic Gap in the Faraghan Mountains, Zagros Ranges, South-Eastern Iran. Bull. Geosci. 2014, 89, 679–706. [Google Scholar] [CrossRef] [Green Version]
  101. Traverse, A. Paleopalynology; Springer: Cham, Switzerland, 2007; ISBN 1402056109. [Google Scholar]
  102. Buratti, N.; Cirilli, S. A New Bleaching Method for Strongly Oxidized Palynomorphs. Micropaleontology 2011, 57, 263–267. [Google Scholar]
  103. Tyson, R.V. Palynofacies analysis. In Applied Micropalaeontology; Springer: Cham, Switzerland, 1993; pp. 153–191. [Google Scholar]
  104. Steffen, D.; Gorin, G.E. Sedimentology of Organic Matter in Upper Tithonian-Berriasian Deep-Sea Carbonates of Southeast France: Evidence of Eustatic Control. In Source Rocks in a Sequence Stratigraphic Framework; AAPG: Tulsa, OK, USA, 1993; pp. 49–65. [Google Scholar]
  105. Cirilli, S.; Bucefalo Palliani, R.; Pontini, M.R. Palynostratigraphy and Palynofacies of the Late Triassic R. Contorta Facies in Northern Apennines: II The Monte Cetona Formation. Rev. Paleobiol. 1994, 13, 319–339. [Google Scholar]
  106. Cirilli, S.; Buratti, N.; Gugliotti, L.; Frixa, A. Palynostratigraphy and Palynofacies of the Upper Triassic Streppenosa Formation (SE Sicily, Italy) and Inference on the Main Controlling Factors in the Organic Rich Shale Deposition. Rev. Palaeobot. Palynol. 2015, 218, 67–79. [Google Scholar] [CrossRef]
  107. Cirilli, S.; Panfili, G.; Buratti, N.; Frixa, A. Paleoenvironmental Reconstruction by Means of Palynofacies and Lithofacies Analyses: An Example from the Upper Triassic Subsurface Succession of the Hyblean Plateau Petroleum System (SE Sicily, Italy). Rev. Palaeobot. Palynol. 2018, 253, 70–87. [Google Scholar] [CrossRef]
  108. Batten, D.J. Palynofacies and Palaeoenvironmental Interpretation. Palynol. Princ. Appl. 1996, 3, 1011–1064. [Google Scholar]
  109. Berra, F.; Cirilli, S. Preservation and Thermal Alteration of Organic Matter in the Ortles and Quattervals Nappes (Upper Austroalpine, Nord-Eastern Lombardy, Italy): Preliminary Results and Implications for Regional Geology. Eclogae Geol. Helv. 1997, 90, 325–336. [Google Scholar]
  110. Berra, F.; Cirilli, S. Palaeoenvironmental Interpretation of the Late Triassic Fraele Formation: Ortles Nappe, Austroalpine Domain, Lombardy. Riv. Ital. Paleontol. Stratigr. 1997, 103, 53–70. [Google Scholar]
  111. Aldinucci, M.; Brogi, A.; Spina, A. Middle-Late Permian Sporomorphs from the Farma Formation (Monticiano-Roccastrada Ridge, Southern Tuscany): New Constraints for the Tectono-Sedimentary History of the Tuscan Domain. Boll. Soc. Geol. Ital. 2008, 127, 581–597. [Google Scholar]
  112. Cornamusini, G.; Talarico, F.M.; Cirilli, S.; Spina, A.; Olivetti, V.; Woo, J. Upper Paleozoic Glacigenic Deposits of Gondwana: Stratigraphy and Paleoenvironmental Significance of a Tillite Succession in Northern Victoria Land (Antarctica). Sediment. Geol. 2017, 358, 51–69. [Google Scholar] [CrossRef]
  113. Tyson, R.V. Late Jurassic Palynofacies Trends, Piper and Kimmeridge Clay Formations, UK Onshore and Northern North Sea. In Northwest European Micropalaeontology and Palynology; Ellis Horwood Publishers: Chichester, UK, 1989; pp. 135–172. [Google Scholar]
  114. Fraser, W.T.; Watson, J.S.; Sephton, M.A.; Lomax, B.H.; Harrington, G.; Gosling, W.D.; Self, S. Changes in spore chemistry and appearance with increasing maturity. Rev. Palaeobot. Palynol. 2014, 201, 41–46. [Google Scholar] [CrossRef] [Green Version]
  115. Clayton, G.; Goodhue, R.; Abdelbagi, S.T.; Vecoli, M. Correlation of Palynomorph Darkness Index and vitrinite reflectance in a submature Carboniferous well section in northern Saudi Arabia. Rev. Micropaléontologie 2017, 60, 411–416. [Google Scholar] [CrossRef]
  116. Riboulleau, A.; Spina, A.; Vecoli, M.; Riquier, L.; Quijada, M.; Tribovillard, N.; Averbuch, O. Organic matter deposition in the Ghadames Basin (Libya) during the Late Devonian—A multidisciplinary approach. Palaeogeogr. Palaeoclimatol. Palaeoecol. 2018, 497, 37–51. [Google Scholar] [CrossRef] [Green Version]
  117. Haseldonckx, P. Relation of Palynomorph Colour and Sedimentary Organic Matter to Thermal Maturation and Hydrocarbon Generating Potential. Generation and Maturation of Hydrocarbons in Sedimentary Basins. United Nations Economic and Social Development in Asia and the Pacific. CCOP Tech. Publ. 1979, 6, 41–53. [Google Scholar]
  118. Fisher, M.J.; Barnard, P.C.; Cooper, B.S. Organic Maturation and Hydrocarbon Generation in the Mesozoic Sediments of the Sverdrup Basin, Arctic Canada. In Proceedings of the 4th International Palynological Conference, Lucknow, India, 29 December 1976–15 January 1977; pp. 581–588. [Google Scholar]
  119. Collins, A. The 1-10 Spore Colour Index (SC1) Scale: A Universally Applicable Colour Maturation Scale Based on Graded, Picked Palynomorphs. Meded. Rijks Geol. Dienst. 1990, 45, 39–47. [Google Scholar]
  120. Hillier, S.; Marshall, J.E.A. Organic Maturation, Thermal History and Hydrocarbon Generation in the Orcadian Basin, Scotland. J. Geol. Soc. 1992, 149, 491–502. [Google Scholar] [CrossRef]
  121. Marshall, J.E.A.; Yule, B.L.; Jones, P.T.; Rowe, N.P. Spore Colour Measurement. Fossil Plants and Spores: Modern Techniques; Geological Society: London, UK, 1999; pp. 165–168. [Google Scholar]
  122. Pearson, D.L. Pollen/Spore Color Standard, Revised Edition; Phillips Petroleum Exploration Projects Section: Bartlesville, OK, USA, 1990. [Google Scholar]
  123. Senftle, J.T.; Landis, C.R.; McLaughlin, R.L. Organic Petrographic Approach to Kerogen Characterization. In Organic Geochemistry. Topics in Geobiology; Springer: Boston, MA, USA, 1993; pp. 355–374. [Google Scholar] [CrossRef]
  124. Mao, S.; Buxton Eglinton, L.; Whelan, J.; Liu, L. Thermal Evolution of Sediments from Leg 139, Middle Valley, Juan de Fuca Ridge: An Organic Petrological Study. In Proceedings of the Ocean Drilling Program. Scientific Results, College Station, TX, USA, 3–7 October; Ocean Drilling Program: College Station, TX, USA, 1994; Volume 139. [Google Scholar]
  125. Taylor, G.H.; Teichmüller, M.; Davis, A.; Diessel, C.F.K.; Littke, R.; Robert, P. Organic Petrology; Schweizerbart Science Pulishers: Stuttgart, Germany, 1998. [Google Scholar]
  126. Fernandes, P.; Rodrigues, B.; Borges, M.; Matos, V.; Clayton, G. Organic Maturation of the Algarve Basin (Southern Portugal) and Its Bearing on Thermal History and Hydrocarbon Exploration. Mar. Pet. Geol. 2013, 46, 210–233. [Google Scholar] [CrossRef]
  127. Galasso, F.; Pereira, Z.; Fernandes, P.; Spina, A.; Marques, J. First Record of Permo-Triassic Palynomorphs of the N’Condédzi Sub-Basin, Moatize-Minjova Coal Basin, Karoo Supergroup, Mozambique. Rev. Micropaléontol. 2019, 64, 100357. [Google Scholar] [CrossRef]
  128. Galasso, F.; Fernandes, P.; Montesi, G.; Marques, J.; Spina, A.; Pereira, Z. Thermal History and Basin Evolution of the Moatize-Minjova Coal Basin (N’Condédzi Sub-Basin, Mozambique) Constrained by Organic Maturation Levels. J. Afr. Earth Sci. 2019, 153, 219–238. [Google Scholar] [CrossRef]
  129. Van Gijzel, P. Manual of the Techniques and Some Geological Applications of Fluorescence Microscopy. In Proceedings of the American Association of Stratigraphic Palynologists, 12 Annual Meeting Workshop, Dallas, TX, USA, 9–12 September 1979. [Google Scholar]
  130. McPhilemy, B. The Value of Fluorescence Microscopy in Routine Palynofacies Analysis: Lower Carboniferous Successions from Counties Armagh and Roscommon, Ireland. Rev. Palaeobot. Palynol. 1988, 56, 345–359. [Google Scholar] [CrossRef]
  131. Hillier, S.; Marshall, J. A Rapid Technique to Make Polished Thin Sections of Sedimentary Organic Matter Concentrates. J. Sediment. Res. 1988, 58, 754–755. [Google Scholar] [CrossRef]
  132. Barker, C.E. Geothermics of petroleum systems: Implications of the stabilization of kerogen thermal maturation after a geologically brief heating duration at peak temperature. In Petroleum Systems of the United States; Magoon, L.B., Ed.; U.S. Geological Survey Bulletin: Washington, DC, USA, 1988; Volume 1870, pp. 26–29. [Google Scholar]
  133. Henry, D.G.; Jarvis, I.; Gillmore, G.; Stephenson, M. Raman Spectroscopy as a Tool to Determine the Thermal Maturity of Organic Matter: Application to Sedimentary, Metamorphic and Structural Geology. Earth-Sci. Rev. 2019, 198, 102936. [Google Scholar] [CrossRef]
  134. Tuinstra, F.; Koenig, J.L. Raman Spectrum of Graphite. J. Chem. Phys. 2003, 53, 1126. [Google Scholar] [CrossRef] [Green Version]
  135. Espitalié, J.; Laporte, J.L.; Madec, M.; Marquis, F.; Leplat, P.; Paulet, J.; Boutefeu, A. Méthode rapide de caractérisation des roches mères, de leur potential et de leur degré d’évolution. Oil Gas Sci. Technol.—Rev. l’Institut Fr. Pet. 1977, 32, 23–42. [Google Scholar]
  136. Peters, K.E.; Whelan, J.K.; Hunt, J.M.; Tarafa, M.E. Programmed pyrolysis of organic matter from thermally altered Cretaceous black shales. Am. Assoc. Pet. Geol. Bull. 1983, 67, 2137–2146. [Google Scholar]
  137. Peters, K.E. Guidelines for Evaluating Petroleum Source Rock Using Programmed Pyrolysis. Am. Assoc. Pet. Geol. Bull. 1986, 70, 318–329. [Google Scholar] [CrossRef]
  138. Dembicki, H. Three common source rock evaluation errors made by geologists during prospect or play appraisals. Am. Assoc. Pet. Geol. Bull. 2009, 93, 341–356. [Google Scholar] [CrossRef]
  139. Guedes, A.; Valentim, B.; Prieto, A.C.; Rodrigues, S.; Noronha, F. Micro-Raman spectroscopy of collotelinite, fusinite and macrinite. Int. J. Coal Geol. 2010, 83, 415–422. [Google Scholar] [CrossRef]
  140. Espitalié, J.; Deroo, G.; Marquis, F. La pyrolyse Rock-Eval et ses applications. Troisième partie. Rev. l’Institut Fr. Pet. 1986, 41, 73–89. [Google Scholar] [CrossRef]
  141. Peters, K.E.; Cassa, M.R. Applied Source Rock Geochemistry: Chapter 5: Part II. Essential Elements; American Association of Petroleum Geologists: Tulsa, OK, USA, 1994. [Google Scholar]
  142. Langford, F.F.; Blanc-Valleron, M.-M. Interpreting Rock-Eval Pyrolysis Data Using Graphs of Pyrolizable Hydrocarbons vs. Total Organic Carbon. AAPG Bull. 1990, 74, 799–804. [Google Scholar] [CrossRef]
  143. Hazra, B.; Wood, D.A.; Varma, A.K.; Sarkar, B.C.; Tiwari, B.; Singh, A.K. Insights into the Effects of Matrix Retention and Inert Carbon on the Petroleum Generation Potential of Indian Gondwana Shales. Mar. Pet. Geol. 2018, 91, 125–138. [Google Scholar] [CrossRef]
  144. Yang, S.; Horsfield, B. Critical Review of the Uncertainty of Tmax in Revealing the Thermal Maturity of Organic Matter in Sedimentary Rocks. Int. J. Coal Geol. 2020, 225, 103500. [Google Scholar] [CrossRef]
  145. Conford, C.; Gardner, P.; Burgess, C. Geochemical truths in large data sets. I: Geochemical screening data. Org. Geochem. 1998, 29, 519–530. [Google Scholar] [CrossRef]
  146. Cheshire, S.; Craddock, P.R.; Xu, G.; Sauerer, B.; Pomerantz, A.E.; McCormick, D.; Abdallah, W. Assessing thermal maturity beyond the reaches of vitrinite reflectance and Rock-Eval pyrolysis: A case study from the Silurian Qusaiba formation. Int. J. Coal Geol. 2017, 180, 29–45. [Google Scholar] [CrossRef]
  147. Hunt, J.M. Petroleum Geochemistry and Geology, 2nd ed.; Freeman and Company: New York, NY, USA, 1996; Volume 74. [Google Scholar]
  148. Lafargue, E.; Marquis, F.; Pillot, D. Rock-Eval 6 Applications in Hydrocarbon Exploration, Production, and Soil Contamination Studies. Rev. l’Institut Fr. Pet. 1998, 53, 421–437. [Google Scholar] [CrossRef] [Green Version]
  149. Maravelis, A.; Makrodimitras, G.; Pasadakis, N.; Zelilidis, A. Stratigraphic evolution and source rock potential of a Lower Oligocene to Lower—Middle Miocene continental slope system, Hellenic Fold and Thrust Belt, Ionian Sea, northwest Greece. Geol. Mag. 2014, 151, 394–413. [Google Scholar] [CrossRef]
  150. Maravelis, A.G.; Chamilaki, E.; Pasadakis, N.; Zelilidis, A.; Collins, W.J. Hydrocarbon generation potential of a Lower Permian sedimentary succession (Mount Agony Formation): Southern Sydney Basin, New South Wales, Southeast Australia. Int. J. Coal Geol. 2017, 183, 52–64. [Google Scholar] [CrossRef]
  151. Maravelis, A.G.; Chamilaki, E.; Pasadakis, N.; Vassiliou, A.; Zelilidis, A. Organic geochemical characteristics and paleodepositional conditions of an Upper Carboniferous mud-rich succession (Yagon Siltstone): Myall Trough, southeast Australia. J. Pet. Sci. Eng. 2017, 158, 322–335. [Google Scholar] [CrossRef]
  152. Rashidi, M.R. Source Rock Potential and Kerogen Evaluation of Lower Permian Faraghan Formation in Zagros Basin of Iran. In Proceedings of the 5th EAGE St. Petersburg International Conference and Exhibition on Geosciences-Making the Most of the Earths Resources, Saint Petersburg, Russia, 2–5 April 2012. [Google Scholar] [CrossRef]
Figure 2. Stratigraphic log, sampled horizons and palynofacies of the Faraghan Formation at the Darreh Yas section.
Geosciences 11 00484 g002
Figure 3. Stratigraphic log sampled horizons and palynofacies of the Faraghan Formation at the Kuh e Faraghan section.
Geosciences 11 00484 g003
Figure 4. AOM-Phytoclast-Palynomorph plotted on the Tyson’s ternary diagram of the Faraghan Formation at the Darreh Yas (a) and Kuh e Faraghan (b) sections.
Geosciences 11 00484 g004
Scheme 1. Organic matter content from the Faraghan Formation. (a) Darreh Yas section. Palynofacies with opaque and translucent phytoclasts. Sample 13254. Scale bar indicates 200 µm; (b) Kuh e Faraghan section. Palynofacies with bisaccate pollens, spores, opaque and translucent phytoclasts. Sample RE-2516. Scale bar indicates 100 µm; (c) Kuh e Faraghan section. Palynofacies consists of opaque and translucent phytoclasts and AOM. Sample RE-2518. Scale bar indicates 100 µm; (d) Kuh e Faraghan section. Palynofacies consisting mainly of translucent phytoclasts and few sporomorphs. Sample RE-2517. Scale bar indicates 100 µm; (e) Darreh Yas section. Palynofacies containing opaque and translucent phytoclasts and brown to dark brown sporomorphs. Sample 13264. Scale bar indicates 100 µm; (f) Kuh e Faraghan section. Palynofacies characterized by opaque and translucent phytoclasts laevigate trilete spores (where PDI was measured) and acritarchs. Sample RE-2519. Scale bar indicates 100 µm.
Geosciences 11 00484 sch001
Figure 6. Histogram of %Ro values of the Faraghan Formation at the Darreh Yas and Kuh e Faraghan sections.
Geosciences 11 00484 g006
Scheme 2. Organic matter particles images taken for VR measurements. (a) Sample 13263: a—vitrinite, b—inertinite; (b) Sample 13263: a—vitrinite, b—inertinite; (c) Sample 13266: a—vitrinite, b—inertinite; (d) Sample 13266: a—vitrinite, c—sporinite, d—mineral; (e) Sample 13266: a—vitrinite, b—inertinite; (f) Sample 13266: a—vitrinite, b—inertinite.
Geosciences 11 00484 sch002
Figure 7. Histograms of PDIC.-L %. (Calamospora-Laevigatosporites) and PDIP. % (Punctatisporites) of the Faraghan Formation at the Darreh Yas and Kuh e Faraghan sections.
Geosciences 11 00484 g007
Figure 8. Lithology, sampled horizons and thermal maturity data for the Faraghan Formation at the Darreh Yas and Kuh e Faraghan sections.
Geosciences 11 00484 g008
Publisher’s Note: MDPI stays neutral with regard to jurisdictional claims in published maps and institutional affiliations.

