
Garnet Chemical Zoning Based Thermobarometry: Method Evaluation and Applications in the Menderes Massif, Western Turkey


1
Department of Geological Sciences, Jackson School of Geosciences, The University of Texas at Austin, 2275 Speedway Stop C9000, Austin, TX 78712, USA
2
ExxonMobil, Spring, TX 77389, USA
*
Author to whom correspondence should be addressed.
Geosciences 2021, 11(12), 505; https://0-doi-org.brum.beds.ac.uk/10.3390/geosciences11120505
Submission received: 2 October 2021
/
Revised: 6 December 2021
/
Accepted: 6 December 2021
/
Published: 10 December 2021
(This article belongs to the Collection Early Career Scientists’ (ECS) Contributions to Geosciences)
Abstract
:The garnet chemical zoning method (GZM) is a reliable thermodynamic approach for forward modeling pressure-temperature (P-T) paths using observed garnet and bulk rock compositions. However, intracrystalline diffusion is known to compromise the integrity of GZM modeled garnet-growth P-T paths. For this reason, extracting reliable metamorphic estimates from garnet-bearing schists in the Central Menderes Massif (CMM), western Turkey, has been difficult. To evaluate the impact of diffusion on GZM, we simulate garnet growth and diffusion for an average metapelite using the program Theria_G. Modeled garnet compositions from four simulations are used to estimate P-T conditions and paths by GZM, which are compared against Theria_G specified P-T-t trajectories. Factors influencing results are heating/cooling rate, grain size, and peak T. At a maximum T of 610 °C, both undiffused and diffused garnet compositions returned estimates comparable to prescribed conditions regardless of heating/cooling rate. Diffused profiles from simulations reaching a maximum T of 670 °C also reproduced prescribed P-T paths if tectonism occurred at high heating/cooling rates (50 °C/my). From these insights and additional Theria_G simulation-derived observations for CMM garnets, we deduce that metamorphism in the region exceeded 650 °C and achieved a maximum burial P between 8–10 kbar prior to Cenozoic exhumation.
1. Introduction
Garnet is known to retain a record of tectonism experienced during growth with the assumption that its chemical zoning occurs as pressure and temperature (P and T) change over time (e.g., [1,2,3,4,5,6,7,8,9,10,11,12,13,14,15,16,17,18,19,20,21,22]). Recently, the application of one garnet-based thermobarometric method has further shown this mineral’s ability to record a more dynamic evolution of metamorphic terranes than what is typically extracted (e.g., [17,19,20,21,22,23]). The garnet zoning thermobarometric method (GZM), herein referencing the approach of [17], can provide a detailed reconstruction of nuanced lithosphere dynamics during the prograde burial of crustal rocks, as is the case in the Menderes Massif, western Turkey [21,23]. There the method was used to reveal that garnets throughout the southern portion of the massif not only retain a record of metamorphic growth in response to Cenozoic burial, but they also capture an intermediate pressure inflection (~1 kbar drop) interpreted as a brief period of local denudation.
GZM has only seen a limited number of applications [17,19,20,21,22,23]. One plausible explanation for this could be users encountering “model failure” due to divalent cation intracrystalline diffusion within garnet, a realistic expectation for many metamorphic garnets worldwide. For instance, Etzel et al. [23] attempted to apply this approach to a series of metapelites from the Central Menderes Massif’s Bozdağ and Bayındır nappes but could not produce sensible P-T paths for all but one sample. The authors speculated this was because chemical zonation had relaxed due to intracrystalline diffusion; ultimately, they could only report relative metamorphic conditions.
The limited successful application of GZM in the Central Menderes Massif has inspired a need to evaluate the method’s sensitivity to diffusional modification. By doing so, we believe the clarity of the method’s reliability- and limitations- will be presented.
In this contribution, we revisit the work of [21,23]. We begin by reviewing the fundamentals of GZM and how it interfaces with the software package Theriak-Domino [24,25] as conceived by [17]. From this, we segue into a modeling-based experiment designed to evaluate the impacts of intracrystalline diffusion on GZM thermobarometry. Given observations made from this sensitivity evaluation, we then reexamine the Cenozoic metamorphic history of the Menderes Massif by using garnet compositions from [23] to forward-model garnet growth along prescribed pressure-temperature-time (P-T-t) paths using the well-established software package Theria_G [26]. The ultimate goal is to replicate measured garnet compositions previously reported by [23], and thus propose a plausible tectonic history for the region.
2. Geological Background
The Menderes Massif, located in western Turkey, is a part of the Alpine-Himalayan orogeny and is one of the largest metamorphic core complexes in the world (Figure 1). Estimated P-T conditions have been used to infer processes that worked to assemble western Turkey and to speculate about the evolution of western Anatolia compared to the Aegean Sea [27,28,29]. The region has been mapped as a series of stacked nappes [27,28,29]. These are termed the Bayındır, Bozdağ, Çine, and Selimiye nappes, and were emplaced sometime after the Late Cretaceous (e.g., [30]). This contribution focuses on samples from the structurally lowest Bayındır and Bozdağ nappes exposed in the central Menderes Massif (Figure 1).
The Bayındır nappe consists of greenschist to amphibolite facies metasediments [28,31]. Lithologies include phyllite, quartzite, marble, pelitic greenschist, and Miocene granites. The schists contain biotite + quartz + muscovite + plagioclase + garnet + ilmenite + chlorite [32]. The contact between the Bayındır and Bozdağ nappes is mapped as a thrust fault based on refolded fabrics [28]. Alternatively, the Bayındır nappe may itself be a greenschist-facies mylonitic shear zone [33]. The overlying Bozdağ nappe is reported to be higher grade than the Bayındır nappe (amphibolite-facies) [27,31,34]. The Bozdağ unit includes lenses of eclogite, marble, amphibolite, and granitoids [31,35]. Bozdağ nappe metapelites from the central Menderes Massif comprise quartz + muscovite + staurolite + garnet ± biotite ± plagioclase ± kyanite ± chlorite [23,31].
Menderes Massif rocks have yielded problematic P-T estimates. Previous estimates f range from <450 °C and ~4 kbar to ~650 °C and 10 kbar [36,37,38,39]. Some rocks show evidence of disequilibrium among phases and some barometers have been applied to inappropriate (uncalibrated) mineral compositions [36,40,41]. One reported range of T conditions was determined isotopically, but because the mineral assemblages were judged to be in disequilibrium, their calculations may not reflect precise prograde T’s [42]. One study only reported estimated temperatures and assumed baric conditions between 5 and 10 kbar due to a “lack of P-sensitive assemblages” [37]. Some conditions suggest inverted metamorphic gradients within and between individual nappes [43].
More recently, Etzel et al. [23] reported P-T paths from chemically zoned garnets using the GZM approach for two Bozdağ nappe samples (MM03-22 and MM03-23; Figure 2). The data, petrology, and sample locations are described in detail by [23,44]. Figure 1 shows their general locations. One path suggests growth during burial (MM03-22), and a second path (MM03-23) suggests garnet grew isobarically over an increase in T of ~45 °C (Figure 2). Although Etzel et al. [23] tried using GZM to obtain garnet P-T paths from three other Bayındır nappe rocks (samples MM03-33, MM03-38, and MM04-48) and three from the Bozdağ nappe (samples MM03-26, MM03-27, MM03-28), they were unsuccessful. Still, by using their measured bulk rock compositions and observed garnet composition at grain cores and rims, P-T conditions were estimated by isopleth thermobarometry, allowing generalized paths to be presented for five other samples. The garnet rim P-T conditions for these samples (590–640 °C and 6.4–7.5 kbar) are consistent with the conditions reported elsewhere in the Menderes Massif [22,37,39,45].
3. Methods
3.1. Garnet Chemical Zoning Thermobarometry
In rocks that have experienced a simple prograde metamorphic history, peak P-T estimates provide information on the depths from which they have been exhumed [46,47,48,49], whereas P-T paths provide trajectories that rocks followed throughout their metamorphic history. The paths pass through peak metamorphic conditions inferred from observed mineral assemblages, isochemical phase diagrams, and/or estimates made using conventional thermobarometry [31,33,39,47]. Although they use chemical information from the mineral assemblages, paths constructed in this way do not consider the complexities between initial and final growth.
Several approaches have been developed to generate and estimate the most detailed P-T paths possible from garnet based on its chemical zoning (e.g., [6,17,18,50,51]). One such approach developed by [17] forward models P-T paths based on measured garnet compositions in metapelites. Their method has been previously described to varying levels of detail [17,20,22,23]. Here we focus the discussion on P-T estimates and computing isochemical phase diagrams using the software package Theriak-Domino. Other software packages could be used, such as Perple_X [52,53], if the original code of [17] is appropriately adapted. These packages use the same input information (garnet composition and effective rock composition) and achieve the same results. Assuming the code of [17] could interface with Perple_X, both programs should produce comparable results provided that the same thermodynamic database and activity models are used [54].
In the GZM approach, a P-T path over which garnet grew is estimated using its observed composition (from EPMA) and bulk-rock chemical composition. The bulk composition can be obtained in a variety of ways, including by Fusion-Inductively Coupled Plasma spectrometry (FUS-ICP), X-ray fluorescence (XRF), or compositionally analyzing minerals and estimating their modes (e.g., [22,55,56,57]). We routinely employ one additional step: independently estimating core and rim conditions by isopleth thermobarometry for validation purposes. For this step, the core and rim garnet compositions are used to estimate P-T conditions using the original bulk rock composition (for core) and a fractionated bulk rock composition (for rim). The fractionated composition is computed by Theriak-Domino (described below). Reported P-T conditions are determined where all garnet isopleths (±0.01 mole fraction) overlap.
The GZM method first defines conditions of garnet nucleation, then proceeds to determine the rest of the path. The routine of [17] runs in MATLAB and interfaces with the software package Theriak-Domino [25,54]. The process begins by computing an isochemical phase diagram using a whole-rock bulk composition and at a P-T point outside the garnet stability field. The script searches the P-T grid for the smallest misfit between the measured composition (i.e., input core composition) and a modeled garnet composition (core composition for the initial step). The process uses the optimization function FMINSEARCH in MATLAB, which uses the Nelder–Mead algorithm [58] to find the smallest misfit. The misfit is calculated as the square root of the sum of the squared differences between the measured composition (i.e., specified input) and the best-fit composition. Once an acceptable misfit is reached and the calculated P-T point is accepted, the program fractionates a simulated amount of garnet, which will then modify the bulk composition. THERIAK estimates this effective bulk composition for the next step of garnet growth. The process is repeated for each point along the garnet core-rim transect. In the final step of our approach, the rim conditions are independently estimated by isopleth thermobarometry as described above.
Several evaluations are made to gauge whether the calculations produce a sensible result. Although multiple paths from the same garnet should follow the same trajectory, paths could end at different conditions [22], depending on the extent of preservation of the garnet rim; if analyzing different garnets from the same rock, garnet nucleation could occur at different times for different crystals (see examples in [20,22]). Similarly, they could start at different conditions depending on the location of the analyses near the garnet core. Specifically, either non-central sectioned garnet and/or garnets nucleated at different times could result in such an observation. Finally, the GZM P-T path will generate a garnet composition which is compared to the input composition to determine the extent of a mismatch.
Assumptions and Uncertainty
A series of assumptions and specifications underlie any thermobarometric estimate by thermodynamic modeling, including conventional or GZM. P and T estimates are made by referring to reported properties, including molar enthalpy of formation, molar entropy, molar volume, heat capacity, bulk modulus, Landau parameters, and Margules parameters. One widely referenced dataset is the internally consistent database of [59], with improvements integrated into updated versions released over the years. By calling on this, or any such dataset, these values are assumed to be reliable to varying degrees. Although, over time improvements are made. For example, activity-composition relations have improved in recent years (e.g., [60]).
Determining the uncertainty of a GZM P-T path is complicated given the number of individual components (all of which have distinctly associated uncertainties) necessary to arrive at an estimated value (e.g., [10,60,61,62,63,64,65,66,67]). Some have shown how this can, in part, be better constrained through numerical approaches (e.g., [65,68,69]). For example, Palin et al. [68] used a Monte Carlo randomization procedure to simulate petrological heterogeneity at the thin-section scale as well as phase proportion uncertainty. Their approach allowed for error propagation stemming from geological uncertainty associated with petrological heterogeneity to be traced. Ultimately, they demonstrated even minor differences in bulk composition from the same sample might generate distinct differences in pseudosection topologies. Duesterhoeft et al. [69] later developed a Monte Carlo technique to efficiently estimate relative uncertainty at the thin section scale. Their approach relies on EPMA quantitative compositional maps to determine the local bulk composition, mineral assemblages, modes, and compositions from the same rock volume. This internally consistent approach (meaning bulk rock composition and P-T estimates are made from the exact same rock mass) allows for a quantifiable comparison between thermodynamic estimates and observations. Thus, their technique can statistically quantify how local chemical and compositional heterogeneities (i.e., bulk rock composition/chemical variability) cause observable variability in thermodynamic P-T estimates.
GZM requires garnet compositions collected by EPMA and a representative bulk rock chemical composition from the same hand specimen. For EPMA analyses, uncertainty is determined for each element using counting statistics and then propagating this uncertainty to the structural formula (e.g., [57,70]). For bulk composition, factors including what is considered representative, including how the sample was prepared and chosen for analysis, must be considered. With respect to modeling, which here includes computing isochemical phase diagrams and estimating P-T conditions, uncertainties in thermodynamic data being used (i.e., solution models and end member values) are contributing factors. These are also difficult to determine thoroughly (e.g., [62,71]). If only pure phases are considered, a Bayesian approach can be used [72]. However, this is complicated when complex solid solutions are involved, as is often the case. Ultimately, many often report relative uncertainty values of ±25–50 °C and ±1–2 kbar [62,65]. This level of uncertainty should be anticipated for GZM, even if the isopleth intersections cover a relatively small region in the P-T space.
Because an analytically determined bulk rock composition is used for GZM estimates, elaborating on insights reported by [68,73] about what is considered representative or an appropriate bulk rock composition is necessary. The term “bulk composition” is generally accepted to mean the average chemical composition of the entire analyzed sample, typically less than or equal to a thin section in size. This scale is appropriate because it is typically smaller than the equilibration volume during a metamorphic event. Lanari et al. [73] refers to this as the “local bulk composition”. Typically, analytically derived bulk rock compositions contain contributions from accessory minerals that cannot or do not need to be considered during phase equilibria modeling. As described by [68], appropriate corrections to the bulk composition are made to account for these, resulting in a “model-ready bulk composition”. Theoretically, a portion of a zoned metamorphic mineral (e.g., garnet) is unreactive during the later stages of metamorphism. As such, the relevant bulk composition for a volume of rock at nearly all times during metamorphism is not the analytically determined bulk rock composition (i.e., model-ready). In this circumstance, the reactive composition is commonly referred to as the “effective bulk composition”. Palin et al. [68] and Lanari et al. [73] have described at length the inherent uncertainties associated with each definition of a bulk rock composition. For the purposes of GZM, it is important to ensure a representative model-ready bulk rock composition is used to estimate nucleation, that an appropriate, effective bulk composition is used to estimate later P-T estimates along a garnet growth path, and that the user understands the associated uncertainties of these values which will propagate through to the final reported P-T estimates.
Another inherent assumption is closed system behavior. Because GZM computes an effective bulk composition for each P-T step, we assume there is no chemical loss or gain by the system. Closed rock systems specify that elements partition and exchange into and between minerals as they grow. For example, as Mn is incorporated into garnet during growth, its concentration is reduced in the surrounding matrix. In a closed system, it is assumed that Mn is not flushed away by geofluids leaving the system. In reality, a garnet composition could change during crystal growth due to open-system conditions, making this assumption unreliable (e.g., [74]). Chemical exchange in an open system can alter the primary composition of any mineral phase. For instance, rare earth elements and isotopic tracers have demonstrated this behavior in metamorphic zircon [75]. However, for pelitic schists metamorphosed at amphibolite-facies conditions, open-system exchange may only be a concern for garnets along high fluid-flow conduits (e.g., [76]).
GZM thermobarometry is not immune to a lack of chemical equilibrium, which can never be proven for any rock system (e.g., [46]). Modification of initial growth compositions is possible either by intracrystalline diffusion in garnet or via post-growth fluid-rock interaction associated with dissolution-reprecipitation reactions (e.g., [74,75,77]). Again, however, this is generally a minor concern [76].
Another challenge to the GZM approach of generating P-T paths is determining and defining the starting conditions of the garnet core nucleation. The geometric crystal core can be determined by high-resolution computed X-ray tomography [78]. However, the compositional core does not always coincide with a geometric center because zoning can be asymmetric [79]. Thus, chemical evaluation is mandatory to determine chemical zoning along a centrally exposed crystal. To ensure a complete chemical record is studied, one would analyze the largest crystal(s) in a population. Alternative approaches are used to approximate “core” in the absence of X-ray tomography data. For instance, thin section-scale X-ray maps can be used to reveal the largest crystals within a thin section that have the highest concentration of Mn closest to the crystal’s center. EPMA can then chemically characterize the garnets from core to rim. If the largest garnet in a single-stage, prograde metamorphosed pelite with a simple reaction history, such as chlorite dehydration, is the oldest, then the largest crystal with the highest Mn content in the core should retain a complete chemical record of garnet growth. One caveat to this logic though is the largest crystal does not necessarily imply the oldest crystal. Thus, reinforcing the need to analyze an array of garnets from each sample, varying in size and even proximity to other garnet crystals. In general, analyzing the largest crystal has proven successful in other studies using the GZM approach (e.g., [17,19,20,21,22,23]). A significant value of the GZM approach is that when systems stray from chemical equilibrium, central sectioning, zoning symmetry, and a lack of diffusional modification, a user can detect the problem. An important check on the efficacy of the GZM P-T path and isopleth conditions is whether the results seem geologically reasonable.
3.2. Forward-Modeling Intracrystalline Diffusion and Garnet Growth
Intracrystalline diffusion of Ca++, Mg++, Fe++, and Mn++ within garnet during growth along a specified P-T path is modeled using Theria_G [26]. This program simultaneously models intracrystalline diffusion and accounts for chemical fractionation during garnet growth. This approach requires a specified bulk-rock chemical composition, garnet crystal size distribution (CSD), diffusion parameters, and an input P-T-t trajectory (Figure 3). With these inputs, Theria_G models both primary and diffusion-modified garnet compositions for each radius class of the CSD.
Theria_G is used for two portions of this contribution. First, intracrystalline diffusion is modeled for an average metapelitic schist using the bulk composition of [80] (Table 1). We use diffusion parameters from [81], and CSD1 of [26] with a radius class value of 140 μm. A radius class of 140 μm means that each garnet population increases in crystal radius by 140 μm from the previous class, starting with 140 μm, and theoretically ending at 1400 μm. Radii classes are defined as garnet generations and are numbered based on their growth fraction. Pressure-temperature-time path trajectories are described in detail later.
The second application of Theria_G is forward modeling garnet growth in the Bayındır and Bozdağ nappes from the Central Menderes Massif. Here four separate input bulk compositions are used (Table 1). One is an averaged Bayındır nappe bulk-rock composition (n = 6 samples), the second is an averaged Bozdağ nappe bulk-rock composition (n = 3 samples), and the final two are specific, representative, samples from each nappe (Bozdağ = MM03-26; Bayındır = MM03-23) (Table 1). Averaged values, instead of individual compositions from every sample, were used as the approach was to compare Theria_G results across multiple samples. Two specific samples for included for nuanced comparisons. A CSD consisting of eight radii classes was specified, each increasing in radius by 250 μm (Figure 4). Pressure-temperature-time path trajectories are described in detail below. Major element X-ray maps from all CMM samples considered in this contribution, including MM03-23 and MM03-26, can be found in Supplementary File S1.
4. Results
4.1. Modeling Diffusion in an Average Metapelitic Schist
Although chemical diffusion and the impacts of diffusional modification on P-T path calculations have long been a focus of study (e.g., [80,81,82,83,84,85,86,87,88,89,90,91]), documenting how diffusion impacts GZM P-T paths has been noted [22,23] but under-explored. Original divalent cation zoning in garnet < 100 μm will be modified if the crystal encounters T > 600 °C for a protracted period (e.g., [3,90,91,92,93,94]). A fundamental assumption for the GZM approach is that input garnet compositions record their original, prograde growth paths.
To investigate the impact of cation diffusion on GZM estimates, we numerically simulated garnet growth for a given volume of rock over a series of P-T-t paths. Note, results presented in the following subsection do not focus specifically on garnets from Turkey but rather, a separate numerical experiment designed to independently test the effect of diffusion on the GZM method. Each simulation ran along a unique P-T-t trajectory (Figure 3B,C). Two were identical to “Path B” used by [26], only differing in heating/cooling rate (5 °C/my vs. 50 °C/my). These rates were chosen to examine the impact of two extremes: slow (5 °C/my) and rapid (50 °C/my). Inferences can be made intermediate rates based on our observations and those made by others (e.g., [92]). The next two simulations are similar in path shape and have identical heating/cooling rates to Path B but achieved a max T of 670 °C (as opposed to 610 °C) and a final T of 515 °C (as opposed to 455 °C) (Figure 3B). Once all four simulations were finished, forward-modeled garnet compositions (primary and diffusional-modified) were used as inputs for GZM P-T path modeling and isopleth thermobarometry. Because the P-T path was prescribed, the accuracy of each GZM path can be evaluated. Note- simulations are referenced by their path and heating/cooling rate (Path-B_5 °C/my, Path-B_50 °C/my, Path-hiT_5 °C/my, and Path-hiT_50 °C/my). All simulation input specifications and results are summarized in the next sections and in Supplementary File S2.
4.1.1. Modeling Garnet Compositions
Garnets from radii classes 1, 4, 6, and 8 are compared within and between the various model simulations. Figure 5 and Figure 6 show the results using only the almandine and spessartine mole fractions. All compositional data, including pyrope and grossular mole fractions, can be found in Supplementary File S3.
For Path-B_5 °C/my and Path-B_50 °C/my, the initial almandine fractions are not impacted by diffusion as each class contains their appropriate chemical record of the overall garnet growth episode. Each class is identical to its counterpart between simulations (i.e., non-diffused vs. diffused). Class 1 contains a complete chemical record of metamorphism, whereas class 8 only recorded a small fraction (as expected). In Path-B_5 °C/my (Figure 5A), radius class 1 has an initial Xalm of 0.46-mole fraction, whereas classes 6 and 8 are higher at 0.53 and 0.63 initial Xalm, respectively. Compared to Path-B_50 °C/my (Figure 5B), the initial fractions are identical. Both Path-hiT_5 °C/my and Path-hiT_50 °C/my results have similar chemical gradient trends that increase from the core to rim; however, the initial almandine fractions for Path-hiT_5 °C/my are ~0.1 higher (Figure 5C,D).
As seen in the diffused results for all four simulations, diffusion noticeably relaxes the almandine profiles in the lower heating/cooling rate simulations (Path-B_5 °C/my and Path-hiT_5 °C/my). For Path-B_5 °C/my, the effect of diffusion is most pronounced in radius class 6 (Figure 5A). Garnets from Path-hiT_5 °C/my were most impacted by diffusion, and every radius class exhibits gradient relaxation (Figure 5C). Similar trends are observed in the spessartine mole fraction in both initial prograde and diffusion profiles (Figure 6).
4.1.2. Core and Rim P-T Conditions by Isopleth Thermobarometry
Table 2 lists all core P-T conditions estimated by GZM isopleth thermobarometry for all radii classes. The associated isochemical phase diagrams and fractionated bulk compositions that generated these conditions are provided in Supplementary Files S4 and S5. Samples are coded by heating/cooling rate (5 °C/my vs. 50 °C/my), radius class (1, 4, 6, 8), and whether the primary (p) or diffused (d) garnet composition modeled by Theria_G is used (e.g., 5-1_p = 5 °C/my, radius class 1, primary composition). For each garnet generation in all four Theria_G simulations, core and rim conditions were estimated. These conditions were estimated using the Theria_G predicted prograde garnet composition and the final diffusional-modified composition. Appropriate fractionated bulk compositions computed by Theria_G are used as the “initial” bulk compositions for later generations.
GZM core P-T estimates for garnets from Path B at 5 °C/my and 50 °C/my were obtained for every sample. These estimates, made using the original prograde composition, reproduced P-T values predicted by Theria_G for every garnet radius class. Isopleth P-T estimates agree with the prescribed conditions of garnet-growth computed by Theria_G; this is a cross-check to ensure isopleth P-T estimates are reliable. Core P-T estimates made using diffused garnet compositions from Path-B_ 5 °C/my deviate from their undiffused counterpart for radii classes 6 and 8. For Path-B_50 °C/my, core estimates made using diffused compositions slightly deviate from non-diffused composition estimates by <5 °C and <0.3 kbar (Table 2).
For reference, we will state the anticipated (i.e., prescribed) P-T conditions. For Path B at 5 °C/my and 50 °C/my radius class 1 nucleates at 500 °C and 5.9 kbar; radius class 4 nucleates at 502 °C and 5.9 kbar; radius class 6 nucleates at 517 °C and 6.6 kbar; radius class 8 nucleates at 556 °C and 9.1 kbar. For 5 °C/my, all growth should cease at 560 °C and 9.7 kbar, and at 565 °C and 9.7 kbar for 50 °C/my. For Path hiT at 5 °C/my and 50 °C/my radius class 1 nucleates at 521 °C and 5.3 kbar; radius class 4 nucleates at 523 °C and 5.4 kbar; radius class 6 nucleates at 543 °C and 5.9 kbar; radius class 8 nucleates at 579 °C and 6.8 kbar. For 5 °C/my, all growth should cease at 645 °C and 10.1 kbar, and at 589 °C and 7.2 kbar for 50 °C/my.
Garnet core P-T estimates from both Path-hiT trajectories agree with Theria_G predicted values for every estimate made using undiffused compositions. Estimating core-growth conditions for diffused garnets from the Path-hiT_5 °C/my simulation was only possible for radii classes 1 and 8. However, radius class 8 diffused conditions are 40 °C and 1.8 kbar higher than estimates from its undiffused counterpart (Table 2). An inability to produce estimates for radii classes 4 and 6 is because the diffused compositions significantly deviate from their undiffused counterparts (>0.1 mole fraction), whereas diffused and undiffused compositions from radii classes 1 and 8 are within 0.02 mole fraction. Path-hiT_50 °C/my diffused profile core P-T estimates from every generation agree with their undiffused counterparts. This result is because core compositions were unchanged between diffused and undiffused profiles.
Rim P-T estimates made by isopleth thermobarometry were successful for every radius class from Path-B_5 °C/my (Table 2). Again, this was a cross-check to demonstrate we are able to reproduce prescribed growth conditions. Success means isopleth thermobarometry estimated the prescribed P and T conditions (i.e., all isopleth overlapped). Attempts to generate rim conditions for samples from Path-B_50 °C/my were successful when using the prograde garnet composition. However, they failed when using diffused compositions for all but the largest radius class. This failure occurred despite an agreement between the original and diffused compositions. Subtle diffusion in the smaller radii classes likely impacted how the bulk rock fractionated during garnet growth, thus impeding the method’s ability to estimate conditions.
Estimating the correct rim P-T conditions when using compositions from Path-hiT at both rates is variable (Table 2). Path-hiT_5 °C/my rim estimates are obtained for every radius class, except for radius classes 4 and 6 when using diffused compositions (Table 2). Every estimate made using a primary composition returned the prescribed rim-growth conditions for this simulation, whereas radius class 1 using the diffused composition underestimated T by ~100 °C. Rim P-T estimates made by isopleth thermobarometry for Path-hiT_50 °C/my garnets were successful (i.e., all isopleth overlapped) for every attempt, excluding radius classes 4 (both primary and diffused) and 6 (only diffused). For these cases, P-T estimates did not predict the prescribed conditions at the end of the paths. This failure, in turn, led to the computation of an incorrect fractionated bulk composition that is not in equilibrium with Theria_G computed garnet compositions. We will elaborate on the problem regarding the effective bulk composition of diffused samples later. If the final six points from both paths are ignored (both undiffused and diffused), however, the final rim estimates agree with the prescribed conditions.
4.1.3. Modeled P-T Paths
GZM-modeled garnet-growth P-T paths are obtained for every sample listed in Table 2. Again, the garnet compositions were produced by Theria_G simulations and the specified bulk composition of [79]. GZM paths modeled using garnet compositions from Path-B 5 °C/my and 50 °C/my replicate the prescribed Theria_G path regardless of whether the core to rim composition has been modified by diffusion (Figure 7a,b). The results are generally within the accepted analytical uncertainty for thermobarometry, as discussed earlier. However, minor deviations exist. The final six points of Path-B_ 5 °C/my, radius class 4, and primary composition overestimate T by ~15 °C (Figure 7a). The final points of Paths-B_ 50 °C/my, radius classes 6 and 8, using diffused compositions, overestimate T by ~10 °C and P by ~0.5 kbar (Figure 7b). GZM P-T path estimates using garnet compositions from Path-hiT_5 °C/my and Path-hiT_50 °C/my deviate from the prescribed Theria_G path to a greater extent, specifically when using diffused garnet compositions.
This failure to replicate the prescribed path is most pronounced for diffused garnets from Path-hiT_5 °C/my (Figure 7c). For this group, only radius class 1 generated a P-T path estimate consistent in shape to the prescribed path but ultimately underestimates P by ~3.5 kbar at the end. Radii classes 4, 6, and 8 all fail to estimate the correct P-T conditions and even suggest garnet grew during exhumation as opposed to burial. Specifically, radius class 4 begins at 555 °C and 6.9 kbar, proceeds to drop in pressure to 6.2 kbar (T = 585 °C) and then reaches its final point at 630 °C and 6.9 kbar. Radius class 6 begins at 575 °C and 7 kbar, continues to increase in T to 585 °C but drops in P to 6.2 kbar. Similarly, radius class 8 begins at 577 °C and 6.9 kbar and grows along an exhumation path to 586 °C and 6.3 kbar.
Interestingly, for path-hiT_50 °C/my, diffused compositions from each radii class returned P-T estimates that fell within the range of the complete garnet growth window. For example, every P-T estimate from radius class 4 ranges from 7 kbar and 550 °C to 6 kbar and 590 °C, whereas the prescribed garnet growth window is between 5.3 kbar and 520 °C and 10 kbar and 660 °C. Although the diffused composition from radius class 4 was unable to predict the true P-T path shape, it was still able to return meaningful P-T estimates for the sample. Here meaningful estimated conditions are defined as those that the garnet experienced at some point during metamorphism, but not necessarily at nucleation or growth termination.
P-T path estimates using garnet compositions (both non-diffused and diffused) from high-T_50 °C/my deviate less from the prescribed path than estimates using compositions from high-T_5 °C/my. In general, most P-T paths for high-T_50 °C/my agree with the prescribed path. However, the final P-T point estimates for radii classes 1, 4, and 6 (both non-diffused and diffused) overestimate P between 0.5–1.5 kbar and T by 5–15 °C (Figure 7d). The only significant path deviation occurred when the diffused compositions from radius class 6 were used (Figure 7d). The first half of the path suggests garnet growth was isobaric, and that the second half of growth occurred during burial. Both compositions from radius class 8 accurately estimated rim growth.
4.1.4. Variable Effective Bulk Compositions
To determine the efficacy of estimating core and rim conditions by isopleth thermobarometry for diffused garnets that may have nucleated well after the first generation, core and rim conditions were estimated using the initial bulk composition as opposed to the appropriate fractionated bulk compositions (Table 3). Theoretically, this scenario would be the only available composition one might have for a rock sample that experienced diffusion. We chose to focus on diffused core and rim compositions computed by Theria_G at both heating/cooling rates for Path hiT.
Estimating core P-T conditions did not work for radii classes 4 and 6 from Path-hiT_5 °C/my (hiT5-4_dp and hiT5-6_dp, Table 3), but every other case returned values consistent with the prescribed conditions of core growth (within standard thermobarometry errors). For instance, core-growth estimates for radius class 4 from Path-hiT_50 °C/my are 530 °C and 5.5 kbar (hiT50-4_dp, Table 3), whereas the actual conditions of nucleation for this sample are 525 °C and 5.5 kbar (Table 2). Rim P-T estimates were produced for every sample in this experiment and are identical within each simulation. For Path-hiT_5 °C/my, this experiment estimated conditions of 740 °C and 9.8 kbar (Table 3), whereas the prescribed rim-growth conditions are 665 °C and 10.2 kbar (Table 2). Simulation 4 estimates for this experiment were 580 °C and 6.8 kbar (Table 3), whereas prescribed rim growth occurred at 575 °C and 6.7 kbar (Table 2).
Not all the isopleths of ±0.01 mole fraction spessartine, grossular, almandine, and pyrope overlapped for each attempt. The values reported in Table 3 reflect regions in the P-T space where two or three of the four isopleths overlapped or converged but do not entirely overlap in the P-T space. For every trial with reported conditions, grossular and pyrope isopleths overlapped, and occasionally almandine. See Supplementary File S5 for complete isochemical phase diagrams.
Although Path-hiT_5 °C/my rim T estimates are over 100 °C higher, P estimates were consistent with the specified pressure. Both P and T estimates for Path-hiT_50 °C/my were identical to the prescribed values (Table 2). Because the appropriate bulk composition was not used, and the samples experienced chemical relaxation, replicating the prescribed conditions should not be expected. However, results from this experiment suggest meaningful rim P-T estimates might be retrievable from samples that have been impacted by diffusion, particularly from the late-stage garnets of a population. Heating and cooling rates also influence the reliability in that the more rapidly cooled (i.e., quickly exhumed) samples should retain a better record. Ultimately, this approach would not produce reliable GZM P-T paths for every sample, but the relative core and rim P-T estimate might be retrievable. These relative conditions may provide insights into the tectonic processes that operated in a field area that may not be otherwise obtainable.
4.2. A Model-Based Evaluation of the Central Menderes Massif using Theria_G
As noted above, GZM holds promise for estimating meaningful metamorphic conditions from diffused garnets and may reveal the extent to which diffusion alters estimated conditions from the original growth composition. We next evaluate the validity of metamorphic conditions reported from diffusively zoned garnets exposed in the central Menderes Massif, western Turkey [23].
To evaluate the reliability of these estimates, we use Theria_G to simulate garnet growth and intracrystalline diffusion over a series of specified P-T-t trajectories in an attempt to model the observed garnet zoning pattern in five of the rocks (Figure 1). These rocks are Bayındır samples MM03-22, MM03-23, MM03-33 and Bozdağ samples MM03-26, MM03-27 (Figure 8). This modeling exercise aims to test whether speculated Barrovian metamorphic P-T conditions/paths reported by [23] are plausible (Figure 2).
As noted by [23], the original chemical zoning in garnets from both the Bayındır and Bozdağ nappes was modified by intracrystalline diffusion. Only the largest garnets (>1.5 mm diameter) from the Bayındır nappe show core to rim chemical gradients (Figure 8a–d), and garnets from the Bozdağ nappe only retain minor chemical gradients, even those >2 mm in diameter (Figure 8e–h).
A CSD consisting of eight radii classes was specified based upon petrological observations (Figure 4a). Three Theria_G P-T-t trajectories were designed using petrological observations and previous P-T estimates (Figure 4b) [21,23,31,37,39]. P-T conditions for Path 1 are based upon previously reported GZM P-T paths in the Southern and Central Menderes Massif [21,23]. This path assumes a maximum P of 7.6 kbar and T of 600 °C before exhumation. Path 2 commences at 500 °C and 6 kbar, proceeds to 685 °C and 8.5 kbar, and then exhumes to 450 °C and 3 kbar. Path 3 is the same as path 2, but in this case, the sample reaches a maximum P of 10.5 kbar. Paths 2 and 3 are designed to test lower and upper P boundaries reported by [23] based on the observation of ragged staurolite grains associated with garnet. A heating/cooling rate of 18 °C/my is maintained for each path. This specific heating/cooling rate is chosen to maintain a simulation duration of ~20 ± 3 my (Figure 4c). Any rate between 15–23 °C/my would have also satisfied this goal.
The total duration of each path, 18 my (Path 1) and 23 my (Paths 2 and 3), is a consequence of maintaining a constant 18 °C/my heating/cooling rate (Figure 4c). The Barrovian-style Main Menderes Metamorphic (MMM) event is poorly constrained at 62-25 Ma based on 40Ar/39Ar and Rb-Sr mica ages [95,96,97]. However, the timeframe is generally attributed to the Eocene-Oligocene (e.g., [45,98]). We believe the model duration is consistent with (1) the timing of Cenozoic tectonism responsible for metamorphism, (2) the observation of partial exhumation of rocks in the Menderes Massif, and (3) reported timescales of metamorphism.
In total, four simulations were run: three using the averaged Bayındır nappe composition and one using the averaged Bozdağ nappe composition. Each Bayındır nappe simulation ran using one of the three P-T trajectories displayed in Figure 4b while the only simulation for the Bozdağ nappe was run along Path 3. We also include simulation results ran along Path 3 using the specific bulk-rock compositions of samples MM03-23 and MM03-26 as opposed to average bulk-rock compositions; observations from these two models are discussed.
We only present the Theria_G modeled almandine and spessartine mole fractions for radii classes 1, 3, 5, and 6 (Figure 9). Pyrope and grossular mole fractions are presented in Supplementary Files S6. The original garnet compositions generated from each simulation for the Bayındır nappe are typical of Barrovian metamorphic garnets. They show increasing almandine content and decreasing spessartine content from core to rim (Figure 9a–c,e–h). Noticeable diffusion is not observed for Bayındır Path 1 results but is observed in every radius class from Bayındır paths 2 and 3. This observation is not unexpected as Path 1 never exceeds 600 °C, whereas paths 2 and 3 achieve a maximum T of 685 °C. Despite the occurrence of diffusion in samples along paths 2 and 3, pronounced chemical gradients remain for their radii classes 1 and 3 (radii > 1.0 mm), and even a subtle gradient is present in the smaller garnets.
Only one simulation is executed for the Bozdağ nappe, and it evolved along P-T Path 3. Overall, spessartine content is low (<0.05 mole fraction) compared to almandine (between 0.72 and 0.9 mole fraction). Modeled prograde almandine compositions for every radius class predict a gradual increase from the core to mid-crystal then a sharp increase from ~0.76 mole fraction to ~0.9 mole fraction (Figure 9d). Following this increase, the almandine content decreases toward the rim, with a noticeable near-rim drop from 0.86 mole fraction to 0.84 mole fraction, then levels off to a constant value of ~0.8 mole fraction for the remainder of the crystal.
Modeled diffusion for almandine in every radius class is analogous to a wave in the Bozdağ nappe: an increase from core to mid crystal, then decrease from mid-crystal to rim. For spessartine, mole fraction values decrease from core to rim, but a minor mid-crystal spike is predicted (<0.01 mole fraction) (Figure 9h). Diffusion in spessartine is modeled for every radius class, but a subtle chemical gradient remains. This unusual chemical zoning, particularly evident for almandine content, is the consequence of predicted garnet stability varying across P-T space given the effective bulk-rock composition. The mid-crystal spike occurs because garnet growth ceased when the population reached 0.76 mole fraction as the P-T path crosses into the staurolite stability field but resumes as the model progresses into a second garnet growth stability field.
5. Discussion
5.1. Implications for the Reliability and Sensitivity of GZM
From the results of our sensitivity evaluation using an average metapelitic schist, we make several observations. First, estimating P-T conditions and paths by GZM appears to reproduce the prescribed initial condition if the sample does not experience peak metamorphic T > ~600 °C and/or is quickly exhumed. If a sample reaching a maximum T ~600 °C slowly cools (i.e., is slowly exhumed), diffusion is expected to occur for crystals with a radius < 0.8 mm (Figure 5A and Figure 6A). Despite this, P-T estimates within the standard errors of thermobarometry are still achievable. The results suggest that modeling garnet P-T paths by GZM should be possible for any metapelitic garnet-bearing rock that has a maximum T of ≤600 °C and is void of post-growth modification. These conditions correspond to moderate amphibolite facies Barrovian metamorphism. Post-growth modifications would include metasomatism and significant retrograde alteration.
Second, intracrystalline diffusion is expected in garnets experiencing a maximum T well above 600 °C, unless the crystal is rapidly exhumed and has a radius >1.0 mm (e.g., [3,89,90,91,93]). To focus on this observation, we have computed the mismatch between prescribed and modeled conditions (Figure 10; ΔTG-GZM). Because diffusion will modify a garnet composition if the sample slowly cools and/or has a radius <1.0 mm, meaningful P-T paths estimated by GZM should not be expected. Although our results do not define an accurate path or path shape, the P-T estimates are still generally meaningful in terms of the overall conditions. As seen in Figure 10, the larger radii classes for path hiT_5 generally produce estimates within 25 °C and 1 kbar, whereas smaller radii classes return unreliable absolute estimates. Although conditions are incorrect for the smaller crystals, most estimates do fall within uncertainty and could be considered satisfactory in a relative sense but should only be reported if supported by additional information (e.g., petrographic observations). Therefore, while GZM may not always be suitable for estimating P-T paths for diffused samples, estimates of meaningful relative metamorphic conditions appear to be possible using this method, as was the case in the Central Menderes Massif [23].
Third, if metamorphism significantly exceeds 600 °C and a sample is rapidly exhumed, the smallest, and/or last garnet population to nucleate, may lack compositional zoning. Garnet zoning may not develop because of a highly fractioned bulk-rock composition and short growth duration. Thus, garnets from this population may not experience dramatic chemical relaxation from the core to the rim. As such, this subpopulation theoretically should be able to accurately predict the final conditions of garnet growth (Figure 7d and Figure 10c,d). Because this population would nucleate well after the original bulk rock composition has fractionated in response to earlier metamorphism, approximately one million years in our example, what to use as an appropriate starting bulk composition when attempting to model a P-T path for this subpopulation remains unclear. We do note, however, this is not to say zoning cannot- or will not- develop in the youngest (or smallest) population(s), even subtle gradients can develop, and will then relax due to intracrystalline diffusion.
5.2. Interpreting the Cenozoic Metamorphic History of the Central Menderes Massif
Theria_G generated garnet compositions using averaged bulk rock compositions are compared against observed garnet compositions from the Bayındır (samples MM03-22, MM03-23, MM03-33) and Bozdağ nappes (samples MM03-26, MM03-27) in Figure 11. For illustrative purposes, we only focus on almandine and spessartine mole fractions. Bayındır Path 3 diffused spessartine compositions are similar to Bayındır nappe samples MM03-22 and MM03-33 in transect zoning pattern and concentration (Figure 11a,b). MM03-23 zoning is effectively flat, but the observed spessartine and almandine mole fraction values are comparable to simulated diffused profile values. Simulated zoning for Bozdağ nappe garnets is consistent with observed compositions in samples MM03-26 and MM03-28 (Figure 11e–h). Interestingly, even a Theria_G predicted “wave zonation” is observed for almandine, although more pronounced than in an actual sample (Figure 11g,h).
As mentioned earlier, these simulations used averaged bulk rock compositions. However, for further comparison, we have also included simulated results using the whole-rock bulk compositions from samples MM03-23 and MM03-26 (Figure 11a,c,e,g,). Here we only show the modeled diffused profiles. For the Bayındır nappe, the modeled garnet profile for MM03-23 is remarkably consistent with the observed composition for both spessartine and almandine (Figure 11a–d). For Bozdağ nappe sample MM03-26, the modeled spessartine profile is generally consistent with the observed values. Modeled almandine concentrations from core to rim for MM03-23 are similar, but we note modeled core is lower (0.71 vs. 0.81) while rim values are consistent. The almandine chemical wave described earlier is also predicted for MM03-26, however, as seen in Figure 11g, the inflection predicted by Theria_G is more pronounced than the observed profile.
As demonstrated here and suggested by [23], Bozdağ nappe and smaller Bayındır nappe garnets (<1 mm diameter) were likely modified by intracrystalline diffusion. Given the general consistency between simulation-predicted compositions and observed compositions, we postulate rocks from the Bozdağ and Bayındır nappes experienced a tectono-metamorphic history similar to Path 3 (Figure 3), although Bayındır nappe samples may not have been buried as deep. To summarize our preferred interpretation: metamorphism initiates at ~500 °C and ~6 kbar, reaches a maximum P of 10.5 kbar, experiences a maximum T of 685 °C as a transition from burial to exhumation occurs, then the sample is isothermally exhumed to a P of 5.5 kbar and finally cools to <450 °C at 3 kbar. Given the stipulated heating/cooling rate, a sample evolving along this path would have been exhumed from peak P (10.5 kbar) to a P of 5.5 kbar within 3 million years, then gradually exhumed to a P of 3 kbar over 12 million years. While the exact conditions (maximum P and T) and specific heating/cooling rate are debatable, it is clear from this modeling exercise that all garnets experienced peak metamorphic T of ≥650 °C.
6. Conclusions
GZM is a promising technique that can sharpen our understanding of the lithospheric dynamics responsible for metamorphism. A primary objective of this work was to evaluate the reliability of GZM thermobarometry, test its sensitivity to intracrystalline diffusion, and reinterpret the Cenozoic prograde metamorphic history of the Central Menderes Massif (Figure 12). Sensitivity testing was accomplished using Theria_G to simulate garnet growth along a series of prescribed P-T-t trajectories for a sample with an average metapelite composition. This experiment suggests that estimating P-T conditions using GZM is a reliable approach, particularly when peak metamorphic T is ≤600 °C and/or if the sample was rapidly exhumed. Naturally, the most reliable garnet from a population to target is from the first generation (i.e., theoretically largest), but later generations also return reliable P-T estimates. Not surprisingly, diffusion will occur if a sample achieves peak T’s sufficiently above 600 °C; however, the extent to which chemical relaxation progresses is a function of heating/cooling rate and crystal size. This general result has been previously demonstrated (e.g., [93]). Within this category of samples (i.e., high peak T’s), the ability to model reliable garnet-growth P-T paths is strongly dependent upon the heating/cooling rate. Results here indicate that replication of prescribed P-T paths is possible so long as cooling is rapid. Finally, this series of modeling experiments suggest that although precise P-T estimates cannot be made for a sample that has experienced intracrystalline diffusion, meaningful P-T estimates can be made by isopleth thermobarometry. Caution should be exercised if attempting to model complete P-T paths by GZM for this class of samples.
Findings from this study validate the results presented by [23] for samples from the central Menderes Massif (Figure 12). Further application of Theria_G using average bulk rock compositions from the region confirmed their “flat” profiles are a consequence of chemical relaxation by predicting observed EPMA compositions. This work also suggests peak metamorphic T’s in the region exceeded 650 °C. While implied peak P from this work overestimates previously reported GZM P’s by 2–3 kbar [23] (Figure 12), our new results suggest these rocks reach a maximum P of 8–10 kbar. Overall, peak P and T conditions reported in this contribution are consistent with observed mineral assemblages and are, therefore, considered reliable.
Supplementary Materials
The following are available online at https://0-www-mdpi-com.brum.beds.ac.uk/article/10.3390/geosciences11120505/s1, File S1: major element (Fe, Mg, Mn, Ca) X-ray maps of garnets from the Central Menderes Massif; File S2: all simulation input specifications and results; File S3: Theria_G simulated garnet compositions for an average metapelitic schist; File S4: fractionated bulk compositions generated by Theriak Domino; File S5: all isochemical phase diagrams and labeled reactions; File S6: Theria_G simulated garnet compositions for average Bayındır and Bozdağ nappe garnets.
Author Contributions
Conceptualization, T.M.E. and E.J.C.; methodology, T.M.E.; software, T.M.E.; validation, T.M.E. and E.J.C.; formal analysis, T.M.E. and E.J.C.; investigation, T.M.E. and E.J.C.; resources, T.M.E. and E.J.C.; data curation, T.M.E. and E.J.C.; writing—original draft preparation, T.M.E.; writing—review and editing, T.M.E. and E.J.C.; visualization, T.M.E. and E.J.C.; project administration, T.M.E. and E.J.C.; funding acquisition, E.J.C. and T.M.E. All authors have read and agreed to the published version of the manuscript.
Funding
This material is based upon work supported by the National Science Foundation under Grant No. 0937254. Additional funding was provided by the Jackson School of Geosciences. This contribution was inspired by several years of experimentation and fruitful discussions with many collaborators.
Data Availability Statement
All data supporting this contribution can be found in the Supplementary Files as well as in a previous publication [23].
Acknowledgments
This work would not have been possible without Cenk Ozerdem collecting samples in the Menderes Massif and Ibrahim Cemen’s expertise in western Anatolian Geology. We thank Eric Kelly for introducing us to GZM thermobarometry and his involvement early on in refining the approach. We thank Freya George for assisting us with the initial setup and execution of Theria_G. Other aspects of this work evolved from indirect conversations on web-based discussion boards. Specifically, we thank Pierre Lanari for an insightful review on determining uncertainty associated with thermobarometric estimates and calculating isochemical phase diagrams. We thank two anonymous referees and Mark Cloos for their insightful and constructive feedback on an earlier version of this contribution. Finally, we appreciate Thomas Hoisch and two anonymous reviewers for their helpful comments.
Conflicts of Interest
The authors declare no conflict of interest. The funders had no role in the design of the study, in the collection, analyses, or interpretation of data, the manuscript’s writing, or the decision to publish the results.
References
- Hollister, L.S. Garnet zoning: An interpretation based on the Rayleigh fractionation model. Science 1966, 154, 1647–1651. [Google Scholar] [CrossRef]
- Atherson, M.P. The variation in garnet, biotite and chlorite composition in medium grade pelitic rocks from the Dalradian, Scotland, with particular reference to the zonation in garnet. Contrib. Miner. Petrol. 1968, 18, 347–371. [Google Scholar] [CrossRef]
- Tracy, R.J.; Robinson, P.; Thompson, A.B. Garnet composition and zoning in the determination of temperature and pressure of metamorphism, central Massachusetts. Am. Min. 1976, 61, 762–775. [Google Scholar]
- Ferry, J.M.; Spear, F.S. Experimental calibration of portioning of Fe and Mg between biotite and garnet. Contrib. Miner. Petrol. 1978, 66, 113–117. [Google Scholar] [CrossRef]
- Spear, F.S.; Selverstone, J. Quantitative P-T paths from zoned minerals: Theory and tectonic applications. Contrib. Miner. Petrol. 1983, 83, 348–357. [Google Scholar] [CrossRef]
- Spear, F.S.; Selverstone, J.; Hickmott, D.; Crowley, P.; Hodges, K.V. P-T paths from garnet zoning: A new technique for deciphering tectonic processes in crystalline terranes. Geology 1984, 12, 87–90. [Google Scholar] [CrossRef]
- Hickmott, D.D.; Shimizu, N.; Spear, F.S.; Selverstone, J. Trace element zoning in a metamorphic garnet. Geology 1987, 15, 573–576. [Google Scholar] [CrossRef]
- Berman, R.G. Mixing properties of Ca-Mg-Fe-Mn garnets. Am. Min. 1990, 75, 328–344. [Google Scholar]
- Hoisch, T.D. Empirical calibration of six geobarometers for the mineral assemblage quartz + muscovite + biotite + plagioclase + garnet. Contrib. Miner. Petrol. 1990, 104, 225–234. [Google Scholar] [CrossRef]
- Kohn, M.J.; Spear, F.S. Error propagation for barometers: 2. Applications to rocks. Am. Min. 1991, 76, 138–147. [Google Scholar]
- Indares, A. Metamorphic interpretation of high-pressure-temperature metapelites with preserved growth zoning in garnet, eastern Grenville Province, Canadian Shield. J. Metamorph. Geol. 1995, 13, 465–486. [Google Scholar] [CrossRef]
- Vance, D.; Mahar, E. Pressure-temperature paths from P-T pseudosections and zoned garnets: Potential, limitations and examples from the Zanskar Himalaya, NW India. Contrib. Miner. Petrol. 1998, 132, 225–245. [Google Scholar] [CrossRef]
- Holdaway, M.J. Optimization of some key geothermobarometers for pelitic metamorphic rocks. Miner. Mag. 2004, 68, 1–14. [Google Scholar] [CrossRef]
- Tinkham, D.K.; Ghent, E.D. Estimating P-T conditions of garnet growth with isochemical phase-diagram sections and the problem of effective bulk-composition. Can. Miner. 2005, 43, 35–50. [Google Scholar] [CrossRef]
- Kohn, M.J. P-T-t data from central Nepal support critical taper and repudiate large-scale channel flow of the Greater Himalayan Sequence. Geol. Soc. Am. Bull. 2008, 120, 259–273. [Google Scholar] [CrossRef]
- Gasco, I.; Gattiglio, M.; Borghi, A. Lithostratigraphic setting and P-T metamorphic evolution for the Dora Maira massif along the Piedmont Zone boundary (middle Susa Valley, NW Alps). Int. J. Earth Sci. 2011, 100, 1065–1085. [Google Scholar] [CrossRef]
- Moynihan, D.P.; Pattison, D.R.M. An automated method for the calculation of P-T paths from garnet zoning, with application to metapelitic schists from the Kootenay Arc, British Columbia, Canada. J. Metamorph. Geol. 2013, 31, 525–548. [Google Scholar] [CrossRef]
- Vrijmoed, J.C.; Hacker, B.R. Determining P-T paths from garnet zoning using a brute-force computational method. Contrib. Miner. Petrol. 2014, 167, 997. [Google Scholar] [CrossRef]
- Kelly, E.D.; Hoisch, T.D.; Wells, M.L.; Vervoort, J.D.; Beyene, M.A. An Early Cretaceous garnet pressure-temperature path recording syncovergent burial and exhumation from the hinterland of the Sevier orogenic belt, Albion Mountains, Idaho. Contrib. Miner. Petrol. 2015, 170, 20. [Google Scholar] [CrossRef]
- Catlos, E.J.; Lovera, O.M.; Kelly, E.D.; Ashley, K.T.; Harrison, T.M.; Etzel, T.M. Modeling high-resolution pressure-temperature paths across the Himalayan Central Thrust (Central Nepal): Implications for the dynamics of collision. Tectonics 2018, 37, 2363–2388. [Google Scholar] [CrossRef]
- Etzel, T.M.; Catlos, E.J.; Ataktürk, K.; Lovera, O.M.; Kelly, E.D.; Çemen, I.; Diniz, E. Implications for thrust-related shortening punctuated by extension from P-T paths and geochronology of garnet-bearing schists, Southern (Çine) Menderes Massif, SW Turkey. Tectonics 2019, 38, 1974–1998. [Google Scholar] [CrossRef] [Green Version]
- Craddock Affinati, S.; Hoisch, T.D.; Wells, M.L.; Vervoort, J.D. Pressure-temperature-time paths from the Funeral Mountains, California, reveal Jurassic retroarc underthrusting during early Sevier orogenesis. Geol. Soc. Am. Bull. 2019, 132, 1047–1065. [Google Scholar] [CrossRef]
- Etzel, T.M.; Catlos, E.J.; Cemen, I.; Ozerdem, C.; Oyman, T.; Miggins, D. Documenting exhumation in the Central and Northern Menderes Massif (Western Turkey); New insights from garnet-based P-T estimates and K-feldspar 40Ar/39Ar geochronology. Lithosphere 2020, 2020, 8818289. [Google Scholar] [CrossRef]
- De Capitani, C.; Brown, T.H. The computation of chemical equilibrium in complex systems containing non-ideal solutions. Geochim. Cosmochim. Acta 1987, 51, 2639–2652. [Google Scholar] [CrossRef]
- De Capitani, C.; Petrakakis, K. The computation of equilibrium assemblage diagrams with Theriak/Domino software. Am. Min. 2010, 95, 1006–1016. [Google Scholar] [CrossRef]
- Gaidies, F.; de Capitani, C.; Abart, R. THERIA_G: A software program to numerically model prograde garnet growth. Contrib. Miner. Petrol. 2008, 155, 657–671. [Google Scholar] [CrossRef] [Green Version]
- Ring, U.; Gessner, K.; Gűngör, T.; Passchier, C.W. The Menderes Massif of western Turkey and the Cycladic massif in the Aegean: Do they really correlate? J. Geol. Soc. Lond. 1999, 156, 3–6. [Google Scholar] [CrossRef]
- Gessner, K.; Ring, U.; Passchier, C.W.; Gungor, T. How to resist subduction: Evidence for large-scale out-of-sequence thrusting during Eocene collision in western Turkey. J. Geol. Soc. Lond. 2001, 158, 769–784. [Google Scholar] [CrossRef] [Green Version]
- Jolivet, L.; Rimmelé, G.; Oberhänsli, R.; Goffé, B.; Candan, O. Correlation of syn-orogenic tectonic and metamorphic events in the Cyclades, the Lycian nappes and the Menderes Massif. Geodynamic implications. Bull. Soc. Géol. Fr. 2004, 175, 217–238. [Google Scholar] [CrossRef]
- Dora, O.O.; Candan, O.; Kaya, O.; Durr, S.; Oberhansli, R. New evidence concerning the geotectonic evolution of the Menderes Massif. In Proceedings of the International Earth Science Colloquium on the Aegean Region, Izmir, Turkey, 9–14 October 1995; Volume 1, pp. 53–72. [Google Scholar]
- Ring, U.; Willner, A.P.; Lackmann, W. Stacking of nappes with different pressure-temperature paths; an example from the Menderes Nappes of western Turkey. Am. J. Sci. 2001, 301, 912–914. [Google Scholar] [CrossRef]
- Okay, A.I. Stratigraphic and metamorphic inversions in the central Menderes Massif: A new structural model. Int. J. Earth Sci. 2001, 89, 709–727. [Google Scholar] [CrossRef]
- Régnier, J.; Mezger, J.E.; Passchier, C. Metamorphism of Precambrian-Paleozoic schists of the Menderes core series and contact relationships with Proterozoic orthogneisses of the western Çine Massif, Anatolide belt, western Turkey. Geol. Mag. 2007, 144, 67–104. [Google Scholar] [CrossRef] [Green Version]
- Candan, O.; Dora, O.O.; Oberhansli, R.; Cetinkaplan, M.; Partzsch, J.H.; Warkus, F.C.; Durr, S. Pan-African high-pressure metamorphism in the Precambrian basement of the Menderes Massif, western Anatolia, Turkey. Int. J. Earth Sci. 2001, 89, 793–811. [Google Scholar]
- Hetzel, R.; Romer, R.; Candan, O.; Passchier, C.W. Geology of the Bozdağ area, central Menderes Massif, SW Turkey: Pan-African basement and Alpine deformation. Geol. Rundsch. 1998, 87, 394–406. [Google Scholar] [CrossRef]
- Ashworth, J.R.; Evirgen, M.M. Garnet and associated minerals in the southern margin of the Menderes Massif, southwest Turkey. Geol. Mag. 1984, 121, 323–337. [Google Scholar] [CrossRef]
- Iredale, L.J.; Teyssier, C.; Whitney, D.L. Cenozoic pure-shear collapse of the southern Menderes Massif, Turkey. Geol. Soc. Lond. Spec. Publ. 2013, 372, 323–342. [Google Scholar] [CrossRef]
- Régnier, J.; Ring, U.; Passchier, C.W.; Gessner, K.; Gungor, T. Contrasting metamorphic evolution of metasedimentary rocks from the Cine and Selimiye nappes in the Anatolide belt, western Turkey. J. Metamorph. 2003, 21, 699–721. [Google Scholar] [CrossRef]
- Whitney, D.L.; Bozkurt, E. Metamorphic history of the southern Menderes Massif, western Turkey. Geol. Soc. Am. Bull. 2002, 114, 829–838. [Google Scholar] [CrossRef]
- Ashworth, J.R.; Evirgen, M.M. Plagioclase relations in pelites, central Menderes Massif, Turkey. I. The peristerite gap with coexisting kyanite. J. Metamorph. 1985, 3, 207–218. [Google Scholar] [CrossRef]
- Ashworth, J.R.; Evirgen, M.M. Plagioclase relations in pelites, Menderes Massif, Turkey; II. Perturbation of garnet-plagioclase geobarometers. J. Metamorph. 1985, 3, 219–229. [Google Scholar] [CrossRef]
- Satır, M.; Taubald, H. Hydrogen and oxygen isotope evidence for fluid-rock interaction in the Menderes Massif, western Turkey. Int. J. Earth Sci. 2001, 89, 812–821. [Google Scholar] [CrossRef]
- Çemen, I.; Catlos, E.J.; Gögűs, O.; Özerdem, C. Postcollisional extensional tectonics and exhumation of the Menderes massif in the Western Anatolia extended terrane, Turkey. Spec. Pap.-Geol. Soc. Am. 2006, 409, 353–379. [Google Scholar]
- Ozerdem, C. Thermobarometric Constraints on the Evolution of the Menderes Massif (Western Turkey): Insights into the Metamorphic History of a Complexly Deformed Region. Master’s Thesis, Oklahoma State University, Stillwater, OK, USA, 2004; pp. 1–89. [Google Scholar]
- Cenki-Tok, B.; Expert, M.; Işık, V.; Candan, O.; Monié, P.; Bruguier, O. Complete Alpine reworking of the northern Menderes Massif, western Turkey. Int. J. Earth Sci. 2016, 105, 1507–1524. [Google Scholar] [CrossRef]
- Spear, F.S. Metamorphic Phase Equilibria and Pressure-Temperature-Time Paths; Mineralogical Society of America: Washington, DC, USA, 1993; pp. 1–799. [Google Scholar]
- Walker, C.B.; Searle, M.P.; Waters, D.J. An integrated tectonothermal model for the evolution of the High Himalaya in western Zanskar with constraints from thermobarometry and metamorphic modeling. Tectonics 2001, 20, 810–833. [Google Scholar] [CrossRef]
- Walsh, E.O.; Hacker, B.R. The fate of subducted continental margins: Two-stage exhumation of the high-pressure to ultrahigh-pressure Western Gneiss Region, Norway. J. Metamorph. 2004, 22, 671–687. [Google Scholar] [CrossRef]
- Root, D.B.; Hacker, B.R.; Gans, P.B.; Ducea, M.N.; Eide, E.A.; Mosenfelder, J.L. Discrete ultrahigh-pressure domains in the Western Gneiss Region, Norway: Implications for formation and exhumation. J. Metamorph. 2005, 23, 45–61. [Google Scholar] [CrossRef]
- Selverstone, J.; Spear, F.S. Metamorphic P-T paths from pelitic schists and greenstones from the south-west Tauern Window, Eastern Alps. J. Metamorph. 1985, 3, 439–465. [Google Scholar] [CrossRef]
- Faryard, S.W.; Jezek, J. Compositional zoning in garnet and its modification by diffusion during pressure and temperature changes in metamorphic rocks; an approach and software. Lithos 2019, 332, 287–295. [Google Scholar] [CrossRef]
- Connolly, J.A.D.; Petrini, K. An automated strategy for calculation of phase diagram sections and retrieval of rock properties as a function of physical conditions. J. Metamorph. 2002, 20, 697–708. [Google Scholar] [CrossRef] [Green Version]
- Connolly, J.A.D. Computation of phase equilibria by linear programming: A tool for geodynamic modeling and its application to subduction zone decarbonation. EPSL 2005, 236, 524–541. [Google Scholar] [CrossRef]
- Trooper, P.; Hauzenberger, C. How well do pseudosection calculations reproduce simple experiments using natural rocks: An example from high-P high-T granulites of the Bohemian Massif. Austrian J. Earth Sci. 2015, 108, 123–138. [Google Scholar] [CrossRef]
- Marmo, B.A.; Clarke, G.L.; Powell, R. Fractionation of bulk rock composition due to porphyroblast growth: Effects on eclogite facies mineral equilibria, Pam Peninsula, New Caledonia. J. Metamorph. 2002, 20, 151–165. [Google Scholar] [CrossRef]
- Lanari, P.; Vidal, O.; De Andrade, V.; Dubacq, B.; Lewin, E.; Grosch, E.G.; Schwartz, S. XMapTools: A MATLAB-based program for electron microprobe X-ray image processing and geothermobarometry. Comp. Geosci. 2014, 62, 227–240. [Google Scholar] [CrossRef] [Green Version]
- Lanari, P.; Giuntoli, F.; Burn, M.; Engi, M. An inverse modeling approach to obtain P–T conditions of metamorphic stages involving garnet growth and resorption. Eur. J. Min. 2017, 29, 181–199. [Google Scholar] [CrossRef] [Green Version]
- Nelder, J.A.; Mead, R. A simplex method for function minimization. Comp. J. 1965, 7, 308–313. [Google Scholar] [CrossRef]
- Holland, T.J.B.; Powell, R. An internally consistent thermodynamic data set for phases of petrological interest. J. Metamorph. 1998, 16, 309–343. [Google Scholar] [CrossRef]
- White, R.W.; Powell, R.; Holland, T.J.B.; Johnson, T.E.; Green, C.R. New mineral activity-composition relations for thermodynamic calculations in metapelitic systems. J. Metamorph. 2014, 32, 261–286. [Google Scholar] [CrossRef]
- Kohn, M.J. Uncertainties in differential thermodynamic (Gibbs’ method) P-T paths. Contrib. Miner. Petrol. 1993, 113, 24–39. [Google Scholar] [CrossRef]
- Worley, B.; Powell, R. High-precision relative thermobarometry: Theory and a worked example. J. Metamorph. 2000, 18, 91–101. [Google Scholar] [CrossRef]
- Waters, D.J.; Lovegrove, D.P. Assessing the extent of disequilibrium and overstepping of prograde metamorphic reactions in metapelites from the Bushveld Complex aureole, South Africa. J. Metamorph. 2002, 20, 135–149. [Google Scholar] [CrossRef]
- Evans, T.P. A method for calculating effective bulk composition modification due to crystal fractionation in garnet-bearing schist; implications for isopleth thermobarometry. J. Metamorph. 2004, 22, 547–557. [Google Scholar] [CrossRef]
- Powell, R.; Holland, T.J.B. On thermobarometry. J. Metamorph. 2008, 26, 155–179. [Google Scholar] [CrossRef]
- Pattison, D.R.M.; Tinkham, D.K. Interplay between equilibrium and kinetics in prograde metamorphism of pelites: An example from the Nelson aureole, British Columbia. J. Metamorph. 2009, 27, 249–279. [Google Scholar] [CrossRef]
- Carlson, W.D.; Pattison, D.R.M.; Caddick, M.J. Beyond the equilibrium paradigm: How consideration of kinetics enhances metamorphic interpretation. Am. Min. 2015, 100, 1659–1667. [Google Scholar] [CrossRef]
- Palin, R.M.; Weller, O.M.; Waters, D.J.; Dyck, B. Quantifying geological uncertainty in metamorphic phase equilibria modelling; a Monte Carlo assessment and implications for tectonic interpretations. Geosci. Front. 2016, 7, 597–607. [Google Scholar] [CrossRef] [Green Version]
- Duesterhoeft, E.; Lanari, P. Iterative thermodynamic modelling-Part 1: A theoretical scoring technique and a computer program (Bingo-Antidote). J. Metamorph. 2020, 38, 527–551. [Google Scholar] [CrossRef]
- Lanari, P.; Vho, A.; Bovay, T.; Airaghi, L.; Centrella, S. Quantitative Compositional Mapping of Mineral Phases by Electron Probe Micro-Analyser; Ferrero, S., Lanari, P., Goncalves, P., Grosch, E.G., Eds.; Metamorphic Geology: Microscale to Mountain Belts; GSA Special Pubs.: Boulder, CO, USA, 2019; Volume 478, pp. 39–63. [Google Scholar]
- Lanari, P.; Duesterhoeft, E. Modeling Metamorphic Rocks using Equilibrium Thermodynamics and Internally Consistent Databases: Past Achievements, Problems and Perspectives. J. Petrol. 2019, 60, 19–56. [Google Scholar] [CrossRef] [Green Version]
- Chatterjee, N.D.; Krüger, R.; Haller, G.; Olbricht, W. The Bayesian approach to an internally consistent thermodynamic database: Theory, database, and generation of phase diagrams. Contrib. Miner. Petrol. 1998, 133, 149–168. [Google Scholar] [CrossRef]
- Lanari, P.; Engi, M.L. Local Bulk Composition Effects on Metamorphic Mineral Assemblages. Rev. Mineral. Geochem. 2017, 83, 55–103. [Google Scholar] [CrossRef] [Green Version]
- Whitney, D.L. Garnets as open systems during regional metamorphism. Geology 1996, 24, 147–150. [Google Scholar] [CrossRef]
- Martin, L.A.J.; Duchene, S.; Deloule, E.; Vanderhaeghe, O. Mobility of trace elements and oxygen in zircon during metamorphism: Consequences for geochemical tracing. EPSL 2011, 267, 161–174. [Google Scholar] [CrossRef]
- Ague, J.J. Element mobility during regional metamorphism in crustal and subduction zone environments with a focus on the rare earth elements (REE). Am. Min. 2017, 102, 1796–1821. [Google Scholar] [CrossRef]
- Kohn, M.J.; Spear, F. Retrograde net transfer reaction insurance for pressure-temperature estimates. Geology 2000, 28, 1127–1130. [Google Scholar] [CrossRef]
- Denison, C.; Carlson, W.D. Three-dimensional quantitative textural analysis of metamorphic rocks using high-resolution computed X-ray tomography: Pat II. Application to natural samples. J. Metamorph. 1997, 15, 45–57. [Google Scholar] [CrossRef]
- Daniel, C.G.; Spear, F.S. Three-dimensional patterns of garnet nucleation and growth. Geology 1998, 26, 503–506. [Google Scholar] [CrossRef]
- Caddick, M.J.; Thompson, A.B. Quantifying the tectono-metamorphic evolution of pelitic rocks from a wide range of tectonic settings: Mineral compositions in equilibrium. Contrib. Miner. Petrol. 2008, 156, 177–195. [Google Scholar] [CrossRef] [Green Version]
- Chakroborty, S.; Ganguly, J. Cation diffusion in aluminosilicate garnets: Experimental determination in spessartine-almandine diffusion couples, evaluation of effective binary diffusion coefficients, and applications. Contrib. Miner. Petrol. 1992, 111, 74–86. [Google Scholar] [CrossRef]
- Blackburn, W.H. Zoned and unzoned garnets from the Grenville gneiss around Gananoque, Ontario. Can. Miner. 1969, 9, 691–698. [Google Scholar]
- Anderson, D.E.; Buckley, G.R. Zoning in garnets-diffusion models. Contrib. Miner. Petrol. 1973, 15, 205–216. [Google Scholar] [CrossRef]
- Viete, D.R.; Hermann, J.; Lister, G.S.; Stenhouse, I.R. The nature and origin of the Barrovian metamorphism, Scotland: Diffusion length scales in garnet and inferred thermal time scales. J. Geol. Soc. Lond. 2011, 168, 115–132. [Google Scholar] [CrossRef] [Green Version]
- Anderson, D.E.; Olimpio, J.C. Progressive homogenization of metamorphic garnets, South Morar, Scotland: Evidence for volume diffusion. Can. Miner. 1977, 15, 205–216. [Google Scholar]
- Lasaga, A.C.; Richardson, S.M.; Holland, H.D. The Mathematics of Cation Diffusion and Exchange between Silicate Minerals during Retrograde Metamorphism; Saxena, S.K., Bhattacharji, S., Eds.; Energetics of Geological Processes; Springer: New York, NY, USA, 1977; pp. 354–387. [Google Scholar]
- Cygan, R.T.; Lasaga, A.C. Crystal growth and the formation of chemical zoning in garnets. Contrib. Miner. Petrol. 1982, 79, 187–200. [Google Scholar] [CrossRef]
- Cygan, R.T.; Lasaga, A.C. Self-diffusion of magnesium in garnet at 750 °C to 900 °C. Am. J. Sci. 1985, 285, 328–350. [Google Scholar] [CrossRef]
- Chakraborty, S.; Ganguly, G. Compositional Zoning and Cation Diffusion in Garnets; Ganguly, J., Ed.; Diffusion, atomic ordering, and mass transport: Selected problems in geochemistry; Springer: New York, NY, USA, 1990. [Google Scholar]
- Florence, F.P.; Spear, F.S. Effects of diffusional modification of garnet growth zoning on PT path calculations. Contrib. Miner. Petrol. 1991, 107, 487–500. [Google Scholar] [CrossRef]
- Carlson, W.D. Rates of Fe, Mg, Mn and Ca diffusion in garnet. Am. Min. 2006, 91, 1–11. [Google Scholar] [CrossRef]
- Ganguly, J. Cation diffusion kinetics in aluminosilicate garnets and geological applications. RIMS 2001, 72, 559–601. [Google Scholar] [CrossRef]
- Caddick, M.J.; Konopasek, J.; Thompson, A.B. Preservation of garnet growth zoning and the duration of prograde metamorphism. J. Petrol. 2010, 51, 2327–2347. [Google Scholar] [CrossRef] [Green Version]
- Yardley, B.W.D. An empirical study of diffusion in garnet. Am. Min. 1977, 62, 793–800. [Google Scholar]
- Satir, M.; Friedrichsen, H. The origin and evolution of the Menderes Massif, w-Turkey: A rubidium/strontium and oxygen isotope study. Geol. Rundsch. 1986, 75, 703–714. [Google Scholar] [CrossRef]
- Bozkurt, E.; Satir, M. The southern Menderes Massif (western Turkey): Geochronology and exhumation history. Geol. J. 2000, 35, 285–296. [Google Scholar] [CrossRef]
- Lips, A.L.W.; Cassard, D.; Sözbilir, H.; Yılmaz, H. Multistage exhumation of the Menderes Massif, western Anatolia (Turkey). Int. J. Earth Sci. 2001, 89, 781–792. [Google Scholar] [CrossRef]
- Catlos, E.J.; Çemen, I. Monazite ages and the evolution of the Menderes Massif, western Turkey. Int. J. Earth Sci. 2005, 94, 204–217. [Google Scholar] [CrossRef]
Figure 1.
Geological map of the Menderes Massif, western Turkey, modified from [23]. (a) Regional map of the Aegean Sea and western Anatolia. This shows the location of the Menderes Massif and its position in relation to the Izmir—Ankara—Erizincan Suture Zone (IAESZ). (b) Simplified geological map of the Central Menderes Massif. The locations of samples referenced in this study are labeled.

Figure 2.
A compilation of garnet P-T estimates for rocks from the Central Menderes Massif. All estimates here are made using the GZM approach (P-T path modeling and core/rim isopleth thermobarometry). Error bars for core/rim estimates are based upon the region of P-T space, which garnet isopleths overlapped. This figure is modified from [23].

Figure 3.
Overview of input specifications used for THERIA_G modeling. (A) Garnet crystal size distribution (CSD) for each radius class as used here and by [26]. Each radii class increases in radius by 140 μm from the previous, with class 10 being the smallest and class 1 being the largest. #grt/ccm = number of garnets per cubic centimeter. (B) Specified P-T paths over which the modeled rock evolved. Path B is identical to that used by [26]. Path hiT is a higher temperature analog of path B. (C) Temperature-time plot of each of the four model scenarios tested in the study. Both paths in panel b are run at two different heating/cooling rates (5 °C/my and 50 °C/my).

Figure 4.
Specified P-T-t trajectories for Theria_G simulations executed using average bulk rock compositions from the Menderes Massif (Turkey) Bayındır and Bozdağ nappes. (a) Specified crystal size distribution (CSD), based upon petrographic observations. (b) Pressure-temperature paths specified for Theria_G simulations. The trajectories are based upon previous P-T estimates made throughout the region, and also consider field observations. (c) Temperature-time histories for P-T paths to show specified heating/cooling rates.

Figure 5.
Compilation of the Theria_G modeled almandine mole fractions for radii classes 1, 4, 6, and 8. Radius is the distance in mm from the core. Symbols represent model-predicted initial prograde growth profiles that are not impacted by intracrystalline diffusion, whereas the solid red lines correspond to the final diffusion-impacted profiles. Each panel is a separate simulation unique in heating/cooling rate and/or input P-T path. (A) Results for a simulation evolved along [26] path “B” at a heating/cooling rate of 5 °C/my. (B) evolved along [26] path “B” at a heating/cooling rate of 50 °C/my. (C) evolved along the hiT path (Figure 3B) with a heating/cooling rate of 5 °C/my. Panel (D) evolved along the hiT path with a heating/cooling rate of 50 °C/my. All data are plotted at the same y-scale for ease of comparison.

Figure 6.
Compilation of the THERIA_G modeled spessartine mole fractions for radii classes 1, 4, 6, and 8. Radius is the distance in mm from the core. Symbols represent model-predicted initial prograde growth profiles and are not impacted by intracrystalline diffusion, whereas the solid red lines correspond to the final diffusion-impacted profiles. Each panel is a separate simulation unique in heating/cooling rate and/or input P-T path. (A) Results from a simulation evolved along [26] path “B” at a heating/cooling rate of 5 °C/my. (B) evolved along [26] path “B” at a heating/cooling rate of 50 °C/my. (C) evolved along the hiT path (Figure 3B) with a heating/cooling rate of 5 °C/my. (D) evolved along the hiT path with a heating/cooling rate of 50 °C/my. All data are plotted at the same y-scale for ease of comparison.

Figure 7.
GZM modeled garnet P-T paths using Theria_G simulated garnet compositions (both primary and diffused) presented in Figure 3 as specified profiles. (a) P-T paths for radii classes 1, 4, 6, and 8 modeled by GZM using garnet compositions generated in simulation 1 (Path B, heating/cooling rate of 5 °C/my). (b) P-T paths for radii classes 1, 4, 6, and 8 modeled by GZM using garnet compositions generated in simulation 2 (Path B, heating/cooling rate of 50 °C/my). (c) P-T paths for radii classes 1, 4, 6, and 8 modeled by GZM using garnet compositions generated in simulation 3 (Path hiT, heating/cooling rate of 5 °C/my). (d) P-T paths for radii classes 1, 4, 6, and 8 modeled by GZM using garnet compositions generated in simulation 1 (Path hiT, heating/cooling rate of 50 °C/my).

Figure 8.
Garnet compositions from select samples from the Central Menderes Massif [23]. Data are plotted as individual garnet mole-fraction end-member (spessartine, grossular, almandine, pyrope). Panels (a–d) are from Bayındır nappe samples MM03-22, 23, and 33. Panels (e–h) are from Bozdağ nappe samples MM03-26 and 28.

Figure 9.
Theria_G predicted almandine and spessartine compositions in average samples from the Bayındır and Bozdağ nappes (Menderes Massif, Turkey). (a–h) depict the predicted original prograde-growth composition for different radii classes (symbols), and diffusion-modified composition (solid red lines) as the sample evolves on one of the three specified P-T-t trajectories shown in Figure 4a.

Figure 10.
A visual representation of the computed mismatch between the prescribed path and GZM modeled path values for path hiT only (ΔTG-GZM). The x-axis represents the time from nucleation of radii class 1 (my = million years). (a) Temperature mismatch for path hiT-5. (b) Pressure mismatch for path hiT_5. (c) Temperature mismatch for path hiT_50. Pressure mismatch path hiT_50. (d) Pressure mismatch for path hiT_50.Dashed lines in every panel represent bounds of uncertainly for temperature (±25 °C) and pressure (±1 kbar). Symbology code: 5-1_p = 5 °C/my, class 1 primary composition; 5-1_d = 5 °C/my, class 1 diffused composition.

Figure 11.
A comparison between Theria_G predicted garnet compositions for samples in the central Menderes Massif and actual garnet compositions determined by EPMA [23]. (a) Theria_G predicted spessartine compositions for an average Bayındır nappe rock evolving along Path 3 (Figure 4a). (b) Observed spessartine content in a subset of samples from the Bayındır nappe. (c) Theria_G predicted almandine compositions for an average Bayındır nappe rock evolving along Path 3. (d) Observed almandine content in a subset of samples from the Bayındır nappe. (e) Theria_G predicted spessartine compositions for an average Bozdağ nappe rock evolving along Path 3. (f) Observed spessartine content in a subset of samples from the Bozdağ nappe. (g) Theria_G predicted almandine compositions for an average Bozdağ nappe rock evolving along Path 3. (h) Observed almandine content in a subset of samples from the Bozdağ nappe.

Figure 12.
A simplified compilation of the most likely P-T path rocks in the Central Menderes Massif traveled along during an orogenic cycle responsible for metamorphism. This path is superimposed onto previously reported conditions [23] to demonstrate that although these recently reported conditions are not absolute, they are generally accepted as a relative estimate.


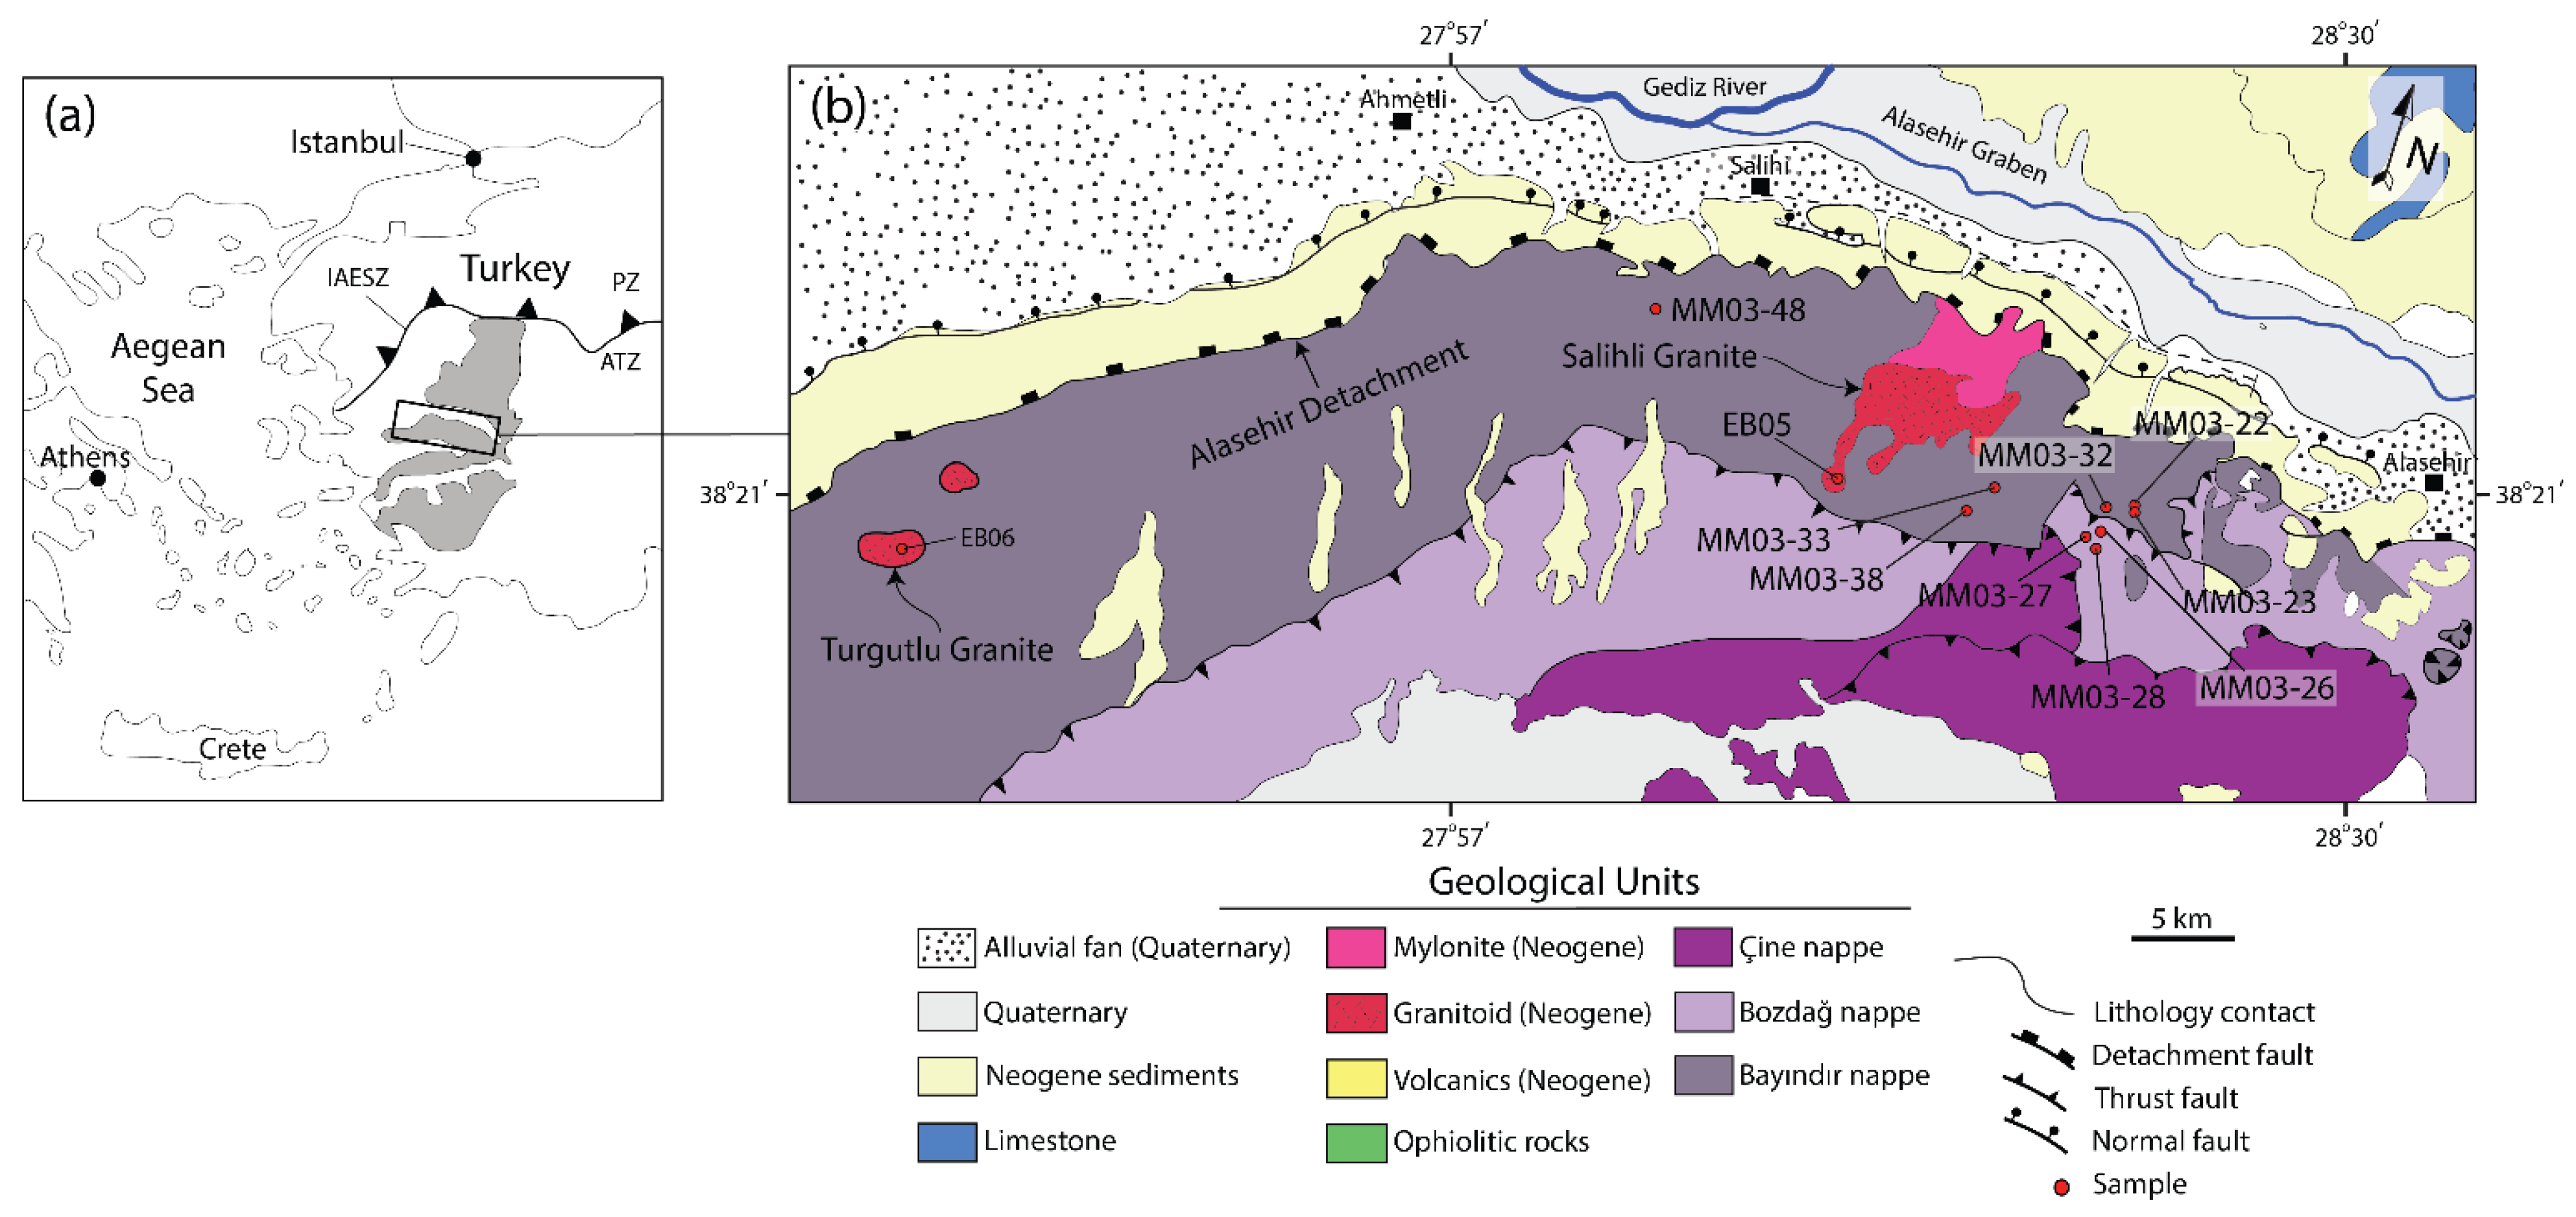
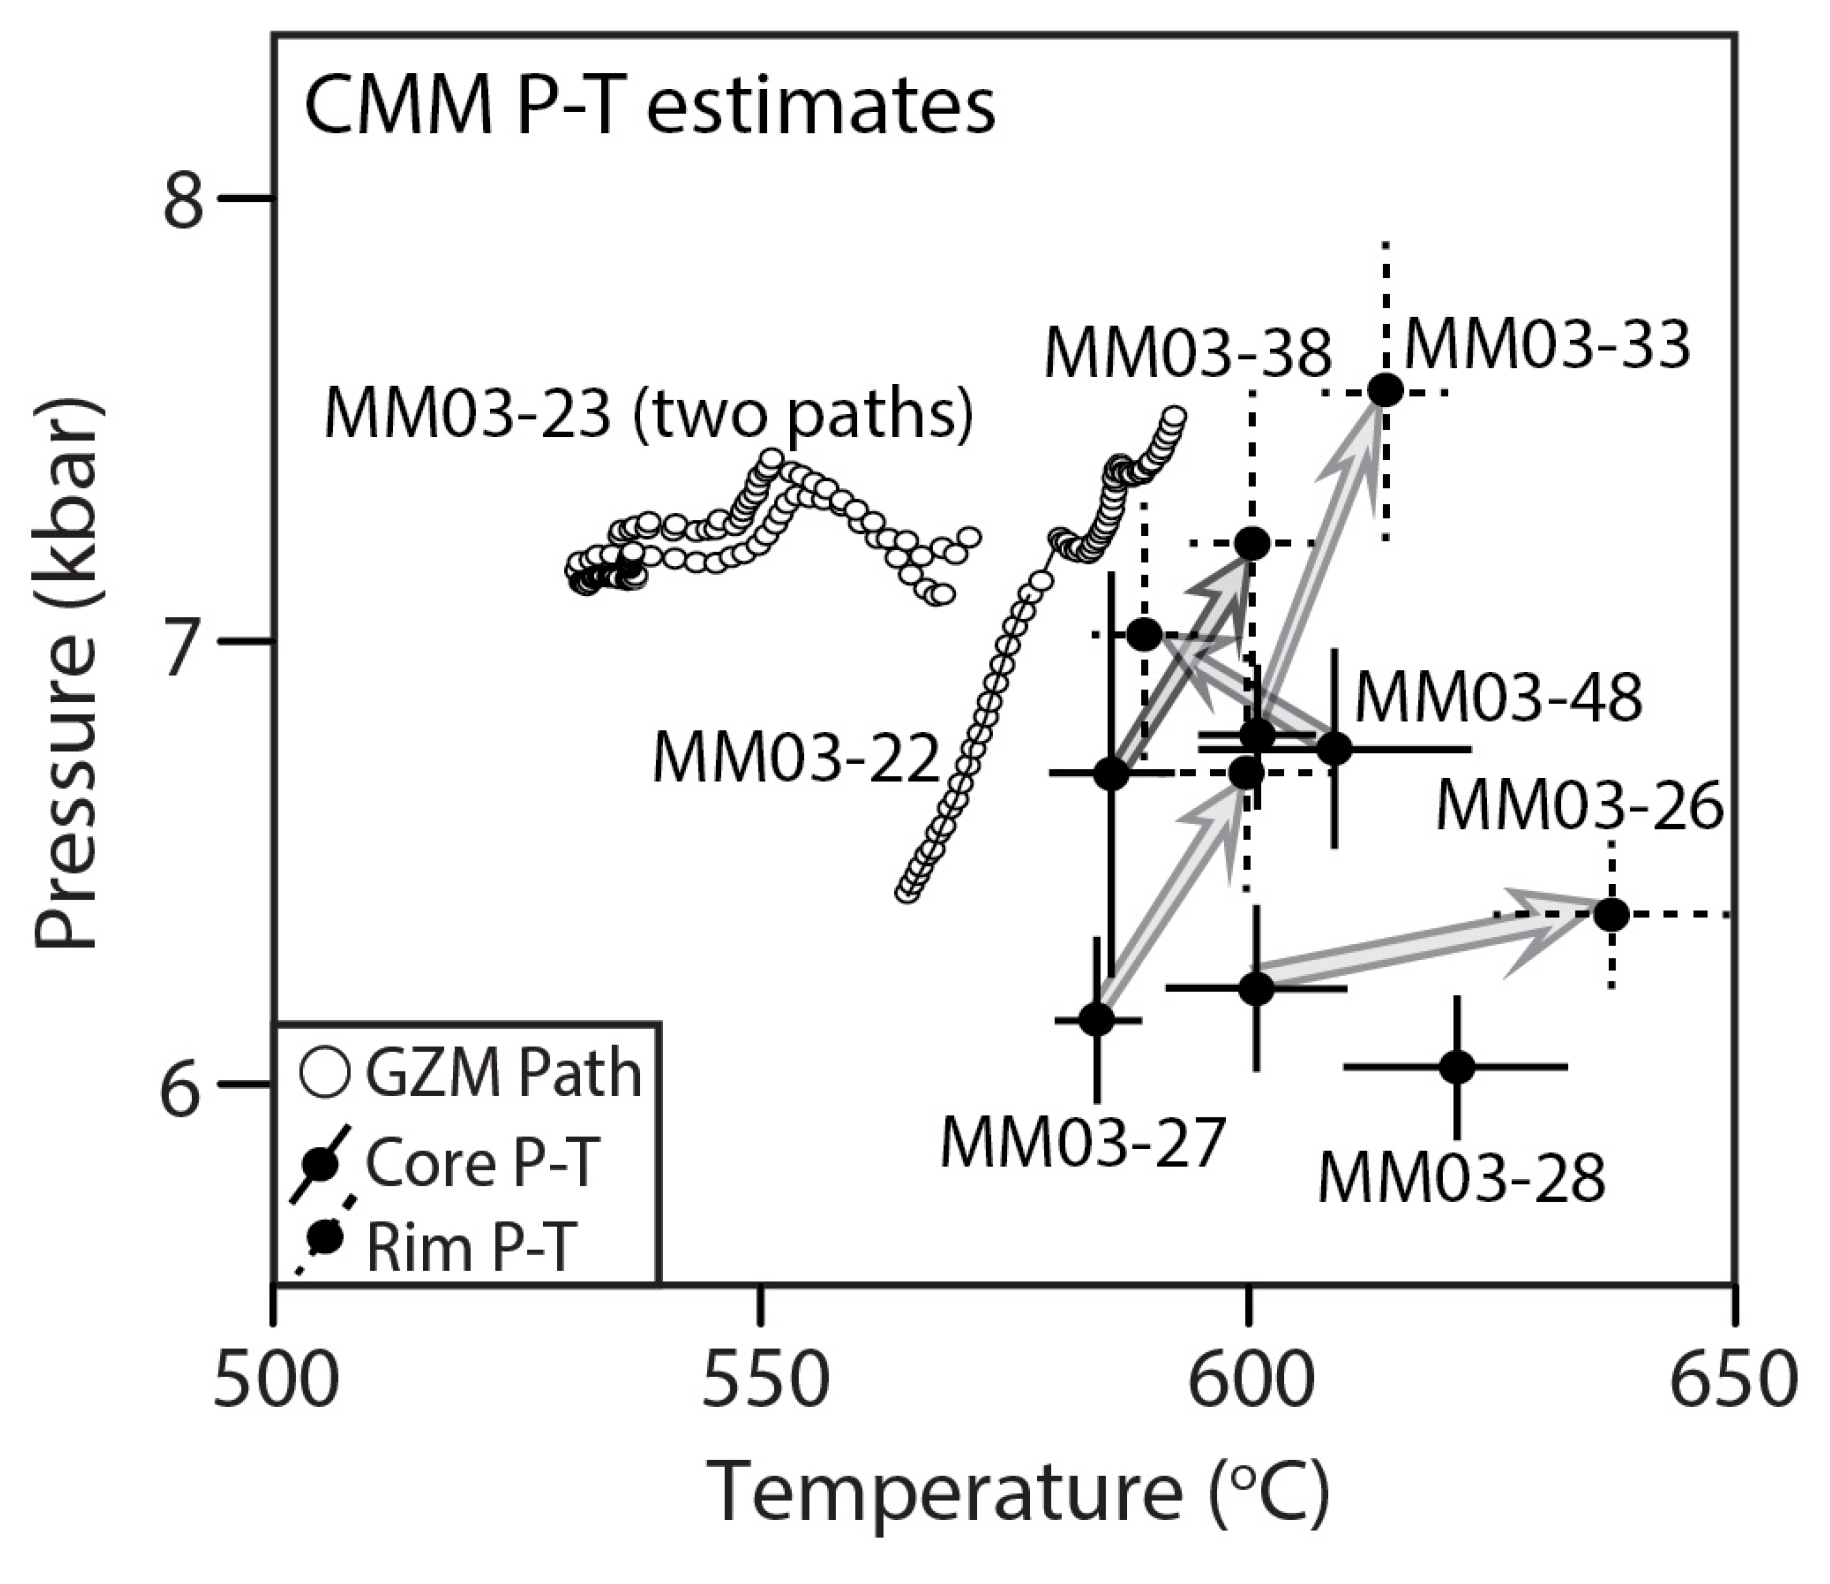
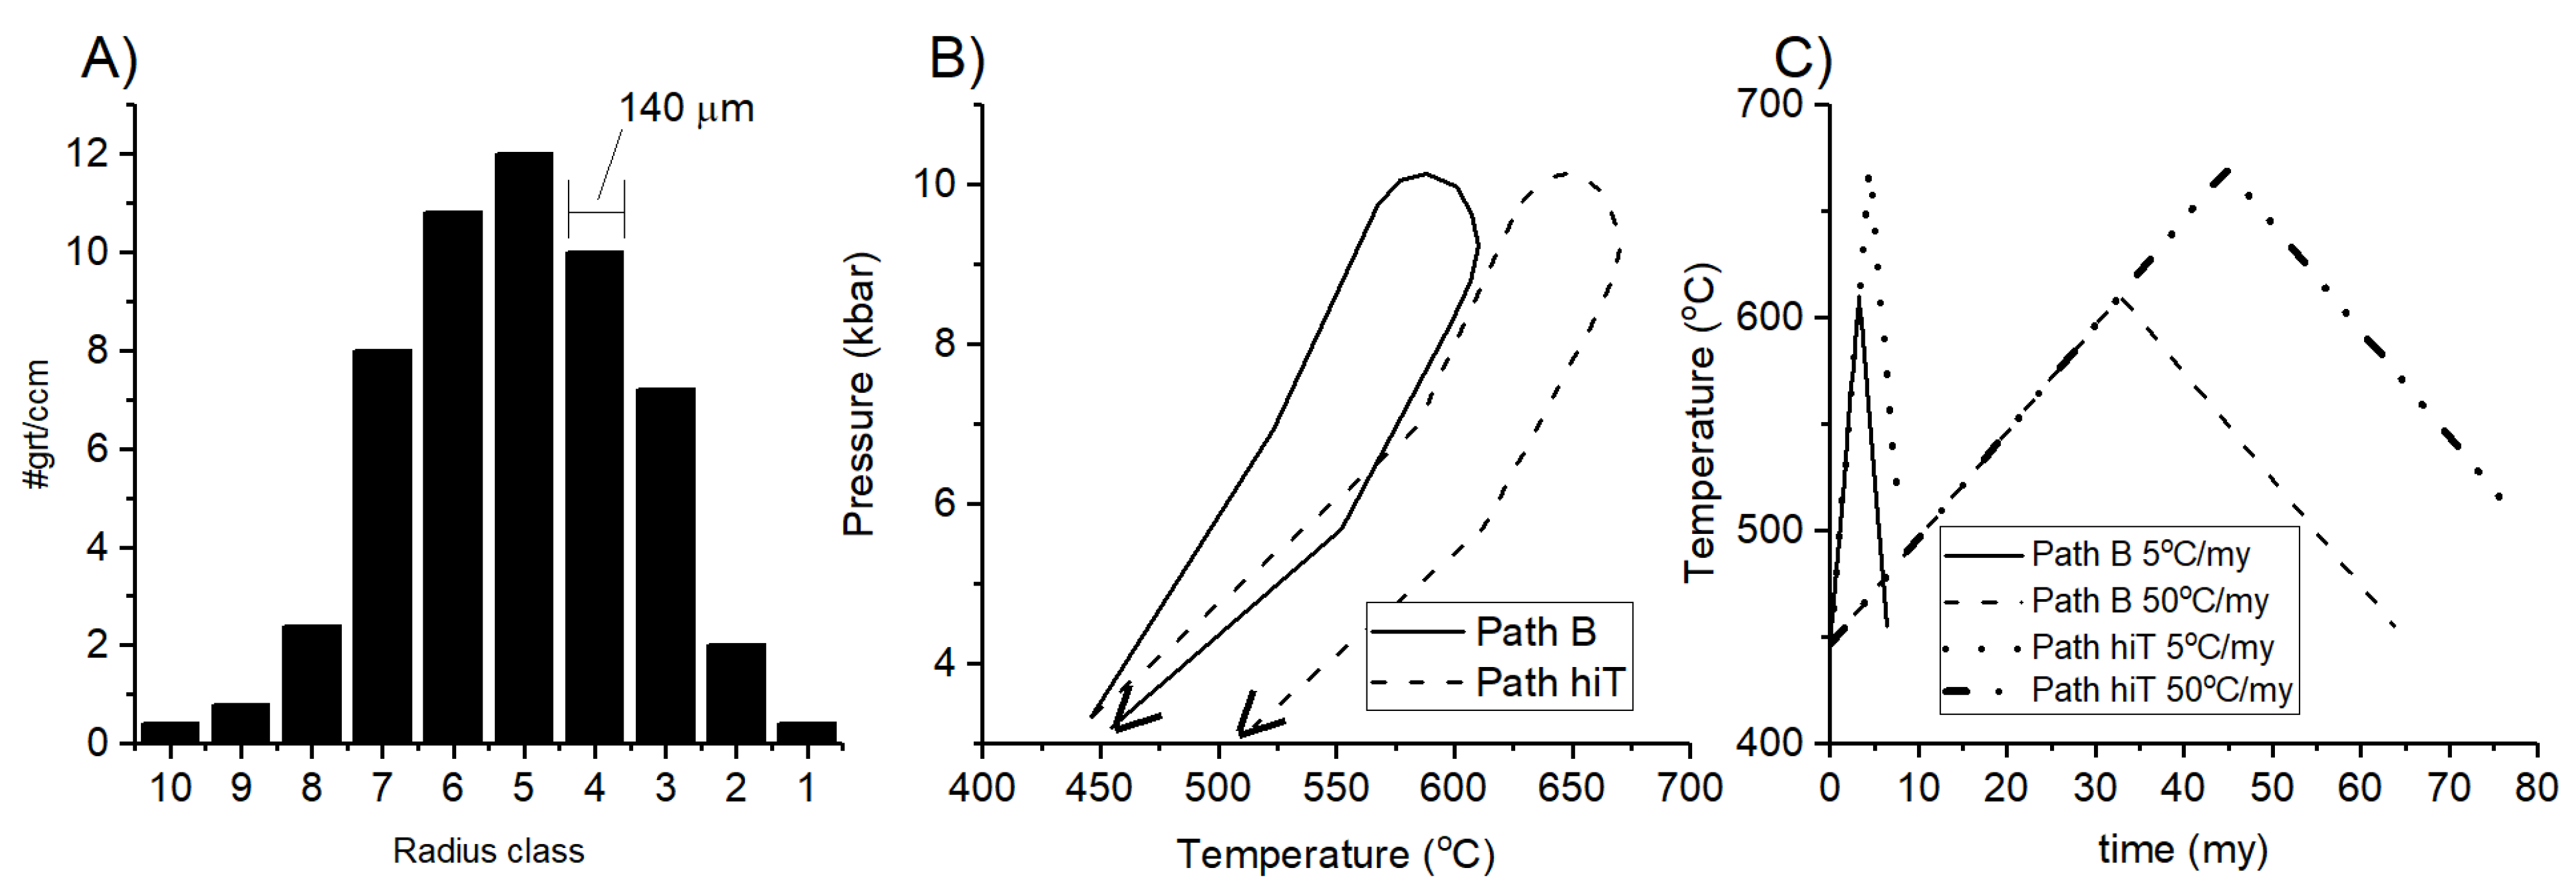
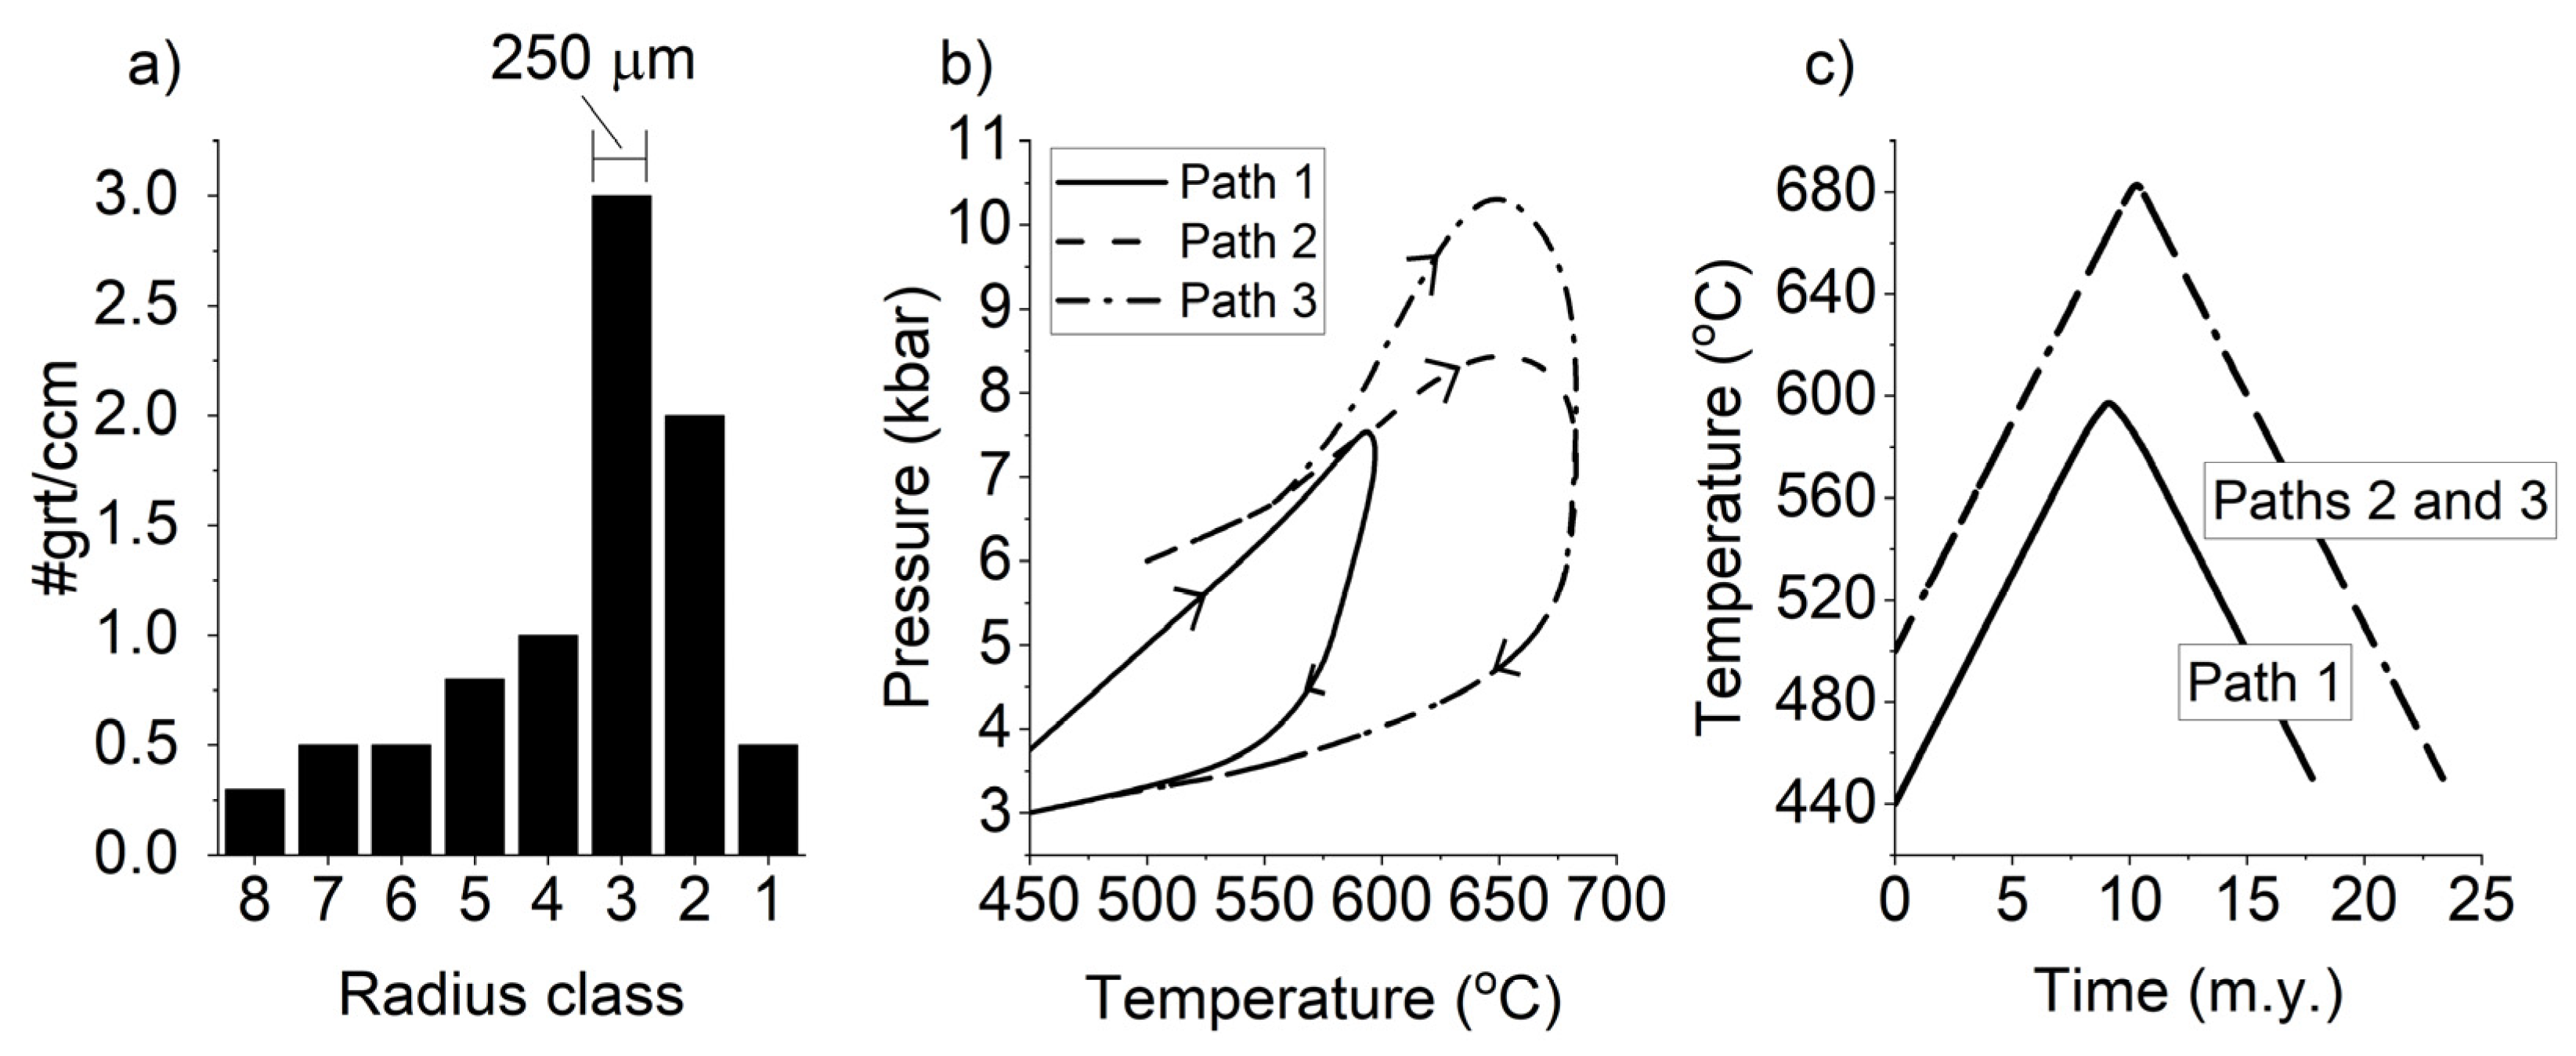
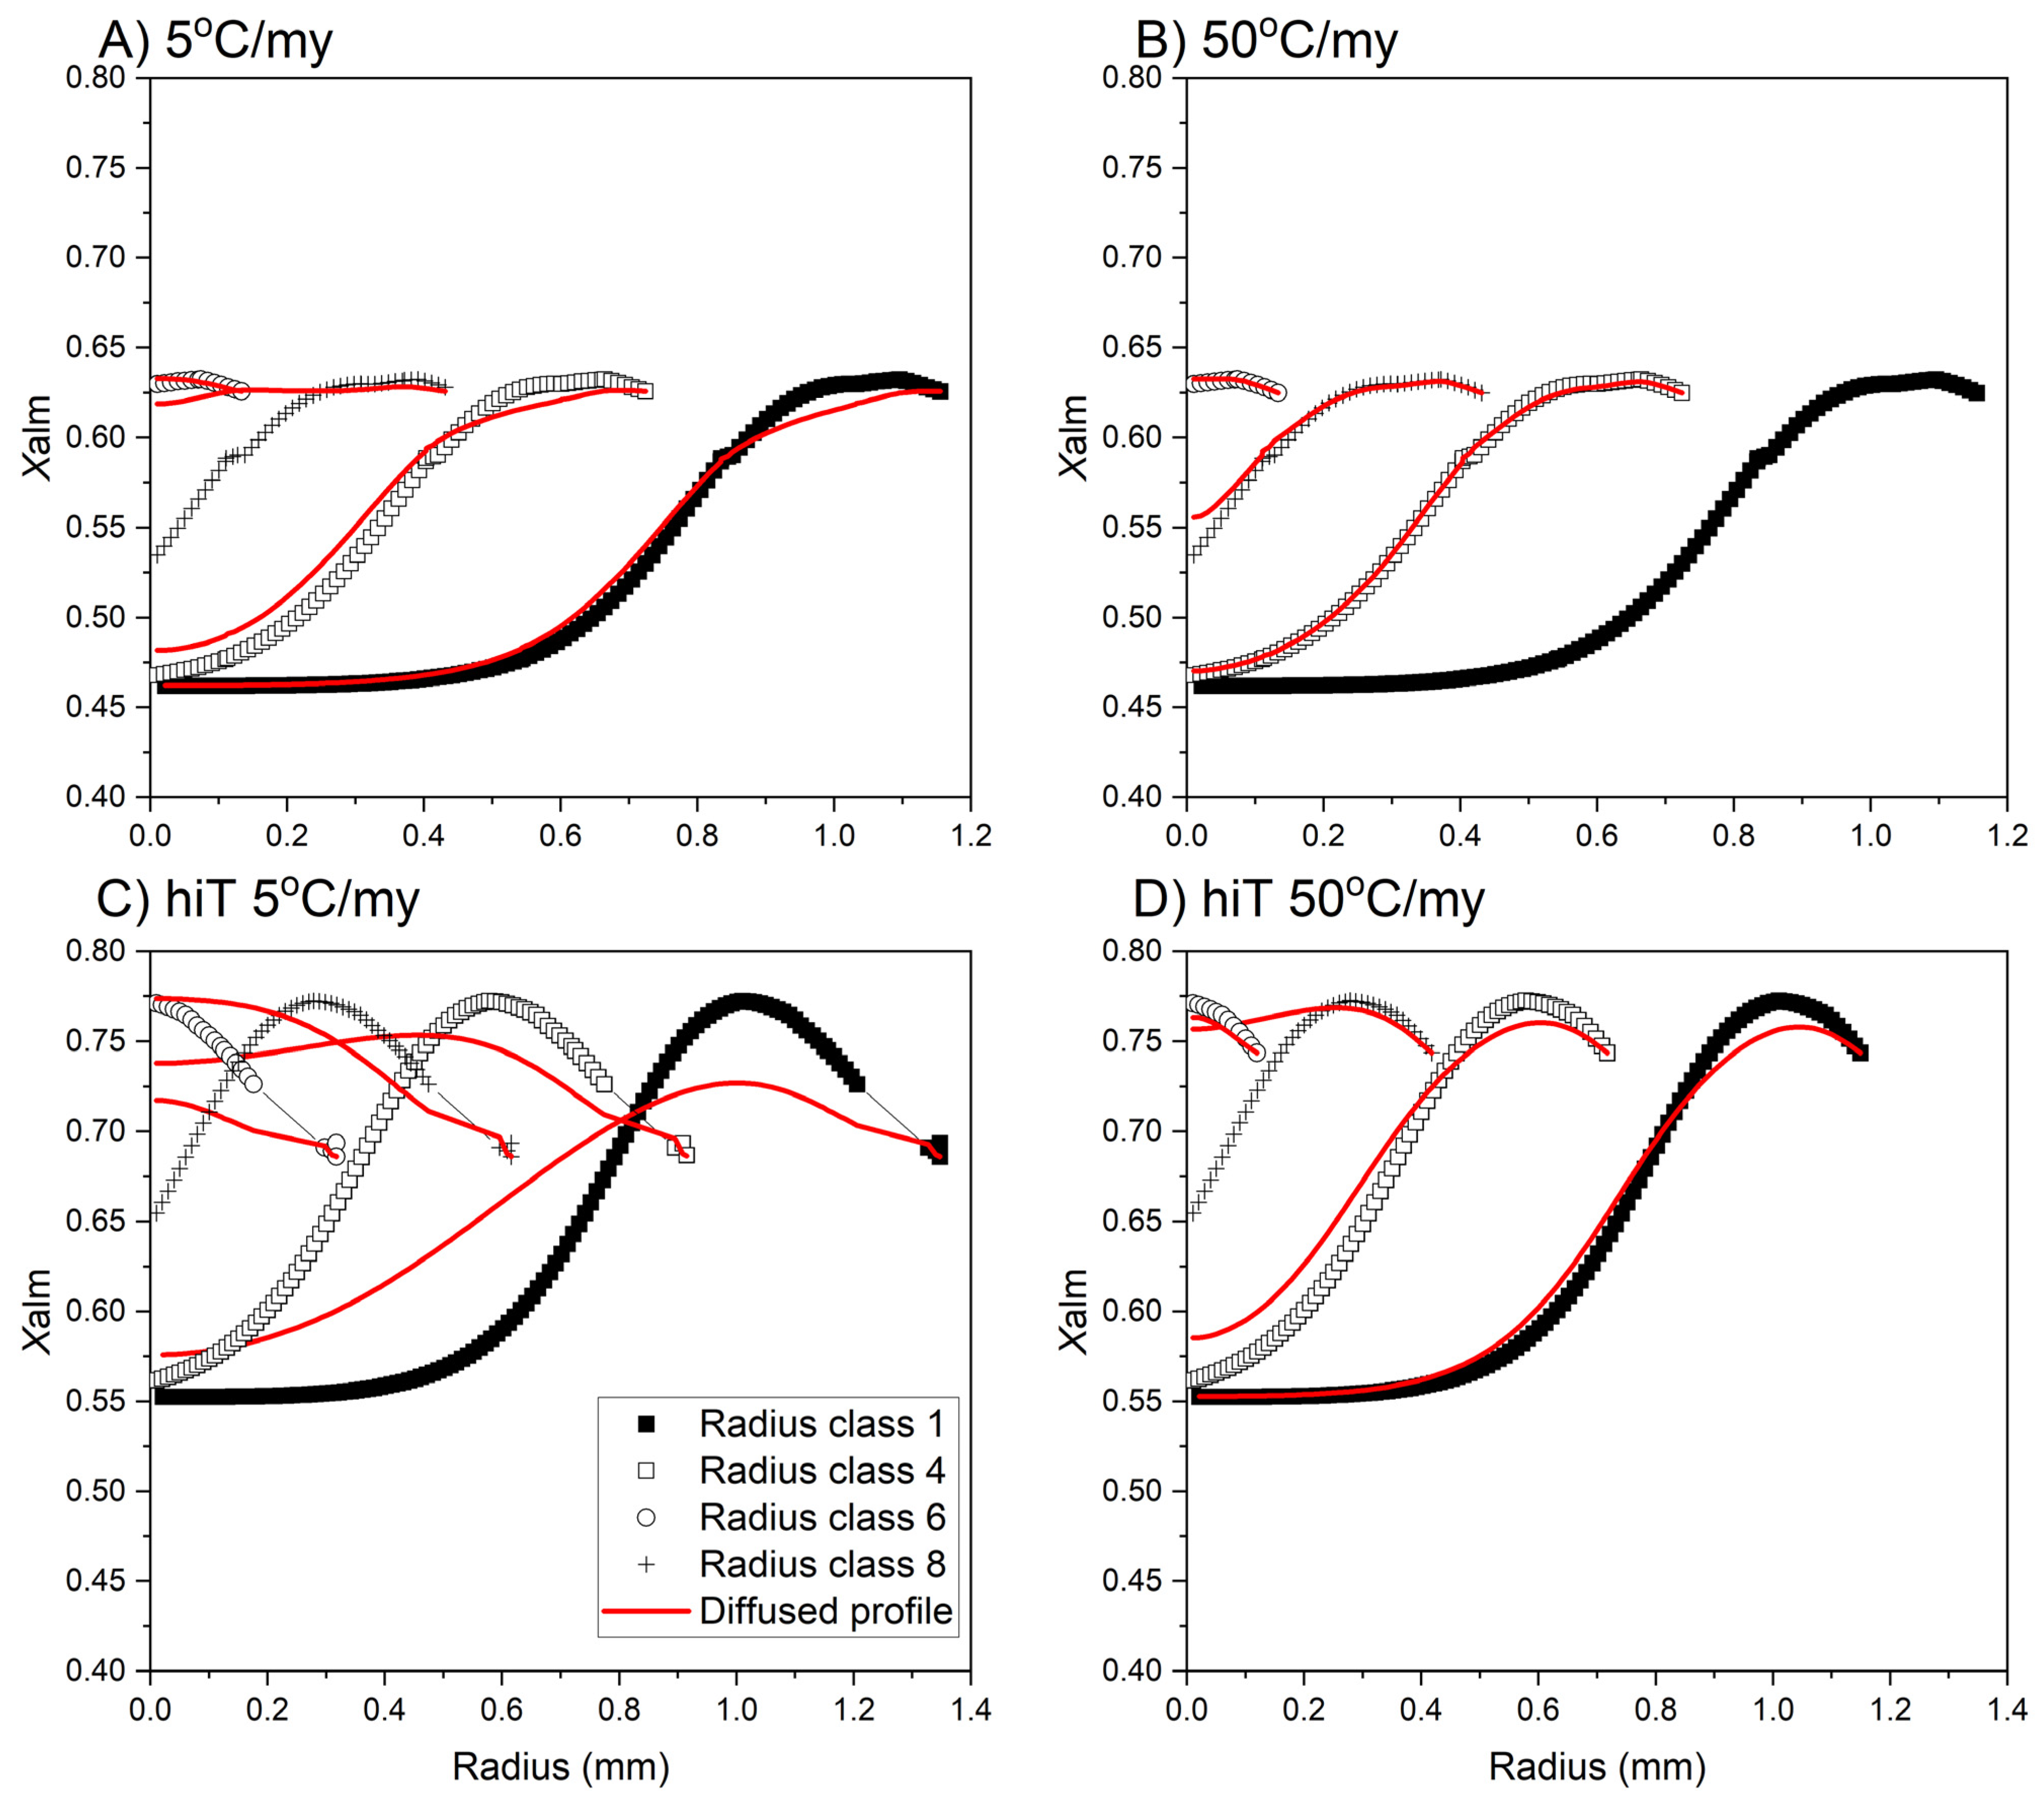
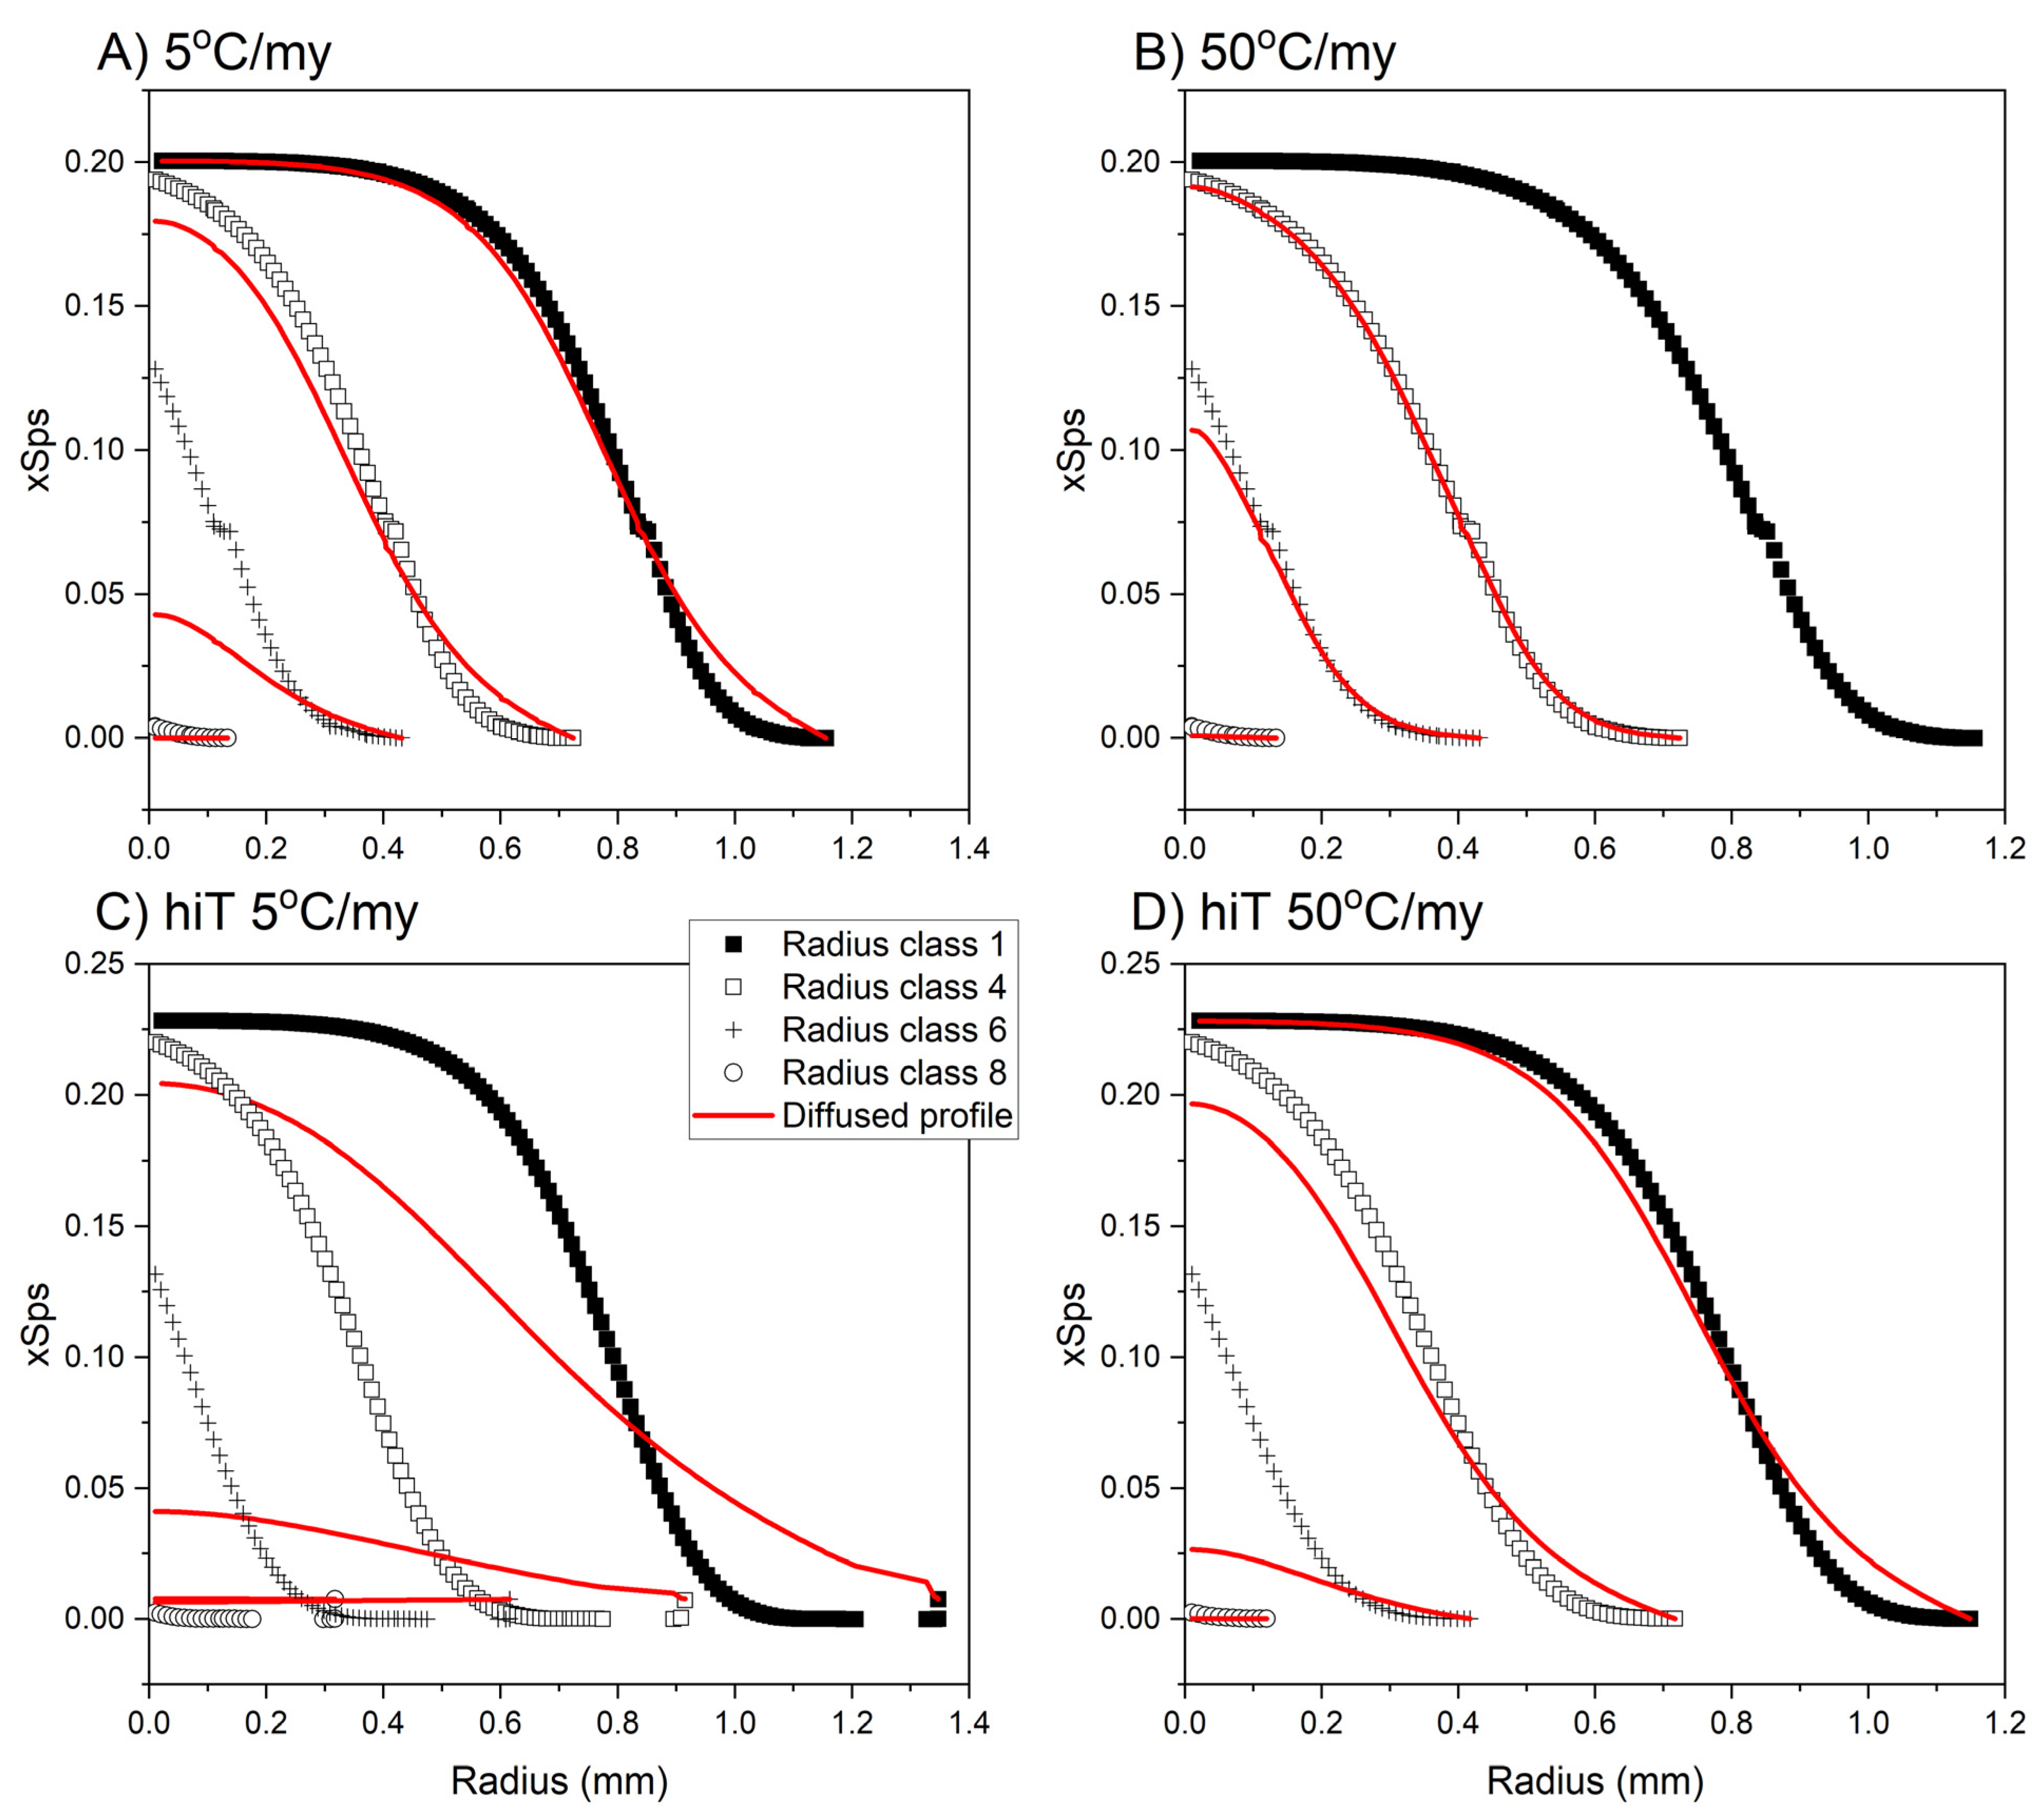
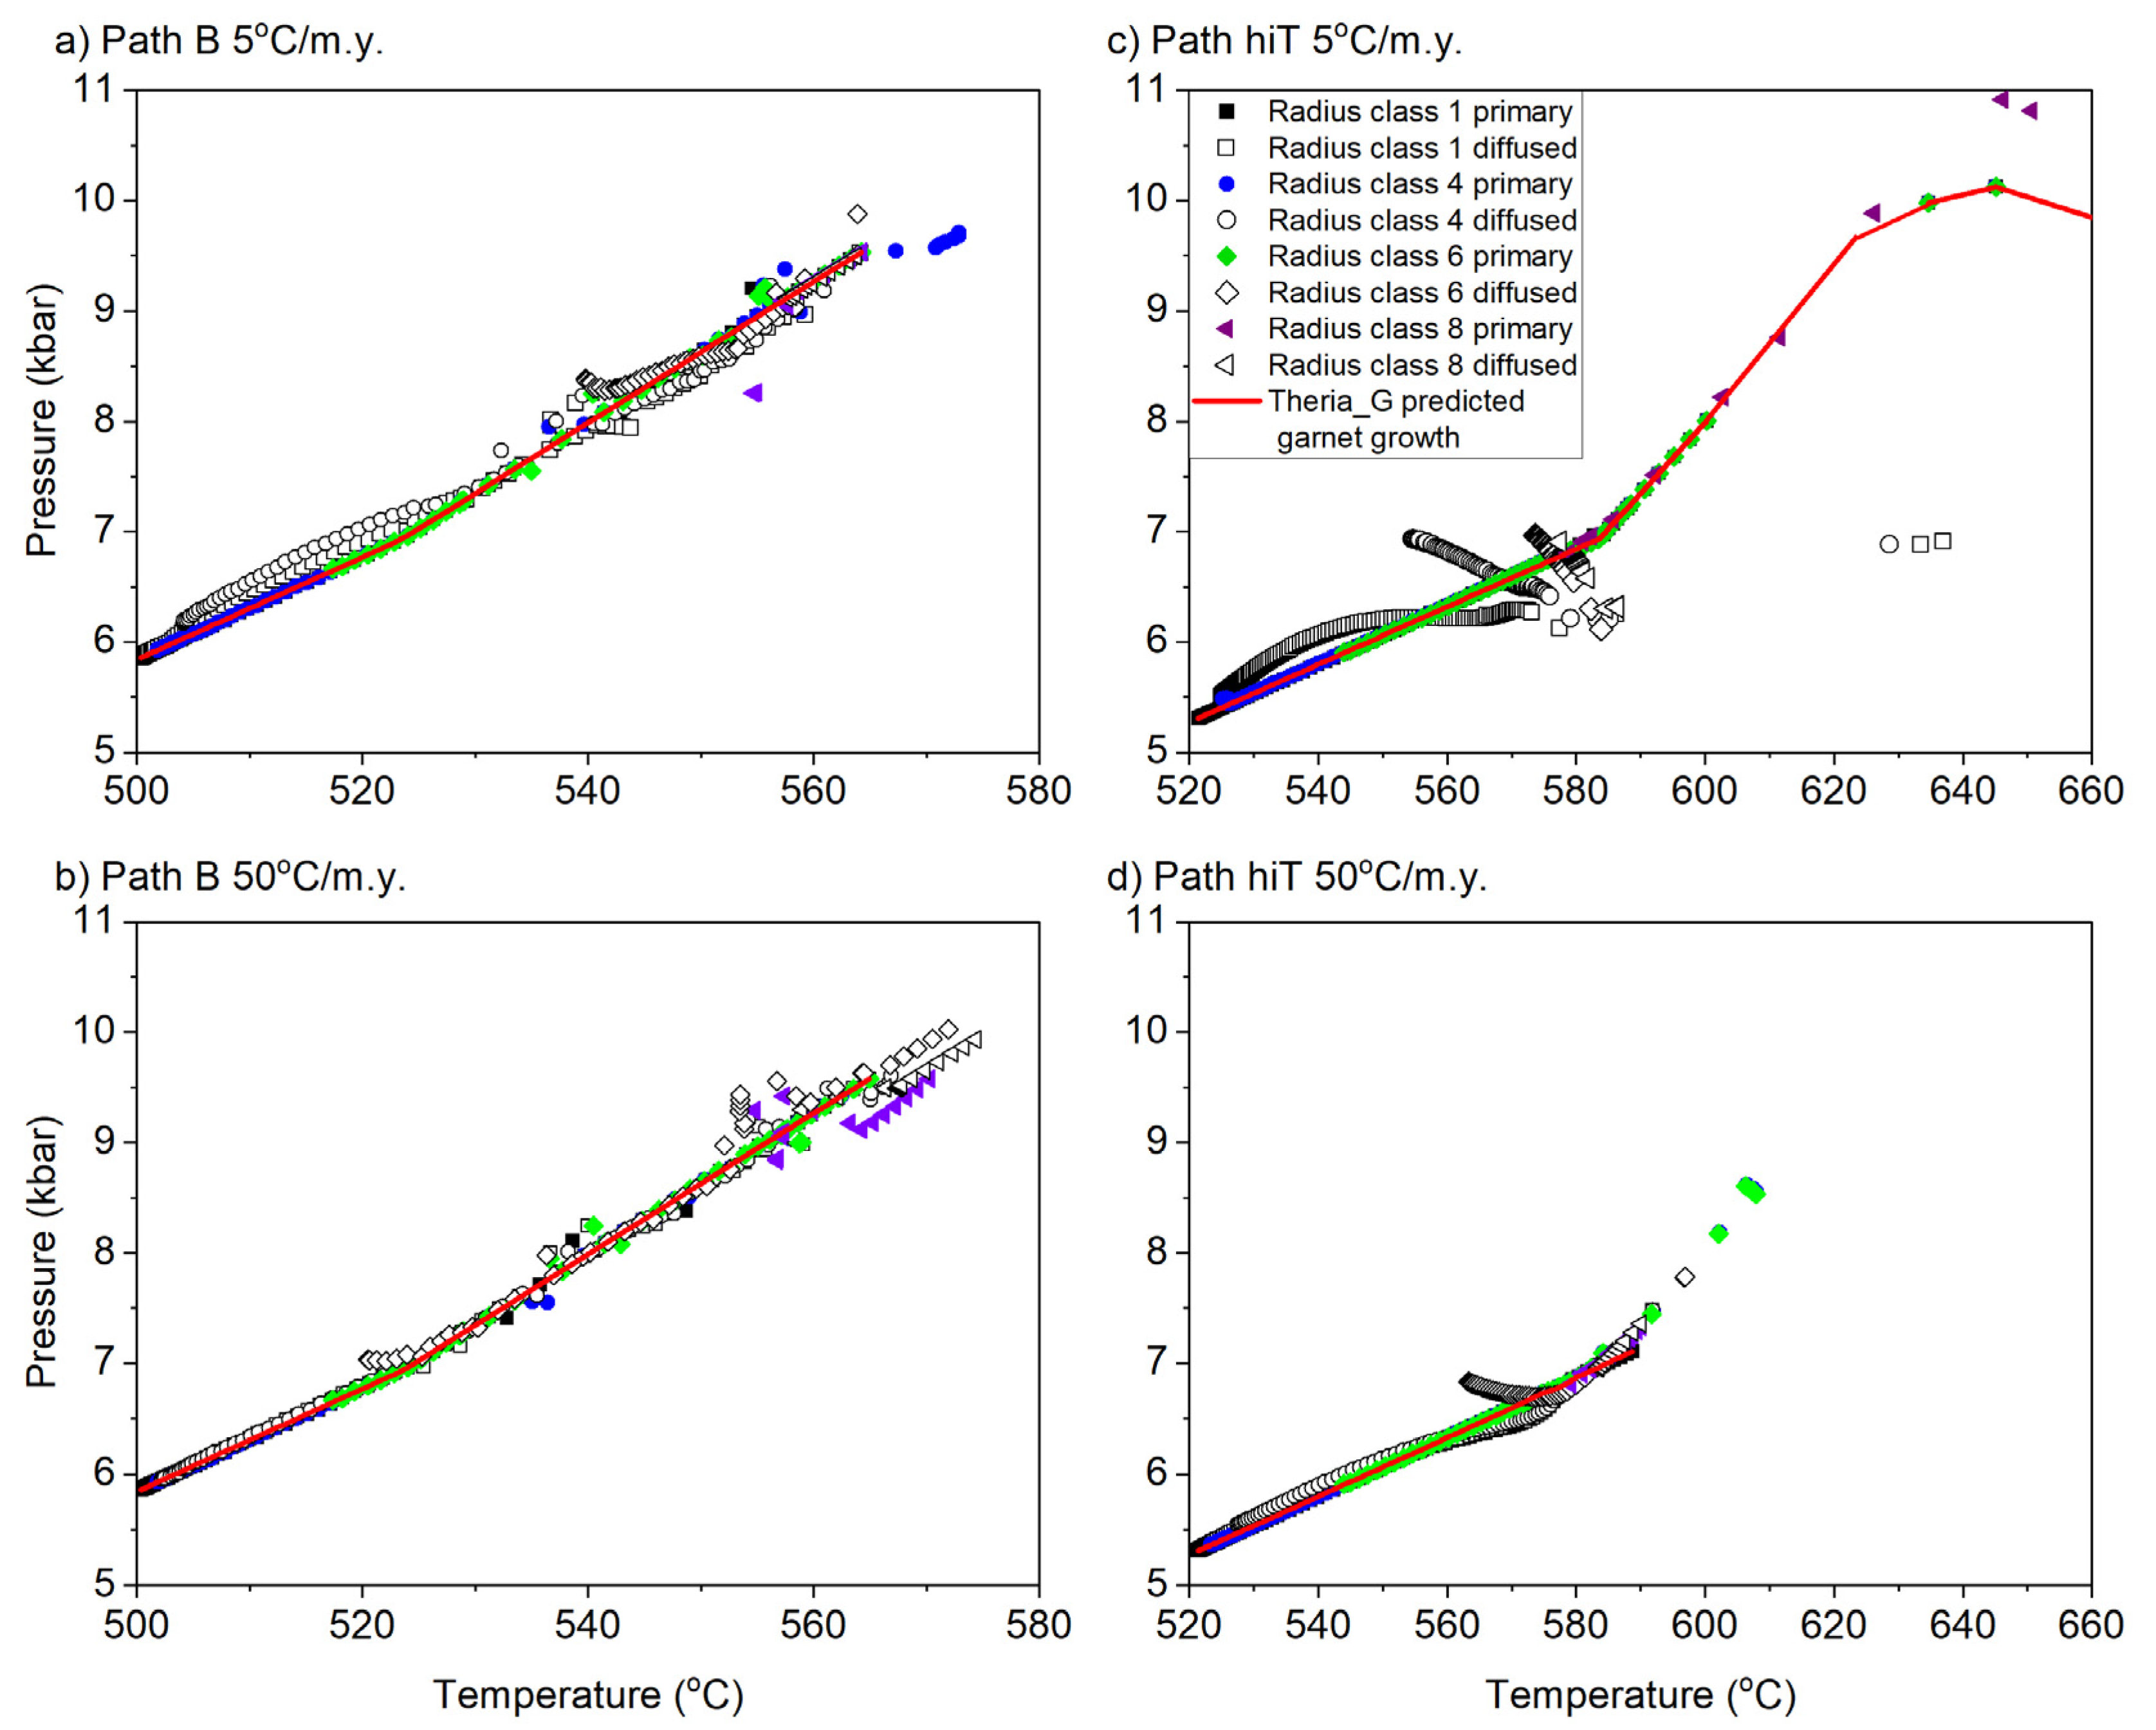
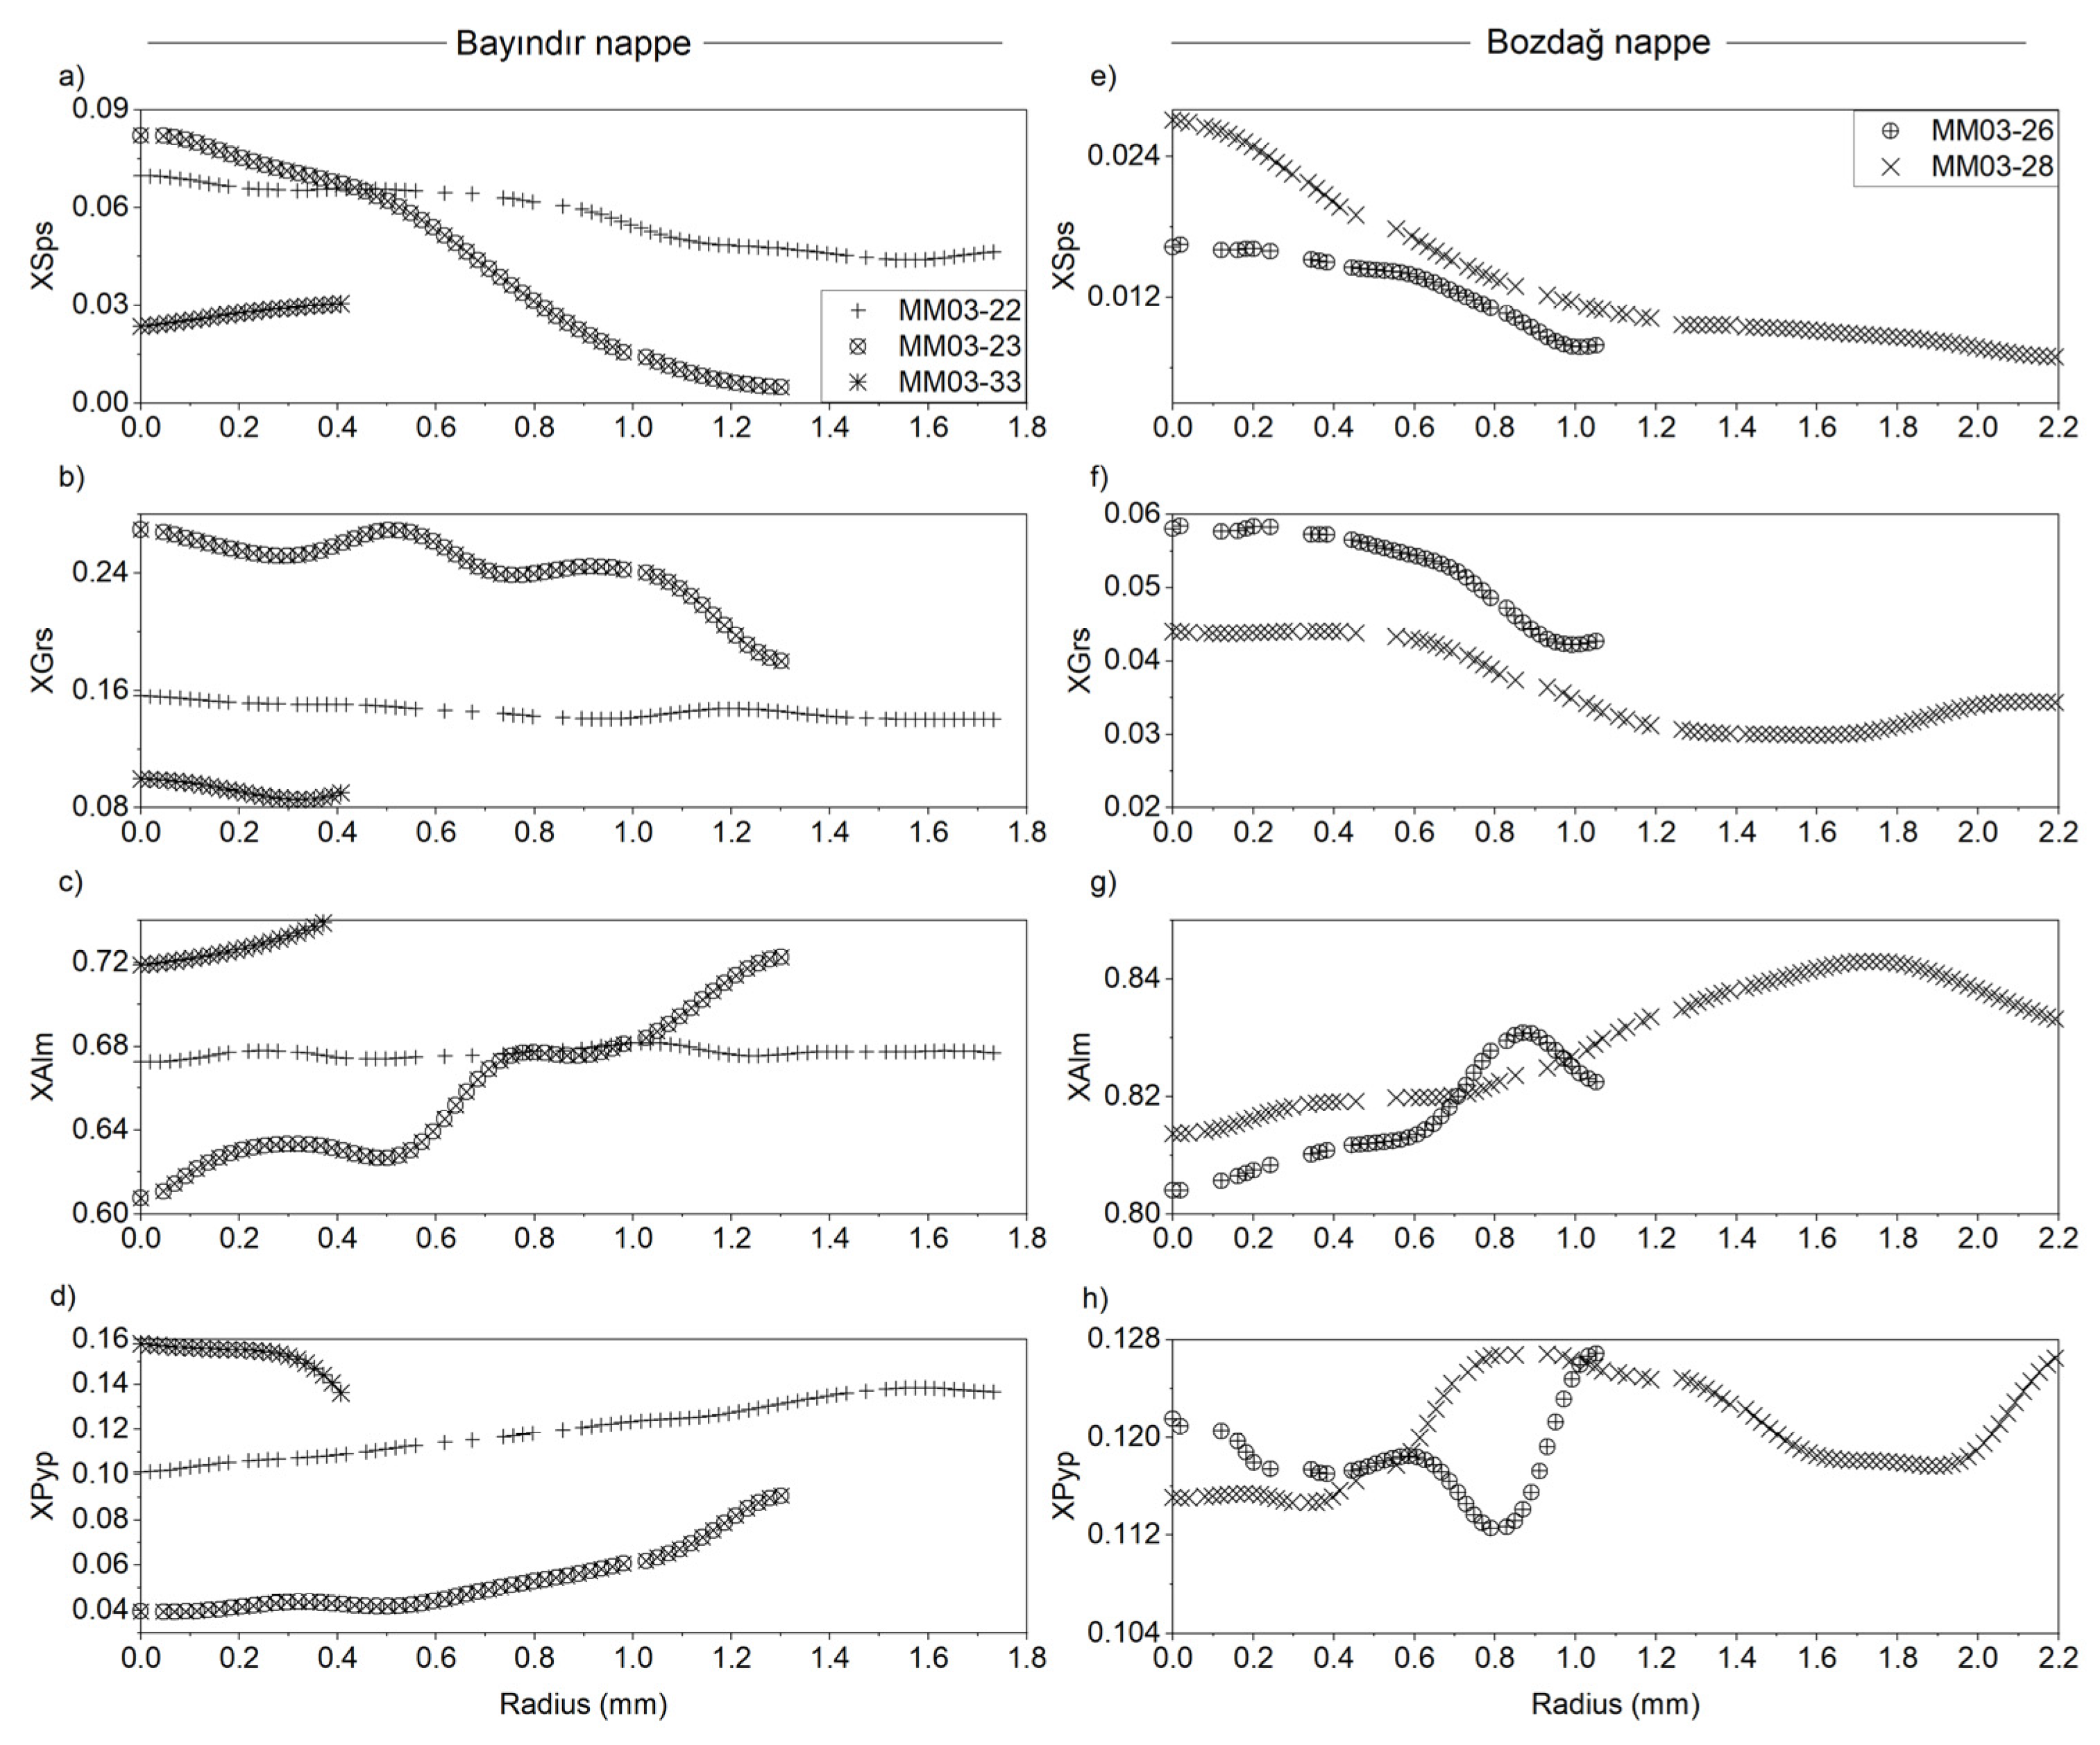
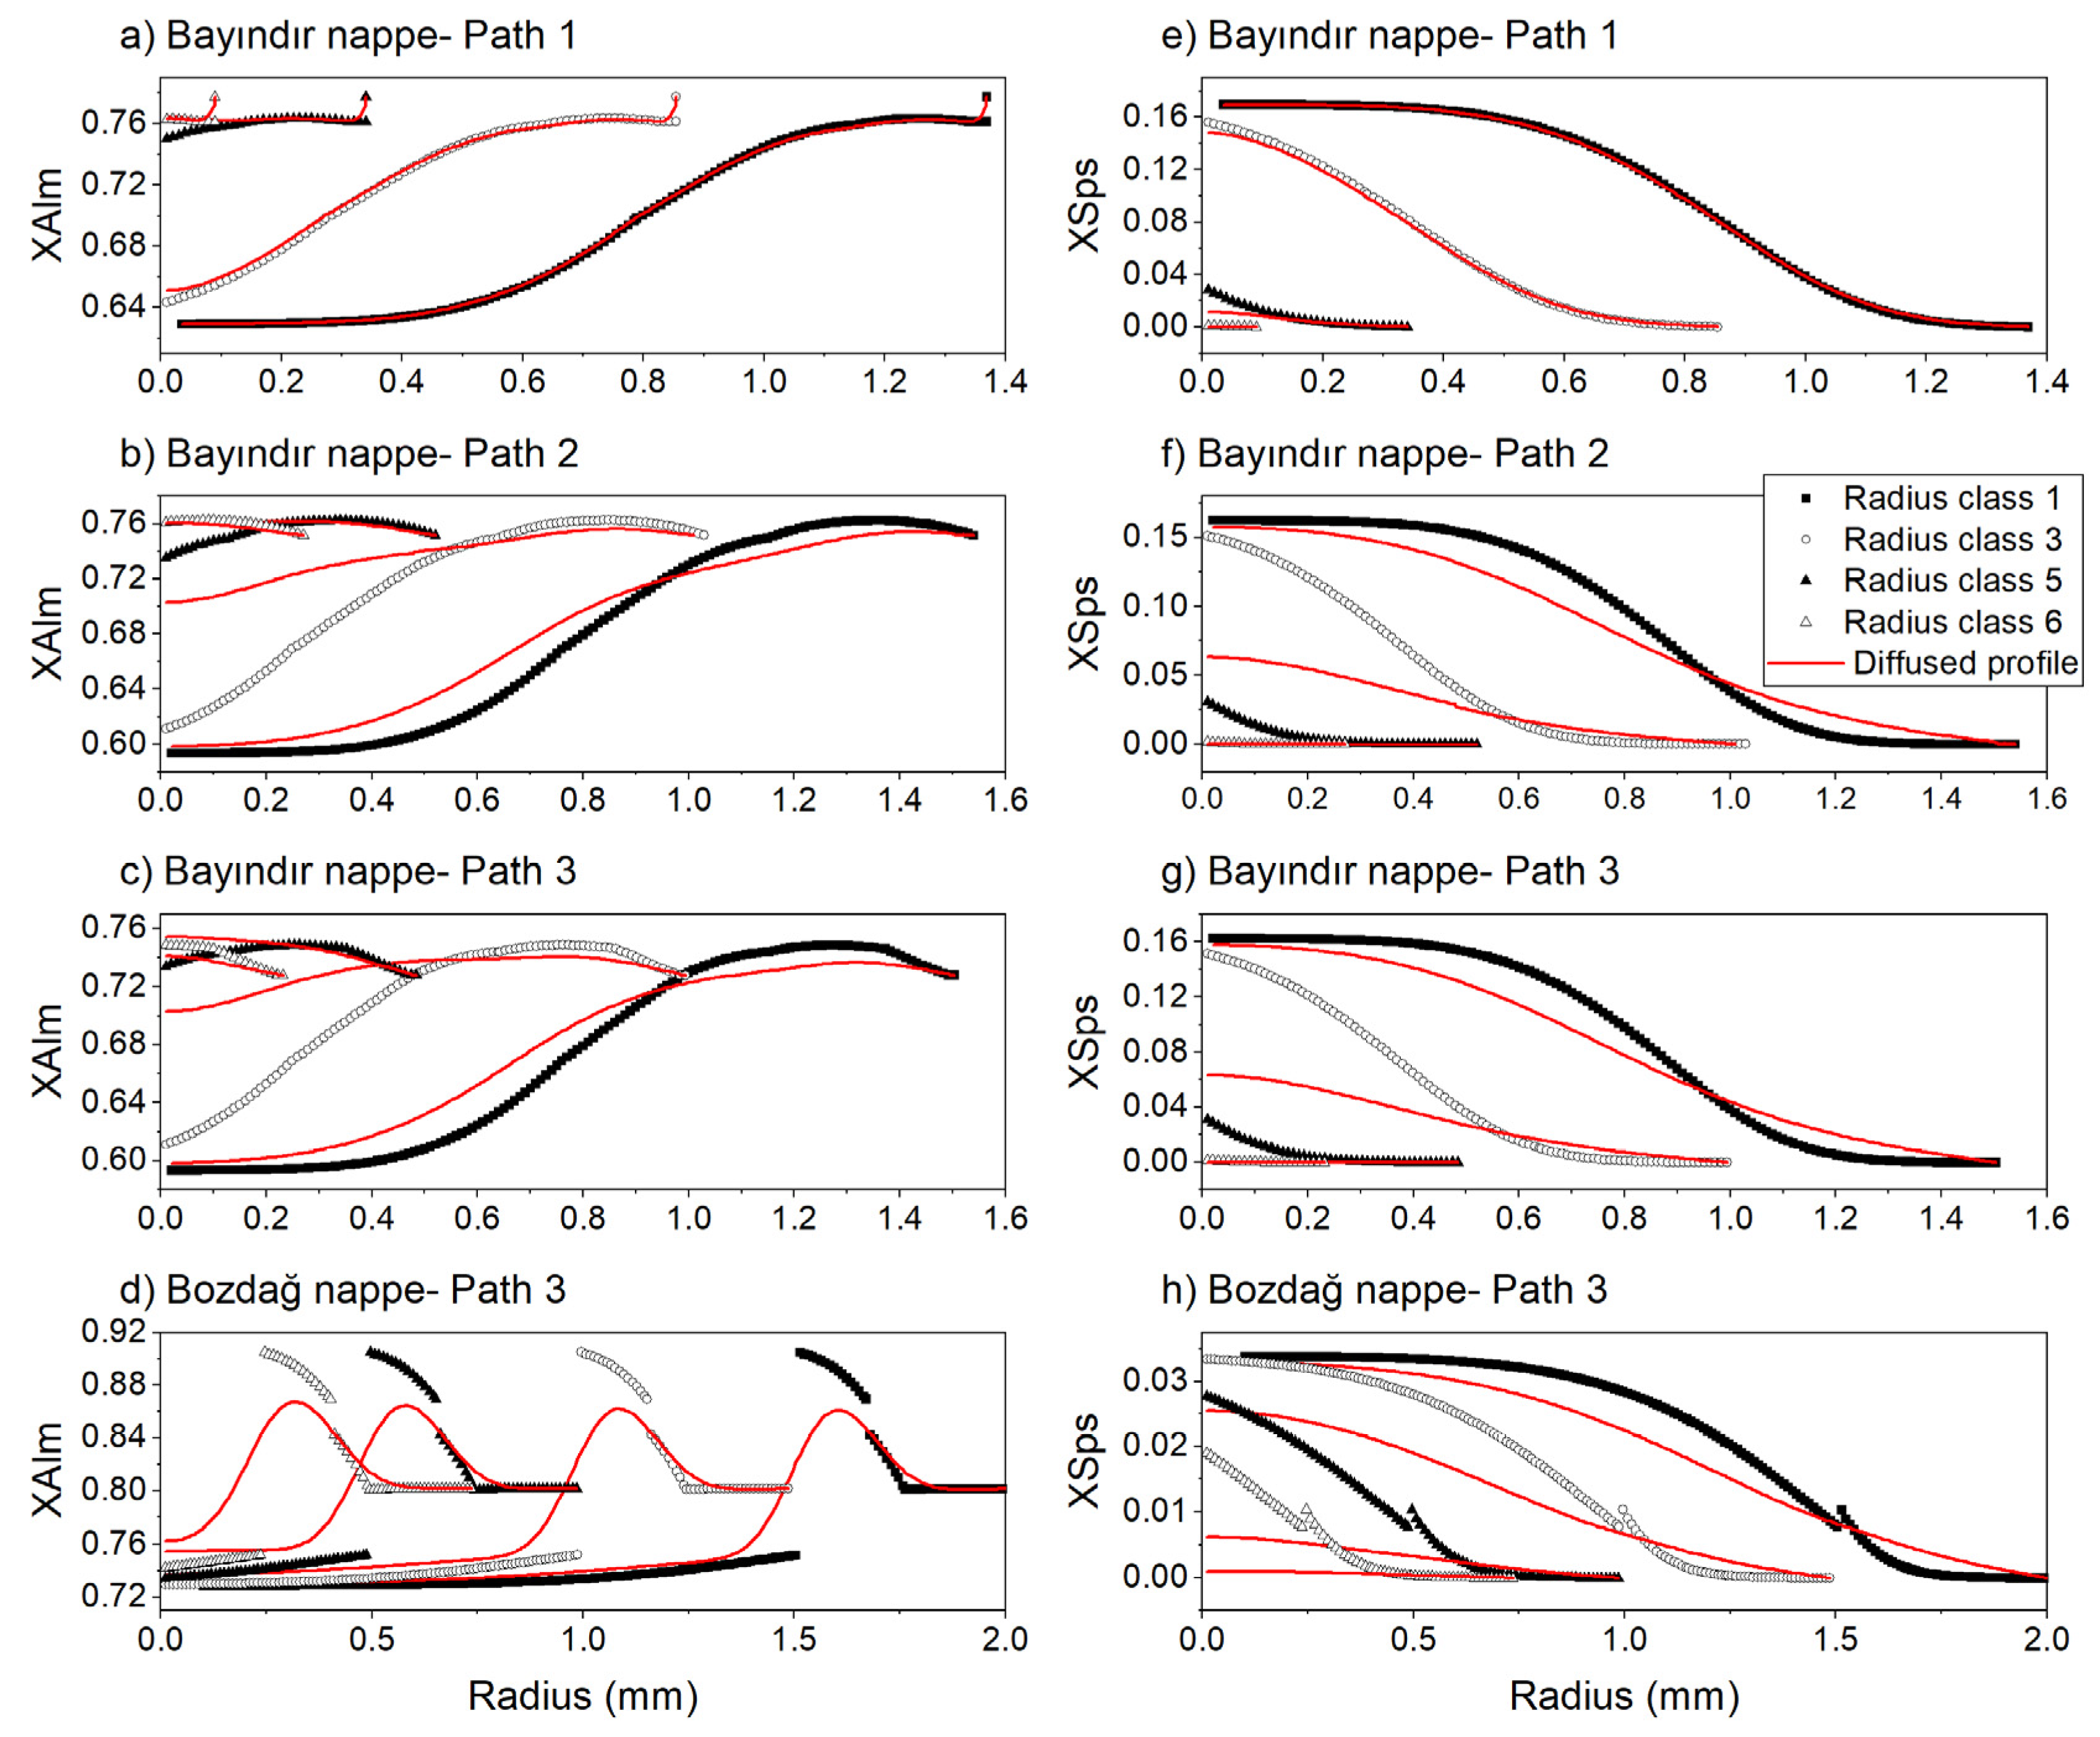
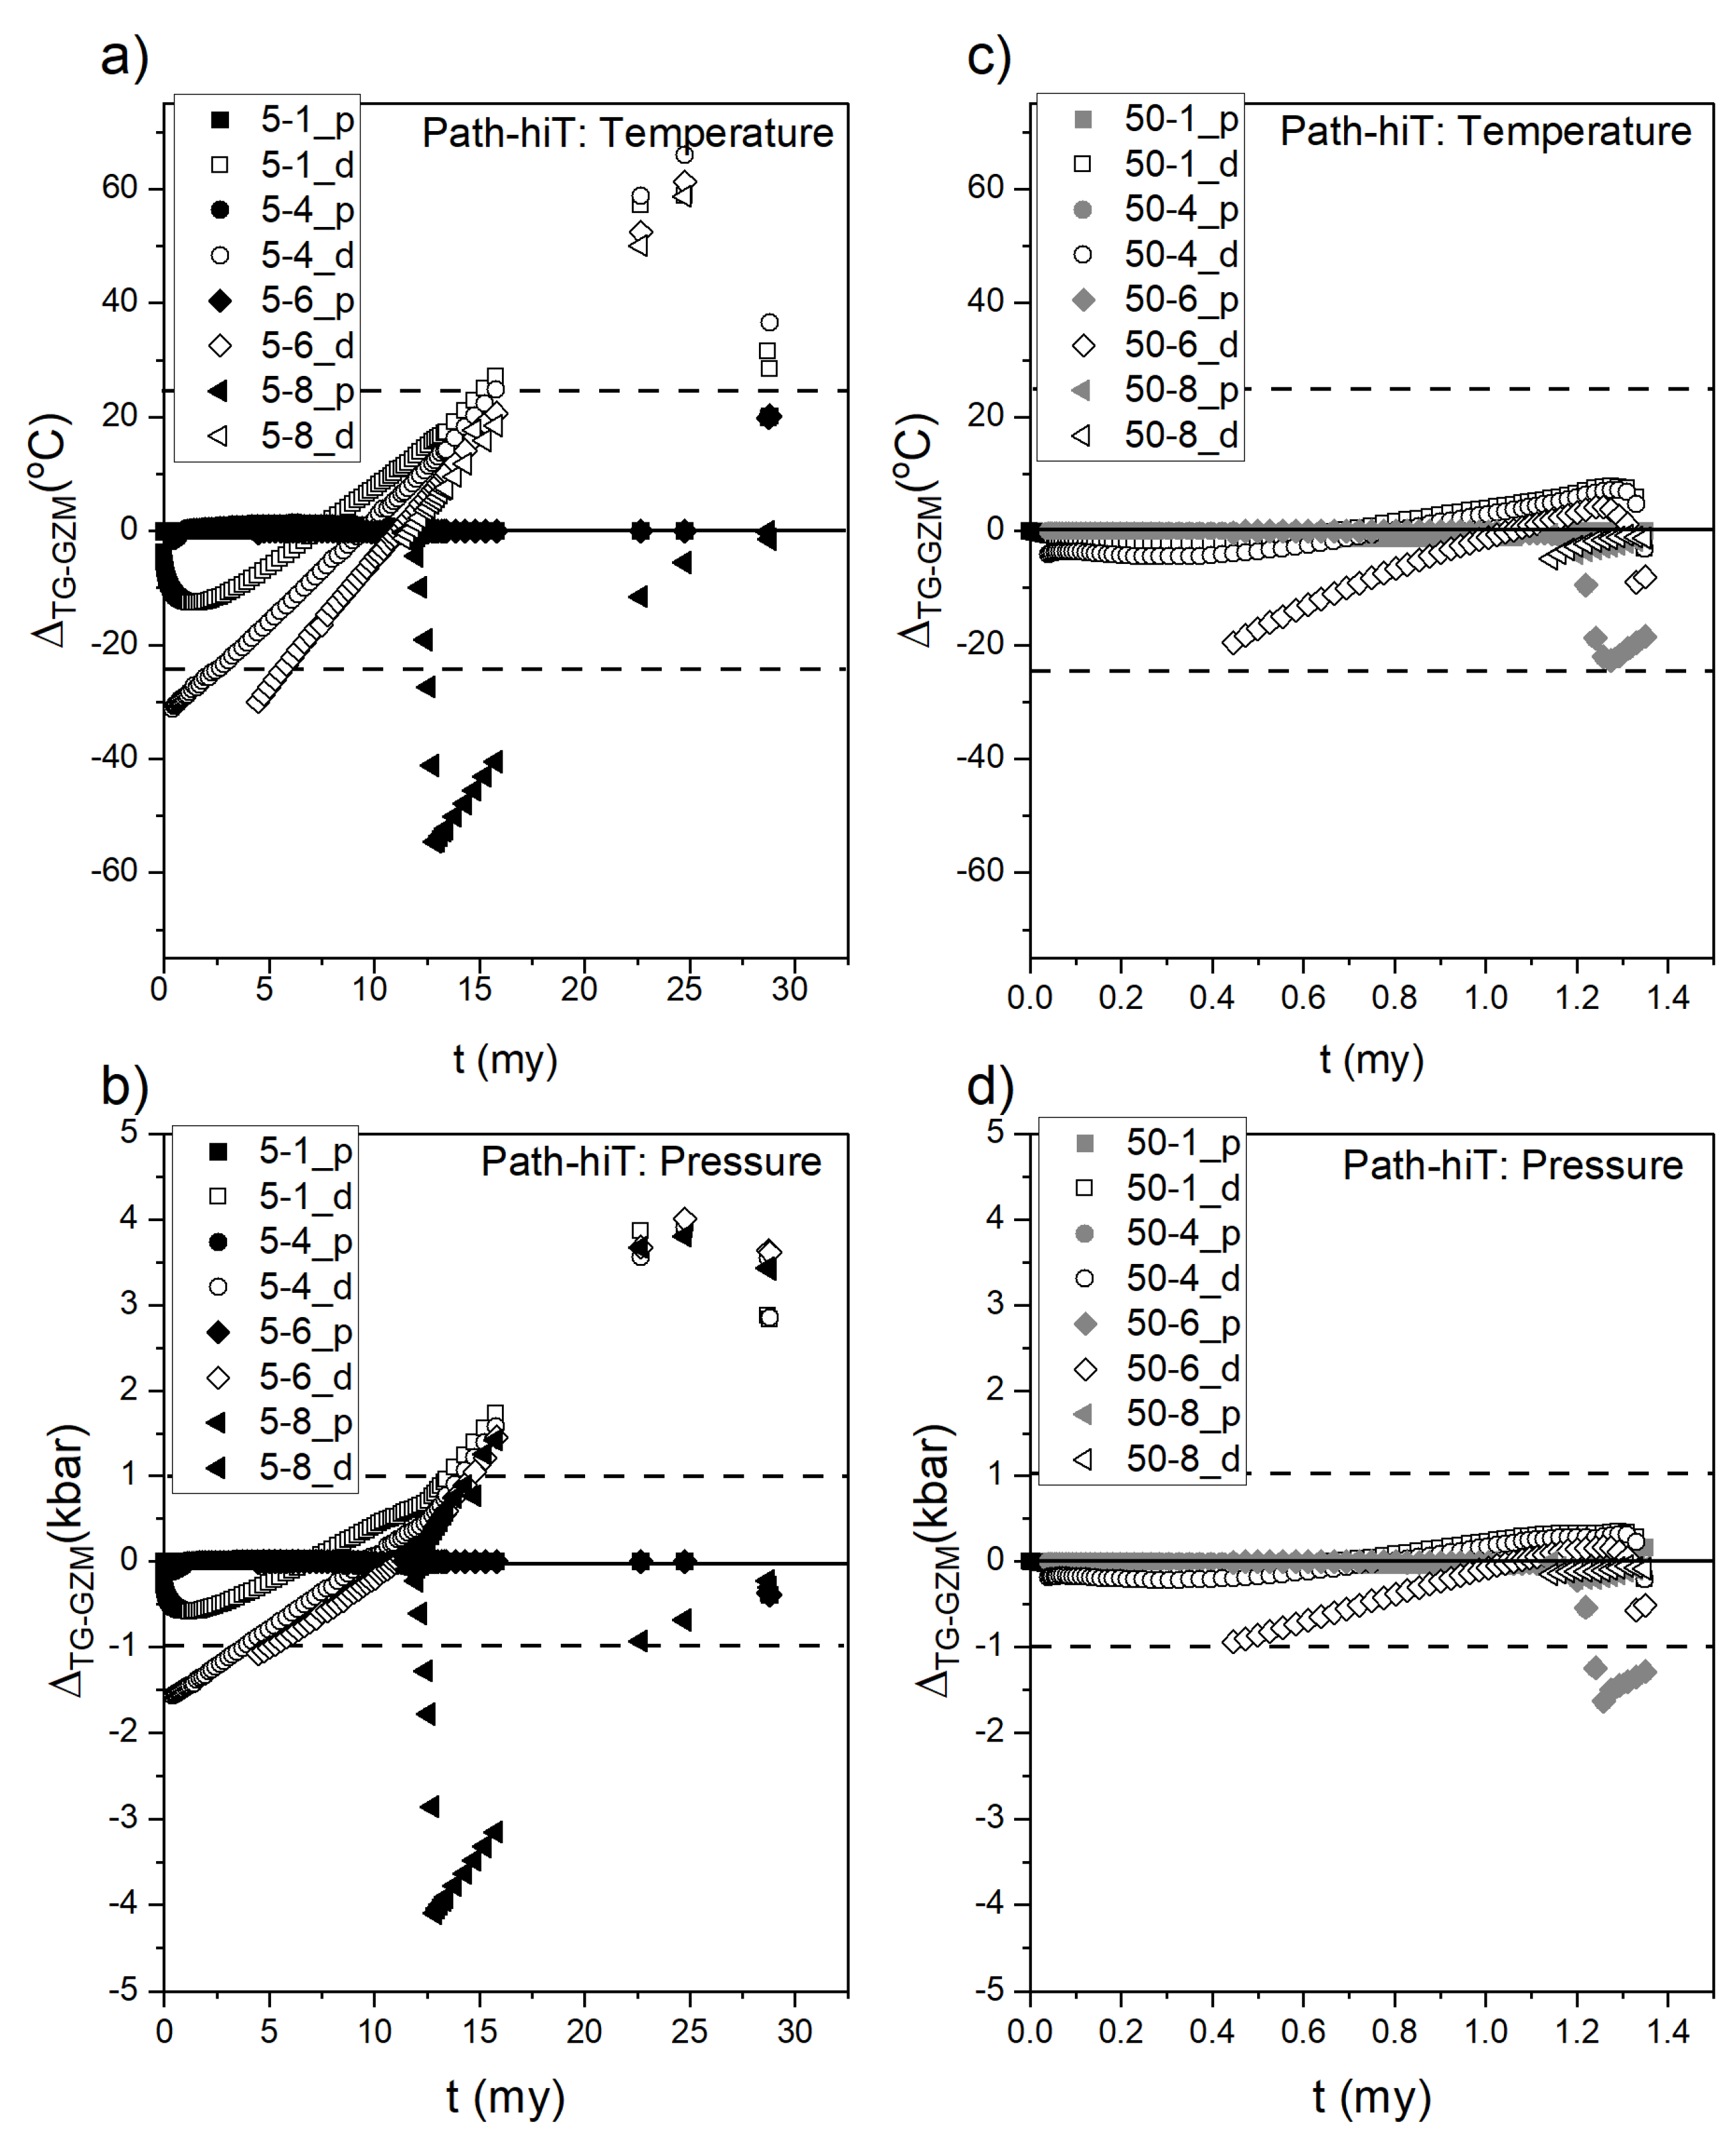
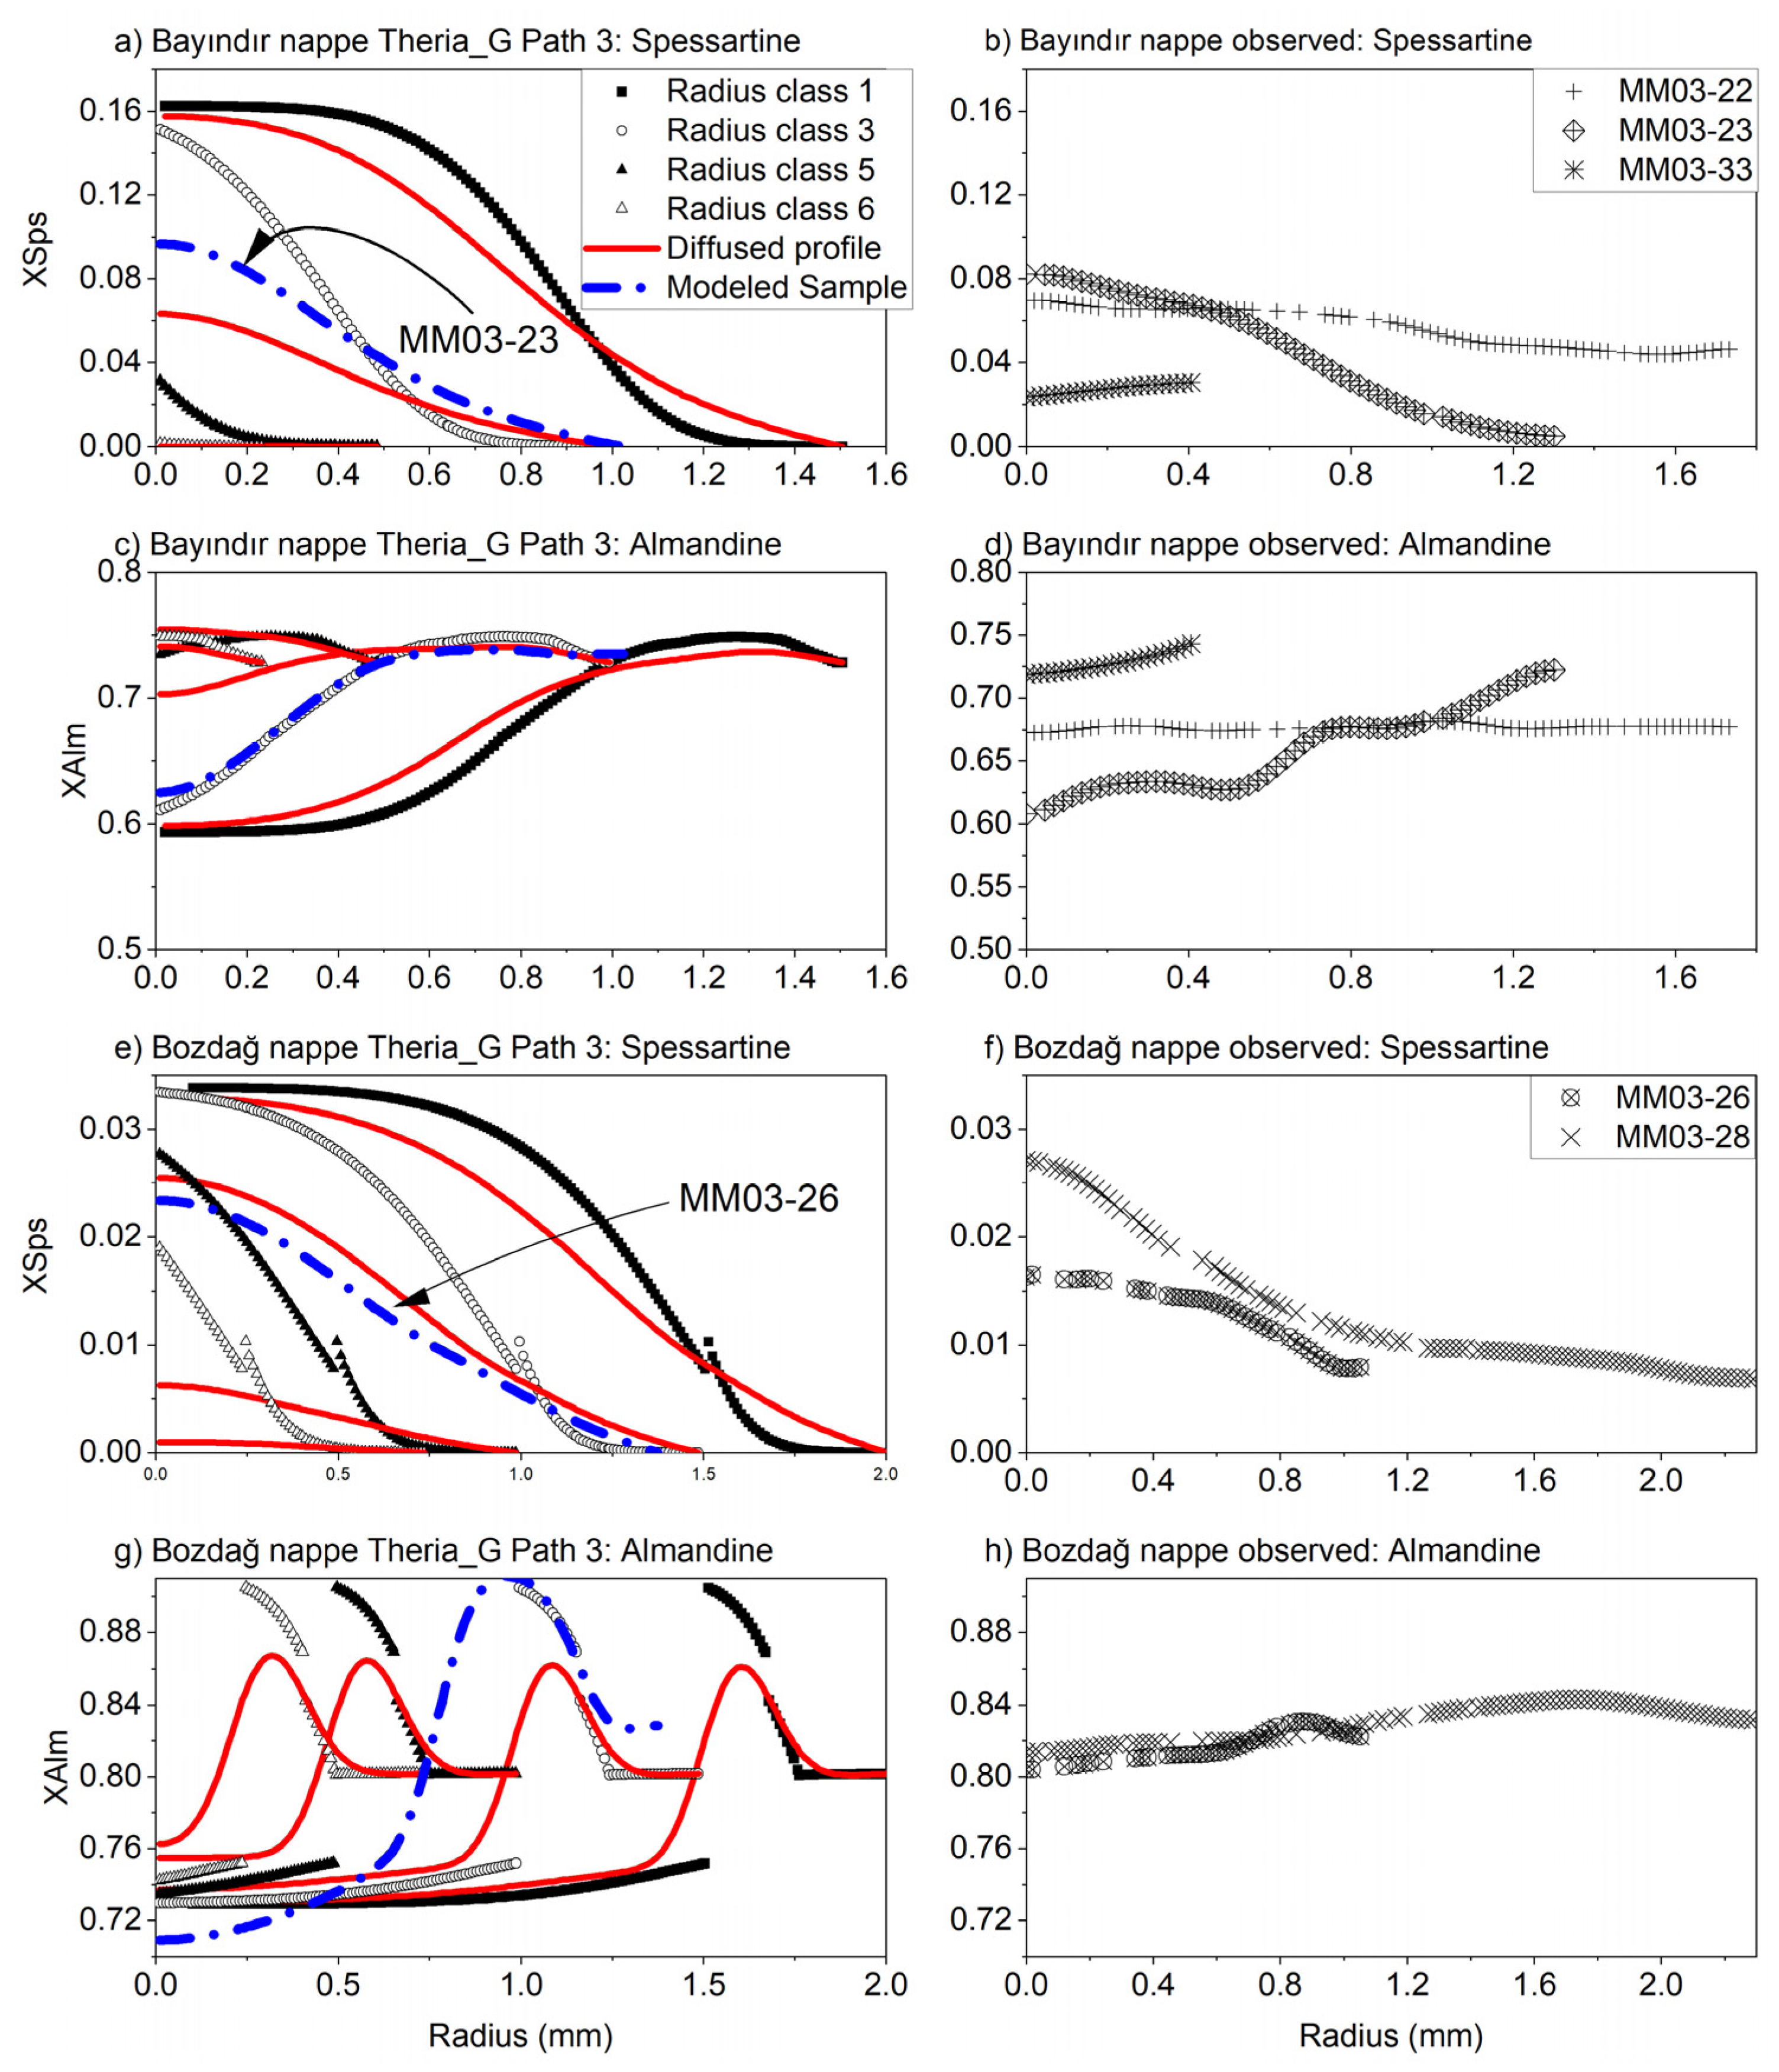
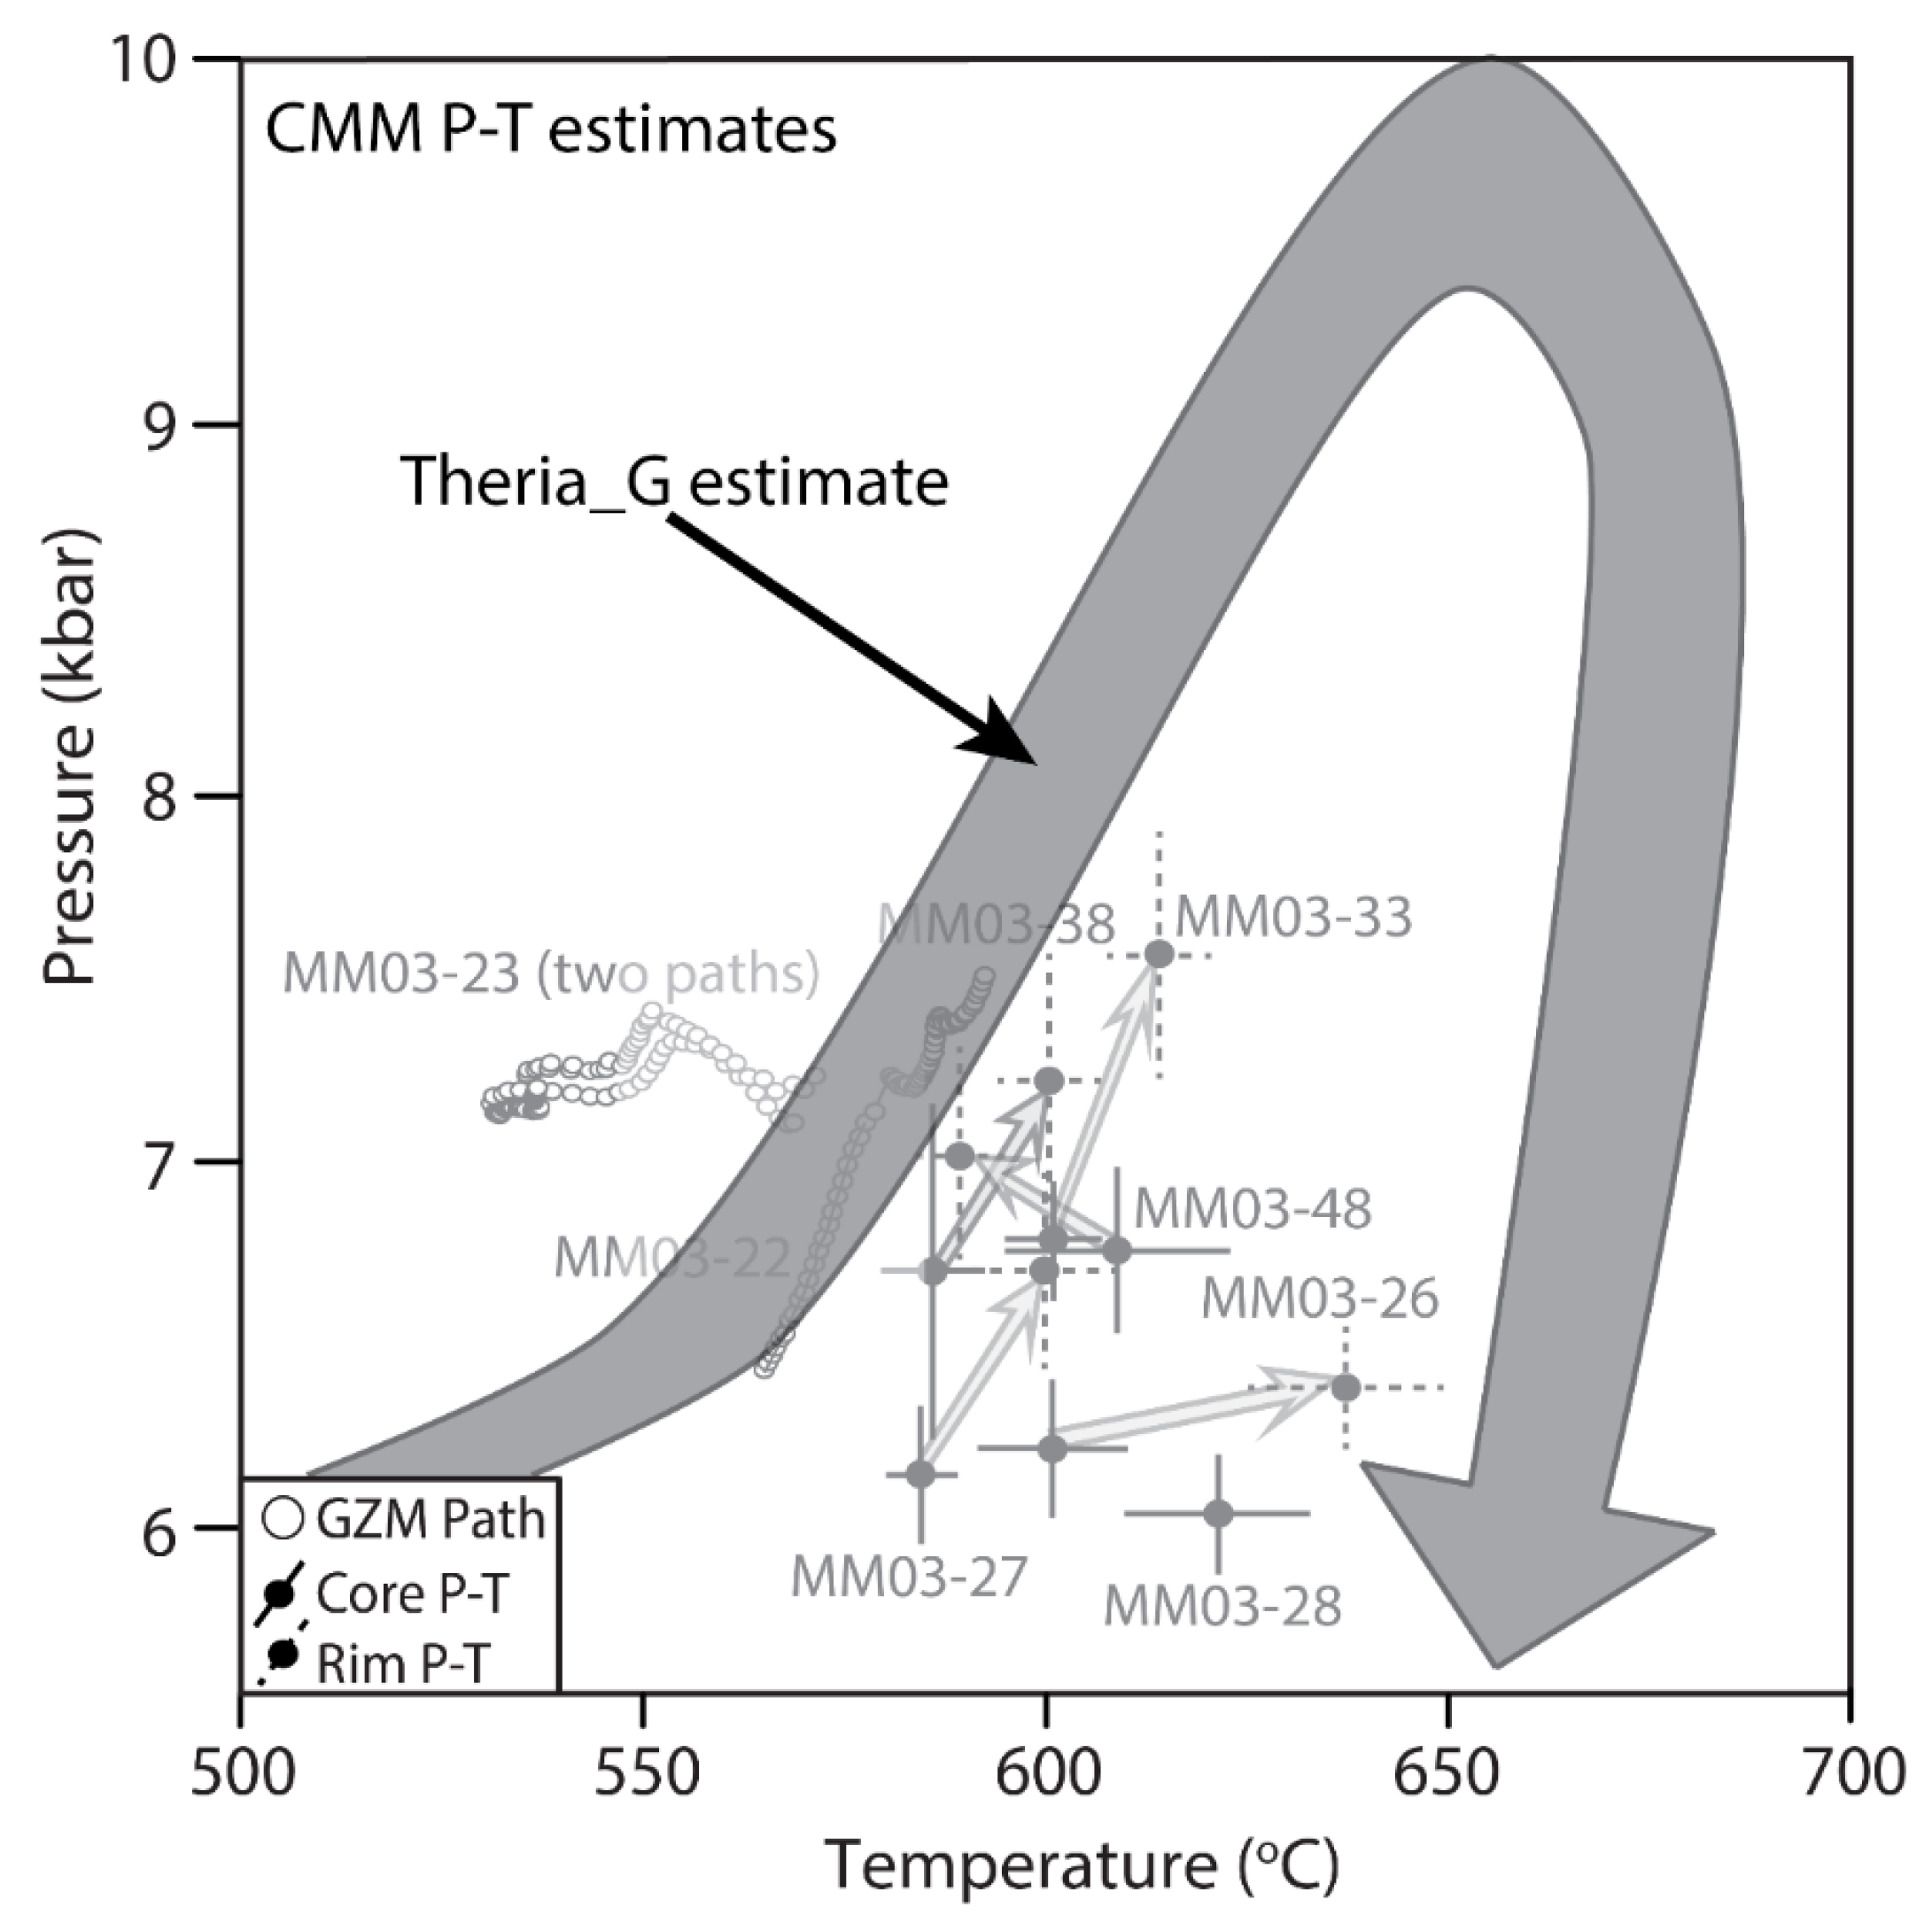
Table 1.
Initial bulk rock compositions.
| Sample (wt%) | C & T (2008) * | Avg. Bayındır † | Avg. Bozdağ † | MM03-23 | MM03-26 |
|---|---|---|---|---|---|
| SiO2 | 59.80 | 61.01 | 64.31 | 62.22 | 64.58 |
| Al2O3 | 16.57 | 17.35 | 20.56 | 15.73 | 19.52 |
| FeO ‡ | 5.81 | 7.17 | 8.77 | 8.84 | 8.67 |
| MnO | 0.10 | 0.07 | 0.05 | 0.11 | 0.06 |
| MgO | 2.62 | 2.53 | 0.85 | 3.22 | 0.66 |
| CaO | 1.09 | 1.43 | 0.34 | 1.30 | 0.29 |
| Na2O | 1.73 | 2.81 | 0.47 | 2.16 | 0.71 |
| K2O | 3.53 | 3.04 | 1.42 | 2.74 | 1.66 |
| TiO2 | 0.75 | 0.90 | 1.13 | 1.00 | 1.36 |
| Total | 92.0 | 96.3 | 97.9 | 97.3 | 97.5 |
Table 2.
Garnet core and rim P-T conditions estimated by isopleth thermobarometry.
| Sample * (Path-B) | Core T (°C) | Core P (kbar) | Rim T (°C) | Rim P (kbar) | Sample (Path-hiT) | Core T (°C) | Core P (kbar) | Rim T (°C) | Rim P (kbar) |
|---|---|---|---|---|---|---|---|---|---|
| Garnets at a heating/cooling rate of 5 °C/my | |||||||||
| 5-1_p | 500 | 5.9 | 560 | 9.7 | 5-1_p | 520 | 5.3 | 665 | 10.2 |
| 5-1_d | 500 | 5.9 | 560 | 9.7 | 5-1_d | 525 | 5.5 | 565 | 9.6 |
| 5-4_p | 500 | 6.1 | 560 | 9.7 | 5-4_p | 520 | 5.4 | 665 | 10.2 |
| 5-4_d | 505 | 6.3 | 560 † | 9.7 † | 5-4_d | - ‡ | - | - | - |
| 5-6_p | 520 | 6.7 | 560 | 9.7 | 5-6_p | 545 | 5.9 | 665 | 10.3 |
| 5-6_d | 545 † | 8.1 † | 560 | 9.7 | 5-6_d | - | - | - | - |
| 5-8_p | 560 | 9.1 | 560 | 9.7 | 5-8_p | 570 | 6.8 | 665 | 10.1 |
| 5-8_d | 560 † | 9.1 † | 560 † | 9.7 † | 5-8_d | 610 † | 8.6 † | - | - |
| Garnets at a heating/cooling rate of 50 °C/my | |||||||||
| 50-1_p | 500 | 5.9 | 560 | 9.7 | 50-1_p | 520 | 5.3 | 590 | 7.5 |
| 50-1_d | 500 | 5.9 | 560 † | 9.7 † | 50-1_d | 520 | 5.3 | 590 | 7.5 |
| 50-4_p | 500 | 6.1 | 560 | 9.7 | 50-4_p | 525 | 5.4 | - | - |
| 50-4_d | 500 | 6.1 | 560 † | 9.5 † | 50-4_d † | 530 † | 5.5 † | - | - |
| 50-6_p | 515 | 6.8 | 560 | 9.7 | 50-6_p | 545 | 5.9 | 590 | 7.5 |
| 50-6_d | 520 | 7.0 | - | - | 50-6_d | - | - | 590 | 7.8 |
| 50-8_p | 540 | 8.8 | 560 | 9.7 | 50-8_p | 575 | 6.8 | 590 | 7.5 |
| 50-8_d | 545 | 8.7 | - | - | 50-8_d | 575 | 6.9 | 590 | 7.5 |
* Samples are coded by heating/cooling rate (5 vs. 50), radius class (1, 4, 6, 8), and whether the primary (p) or diffused (d) garnet composition modeled by THERIA_G was used (e.g., 5-1_p = 5 °C/my, radius class 1, primary composition). See Figure 4 for these simulation specifications. † Not all isopleths intersected and/or plotted, but still able to infer a plausible condition. ‡ “-“ the value is not reported due to a lack of isopleth overlap or isopleths did not plot within the specified range of P-T conditions.
Table 3.
Garnet core and rim P-T conditions.
| Sample (Path hiT) * | Core T (°C) | Core P (kbar) | Rim T (°C) † | Rim P (kbar) † |
|---|---|---|---|---|
| 5-4_dp | - ‡ | - ‡ | 740 | 9.8 |
| 5-6_dp | - ‡ | - ‡ | 740 | 9.8 |
| 5-8_dp | 610 † | 8.6 † | 740 | 9.8 |
| 50-4_dp | 530 † | 5.5 † | 580 | 6.8 |
| 50-6_dp | 550 † | 6.1 † | 580 | 6.8 |
| 50-8_dp | 575 † | 6.9 † | 580 | 6.8 |
* Values are estimated by isopleth thermobarometry using Theriak-Domino to test the sensitivity of GZM thermobarometry to diffusion and input bulk composition. Every estimate was made using the original bulk rock composition of [80] as input as opposed to the appropriate fractionated bulk compositions (as done for values reported in Table 2). Samples are coded by heating/cooling rate (5 vs. 50), radius class (4, 6, 8), and indicating the diffused profile was used (d) (e.g., 5-4_dp = 5 °C/my, radius class 4, diffused garnet composition used, and results for this experiment). Note, the second “p” is included in every sample to differentiate from the results presented in Table 2. † Not all isopleths intersected and/or plotted, but still able to infer a plausible condition. ‡ Value not reported because no condition was determinable either due to a lack of isopleth overlap and/or isopleths do not plot within the defined P-T space.
Publisher’s Note: MDPI stays neutral with regard to jurisdictional claims in published maps and institutional affiliations. |
© 2021 by the authors. Licensee MDPI, Basel, Switzerland. This article is an open access article distributed under the terms and conditions of the Creative Commons Attribution (CC BY) license (https://creativecommons.org/licenses/by/4.0/).
Share and Cite
MDPI and ACS Style
Etzel, T.M.; Catlos, E.J. Garnet Chemical Zoning Based Thermobarometry: Method Evaluation and Applications in the Menderes Massif, Western Turkey. Geosciences 2021, 11, 505. https://0-doi-org.brum.beds.ac.uk/10.3390/geosciences11120505
AMA Style
Etzel TM, Catlos EJ. Garnet Chemical Zoning Based Thermobarometry: Method Evaluation and Applications in the Menderes Massif, Western Turkey. Geosciences. 2021; 11(12):505. https://0-doi-org.brum.beds.ac.uk/10.3390/geosciences11120505
Chicago/Turabian StyleEtzel, Thomas M., and Elizabeth J. Catlos. 2021. "Garnet Chemical Zoning Based Thermobarometry: Method Evaluation and Applications in the Menderes Massif, Western Turkey" Geosciences 11, no. 12: 505. https://0-doi-org.brum.beds.ac.uk/10.3390/geosciences11120505
Note that from the first issue of 2016, this journal uses article numbers instead of page numbers. See further details here.