Article

Quantifying the Impact of a Tsunami on Data-Driven Earthquake Relief Zone Planning in Los Angeles County via Multivariate Spatial Optimization

1
Spatial Sciences Institute, University of Southern California, Los Angeles, CA 90089, USA
2
Spatial Statistics Team, Environmental Systems Research Institute, Redlands, CA 92373, USA
*
Author to whom correspondence should be addressed.
Submission received: 27 November 2020 / Revised: 9 February 2021 / Accepted: 10 February 2021 / Published: 19 February 2021
(This article belongs to the Special Issue Interdisciplinary Geosciences Perspectives of Tsunami Volume 3)

Abstract

:
Post-earthquake relief zone planning is a multidisciplinary optimization problem, which required delineating zones that seek to minimize the loss of life and property. In this study, we offer an end-to-end workflow to define relief zone suitability and equitable relief service zones for Los Angeles (LA) County. In particular, we address the impact of a tsunami in the study due to LA’s high spatial complexities in terms of clustering of population along the coastline, and a complicated inland fault system. We design data-driven earthquake relief zones with a wide variety of inputs, including geological features, population, and public safety. Data-driven zones were generated by solving the p-median problem with the Teitz–Bart algorithm without any a priori knowledge of optimal relief zones. We define the metrics to determine the optimal number of relief zones as a part of the proposed workflow. Finally, we measure the impacts of a tsunami in LA County by comparing data-driven relief zone maps for a case with a tsunami and a case without a tsunami. Our results show that the impact of the tsunami on the relief zones can extend up to 160 km inland from the study area.

1. Introduction

A recent study conducted by the United States Geological Survey (USGS) shows that a portion of the San Andreas Fault close to Los Angeles (LA) could be overdue for a major earthquake. Extensive areas in Los Angeles County are at high risk due to urbanization, dense population, and a complex road network. Areas along the coast are also threatened by post-earthquake tsunamis, despite the low probability [1]. Under such circumstances, an efficient and manageable evacuation plan can help authorities and citizens to make appropriate decisions in preparing and responding to a massive earthquake. Relief zone planning is the first step towards a successful disaster response.
The imminent geologic hazard facing LA County is caused by earthquakes that originate from terrestrial fault lines in California [2]. The majority of the tsunamis that impact the county originate from distal subduction zone events from the Pacific Rim, such as 1964 Alaska [3], 2010 Chile [4], and 2011 Tohoku earthquakes [4], with few reports of local tsunami-generating events, such as the Santa Barbara earthquake of 1812 [5]. The resulting tsunamis can lead to severe damage, such as thirty block inundation in downtown Crescent City due to 1964 Alaska earthquake ( M W 9.4) [6]. In a densely populated and industrial area, such as LA County, a tsunami can put millions of lives at risk and result in up to $6 billion of damage in port disruption, property damage, and evacuations [1]. Earthquakes that took place in the county’s near history, such as the 1994 Northridge earthquake ( M W 6.7), resulted in destroying thousands of homes, closing major highways, and injuring thousands of people [7].
Timely and equitable allocation of limited relief resources during a disaster is of upmost importance to maximize the survival rate [8]. In the case of past destructive earthquakes in LA County, societal needs varied from short term (hours) need for hospital resource allocation [9], mid-term (days) need for shelters [10], and long-term (months) needs for repairs to the electrical and transportation infrastructure [11,12]. The delineation of relief zones seeks to separate a service area into smaller zones to distribute the service load equally between zones without compromising service quality [13,14].
Data-driven relief zone planning has been studied by numerous researchers. Anhorn and Khazai [15] established an open space suitability index (OSSI) to evaluate capacity-based suitability and accessibility of shelter sites. Chu and Su [16] proposed an evaluation system to select the optimal shelter locations while using the technique for order preference by similarity to ideal solution (TOPSIS) with the weights being generated from the analytic hierarchy process (AHP) and entropy method. Geng et al. [17] defined a multi-criteria location model while using fuzzy AHP, fuzzy TOPSIS, and multi-objective optimization approaches to locate shelters and optimize the shelter allocation solutions. Xu et al. [18] adopted a multi-criteria constraint model to determine shelter locations with maximum spatial coverage. Kılcı, et al. [19] established a mixed-integer linear programming model to select temporary post-earthquake shelters in Turkey. Zhao, Li, and Sun [20] introduced an integrated location-allocation shelter model that assigns evacuees to the closest open spaces that are suitable for shelters, while considering both building resilience and life support needs after a disaster. The Khazai and Daniell’s method [21], on the other hand, focused on obtaining shelter demand, rather than location suitability and creating a shelter needs index (SNI), which contains a shelter seeking index (SSI) and a displaced person index (DPI). Aldika’s [22] method addressed tsunami evacuation routes. Proposed method uses a web-based geographic information system to create a tool that could help people to find the closest shelter and the best route to get there from their location. This tool used Dijkstra’s algorithm [23] to create the shortest route to any given location.
Thematic applications of relief zone planning methods in LA County give attention to different dimensions of the problem. Lin et al. [24] researched the logistics optimization to model “relief depots” that are best connected to the population being served via the road network. Bolin and Stanford [10] studied the unmet needs of the LA County population after the 1994 Northridge earthquake, emphasizing racial disparities of such needs. Nelson and French [25] dealt with optimal policy that is pertinent to seismic safety measures to reduce the loss of life and property with the 1994 Northridge Earthquake as their case study. Modeling of tsunami events in Southern California is focused on geologic models. Ryan et al. [26] proposed a three-dimensional (3-D) dynamic rupture model for an earthquake and the resulting tsunami in Pitas Point and Lower Red Mountain, which can be used to assess the impact of geologic drivers. Ryan et al. [27] compiled historic earthquakes in the Aleutian–Alaska megathrust and their tsunami generating potential for California. Borrero et al. [5] focused on the short-field (local) fault systems in California that can pose a tsunami threat in Southern California.
The main shortcoming of general relief zone allocation methods is the global approach to modeling zones, without an explicit model of spatial heterogeneity behind relief zone drivers. Chu and Su’s approach [16] only applies to cities with existing shelter candidates and it cannot provide a solution for places without shelter planning. Additionally, methods that require such an “informed initial guess” in spatial optimization are prone to local optima. Such optima result in relief zones that honor the initial guesses of what the zones should be without conforming to underlying data. Although Khazai and Daniell’s method [21] can accurately measure the number of people at risk of being displaced (DPI), the shelter-seeking index (SSI) remains unpredictable, due to possibilities in seeking alternatives to shelters. The requirement of the number of zones as an exogenous variable, without any consideration for the optimal number of zones that result in the most equitable allocation of limited resources, is an overarching shortcoming in all methodologies.
Aside from model shortcomings, the impact of a tsunami on California’s, in particular, LA County’s, plans for disaster relief is not studied. Studies that pertain to a tsunami in Southern California only consider geological drivers and factors that impact the allocation of resources, such as population mobility out of inundation zones, are not modeled. Besides, the impact of population, relief zone drivers are not modeled in conjunction. Detailed studies on earthquake relief models in California mostly focus on a single dimension of resource allocation without a holistic model to incorporate different decision variables to define data-driven zones.
This study presents a spatial optimization workflow for designing earthquake relief zones with fair access and equal population served. A suitability model that incorporates geologic and anthropological variables is proposed and metrics for equitable zone design for relief planning are elaborated. Two cases, namely, an earthquake without a tsunami and an earthquake with a tsunami, are considered. The population in tsunami inundation affected regions is redistributed to the closest neighbor in the tsunami scenario. The proposed work assumes no prior knowledge of relief zones and a potential tsunami in relief planning in LA County.

2. Study Area

Los Angeles (LA) County is located in Southern California (Figure 1). It has a land area of 10,510 square kilometers and a coastline of 112 km bordering the Pacific Ocean. The county sits on the world’s greatest earthquake zone, the circum-Pacific seismic belt. The probability of having an earthquake measuring magnitude of 6.7, 7, and 7.5 in the LA region in the next 30 years is 60%, 46%, and 31%, respectively, according to the third Uniform California Earthquake Rupture Forecast (UCERF3) [28]. As a county with the largest population in the United States, LA faces a serious challenge for earthquake evacuation. Thus, planning earthquake relief zones with adequate access is essentially important for earthquake planning to ensure the safety of the entire population. Figure 1 shows the study area map.

3. Materials and Methods

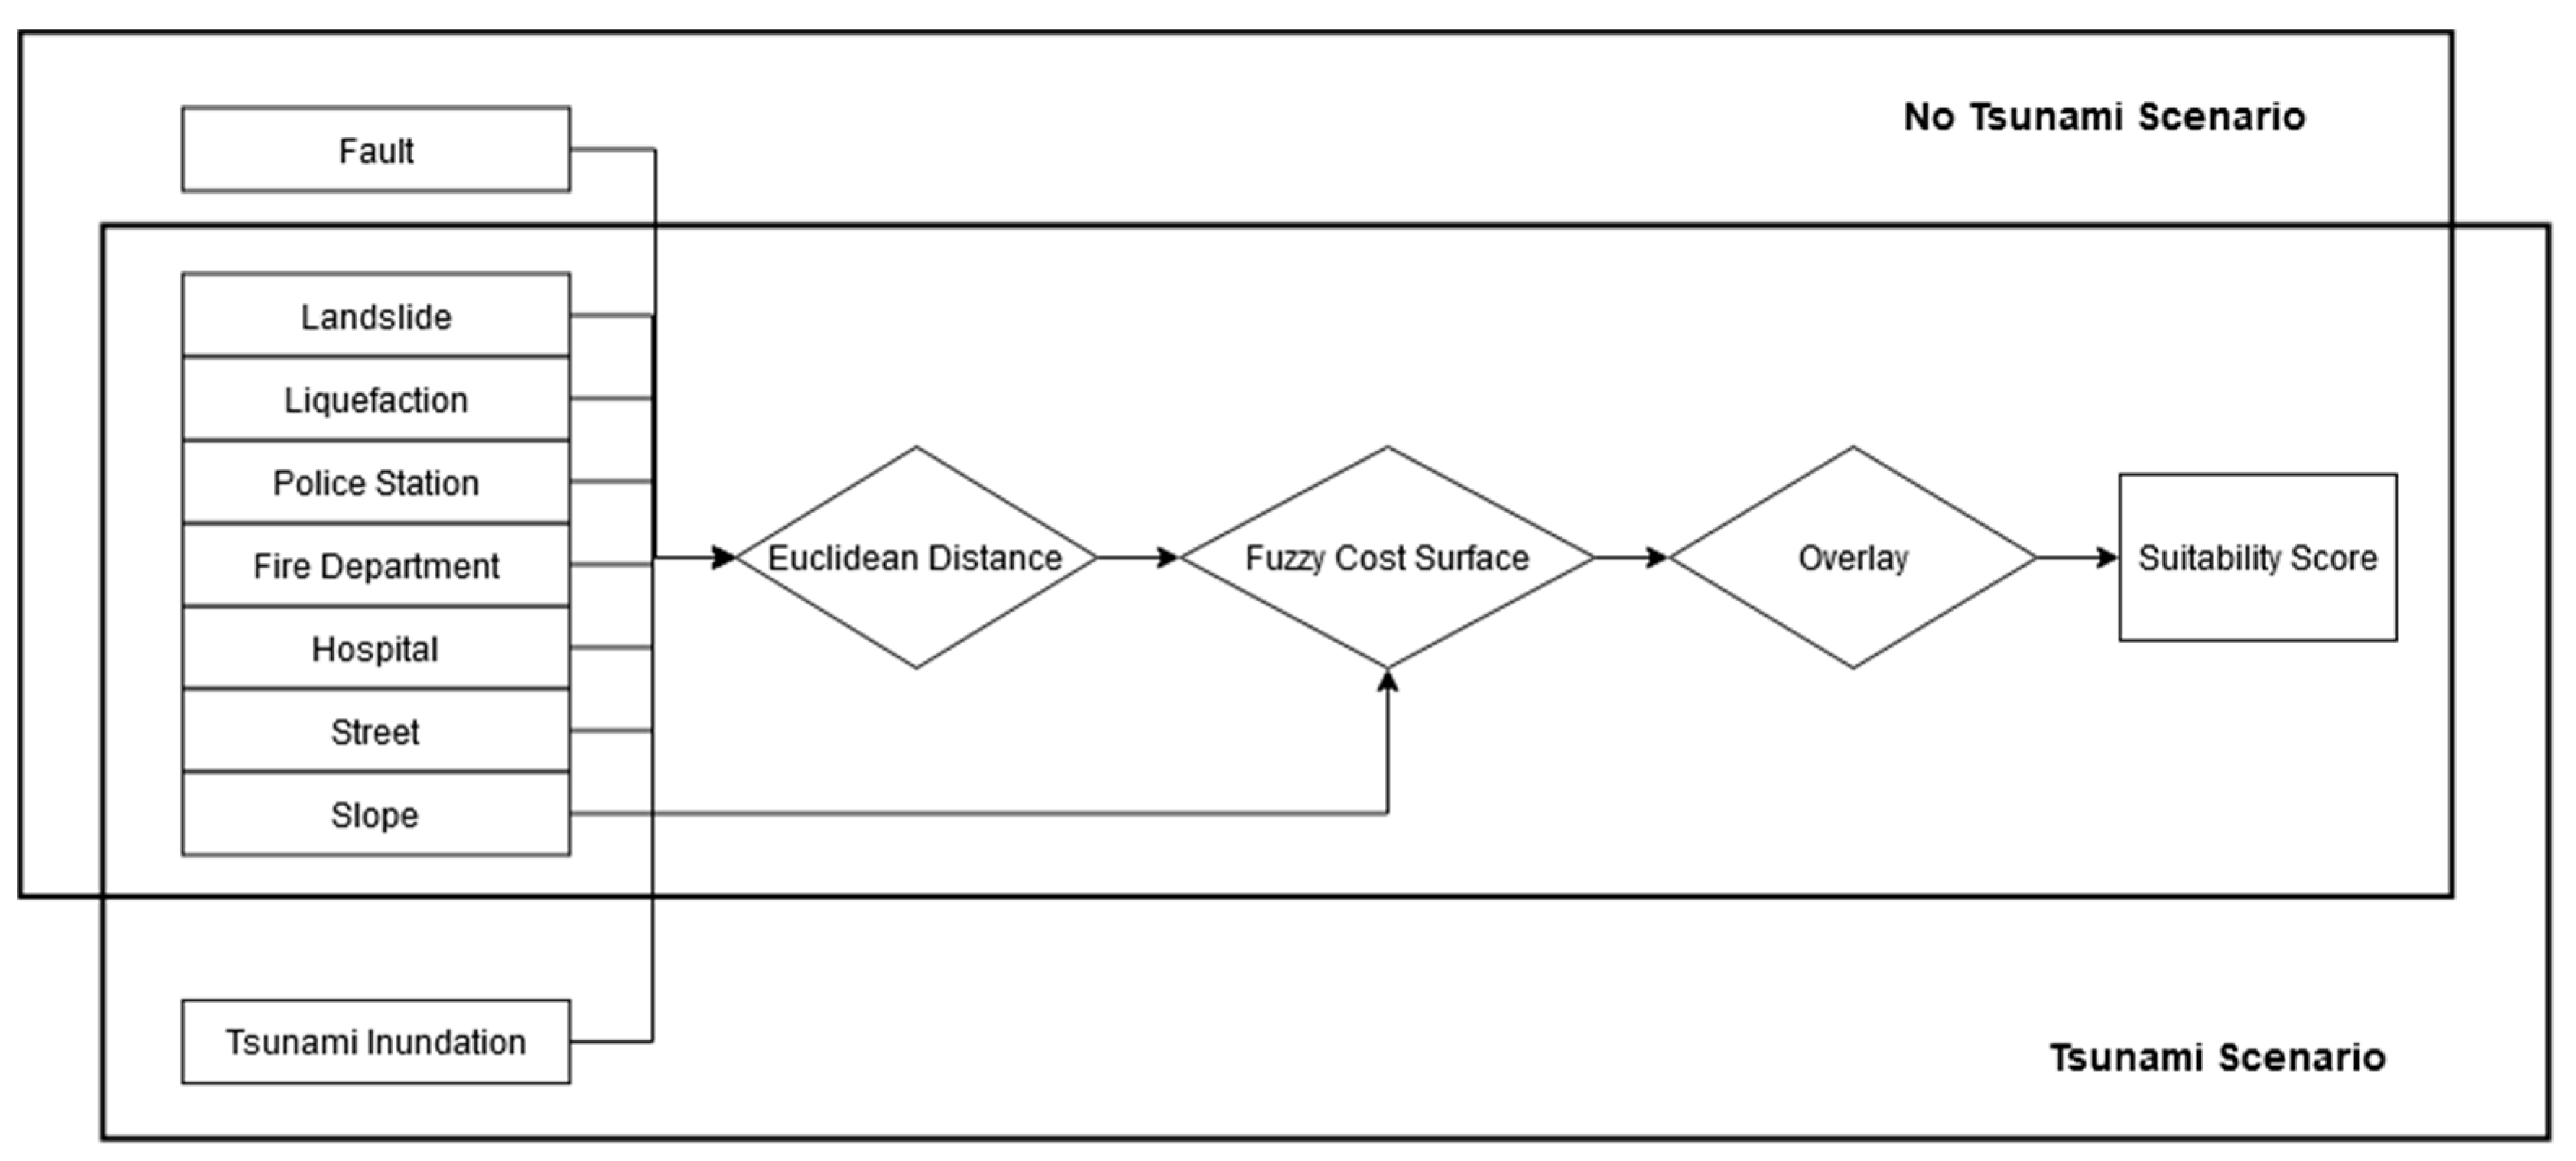
3.1. Earthquake Shelter Suitability Analysis

The earthquake shelter suitability analysis that is presented in the study applied multiple-criteria decision analysis (MCDA) that integrates fuzzy membership and overlay analysis. The suitability model incorporates environmental and socio-economic factors to ensure the safety and accessibility of the shelters in the relief regions. The suitability score is estimated by performing a weighted overlay on the fuzzy results of distance raster derived from all factors. The suitability model is discussed in two scenarios—tsunami scenario and no tsunami scenario—in order to investigate the impacts of tsunami on relief zone planning. In both scenarios, the model includes geological features, such as the slope of the terrain. Because the occurrence of earthquakes is often accompanied by secondary hazards, the distance to zones susceptible to landslides and liquefaction are considered in the model to alleviate the safety concern. The model also consists of human-driven factors including distance to streets and important aids, such as police stations, fire departments, and medical centers. Locations that are close to these features are preferable, as they provide easy access and immediate help in disaster relief. The distance to natural disasters is separately discussed in two scenarios. In no tsunami scenario, the primary source of disaster is fault lines, as the earthquakes originate from a local source on land. In the other scenario, a high probability of tsunami hitting LA County is likely to be generated from distant earthquakes. Therefore, the major constraint considered in the tsunami scenario is the inundation risk. Table 1 lists the data used in the study.
Figure 2 elaborates the schemes of the two scenario-based models.
Note that the influence of the tsunami is modeled as a distance to the inundation buffer. An implicit effect of tsunami inundation is the redistribution of the population in the inundated zones. The population living in a census tract inside the inundation buffer is reassigned to the closest census tract outside of the inundated regions.

3.1.1. Fuzzy Cost Surface

The fuzzy concept is frequently applied in multiple-criteria decision analysis (MCDA) studies to address the uncertainty in decisions [17]. The fuzzy membership functions measure the degree of membership that is in one specific set on a 0 to 1 scale. 0 represents the no membership of the set, while 1 stands for full membership.
Fuzzy MS Large is used when the larger values are more likely to be in one set, in Equation (1). It is a sigmoid curve that is defined by a specified mean and standard deviation. The midpoint is assigned with a membership of 0.5. A value that is greater than midpoint is assigned as a great membership, while a value smaller than midpoint is assigned as a small membership.
μ ( x ) = { 1   b s / ( x a m + b s )   x > a m 0   x a m
where m is the mean, s is the standard deviation, and a and b are defined multipliers.
Fuzzy MS Small is a sigmoid curve that is defined by a customized mean and deviation, where small values are assigned as a large probability to be the membership of one set (Equation (2)). The membership of the midpoint is set to be 0.5 and the probability of membership decreases as the value increases from the midpoint.
μ ( x ) = { b s / ( x a m + b s )   x > a m   0   x a m
here, m is the mean, s is the standard deviation, and a and b are defined multipliers.
The Fuzzy Near function is commonly used when membership is close to a specific value. It uses a midpoint to locate the full membership and assign it a value of 1 (Equation (3)). As values move away from the midpoint in both directions, the membership decreases to no membership with a value of 0. The spread ( f 1 ) determines how quickly the value drops from 1–0.
μ ( x ) = 1 1 + f 1 × ( x f 2 ) 2
where f 1 is the spread,   f 2 is the mid-point.
The fuzzy results are generated with the fuzzy membership tool in ArcGIS Pro. A shelter within 1500 m of major fault lines is dangerous [29]. Areas that are beyond 1500 m of the fault line were converted to raster using the Euclidean Distance tool in ArcGIS Pro. Based on the suggestion of the Red Cross, when facing a potential tsunami, people should run at least 30 m above or 3200 m away from the coast. Here, regions within the 3200 m buffer of the tsunami inundation line are described as not being suitable for shelters. The distance raster outside the buffer was created for tsunami inundation. Similarly, in order to reduce the impacts of secondary hazards, the distance raster of the liquefaction and landslide zones were defined by excluding these regions. Because shelters prefer a location that is far away from these risky areas, Fuzzy MS Large function was selected to apply to these raster layers in the fuzzy membership tool. For the distance to police station, fire department, and hospital, the Fuzzy MS Small function was performed, as the shelters prefer these services to be closer. The Turkish Red Crescent considers a shelter with a slope of 2% to 4% as an ideal candidate [19]. Thus, a Fuzzy Near function with a midpoint of 3 was applied to the slope data that were derived from Digital Elevation Models (DEMs) as the slope close to 3% is considered to be the most suitable for shelter locations.

3.1.2. Weighted Sum Approach

Weighted overlay is widely used in the suitability analysis to provide a comprehensive assessment of multi-constraints [15]. The suitability score in the study is calculated as the sum of the products of each input raster by its specified weight that is shown in Table 2. The weighted sum tool in ArcGIS Pro generates the overlay results of distance rasters. We used the weights defined by Chu and Su [16] for defining suitability scores for shelter zones. In particular, we apply defined synthesis weights from Chu and Su’s paper [16]. Table 2 shows the detailed weights. The earthquake shelter suitability score is defined as a linear superposition of different factors in Equation (4).
S c o r e = i = 1 n ( W i C i )
where W i is the overlay weights, C i is the raster values for the criteria, and n is the number of criteria used in our study. The shelter suitability in two scenarios was first calculated for the entire county and each census tract was assigned two suitability scores, a tsunami scenario score and a no tsunami scenario score.

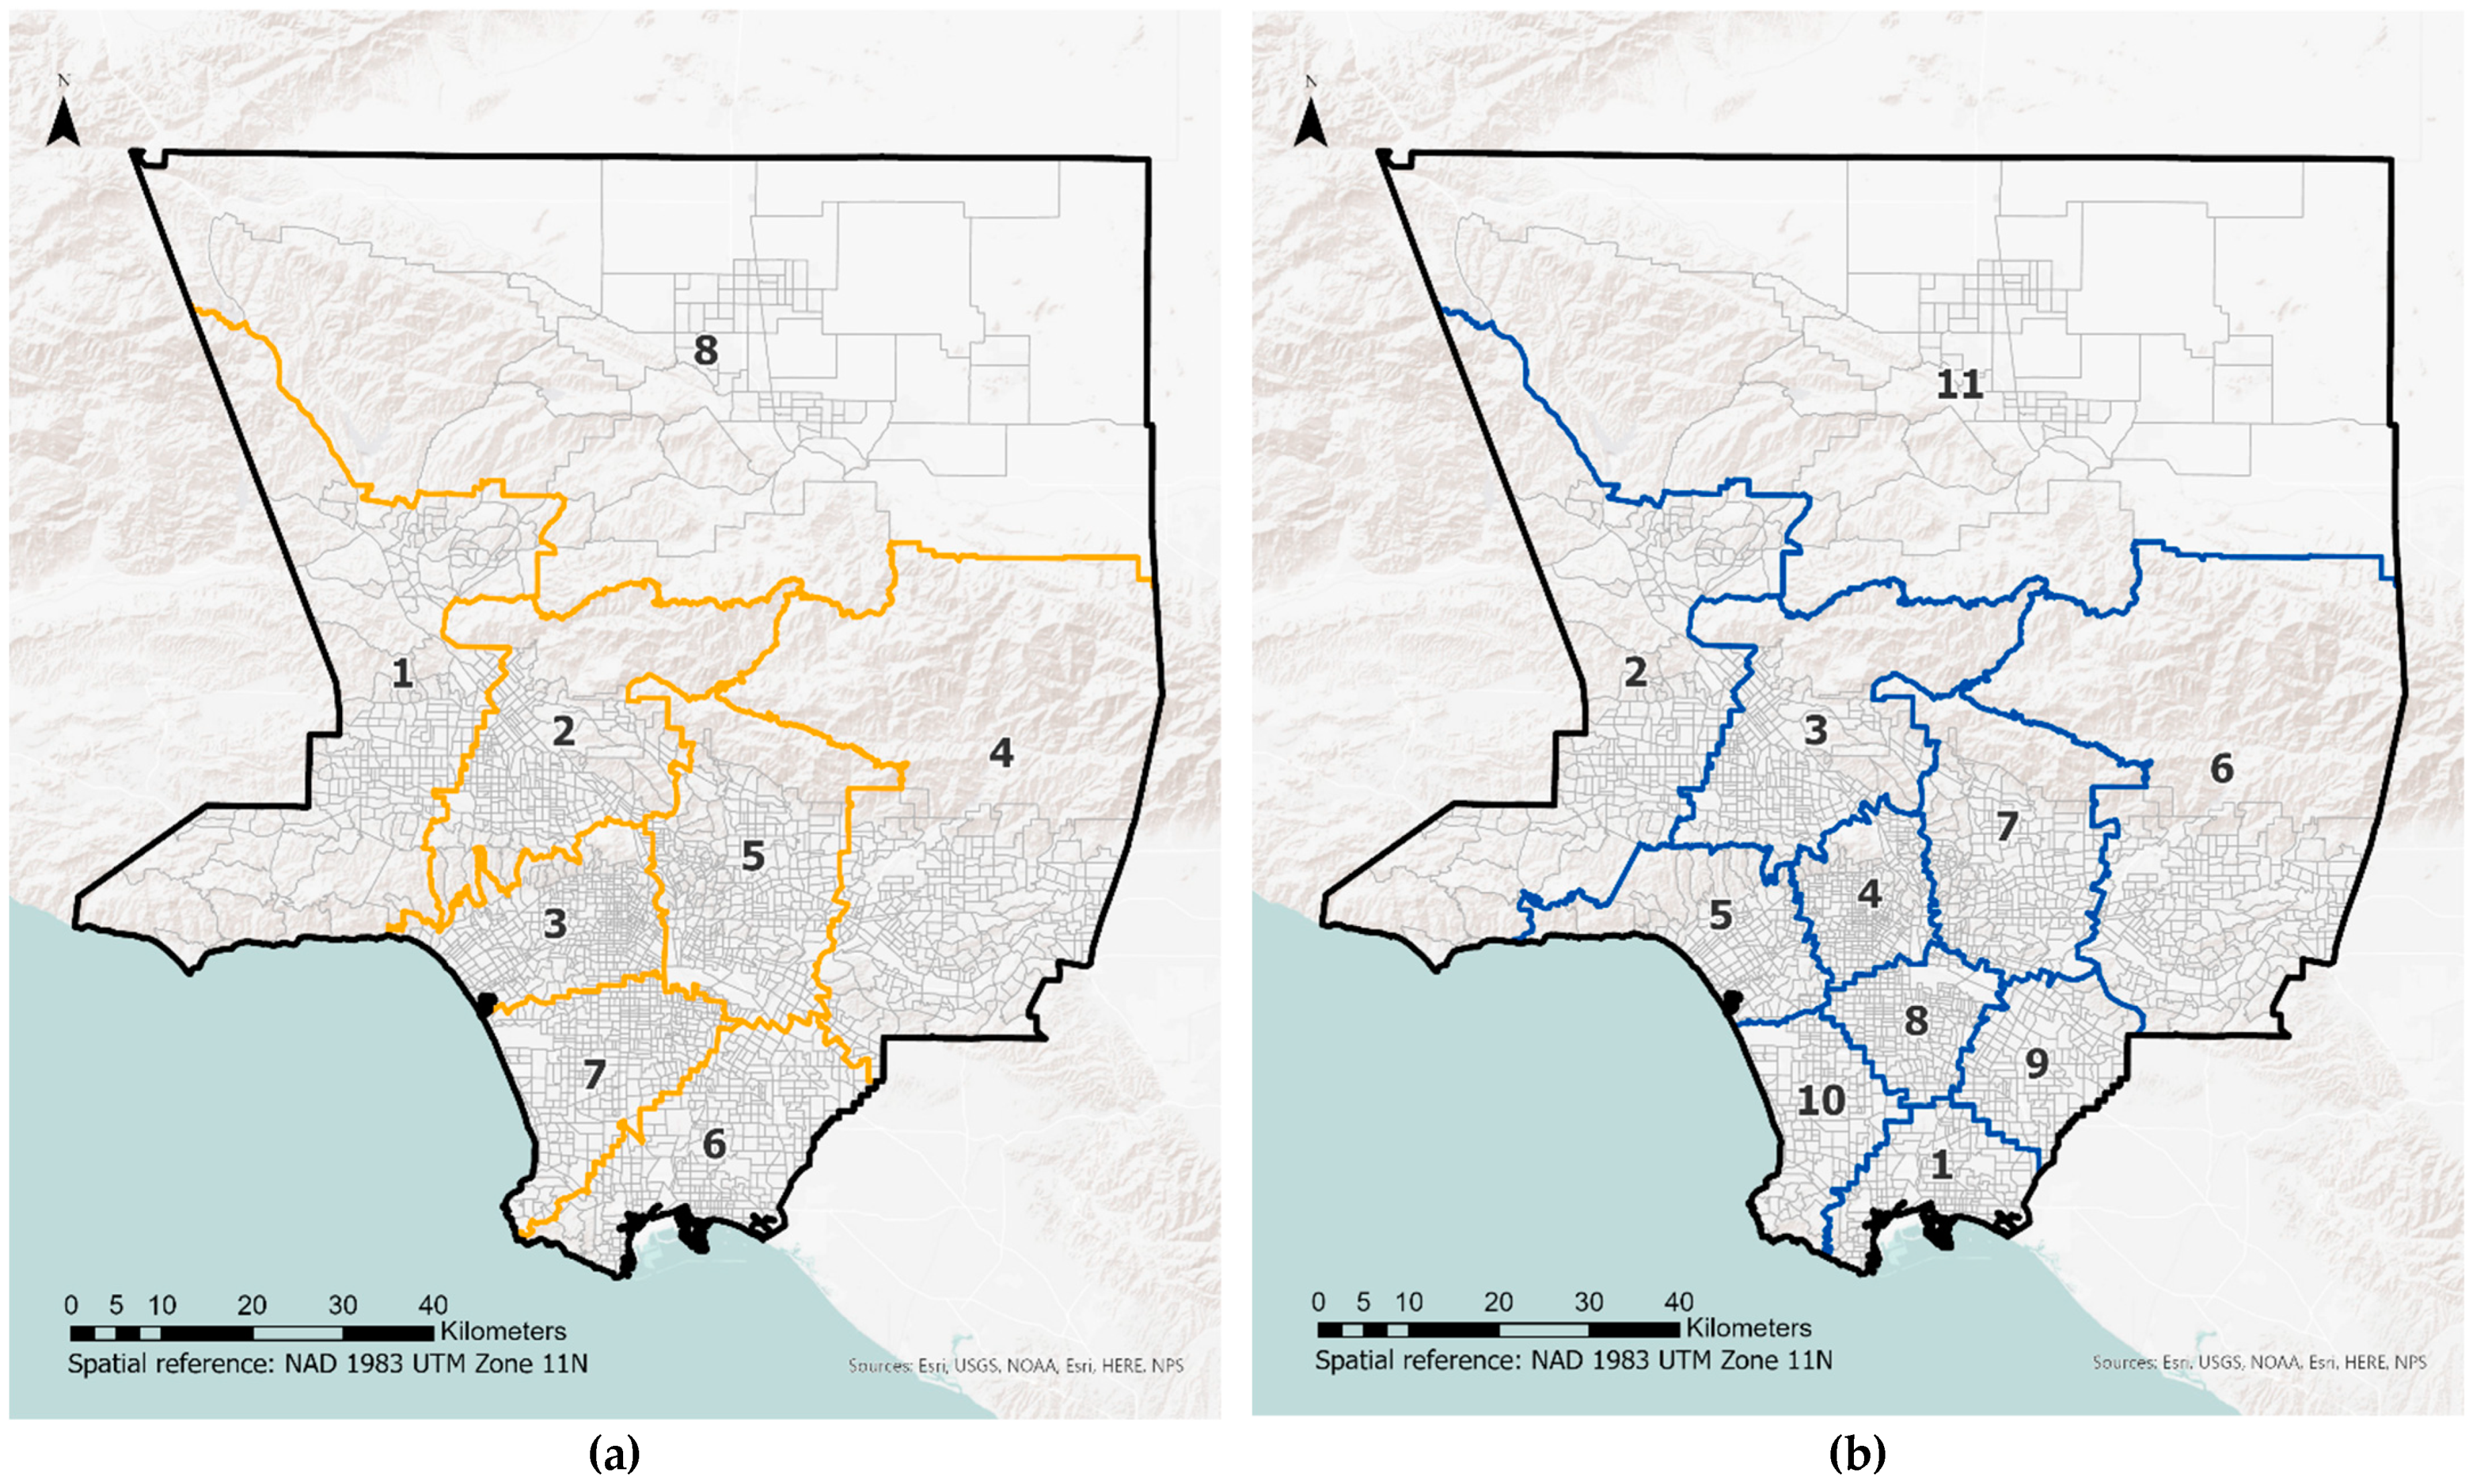
3.2. Delineating Earthquake Relief Zones

The partition of earthquake relief zones with equal access is defined as the optimization of the p-median problem. Teitz and Bart’s heuristic [30] was chosen to equalize the standardized population and suitability scores at the census tract level. The TZ-Bart algorithm is given in Algorithm 1:
Algorithm 1: TZ-Bart
Input :
N: Number of zones
X: Spatial data
Output:
Z: Zones
Z o   ~   T ( X ,   N ) Sample N contiguous zones with a process T (can be random)
Z * = Z o   Set current zone to initial zones
w h i l e   o b j ( Z * ) > ε If zones are not optimal, repeat
X i ~ X Sample a location
Z k ˜ = X i Assign zone center for the kth zone to X i
Z * = Z * \ Z * k Z k ˜ Update the zone map
The optimal solution is selected from all of the searched solutions to achieve the goal of equitable access to relief zones. We use the mean absolute deviation (MAD) and standard deviation between zones as the objective functions. These metrics are provided in Equations (5) and (6):
1.
Mean Absolute Deviation (MAD)
| x i u | N
2.
Standard Deviation (SD)
( x i u ) 2 N
where x i is the mean of the standardized variable of the census tract, u is the mean of the standardized value of zones, and N is the number of zones.
The suitability scores that were obtained from two scenarios were averaged in each census tract and aggregated to census tract polygons with spatial join tool in ArcGIS Pro. The mean suitability score and population values were standardized to the average and standard deviation.

3.3. Comparing Earthquake Relief Zones via Spatial Association
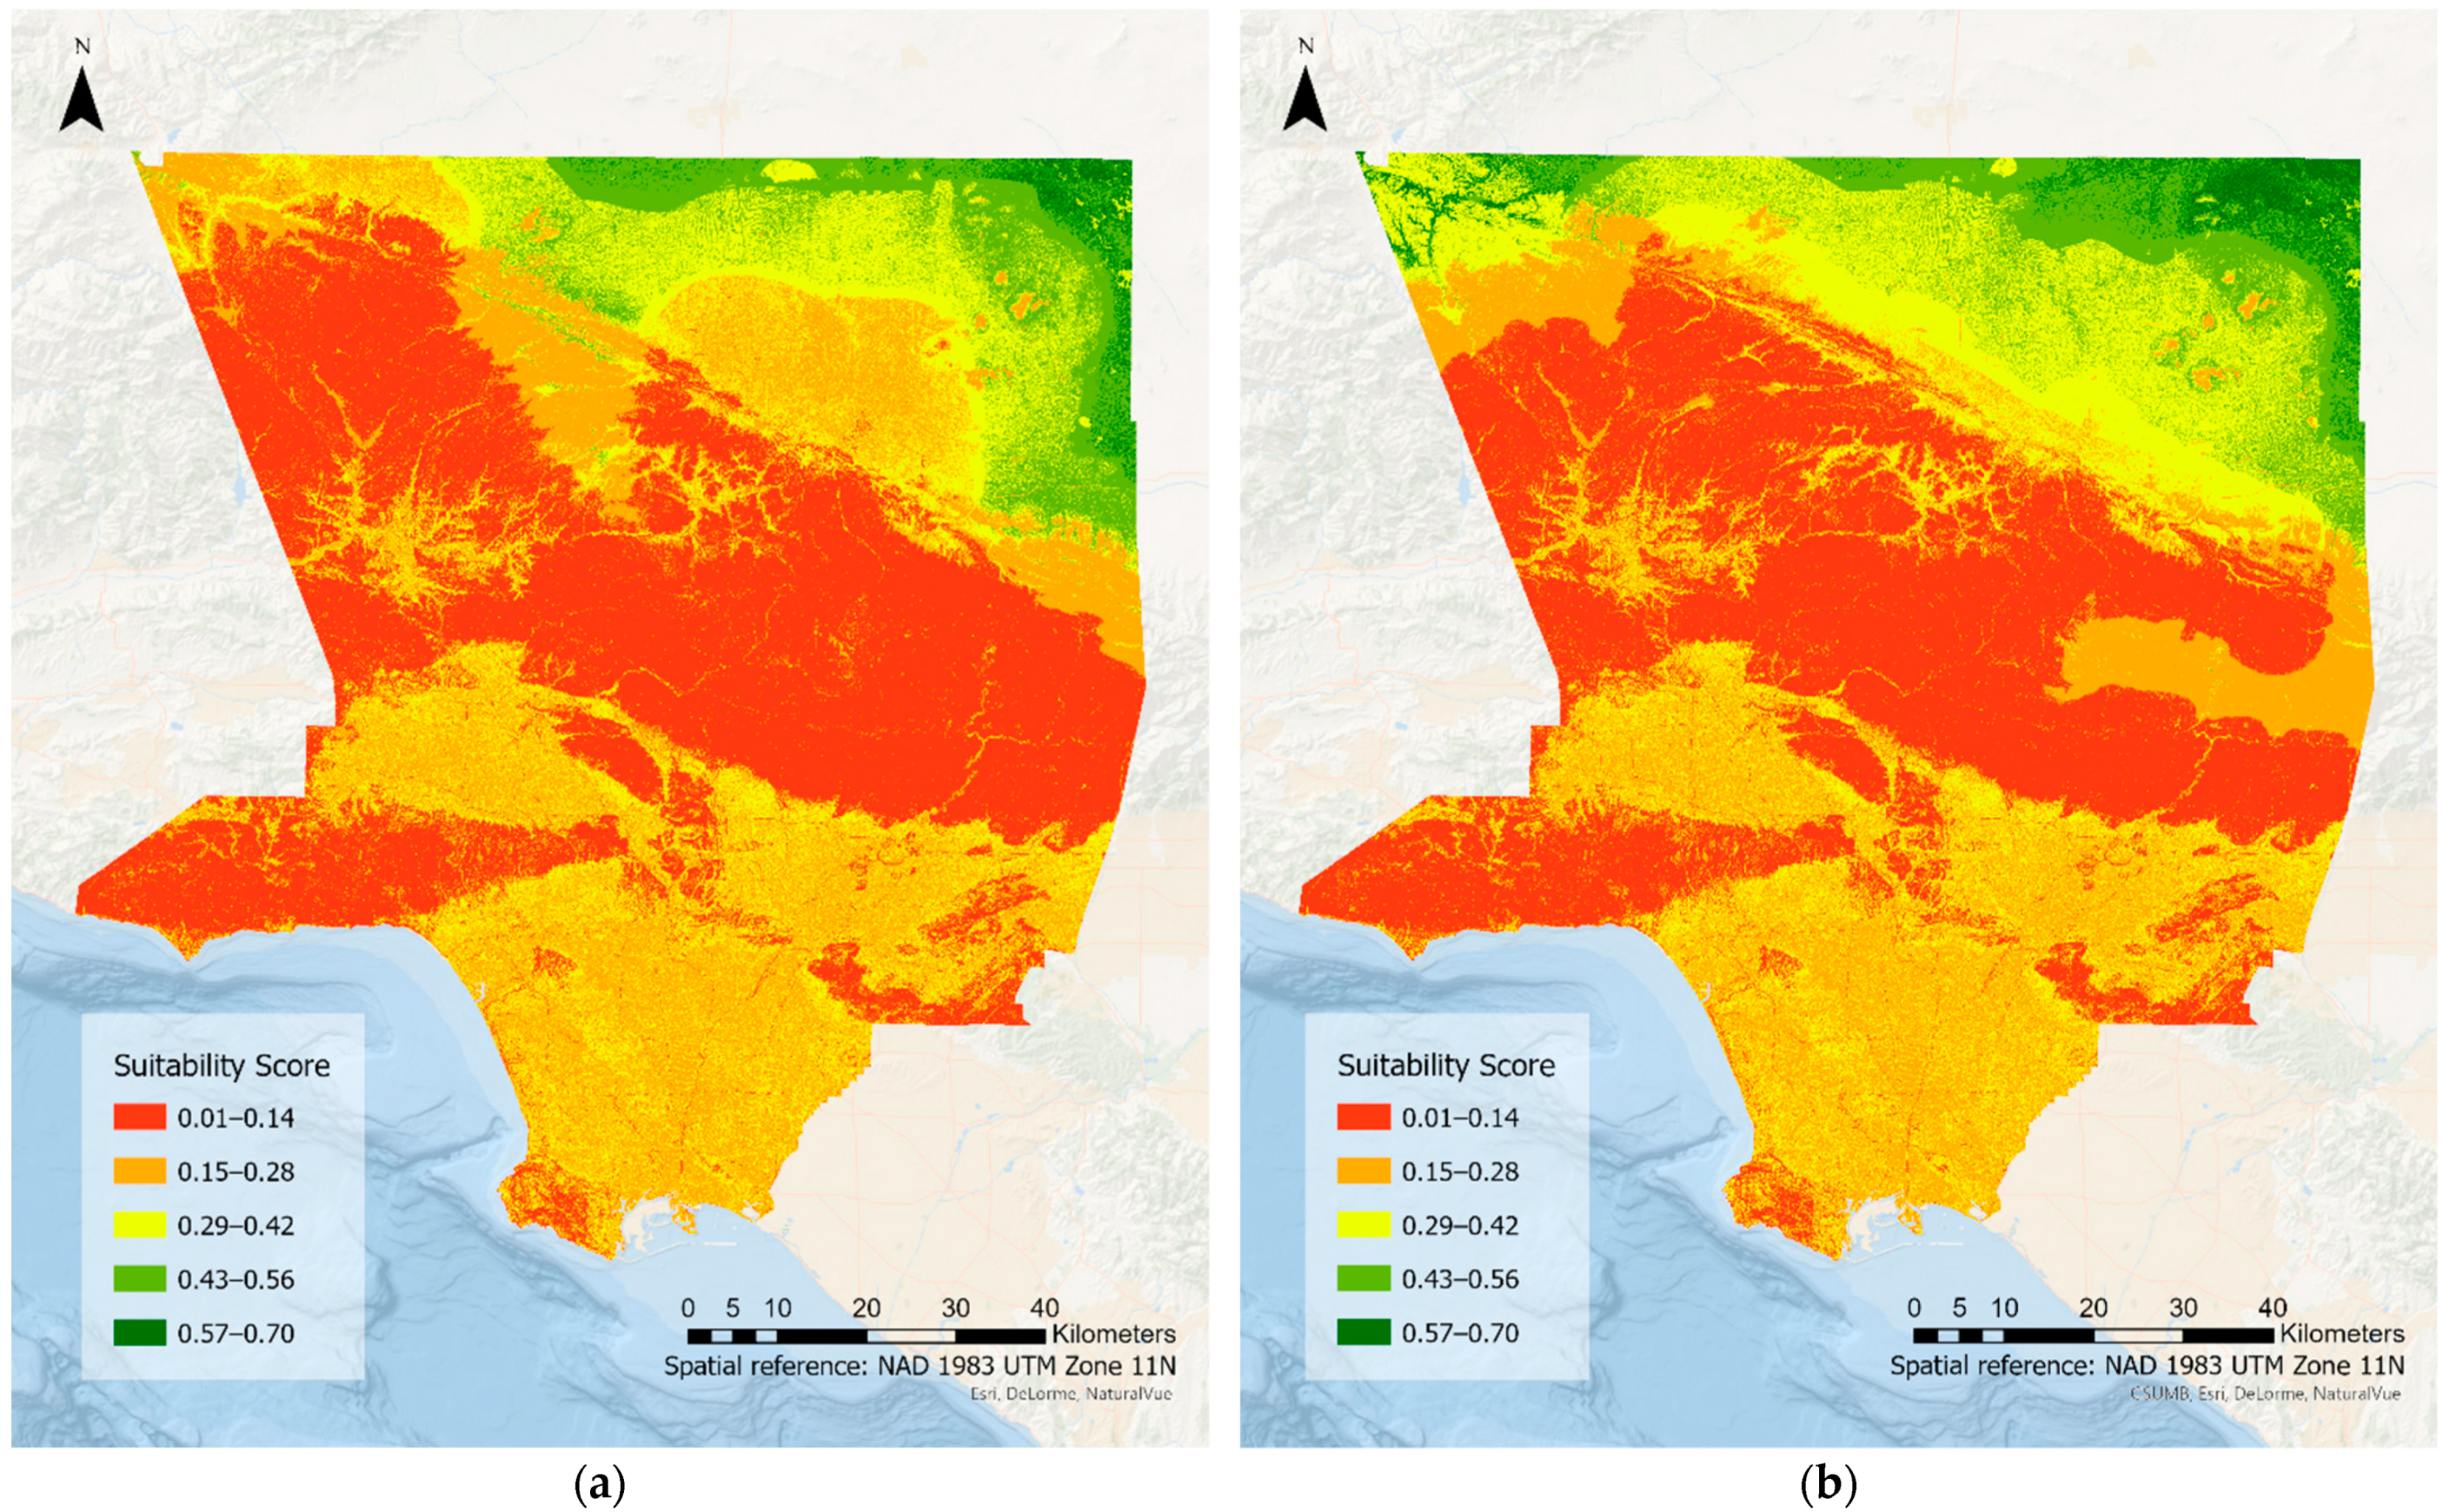
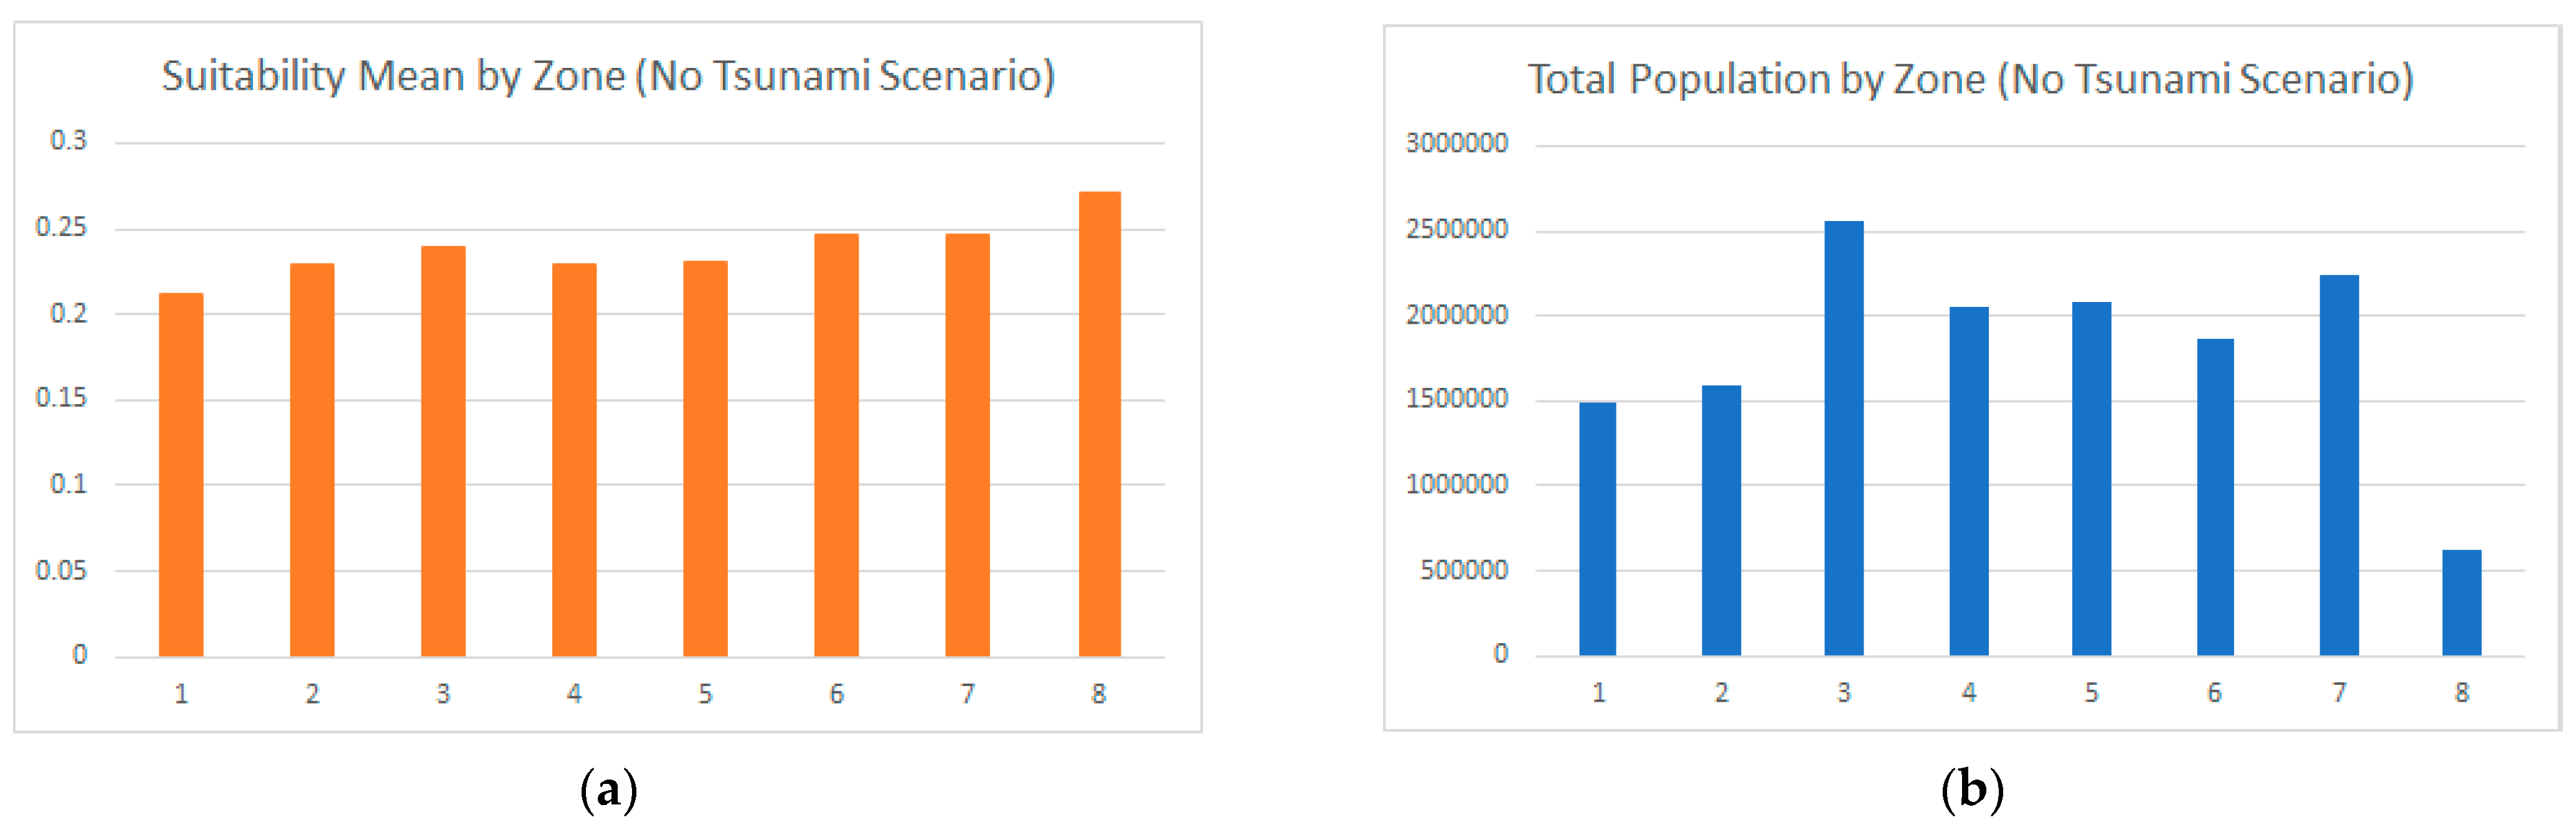
The spatial similarities and differences between relief zones for tsunami and no-tsunami cases are quantified with the V-measure. We use similar terminology to Nowosad and Stepinski [31] to define the V-measure in Equation (7):
V = 2 h c h + c
where h is homogeneity between two zone maps and c is the measure of completeness. A V-measure of 1 means a perfect spatial association between two maps and 0 represents no spatial association.
Homogeneity measure is defined in Equation (8):
h = 1 i = 1 N 1 A i ( 1 ) A E i ( 2 ) E ( 2 )
where N 1 is the number of zones of no tsunami scenario, A i ( 1 ) is the area of zone i in the zone map of no tsunami scenario, A is the size of the study area, E i ( 2 ) is the variation in zone i in the zone map of tsunami scenario, and E ( 2 ) is the variation between all the zones in the zone map of the tsunami scenario. Different methods for computing variation exist, here the variation is quantified with the Shannon Entropy. A homogeneity of zero implies perfect similarity between two zone maps, and homogeneity of one implies the two zone maps being completely different.
Completeness measures the similarity of the zone map in no tsunami scenario with respect to map in tsunami scenario. This measure is defined in Equation (9):
c = 1 i = 1 N 2 A i ( 2 ) A E i ( 1 ) E ( 1 )
The value of the metrics ranges from 0 to 1 and a larger value indicates better homogeneity.

4. Results

The range of earthquake shelter suitability in both scenarios is divided into the same five classes with equal intervals in ArcGIS Pro for easier comparison. The scores from low to high are represented by red, orange, yellow, light green, and dark green. A high suitability score suggests that the location is preferable for earthquake shelters. Figure 3 juxtaposes shelter suitability maps for both scenarios.
The maps reveal that the north-east corners have relatively high suitability, while the west tip and the middle part of the county appear to be the least suitable places for shelters in both scenarios. There is not much shelter suitability difference observed in the bottom half of the two maps, especially along the coast. The distribution of shelter suitability appears to be very distinct in the north-west of the county and the east of the San Gabriel Mountains.
The partition results from Teitz and Bart’s algorithm are summarized as mean absolute deviation (MAD) and standard deviation (SD) for each zone. Figure 4 shows the mean absolute deviation (MAD) and standard deviation (SD) for the number of zones from 2 to 30.
Defining the number of optimal zones has a trivial solution. It is more probable to find an equal division of data for two zones to balance the availability of land that is suitable for shelters and the capacity of the population served in each zone. Here, we define the largest number of zones with a low standard deviation of suitability between zones to ensure an equal allocation of population and suitability to relief zones. Therefore, eight and eleven are selected to be the optimal number of relief zones for no tsunami scenario and tsunami scenario. Figure 5 depicts the map of optimal relief zones defined for two scenarios.
No significant differences in the east and north inland area exist between the two scenarios. We observe the number of relief zones close to the coast and Downtown LA between the two scenarios is different. In the tsunami scenario, the southern half of the county tends to be divided into smaller relief zones. Regions that are closer to coast areas exhibit substantial changes, due to population shifts and subtle changes in the suitability scores.
The resulting distribution of suitability mean and total population per zone of two scenarios is depicted below:
Suitability means between zones in both scenarios are almost equally allocated, with the northern section of LA County (Zone 8 in Figure 6a and Zone 11 in Figure 7a), being slightly above the mean of all other zones. Distinct clusters of high population in LA County result in an uneven distribution of population for one zone (Zone 8) in earthquake relief zones (Figure 6b) and two zones (Zones 1 and 11) in the earthquake and tsunami relief zones (Figure 7b).
The overall similarity between relief zones for both of the scenarios are compared with the spatial V-measure. A V-measure of 0.89 indicates two relief zone maps are highly associated. The local differences between relief zones are depicted in Figure 8. Blue indicates low inhomogeneities (high degree of similarity), while yellow stands for high inhomogeneities (low degree of similarity) between two scenarios.
The maps of regions’ inhomogeneity indicate that the tsunami has the least influence on the relief zone planning in the north (dark blue) and the most significant impacts on the zones in the south of LA County (yellow). The major difference between the two maps is that four zones (Zone 3, 5, 6, and 7 in Figure 8a) are divided into seven smaller regions in the tsunami scenario (Figure 8b).

5. Discussions

Tsunamis in Southern California are infrequent events that can impose substantial changes to relief plans in the case of an earthquake. Ruling out the possibility of a tsunami and making plans accordingly can result in a large portion of the LA population not being served. Data-driven methods are crucial in combining multidisciplinary data to reflect demographic and natural drivers to this problem.
LA County faces unique earthquake risks due to its long coastline, high population density, a dense network of terrestrial faults, and being susceptible to tsunamis from distal and near field sources. Tsunamis in California are perceived as an unlikely extreme event due to their low frequency; however, our analysis shows that a tsunami can change relief plans considerably. An unexpected result is the extent to which a tsunami can alter relief zones in LA County. Mapped inundation zones that extend a maximum of 3200 m inland from the coast can change relief zones as inland as 160 km due to displaced population, and the inability to setup relief zones near inundation zones. We observe the substantial difference between relief zone maps between a tsunami and a no-tsunami scenario to be in the outskirts of Downtown LA, one of the most densely populated sections of the county. This points to the importance of having plans that include tsunamis in LA County, as a lack of planning can result in millions of people not having access to relief services required after an earthquake event.
Our suitability analysis shows San Gabriel Mountain Range to be a natural barrier to extending coastal relief zones. This poses considerable uncertainty in relief zone planning during an earthquake event that originated from the San Andreas Fault network. For tsunami relief, it limits the total service area for the population that is impacted by the tsunami.
We presented the first workflow that assesses the impact of a tsunami on earthquake relief planning. Our current analysis takes a purely spatial approach to the problem and models it as a resource allocation problem under different loadings, such as suitability and population. It is worth noting that an area, such as LA, with a high number of commuters and tourist attractions, makes time another important aspect of the allocation problem. A large number of census tracts in LA County have different daytime and nighttime population due to the large commuter population. Thus, the time aspect of variables that impact the relief zones is another important direction to study.

6. Conclusions

In this paper, we present a workflow that quantifies the impact of a tsunami on data-driven relief zones. Our results indicate that a tsunami alters relief plans considerably in LA County. The displaced population due to a tsunami is the main driver for this difference. The workflow that is presented in this paper proposes a generalizable workflow that can incorporate different covariates into relief zone planning.
We address an important shortcoming of resource allocation workflows, the number of optimal zones for resource allocation. For a given resource allocation algorithm, our results indicate the differing quality of modeled relief zones. In this work, we define the mean average deviation between population and suitability as the main metrics for selecting the optimal number of regions. We acknowledge that different design considerations will require different objective functions when defining the relief zones.

Author Contributions

Conceptualization, O.A. and Y.G.; methodology, O.A., and Y.G.; software, O.A. and Y.G.; formal analysis, O.A., Y.G.; investigation, O.A., and Y.G.; resources, O.A., Y.G. and J.S.; data curation, O.A., Y.G. and J.S.; writing—original draft preparation, O.A., and Y.G.; visualization, O.A., and Y.G.; supervision, O.A.; project administration, O.A. All authors have read and agreed to the published version of the manuscript.

Funding

This research received no external funding.

Institutional Review Board Statement

Excluded since the study did not involve humans or animals.

Informed Consent Statement

Not applicable.

Data Availability Statement

The data presented in this study are available on request from the corresponding author.

Conflicts of Interest

The authors declare no conflict of interest.

Abbreviations

SymbolDescription
A Size of study area
A i Area of zone i
a, bFuzzy cost function multipliers
E Variation between all zones
E i Variation at zone i
C i Raster value of criteria i
c Completeness
f1Fuzzy near function spread
f2Fuzzy near function midpoint
h Homogeneity between zone maps of two scenarios
mMean
NNumber of the zones
n Number of criteria
sStandard deviation
u Standardized mean of variable between zones
W i Importance weight of criteria i
X i Spatial data at sample location
x i Mean value of the standardized variable at census tract i
μ ( x ) Fuzzy membership probability

References

  1. Rose, A.; Sue Wing, I.; Wei, D.; Wein, A. Economic impacts of a California tsunami. Nat. Hazards Rev. 2016, 17, 04016002. [Google Scholar] [CrossRef] [Green Version]
  2. Allen, C.R.; St Amand, P.; Richter, C.F.; Nordquist, J.M. Relationship between seismicity and geologic structure in the Southern California region. Bull. Seismol. Soc. Am. 1965, 55, 753–797. [Google Scholar]
  3. Uslu, B.; Borrero, J.C.; Dengler, L.A.; Synolakis, C.E. Tsunami inundation at Crescent City, California generated by earthquakes along the Cascadia Subduction Zone. Geophys. Res. Lett. 2007, 34. [Google Scholar] [CrossRef]
  4. Wilson, R.I.; Admire, A.R.; Borrero, J.C.; Dengler, L.A.; Legg, M.R.; Lynett, P.; McCrink, T.P.; Miller, K.M.; Ritchie, A.; Sterling, K.; et al. Observations and impacts from the 2010 Chilean and 2011 Japanese tsunamis in California (USA). Pure Appl. Geophys. 2013, 170, 1127–1147. [Google Scholar] [CrossRef]
  5. Borrero, J.C.; Legg, M.R.; Synolakis, C.E. Tsunami sources in the southern California bight. Geophys. Res. Lett. 2004, 31. [Google Scholar] [CrossRef]
  6. Dengler, L.A.; Magoon, O. The 1964 tsunami in Crescent City, California: A 40-year retrospective. In Solutions to Coastal Disasters; ASCE: Reston, VA, USA, 2005; pp. 639–648. [Google Scholar]
  7. Hall, J.F.; Holmes, W.T.; Somers, P. Northridge Earthquake, January 17, 1994; Preliminary Reconnaissance Report; Earthquake Engineering Research Institude: Oakland, CA, USA, 1994. [Google Scholar]
  8. Yang, F.; Yuan, Q.; Du, S.; Liang, L. Reserving relief supplies for earthquake: A multi-attribute decision making of China Red Cross. Ann. Oper. Res. 2016, 247, 759–785. [Google Scholar] [CrossRef]
  9. Fiedrich, F.; Gehbauer, F.; Rickers, U. Optimized resource allocation for emergency response after earthquake disasters. Saf. Sci. 2000, 35, 41–57. [Google Scholar] [CrossRef]
  10. Bolin, R.; Stanford, L. Shelter, housing and recovery: A comparison of US disasters. Disasters 1991, 15, 24–34. [Google Scholar] [CrossRef] [PubMed]
  11. Rose, A.; Benavides, J.; Chang, S.E.; Szczesniak, P.; Lim, D. The regional economic impact of an earthquake: Direct and indirect effects of electricity lifeline disruptions. J. Reg. Sci. 1997, 37, 437–458. [Google Scholar] [CrossRef]
  12. Dalziell, E.; Nicholson, A. Risk and impact of natural hazards on a road network. J. Transp. Eng. 2001, 127, 159–166. [Google Scholar] [CrossRef]
  13. Horner, M.W.; Downs, J.A. Optimizing hurricane disaster relief goods distribution: Model development and application with respect to planning strategies. Disasters 2010, 34, 821–844. [Google Scholar] [CrossRef]
  14. Sabouhi, F.; Tavakoli, Z.S.; Bozorgi-Amiri, A.; Sheu, J.B. A robust possibilistic programming multi-objective model for locating transfer points and shelters in disaster relief. Transp. A Transp. Sci. 2019, 15, 326–353. [Google Scholar] [CrossRef]
  15. Anhorn, J.; Khazai, B. Open space suitability analysis for emergency shelter after an earthquake. Nat. Hazards Earth Syst. Sci. 2015, 15, 789–803. [Google Scholar] [CrossRef] [Green Version]
  16. Chu, J.; Su, Y. The application of TOPSIS method in selecting fixed seismic shelter for evacuation in cities. Syst. Eng. Procedia 2012, 3, 391–397. [Google Scholar] [CrossRef] [Green Version]
  17. Geng, S.; Hou, H.; Zhang, S. Multi-Criteria Location Model of Emergency Shelters in Humanitarian Logistics. Sustainability 2020, 12, 1759. [Google Scholar] [CrossRef] [Green Version]
  18. Xu, J.; Yin, X.; Chen, D.; An, J.; Nie, G. Multi-criteria location model of earthquake evacuation shelters to aid in urban planning. Int. J. Disaster Risk Reduct. 2016, 20, 51–62. [Google Scholar] [CrossRef]
  19. Kılcı, F.; Kara, B.Y.; Bozkaya, B. Locating temporary shelter areas after an earthquake: A case for Turkey. Eur. J. Oper. Res. 2015, 243, 323–332. [Google Scholar] [CrossRef]
  20. Zhao, L.; Li, H.; Sun, Y.; Huang, R.; Hu, Q.; Wang, J.; Gao, F. Planning emergency shelters for urban disaster resilience: An integrated location-allocation modeling approach. Sustainability 2017, 9, 2098. [Google Scholar] [CrossRef] [Green Version]
  21. Khazai, B.; Daniell, J.E.; Franchin, P.; Cavalieri, F.; Vangelsten, B.V.; Lervolino, L.; Esposito, S. A new approach to modeling post-earthquake shelter demand: Integrating social vulnerability in systemic seismic vulnerability analysis. In Proceedings of the 15th World Conference on Earthquake Engineering, Lisbon, Portugal, 24–28 September 2012; pp. 2105–2115. [Google Scholar]
  22. Aldika, W.A. WEBGIS Application for Planning the Tsunami Evacuation Route. IOP Conf. Ser. Earth Environ. Sci. 2019, 273, 012051. [Google Scholar] [CrossRef]
  23. Dijkstra, E.W. A note on two problems in connexion with graphs. Numer. Math. 1959, 1, 269–271. [Google Scholar] [CrossRef] [Green Version]
  24. Lin, Y.H.; Batta, R.; Rogerson, P.A.; Blatt, A.; Flanigan, M. Location of temporary depots to facilitate relief operations after an earthquake. Socio-Econ. Plan. Sci. 2012, 46, 112–123. [Google Scholar] [CrossRef]
  25. Nelson, A.C.; French, S.P. Plan quality and mitigating damage from natural disasters: A case study of the Northridge earthquake with planning policy considerations. J. Am. Plan. Assoc. 2002, 68, 194–207. [Google Scholar] [CrossRef]
  26. Ryan, K.J.; Geist, E.L.; Barall, M.; Oglesby, D.D. Dynamic models of an earthquake and tsunami offshore Ventura, California. Geophys. Res. Lett. 2015, 42, 6599–6606. [Google Scholar] [CrossRef]
  27. Ryan, H.F.; von Huene, R.E.; Wells, R.E.; Scholl, D.W.; Kirby, S.; Draut, A.E. History of Earthquakes and Tsunamis along the Eastern Aleutian-Alaska Megathrust, with Implications for Tsunami Hazards in the California Continental Borderland; No. 1795-A; US Geological Survey: Reston, VA, USA, 2012; pp. i–31.
  28. Field, E.H. UCERF3: A New Earthquake Forecast for California’s Complex Fault System (No. 2015-3009); US Geological Survey: Reston, VA, USA, 2015.
  29. Tai, C.A.; Lee, Y.L.; Lin, C.Y. Urban disaster prevention shelter location and evacuation behavior analysis. J. Asian Archit. Build. Eng. 2010, 9, 215–220. [Google Scholar] [CrossRef]
  30. Teitz, M.B.; Bart, P. Heuristic methods for estimating the generalized vertex median of a weighted graph. Oper. Res. 1968, 16, 955–961. [Google Scholar] [CrossRef]
  31. Nowosad, J.; Stepinski, T.F. Spatial association between regionalizations using the information-theoretical V-measure. Int. J. Geogr. Inf. Sci. 2018, 32, 2386–2401. [Google Scholar] [CrossRef] [Green Version]
Figure 1. Los Angeles County census tracts and boundaries.
Geosciences 11 00099 g001
Figure 2. Suitability Model.
Geosciences 11 00099 g002
Figure 3. Earthquake shelter suitability raster for Los Angeles County (a) in no tsunami scenario and (b) tsunami scenario.
Geosciences 11 00099 g003
Figure 4. Zone statistics of standardized population and suitability of (a) no tsunami scenario and (b) tsunami scenario.
Geosciences 11 00099 g004
Figure 5. Earthquake relief zones in (a) No Tsunami Scenario and (b) Tsunami Scenario.
Geosciences 11 00099 g005
Figure 6. (a) Suitability Mean and (b) Total population by Zone in No Tsunami Scenario.
Geosciences 11 00099 g006
Figure 7. (a) Suitability Mean and (b) Total population by Zone in Tsunami Scenario.
Geosciences 11 00099 g007
Figure 8. (a) Relief zones in no tsunami scenario and region’s inhomogeneities compared to relief zones in tsunami scenario and (b) relief zones in tsunami scenario and region’s inhomogeneities compared to relief zone in no tsunami scenario.
Geosciences 11 00099 g008
Table 1. Data Source.
Dataset NameData TypeData SourceSpatial Reference
Road Network Dataset Of LA CountyShapefileUCLA Institute for Digital Research and Education Via UCLA GeoportalNAD 1983 UTM Zone 11N
LandslideFeature Class (Polygon)LA County GIS HubWGS 84
LiquefactionFeature Class (Polygon)LA County GIS HubWGS 84
SlopeRasterUSGS 1/3rd arc-second Digital Elevation Models DEMsNAD 83
Tsunami InundationFeature Class (Polyline)LA County GIS Hub WGS 84
FaultskmzThird Uniform California Earthquake Rupture Forecast (UCERF3)WGS 84
HospitalsFeature Class (Point)LA County GIS HubWGS 84
Fire Department Feature Class (Point)LA County GIS HubWGS 84
Police Sheriff and Police StationsFeature Class (Point)LA County GIS HubWGS 84
PopulationFeature Class (Polygon)2019 American Community Survey Annual Census InformationNAD 1983 UTM Zone 11N
Table 2. Fuzzy functions and overlay weights in the suitability models.
CategoryDataFuzzy MembershipWeight
Distance to Evacuation RouteStreetFuzzy MS Small with a mean multiplier of 1, a standard multiplier deviation of 1, and a Hedge of None0.038
Distance to Important ServiceFire DepartmentFuzzy MS Small with a mean multiplier of 1, a standard multiplier deviation of 1, and a Hedge of None0.007
Police StationFuzzy MS Small with a mean multiplier of 1, a standard multiplier deviation of 1, and a Hedge of None0.007
Distance to First AidMedical and Health Care CenterFuzzy MS Small with a mean multiplier of 1, a standard multiplier deviation of 1, and a Hedge of None0.012
Distance to Secondary HazardsLandslideFuzzy MS Large with a mean multiplier of 1, a standard multiplier deviation of 1, and a Hedge of Very0.164
LiquefactionFuzzy MS Large with a mean multiplier of 1, a standard multiplier deviation of 1, and a Hedge of Very0.164
Topographic LocationSlopeFuzzy Near with a midpoint of 3, a spread of 0.1, and a Hedge of None0.258
Distance to Natural DisastersNo Tsunami Scenario:
Fault 1500-m Buffer
Fuzzy MS Large with a mean multiplier of 1, a standard multiplier deviation of 0.1, and a Hedge of Very0.408
Tsunami Scenario:
Tsunami Inundation 3200-m Buffer
Publisher’s Note: MDPI stays neutral with regard to jurisdictional claims in published maps and institutional affiliations.

