Article

Advanced Methods of Thermal Petrophysics as a Means to Reduce Uncertainties during Thermal EOR Modeling of Unconventional Reservoirs

1
Center for Hydrocarbon Recovery, Skolkovo Institute of Science and Technology, 3 Nobel Str., 143026 Moscow, Russia
2
LLC SamaraNIPIneft, 18 Vilonovskaya Str., 443010 Samara, Russia
*
Author to whom correspondence should be addressed.
Submission received: 5 March 2021 / Revised: 21 April 2021 / Accepted: 22 April 2021 / Published: 7 May 2021
(This article belongs to the Special Issue Petrophysics and Geochemistry of Unconventional Reservoirs)

Abstract

:
Within the vast category of unconventional resources, heavy oils play an essential role as related resources are abundant throughout the world and the amount of oil produced using thermal methods is significant. Simulators for thermo–hydro–dynamic modeling, as a mandatory tool in oilfield development, are continuously improving. However, the present paper shows that software capabilities for the integration of data on the rock thermal properties necessary for modeling are limited, outdated in some aspects, and require revision. In this paper, it is demonstrated that a characteristic lack of reliable data on rock thermal properties also leads to significant errors in the parameters characterizing oil recovery efficiency. A set of advanced methods and equipment for obtaining reliable data on thermal properties is presented, and a new, vast set of experimental data on formation thermal properties obtained from the Karabikulovskoye heavy oil field (Russia) is described. The time-dependent results of modeling oil recovery at the field segment using the steam-assisted gravity drainage method with both published and new data are discussed. It is shown that the lack of experimental data leads to significant errors in the evaluation of the cumulative oil production (up to 20%) and the cumulative steam/oil ratio (up to 52%).

1. Introduction

Modern thermal petrophysics comprises a complete set of methods that provide significant support for the prospecting, exploration and production of hydrocarbons, related to the need for improvements in studying the heterogeneity and anisotropy of rocks in well sections, studying the processes of heat and mass transfer in reservoirs, studying geochemical characteristics, and obtaining reliable data on the thermal regime of the studied formations [1,2,3,4]. The application of thermal petrophysics methods in modeling thermal methods for enhanced oil recovery (EOR) is highly relevant. First, the oil viscosity and the relative phase permeability of water and oil (see, e.g., [5,6]) are strongly dependent on temperature. The effective use of heat injected or generated in the reservoir determines the economic feasibility of selecting the production technology and the number, optimal location, and the operating mode of wells. The distribution of heat in the reservoir and its resulting temperature are, in turn, determined by its thermal properties—namely, thermal conductivity and volumetric heat capacity—which are among the fundamental physical properties of rocks. Second, the number of oil production projects and the amount of oil produced using thermal methods are significant. By 2010, thermal production accounted for approximately 67% of daily oil production using all EOR methods [7]; by 2014, it accounted for approximately 59% [8]. The number of projects was approximately equal to 30% of the total number of EOR projects and changed slightly over time between 2006 and 2017 inclusive, according to McGlade et al. [9].
However, until recently, obtaining reliable data on sedimentary rock thermal properties was a fairly serious problem for several reasons, which are described in [1,10]. Typically, the final errors when experimentally determining thermal conductivity reach 50–110%, and the volume heat capacity reaches 40–75% [1,11]. It is not surprising that previous data on the thermal properties of sedimentary rock obtained by traditional methods often require serious revision, and existing reference books and databases are not reliable enough [1,4,11]. The lack of strict quality control of the experimental data on thermal petrophysics led to an erroneous understanding of the ranges of spatio–temporal variations in thermal properties, which apparently affected the methods for setting the thermal properties in modern thermo–hydrodynamic (THD) simulators. Our analysis of the capabilities of the corresponding commercial software (STARS of Computer Modeling Group, Eclipse of Schlumberger, PumaFlow of Beicip-Franlab, TempestMORE of ROXAR Software Solutions, tNavigator of Rock Flow Dynamics, VIP/Nexus of Halliburton Landmark, etc.) shows that no significant improvements have been made in the correct assignment and use of experimental data on thermal properties for many years, and the software significantly lags behind the current level of thermal petrophysics development.
Signals of the significant effects of uncertainty in thermal properties data upon simulation results rarely appear in the literature [1,12,13,14,15] and are typically not without drawbacks, in addition to most not available to a wide range of specialists. However, even for these individual works, it is clear that errors in the initial data on thermal properties lead to errors in estimating heating costs by tens of percent, assessing the risks with overburden integrity violations, and predicting temperature. As a result, there are serious errors in the evaluation of oil viscosity, in the evaluation of oil mobility, and, as a result, errors of tens of percent with calculated production volumes and recovery factors (see details in [1,12,13,14,15] and in Section 2.2).
This paper aims to summarize the long-term (1983–2020) history of (1) investigations of the thermal properties of reservoir rocks, surrounding rocks, and reservoir fluids under atmospheric and reservoir conditions; (2) thermal property data interpretation; (3) the integration of experimental data into hydrodynamic models; and (4) assessment of the impacts permitted by the uncertainties in thermal properties on the results of THD modeling. In practice, in the vast majority of cases, there is an underestimation of the existing uncertainty in data on the thermal properties used (including the uncertainty caused by simulator features) and an underestimation of the impact of this uncertainty upon key development parameters (see, e.g., [1]). To reduce this uncertainty when working with a specific development object, it is necessary to conduct a set of measurements with samples of this object and to adapt the data obtained to the specific requirements of the existing simulator. In this regard, the objectives of this paper are two-fold. First, it seeks to inform specialists on the current level of developments in thermal petrophysics, providing the results of applying the appropriate hardware and methodological base to a specific object—the Karabikulovskoye high-viscosity oil field—and demonstrating the consequences of such an application. Secondly, it seeks to consider the problems when applying experimental data on thermal properties in the model, with a demonstration of the need to improve the corresponding options of THD simulators.

2. Consequences of the Growing Gap between Advances in Thermal Petrophysics and THD Modeling

The active development and application of new hardware and methodological sets [2,3] have provided a radical improvement in the quality and volume of experimental studies on sedimentary rock thermal properties and the elimination of shortcomings characteristic of previously used traditional measuring means. However, the analysis of possibilities in the widely applied THD simulations shows that their ability to correctly assign and use experimental data on the thermal properties of rocks and pore fluids is limited and has not been practically improved for many years, as described below.

2.1. Features of Integration of Data on Thermal Properties into THD Simulators

When modeling production, the effective (bulk) thermal properties of each design element of the model may change over time due to changes in the temperature, porosity, pore fluid, and pressure. To account for the changes, all simulators have built-in so-called “mixing rules”—theoretical models (one or more variants) for calculating effective thermal properties based on the values of the thermal properties of components and their volumetric ratios [16]. At the same time, simplified, insufficiently correct models of effective thermal conductivity are used without clear criteria for selecting one particular model. The discrepancy between the evaluations in thermal conductivity for different models can be up to hundreds of percent (see, e.g., the results of this study or [17]). Moreover, this approach requires specifying the thermal properties of the rock mineral matrix, which, until recently, were even more difficult to obtain correctly than measurements with the rocks themselves [1]. As a result, there is additional uncertainty in the effective values of thermal properties used in the calculation, which must be taken into account while simulating. Currently, it is possible to minimize such errors only on the basis of the experimental data obtained by their special treatment and adjustment in view of the features in a specific model built in the software, which is what we have conducted in this paper.
The analysis of modern simulator capabilities also showed that the option to add the dependence of rock thermal properties on thermobaric conditions in some simulators is absent or is limited (e.g., not available for thermal conductivity or cannot take into account dependence on pressure). When this option is available, there is often a restriction on the form of dependency. For example, the linear dependence of the bulk rock heat capacity on temperature, which is typical for the vast majority of simulators, contradicts the experiment and theory (see, e.g., [18]). The fixed rule—linear or nonlinear—implemented in some simulators to account for the temperature dependence of rock thermal conductivity very often does not allow specialists to assign an experimentally determined dependence into the model (in contrast to a simulator, where thermal conductivity variation with temperature can be assigned in table format).
The option to account for heat loss out of the reservoir based on an analytical solution [19] is often used to speed up the calculations. The bulk thermal properties (and without using temperature dependence) for surrounding rocks should be used in this case, while specialists preferably use rock matrix thermal properties instead of the bulk properties for the reservoir. The vast majority of simulators do not allow for the anisotropy of thermal conductivity, which is particularly critical for thermal production methods in shale formations. The heterogeneity of the development object is taken into account either by setting individual thermal properties for each calculated cell (effective properties or matrix properties) or by setting individual properties and “mixing rules” for selected rock types/classes, i.e., for individual groups of cells that make up the model. It should be noted that our aim was not to compare different simulators but rather to emphasize the characteristic shortcomings in the currently existing capabilities for integrating thermal properties into a model.

2.2. Consequences of Uncertainty in Rock Thermal Properties for Simulation

The number of papers, that are accessible to a wide range of readers, which assess the degree of influence of the uncertainty of rock thermal properties on the efficiency of heavy oil production through various thermal EORs is relatively small, and there is no generalization of the results. In this section, we try to eliminate this gap.
Kiasari et al. [12] showed a significant effect of uncertainty in the assigned effective values of reservoir thermal conductivity and volumetric heat capacity on oil production (up to approximately 25% after seven years of production) and the cumulative steam/oil ratio (CSOR) using a small synthetic model of production by steam-assisted gravity drainage. Temizel et al. [13] illustrated that the bulk heat capacity of the rock matrix is the most important factor (among the other 16 considered) affecting cumulative oil production (COP) when steam is injected into a vertical well. However, the authors used a simple synthetic model and did not consider the effect of rock thermal conductivity on the modeling results. Durkin and Menshikova [14] showed a significant influence of uncertainty in rock thermal properties on the oil recovery factor (up to 38% and 28% caused by uncertainty in the reservoir rock heat capacity and thermal conductivity, respectively) and steam/oil ratio (up to 185% and 44% caused by uncertainty in reservoir rock heat capacity and thermal conductivity, respectively) when modeling steam injection. The authors used a range of variations in the thermal properties from published data (sometimes with some non-physical values) in a simple synthetic model without its description and did not disclose the method used to calculate the effective thermal conductivity. Morozyuk et al. [15] showed that accounting for the thermal properties of non-reservoir rocks, found in the section of a productive reservoir, affects the COP (up to 21%) and SOR (up to 19%) by SAGD with a simplified sector model of the Yaregskoye heavy oil field. However, the authors provided neither exact values of the thermal properties nor details on the used mixing rule for thermal conductivity.
Uncertainty in thermal properties significantly affects the production of shale gas [20] or oil [21] using the thermal method in a fractured reservoir. The oil recovery factor increases with the increasing thermal conductivity of shale [22], and gas production increases with the increasing thermal conductivity of gas and rocks and decreases with the increasing specific heat capacity of the rock [20]. The authors used a model of a homogeneous reservoir and assumed that thermal properties do not depend on temperature. Similar shortcomings were found in the paper of Erofeev et al. [22], where the rock thermal conductivity of the Bazhenov formation turned out to be a key parameter, the uncertainty in which had the greatest impact on the production of generated oil when pumping supercritical water into the reservoir. At the basis of the theoretical model, Klemin [23] evaluated the effect of variation in reservoir thermal properties on the efficiency of oil production by SAGD. Irani and Cokar [24] modified Butler’s [25] analytical approach by taking into account the dependence of reservoir effective thermal conductivity on temperature and evaluated the effects of such modifications on oil production and steam/oil ratio. However, the authors resolved and simplified the problem by assuming that there is no heat loss in the surroundings and that the SOR does not depend on thermal conductivity. All of the aforementioned researchers noted a significant (tens of percent) influence of uncertainty in rock thermal properties on the estimates of key development parameters. The degree of this influence changes over time and can be determined by a specific digital model of the production process, since it depends on the chosen technology and process parameters, on the analyzed parameters of production, on the reservoir parameters and reservoir fluid, and on the characteristics and the selected thermal physical options of the simulator.
The analysis of the publications shows that, first, the ranges of spatio–temporal variations of rock thermal properties are often underestimated or non-physical values of rock thermal properties are used. Second, synthetic models that are far from reality in terms of geometry and assigned parameters are often considered. Third, information about the features of integrating data on thermal properties into models is poorly covered, which is often expressed in misunderstanding/not taking into account the difference between effective and matrix values, as well as in a simplified version of assigning thermal properties in the model (both at atmospheric and reservoir conditions). In this regard, the most complete study is the work of Popov et al. [1], which addresses the problem of the reliability of the input data on rock thermal properties (generalized results of thermophysical measurements with more than 1100 rock samples from several heavy oil fields) and the problem of assigning reliable data in simulators. The impact of the effects of uncertainty in thermal properties was evaluated using several models of heavy oil production with different methods of thermal impact on the reservoir: steam-assisted gravity drainage (a synthetic model with parameters close to Faja field, Venezuela), directed in situ reservoir combustion (a synthetic model), and steam injection thermal effect (a model of a segment of Usinskoe heavy oil field). The authors have considered the influence of uncertainty in reservoir thermal properties and surrounding rocks (individually and in combination) on key development parameters depending on the duration of production—up to 75% in CSOR and 70% in COP in cases of SAGD, up to 65% in COP in cases of toe-to-heel air injection, and up to 23% in COP in the case of steam flooding.

3. New Methods and Equipment of Thermal Petrophysics

For full-range studies of rock thermal properties, a whole set of methods and instruments is required for rock thermal property measurements under atmospheric (Section 3.1) and formation (Section 3.2) thermobaric conditions (Table 1). A comprehensive study requires the additional study of pore fluid thermal properties (Section 3.3) as well as studies of the rock properties in different saturation conditions in order to analyze the “thermal properties–porosity” relationship and determine the mineral matrix thermal properties [1,26].

3.1. Measurements of Rock Thermal Properties under Atmospheric Conditions

The cornerstone of the new hardware and methodology base is the non-destructive, non-contact, precision optical scanning method recommended by ISRM [10]. The method allows identifying the main values of thermal conductivity λ along the main axes of thermal conductivity, temperature (diffusivity) conductivity a, and coefficient of thermal anisotropy K, defined as the ratio of thermal conductivity along the principal axes of thermal conductivity, volumetric heat capacity Cρ, and the coefficient of the thermal heterogeneity β of rock samples directly on a full-sized, slabbed, or standard core sample with detailed profiling of the thermal conductivity, temperature conductivity (diffusivity), and volumetric heat capacity without the mechanical processing of the core samples and with the full preservation of the core material. A detailed description of the method and metrological and technical characteristics of installations is given in the published ISRM-suggested methods [10]. Based on optical scanning devices, a method has been developed for the continuous thermal profiling of the entire well core, which, by continuously scanning in the direction perpendicular to the stratification plane for sedimentary rocks, allows for registering different scale variations in the volumetric heat capacity and thermal conductivity components λ, parallel to the stratification plane or layers along the wells with a spatial resolution of 0.001 m [3]. An example of thermal profiling results on two adjacent rock samples from the Karabikulovskoye high-viscosity oil field is shown in Figure 1. It can be seen that even within a single sample of oil sand, its thermal properties change significantly (for this sample, it is up to 18% in thermal conductivity and up to 45% in volumetric heat capacity).

3.2. Measurements of Rock Thermal Properties under Reservoir Conditions

The active introduction of the optical scanning method allowed us not only to increase the validity of the core sample selection sites to form representative collections of rock samples for subsequent laboratory studies [33], but also to significantly improve the quality of thermal property measuring at elevated temperatures. In particular, we recently improved the method for measuring thermal conductivity at elevated temperatures using the DTC-300 (New Castle, DE, USA) device [27] (Table 1). This device, whose operating principle is based on the “divided bar” method [10], is designed to determine the thermal conductivity of industrial materials and in the standard version of its application, cannot provide a satisfactory measurement quality for sedimentary rocks due to its inability to ensure the necessary quality of its surface polishing [27]. Thermal conductivity measurements were performed on solid cylindrical samples of 50 mm in diameter and not exceeding 20 mm in height, in the temperature range from 20 to 300 °C. The measurements met the requirements of ASTM E1530-11 [29].
A differential scanning calorimeter DSC 214 Polyma (NETZSCH, Selb, Germany) was used to determine the rock-specific heat capacity in the temperature range of 30–600 °C. The image and technical characteristics of this calorimeter are shown in Table 1. Measurements and calculation of specific heat capacity were performed in accordance with ASTM E1269-11 [30] requirements, with samples in the form of a disk ~4 mm in diameter with ~1 mm thickness or with powder weighing 20–40 mg. High-purity nitrogen (99.999%) was used as a purge and protective gas (with a volumetric flow rate of 40 and 60 mL/min, respectively). The calorimeter was calibrated for heat flow prior to each series of measurement. The time of isothermal sections was at least 5 min. The heating speed was 10 °C/min. The samples were kept in the calorimeter oven for 15 min at 120 °C (the change in mass of samples after measurements as related to mass after drying was less than 0.1%) prior to making measurements.
The dependence of rock volumetric heat capacity on temperature was determined as the product of specific heat capacity with density, and the change in rock density with temperature was previously determined by measuring the coefficient of linear thermal expansion (CLTE).
CLTE was measured over a wide temperature range using a dilatometer with a quartz pusher DKT-40 (Chelyabinsk, Russia), specifically designed for studies of 30 × 30-mm cylindrical core samples (Table 1). Different CLTE tensor components were determined when a different orientation of the core samples in the dilatometer was used. The use of highly sensitive strain sensors made it possible to achieve a high resolution (~0.01 microns) when measuring the elongation of a sample during its heating. The signal variation did not exceed ±0.05 microns over 10 h, and this meets the requirements of the ASTM E228-95 [31] standard. This allowed us to measure a differential value of CLTE for every temperature interval of 20 °C within a temperature range of 20–300 °C. The metrological and technical characteristics of the DKT-40 unit as well as the improved measurement technique were described in detail by Gabova et al. [28].

3.3. Measurement of Oil Thermal Properties in Reservoir Conditions

The thermal conductivity of oil was measured using a KD2 Pro device (Pullman, WA USA) with a KS-1 remote probe designed to measure the fluid thermal conductivity. The operating principle of the device (based on the line source method) and the measurement procedure are described in detail in [34]. Oil is poured into a measuring cell with a cylindrical probe and is thermostated until the thermal conductivity is stabilized for each of the set temperature values (in the measurement range of up to 150 °C). The measurement process complies with ASTM D5334-14 [32]. To determine the oil volumetric heat capacity within a given temperature range, they performed specific heat capacity (using DSC 214 Polyma) and density measurements (using “Anton Paar” DMA 4200 density meter), followed by multiplication of the measurement results.

4. Case Study: Efficiency in Applying Advanced Thermal Petrophysics Methods at Heavy Oil Field

4.1. Object and Tasks of the Study

The effectiveness of applying new methods of thermal petrophysics is shown by the example of the Karabikulovskoye high-viscosity oil field located in the NE part of Samara Region, Russia (Figure 2), the South Tatar oil and gas region of the Volga–Ural oil and gas province [35].
The main distinctive features of the field are presented by the terrigenous reservoir with good filtration properties, shallow reservoir depth (50–200 m), high oil viscosity in reservoir conditions, low formation pressure, and extremely low gas content (Table 2). The object of this research was the rocks of the productive formation (U2) of the Ufa stage of the upper Permian, mainly represented by weakly cemented bituminous sand, and the surrounding rocks of the Kazan and Ufa stages, represented by gray, dark gray, and brown clays and often silty, fractured, and dense siltstones and sandstones with clay–carbonate cement.
The development of the field is only possible by thermal methods, such as SAGD. Development is significantly complicated by the presence of clay bridges and weak consolidation due to the extremely shallow depth of the formation. The main binding agent for oil sand is its high-viscosity oil by itself, which complicates the process of lab core studies.
To provide the THD modeling of the development using the necessary data on the thermal and thermo–mechanical properties of the Karabikulovskoye field core and fluids, the following tasks had to be resolved:
  • Continuous profiling of the thermal conductivity and volumetric heat capacity of rocks on the recovered full-sized core (total length of core samples was about 100 m) with the definition of coefficients for thermal anisotropy and heterogeneity;
  • Establishment of relationships between thermal properties and other petrophysical properties;
  • Measurement of the thermal conductivity and volumetric heat capacity of rock and oil samples in the reservoir temperature range;
  • Measurement of the CLTE of rock matrix in the reservoir temperature range;
  • Analysis and interpretation of the experimental thermal physical data obtained and preparation of data for input into the model;
  • Evaluation of the application effects of modern thermal petrophysics methods on the results of THD modeling.

4.2. Collection of Samples

Continuous thermal physical rock profiling was performed on a collection of 183 core samples of well A and 159 core samples of well B. Immediately prior to profiling, the full-size core, packed in sealed fiberglass sampling pipes, was sawn jointly with the pipes along the axis. Profiling was performed on the flat surface of slabbed cores without drying or any other treatment.
The studied sediments of the Kazan stage are represented by gray and dark gray clays, often silty and fractured and sometimes calcareous; poorly cemented oil sands of the Ufa stage are medium–fine-grained and composed of micro-quartzite rocks fragments—30–35%, effusive rocks; 25–30%, quartz; 15–20%, feldspar; up to 5%. The rock shows the development of analcime along the edges of effusive rocks in the form of crystals 0.01–0.05 mm in size in amounts of about 10%. Oftentimes, analcime is present in the intergranular space as fragments (Figure 3).
To select cylindrical samples for the special rock studies, the method of drilling out samples from full-sized cores during freezing in liquid nitrogen was used. The selection of sites for core samples’ drilling-out was based on the results of continuous thermo–physical profiling using a special method, selecting the least heterogeneous sections with thermal conductivity values covering the entire range of thermal conductivity changes observed in a continuous profile [33].
Special thermal physical rock studies were conducted with the drilled-out samples: measurement of rock thermal conductivity in 13 cylindrical samples of 50 × 20 mm (eight oil sand and five siltstone samples), measurement of rock-specific and volumetric heat capacity in 31 samples (27 and 4 samples from the productive reservoir and surroundings, respectively), and the measurement of CLTE in 21 cylindrical specimens of 30 × 30 mm.
The study of oil thermal properties was carried out on two samples obtained from portions of oil sand crushed by the centrifugation method.

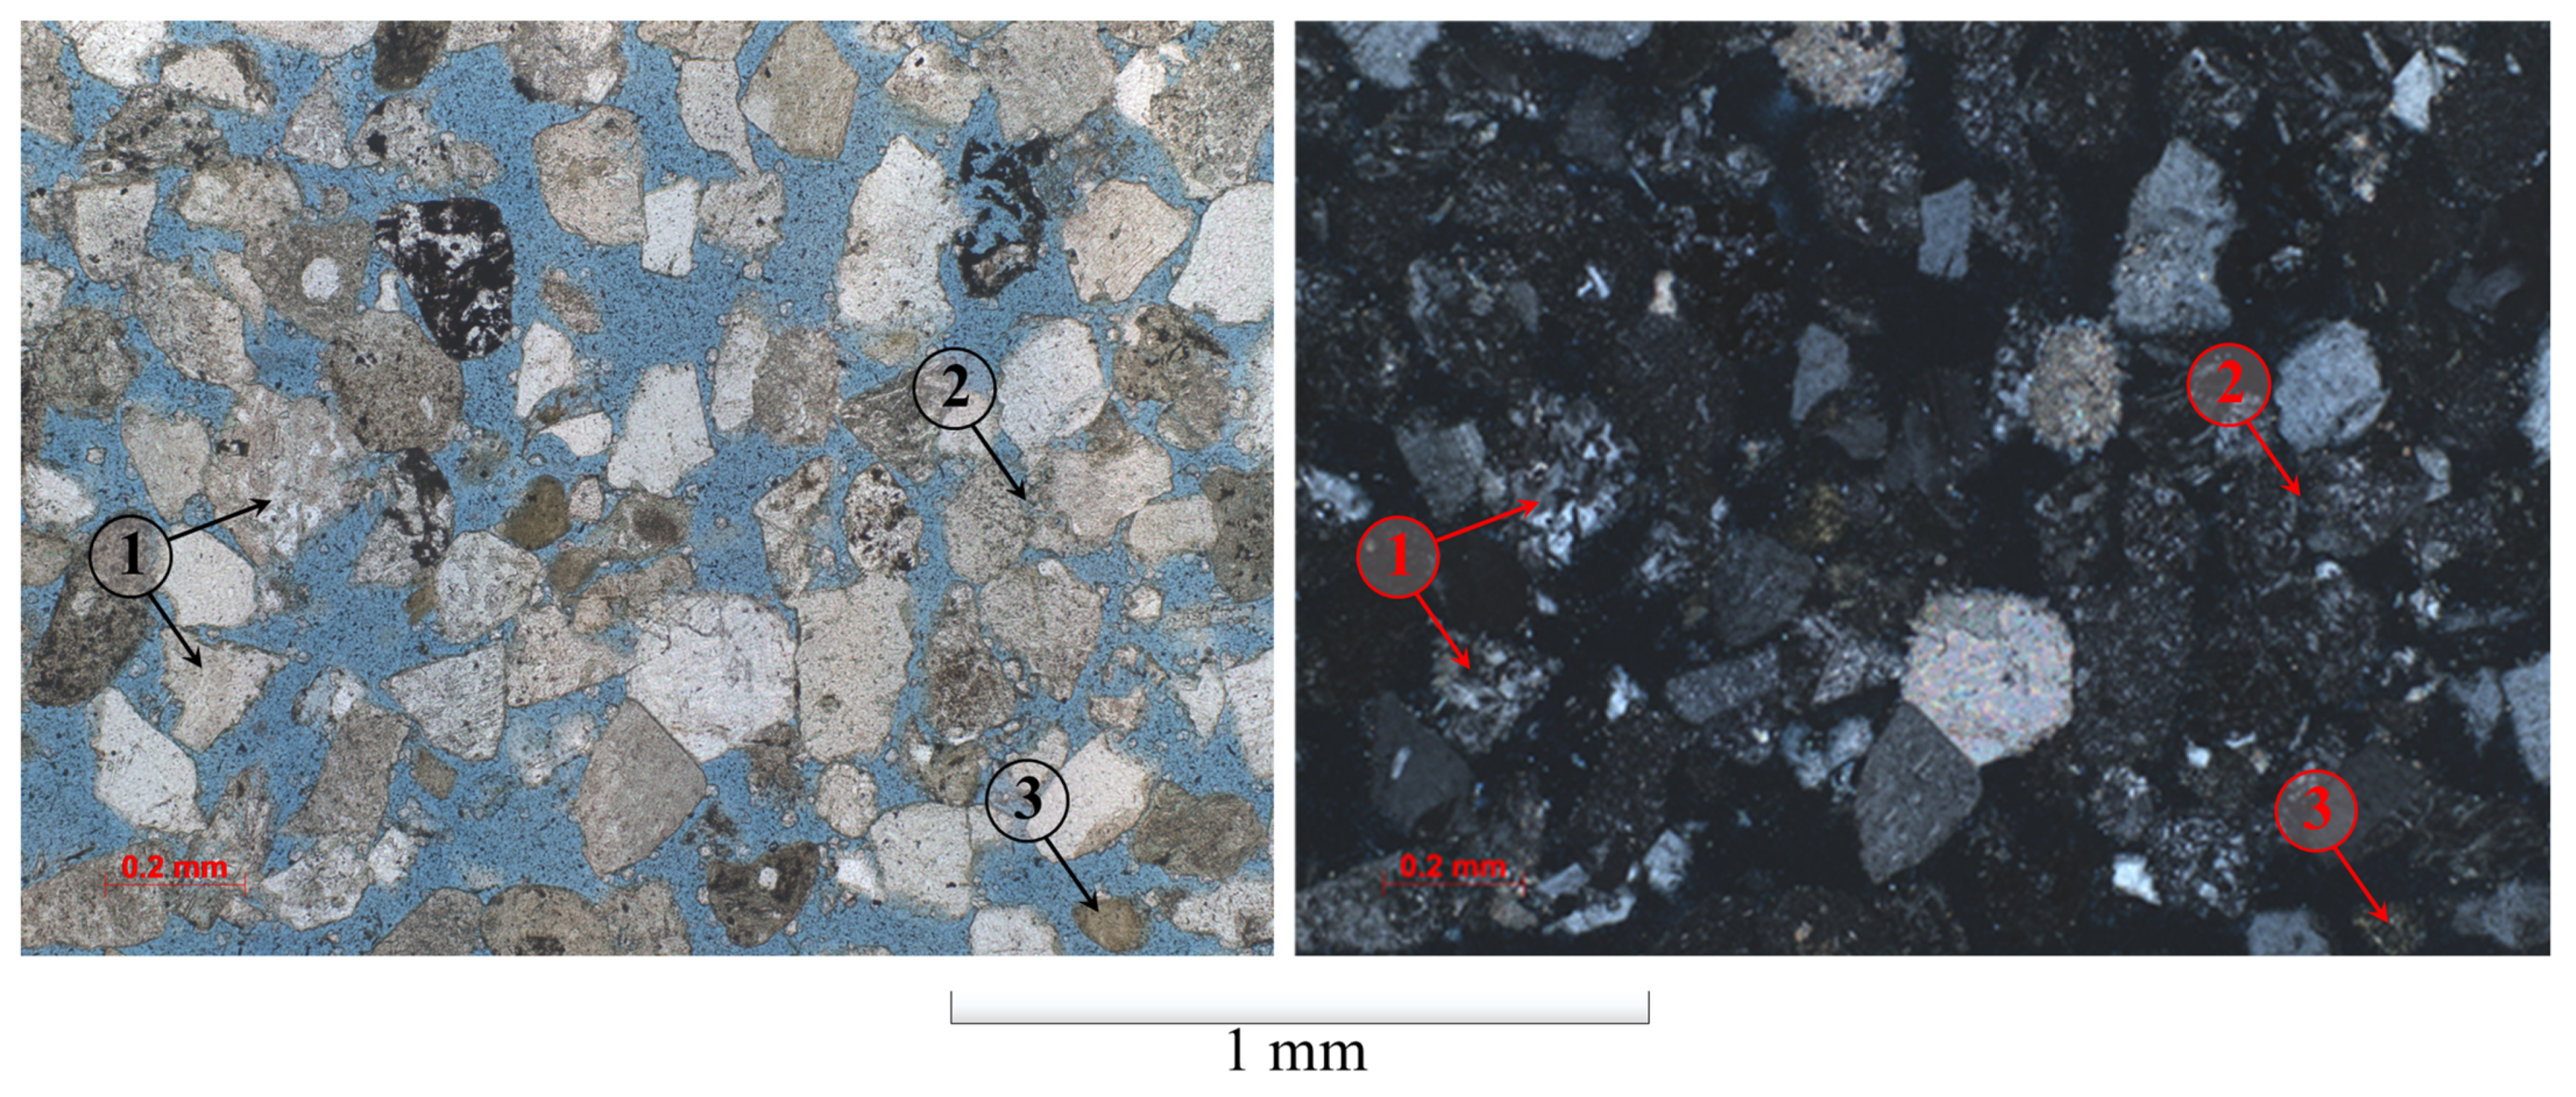
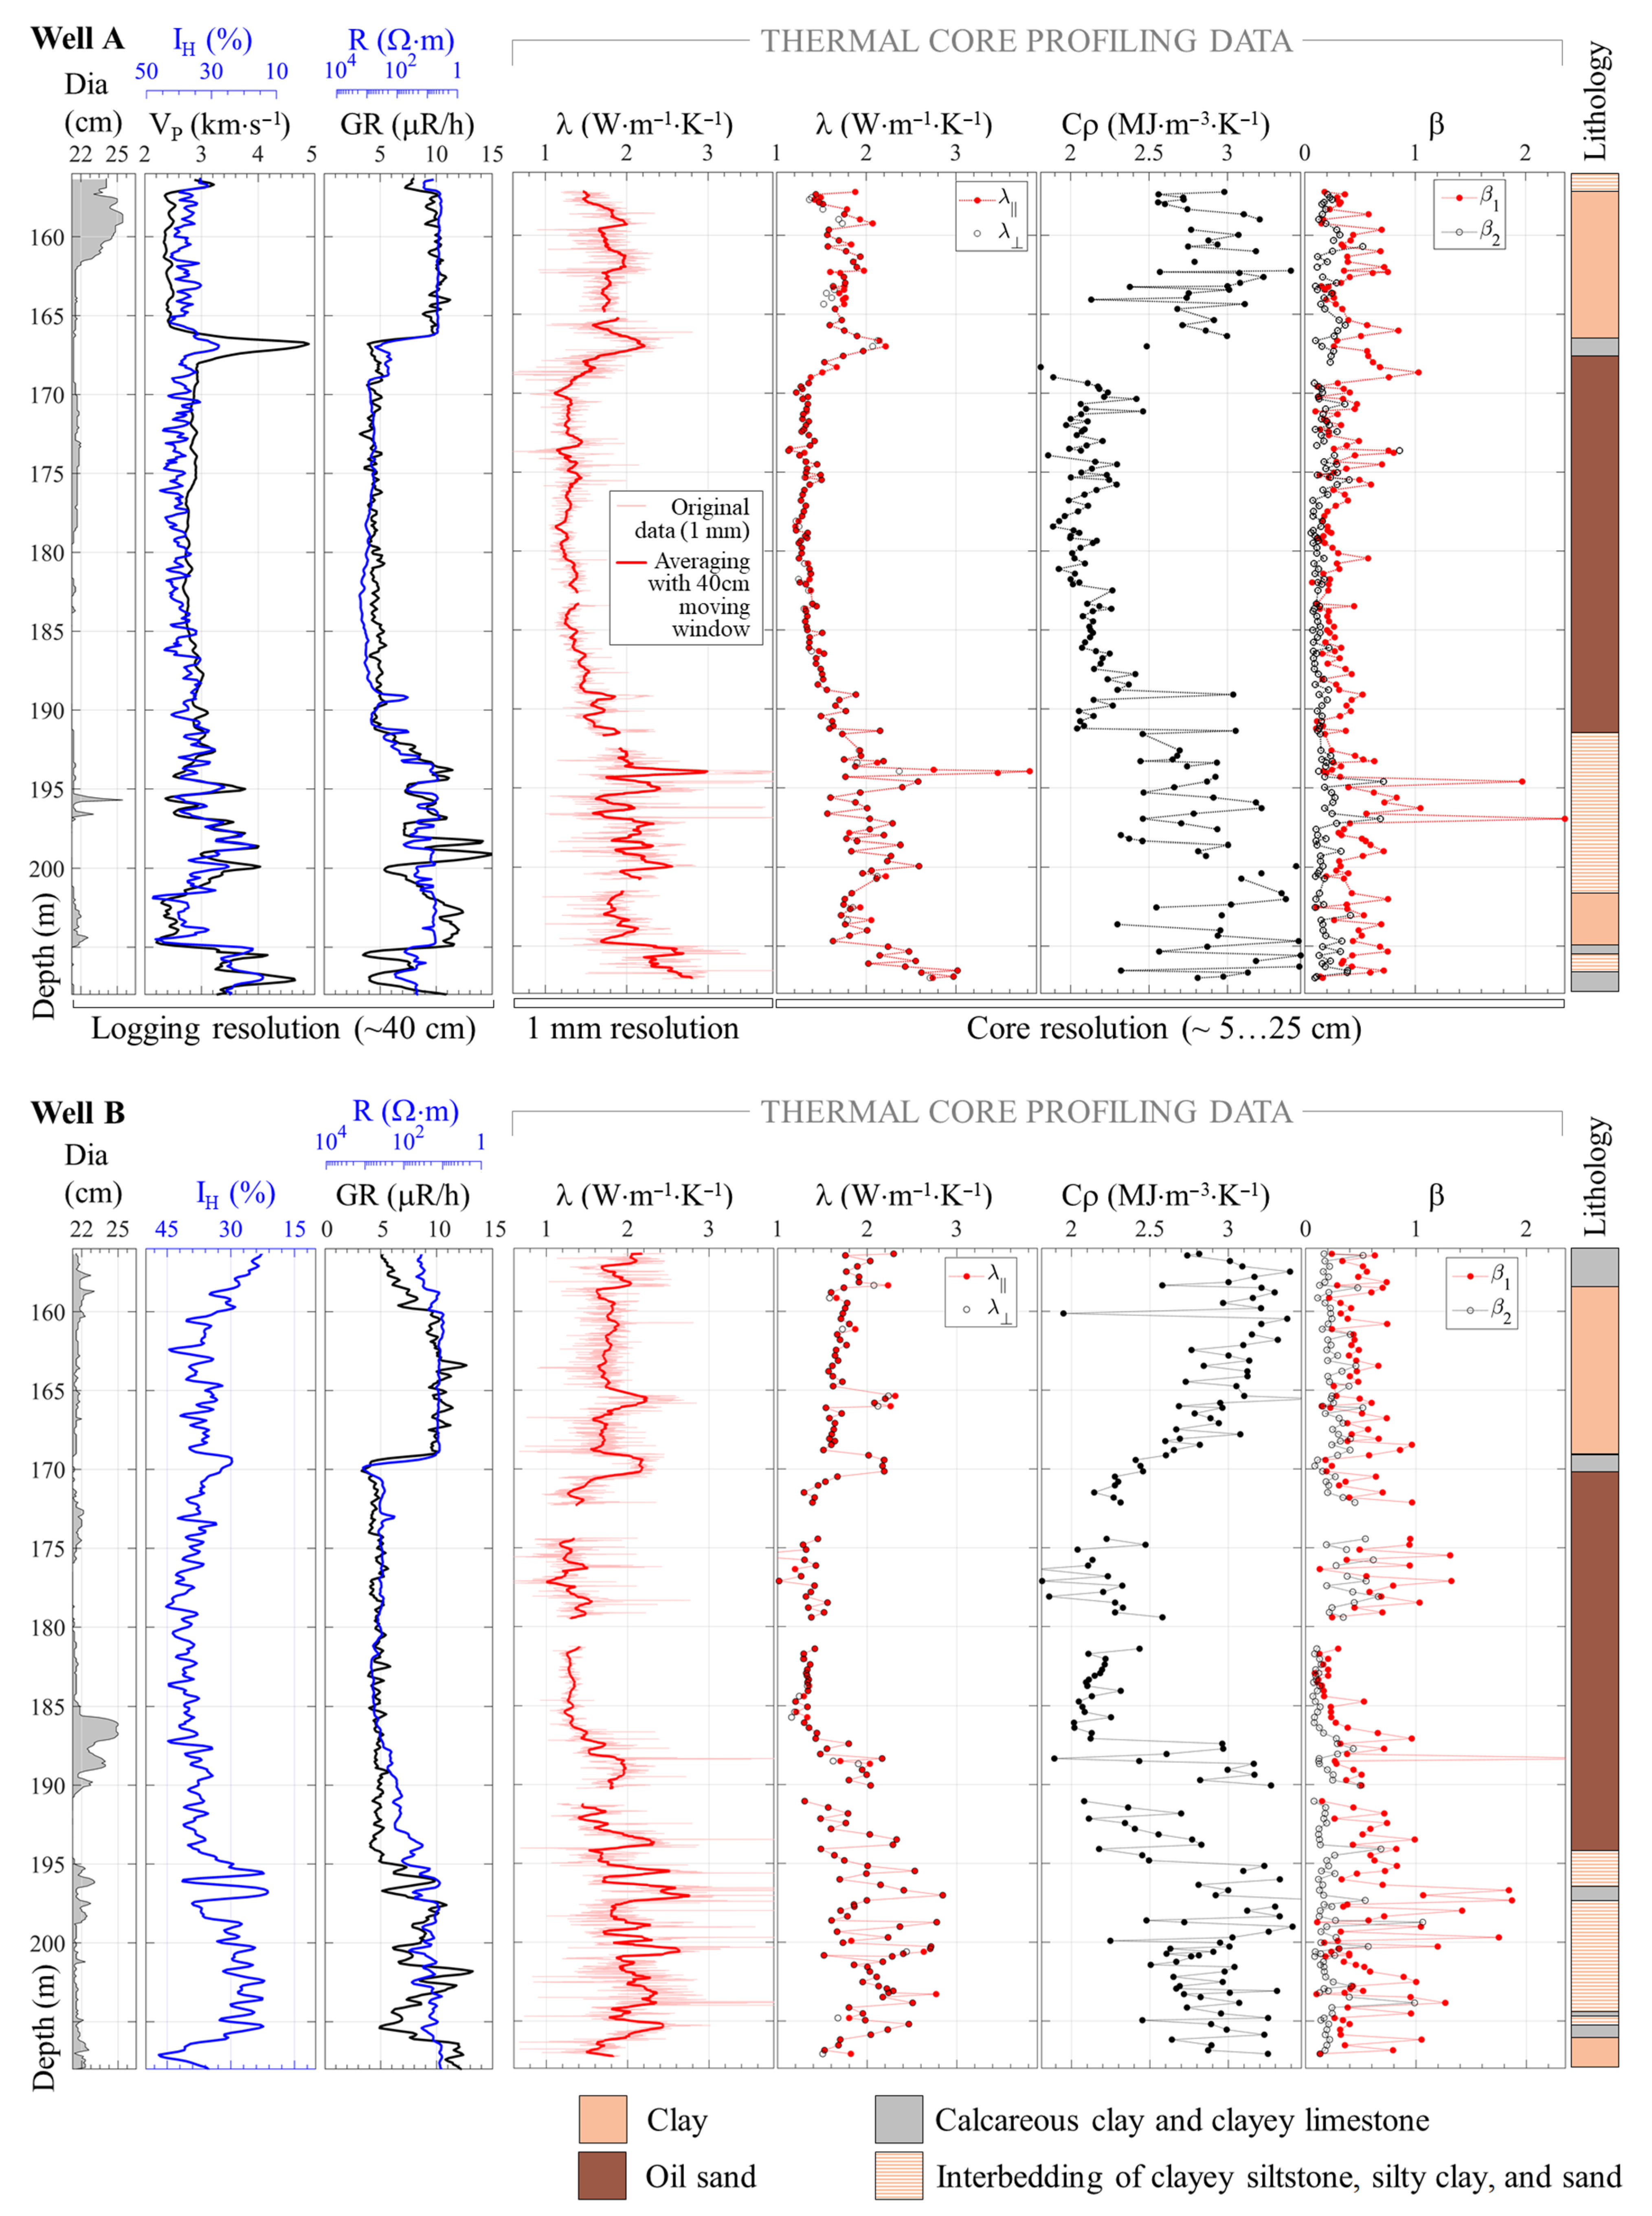
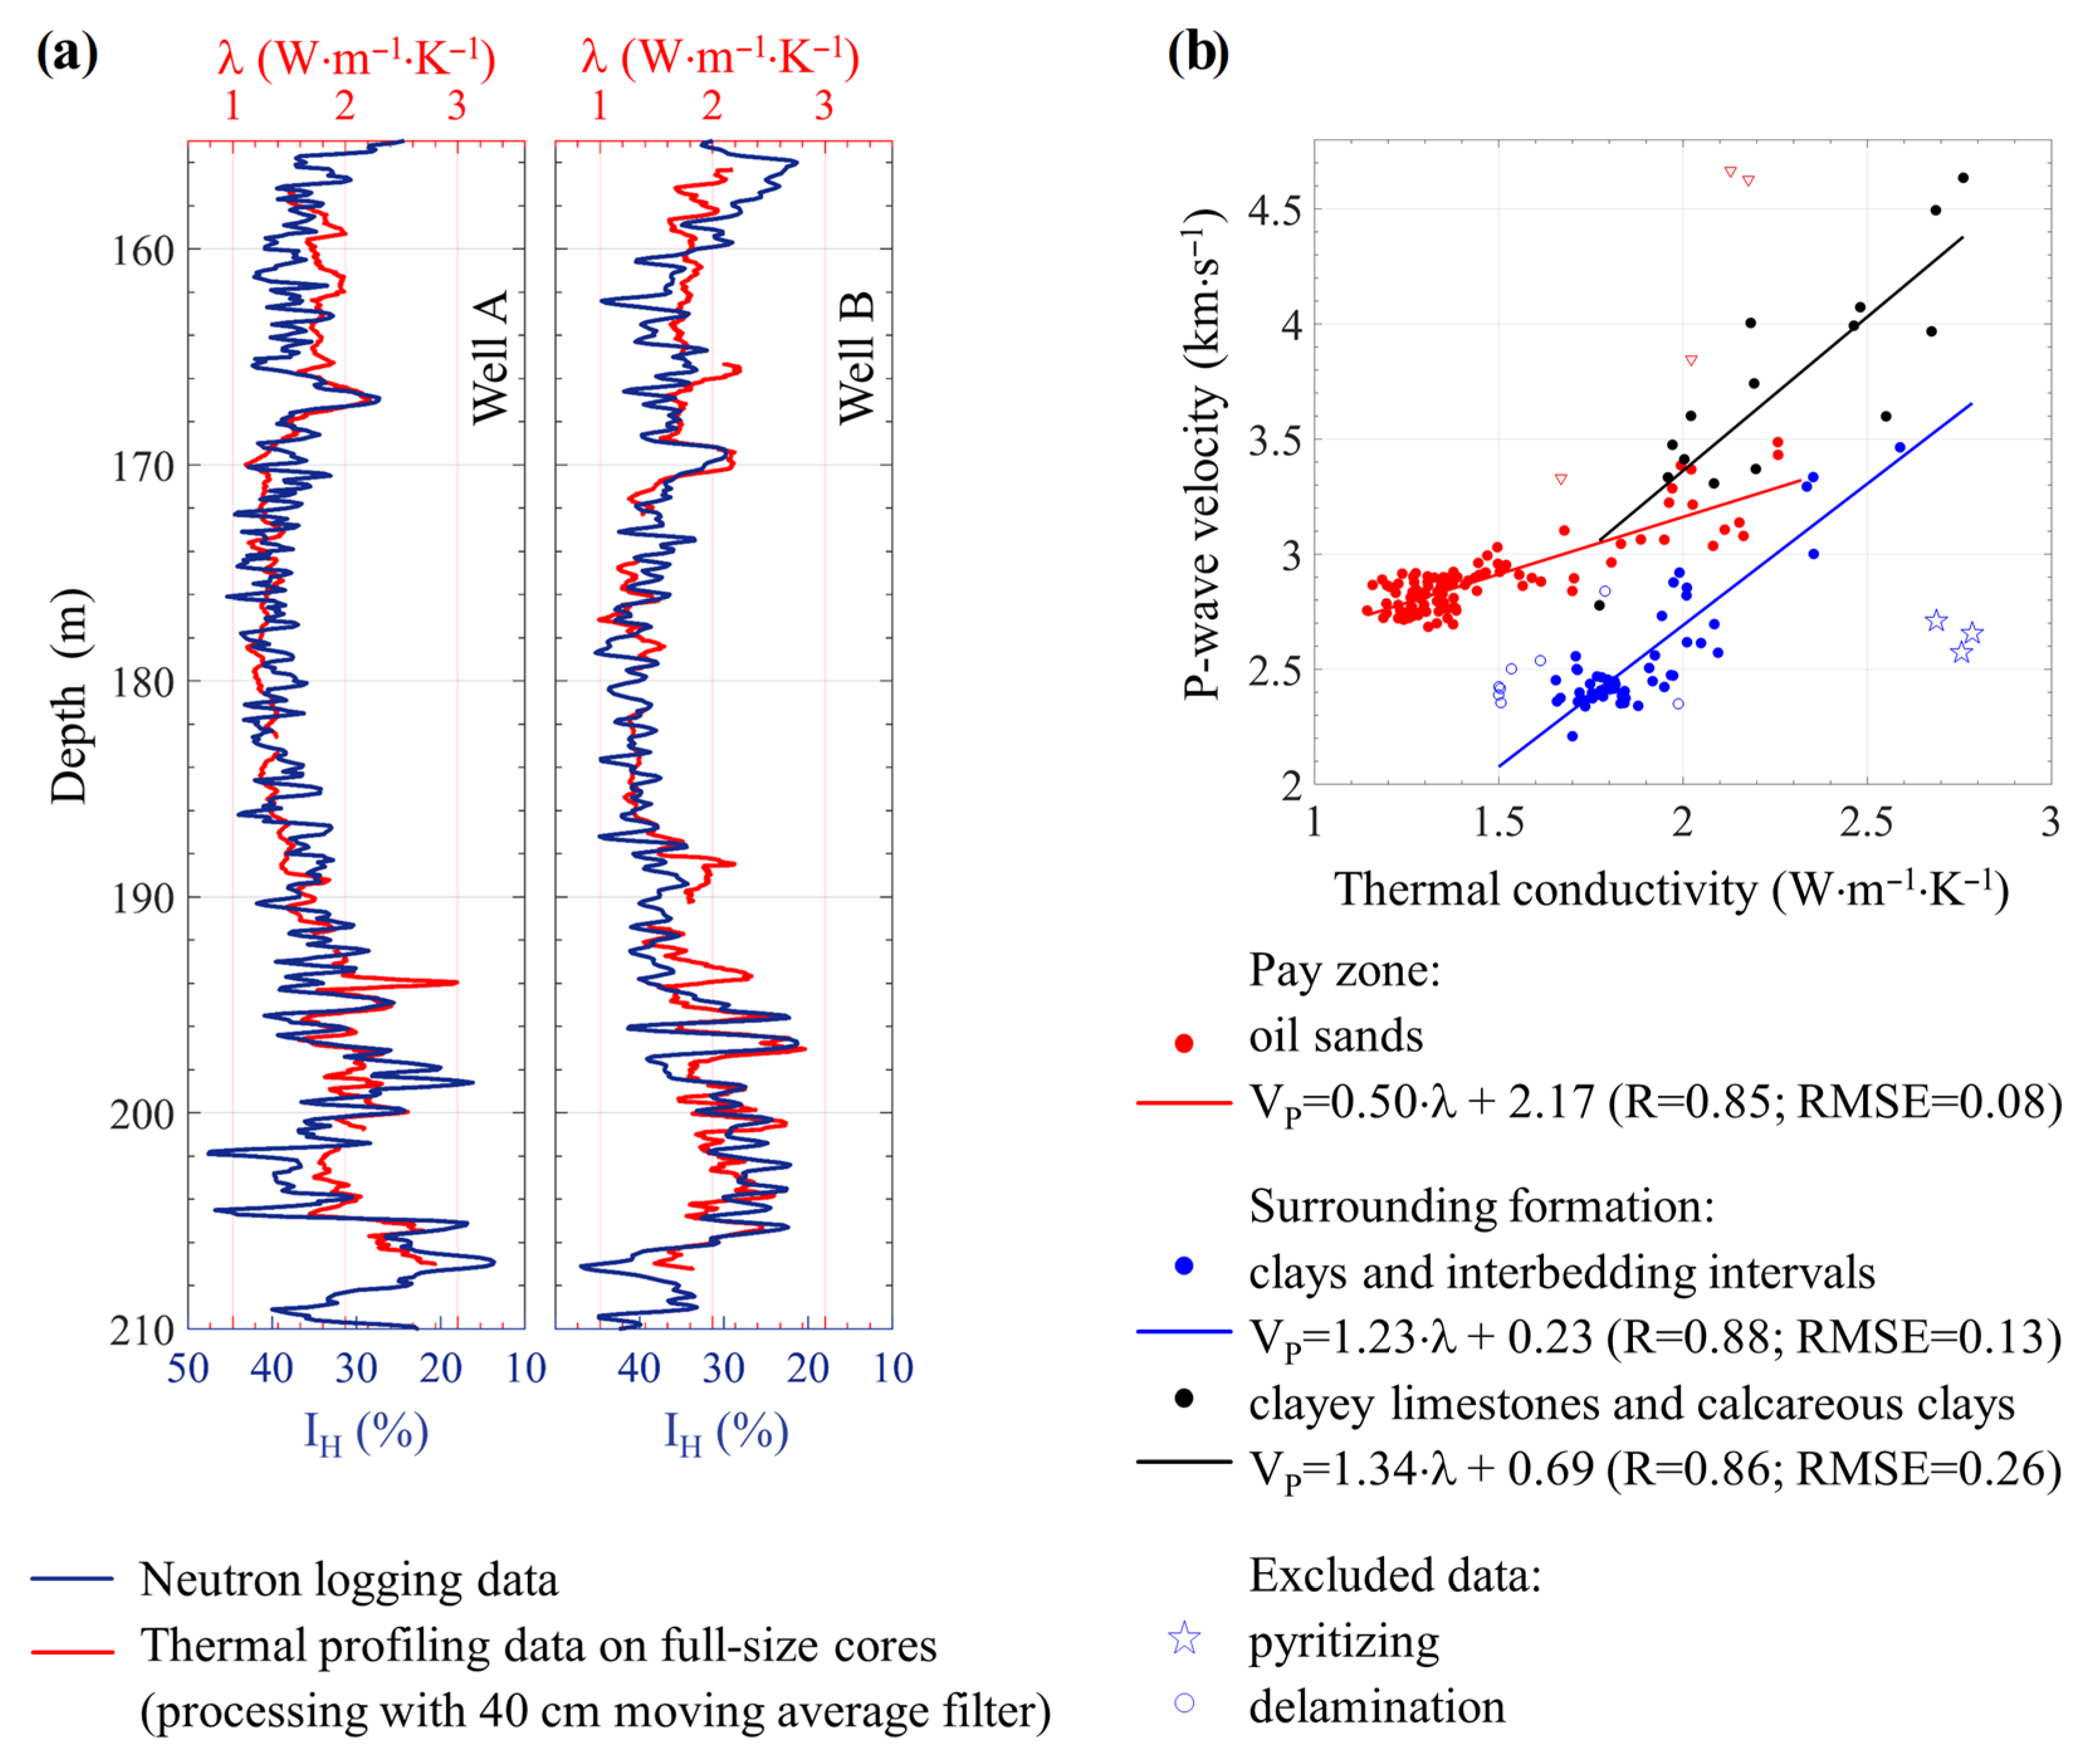
4.3. Results of Experimental Studies and Their Analysis

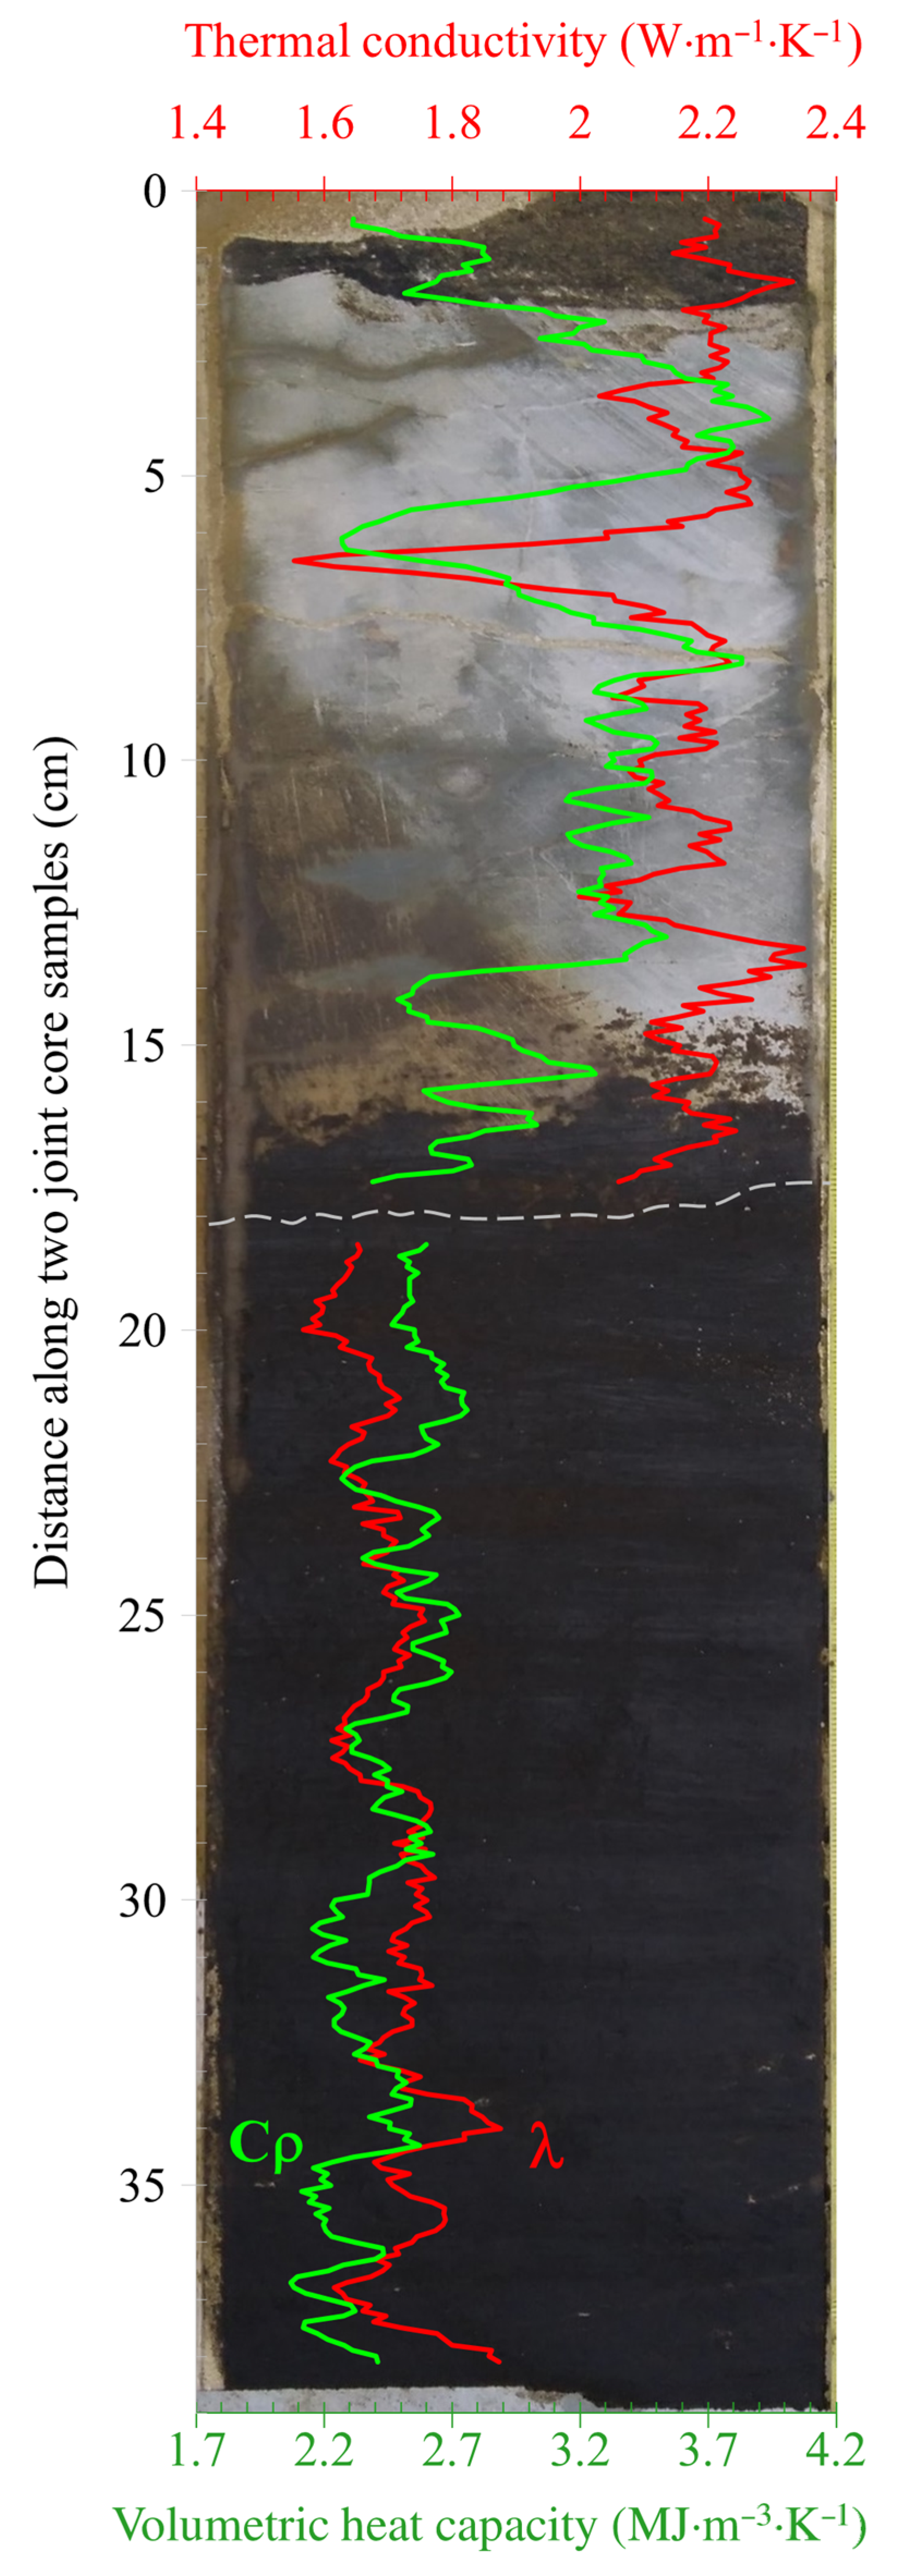
4.3.1. Continuous Thermal Profiling

Continuous thermal profiling was performed using the non-contact non-destructive optical scanning technique [10], which provided profiles of thermal properties with a spatial resolution of 1 mm for every core sample studied. The average thermal anisotropy coefficient was determined for every core sample. The results of determining the set of thermal properties under atmospheric conditions are shown on the plates (Figure 4). Table 3 shows the results of the respective statistical processing for various lithological differences. There are significant (for some rocks, more than three times) variations in the thermal conductivity as well as significant variations in the volumetric heat capacity along the well.
The high average values of the thermal heterogeneity coefficient (up to 0.58) show significant rock heterogeneity at the level of each core sample (see the example in Figure 1), which indicates the need to evaluate the thermal conductivity taking into account the core heterogeneity, which is only possible when using the optical scanning method [10].
Relatively high average values of thermal conductivity were observed in Ufa-stage dense clays and siltstone, which is associated with relatively low values of rock porosity. The reduced average values of thermal conductivity and the increased values of thermal anisotropy coefficient of Kazan-stage clays are mainly due to oriented rock fracturing. The increased values of λ—up to 3.82 W·m−1·K−1 for individual samples—are due to the spotty pyritization of rocks. In general, the following can be said regarding the range of variations in the thermal conductivity of oil sands under normal conditions:
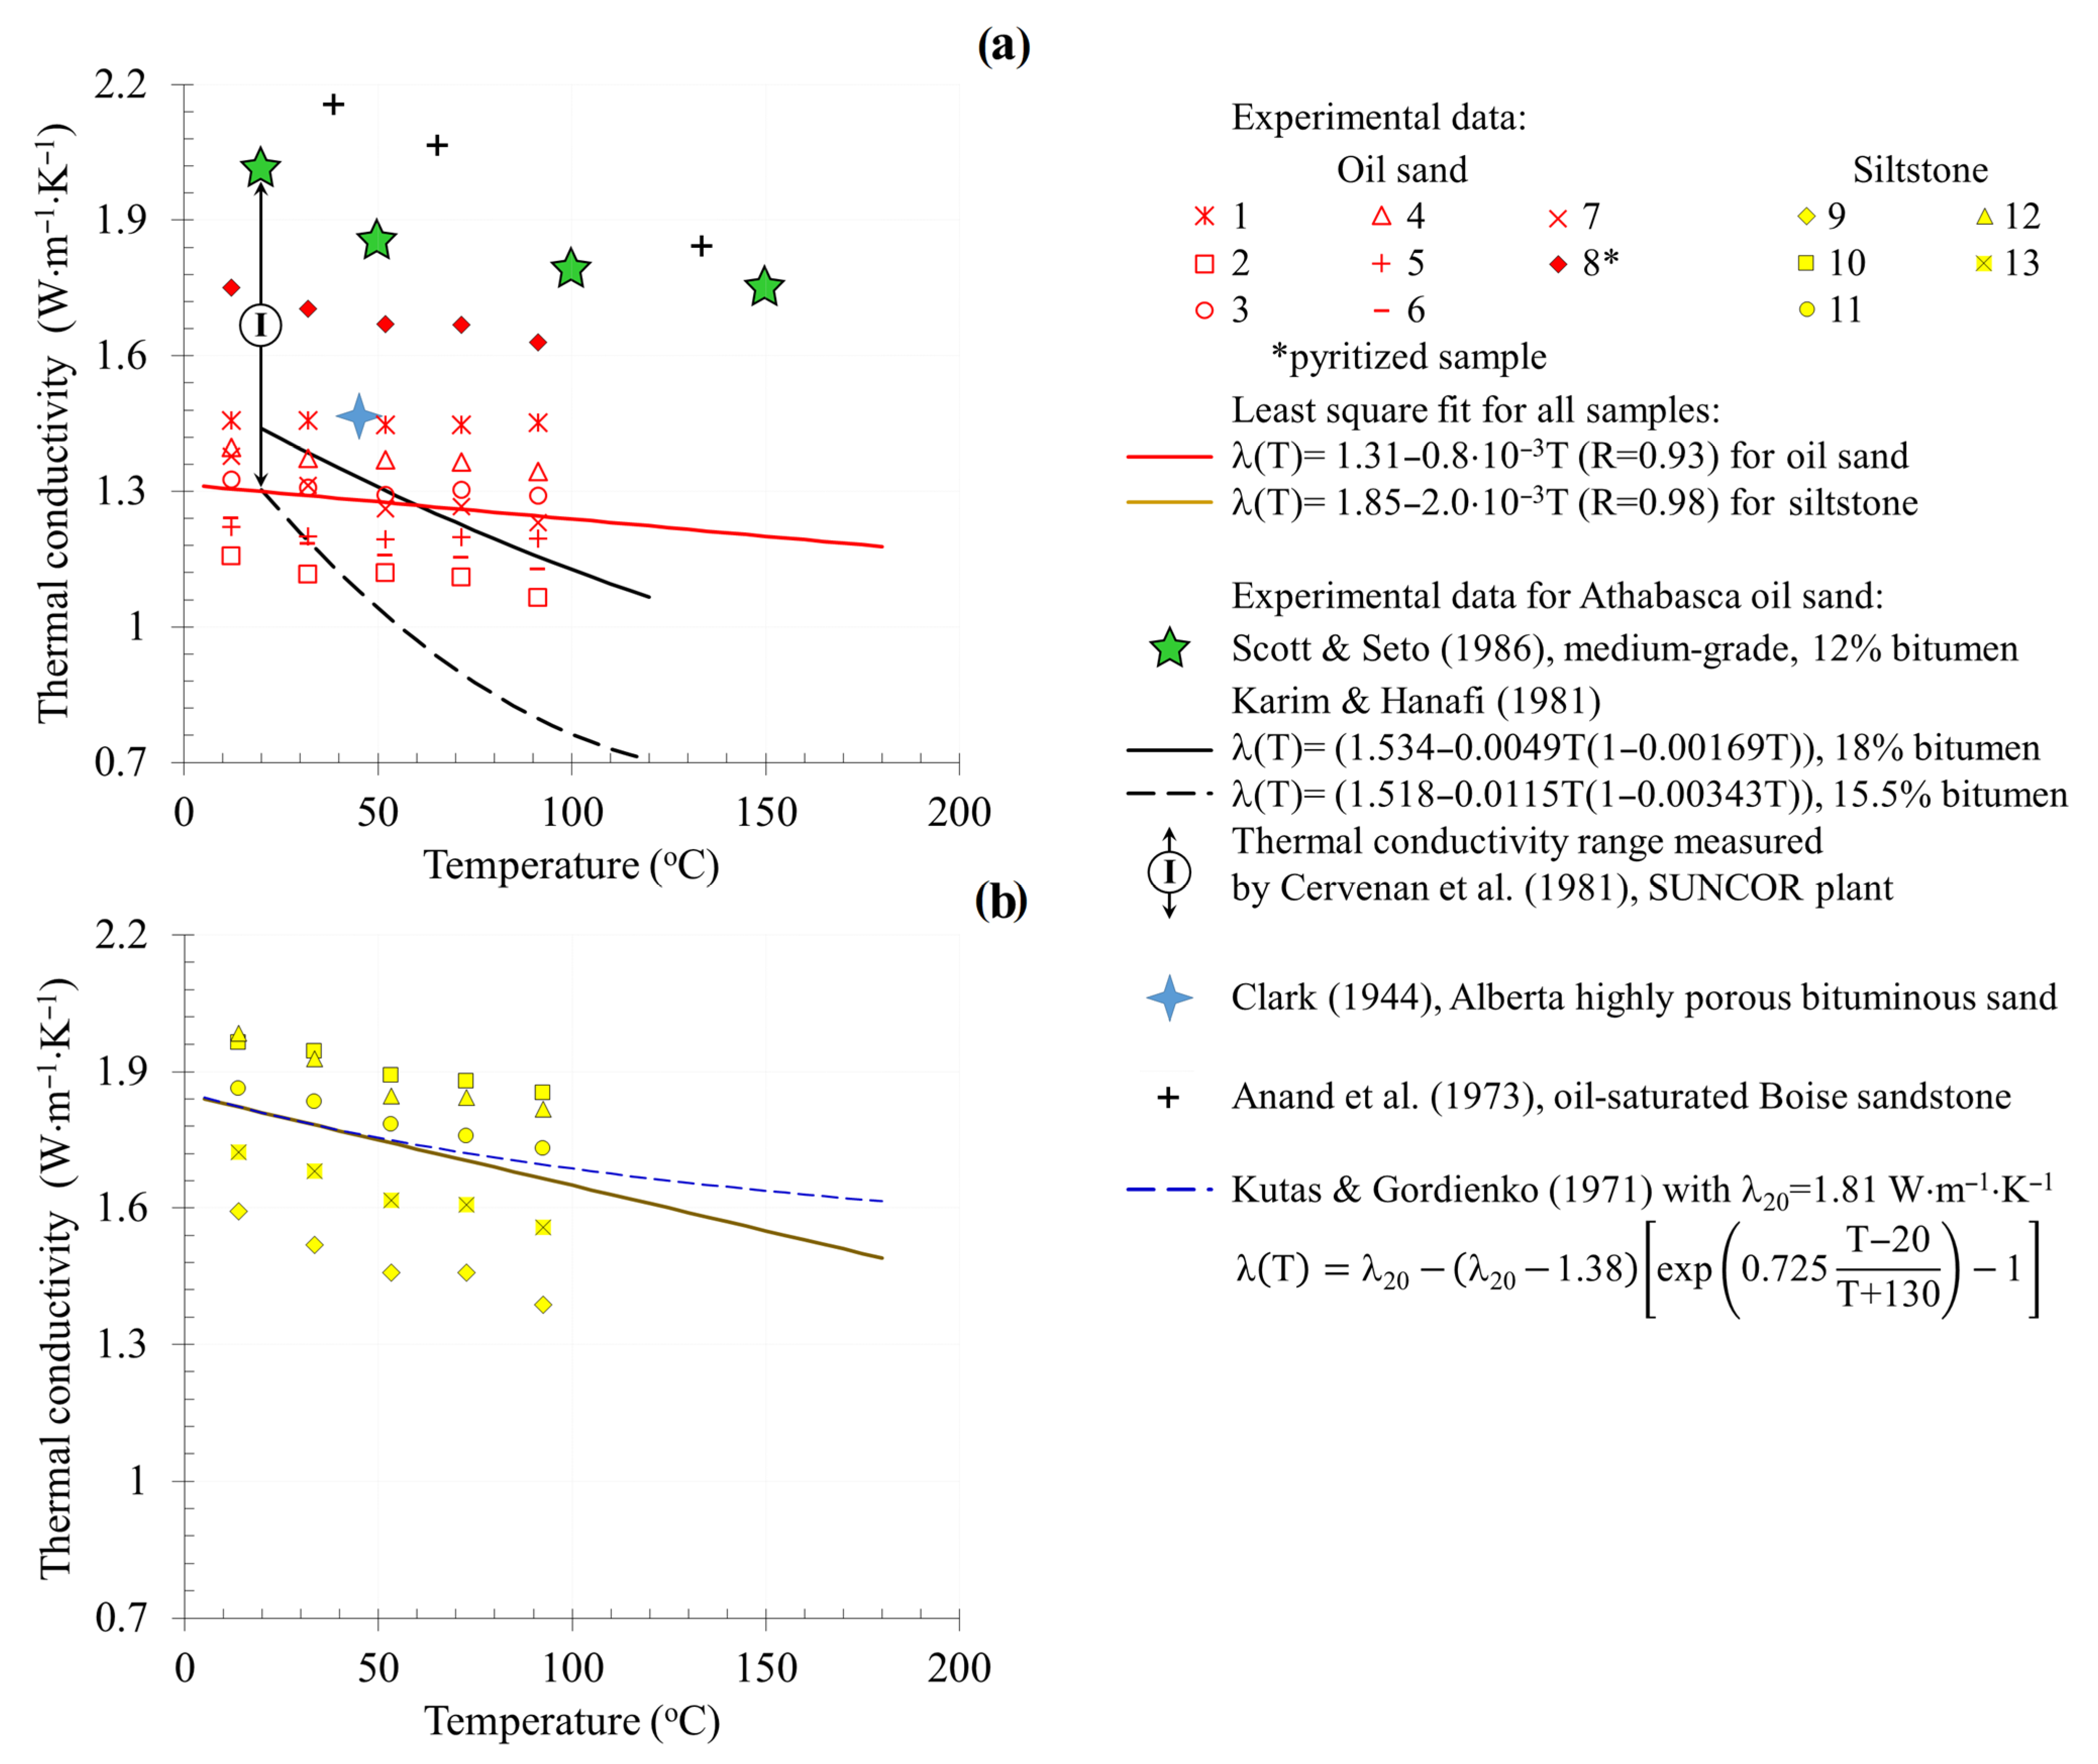
  • It agrees well with the experimental data obtained on several samples of Athabasca oil sands (Canada) by Cervenan et al. [36] (1.3–2.0 W·m−1·K−1);
  • It is lower (due to differences in mineral composition and cementation degree) than the results obtained with oil-wet samples of polymictic sandstone from the high-viscosity oil fields of Oman (characterized by an increased quartz content and lower portion of fragments; see [26]) and quartz sandstones from the Yarega oil field [11];
  • It is significantly higher than the range (0.55–1.05 W·m−1·K−1) established by Lipaev [37] for bituminous sandstones of the Mordovo-Karmalsky bituminous field.
Then, we discuss the difference in the measuring results on a full-size core and drilled-out cylindrical samples. The average values of the volume thermal capacity of clays, siltstones, and dense sandstones significantly decreased from 2.85–2.95 MJ·m−3·K−1 to 2.02–2.04 MJ·m−3·K−1. This was primarily due to changes in the fluid saturation of the rocks. A decrease in the thermal conductivity of Kazan-stage clays by approximately 40% (in contrast to the more compacted Ufa stage clays) indicates the development of fracturing in the samples of these rocks during drilling. The degree of oil sand saturation during drilling also changes, and this reflects the drop in the thermal conductivity of these samples by ~20%. All of these changes in properties, the registration of which became possible due to the use of the optical scanning method, must be taken into account when forming a database of initial data on the thermal properties necessary for THD modeling.

4.3.2. Correlations with Other Petrophysical Properties

To perform a joint analysis of thermal core profiling and logging data, the core column depths were linked to the logging depths, and different scale data were brought to the same spatial resolution (more detailed than the logging data, the results of thermal properties measurements were averaged in a moving window; see [3] for details). The core–log depth adjustment was carried out by comparing the results of hydrogen content (IH) determined by radioactive logging with the results of the measurement of the parallel component of thermal conductivity (λ hereafter, we will omit the lower index “‖” for simplicity) in the core. Thermal conductivity data were first processed with a 40-cm moving window to obtain a vertical spatial resolution similar to the resolution of radioactive logging (about 40 cm). The error in determining IH was ±4–10% (the range was determined by the hardware used and the porosity variations in this section); therefore, despite the significant correlation “λ−IH”, there were cases of inconsistency in variations (Figure 5a). The core–log depth adjustment was subsequently confirmed by the results of gamma ray spectrometry on the core samples when compared with the gamma logging data in well B.
The regression equations for each lithological difference were established iteratively: unknown coefficients of the equation were calculated, the confidence interval (95%) was determined, points falling out of this interval were excluded, and the procedure was repeated until all of the points were included in the confidence interval. As a result, it was found that for rocks of the productive layer, IH = 53.44 − 10.55 λ (R = 0.81; RMSE = 2.6); and for clays, IH = 67.35 − 17.22 λ (R = 0.79; RMSE = 3.2). Here, R is the correlation coefficient and RMSE is the root mean square error. Figure 6b shows the cross-plot of the thermal conductivity along the strata (after reducing to sonic logging spatial resolution) and the longitudinal wave velocity for well A. Three data groups corresponding to different lithological differences are clearly differentiated. Of particular interest are the data excluded from the analysis according to the approach described above. These data correspond to either pyritization intervals (in this case, a local increase in λ is observed; see, e.g., the interval of 193.8–194.1 m in well A), fractured intervals during drilling (in this case, λ is underestimated; see, e.g., the interval of 157.2–158 m in well A), or intervals with insufficiently conditioned logging data (wall erosion, thin layering, tightening, etc.). We do not provide all the possibilities for the joint analysis of the results with the thermal profiling of well survey data, especially since most of the possibilities are described in detail in the paper by Popov et al. [3].
The correlation between thermal conductivity and porosity allows us to determine the matrix value of thermal conductivity (λs, where index s means solid) required for THD modeling (see Section 2.1 and Section 5). The NMR method was used to determine the porosity of samples, since the extraction and drying of poorly consolidated samples led to their partial destruction. For rocks of the Karabikulovskoye field, the regression equation has the following form:
λ = 1.78 exp (−1.39ϕ) W·m−1·K−1 (R2 = 0.64; RMSE = 0.08)
where ϕ is the porosity, and the pre-exponential factor 1.78 W·m−1·K−1 is λs (it is in the range of 1.68–1.87 W·m−1·K−1 with a probability of 0.95). Here, R2 is the coefficient of determination. The relationship between conductivity and porosity for the Karabakhskoye field differs significantly from the relationship for the Mordovo-Karmalsky (λ = 2.64 − 0.055ϕ, W·m−1·K−1, [37]) and Yaregskoye (λ = 6.00 exp (−2.82ϕ), W·m−1·K−1, [11]) oil fields. The reduced value of λs in comparison with our previously established results (2.7–2.9 W·m−1·K−1 for cemented polymictic sandstones) is probably due to two factors: firstly, the high content (from 10% to 35% according to additional X-ray studies and the analysis of transparent sections; see Figure 3) of low heat-conducting analcime with a thermal conductivity of 1.27 W·m−1·K−1 according to Horai [38]; and secondly, the difference in intergranular contacts and grain sizes leading to the case where the λs of rocks with the same mineral composition may differ significantly. Even in monomictic quartz sandstones, λs has a significant range (5.25–6.10 W·m−1·K−1) due to differences in the granulometric composition and intergranular contacts (point, long, convex–concave, etc.).

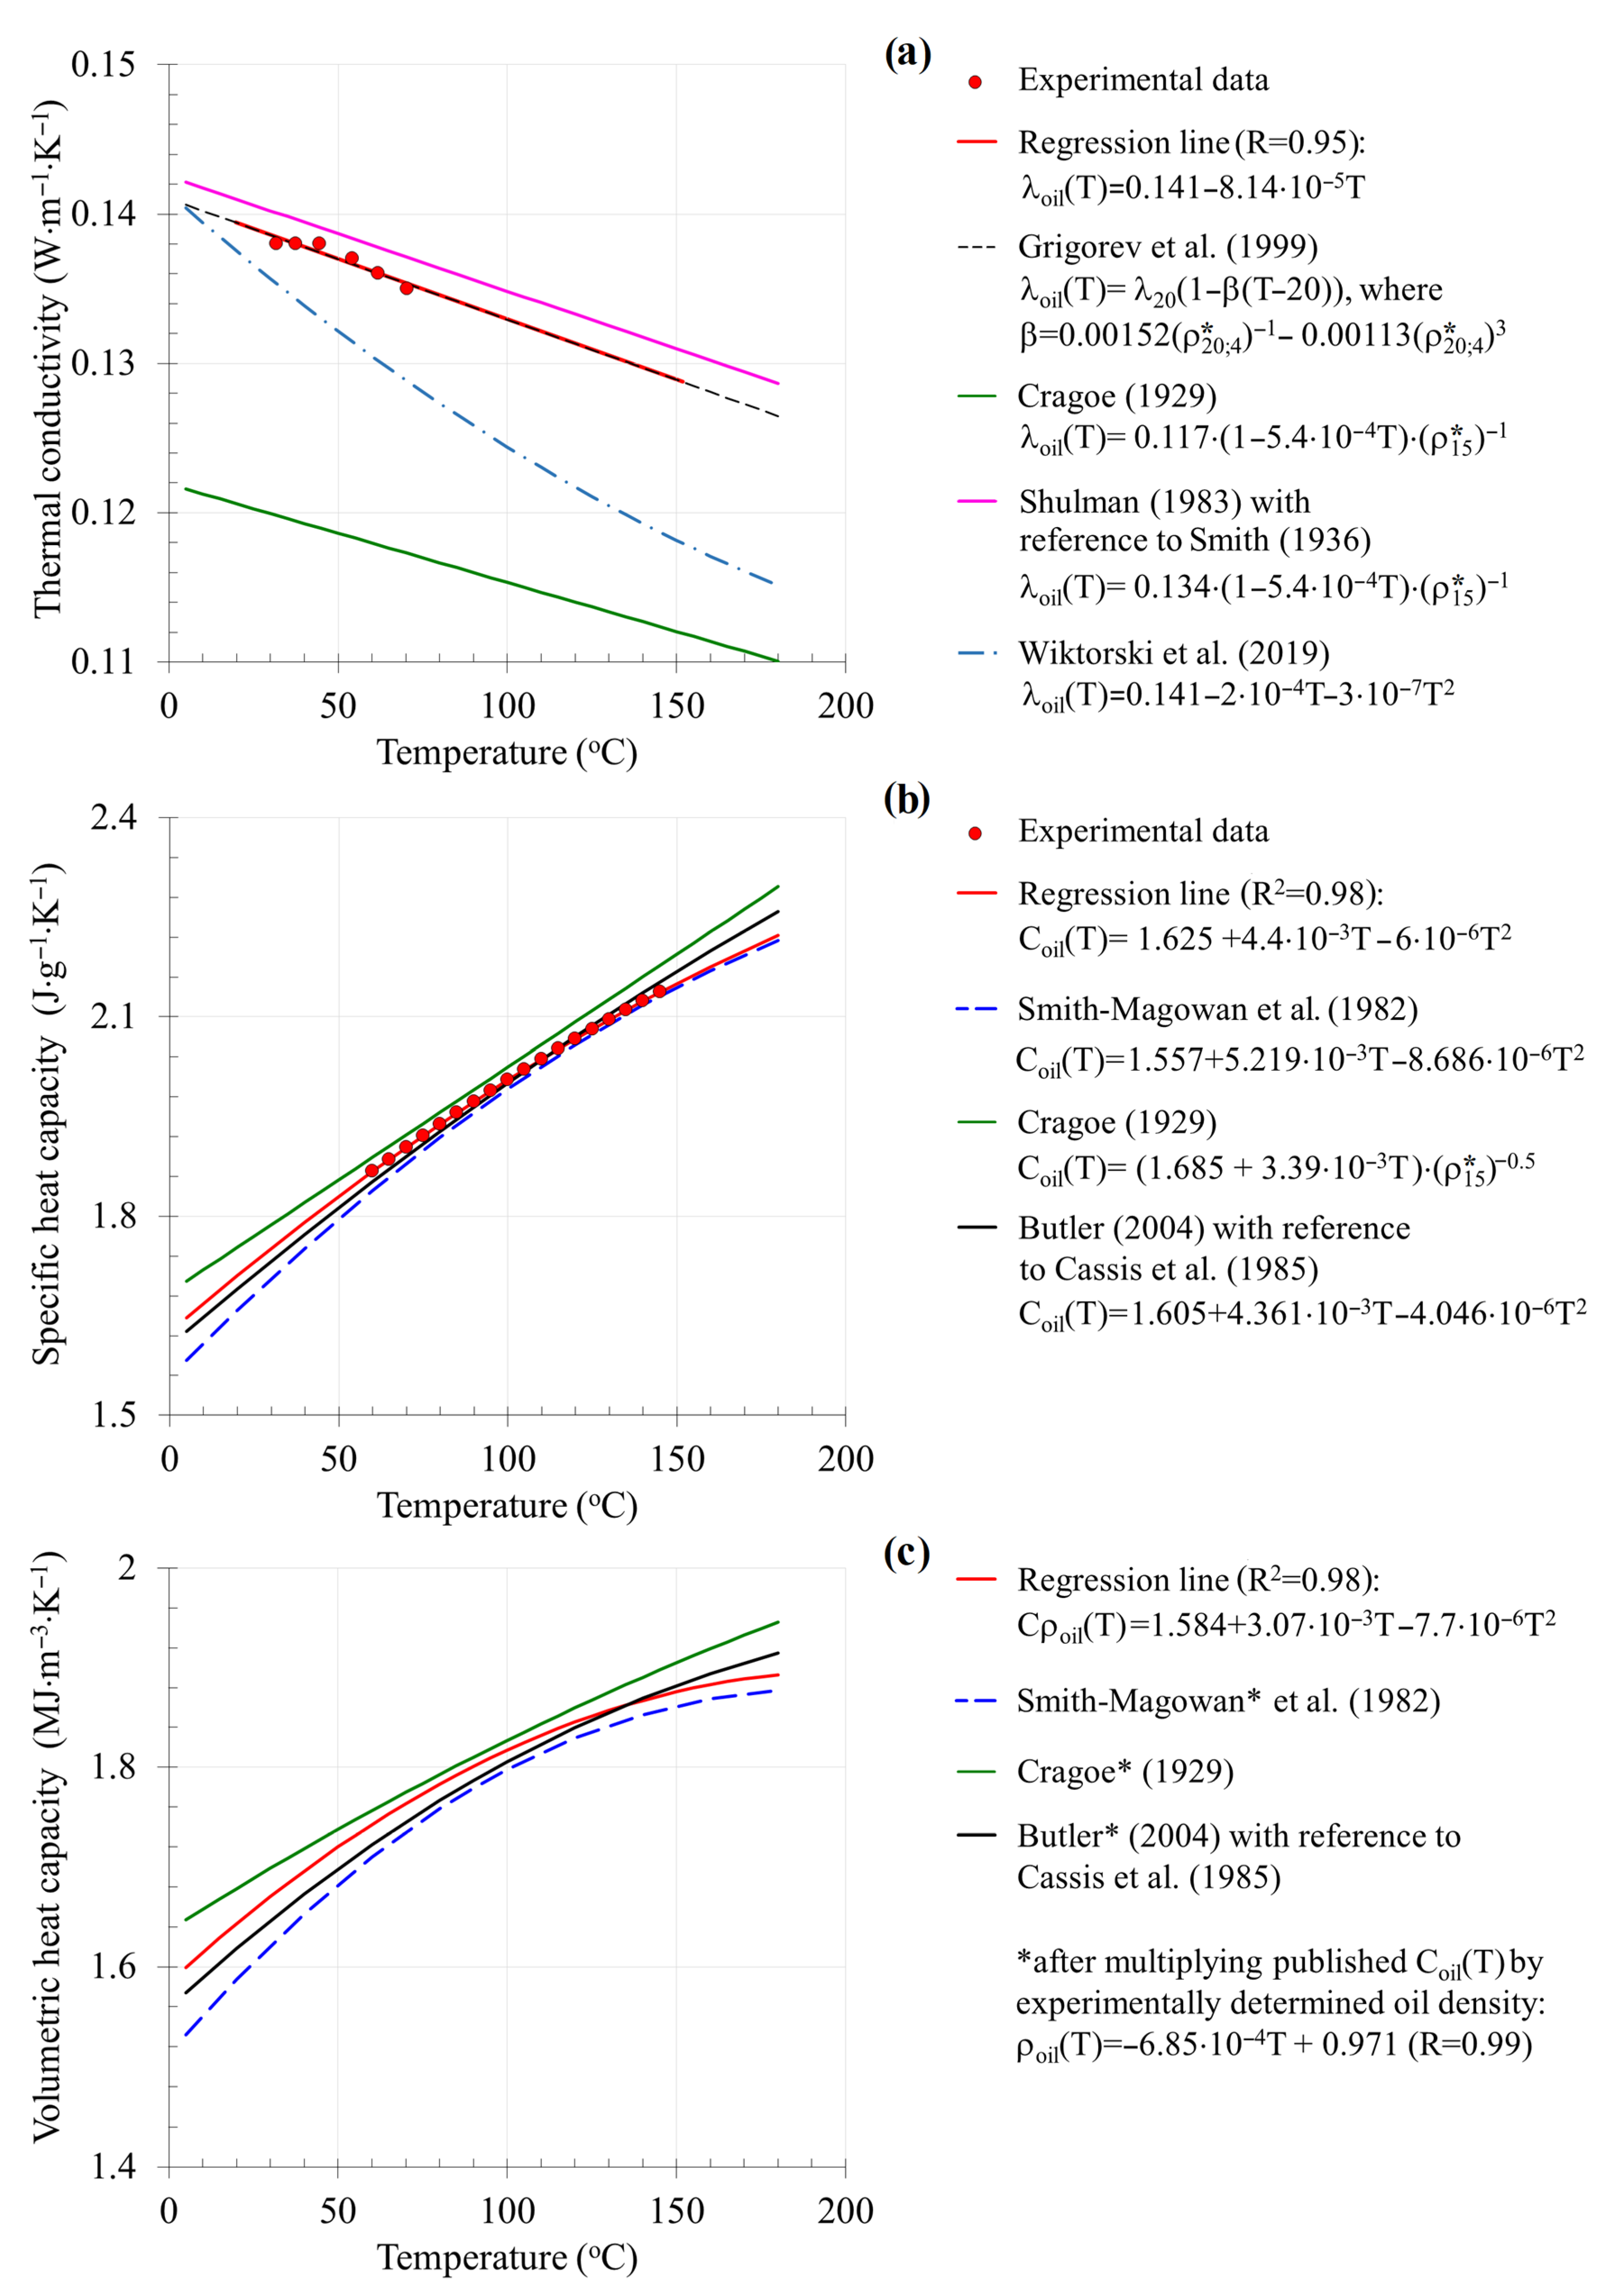
4.3.3. Oil Thermal Conductivity and Heat Capacity at Formation Temperature

The results of measuring the oil thermal conductivity λoil within the range from 30 to 70 °C with subsequent extrapolation to the temperature range from 8 to 180 °C are shown in Figure 6a. The experimental results are in good correlation with the calculation results based on the linear dependence obtained from processing data on 41 oil samples from various fields by Grigoriev et al. [39]. Notably, according to [39], the thermal conductivity of oil at 20 °C, λ20, can be calculated using the oil pour point, whereas we used the experimental values of λ20.
The discrepancy between the results of the experiment in the Karabikulovskoye field oil samples and those of Smith [40] and Shulman [41] is less than 2%. Cragoe’s results [42], derived from experimental data with 18 different types of oil and often used in practice (see, e.g., [5]), demonstrate a similar decrease in thermal conductivity with temperature when the λoil values are systematically underestimated by 13%. Note that Figure 6a shows the formula from Cragoe’s work after converting the values to the SI system. The degree of decrease in λoil with temperature, which is consistent with the results of [39,40,42], is approximately 1.8 times lower than the value obtained by Wiktorski et al. [43]. When calculating λoil using the known formulas, we used, where necessary, the experimentally obtained temperature dependence of oil density ρoil ((T) = −6.85 × 10⁻⁴ T + 0.971, R = 0.99) and the relative oil density ρT * (ρ20;4 * means the ratio of oil density at 20 °C and the density of formation water at 4 °C; ρ15 * means the ratio of oil density at 15 °C and density of formation water at 15 °C).
The averaged results of two measurements (Figure 6b) of oil-specific heat capacity Coil in the range from 60 to 145 °C are in very good agreement (less than 1.5% discrepancy) with the results of the calculations using the equation obtained from the analysis of 13 different heavy oils and bitumen ([5] with reference to Cassis et al. [44]); with the experimental results of Smith-Magowan et al. [45], obtained with four samples of bitumen from Athabasca sands; and with Cragoe’s formula [42], obtained from the analysis of experimental data on 30 oil samples with a relative density in the range of 0.75–0.96.
The temperature dependence of the volumetric heat capacity Cρoil(T) of the Karabikulovskoye oil field (Figure 6c) was determined by the product of experimentally determined Coil(T) and ρoil(T). Comparison with the results obtained on the basis of published data on Coil(T) showed that the smallest discrepancy (less than 1.5%) was observed with the calculations based on Butler’s formula [5].
According to the conducted studies, the thermal conductivity of oil decreases in the temperature range from 8 to 180 °C by 15%, and the volumetric heat capacity increases by 18%, which is generally consistent with the reference data on the dependence of oil thermal properties on temperature (see Figure 6, where the temperature in all equations is given in °C).

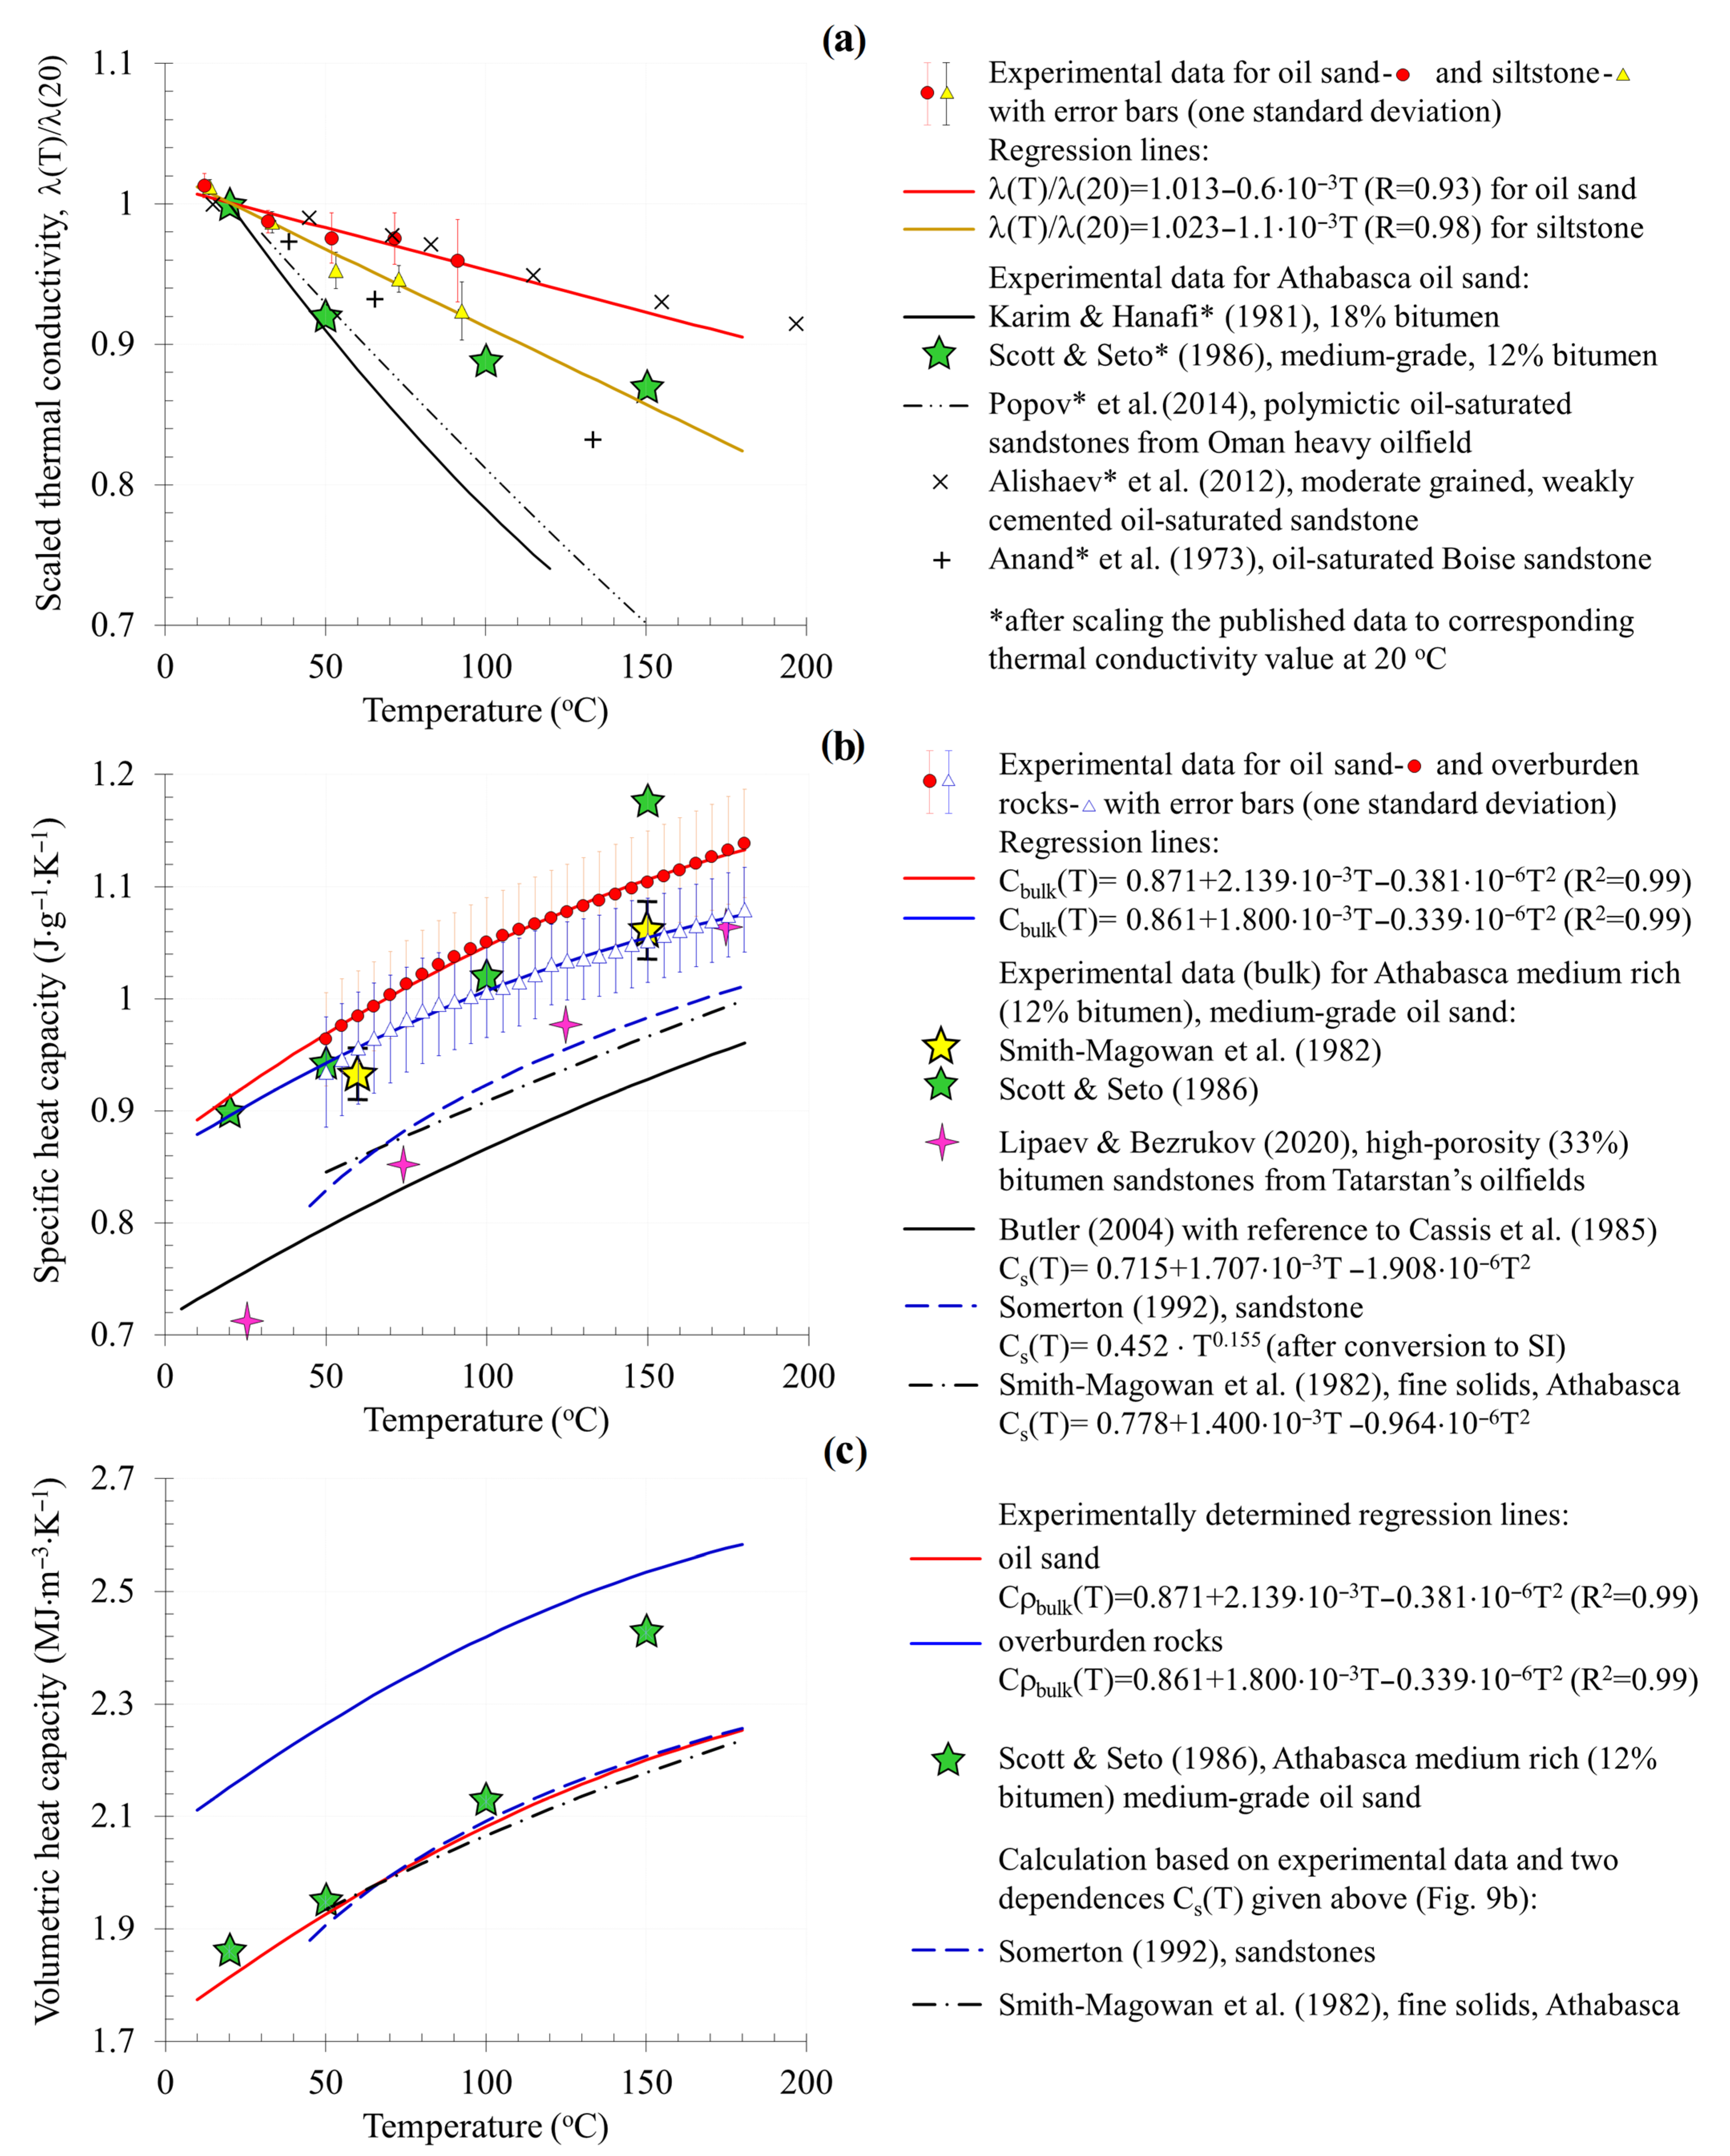
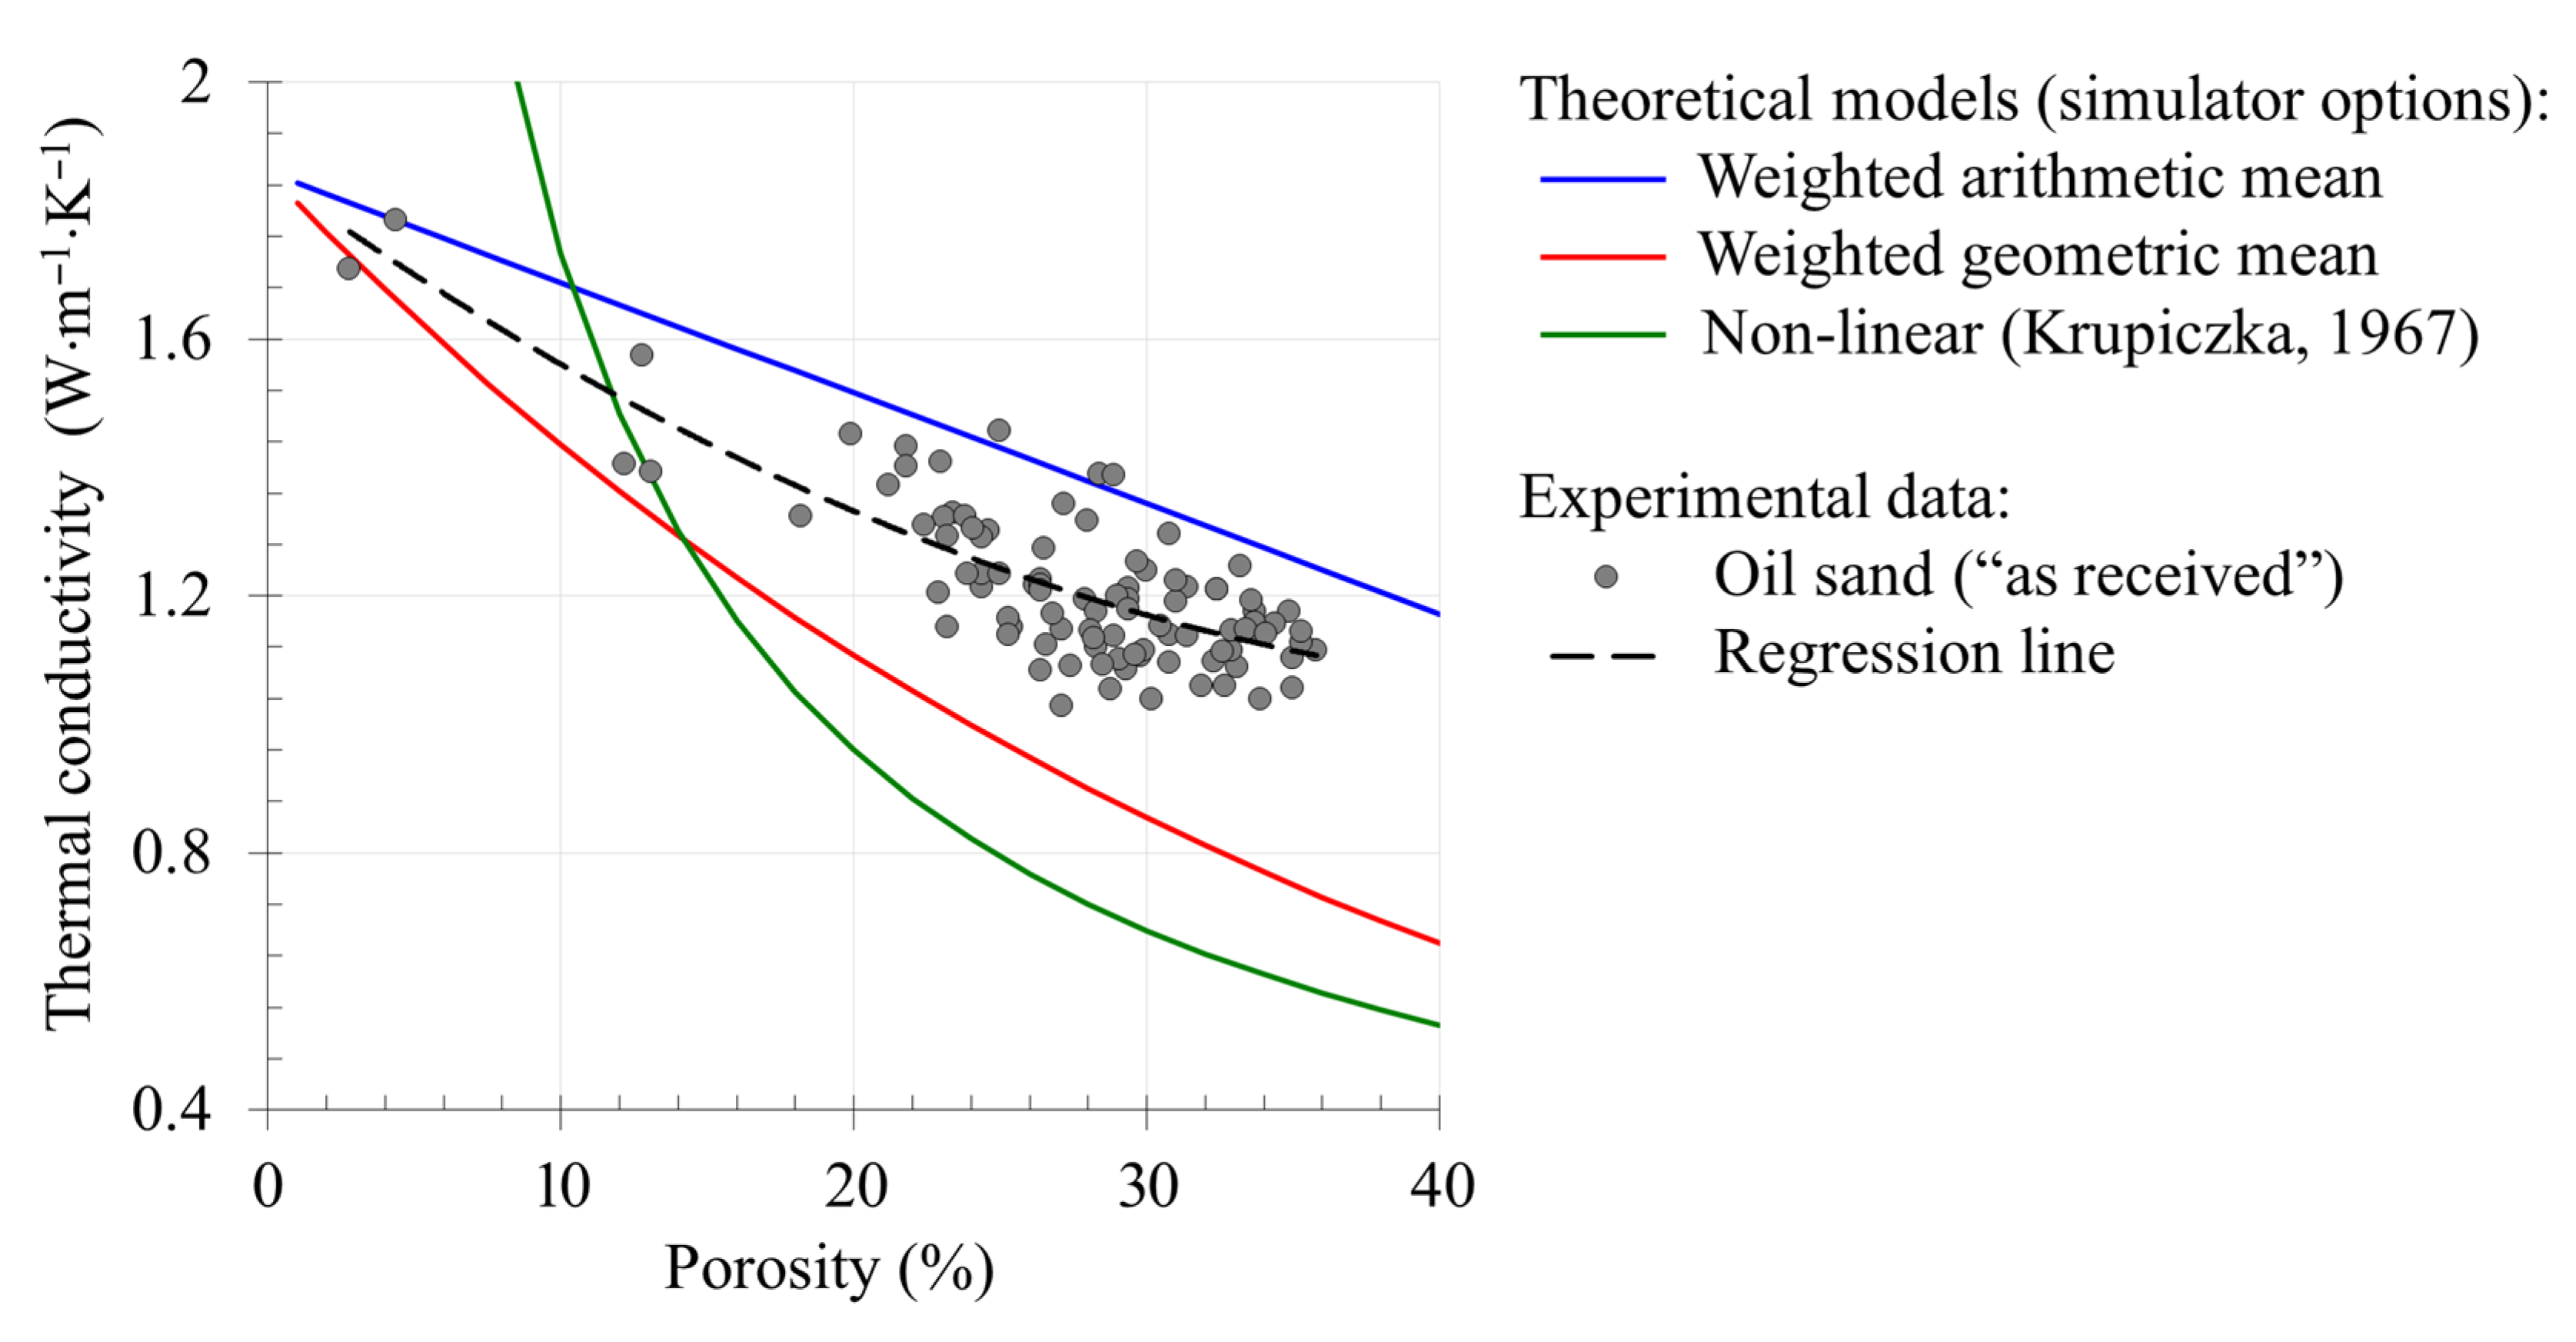
4.3.4. Thermal Conductivity of Rock at Formation Temperature

The results of determining the thermal conductivity of the Karabikulovskoye field rock in an “as-is” state (without pore fluid extraction) in the temperature range from 8 to 180 °C are shown in Figure 7. The results vary widely for both oil sands (from 1.06 to 1.46 W·m−1·K−1 with the exception of the values for sample 8, which are 30% higher than the values of the other samples due to pyritization; Figure 7a) and for siltstones (1.3–1.98 W·m−1·K−1; Figure 7b). Similar variations in the experimental data were also noted by Cervenan et al. [36] and Karim and Hanafi [46] and can be explained by many factors: differences in the porosity of samples and granulometric composition, saturation with bitumen and water, and differences in the degree of cementation.
Comparisons of the established range of absolute thermal conductivity values and published data have shown the following regarding the results for the oil sands of the Karabikulovskoye field:
  • They are in good agreement with experimental results from Athabasca oil sands [36,46,47];
  • They are approximately 1.5 times lower than the λ of medium-rich (12% bitumen content) medium-grade Athabasca oil sand [48], 1.6 times lower than the λ of Boise sandstone with a porosity of 29% saturated by silicon oil [49], and 2.5 times lower than the λ obtained by Alishaev et al. [50] with oil-saturated, moderately grained, “weakly cemented sandstone” (Solonchak, Dagestan Republic, Russia) with a porosity of 13%;
  • They are approximately 2–3 times higher than the values (0.395–0.580 W·m−1·K−1) obtained by Lipaev and Bezrukov [51] with samples of highly porous, finely grained bituminous sands of the Ufa stage from the fields of Tatarstan (underestimated λ values of rocks with similar porosity, burial time, and depth are probably associated with methodological shortcomings of the investigation method used in [51]).
Comparison with the data in the paper of Ramazanova and Emirov [52] is not shown in Figure 7, because dried samples of fine-grained sandstone characterized by a much lower porosity (by five times; in our case, the average porosity of samples studied at elevated temperature was 29%) were studied in [52]. The same applies for comparison with the paper of Abdulagatova et al. [53], which was devoted to the effect of temperature and pressure on the thermal conductivity of dry sandstone having a porosity of 13%.
According to the conducted research, when the temperature increases from 8 to 180 °C, the thermal conductivity of the Karabikulovskoye field oil sands decreases by 11% (red line in Figure 7a). A similar decrease of 8% in thermal conductivity with an increase in temperature from room temperature to 150 °C shows the following:
  • Consistency with the experimental results [50] obtained with oil-saturated, moderately grained, poorly cemented sandstone;
  • Results that are 1.5 times lower than the experimental results [48] obtained with a single sample of Athabasca bituminous sandstone (green asterisks in Figure 7a);
  • Results that are 3.5 times lower than the experimental results [26] obtained with oil-saturated samples from heavy oil fields in Oman;
  • Results that are four times lower than the experimental results [46] obtained with a sample of Athabasca sandstone with 18% bitumen content (black curve in Figure 7a).
The observed decrease in thermal conductivity is radically different from the experimental data [51], which show an increase in thermal conductivity with an increase in temperature in the range from 25 to 225 °C.
The established temperature dependence of the thermal conductivity of oil sands was also compared with the calculations in some published reports based on the experimentally determined average value of thermal conductivity under normal conditions (1.29 W·m−1·K−1). The formula of Vosteen and Schellschmidt [54] for sedimentary rocks, which is often referred to in various studies, shows a slower (by approximately 1.6 times) rate of decrease in thermal conductivity with temperature in the case of oil sands. However, it is worth noting that the work [54] is based on experimental results obtained with dry rocks. A fundamental difference from the experimental data obtained for oil sands is observed when using the formulas of Anand et al. [49], Kutas and Gordienko [55], and Sekiguchi [56]. In contrast to the experimentally demonstrated decrease, the λ (T) calculated using these formulas increases with increasing temperature if λ20 is lower than 1.84 W·m−1·K−1 for the formula of Sekiguchi [56] or lower than 1.38 W·m−1·K−1 for the other formulas [48,53]. Comparison with the formula of Tikhomirov [57], which is often used in practice, is unacceptable in our case, since the formula is derived for water-saturated rocks. The application of the simplified Tikhomirov formula given by Somerton [58] demonstrates an increase in the value of rock thermal conductivity with increasing temperature.
When the temperature increases from 8 to 180 °C, the thermal conductivity of Karabikulovskoye field siltstone decreases by 19% (the brown line in Figure 7b). The calculation results for siltstone thermal conductivity using the formula of Vosteen and Schellschmidt [54], using the experimentally determined average value of λ20 of five samples (1.804 W·m−1·K−1), differ slightly from the experimental dependence established by us (the discrepancy in the range of 8–180 °C does not exceed 1.5%). The formula of Kutas and Gordienko [55] shows a slower (approximately by 1.6 times) rate of decrease in thermal conductivity with increasing temperature. The use of Sekiguchi’s formula [56] leads to a slight increase in λ (T) with increasing temperature, which does not agree with our experimental results.
For convenience in analyzing data on the temperature dependence of thermal conductivity in the studied rock samples and their subsequent use, Figure 8a shows the generalized measurement results normalized to λ20.

4.3.5. Heat Capacity of Rocks at Formation Temperature

The results of determining the specific and volumetric heat capacity in the temperature range from 8 to 180 °C are shown in Figure 8b,c.
The range in specific heat capacity Cbulk variations (red and blue curves and corresponding markers in Figure 8b) is in good agreement with the experimental data of Cervenan et al. [36] (0.9–1.02 J·g−1·K−1 in the range of 23–74 °C), as well as with the experimental results of Scott and Seto [48], obtained with one sample, and the results of Smith-Magowan et al. [45], obtained with 18 samples of Athabasca oil sands (Figure 8b). The obtained values exceed the values of the published temperature dependence for the specific heat capacity of the Cs(T) matrix of sandstones (dotted curves and solid black curve in Figure 8b) due to the presence of bituminous oil in pores, the specific heat of which is approximately 2.5 times higher than the specific heat of rocks’ solid part (see the results in Figure 6b and Figure 8b). For comparison, Figure 8b shows the temperature dependences of Cs(T):
  • The dependence of Smith-Magowan et al. [45], obtained on seven finely grained samples of Athabasca oil sands (Canada) in the range of 50–300 °C;
  • The dependence of Somerton [58], obtained on two sandstone samples (the lower temperature limit is limited to 40 °C due to the lower reliability of results in this range);
  • The dependence for sandstones given by Butler [5] with reference to Cassis et al. [44].
The comparison of our results with results on highly porous, finely grained, bituminous sands of the Ufa stage at Tatarstan fields [51] showed that the Cbulk of oil sands of the Karabikulovskoye field is much higher (by 10–30% depending on the temperature), and the rate of growth in Cbulk with increasing temperature is approximately 1.5 times lower.
The experimental formulas of volumetric heat capacity Cρbulk obtained by the product of the specific heat capacity (Cbulk) and density (ρbulk) are shown in Figure 8c as solid lines. The average density of the samples studied was 2.40 g/cm3 for clays and 1.99 g/cm3 for sandstones. When the temperature increases from 8 to 180 °C, the volumetric heat capacity of oil sands increases by 27%. The observed range of variations is in good agreement with the experimental data of Cervenan et al. [36] (1.7–2.27 MJ·m−3·K−1 in the range of 23–74 °C) and the data of Scott and Seto [48] obtained with several samples of Athabasca bituminous sands (green asterisks in Figure 8c). The established degree of change in Cρbulk with increasing temperature is 1.35 times higher than the corresponding value for oil-saturated sandstone samples from heavy oil fields in Oman [26].
The temperature dependence Cρbulk(T) for oil sands is in excellent agreement with the results of calculations (dashed lines in Figure 8c; the average discrepancy between the experimental and calculated data is less than 1%) performed on the basis of the obtained experimental data and the temperature dependences Cs(T) given by Somerton [58] and Smith-Magowan et al. [45]:
C ρ bulk = C s ( T ) ρ s ( T ) ( 1 - ϕ ) + C ρ o ( T ) ϕ
where ϕ is the average value of porosity of the samples studied in this experiment (27.8%), Cρo(T) is the experimentally obtained dependence of volumetric heat capacity on oil temperature (Section 4.3.3, Figure 6c), and ρs(T) is the sandstone matrix density [58]:
ρ s ( T ) = ρ s ( 20 ) 1 + 0.5 · 10 4 ( T 20 )
Here, instead of the value ρs (20) = 2.65 g/cm3 proposed by Somerton [58], we used the value of 2.39 g/cm3 obtained from the analysis of our experimental data. Note that the specified temperature dependence of the density could be ignored due to a negligible (less than 1%) change in density within the considered temperature range.

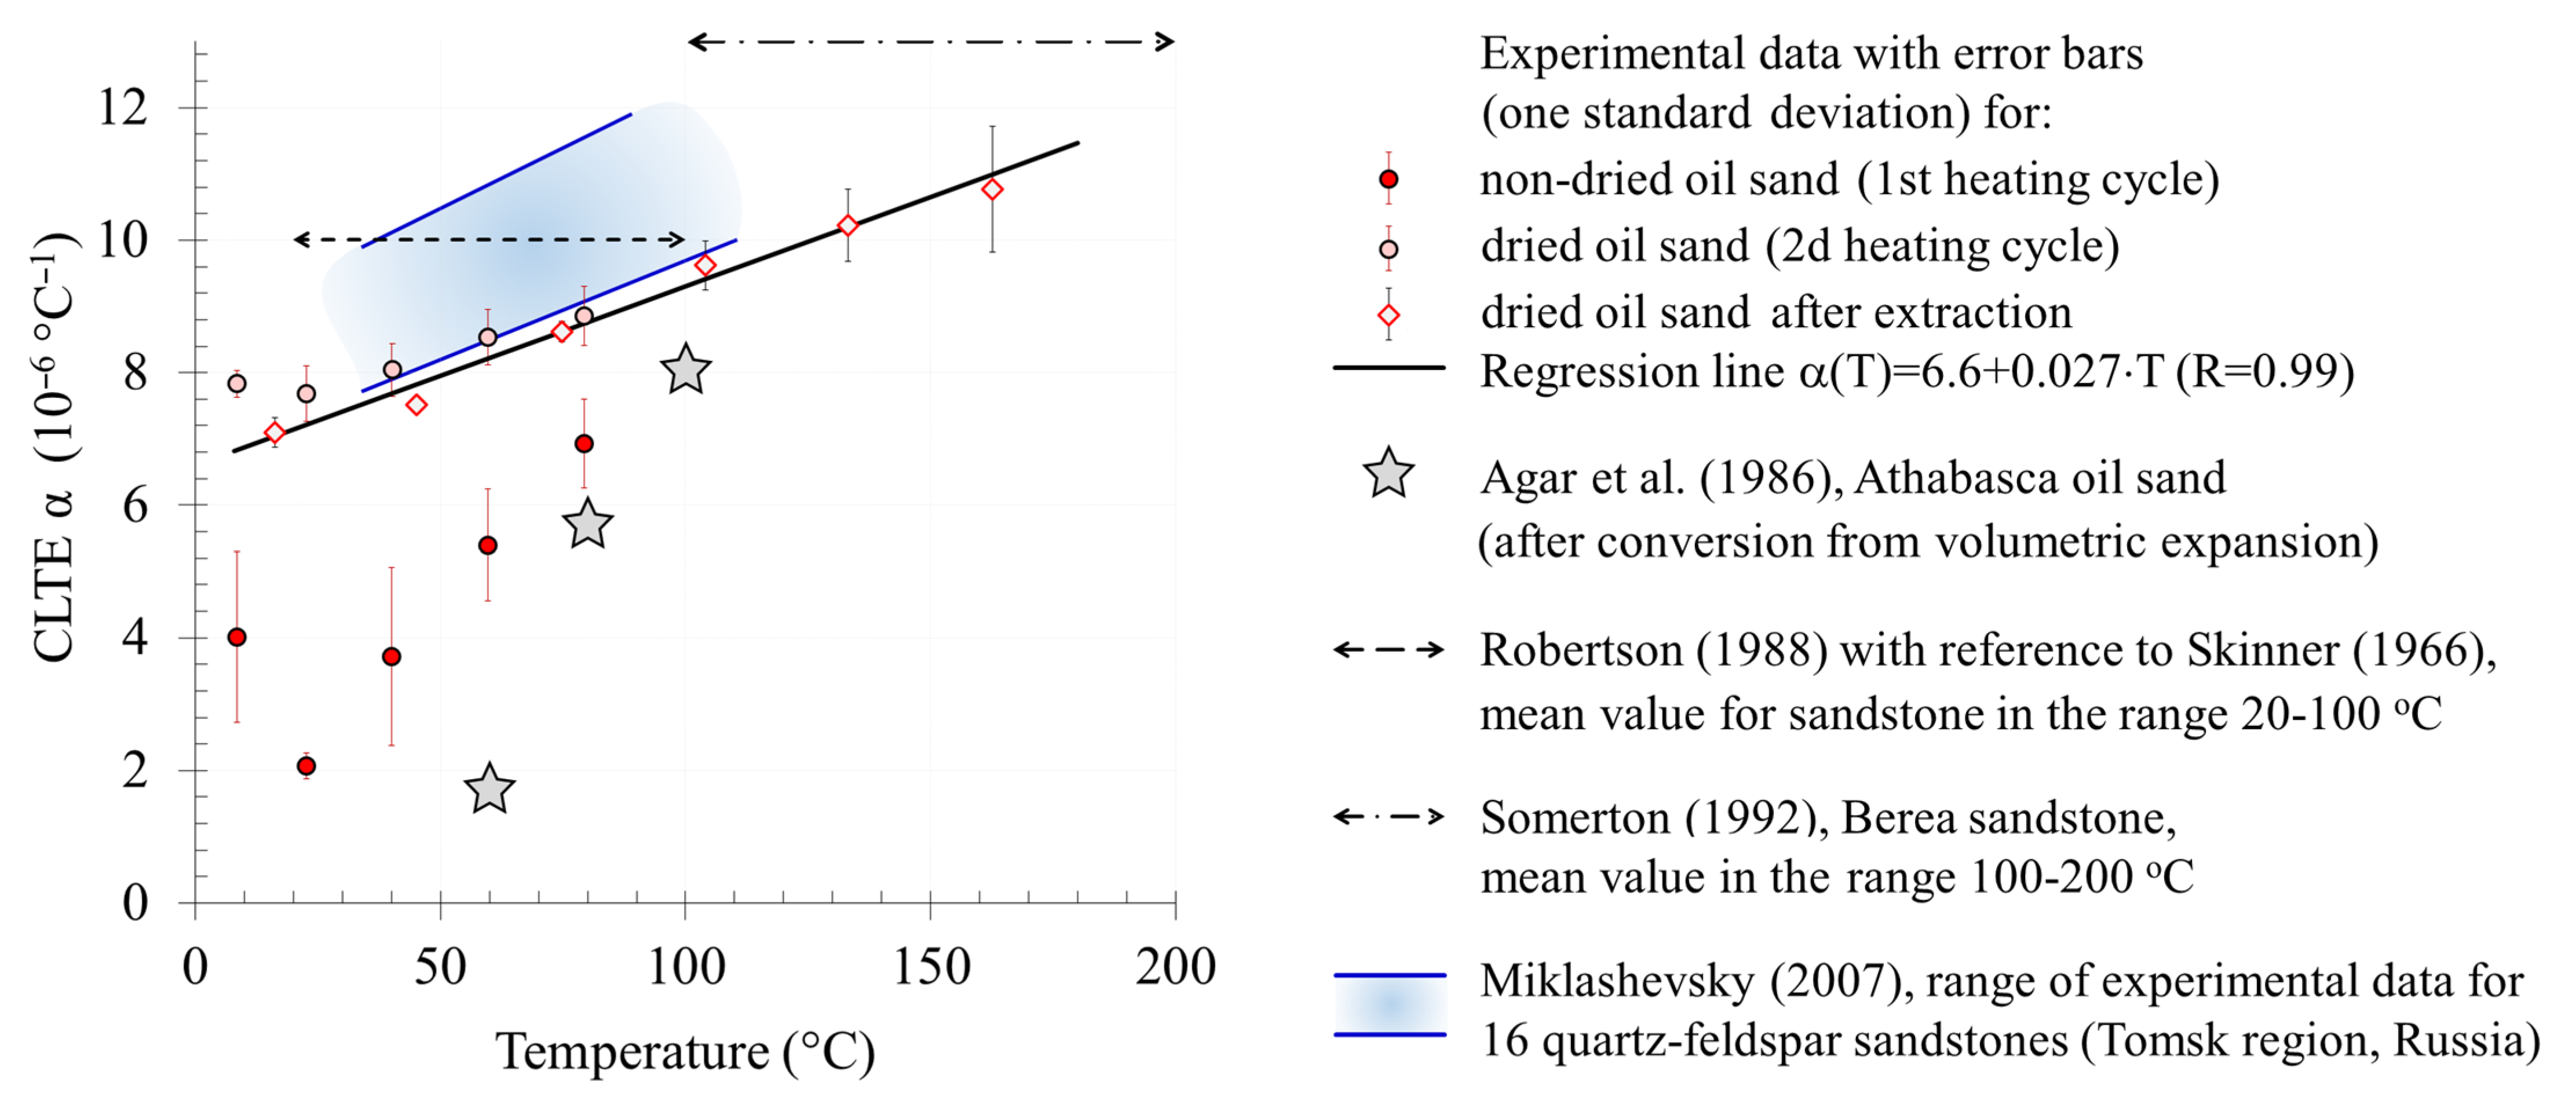
4.3.6. CLTE of Rocks at Formation Temperature

The results of determining the CLTE of rocks from the Karabikulovskoye field in the temperature range from 8 to 180 °C are shown in Figure 9. Experimental data were obtained on 15 samples in an “as-is” state (without pore fluid extraction). The CLTE for three of these 15 samples was measured for the second time (indicated in Figure 9 as the 2nd heating cycle) without removing the samples from the unit. For another six samples, the CLTE was measured in a dried state of the samples after pore fluid extraction.
At the initial stage (up to 50 °C) of the first heating, the CLTE values of non-extracted samples decreased. This behavior is consistent with the results of published studies [59,60,61,62] and is associated with the presence of pore fluid, which is a binding component for poorly consolidated sand. When heated, the properties of pore fluid change; part of the fluid flows out and/or evaporates, which leads to the shrinkage and displacement of individual rock particles and restructuring as a result of reducing the shear resistance at the intergranular contacts. In this case, the instrument detects a smaller elongation due to heating and consequently, a smaller CLTE. With further temperature growth, the CLTE begins to increase naturally, corresponding to the results of Agar et al. [61] obtained on samples of Athabasca bituminous sand (after reducing the volumetric coefficient to a linear one as divided by three).
Repeated measurements of a non-extracted sample without removing the sample from the device or measurements on the extracted samples show a lower rate of increase in CLTE with increasing temperature (the CLTE values increase by 68% when the temperature increases), while the CLTE values themselves are higher compared to the first measurement or measurement on non-extracted samples. It is consistent with the results of previous studies by Agar et al. [61] and Hartlieb et al. [62].
The measured range of CLTE values of the extracted dried (oven-dried) samples is typical for clastic rocks and is in good agreement with published data, usually given as a single number for a fixed temperature range: 1.0 × 10⁻⁵ °C−1 for sandstone in the temperature range of 20–100 °C [63], 10.8 × 10⁻⁶ °C−1 for fine-grained sandstone in the range of 20–80 °C [64], and 13 × 10−6 °C−1 for Berea sandstone in the range of 100–200 °C [58]. Figure 9 also shows the range of CLTE variations measured on 16 samples of quartz–feldspar sandstone of the Tomsk Region [65]. Note that the results obtained with the samples of the Karabikulovskoye field should not completely coincide with those published for a number of reasons, including differences in granular composition [64], type and degree of cementation, and mineral composition [62,63,65].

5. Effect of Application of Advanced Thermal Petrophysics Methods on the Results of THD Modeling

An analysis of the impact of modern methods of the thermal petrophysics on the results of THD modeling of oil recovery at the Karabikulovskoye field was carried out using a commercial simulator. A model of the production process SAGD was created for a section of about 1 km2, including thick sections (more than 10 m) of pay zone. The model included 12 pairs of horizontal injection and production wells. The distance between the horizontal sections of the wells was 100 m and that between the separate pairs of wells was 75–100 m. Due to the high filtration resistance, the reservoir pre-heating process in wells was simulated for 120 days prior to the start of the steam injection. Fixed injection rates (150 t/d) were set as boundary conditions for the wells.
For the analysis of simulation results and publishing, we slightly simplified the calculations in the following way. First, the surrounding rocks were not explicitly modeled, and heat loss outside the reservoir was accounted for using the solution of Vinsome and Westerveld [19]. Second, the anisotropy of thermal conductivity was not taken into account. Third, the reservoir included only one litho-physical type—oil sands. The analysis is based upon the comparison of two calculation results—options A and B—that differ only in the initial data on thermal properties (see Table 4 and Section 5.1). The correction of thermal properties for pressure was not performed because firstly, simulator developers do not provide the corresponding option, and secondly, the pressures in this case were small, and therefore, the correction would be insignificant (see, e.g., [65]).
Note that the simulator used here is widely used in the world and has extensive capabilities (relative to the vast majority of other THD simulators) for integrating data on thermal properties into a model. We avoided naming the software used as similar shortcomings in setting the thermal properties of rocks in a model are valid for any other simulator, and similar conclusions after modeling can be reached (see Section 2). A clear example of the fact that the input of properly defined values of λs into a simulator does not guarantee obtaining bulk values in the model that are close to those experimentally determined is shown in Figure 10. For the average porosity value (28%), the discrepancy in bulk λ calculated using different options is significant (up to 100%) and calculated values do not fit the results of the experiment (the difference is 8%, 28%, and 42% for the weighted arithmetic, geometric, and Krupiczka [66] formulas, respectively). These results clearly demonstrate the necessity of the procedure proposed in Section 5.1 for adapting the results of experimental studies to the capabilities of a simulator (until the corresponding simulator option is improved).

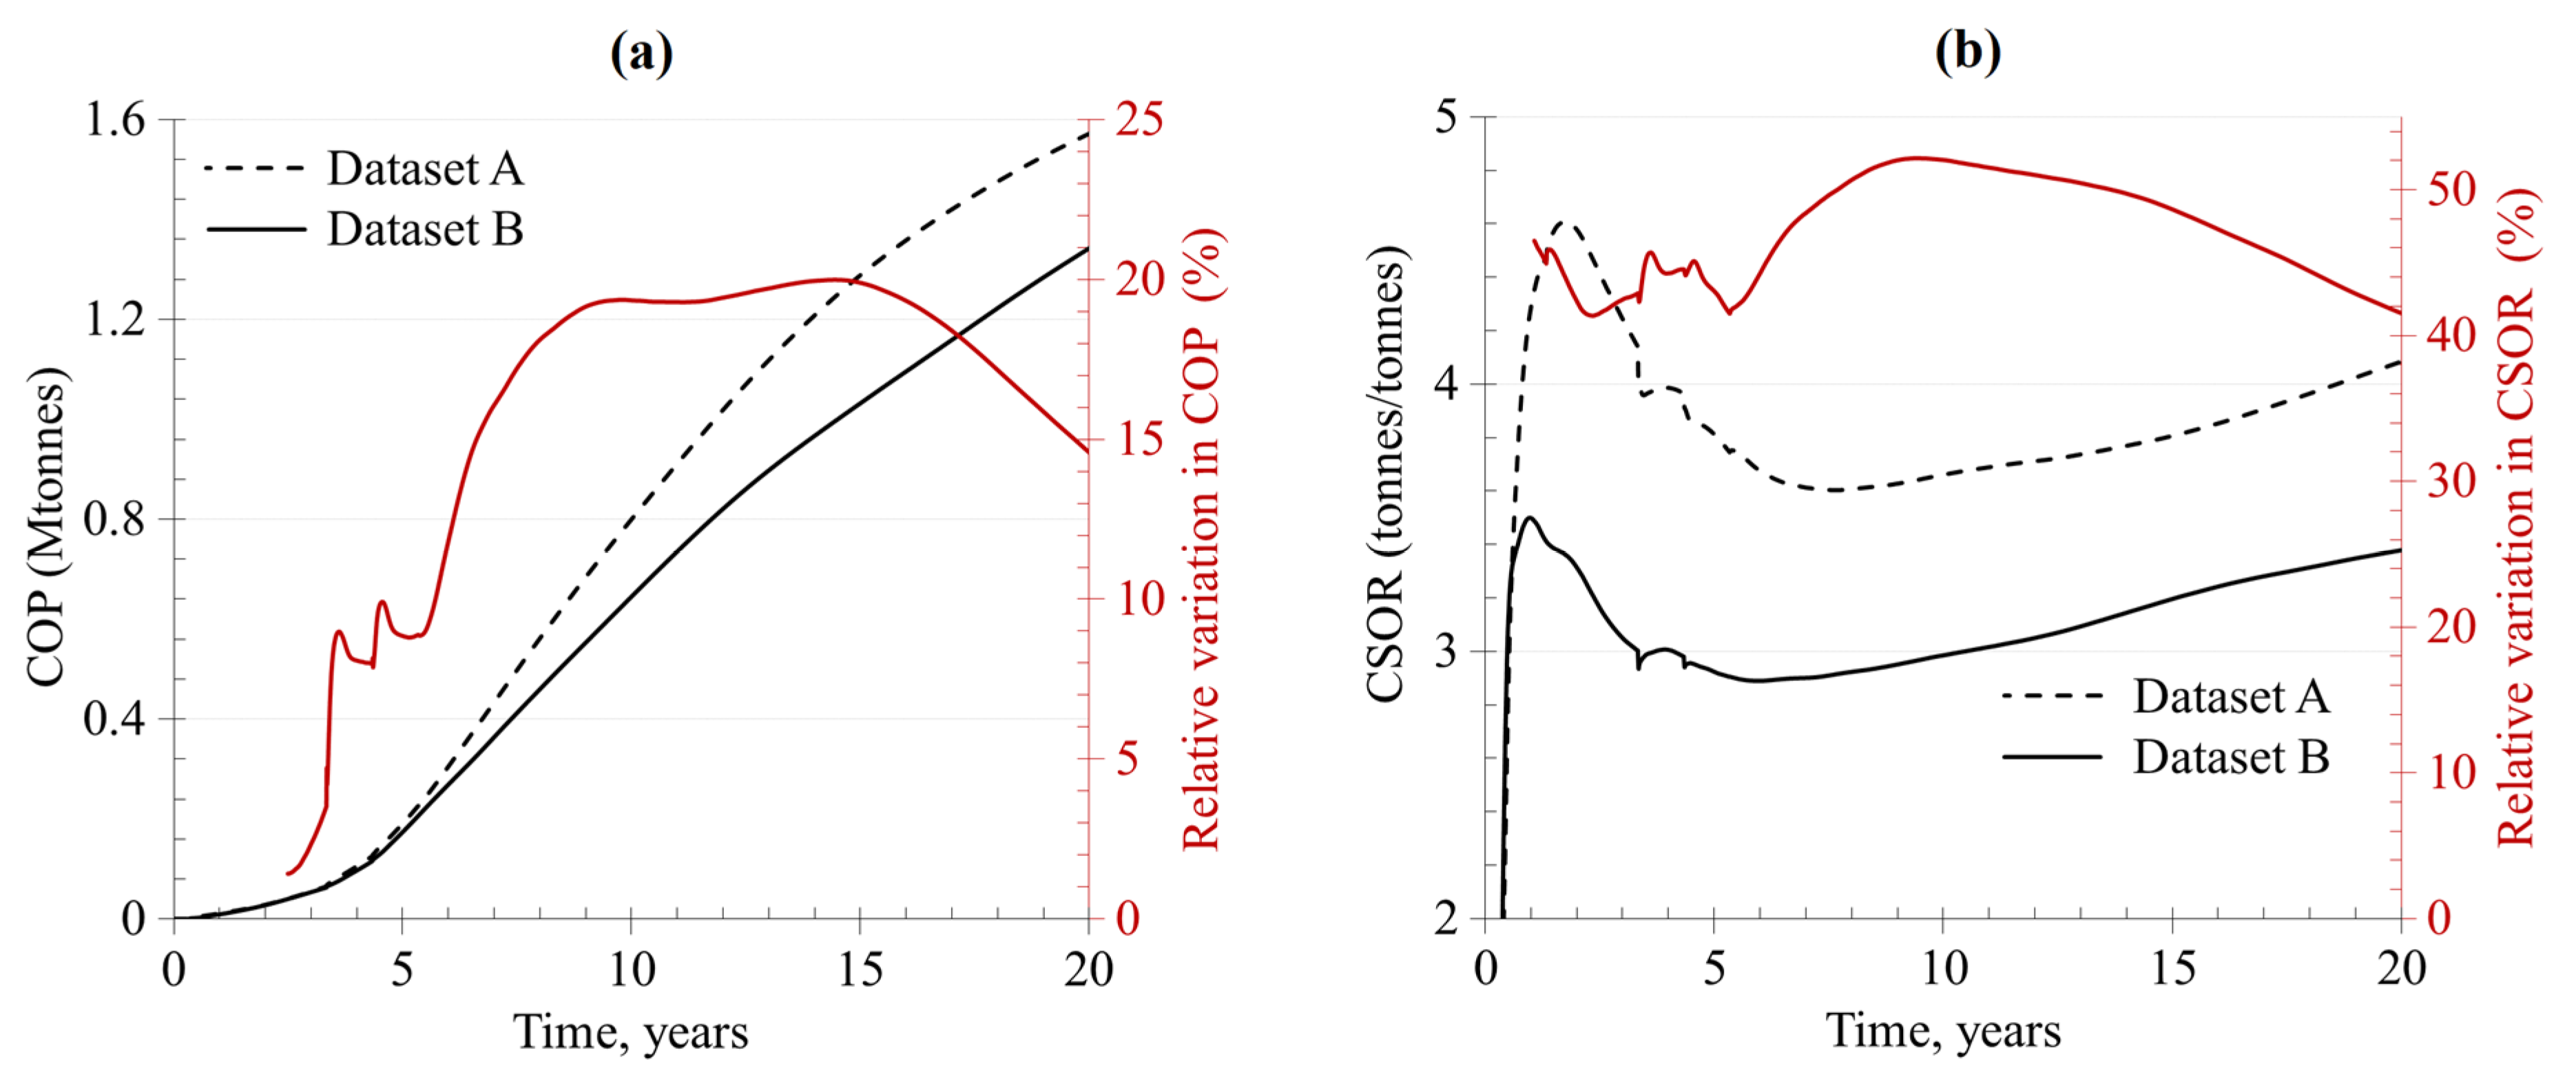
5.1. Two Variants of Input Data on Thermal Properties

In dataset A, the thermal properties (Table 4) were prepared by engaged specialists based on the analysis of published data (primarily the book by Butler [5]), data taken from other heavy oil fields, and the “default” data from the simulator. In particular, the thermal conductivity of the sandstone matrix (7.03 W·m−1·K−1) was calculated using the volumetric fraction of quartz (assumed to be 0.86) using the well-known formula of Somerton [58]. For the surrounding rocks, the thermal conductivity (1.7 W·m−1·K−1) was chosen based on the properties of wet shale. The bulk heat capacity of the oil sand matrix (2.32 MJ·m−3·K−1) was calculated using the specific thermal capacity formula of Cassis et al. [45] and averaged over the given temperature range. For the thermal conductivity of oil, the value was taken as 0.093 W·m−1·K−1. The value of the specific thermal capacity of oil (2.09 J·g−1·K−1) was taken from the simulator database, and the remaining values were taken from data from other high-viscosity oil fields in Russia. No recommendation about the choice of mixing rule for thermal conductivity was given.
We prepared dataset B based on the analysis of the experimental data obtained, taking into account the features of the simulator applied. The temperature dependence of the reservoir rock matrix thermal conductivity (Table 4) was calculated according to a specially developed procedure based on the results of the above-described experimental studies (the temperature dependence in the range of 8–180 °C, results of thermal core profiling, and porosity determination) and available simulator options for the integration of thermal conductivity data into the model. The procedure included (1) calculation of effective thermal conductivity values using all incorporated mixing rules in the characteristic range of porosity variations for the reservoir (see Figure 10) and (2) selecting the simulator option and determining the λs in such a way so as to ensure minimal discrepancy between the calculated and experimentally determined bulk thermal conductivity values. We emphasize that the value of the matrix thermal conductivity determined in this procedure will differ from the actual value, which is caused by the limited capabilities of the simulator for the integration of thermal conductivity data into a model. The temperature dependence of the volumetric reservoir rock thermal capacity was calculated using experimental data on the porosity and volumetric heat capacity of oil (Figure 6c) and oil sands (Figure 8c). Note that the simulator does not allow for setting a nonlinear temperature dependence of rock matrix volumetric heat capacity, so the established relationship was approximated by a linear dependence. The values of the thermal conductivity of the overburden and underburden rocks (1.12 and 1.67 W·m−1·K−1, respectively) were selected in accordance with the experimental data in Table 3 (cylindrical samples). Note that the perpendicular component of effective thermal conductivity is set, since the contribution of this component is responsible for heat leakage from the reservoir. The simulator’s option for accounting for heat loss to the surroundings is based on the solution of Vinsome and Westerveld [19] and does not imply the use of the established temperature dependence of thermal properties but does imply the use of bulk thermal properties. As a result, a constant value of λbulk and Cρbulk (2.03 MJ·m−3·K−1) was set according to Table 3 (the average Cρbulk value of overburden and underburden rocks was chosen). Generally speaking, in the solution [19], the heat loss to the surroundings is directly proportional to the thermal inertia (the square root of the product λbulk and Cρbulk of the surroundings).
From Table 4, it can be seen that in dataset A, compared to dataset B, that thermal properties are taken without accounting for temperature dependence, data on λs are overstated by ~4 times on average, data on Cρs are overstated by 7% on average, data on λbulk of overburden are overstated by 50%, data on Cρbulk are overstated by 14%, data on λoil are underestimated by 30% on average, data on Coil are overstated by 6% on average, and data on CLTE are underestimated by two times on average.

5.2. Simulation Results and Their Analysis

The analysis was based on the assessment of changes in the results of determining the main parameters of development—cumulative oil production (COP) and cumulative steam/oil ratio (CSOR)—depending on the time for two datasets (A and B). Both parameters are important because they are used to evaluate the revenue and costs when calculating economic indicators. Note that we did not conduct a caprock integrity analysis, which is undoubtedly a very important task (a violation of integrity caused by an incorrect selection of the recovery method or its technological parameters has disastrous consequences for the corresponding sector of the field). Comprehensive analysis of the consequences remains outside the scope of this study because (1) it depends on the selected method of coupling the hydrodynamic and geomechanical solutions (in particular, on how exactly the porosity depends on pressure, temperature, bulk deformation, or stress), and (2) it should involve specialized geomechanical software, e.g., ABAQUS of Dassault Systems, VISAGE of Schlumberger, FLAC of Itasca Consulting Group, etc.; see examples in [67,68,69].
The results of comparing the main parameters of the development efficiency are shown in Figure 11. Overestimation of λs in option A leads, on the one hand, to an underestimation of the maximum temperature near the steam chamber and, on the other hand, to an overestimation of the heated volume (conductive heat exchange is the main mechanism for heat transfer near the boundaries of the steam chamber) and, as a result, to an overestimation of COP compared to option B. This overestimation is partially compensated by an underestimation of λoil and an overestimation of the volumetric heat capacity of the rock matrix and oil (see the corresponding studies in [1]). Overestimation of Cρs leads to an overestimation of energy for heating the reservoir and consequently, to an overestimation of the CSOR. The overestimation of the thermal inertia of the surroundings leads to an overestimation of heat loss from the reservoir and consequently, to an additional overestimation of CSOR. The level of uncertainty influence in rock thermal properties changes over time and leads to significant errors in the prediction of key parameters of development (up to 20% in the COP and up to 52% in the CSOR). The error in COP is lower than the error in CSOR, as the overestimation of every parameter (the thermal inertia of the surroundings governing heat loss from the reservoir, the volumetric heat capacity of reservoir rocks governing the energy for the reservoir heating, and the thermal conductivity of reservoir rocks governing the size and temperature of a heated zone near the steam chamber) results in increasing the CSOR in option A compared to option B. Simultaneously, the error in COP caused by thermal conductivity overestimation is partially compensated by the overestimation of the volumetric heat capacity, as more energy is needed to heat the rocks to the same temperature (a detailed study of this effect can be found in [1]).

6. Conclusions

In order to provide the data necessary for thermo–hydrodynamic (THD) modeling of Karabikulovskoye high-viscosity oil field development using data on rock thermal properties, we studied the core material from two wells of the oil field using advanced methods of thermal petrophysics.
The following results were obtained from the complex experimental studies of the thermal properties conducted on 342 full-size core samples at room temperature and on 65 specially prepared rock samples and two oil samples at elevated temperatures:
  • Average values and the range of variations in properties for each lithological difference at room temperature (variations in thermal properties were significant and reached several hundred percent);
  • Temperature dependence of thermal conductivity and the specific and volumetric heat capacity of rocks and oil in the temperature range of 8–180 °C (with temperature growth, the thermal conductivity of oil sand decreased by 11%; siltstones—by 19%; the specific and volumetric heat capacity of oil sands increased by 27%; and the thermal conductivity of oil decreased by 15%, while the volumetric heat capacity increased by 18%);
  • Temperature dependence of rock CLTE in the temperature range of 8–180 °C (CLTE values increased by 68% with temperature growth).
It was established that the capabilities for integrating the data on thermal properties into the THD model built in any modern simulator are limited, are outdated in some aspects, and require revision. This leads to additional uncertainty in the effective (bulk) values of thermal properties used in numerical calculations.
The obtained experimental data were compared with the results of other field studies and were used for THD modeling of Karabikulovskoye field sector development with SAGD (after a special procedure of adaptation to the features of the simulator used). It was shown that, in view of the features of modern simulators for including data on rock thermal properties, the use of advanced methods of thermal petrophysics can increase the reliability of key parameters’ forecasting for the development of high-viscosity oil fields by tens of percent. In the considered sector of the Karabikulovskoye field, the cumulative oil production is specified by up to 20%, and the cumulative steam/oil ratio—by up to 52%.
The improvement of modern THD simulators in terms of providing the input of experimental data to eliminate the lag behind the modern capabilities of thermal petrophysics will lead to an increase in the reliability of simulation results.

Author Contributions

Conceptualization, E.C. and Y.P.; methodology, E.C., Y.P. and K.P.; software, K.P. and A.T.; validation, R.R., E.P., A.G. and M.B.; formal analysis, E.C., R.R., Y.P. and K.P.; investigation, E.C., R.R., E.P., A.G. and A.T.; resources, Y.P., M.B., I.K. and S.D.; data curation, E.P., A.G., M.B. and A.T.; writing—original draft preparation, E.C., R.R. and Y.P.; writing—review and editing, E.P., A.G., K.P., M.B., I.K. and S.D.; visualization, E.C., R.R. and A.T.; supervision, Y.P. and S.D.; project administration, E.P. and I.K. All authors have read and agreed to the published version of the manuscript.

Funding

This research received no external funding.

Data Availability Statement

Restrictions apply to the availability of these data. Data were obtained from LLC SamaraNIPIneft and are available from the corresponding author with the permission of LLC SamaraNIPIneft.

Acknowledgments

The authors of the paper express their sincere gratitude to their colleagues, Egor Savelyev, Dmitry Ostrizhny, and Sergey Pokhilenko from Skolkovo Institute of Science and Technology for their assistance in conducting petrophysical measurements, and to Tagir Karamov, a graduate student of this organization, for analyzing thin sections. The authors also express their gratitude to LLC SamaraNIPIneft for the permission to publish the obtained results.

Conflicts of Interest

The authors declare no conflict of interest.

References

  1. Popov, Y.; Chekhonin, E.; Parshin, A.; Law, D.H.-S.; Pissarenko, D.; Miklashevskiy, D.; Popov, E.; Spasennykh, M.; Safonov, S.; Romushkevich, R.; et al. Experimental Investigations of Spatial and Temporal Variations in Rock Thermal Properties as Necessary Stage in Thermal EOR. In Proceedings of the SPE Heavy Oil Conference, Calgary, AB, Canada, 11–13 June 2013. [Google Scholar]
  2. Popov, Y.; Popov, E.; Chekhonin, E.; Spasennykh, M.; Goncharov, A.; Gabova, A.; Zagranovskaya, J. Advanced Methods of Thermal Petrophysics and Directions of their Effective Applications for Investigations of Oil Shale Formations. In Proceedings of the EAGE/SPE Workshop on Shale Science, Moscow, Russia, 8–9 April 2019. [Google Scholar]
  3. Popov, E.; Popov, Y.; Chekhonin, E.; Safonov, S.; Savelev, E.; Gurbatova, I.; Ursegov, S.; Shakirov, A. Thermal core profiling as a novel and accurate method for efficient characterization of oil reservoirs. J. Pet. Sci. Eng. 2020, 193, 107384. [Google Scholar] [CrossRef]
  4. Chekhonin, E.; Popov, Y.; Peshkov, G.; Spasennykh, M.; Popov, E.; Romushkevich, R. On the importance of rock thermal conductivity and heat flow density in basin and petroleum system modelling. Basin Res. 2020, 32, 1271–1286. [Google Scholar] [CrossRef]
  5. Butler, R.M. Thermal Recovery of Oil and Bitumen, 4th ed.; GravDrain Inc.: Calgary, AB, Canada, 2004. [Google Scholar]
  6. Qin, Y.; Wu, Y.; Liu, P.; Zhao, F.; Yuan, Z. Experimental studies on effects of temperature on oil and water relative permeability in heavy oil reservoirs. Sci. Rep. 2018, 8, 1–9. [Google Scholar] [CrossRef] [Green Version]
  7. Mokheimer, E.M.A.; Hamdy, M.; Abubakar, Z.; Shakeel, M.R.; Habib, M.A.; Mahmoud, M. A Comprehensive Review of Thermal Enhanced Oil Recovery: Techniques Evaluation. ASME J. Energy Resour. Technol. 2019, 141, 030801. [Google Scholar] [CrossRef]
  8. Liu, Z.; Liang, Y.; Wang, Q.; Guo, Y.; Gao, M.; Wang, Z.; Liu, W. Status and progress of world-wide EOR field applications. J. Pet. Sci. Eng. 2020, 193, 107449. [Google Scholar] [CrossRef]
  9. McGlade, C.; Sondak, G.; Han, M. Whatever happened to Enhanced Oil Recovery? Available online: https://www.iea.org/commentaries/whatever-happened-to-enhanced-oil-recovery (accessed on 24 February 2021).
  10. Popov, Y.; Beardsmore, G.; Clauser, C.; Roy, S. ISRM Suggested Methods for Determining Thermal Properties of Rocks from Laboratory Tests at Atmospheric Pressure. Rock Mech. Rock Eng. 2016, 49, 4179–4207. [Google Scholar] [CrossRef]
  11. Chekhonin, E.; Parshin, A.; Pissarenko, D.; Popov, Y.; Romushkevich, R.; Safonov, S.; Spasennykh, M.; Chertenkov, M.; Stenin, V. When rocks get hot: Thermal properties of reservoir rocks. Oilfield Rev. 2012, 24, 20–37. [Google Scholar]
  12. Kiasari, H.H.; Sola, B.S.; Naderifar, A. Investigation on the effect of the reservoir variables and operational parameters on SAGD performance. Braz. J. Pet. Gas. 2010, 4, 59–69. [Google Scholar]
  13. Temizel, C.; Energy, A.; Balaji, K.; Ranjith, R.; Coman, C. Optimization of steam-flooding heavy oil reservoirs under uncertainty. In Proceedings of the SPE Asia Pacific Oil & Gas Conference, Perth, Australia, 25–27 October 2016. [Google Scholar]
  14. Durkin, S.M.; Menshikova, I.N. Effect of thermal properties of rocks to steam stimulation. J. Oil Gas Stud. 2017, 1, 50–53. [Google Scholar] [CrossRef]
  15. Morozyuk, O.A.; Barkovsky, N.N.; Rehachev, P.N.; Durkin, S.M.; Kalinin, S.A. The effect of thermally-conductive heating on reservoir rocks characteristics. Geol. Geophys. Dev. Oil Gas Fields 2018, 6, 46–53. [Google Scholar] [CrossRef]
  16. Zimmerman, R.W. Thermal conductivity of fluid-saturated rocks. J. Pet. Sci. Eng. 1989, 3, 219–227. [Google Scholar] [CrossRef] [Green Version]
  17. Clauser, C. Geothermal Energy. In Landolt-Börnstein, Group 8: Advanced Materials and Technologies; Heinloth, K., Ed.; Springer: Berlin/Heidelberg, Germany, 2006. [Google Scholar]
  18. Landau, L.D.; Lifshitz, E.M. Statistical Physics. Part 1, Vol. 5, Course of Theoretical Physics, 3rd ed.; Butterworth-Heinemann: Oxford, UK, 1980. [Google Scholar]
  19. Vinsome, P.K.W.; Westerveld, J.D. A Simple Method for Predicting Cap and Base Rock Heat Losses In’ Thermal Reservoir Simulators. J. Can. Pet. Technol. 1980, 19, 87–90. [Google Scholar] [CrossRef]
  20. Xue, L.; Dai, C.; Wang, L.; Chen, X. Analysis of Thermal Stimulation to Enhance Shale Gas Recovery through a Novel Conceptual Model. Geofluids 2019. [Google Scholar] [CrossRef]
  21. Egboga, N.U.; Mohanty, K.K.; Balhoff, M.T. A feasibility study of thermal stimulation in unconventional shale reservoirs. J. Pet. Sci. Eng. 2017, 154, 576–588. [Google Scholar] [CrossRef]
  22. Erofeev, A.A.; Mitrushkin, D.A.; Meretin, A.S.; Pachezhertsev, A.A.; Karpov, I.A.; Demo, V.O. Simulation of thermal recovery methods for development of the Bazhenov formation. In Proceedings of the SPE Russian Petroleum Technology Conference and Exhibition, Moscow, Russia, 24–26 October 2016. [Google Scholar]
  23. Klemin, D.V. Theoretical Modeling of Heat and Mass Transfer Processes in the Development of Heavy Oil Fields by SAGD. Ph.D. Thesis, Sergo Ordzhonikidze Russian State University for Geological Prospecting, Moscow, Russia, 2010. (In Russian). [Google Scholar]
  24. Irani, M.; Cokar, M. Discussion on the Effects of Temperature on Thermal Properties in the Steam-Assisted-Gravity-Drainage (SAGD) Process—Part 1: Thermal Conductivity. SPE J. 2016, 21. [Google Scholar] [CrossRef]
  25. Butler, R.M. New Approach to the Modelling of Steam-Assisted Gravity Drainage. J. Can. Pet. Technol. 1985, 24, 42–51. [Google Scholar] [CrossRef]
  26. Popov, Y.; Parshin, A.; Al-Hinai, S.; Miklashevskiy, D.; Popov, E.; Dyshlyuk, E.; Chekhonin, E.; Safonov, S.; Khan, R. Experimental investigations of reservoir thermal properties for heavy oil field in Oman with new methods and equipment. In Proceedings of the World Heavy Oil Congress, New Orleans, LA, USA, 3–6 March 2014. [Google Scholar]
  27. Gabova, A.; Popov, Y.; Savelev, E.; Romushkevich, R.; Chekhonin, E.; Plotnikov, V.; Emelyanov, D.; Akhmadishin, A. Experimental investigation of the effect of temperature on thermal conductivity of organic-rich shales. J. Pet. Sci. Eng. 2020, 193, 107438. [Google Scholar] [CrossRef]
  28. Gabova, A.; Chekhonin, E.; Popov, Y.; Savelev, E.; Romushkevich, R.; Popov, E.; Kozlova, E. Experimental investigation of thermal expansion of organic-rich shales. Int. J. Rock Mech. Min. Sci. 2020, 132, 104398. [Google Scholar] [CrossRef]
  29. ASTM E1530-11. Standard Test Method for Evaluating the Resistance to Thermal Transmission of Materials by the Guarded Heat Flow Meter Technique; ASTM Int.: West Conshohocken, PA, USA, 2011. [Google Scholar]
  30. ASTM E1269-11. Standard Test Method for Determining Specific Heat Capacity by Differential Scanning Calorimetry; ASTM Int.: West Conshohocken, PA, USA, 2018. [Google Scholar]
  31. ASTM E228-95. Standard Test Method for Linear Thermal Expansion of Solid Materials with a Vitreous Silica Dilatometer (Withdrawn 2005); ASTM Int.: West Conshohocken, PA, USA, 1995. [Google Scholar]
  32. ASTM D5334-14. Standard Test Method for Determination of Thermal Conductivity of Soil and Soft Rock by Thermal Needle Probe Procedure; ASTM Int.: West Conshohocken, PA, USA, 2008. [Google Scholar]
  33. Chekhonin, E.; Shakirov, A.; Popov, E.; Romushkevich, R.; Popov, Y.; Bogdanovich, N.; Rudakovskaya, S. The role of thermophysical profiling for core sampling for laboratory investigations of source rocks. In Proceedings of the EAGE/SPE Workshop on Shale Science, Moscow, Russia, 8–9 April 2019. [Google Scholar]
  34. KD2 Pro Thermal Properties Analyzer. Operator’s Manual; Decagon Devices Inc.: Pullman, WA, USA, 2016. [Google Scholar]
  35. Gilaev, G.G.; Khramtsov, A.A.; Semin, A.V.; Kiekbaev, A.A. Features of the technology of construction of steam injection wells for the extraction of natural bitumen deposits in the Samara region. Oil Gas Territ. 2018, 6, 14–26. (In Russian) [Google Scholar]
  36. Cervenan, M.R.; Vermeulen, F.E.; Chute, F.S. Thermal conductivity and specific heat of oil sands samples. Can. J. Earth Sci. 1981, 18, 926–931. [Google Scholar] [CrossRef]
  37. Lipaev, A.A. Geothermal modeling of bitumen deposits as an important stage in the design and regulation of thermal recovery methods. Neft. Gaz. Novacii 2010, 1, 28–33. (In Russian) [Google Scholar]
  38. Horai, K. Thermal conductivity of rock-forming minerals. J. Geophys. Res. 1971, 76, 1278–1308. [Google Scholar] [CrossRef]
  39. Grigorev, B.A.; Bogatov, G.F.; Gerasimov, A.A. Thermal Properties of Oil, Oil Products, Gas Condensates and Their Fractions; Moscow Power Engineering Institute: Moscow, Russia, 1999. (In Russian) [Google Scholar]
  40. Smith, J.F.D. The Thermal Conductivity of liquids. Trans. ASME 1936, 58, 719–725. [Google Scholar] [CrossRef]
  41. Shulman, Z.P. Oils Heat Exchanger Design Handbook, Vol. 5. Physical Properties; Edwards, D.K., Liley, P.E., Maddox, R.N., Matavosian, R., Pugh, S.F., Schunck, M., Schwier, K., Shulman, Z.P., Eds.; Hemisphere Publishing Corporation: Washington, WA, USA, 1983. [Google Scholar]
  42. Cragoe, C.S. Thermal Properties of Petroleum Products; U.S. Department of Commercial Bureau of Standards: Washington, WA, USA, 1929.
  43. Wiktorski, E.; Cobbah, C.; Sui, D.; Khalifeh, M. Experimental study of temperature effects on wellbore material properties to enhance temperature profile modeling for production wells. J. Pet. Sci. Eng. 2019, 176, 689–701. [Google Scholar] [CrossRef]
  44. Cassis, R.; Fuller, N.; Hepler, L.G.; McLean, R.J.C.; Skauge, A.; Srinivasan, N.S.; Yan, H. Specific Heat Capacities of Bitumens and Heavy Oils, Reservoir Minerals, Clays, Dehydrated Clays, Asphaltenes and Cokes. AOSTRA J. Res. 1985, 1, 163–173. [Google Scholar]
  45. Smith-Magowan, D.; Skauge, A.; Hepler, L. Specific Heats of Athabasca Oil Sands and Components. J. Can. Pet. Technol. 1982, 21, 28–32. [Google Scholar] [CrossRef]
  46. Karim, G.A.; Hanafi, A. The thermal conductivity of oils sands. Can. J. Chem. Eng. 1981, 59, 461–464. [Google Scholar] [CrossRef]
  47. Clark, K.A. Some Physical Properties of Alberta Bituminous Sands. Can. J. Res. 1944, 22, 174–180. [Google Scholar] [CrossRef]
  48. Scott, J.D.; Seto, A.C. Thermal Property Measurements on Oil Sands. J. Can. Pet. Technol. 1986, 25, 70–77. [Google Scholar] [CrossRef]
  49. Anand, J.; Somerton, W.H.; Gomaa, E. Predicting thermal conductivities of formations from other known properties. SPE J. 1973, 13, 267–273. [Google Scholar] [CrossRef]
  50. Alishaev, M.G.; Abdulagatov, I.M.; Abdulagatova, Z.Z. Effective thermal conductivity of fluid-bearing rocks: Experiment and modeling. Eng. Geol. 2012, 135–136, 24–39. [Google Scholar] [CrossRef]
  51. Lipaev, A.A.; Bezrukov, D.V. Research of thermal properties of rocks by using serial released instruments: LFA 467 temperature meter and DSC 204 HP differential calorimeter. Upr. Tekhnosferoj 2020, 3, 23–36. (In Russian) [Google Scholar] [CrossRef]
  52. Ramazanova, A.E.; Emirov, S.N. Baric and temperature dependences for the thermal conductivity of sedimentary rocks. Bull. Russ. Acad. Sci. Phys. 2012, 76, 1152–1156. [Google Scholar] [CrossRef]
  53. Abdulagatova, Z.; Abdulagatov, I.M.; Emirov, V.N. Effect of temperature and pressure on the thermal conductivity of sandstone. Int. J. Rock Mech. Min. Sci. 2009, 46, 1055–1071. [Google Scholar] [CrossRef]
  54. Vosteen, H.; Schellschmidt, R. Influence of temperature on thermal conductivity, thermal capacity and thermal diffusivity for different types of rock. Phys. Chem. Earth 2003, 28, 499–509. [Google Scholar] [CrossRef]
  55. Kutas, R.I.; Gordienko, V.V. Heat Flow of the Ukraine; Naukova Dumka: Kiev, Ukraine, 1971. (In Russian) [Google Scholar]
  56. Sekiguchi, K. A method for determining terrestrial heat flow in oil basinal areas. Tectonophysics 1984, 103, 67–79. [Google Scholar] [CrossRef]
  57. Tikhomirov, V.M. Conductivity of rocks and their relationship with density, saturation and temperature. Neft. Khoz. 1968, 46, 151–161. (In Russian) [Google Scholar]
  58. Somerton, W.H. Thermal Properties and Temperature-Related Behavior of Rock/Fluid Systems; Elsevier: Amsterdam, The Netherlands, 1992. [Google Scholar]
  59. Campanella, A.G.; Mitchell, J.K. Influence of Temperature Variations on Soil Behavior. ASCE J. Geotech. Eng. Div. 1968, 94, 709–734. [Google Scholar]
  60. Kosar, K.M. Geotechnical Properties of Oil Sands and Related Strata. Ph.D. Thesis, University of Alberta, Edmonton, AB, Canada, 1989. [Google Scholar]
  61. Agar, J.G.; Morgenstern, N.R.; Scott, J.D. Thermal expansion and pore pressure generation in oil sands. Can. Geotech. J. 1986, 23, 327–333. [Google Scholar] [CrossRef]
  62. Hartlieb, P.; Toifl, M.; Kuchar, F.; Meisels, R.; Antretter, T. Thermo-physical properties of selected hard rocks and their relation to microwave-assisted comminution. Miner. Eng. 2015, 91, 34–41. [Google Scholar] [CrossRef]
  63. Robertson, E.C. Thermal Properties of Rocks: Report 88–441. Available online: https://pubs.usgs.gov/of/1988/0441/report.pdf (accessed on 24 February 2021).
  64. Loubser, P.J.; Bryden, J.G. An apparatus for determining the coefficient of thermal expansion of rocks, mortars and concretes. Mag. Concr. Res. 1972, 24, 97–100. [Google Scholar] [CrossRef]
  65. Miklashevsky, D.E. Development and Application of an Instrumental and Methodological Complex for Measuring the Thermal Properties of Rocks at Elevated Temperature and Pressure. Ph.D. Thesis, Sergo Ordzhonikidze Russian State University for Geological Prospecting, Moscow, Russia, 2007. (In Russian). [Google Scholar]
  66. Krupiczka, R. Analysis of thermal conductivity in granular materials. Int. Chem. Eng. 1967, 7, 122–144. [Google Scholar]
  67. Chalaturnyk, R.J.; Li, P. When Is It Important to Consider Geomechanics in SAGD Operations? J. Can. Pet. Technol. 2004, 43, 53–61. [Google Scholar] [CrossRef]
  68. Zandi, S. Numerical Modeling of Geo-Mechanical Effects of Steam Injection in SAGD Heavy Oil Recovery. Ph.D. Thesis, École Nationale Supérieure des Mines de Paris, Paris, France, 2011. Available online: https://pastel.archives-ouvertes.fr/pastel-00671450 (accessed on 24 February 2021).
  69. Shen, L.; Singhroy, V.; Samsonov, S.V. Forward Modeling of SAGD-Induced Heave and Caprock Deformation Analysis. In Proceedings of the SPE Heavy Oil Conference, Calgary, AB, Canada, 10–12 June 2014. [Google Scholar]
Figure 1. Example of thermal profiling results in two adjacent samples (the border is shown by a dashed gray line) with significant variations in thermal conductivity (red) and volumetric heat capacity (green), superimposed on a photo of slabbed samples (dark area identifies oil sand; light area—siltstone).
Geosciences 11 00203 g001
Figure 2. (a) Location of Karabikulovskoye field; (b) structural map of the top of the permeable part of Ufa stage; and (c) schematic geological–lithological cross-section of productive formation along the line I*–I.
Geosciences 11 00203 g002
Figure 3. Photo of oil sand thin section with quartz rock fragments (1), analcime (2), and effusive rock fragments (3), without an analyzer (left) and with an analyzer (right).
Geosciences 11 00203 g003
Figure 4. Results of thermal profiling at different scales on well logging plots for wells A (top) and B (bottom); see comments in text.
Geosciences 11 00203 g004
Figure 5. Results of the thermal conductivity (λ) profiling on the core as compared with (a) the hydrogen index (IH) calculated from neutron logging data and with (b) the speed VP of longitudinal wave obtained through the interpretation of acoustic logging data.
Geosciences 11 00203 g005
Figure 6. (a) Thermal conductivity, (b) specific and (c) volumetric heat capacity of heavy oil samples from the Karabikulovskoye field in the temperature range from 8 to 180 °C with comparison to published results (see comments in text).
Geosciences 11 00203 g006
Figure 7. Temperature dependence for the thermal conductivity of (a) oil sand and (b) siltstone of the Karabikulovskoye field and comparison with some previously published results.
Geosciences 11 00203 g007
Figure 8. (a) The normalized thermal conductivity as well as the (b) specific and (c) volumetric heat capacity of Karabikulovskoye field rocks in the temperature range from 8 to 180 °C and comparison with previously published data (see comments in the text).
Geosciences 11 00203 g008
Figure 9. CLTE depending on the temperature of the studied samples from the Karabikulovskoye field after extraction and in non-extracted state (during the first and second heating cycles) and comparison with previously published data (see comments in the text).
Geosciences 11 00203 g009
Figure 10. Significant discrepancy between experimental and calculated thermal conductivity data of oil sands of the Karabikulovskoye field; calculation carried out using various simulator options and appropriately defined λs.
Geosciences 11 00203 g010
Figure 11. Comparison results for (a) cumulative oil production and (b) cumulative steam/oil ratio, calculated with the data on rock thermal properties taken from open sources (dataset A) and the results of our experimental studies (dataset B). Right axis (red) reflects the discrepancy in the results obtained with dataset A relative to the results based upon the experimental data.
Geosciences 11 00203 g011
Table 1. Hardware used within the frame of this work to measure rock thermal properties and porous fluids in atmospheric conditions and within the range of formation temperatures.
TCS
(Skoltech)
DTC-300
(TA Instruments)
DSC 214 Polyma
(NETZSCH)
DKT-40
(Special Design)
KD2 Pro e
(Decagon Devices)
Measured
parameters a
TC, TD, VHCTCSHCCLTE dTC
SampleSolidSolidSolid, liquidSolidLiquid
Measuring conditionsAtmospheric
conditions
20–300 °C30–600 °C25–300 °C−50–150 °C
Measurement
quality
TC: 2.0% (A) *
1.5% (P) *
TD: 2.5% (A) *
2.0% (P) *
VHC: 3.0% (A) *
2.5% (P) *
1–2% b (precision)
3–8% b (accuracy)
2.5% (relative error)4% (P) *
1.8∙× 10−7 K−1 (A) *
0.01 W/(m K)
in range 0.02–0.2 W/(m K)
Method of measurementOriginalModified c [27]Tool manufacturerModified c [28]Tool manufacturer
ComplianceISRM
[10]
ASTM
E1530-11 [29]
ASTM
E1269-11 [30]
ASTM
E228-95 [31]
ASTM
D5334-14 [32]
Requirements for measured samplesAny with flat
or cylindrical
surface, length of 10–500 mm
Cylinder, 50 mm in diameter and height not
exceeding 20 mm
Disk, 4 mm in
diameter and 1 mm in width, or powder with mass of 20–40 mg
Standard
cylindrical
samples or cube
(30 × 30 mm)
Liquid sample e, volume of not less than 80 cm3
* (A) means accuracy and (P) means precision with 0.95 confidence probability. a Here, TC means thermal conductivity; TD means thermal diffusivity; SHC and VHC mean specific and volumetric heat capacity, respectively; and CLTE means coefficient of linear thermal expansion. b Depending on the thermal resistance of the sample (according to technical characteristics of the tool). c Modified method to treat the samples for measurements and performing measurements based on the use of optical scanning process. d The differential value of CLTE for every temperature interval of 20 °C within a temperature range of 20–300 °C can be measured. e With KS-1 needle probe to measure TC of liquid media; the depth of the measuring cell must be greater than the length of the probe (6 cm), and the diameter—much larger than the diameter of the probe (1.3 mm).
Table 2. General information about the Karabikulovskoye heavy oil field (U2 layer).
ParameterUnitValue
Average depth of formation topm151
Type of formation-Massive
Type of reservoir-Terrigenous
Average total thicknessm17.6
Porosity factorunit fraction0.29
Permeabilitym·km20.736
Sand factorunit fraction0.78
Initial formation temperature°C8
Initial formation pressureMPa0.72
Reservoir oil viscositymPa s27,350
Surface oil viscosityg/cm30.96
Formation water viscositymPa·s1.41
Surface water densityg/cm31.00
Table 3. Statistical characteristics of rock thermal properties experimentally studied.
Lithology (Stage)Thermal Conductivity
(W·m−1·K−1)
Thermal Anisotropy Coefficient KThermal Heterogeneity Factor
(MJ⋅m−3·K−1)
N
λλβ1β2
Full-Sized (Slabbed) Core
Gray shale, dark gray, silty, fractured (Kz)1.82 (0.19)1.59 (0.28)1.19 (0.11)0.42 (0.19)0.24 (0.10)2.95 (0.31)85
1.42–2.311.29–2.161.02–1.430.15–0.960.08–0.531.99–3.48
Oil sands, poorly cemented (Uf)1.44 (0.27)1.35 (0.19)1.06 (0.08)0.40 (0.32)0.19 (0.13)2.20 (0.30)159
1.00–2.581.01–1.911.00–1.320.07- 2.85 *0.06–0.861.76–3.16
Siltstone and sandstone, dense (Uf)2.16 (0.36)2.13 (0.41)1.11 (0.06)0.58 (0.42)0.24 (0.18)2.92 (0.28)57
1.48–3.041.56–2.681.02–1.160.10–1.870.08–1.062.25–3.51
Shale, brown and dark gray, silty, dense (Uf)2.10 (0.46)1.62 (0.28)1.14 (0.13)0.55 (0.42)0.22 (0.14)2.85 (0.29)41
1.52- 3.82 *1.25–2.061.00–1.320.10- 2.36 *0.09–0.712.37–3.46
Cylindrical Sample of Size 30 × 30 mm and 50 × 20 mm
Gray shale, dark-gray, silty, fractured (Kz)1.34 (0.23)1.12 (0.37)1.38 (0.26)0.36 (0.12)0.34 (0.15)2.04 (0.31)27
0.85–1.960.71–1.941.00–1.770.16–0.650.15–0.781.61–2.84
Oil sands, poorly cemented (Uf)1.20 (0.12)1.13 (0.11)1.06 (0.05)0.19 (0.10)0.19 (0.08)2.19 (0.27)91
1.03–1.950.92–1.651.00–1.280.08–0.730.08–0.511.71–2.91
Siltstone and sandstone, dense (Uf)1.78 (0.37)1.60 (0.32)1.09 (0.06)0.24 (0.14)0.20 (0.09)2.02 (0.19)39
1.16–1.960.95–2.251.00–1.260.10–0.920.09–0.471.69–2.38
Shale, brown and dark gray, silty, dense (Uf)2.05 (0.69)1.67 (0.35)1.11 (0.11)0.31 (0.29)0.28 (0.31)2.04 (0.31)16
1.20–3.861.08–2.221.00–1.430.11–1.240.11–1.321.65–3.05
* Extremely high values are caused by spotty pyritization of individual samples. Notes: (1) Numerator is the average value with the standard deviation in parentheses, while the denominator includes the minimum and maximum values; N is the number of studied samples in the row. (2) Thermal properties in the order of arrangement in Table 3: thermal conductivity along (λ) and perpendicular (λ) to the layers, coefficient of thermal anisotropy (K = λ), coefficient of thermal heterogeneity when scanning in parallel (β1) and perpendicular (β2) to the core axis, and volumetric heat capacity (Cρ). (3) Coefficient of thermal heterogeneity β characterizes the variations in the thermal conductivity along the scanning line and is evaluated as β = (λmax − λmin) λavg−1, where λmax, λmin, and λavg are, respectively, the maximum, minimum, and average values of thermal conductivity for the profile along the scanning line.
Table 4. Input datasets on rock thermal properties for modeling.
Element of the ModelParameterLegendUnitAccepted Value of Parameters
Dataset ADataset B
Reservoir rocksThermal conductivityλsW·m−1·K−17.031.65–9.8 × 10⁻⁴ T *
Volumetric heat capacitysMJ·m−3·K−12.321.83 + 3.3 × 10⁻³ T *
CLTEαs10−6 K−13.936.6 + 0.027 T
Surrounding rocksThermal conductivityλbulkW·m−1·K−11.71.12 (overburden)
1.67 (underburden)
Volumetric heat capacitybulkMJ·m−3·K−12.322.03
OilThermal conductivityλoilW·m−1·K−10.0930.141–8.1 × 10⁻⁵ T
Specific heat capacityCoilJ·g−1·K−12.091.625 + 4.4 × 10⁻³ T − 6 × 10⁻⁶ T2
* Experimental data after adaptation to stimulator capabilities (see explanations in text).
Publisher’s Note: MDPI stays neutral with regard to jurisdictional claims in published maps and institutional affiliations.

