
Influence of Wave Climate on Intra and Inter-Annual Nearshore Bar Dynamics for a Sandy Beach

 ,
,  , ,
, ,
Abstract
:1. Introduction
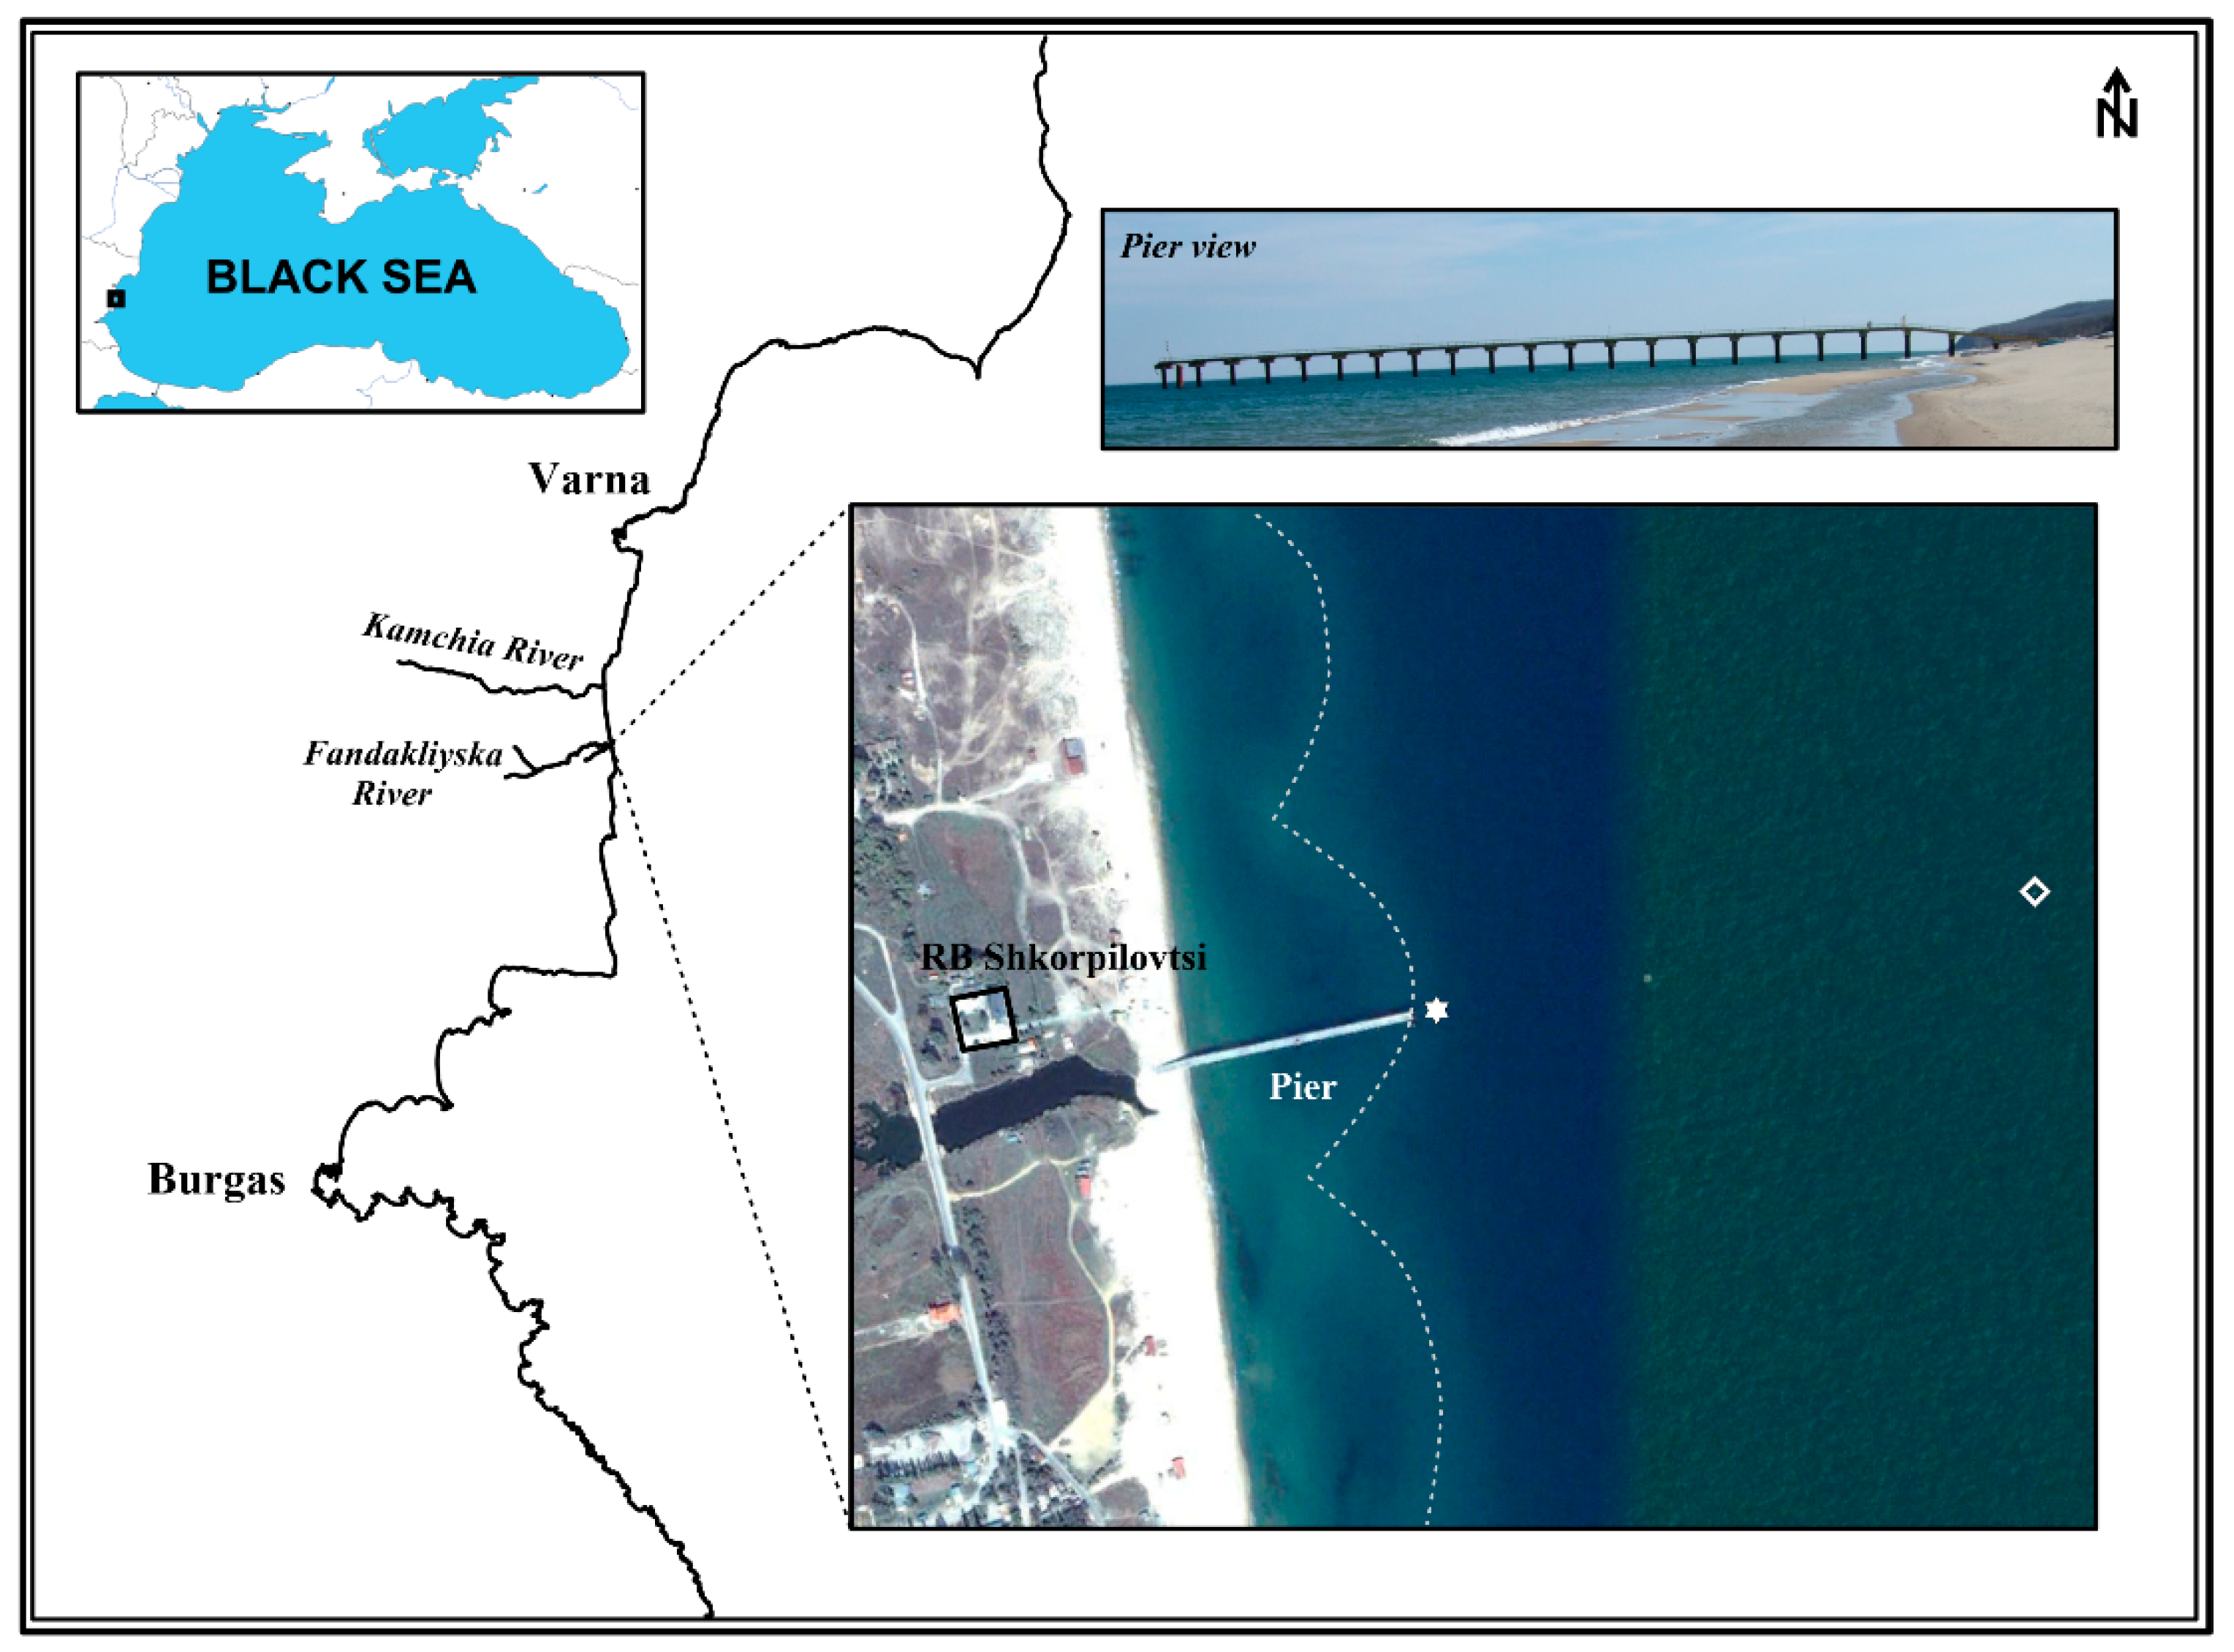
2. Study Site
3. Materials and Methods
3.1. Field Data: Cross-Shore Profiles
3.2. Modeled Data: Wave Parameters
4. Discussion of Results
4.1. Intra-Annual Sand Bar Evolution
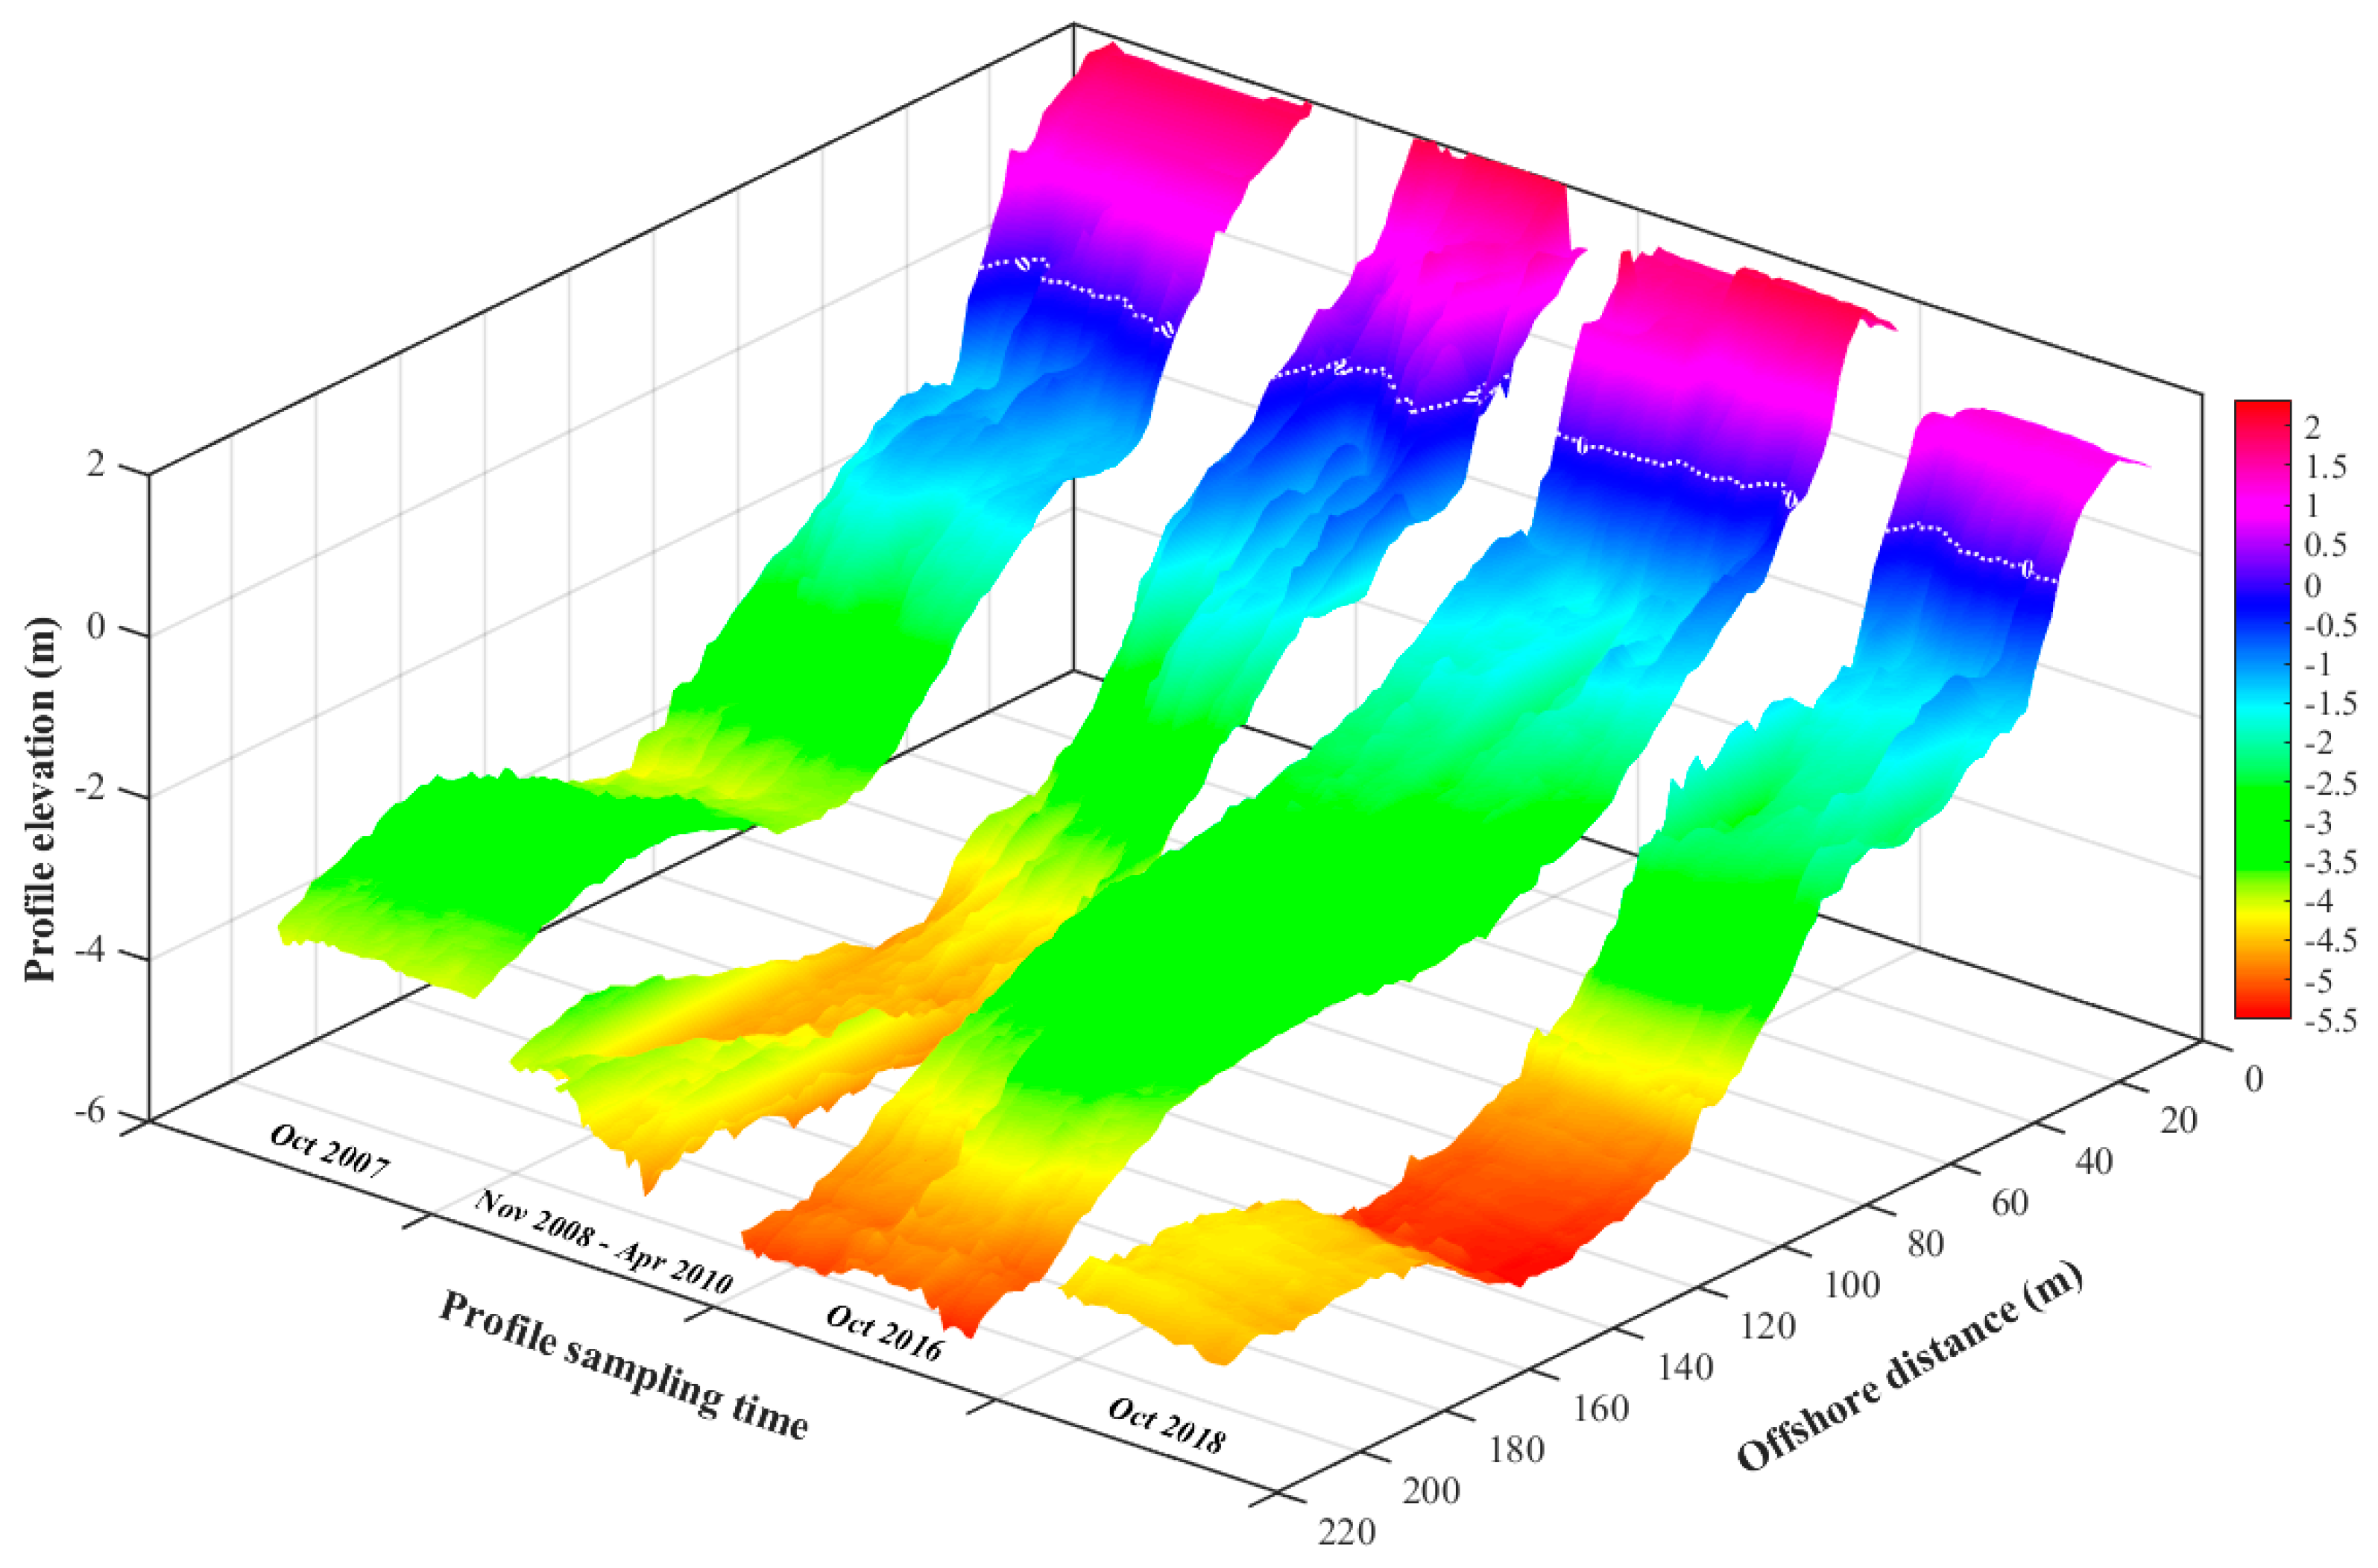
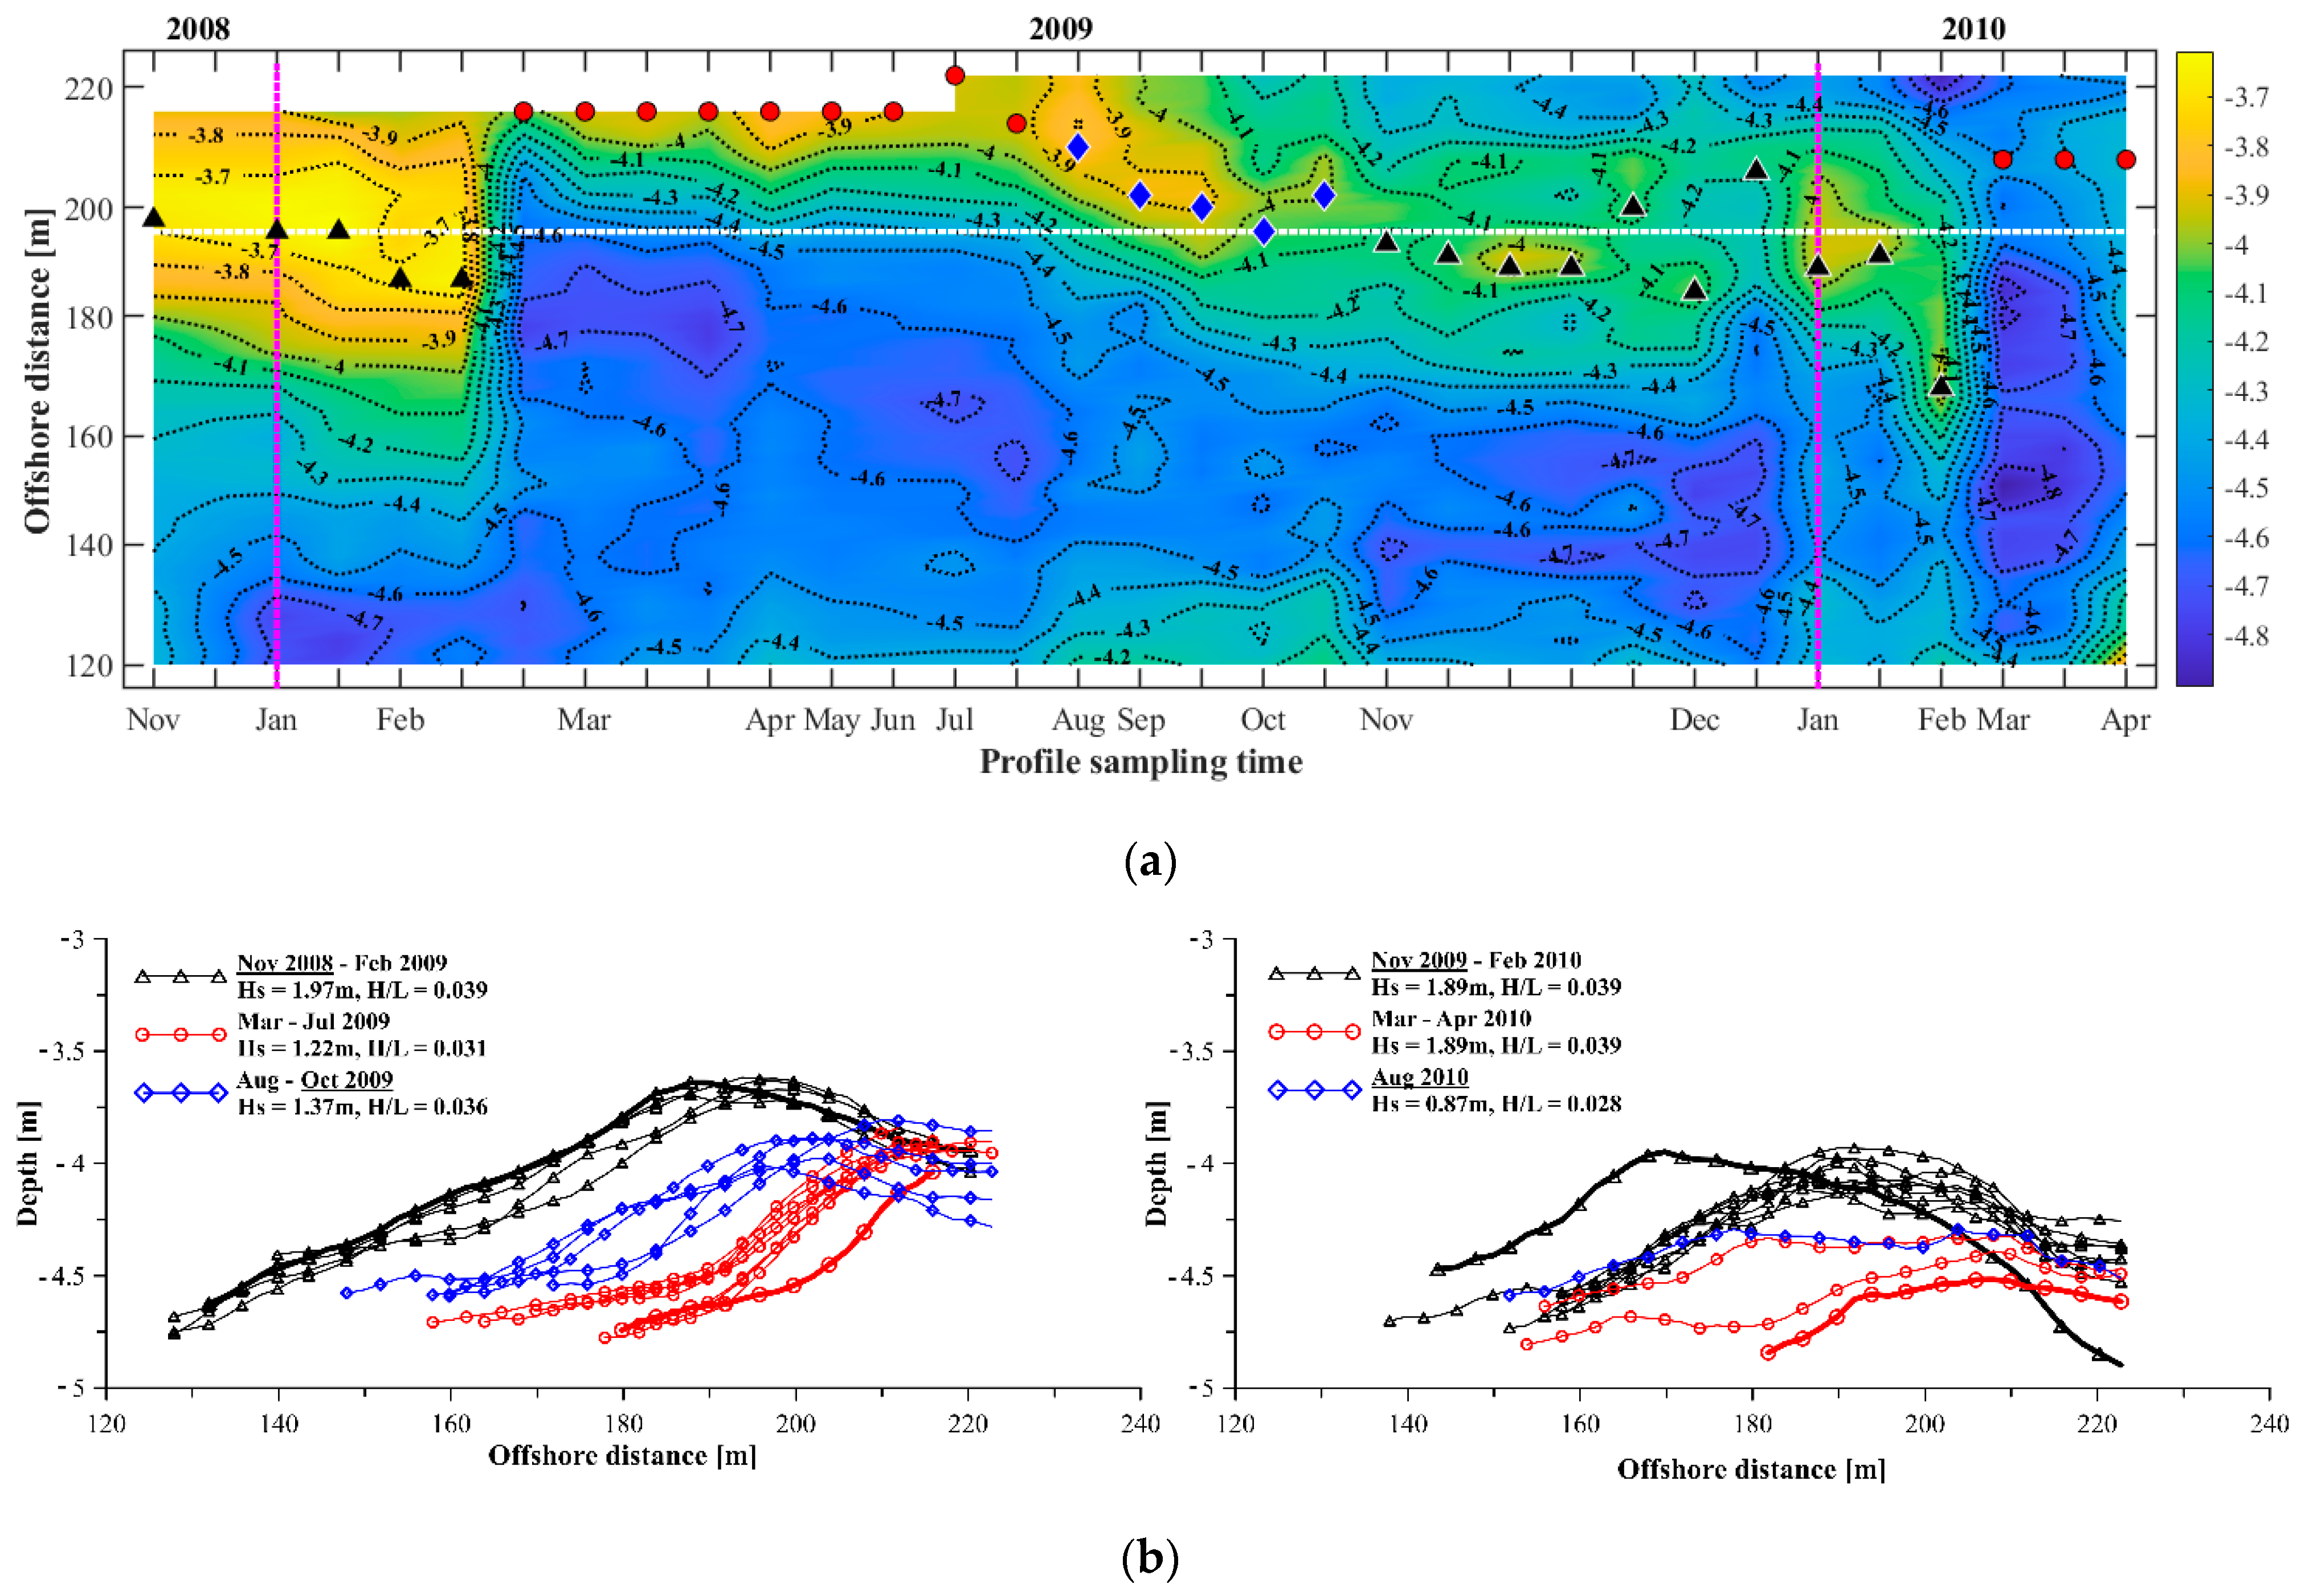
4.1.1. Morphodynamics of the Seabed Relief
- Winter profiles, corresponding to sand bar shoreward location in November 2008 (2009)–February 2009 (2010);
- Summer profiles, corresponding to its farthermost positions offshore as in March–July 2009 and March–April 2010;
- Transitional profiles, representing the gradual bar displacement (August–October 2009 and August 2010) back to its winter position in the nearshore zone.
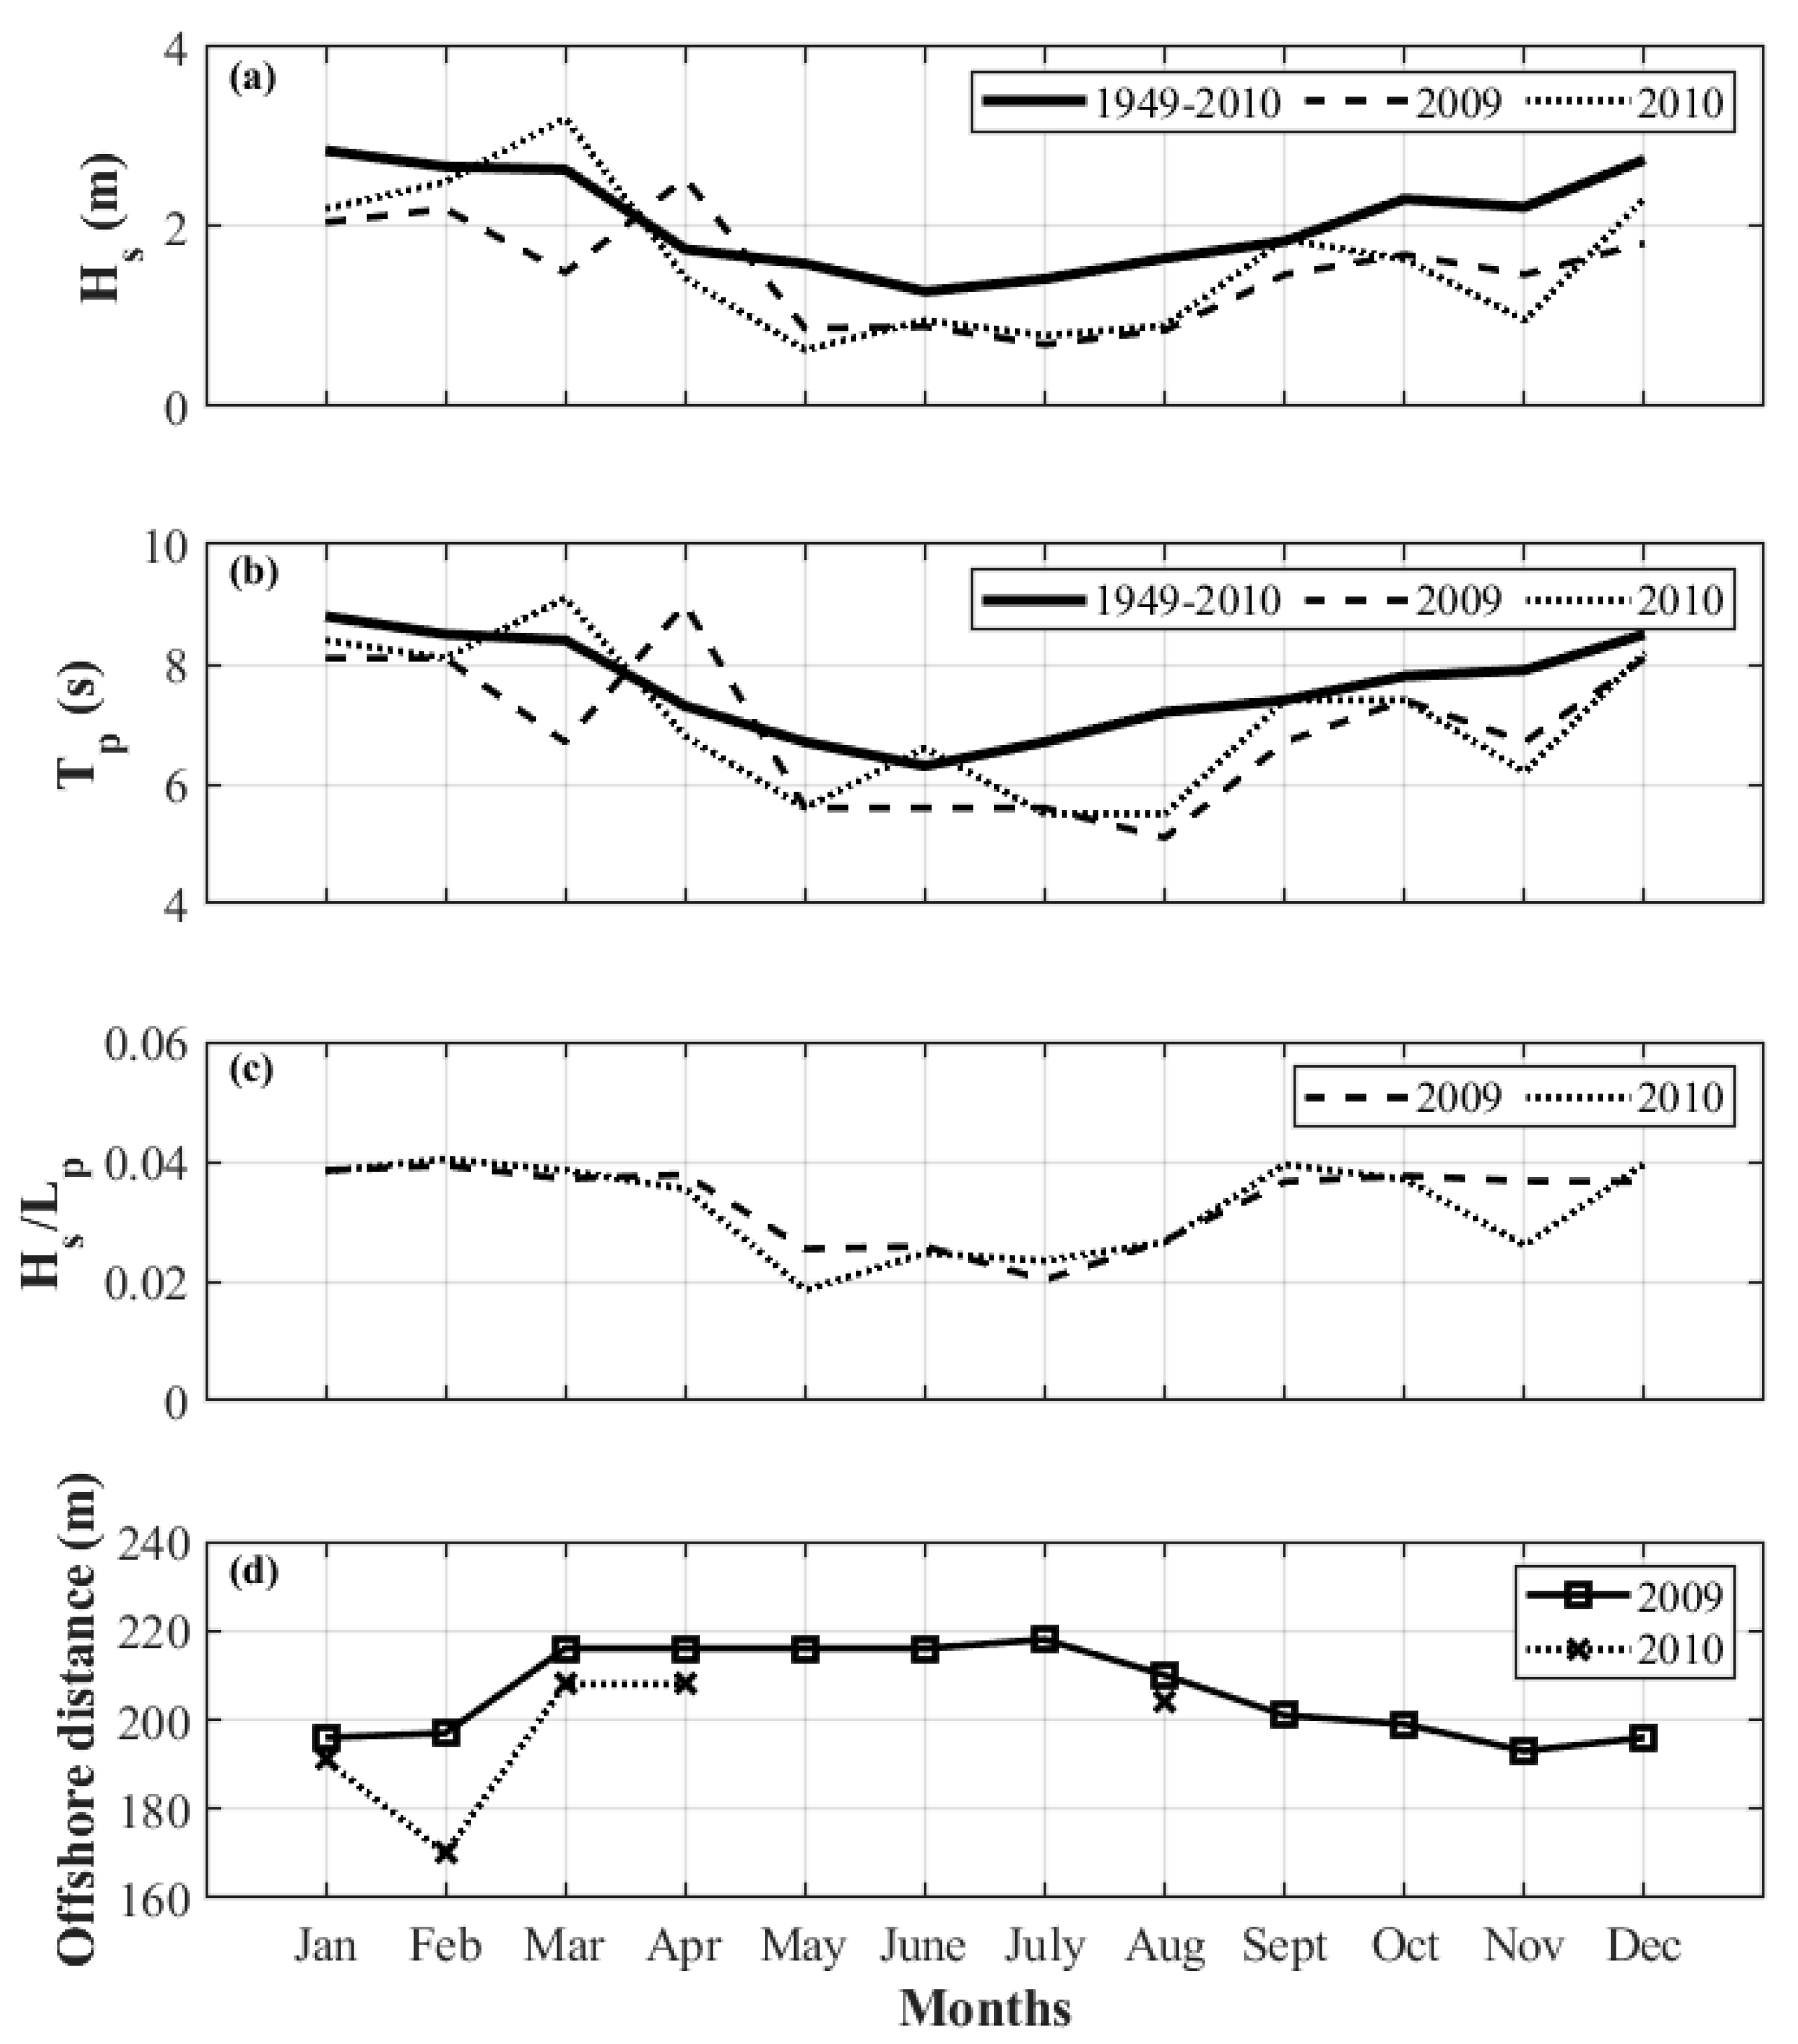
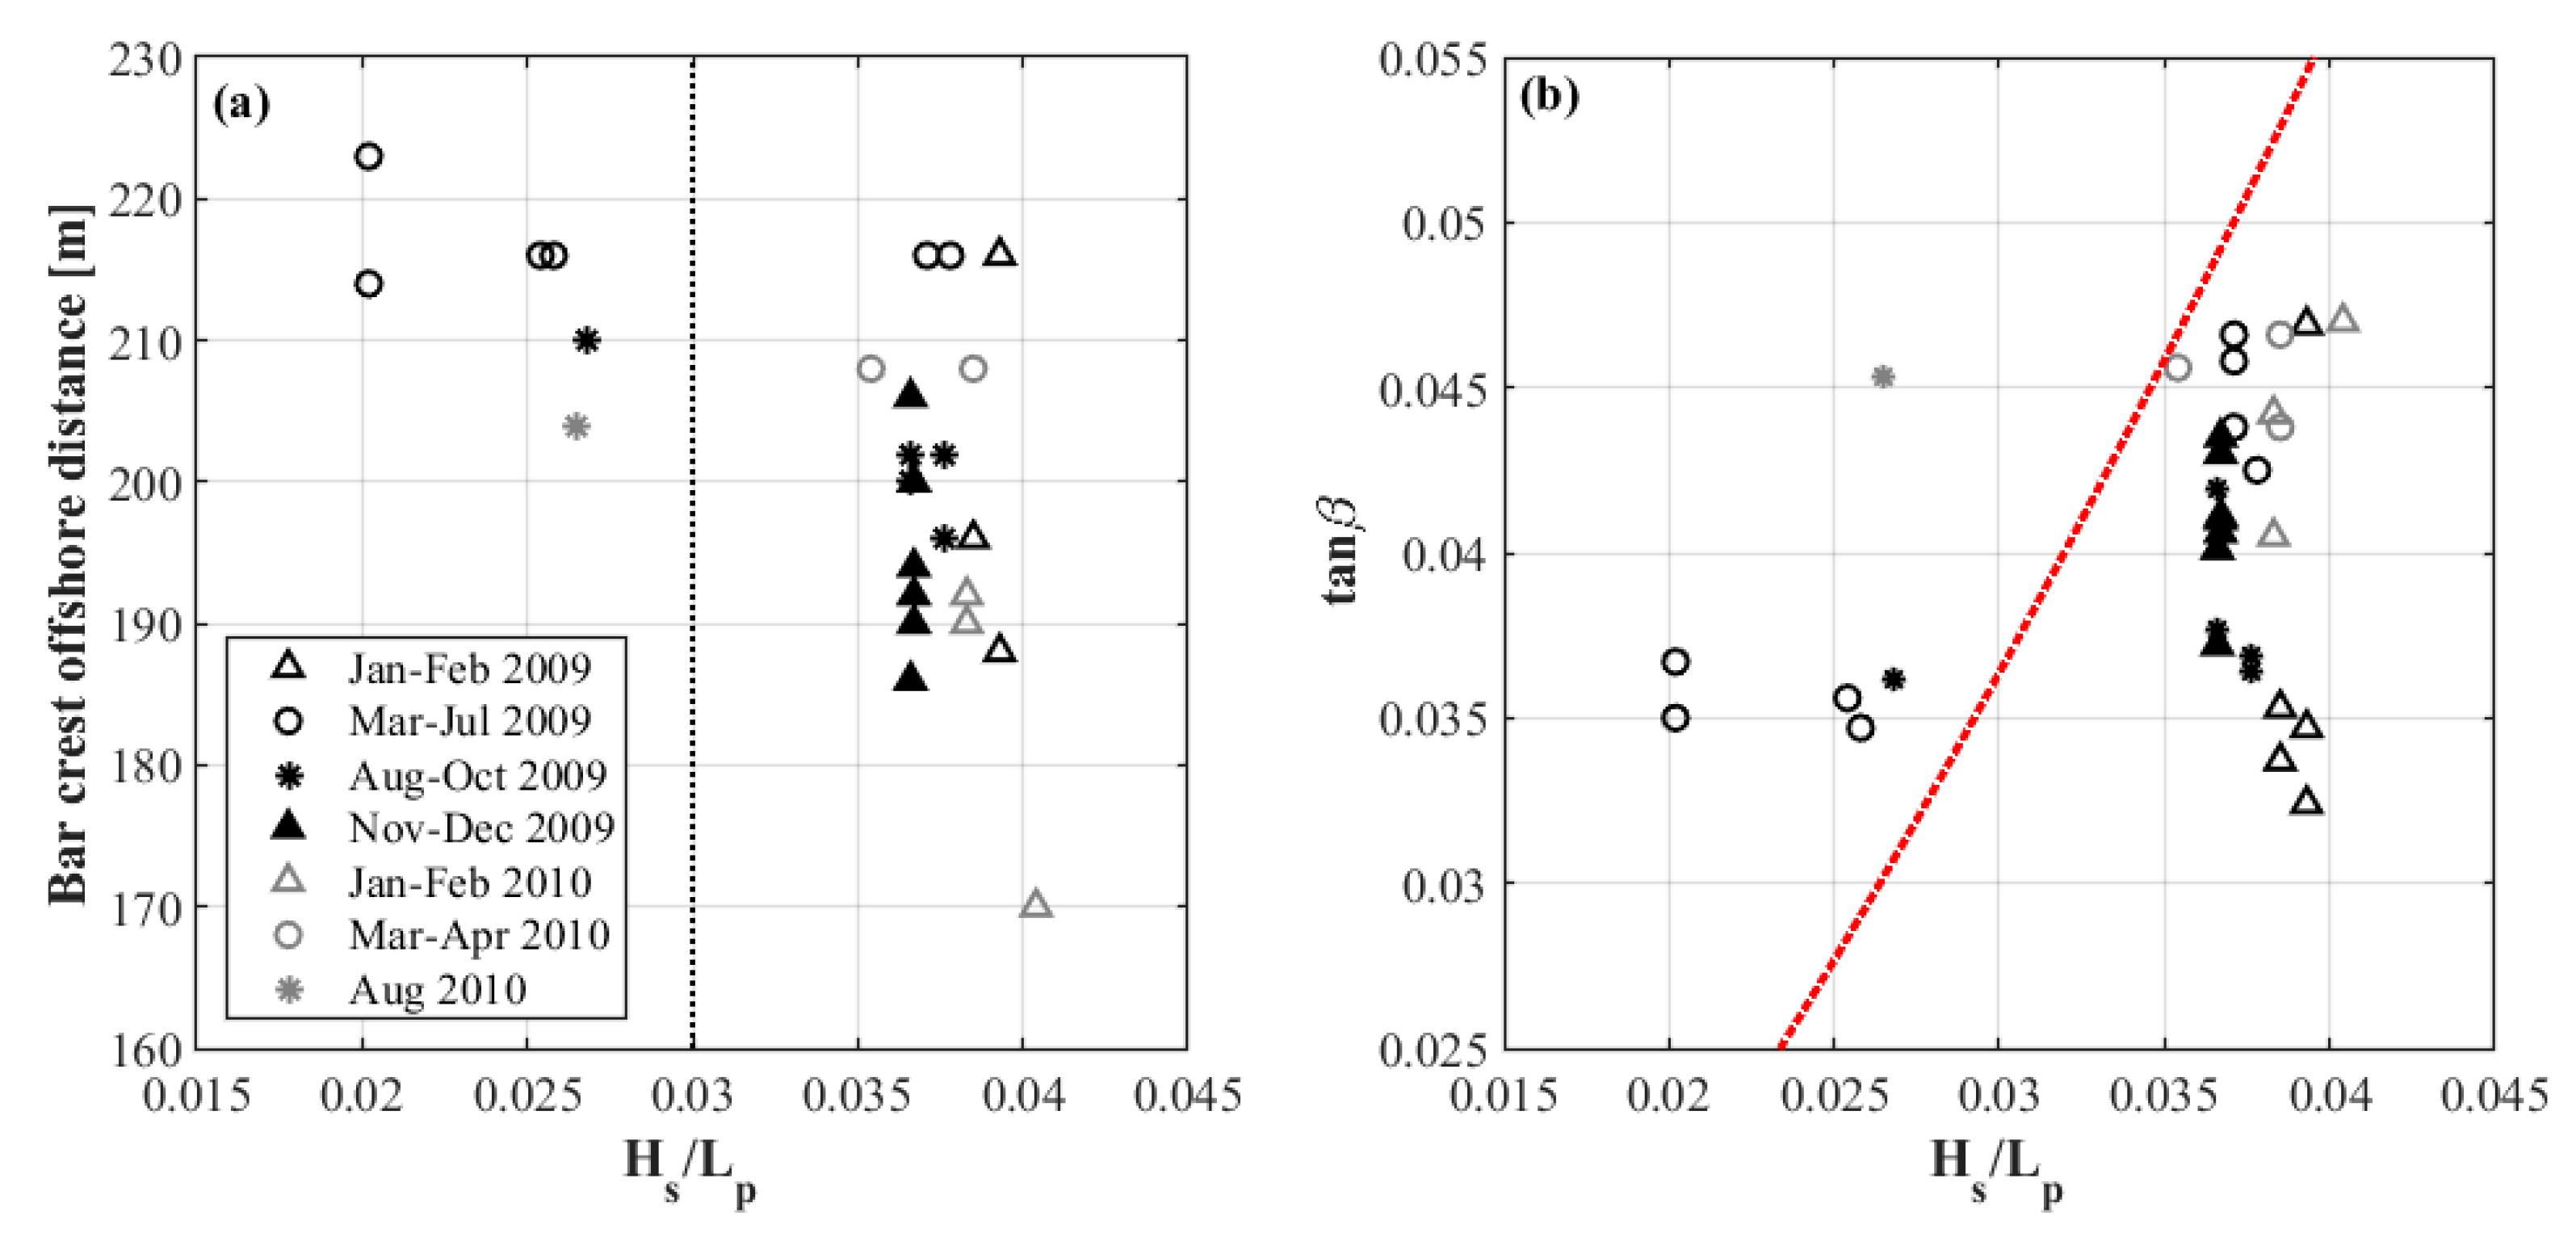
4.1.2. Bar Evolution due to Wave Parameters and Non-Linearity
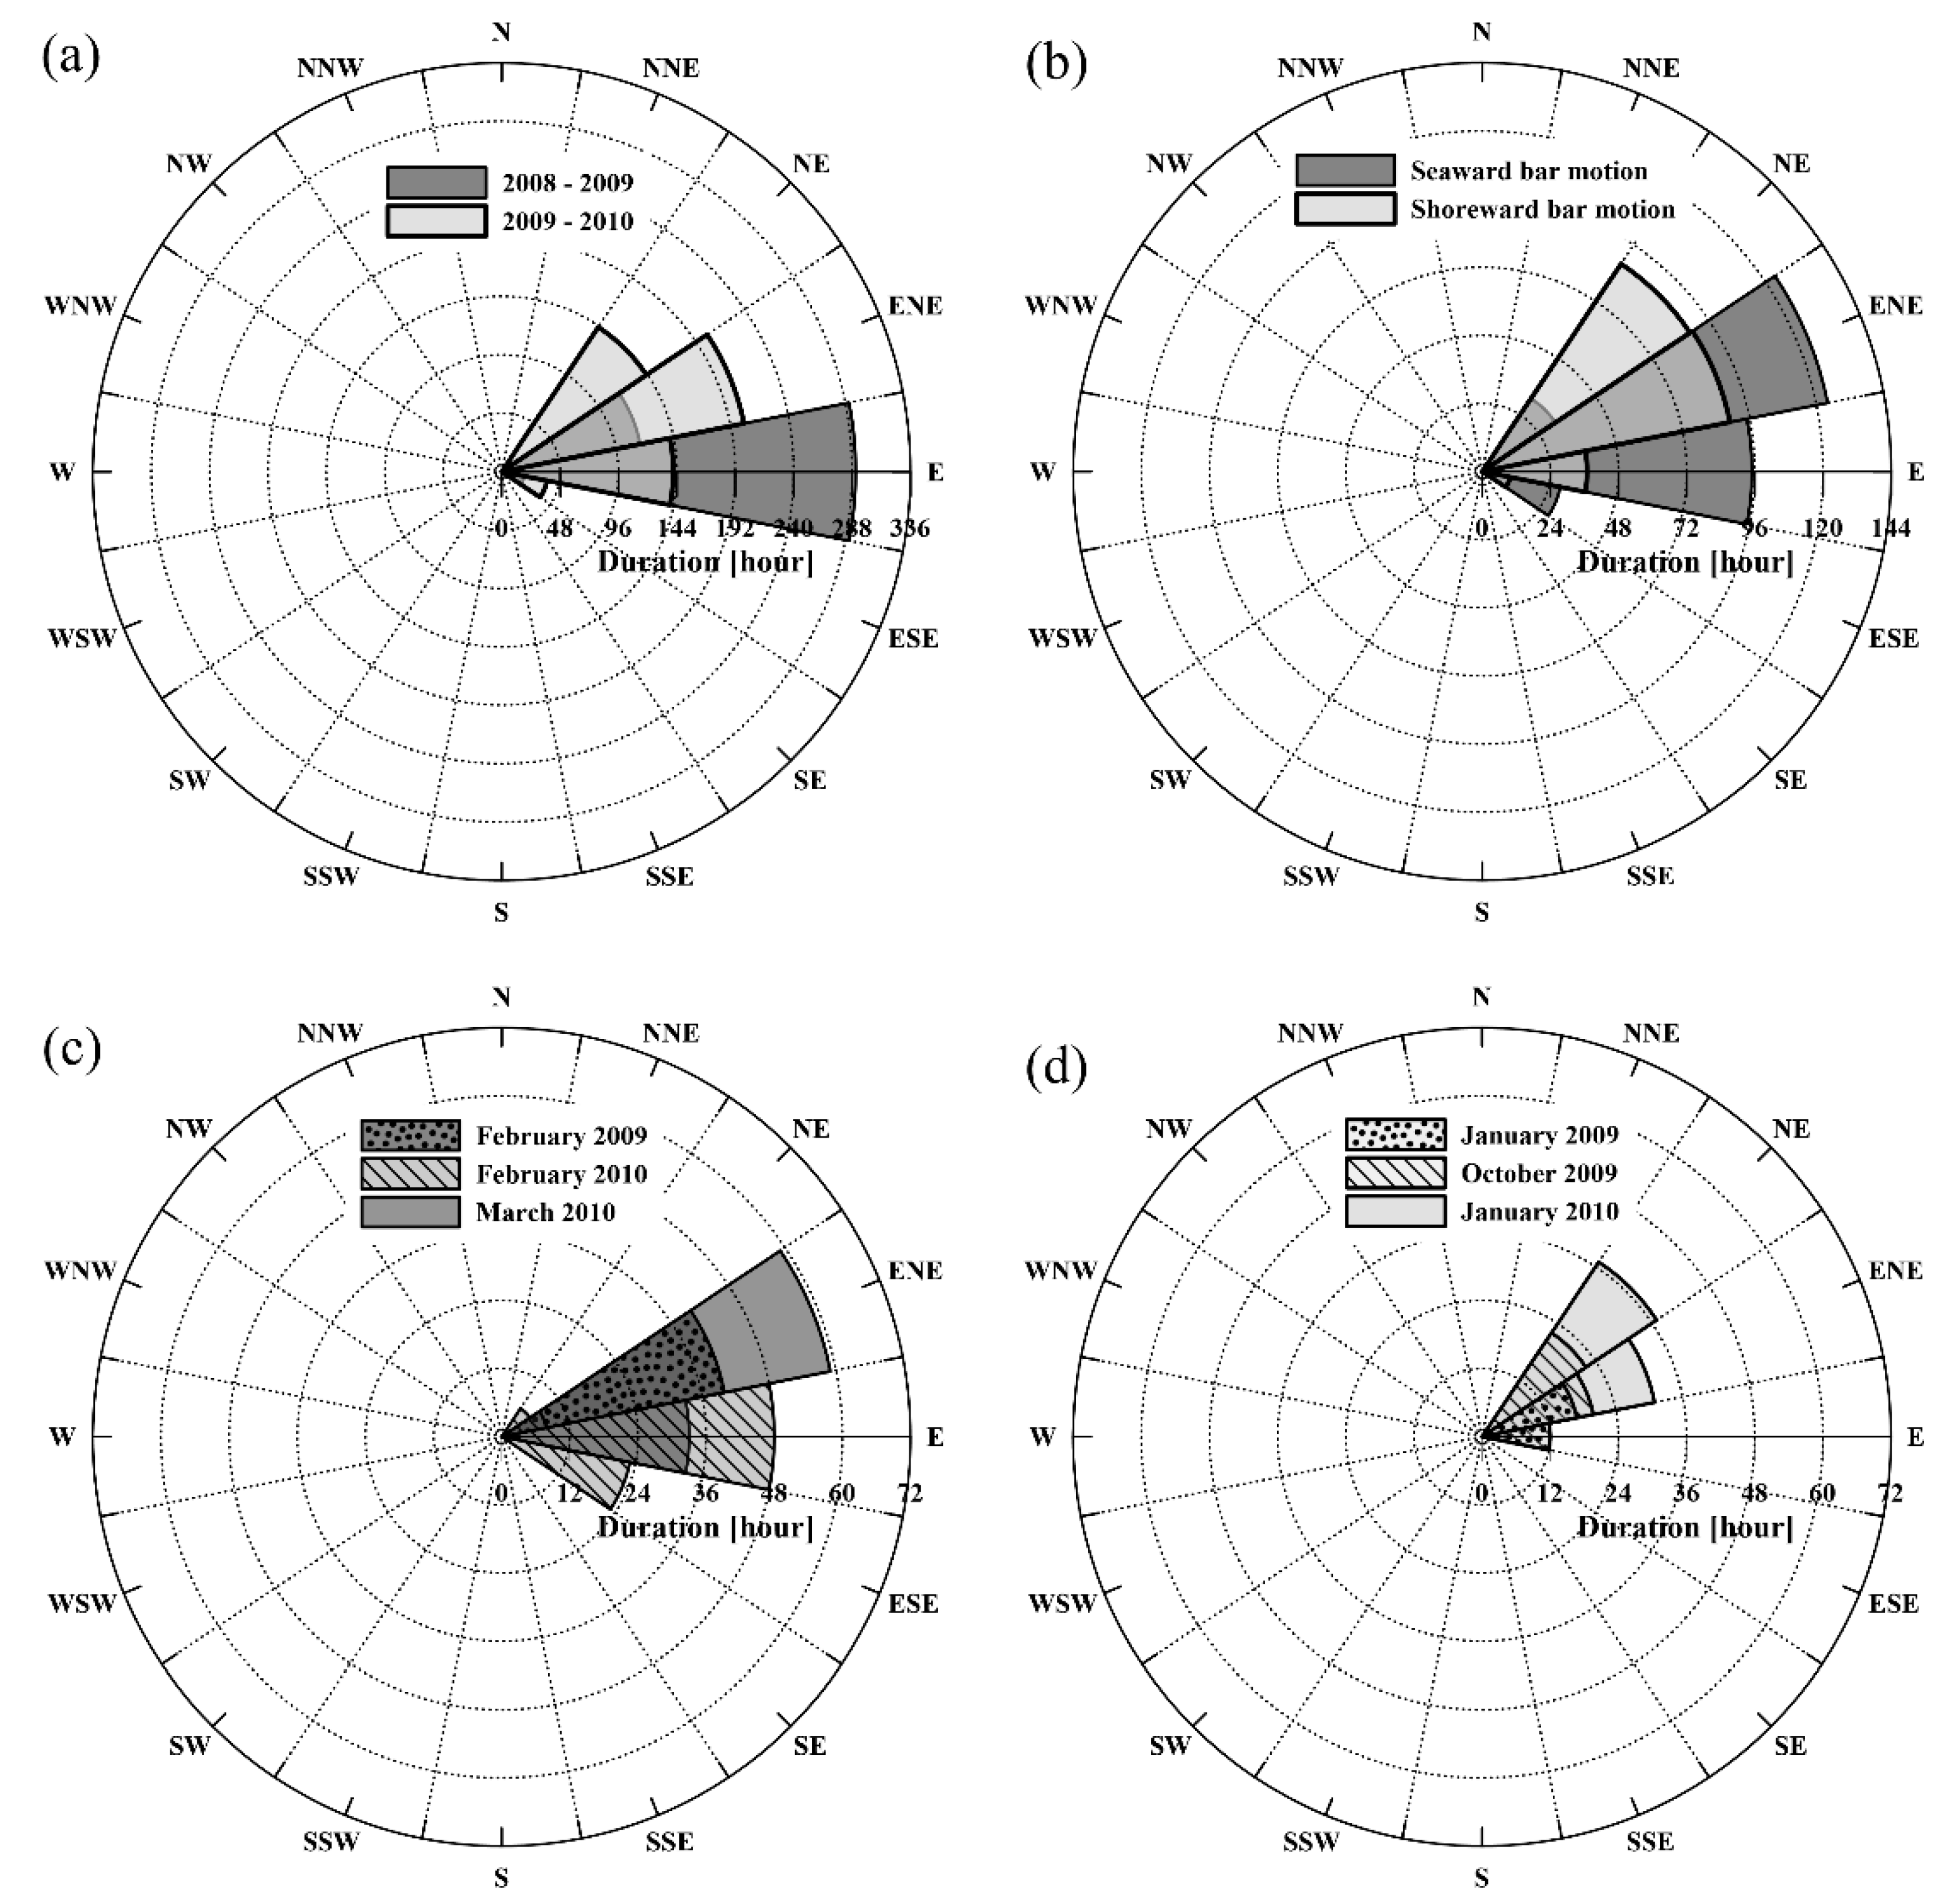
4.1.3. Influence of Storms and Wave Incidence Angle on Bar Dynamics
- Storm season, November 2008–April 2009 and September 2009–April 2010;
- Storm groups, as per Table 2;
- Monthly storms, here, three months with the most severe wave conditions were selected from each storm group SG1&SG2.
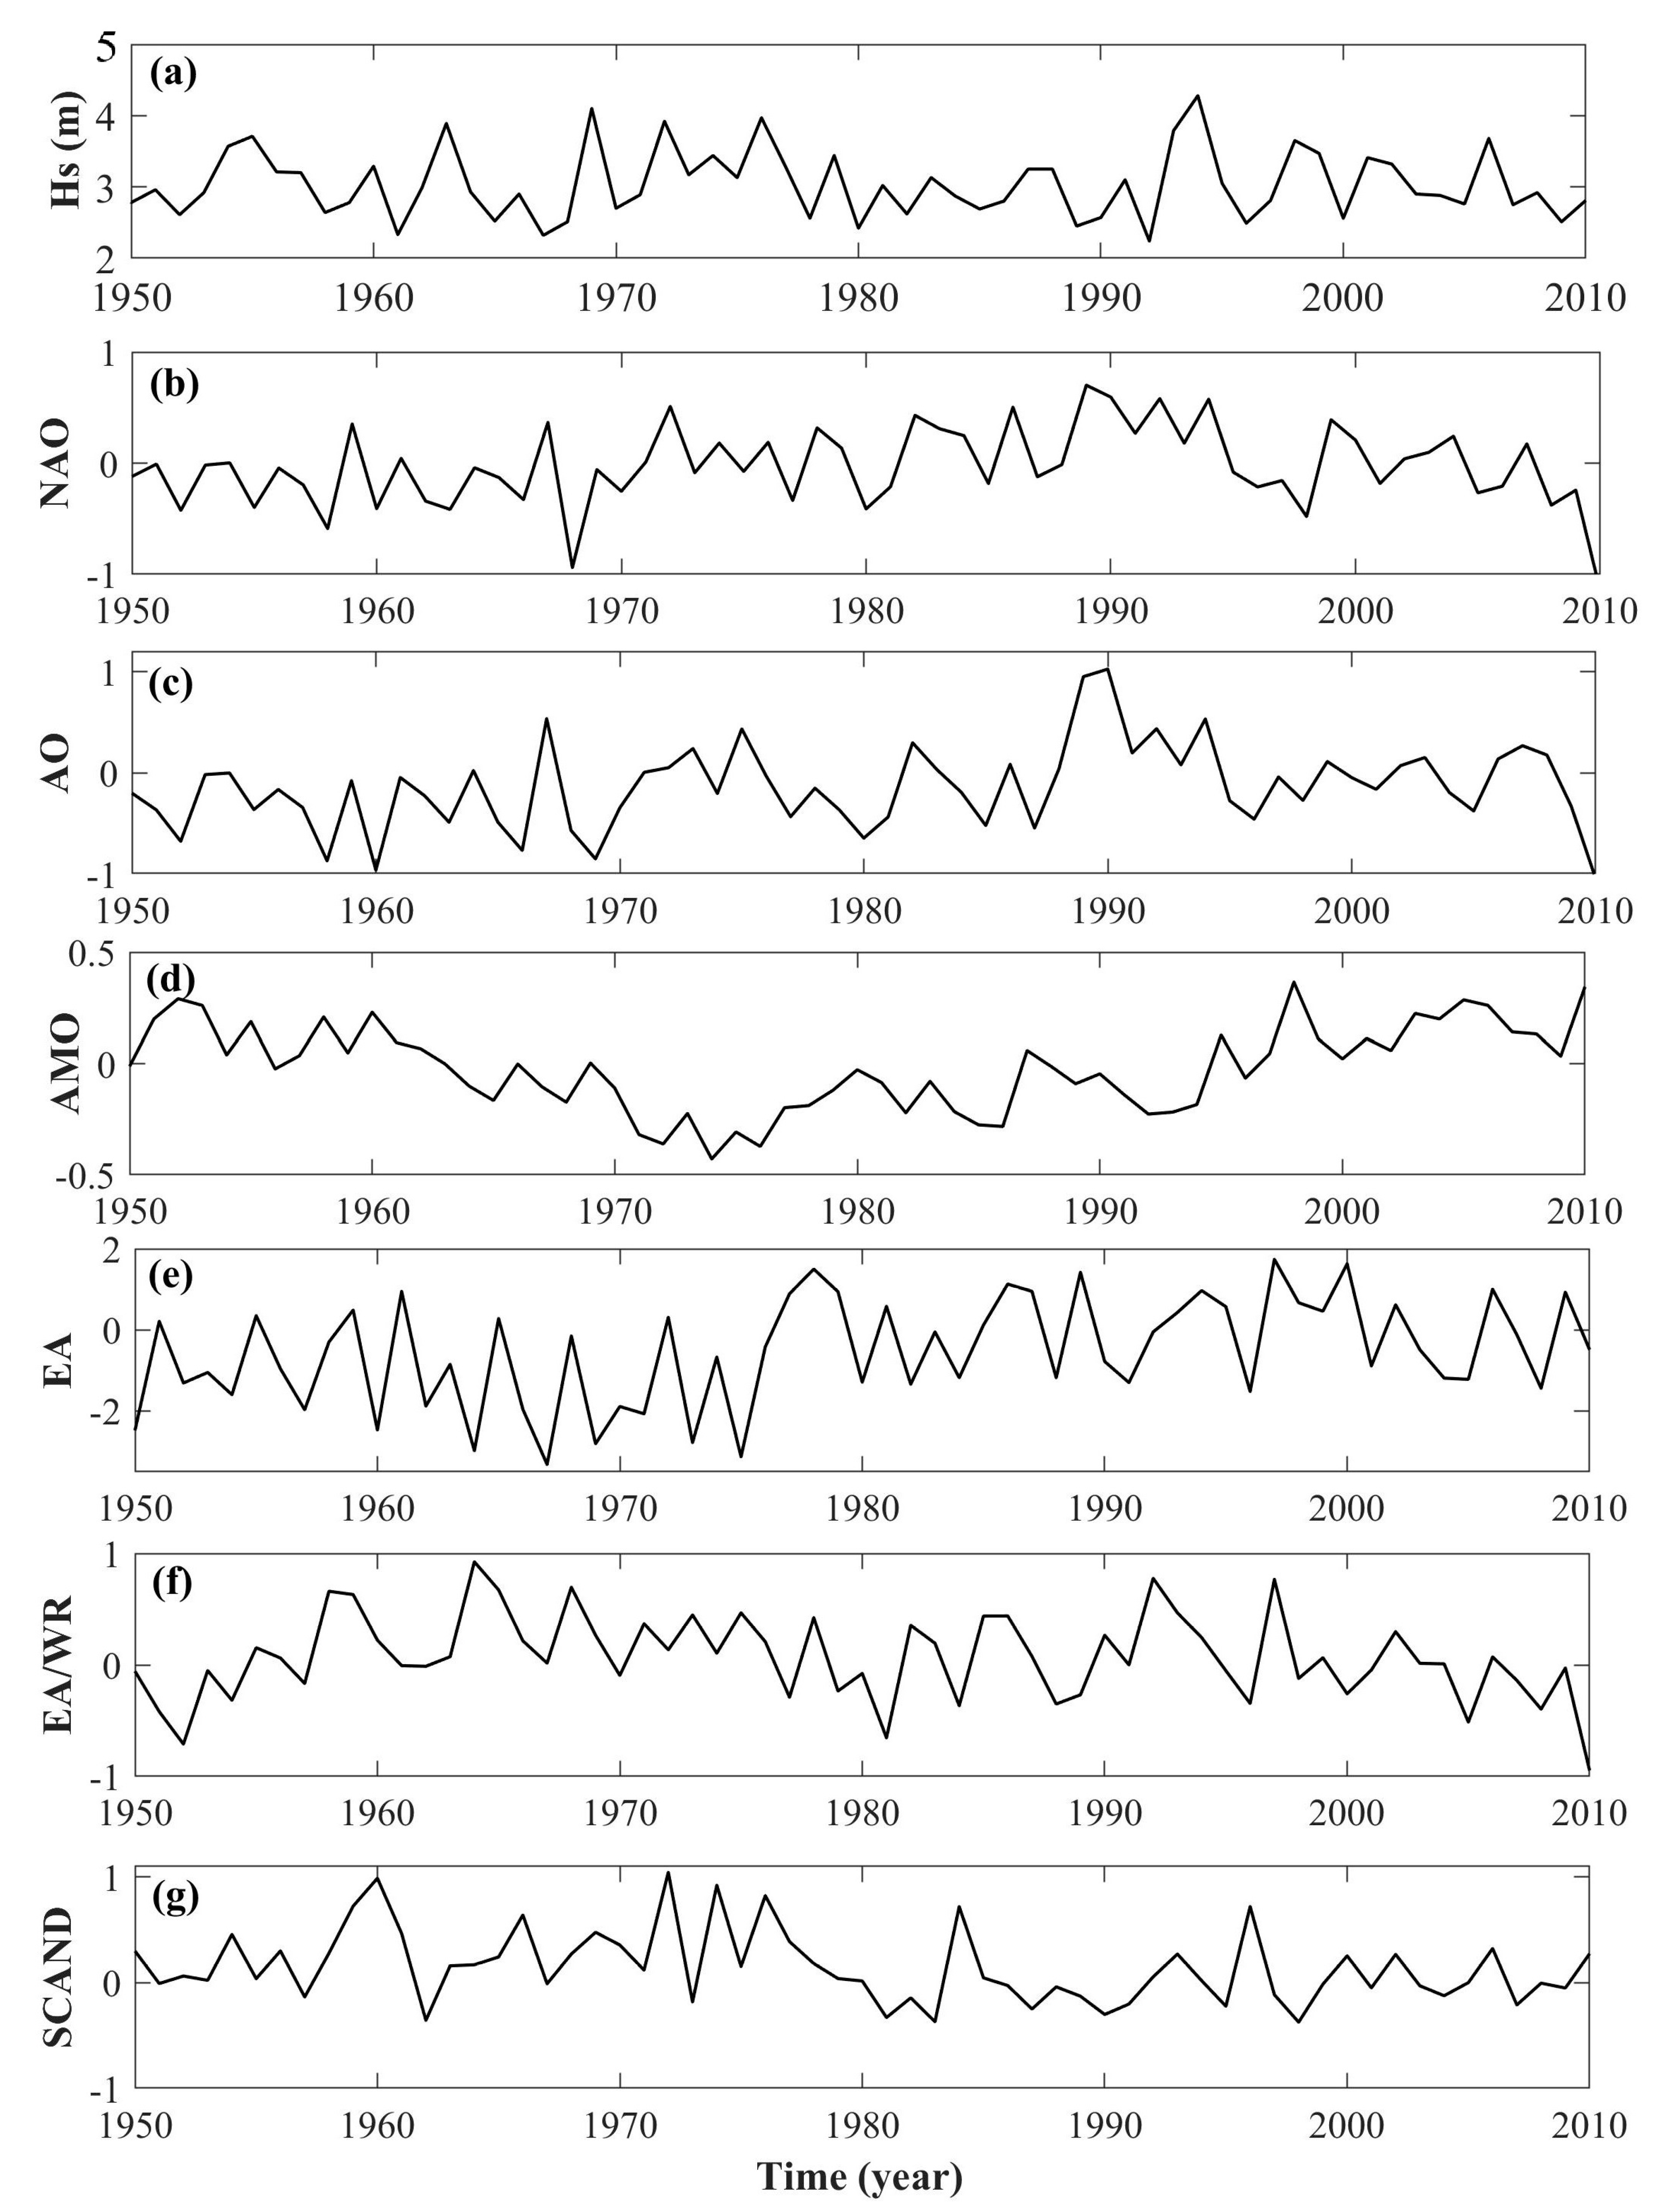
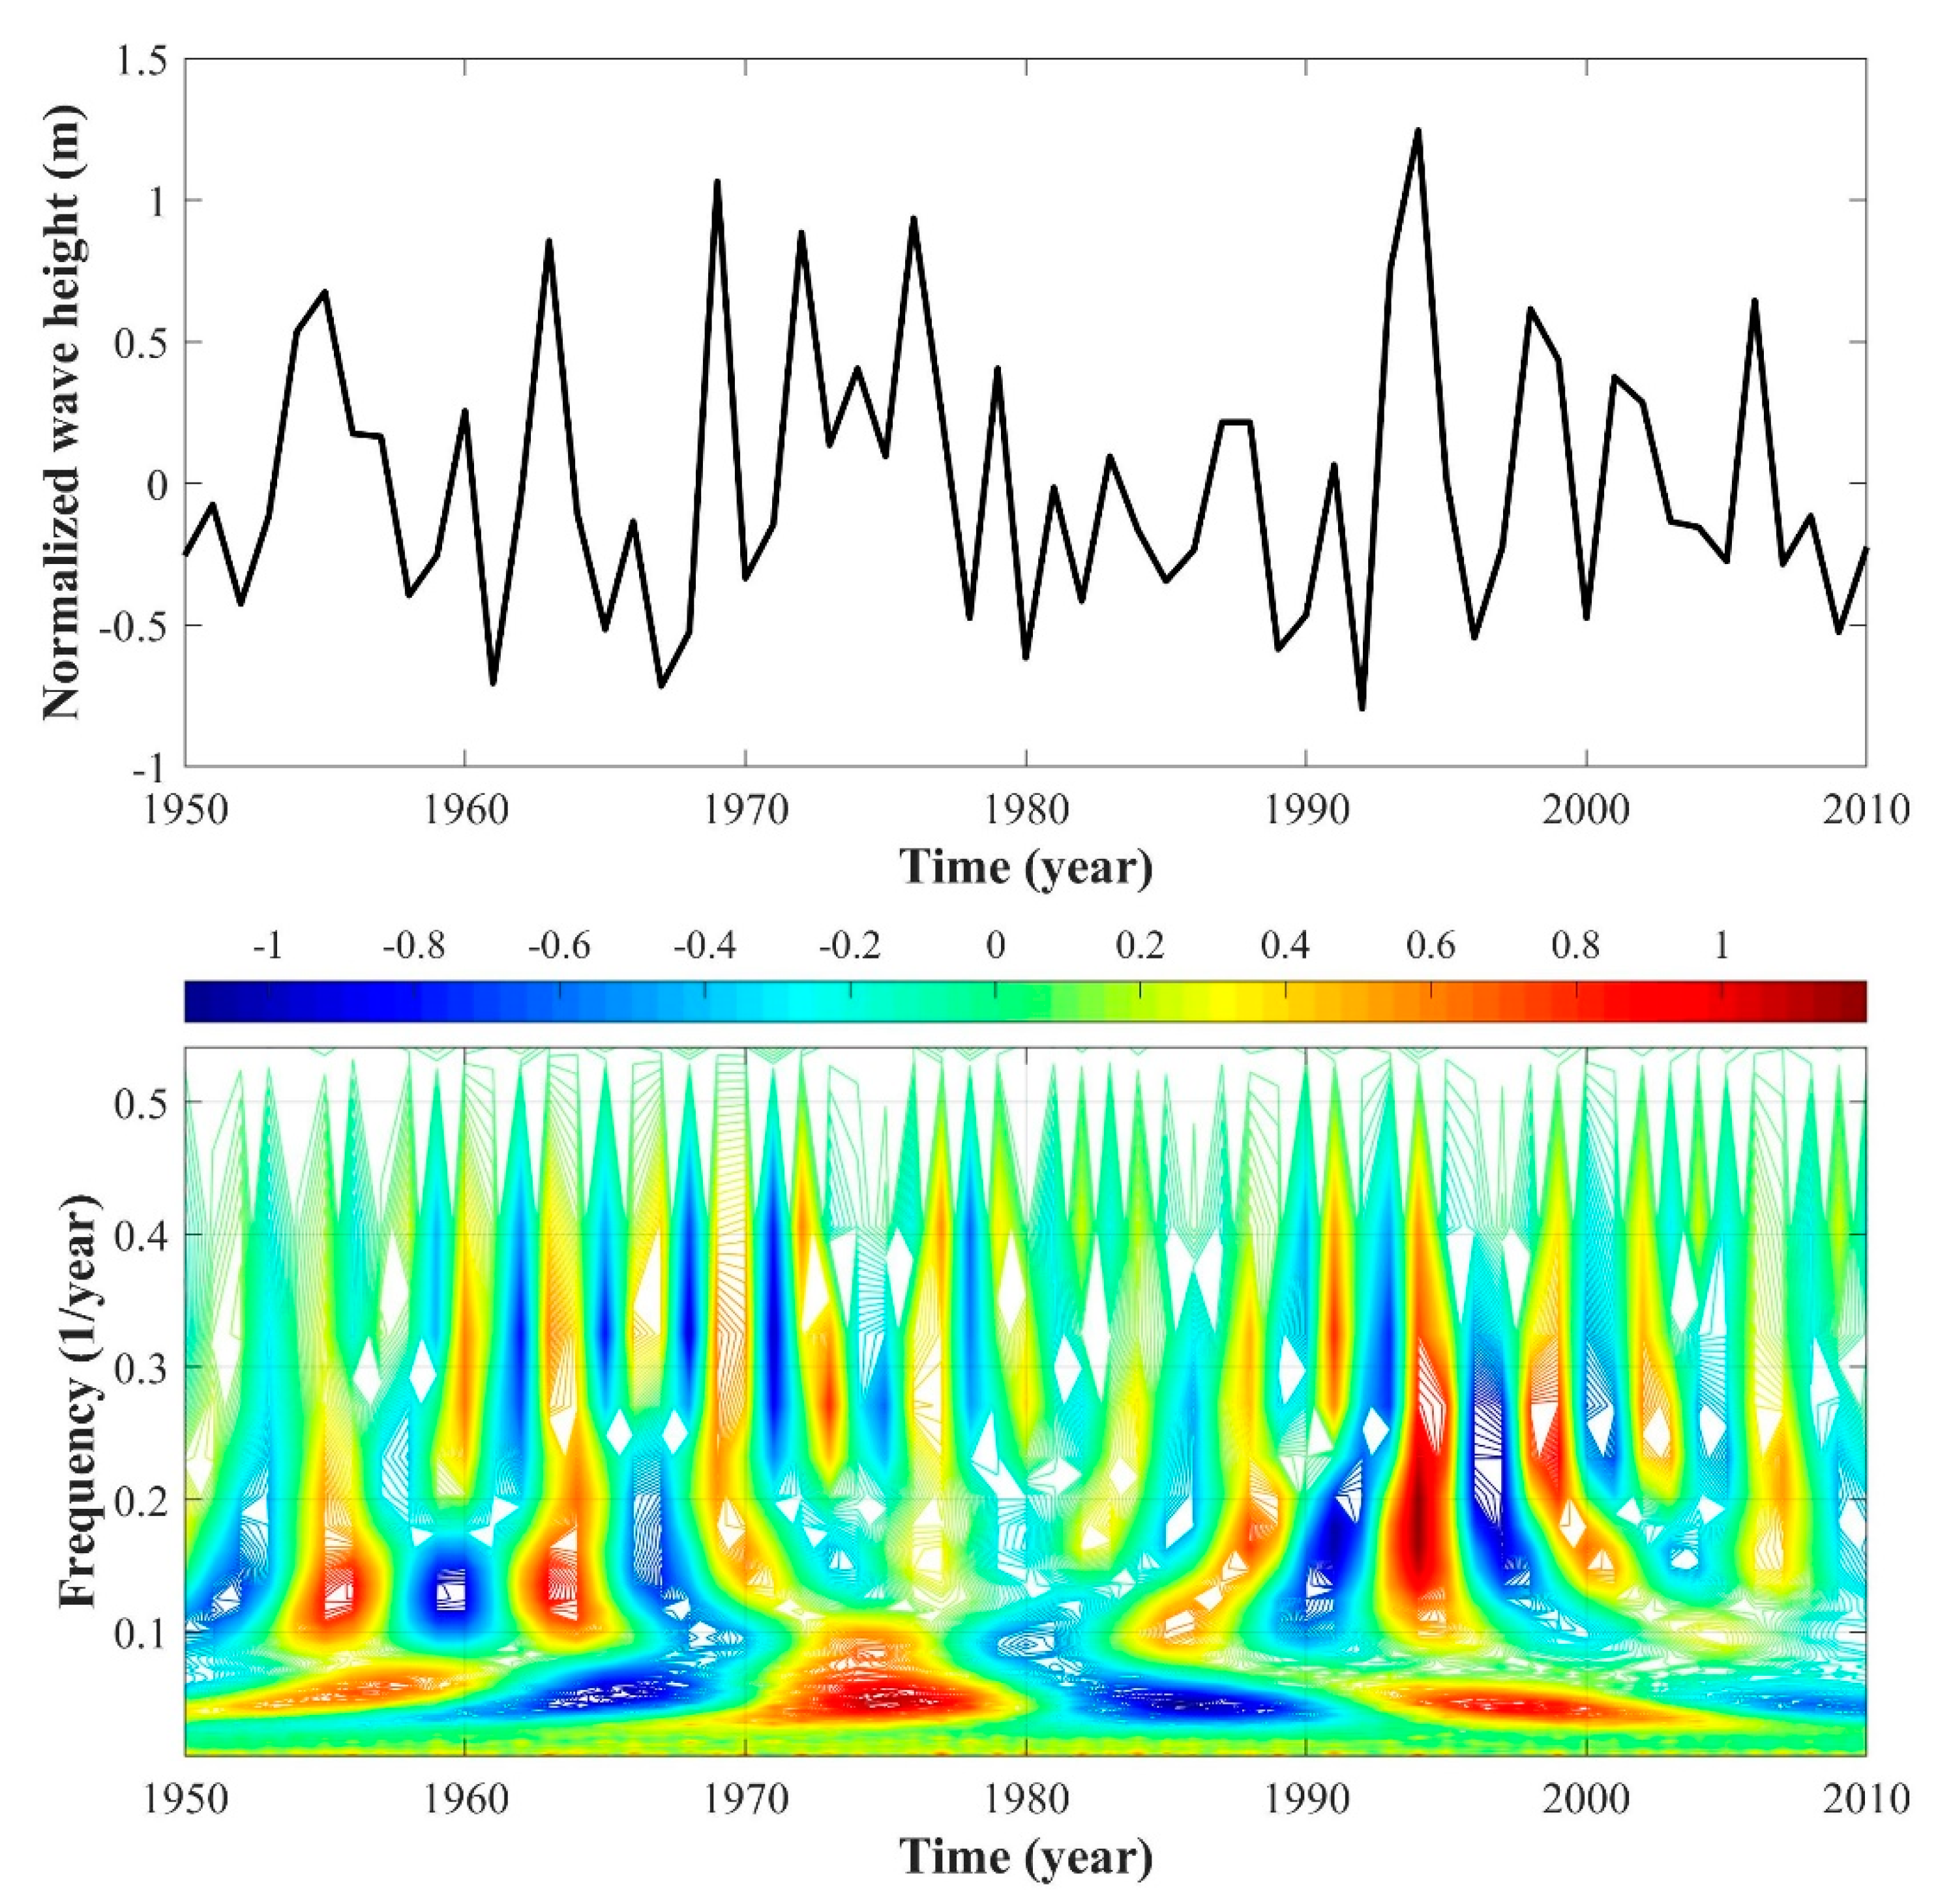
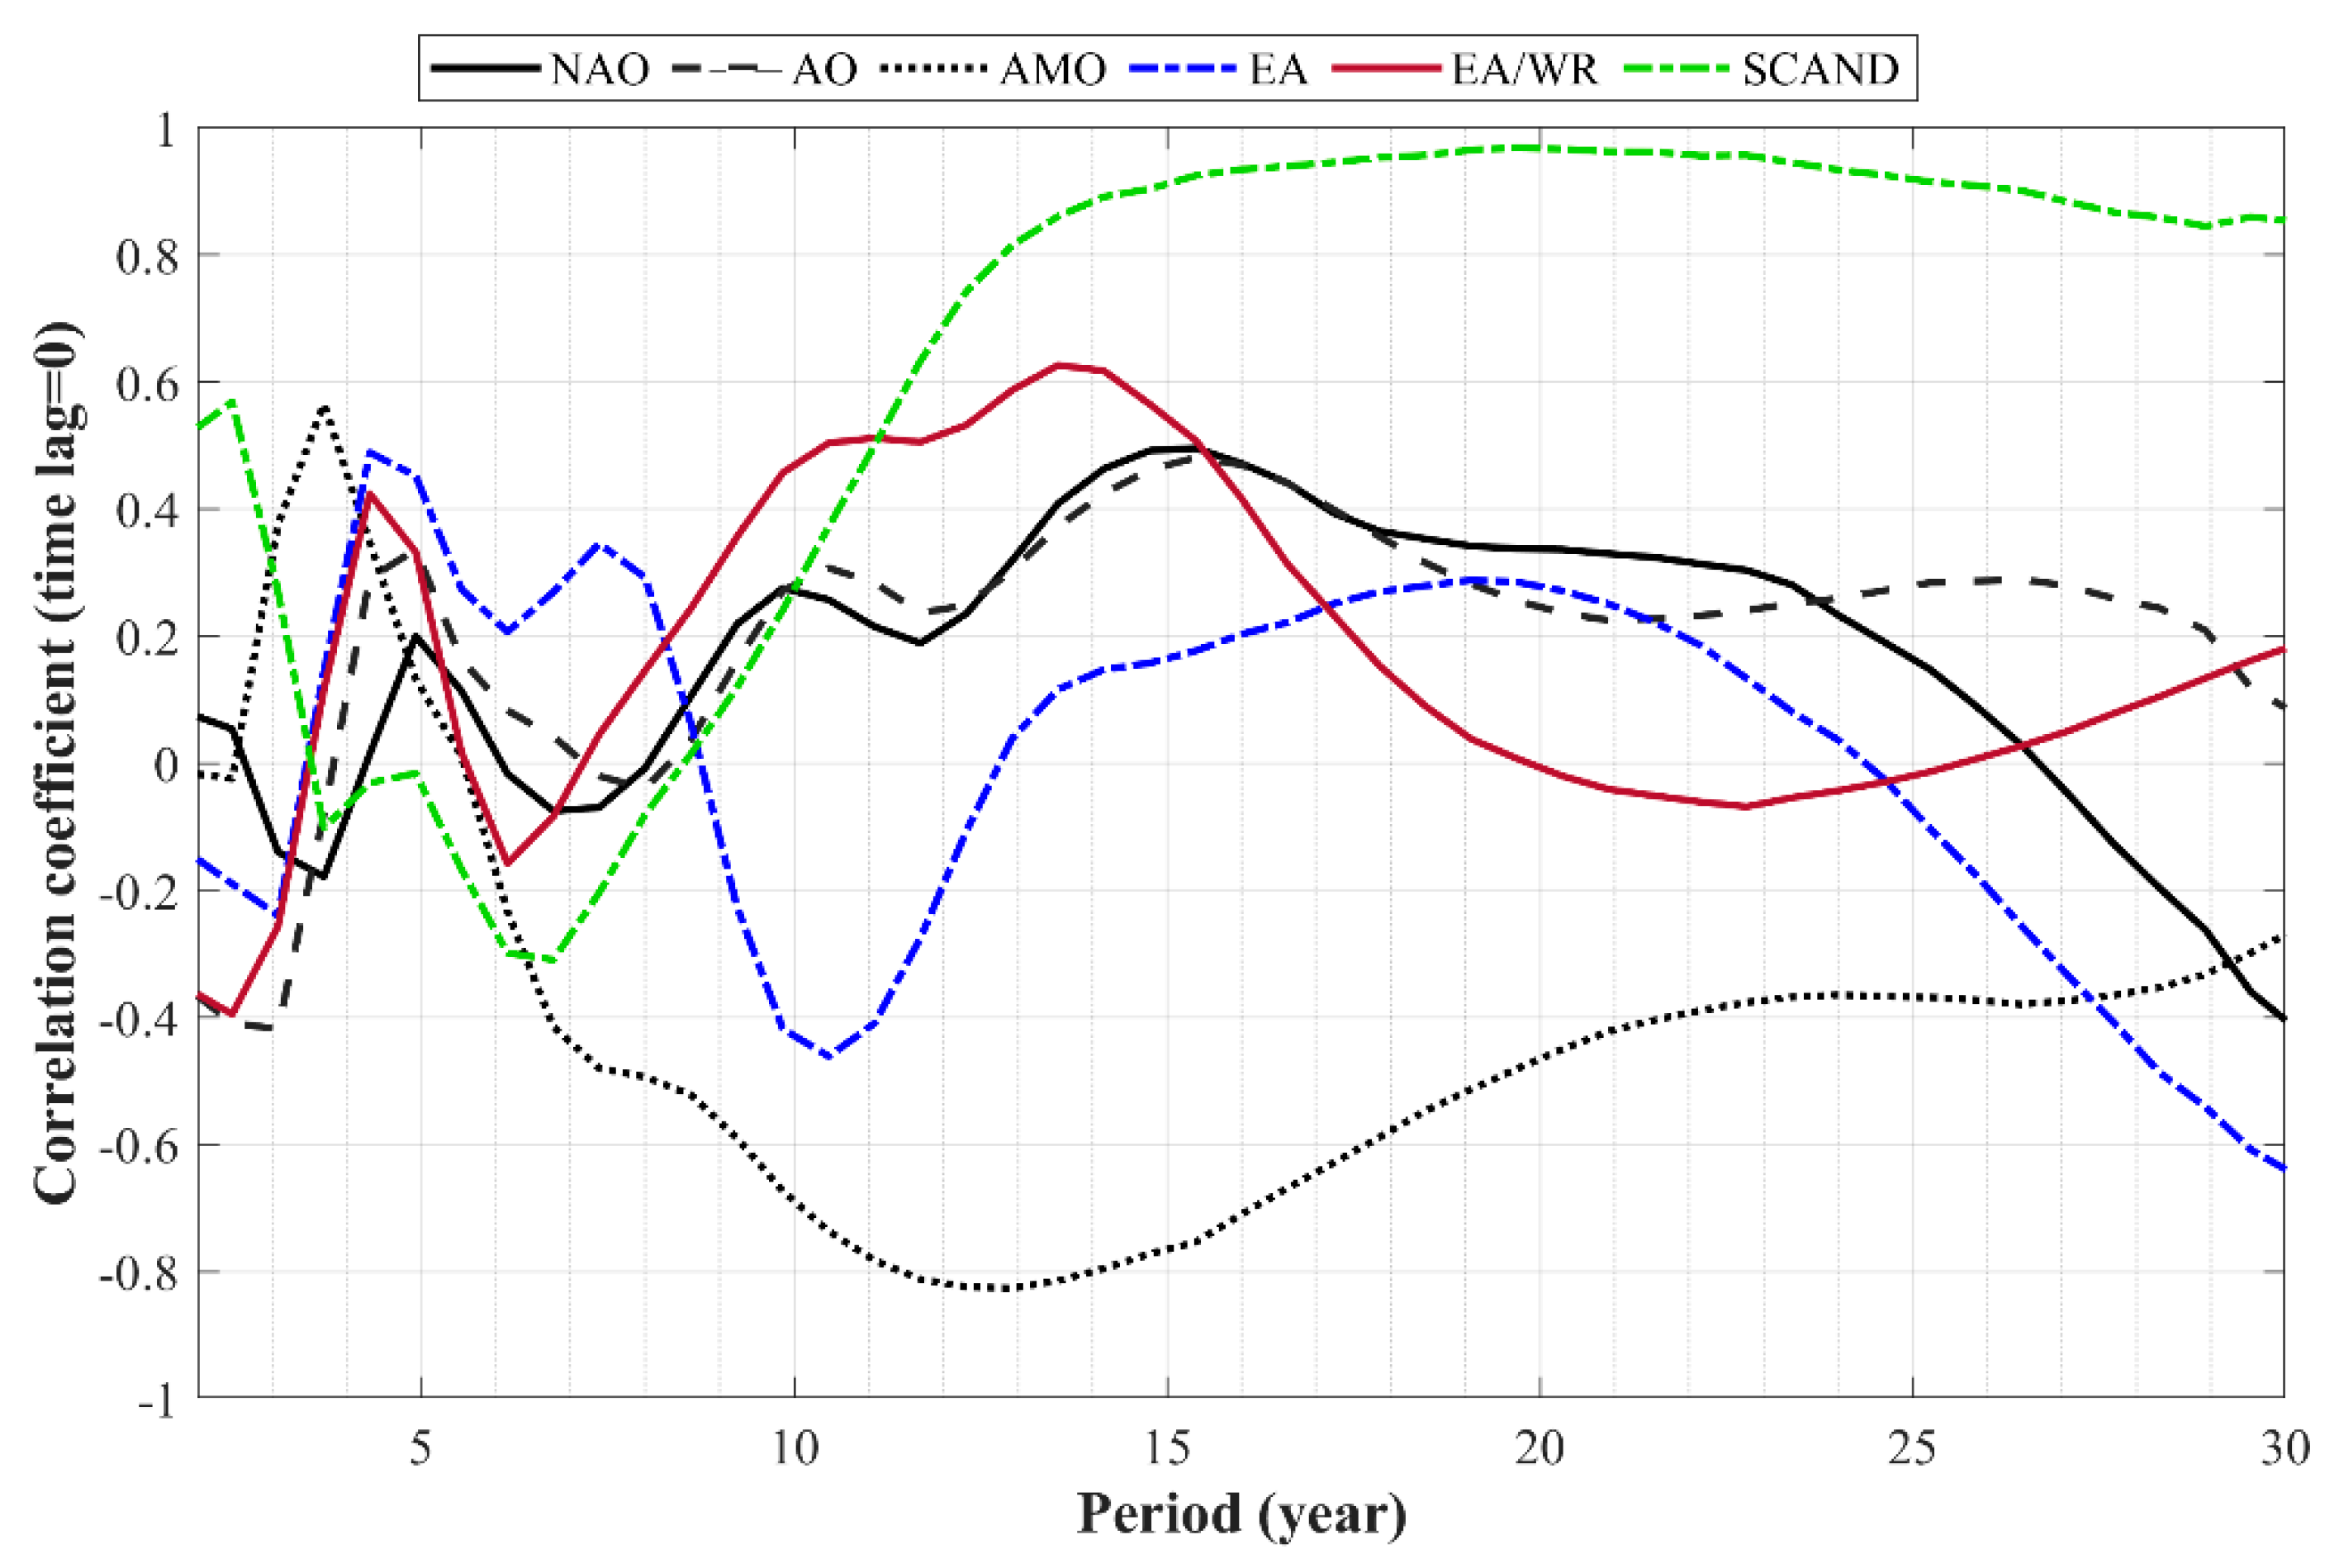
4.2. Possible Periods of Inter-Annual Outer Bar Evolution due to Variations of Wave Climate
5. Conclusions
Author Contributions
Funding
Institutional Review Board Statement
Informed Consent Statement
Data Availability Statement
Acknowledgments
Conflicts of Interest
References
- Plant, N.G.; Holman, R.A.; Freilich, M.H. A simple model for inter-annual sandbar behavior. J. Geophys. Res. 1999, 104, 15755–15776. [Google Scholar] [CrossRef]
- O’Hare, T.J.; Huntley, D.A. Bar formation due to wave groups and associated long waves. Mar. Geol. 1994, 116, 313–325. [Google Scholar] [CrossRef]
- Wijnberg, K.M.; Kroon, A. Barred beaches. Geomorphology 2002, 48, 103–120. [Google Scholar] [CrossRef]
- Dyhr-Nielsen, M.; Sorensen, T. Some sand transport phenomena on coasts with bars. In Proceedings of the 12th International Conference on Coastal Engineering, Washington, DC, USA, 13–18 September 1970; pp. 855–866. [Google Scholar] [CrossRef] [Green Version]
- Sallenger, A.H.; Howd, P.A. Nearshore bars and the breakpoint hypothesis. Coast. Eng. 1989, 12, 301–313. [Google Scholar] [CrossRef]
- Roelvink, J.A. Surf Beat and its Effect on Cross-Shore Profiles. Ph.D. Thesis, Delft University of Technology, Delft, The Netherlands, 1993; 150p. Available online: http://resolver.tudelft.nl/uuid:160325cb-e1d2-46ec-855e-4626dc4ab754 (accessed on 7 May 2021).
- Ruessink, B.G. Infra-Gravity Waves in a Dissipative Multiple Bar System. Ph.D. Thesis, Utrecht University, Utrecht, The Netherlands, 1998; 254p. [Google Scholar]
- Boczar-Karakiewicz, B.; Davidson-Arnott, R.G.D. Nearshore bar formation by non-linear wave processes—A comparison of model results and field data. Mar. Geol. 1987, 77, 287–304. [Google Scholar] [CrossRef]
- Falques, A.; Montoto, A.; Iranzo, V. Bed-flow instability of the longshore current. Cont. Shelf Res. 1996, 16, 1927–1964. [Google Scholar] [CrossRef]
- Larson, M.; Kraus, N.C. Analysis of Cross-Shore Movement of Natural Longshore Bars and Material Placed to Create Longshore Bars; Technical Report DRP-92-5; U.S. Army Engineer Waterways Experiment Station: Vicksburg, MS, USA, 1992; p. 116. Available online: http://resolver.tudelft.nl/uuid:72cb2f64-5ad7-4e7f-9a15-2a778eab1d9e (accessed on 7 May 2021).
- Yuhi, M.; Matsuyama, M.; Hayakawa, K. Sandbar migration and shoreline change on the Chirihama Coast, Japan. J. Mar. Sci. Eng. 2016, 4, 40. [Google Scholar] [CrossRef] [Green Version]
- Ruessink, B.G.; Ranasinghe, R. Beaches. In Coastal Environments & Global Change, 1st ed.; Masselink, G., Gehrels, R., Eds.; John Wiley & Sons, Ltd.: Chichester, UK, 2015; pp. 149–177. [Google Scholar]
- Walstra, D.J.R. On the anatomy of nearshore sandbars: A systematic exposition of inter-annual sandbar dynamics. Doctoral Thesis, Delft University of Technology, Delft, The Netherlands, 2016; 138p. [Google Scholar] [CrossRef]
- Ribas, F.; Albert Falqués, A.; Garnier, R. Nearshore sand bars. In Atlas of Bedforms in the Western Mediterranean; Guillén, J., Acosta-Yepes, J., Chiocci, F.L., Palanques, A., Eds.; Springer International Publishing: Cham, Switzerland, 2017; Chapter 13; pp. 73–79. [Google Scholar]
- Ruggiero, P.; Walstra, D.J.R.; Gelfenbaum, G.; van Ormondt, M. Seasonal-scale nearshore morphological evolution: Field observations and numerical modeling. Coast. Eng. 2009, 56, 1153–1172. [Google Scholar] [CrossRef]
- Shepard, F.P. Beach Cycles in Southern California. Beach Erosion Board, Technical Memorandum; Beach Erosion Board Engineer Research and Development Center: Vicksburg, MS, USA, 1950; Volume 20, p. 31. Available online: https://hdl.handle.net/11681/3369 (accessed on 7 May 2021).
- Dubarbier, B.; Castelle, B.; Ruessink, G.; Marieu, V. Mechanisms controlling the complete accretionary beach state sequence. Geophys. Res. 2017, 44, 5645–5654. [Google Scholar] [CrossRef]
- Ruessink, B.G.; Kuriyama, Y.; Reniers, A.J.H.M.; Roelvink, J.A.; Walstra, J.A. Modeling cross-shore sandbar behavior on the timescales of weeks. J. Geophys. Res. 2007, 112. [Google Scholar] [CrossRef] [Green Version]
- Grasso, F.; Michallet, H.; Certain, R.; Barthélemy, E. Experimental flume simulation of sandbar dynamics. J. Coast. Res. 2009, 56, 54–58. Available online: https://0-www-jstor-org.brum.beds.ac.uk/stable/25737536 (accessed on 7 May 2020).
- Walstra, D.J.R.; Ruggiero, P.; Lesser, G.; Gelfenbaum, G. Modeling nearshore morphological evolution at seasonal scale. In Proceedings of the Fifth Coastal Dynamics International Conference, Barcelona, Spain, 4–8 April 2005. [Google Scholar] [CrossRef]
- Ruessink, B.G.; Pape, L.; Turner, I.L. Daily to interannual cross-shore sandbar migration: Observations from a multiple sandbar system. Cont. Shelf Res. 2009, 29, 1663–1677. [Google Scholar] [CrossRef]
- Cheng, J. Multiple scales of beach morphodynamic processes: Measurements and modelling. Ph.D. Thesis, University of South Florida, Tampa, FL, USA, 2015; p. 198. Available online: https://scholarcommons.usf.edu/etd/5924 (accessed on 7 May 2021).
- Vidal-Ruiz, J.A.; de Alegría-Arzaburu, A.R. An annual cycle of sandbar migration on an intermediate meso-tidal beach: Ensenada, Mexico. In Proceedings of the Coastal Dynamics 2017, Helsingør, Denmark, 12–16 June 2017; pp. 575–585, Paper No. 223. [Google Scholar]
- Vidal-Ruiz, J.A.; de Alegría-Arzaburu, A.R. Variability of sandbar morphometrics over three seasonal cycles on a single-barred beach. Geomorphology 2019, 333, 61–72. [Google Scholar] [CrossRef]
- Bergsma, E.W.J.; Conley, D.C.; Davidson, M.A.; O’Hare, T.J.; Almar, R. Storm Event to Seasonal Evolution of Nearshore Bathymetry Derived from Shore-Based Video Imagery. Remote Sens. 2019, 11, 519. [Google Scholar] [CrossRef] [Green Version]
- Prusak, Z.; Nikolov, H. Analysis of type-profiles in the conditions of the coastal zones of Poland and Bulgaria. Proc. IO-BAS 1992, 1, 65–73. (In Bulgarian) [Google Scholar]
- Trifonova, E.; Valchev, N.; Andreeva, N.; Eftimova, P. Critical storm thresholds for morphological changes in the western Black Sea coastal zone. Geomorphology 2012, 143–144, 81–94. [Google Scholar] [CrossRef]
- Nikolov, H. Thickness of the eroded layer and tendencies in beach profile changes in front of seaside resorts ‘Albena’, ‘Golden sands’ and ‘Drujba’. Oceanology 1981, 8, 54–60. (In Bulgarian) [Google Scholar]
- Keremedchiev, S. Seasonal fluctuations of beach pr ofiles. Oceanology 1985, 14, 63–74. (In Bulgarian) [Google Scholar]
- Nikolov, H. Influence of wave steepness and bottom slope on the short-term deformations of the underwater bottom slope. In Interaction of the Atmosphere, Hydrosphere and Lithosphere in the Nearshore Zone—Results of the International Experiment ‘Kamchia 78′, 1st ed.; Belberov, Z., Antsyferov, S., Zahariev, V., Zats, V., Pykhov, N., Eds.; Publishing House of the Bulgarian Academy of Sciences: Sofia, Bulgaria, 1982; pp. 205–212. (In Bulgarian) [Google Scholar]
- Antsyferov, S.; Pykhov, N.; Dachev, V. Dynamics of suspended sediments. In Dynamical Processes in Coastal Regions, 1st ed.; Antsyferov, S., Belberov, Z., Massel, S., Eds.; Publishing house of the Bulgarian Academy of Sciences: Sofia, Bulgaria, 1990; pp. 157–159. [Google Scholar]
- Trifonova, E.; Valchev, N.; Andreeva, N.; Eftimova, P.; Kotsev, I. Measurements and analysis of storm induced short-term morphological changes in the western Black Sea. J. Coast. Res. 2011, 1, 149–154. Available online: https://0-www-jstor-org.brum.beds.ac.uk/stable/26482151 (accessed on 7 May 2021).
- Eftimova, P.; Trifonova, E.; Valchev, N.; Andreeva, N. Beach erosion caused by storms. Morphological model set up and calibration. In Proceedings of the 11th International Conference on Marine Sciences and technologies—Black Sea’2012, Varna, Bulgaria, 4–6 October 2012; pp. 69–73. [Google Scholar]
- Valchev, N.; Andreeva, N.; Eftimova, P.; Trifonova, E. Prototype of early warning system for coastal storm hazard (Bulgarian Black Sea coast). Compt. Rend. Acad. Bulg. Sci. 2014, 67, 971–978. [Google Scholar]
- Valchev, N.; Eftimova, P.; Andreeva, N. Implementation and validation of a multi-domain coastal hazard forecasting system in an open bay. Coast. Eng. 2018, 134, 212–228. [Google Scholar] [CrossRef]
- Walstra, D.-J.R.; Wesselman, D.A.; Van der Deijl, E.C.; Ruessink, G. On the intersite variability in inter-annual nearshore sandbar cycles. J. Mar. Sci. Eng. 2016, 4, 15. [Google Scholar] [CrossRef] [Green Version]
- Shand, R.D.; Bailey, D.G.; Shephard, M.J. An inter-site comparison of net offshore bar migration characteristics and environmental conditions. J. Coast. Res. 1999, 15, 750–765. [Google Scholar]
- Ruessink, B.G.; Kroon, A. The behavior of a multiple bar system in the nearshore zone of Terschelling: 1965–1993. Mar. Geol. 1994, 121, 187–197. [Google Scholar] [CrossRef]
- Wijnberg, K.M.; Terwindt, J.H.J. Extracting decadal morphological behavior from high-resolution, long-term bathymetric surveys along the Holland coast using Eigen function analysis. Mar. Geol. 1995, 126, 301–330. [Google Scholar] [CrossRef]
- Ruessink, B.G.; Terwindt, J.H.J. The behavior of nearshore bars on the time scale of years: A conceptual model. Mar. Geol. 2000, 163, 289–302. [Google Scholar] [CrossRef]
- Masselink, G.; Austin, M.; Scott, T.; Poate, T.; Russell, P. Role of wave forcing, storms and NAO in outer bar dynamics on a high-energy, macro-tidal beach. Geomorphology 2014, 226, 76–93. [Google Scholar] [CrossRef] [Green Version]
- Saprykina, Y.; Kuznetsov, S.; Valchev, N. Multi-decadal fluctuations of storminess of the Black Sea due to teleconnection patterns on the base of modelling and field wave data. In Lecture Notes in Civil Engineering, Proceedings of the Fourth International Conference in Ocean Engineering (ICOE2018), Chennai, India, 18–21 February 2018; Murali, K., Sriram, V., Samad, A., Saha, N., Eds.; Springer: Singapore, 2019; Volume 22, pp. 773–781. [Google Scholar] [CrossRef]
- D-Maps: Free Maps. Available online: https://d-maps.com (accessed on 7 May 2021).
- Maxar Technologies—High-Resolution Satellite Imagery, Westminster, CO, USA. Available online: https://www.maxar.com (accessed on 7 May 2021).
- Ostrowski, R.; Pruszak, Z.; Skaja, M.; Szmytkiewicz, M.; Trifonova, E.; Keremedchiev, S.; Andreeva, N. Hydrodynamics and lithodynamics of dissipative and reflective shores in view of field investigations. Arch. Hydro-Eng. Environ. Mech. 2010, 57, 219–241. [Google Scholar]
- Valchev, N.; Davidan, I.; Belberov, Z.; Palazov, A.; Valcheva, N. Hindcasting and assessment of the western Black sea wind and wave climate. J. Environ. Prot. Ecol. 2010, 11, 1001–1012. [Google Scholar]
- Belberov, Z.; Antsyferov, S. Research station conditions and organization of experiments. In Dynamical Processes in Coastal Regions: Results of Kamchia International Project, 1st ed.; Popov, V., Antsyferov, S., Belberov, Z., Massel, S., Eds.; Publishing House of the Bulgarian Academy of Sciences: Sofia, Bulgaria, 1990; pp. 14–22. [Google Scholar]
- Davidan, I.; Belberov, Z.; Aubrey, D.; Lavrenov, I. Transformation of wind wave spectral parameters according to the Black sea international experiment. Proc. IO-BAS 2005, 5, 51–64. [Google Scholar]
- Saprykina, Y.; Kuznetsov, S.; Andreeva, N.; Shtremel, M. Scenarios of non-linear wave transformation in the coastal zone. Oceanology 2013, 53, 422–431. [Google Scholar] [CrossRef]
- Kuznetsova, O.; Saprykina, Y.; Shtremel, M.; Kuznetsov, S.; Korzinin, D.; Trifonova, E.; Andreeva, N.; Valchev, N.; Prodanov, B.; Eftimova, P.; et al. Dynamics of sandy beach in dependence on wave parameters. In Maritime Transportation and Harvesting of Sea Resources, Proceedings of the 17th International Congress of the International Maritime Association of the Mediterranean (IMAM’2017), Lisbon, Portugal, 9–11 October 2017; Guedes Soares, C., Teixeira, A.P., Eds.; Taylor & Francis Group: London, UK, 2017; Volume 2, pp. 1075–1079. [Google Scholar]
- Nikolov, H.; Pykhov, N. Brief deformations along the profile of the underwater coastal slope during storm. In Interaction of the Atmosphere, Hydrosphere and Lithosphere in the Nearshore Zone. Results of the International Experiment ‘Kamchia 77′, 1st ed.; Belberov, Z., Zahariev, V., Kuznetsov, O., Massel, S., Pykhov, N., Rojdestvensky, A., Filyushkin, B., Eds.; Publishing House of the Bulgarian Academy of Sciences: Sofia, Bulgaria, 1980; pp. 229–237. (In Russian) [Google Scholar]
- U.S. Army Corps of Engineers. Coastal Engineering Manual, 18th ed.; U.S. Army Corps of Engineers: Washington, DC, USA, 2006; Electronic; ISBN 978-1-60119-026-0. Available online: http://app.knovel.com/hotlink/toc/id:kpCEM0000P/coastal-engineering-manual (accessed on 7 May 2021).
- The SWAN Team. SWAN User Manual; Delft University of Technology: Delft, The Netherlands, 2016. [Google Scholar]
- Feser, F.; Weisse, R. Multi-decadal atmospheric modeling for Europe yields multi-purpose data. EOS Trans. AGU 2001, 82, 305–310. [Google Scholar] [CrossRef] [Green Version]
- Yang, F.; Pan, H.; Krueger, S.K.; Moorthi, S.; Lord, S.J. Evaluation of the NCEP global forecast system at the arm SGP site. Mon. Weather Rev. 2006, 134, 3668–3690. [Google Scholar] [CrossRef]
- Valchev, N.; Trifonova, E.; Andreeva, N. Past and recent trends in the western Black Sea storminess. Nat. Hazards Earth Syst. Sci. 2012, 12, 961–977. [Google Scholar] [CrossRef]
- Roelvink, D.; Reniers, A.; van Dongeren, A.; van Thiel de Vries, J.; McCall, R.; Lescinski, J. Modelling storm impacts on beaches, dunes and barrier islands. Coast. Eng. 2009, 56, 1133–1152. [Google Scholar] [CrossRef]
- Vieira, B.F.V.; Pinho, J.L.S.; Barros, J.A.O.; Antunes do Carmo, J.S. Hydrodynamics and Morphodynamics Performance Assessment of Three Coastal Protection Structures. J. Mar. Sci. Eng. 2020, 8, 175. [Google Scholar] [CrossRef] [Green Version]
- Castelle, B.; Bonneton, P.; Dupuis, H.; Sénéchal, N. Double bar beach dynamics on the high-energy meso-macrotidal French Aquitanian Coast: A review. Mar. Geol. 2007, 245, 141–159. [Google Scholar] [CrossRef]
- Saprykina, Y. The influence of wave non-linearity on cross-shore sediment transport in coastal zone: Experimental investigations. Appl. Sci. 2020, 10, 4087. [Google Scholar] [CrossRef]
- Korzinin, D.; Shtremel, M. Deformation of coastal profile during different storm phases. In Proceedings of the 36th International Conference on Coastal Engineering, Baltimore, MD, USA, 30 July–3 August 2018; Volume 1, p. 43. [Google Scholar] [CrossRef] [Green Version]
- Saprykina, Y.; Kuznetsova, O. Influence of wave transformation processes on evolution of underwater beach profile. In Proceedings of the 36th International Conference on Coastal Engineering, Baltimore, MD, USA, 30 July–3 August 2018; Volume 1, p. 65. [Google Scholar] [CrossRef] [Green Version]
- Saprykina, Y.V.; Shtremel, M.N.; Kuznetsov, S.Y. On the possibility of bi-phase parametrization for wave transformation in the coastal zone. Oceanology 2017, 57, 253–264. [Google Scholar] [CrossRef]
- Saprykina, Y.V.; Kuznetsov, S.Y.; Divinskii, B.V. Influence of processes of nonlinear transformations of waves in the coastal zone on the height of breaking waves. Oceanology 2017, 57, 383–393. [Google Scholar] [CrossRef]
- Longinov, V.V. Coastal Zone Dynamics in Tideless Seas; The USSR Academy of Sciences Publisher House: Moscow, Russia, 1963; p. 379. (In Russian) [Google Scholar]
- Kuznetsova, O.; Saprykina, Y.; Divinsky, B. Underwater barred beach profile transformation under different wave conditions. In Coastal erosion and dynamical processes in the nearshore zone, Proceedings of the Materials of XXVI International Coastal Conference Managing Risks to Coastal Regions and Communities in a Changing World, Saint-Petersburg, Russia, 22–27 August 2016; Academus Publishing: Redwood, CA, USA, 2016. [Google Scholar] [CrossRef]
- Kuznetsova, O.; Saprykina, Y. Intra-annual storm deformations on sandy beach by an example of Kamchia-Shkorpilovtsi coast (Black Sea, Bulgaria). Proc. Geom. 2017, 10, 435–444. (In Russian) [Google Scholar]
- Saprykina, Y.V.; Kuznetsov, S.Y. Methods of analysis of nonstationary variability of wave climate of Black Sea. Phys. Oceanogr. 2018, 4, 156–164. [Google Scholar] [CrossRef]
- Polonsky, A.; Evstigneev, V.; Naumova, V.; Voskresenskaya, E. Low-frequency variability of storms in the northern Black Sea and associated processes in the ocean-atmosphere system. Reg. Environ. Chang. 2014, 14, 1861–1871. [Google Scholar] [CrossRef]
- Zăinescu, F.I.; Tătui, F.; Valchev, N.N.; Vespremeanu-Stroe, A. Storm climate on the Danube delta coast: Evidence of recent storminess change and links with large-scale teleconnection patterns. Nat. Hazards 2017, 87, 599–621. [Google Scholar] [CrossRef]
- Saprykina, Y.; Shtremel, M.; Aydoğan, B.; Ayat Aydoğan, B. Variability of the nearshore wave climate in the eastern part of the Black Sea. Pure Appl. Geoph. 2019, 176, 3757–3768. [Google Scholar] [CrossRef]
- Saprykina, Y.; Kuznetsov, S. Analysis of the variability of wave energy due to climate changes on the example of the Black Sea. Energies 2018, 11, 2020. [Google Scholar] [CrossRef] [Green Version]
- National Oceanic and Atmospheric Administration of U.S.A. Available online: https://www.cpc.ncep.noaa.gov (accessed on 23 January 2021).
- Sonu, C. Three-dimensional beach changes. J. Geol. 1973, 81, 42–64. Available online: https://0-www-jstor-org.brum.beds.ac.uk/stable/30060693 (accessed on 7 May 2021). [CrossRef]


| Profile Type | Winter Profiles | Summer Profiles | Transitional Profiles | |||
|---|---|---|---|---|---|---|
| Seasons | Nov 2008–Feb 2009 | Nov 2009–Feb 2010 | Mar–Jul 2009 | Mar–Apr 2010 | Aug–Oct 2009 | Aug 2010 |
| Bar crest average offshore distance (m) | 193 | 191 | 217 | 208 | 202 | 204 1 |
| Bar crest average depth (m) | 3.65 | 4.02 | 3.91 | 4.4 | 3.92 | 4.29 1 |
| Average bar height (m) | 0.99 | 0.6 | 0.78 | 0.35 | 0.66 | 0.29 1 |
| Storm Groups (SG) | Hs (m) | Tp (s) | Hs/Lp | Duration of Wave Conditions with Hs/Lp > 0.04 (h) |
|---|---|---|---|---|
| SG1: Storms moving the outer bar shoreward (January 2009, September–October–November 2009, January 2010) | 1.59 | 6.7 | 0.036 | 66 |
| SG2: Storms moving the outer bar seaward (February 2009, December 2009, February–March 2010) | 1.7 | 7.2 | 0.037 | 121 |
Publisher’s Note: MDPI stays neutral with regard to jurisdictional claims in published maps and institutional affiliations. |
© 2021 by the authors. Licensee MDPI, Basel, Switzerland. This article is an open access article distributed under the terms and conditions of the Creative Commons Attribution (CC BY) license (https://creativecommons.org/licenses/by/4.0/).
Share and Cite
Andreeva, N.; Saprykina, Y.; Valchev, N.; Eftimova, P.; Kuznetsov, S. Influence of Wave Climate on Intra and Inter-Annual Nearshore Bar Dynamics for a Sandy Beach. Geosciences 2021, 11, 206. https://0-doi-org.brum.beds.ac.uk/10.3390/geosciences11050206
Andreeva N, Saprykina Y, Valchev N, Eftimova P, Kuznetsov S. Influence of Wave Climate on Intra and Inter-Annual Nearshore Bar Dynamics for a Sandy Beach. Geosciences. 2021; 11(5):206. https://0-doi-org.brum.beds.ac.uk/10.3390/geosciences11050206
Chicago/Turabian StyleAndreeva, Nataliya, Yana Saprykina, Nikolay Valchev, Petya Eftimova, and Sergey Kuznetsov. 2021. "Influence of Wave Climate on Intra and Inter-Annual Nearshore Bar Dynamics for a Sandy Beach" Geosciences 11, no. 5: 206. https://0-doi-org.brum.beds.ac.uk/10.3390/geosciences11050206