Article

Seismic and Geodetic Imaging (DInSAR) Investigation of the March 2021 Strong Earthquake Sequence in Thessaly, Central Greece

by
Gerassimos A. Papadopoulos
1,*,
Apostolos Agalos
1,
Andreas Karavias
2,
Ioanna Triantafyllou
3,
Issaak Parcharidis
2 and
Efthymios Lekkas
3
1
International Society for the Prevention & Mitigation of Natural Hazards, 10681 Athens, Greece
2
Department of Geography, Harokopio University, 17671 Athens, Greece
3
Department of Dynamic Tectonic Applied Geology, Faculty of Geology and Geoenvironment, National and Kapodistrian University of Athens, 15784 Athens, Greece
*
Author to whom correspondence should be addressed.
Submission received: 7 June 2021 / Revised: 16 July 2021 / Accepted: 21 July 2021 / Published: 25 July 2021
(This article belongs to the Special Issue Morphogenic Faulting: Current Practices and Future Challenges)

Abstract

:
Three strong earthquakes ruptured the northwest Thessaly area, Central Greece, on the 3, 4 and 12 March 2021. Since the area did not rupture by strong earthquakes in the instrumental period of seismicity, it is of great interest to understand the seismotectonics and source properties of these earthquakes. We combined relocated hypocenters, inversions of teleseismic P-waveforms and of InSAR data, and moment tensor solutions to produce three fault models. The first shock (Mw = 6.3) occurred in a fault segment of strike 314° and dip NE41°. It caused surface subsidence −40 cm and seismic slip 1.2–1.5 m at depth ~10 km. The second earthquake (Mw = 6.2) occurred to the NW on an antithetic subparallel fault segment (strike 123°, dip SW44°). Seismic slip of 1.2 m occurred at depth of ~7 km, while surface subsidence −10 cm was determined. Possibly the same fault was ruptured further to the NW on 12 March (Mw = 5.7, strike 112°, dip SSW42°) that caused ground subsidence −5 cm and seismic slip of 1.0 m at depth ~10 km. We concluded that three blind, unknown and unmapped so far normal fault segments were activated, the entire system of which forms a graben-like structure in the area of northwest Thessaly.

1. Introduction

During March 2021 the area of northwest Thessaly, Central Greece, was ruptured by a sequence of three strong earthquakes [1] (Figure 1) that occurred on the 3 (10:16:08 UTC), 4 (18:38:19 UTC) and 12 (12:57:50 UTC) of the month. Source parameters of these earthquakes, determined by the National Observatory of Athens (NOA) as well as from other national and international seismological centers, are listed in Table S1. It is noteworthy that for the first and third strong earthquakes consistent moment magnitudes, Mw~6.3 and Mw~5.7, respectively, have been determined by the various centers. However, magnitudes determined for the second strong earthquake vary from Mw = 5.9 to Mw = 6.3, an issue examined further later. On the other hand, the various fault-plane solutions produced by seismological centers are consistent in that the three strong earthquakes shared focal mechanisms of normal faulting striking roughly NW–SE.
This is also consistent with the active tectonics of the area, which is dominated by a NE–SW to N–S active extensional field [2,3,4,5,6,7,8]. The main faults that dominate the area are the Tyrnavos and Larissa Faults, which dip to N–NE, and the Rodia Fault, which dips to S–SW (Figure 1). The Tyrnavos-Larissa Basin is a tectonic structure which is bounded by the Tyrnavos and Larissa Faults to the south and by the Rodia Fault to the north. The Tyrnavos Fault is one of the major active structures in the study area. It mainly affects the Triassic crystalline limestone of the Pelagonian basement as well as Pliocene and Quaternary deposits [2]. The general trend of the Tyrnavos Fault is about E–W, although a slightly right-bending geometry is evident. The length of the well-defined and mapped fault trace exceeds 12 km [3]. Earthquake parameters determined by NOA showed that the strong seismic activity was preceded by a series of about 30 foreshocks, with local magnitude, ML, ranging from 0.9 to 2.9, occurring in an area of radius of ~30 km around the epicenter of the first shock from 28 February up to 3 March (Figure 1). The first strong earthquake caused damage mostly in old unreinforced houses and other structures mainly in the villages of Damasi, Mesochori and Vlachogianni [1] (Figure 1). Further damage was noted towards NW after the second strong earthquake mainly in the village Domeniko.
The March 2021 earthquake sequence is quite challenging for a number of reasons. First, no strong earthquake has occurred in the entire Thessaly area since 1980, therefore, the last sequence is the first recorded by modern seismograph and other networks, e.g., CGPS. Besides, the March 2021 earthquakes ruptured an area which has been considered as a long-term seismic gap identified on the basis of the historical seismicity of the Thessaly area. The discussion on this issue opened after the observation that the north side of Thessaly, including the area of the March 2021 activity, has not ruptured by strong earthquakes since AD 1781, while the south side ruptured by several strong earthquakes from 1954 up to 1980, after an apparent quiescence since AD 1773 [9,10] (Figure 2). The main conclusion of that apparent space–time earthquake clustering was that should the seismicity pattern in south Thessaly repeat in the north side, then a migration of the activity would be expected northwards in the near future [9,10]. This important issue was further examined and debated in several subsequent studies based on geological data and on space–time seismicity patterns [11,12,13,14,15].
On the other hand, a major challenge is the investigation of the seismic fault(s) associated with the three strong earthquakes. The area extended to the south and southeast from the source of the first earthquake is dominated by mapped and well-studied faults, such as the Tyrnavos (TF) and Larissa (LF) ones, e.g., [1,2,4,5] (Figure 1). A first attempt to investigate the seismotectonics of the three earthquakes was made on the basis of InSAR analysis [16]. The authors of that study suggested that all the three earthquakes have been associated with a normal fault system striking about SE–NW and dipping NE. As we will see later, we propose a different seismotectonic interpretation. The only surface-fault trace observed in association with the March 2021 activity was found in the area of Mesochori (Figure 1) (Prof. I. Koukouvelas, personal communication) but a relevant study is still in progress. Abundant but rather minor ground fissures were reported in the area [17]. Surface manifestations of soil liquefaction were also observed in several spots (Figure 3) lying within the limiting distance, R, from the epicenter of the first earthquake, predicted by empirical relationships between R and earthquake magnitude, M [18]. However, such ground fissures do not provide evidence of surface-fault trace since liquefaction is controlled by other factors, such as M, R and the soil susceptibility.
The present paper focuses on the investigation of the seismotectonics of the strong earthquake activity of March 2021 and the investigation of fault models for the three strongest earthquakes on the basis of seismological and satellite geodesy (DInSAR) observations. We are also interested to understand whether or not the strong earthquakes ruptured segments of the same fault or of different faults. Of equal interest is the investigation of possible links between the March 2021 seismogenic faults with the already known and mapped faults having surface expression in the area (Figure 1). Results on such issues are of importance for the better assessment of the level of seismic hazard in the Thessaly area.

2. Materials and Methods

To investigate the seismotectonics of the three strong earthquakes that ruptured the Thessaly area during March 2021, we relocated their hypocenters, inverted teleseismic P-wave records, produced Interferometric Synthetic Aperture Radar (InSAR) images and inverted InSAR data, and took also critically into account moment tensor solutions produced by several seismological centers. Eventually we redetermined moment magnitudes and concluded with fault models for the three strong earthquakes and proposed a seismotectonic interpretation for the entire sequence.

2.1. Εarthquake Magnitudes

Consistent moment magnitudes, Mw, have been determined by various seismological centers for each one of the first and third strong earthquakes (Table S1). However, Mw determined for the second earthquake ranges from 5.9 to 6.3. It is remarkable that the worldwide recognized Global Centroid Moment Tensor (GCMT) Project and the GEOSCOPE Observatory-French Global Network of broad band seismic stations did not produce moment tensor solutions for this earthquake. In addition, the United States Geological Survey (USGS), another renowned institute, has been able to determine only body-wave magnitude mb = 5.8 for the same earthquake. On the other hand, the solution produced by the GEOFON system of the Deutsche GeoForschungsZentrum (GFZ), Potsdam, provided Mw = 6.3 based on regional stations of the GEOFON system without the use of teleseismic records. The reason is that teleseismic records of the second earthquake have been covered by the records of an earlier large earthquake (Mw = 7.4) occurring in the Kermadec–New Zealand region on 4 March 2021 at 17:41:24.2 UTC (Joachim Saul, GFZ; personal communication). We redetermined moment magnitudes from the inversion of teleseismic records for the first earthquake and from the inversion of InSAR data for the three strong earthquakes.

2.2. Hypocenter Relocation

Τo improve the hypocentral determinations of NOA for the three largest earthquakes of the seismic sequence (Table S1) we relocated the hypocenters by implementing a 1D velocity model (Table 1) and by employing the Non-Linear Location (NLLoc) algorithm [19,20], which follows a non-linear location approach [21] and provides more reliable solutions and hypocenter error estimates as compared to linearized algorithms. The velocity model used is a revision of the one found in an earlier study for a nearby area [22]. NLLoc provides a complete, probabilistic solution of the earthquake location problem expressed in terms of the posterior density function (PDF) in the space and time domains. Only manually re-picked P and S phases recorded by permanent stations of the Hellenic Unified Seismological Network (https://bbnet.gein.noa.gr/HL/real-time-plotting/husn/husnmap, last access 13 May 2021) situated at epicentral distances of up to ~120 km from the first shock were utilized. The reason is that the crustal thinning from the plate boundary towards the back-arc area creates significant errors in accurately locating the earthquake, especially when distant seismic phases are included in the analysis [23]. The difference in the onset times picked relative to NOA’s solution is on average ± 0.15 s. Following an iteration procedure, the relocation was repeated, by including phase residuals at seismic stations obtained from the previous run, until no further significant decrease of the RMS value between two successive runs was achieved, i.e., until minimizing the location errors. To correct for irregular station distribution a relevant station weighting tool in NLLoc was utilized.

2.3. Earthquake Focal Mechanisms

Earthquake focal mechanisms for the three strong earthquakes have been obtained through moment tensor solutions produced by several seismological centers (Table S2). To understand similarities and differences between the various fault-plane solutions we calculated the average strike, dip and rake (slip vector) for each one of the two nodal planes (NPs) involved in the solutions published for each one of the three strong earthquakes. The results received are presented in Section 3.2.

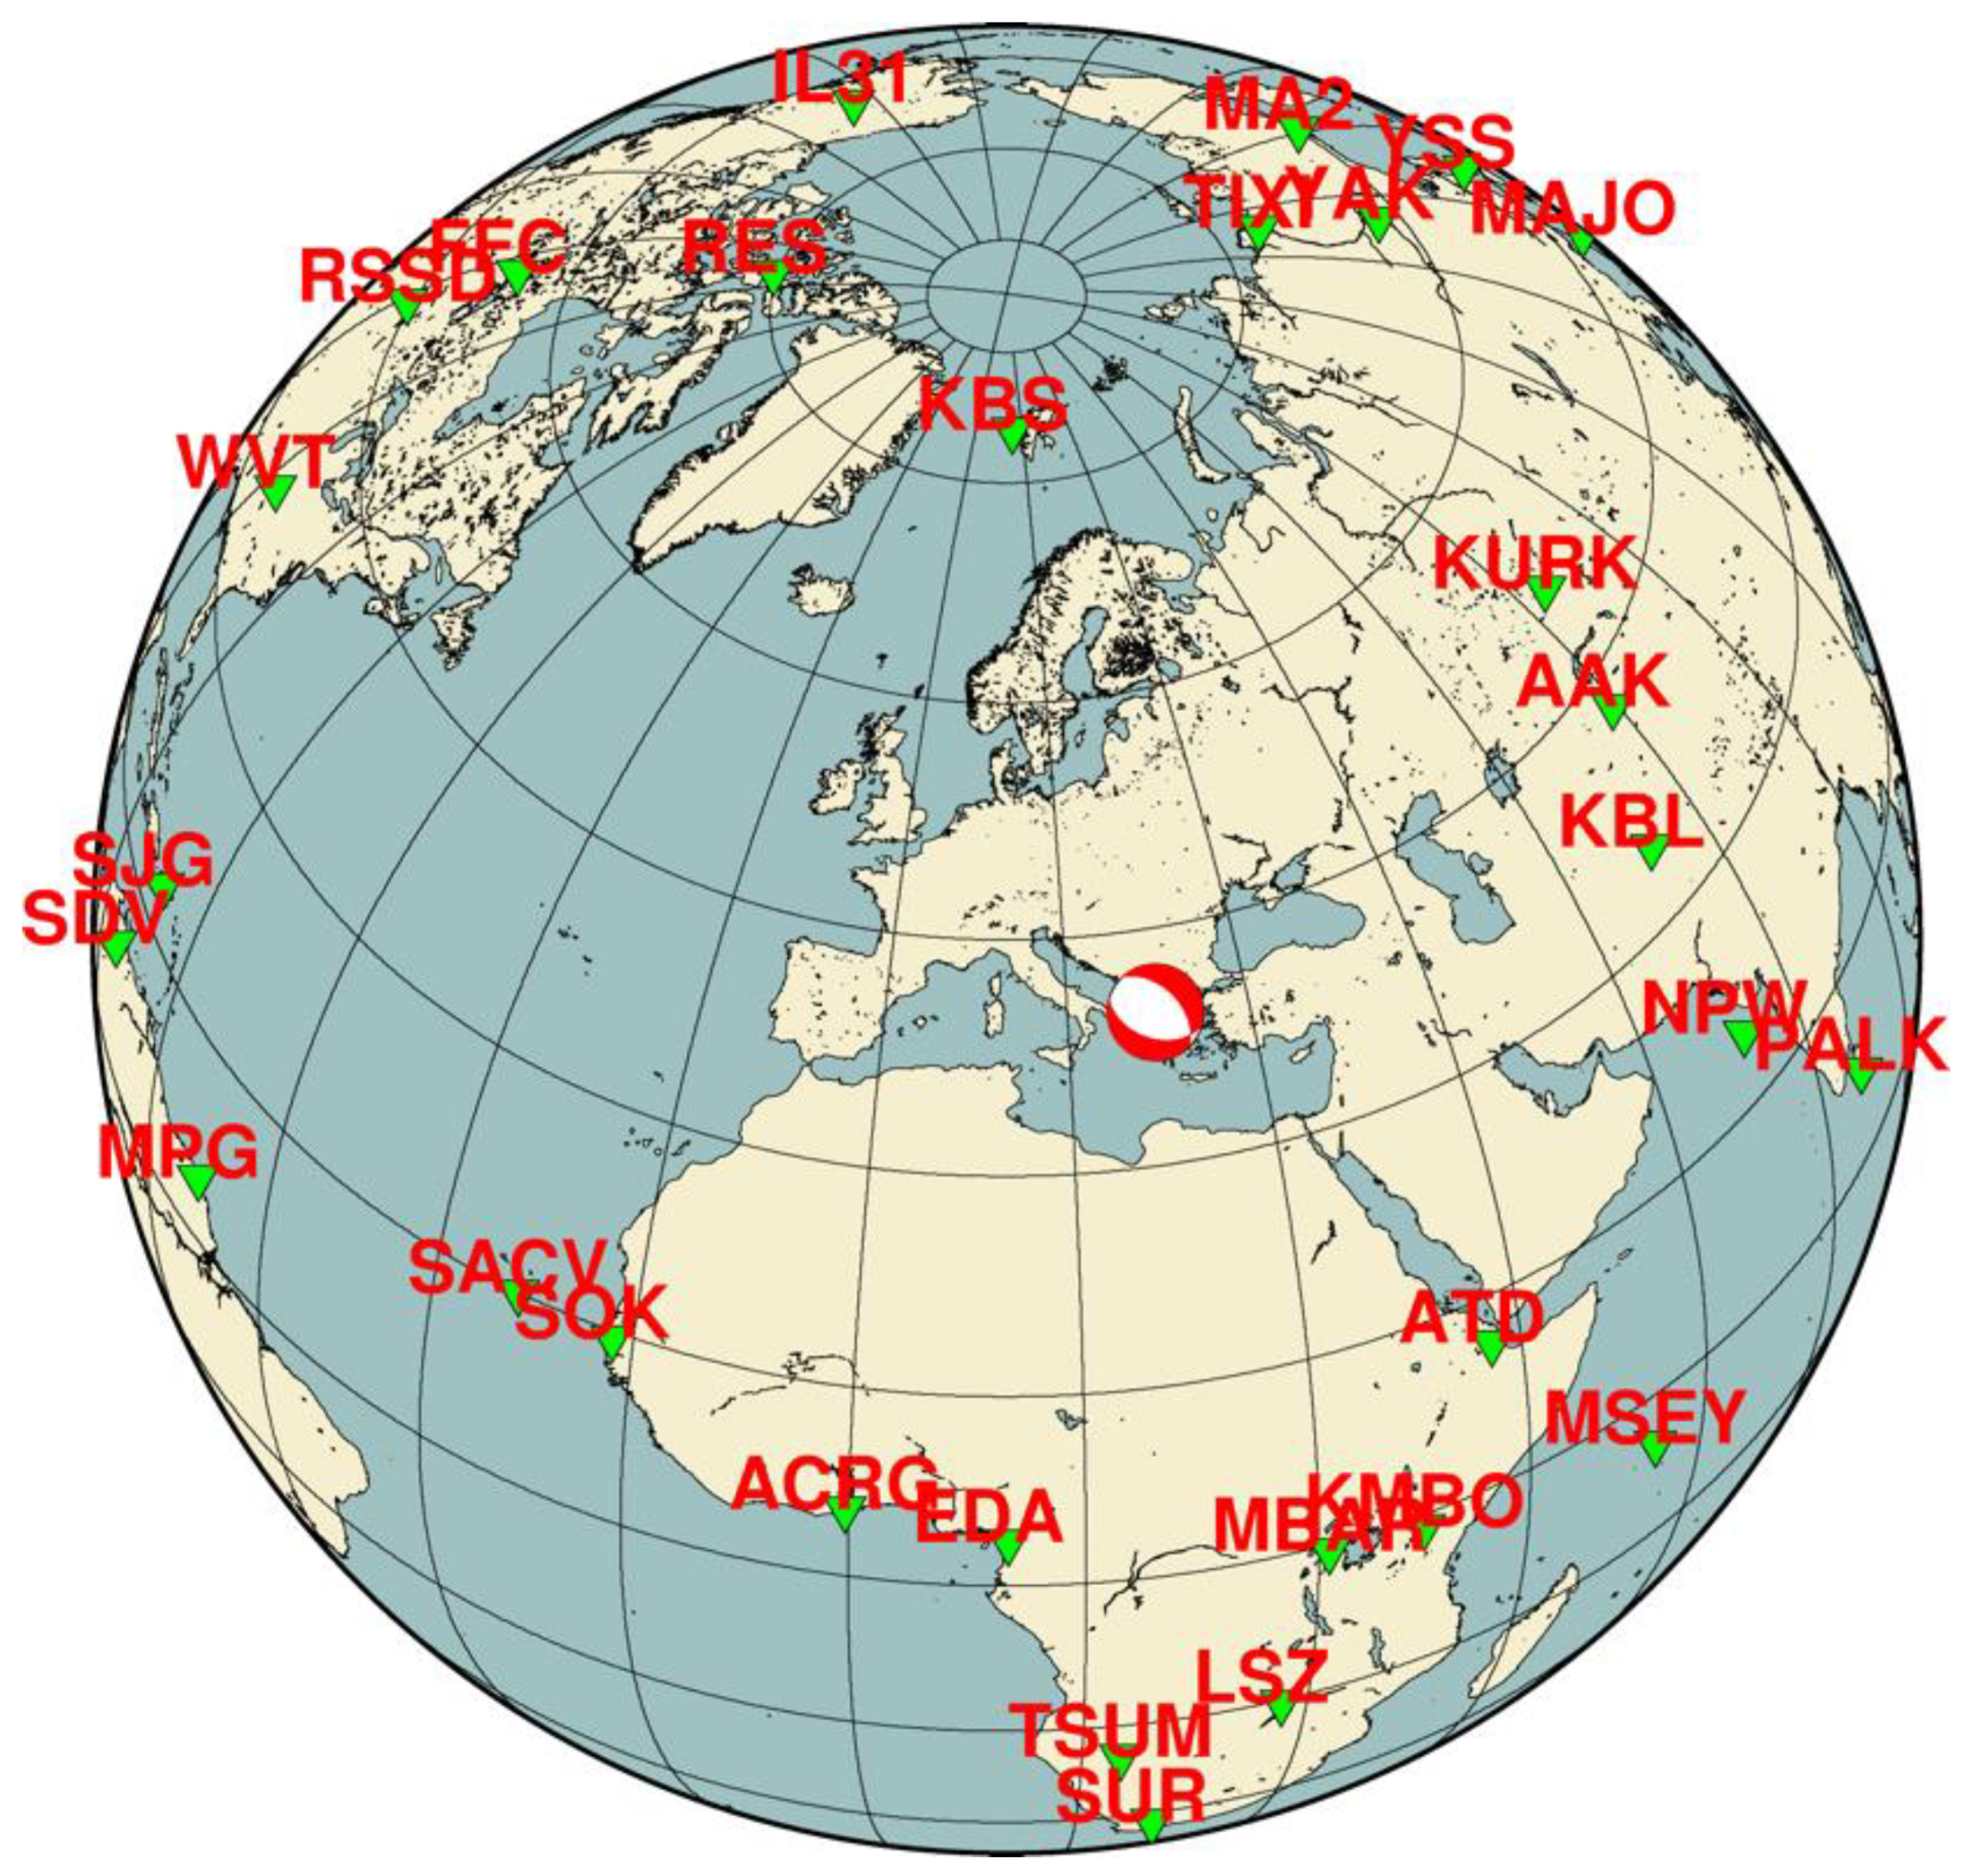
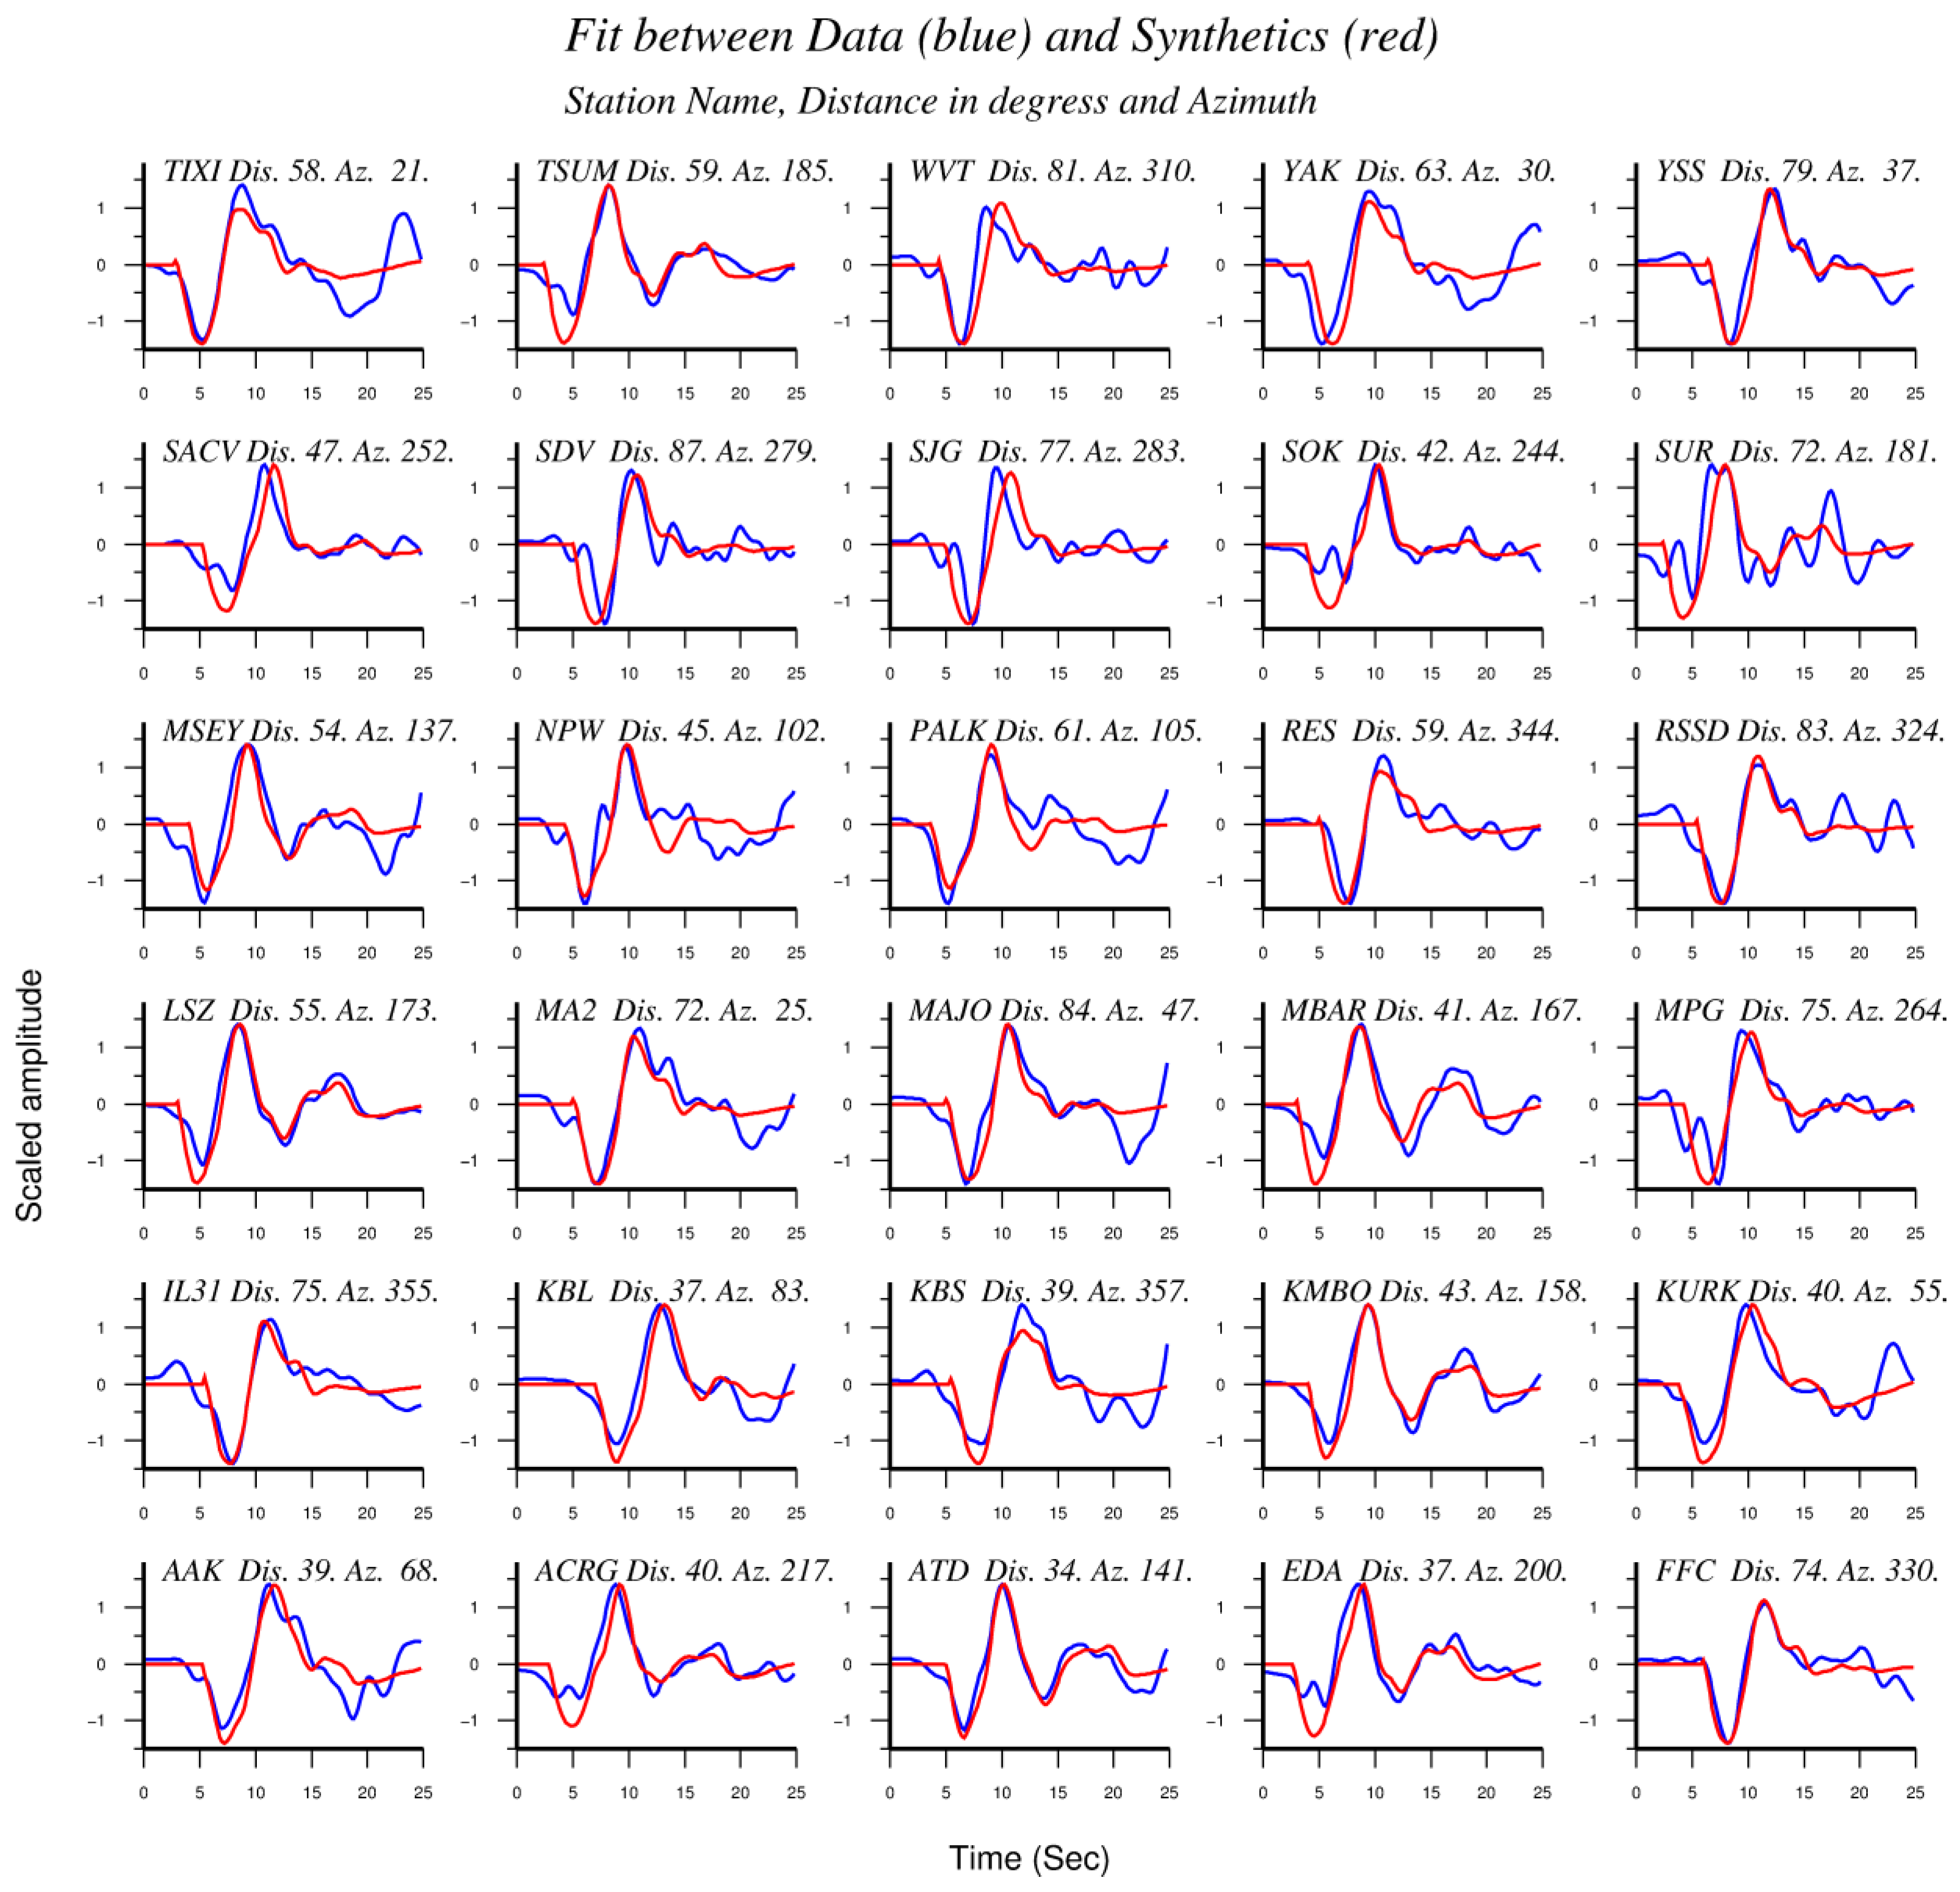
2.4. Rupture Process from the Inversion of Teleseismic P-Waveforms

The temporal and spatial evolution of the seismic slip upon the fault plane of the first shock of 3 March 2021 has been modeled applying a non-negative, least squares finite-fault inversion scheme based on a kinematic parameterization of the fault [24,25,26]. The data set used consists of P waveforms from teleseismic records at distances ranging from 30° to 90° with good azimuthal coverage (Figure 4) and a high signal to noise ratio. Waveform data were collected from GEOFON and other seismographic networks and downloaded through the IRIS (Incorporated Research Institutions for Seismology) Data Management Center (https://ds.iris.edu/ds/nodes/dmc/, last access 20 May 2021). The waveforms were cut nearly 2 s before the first P arrival and their duration used for inversion is 25 s. All waveforms were pre-processed to remove the mean offset and instrument response before the inversion. They were also band-pass filtered between 0.04 and 0.6 Hz using a Butterworth filter, re-sampled to 0.2 samples/s and finally integrated in time to obtain displacements. The calculated elementary synthetics were convolved with an attenuation operation under the assumption that t* = 1 s, where t* is the attenuation parameter of teleseismic body waves that represents the total body wave travel time divided by Q along the ray path for P waves. More details on the application of method for earthquakes in the Mediterranean region and elsewhere can be found in several papers e.g., [24,25,27].
This method could not be applied to the second strong earthquake of the 4 March since no adequate number of teleseismic P-wave records are available. As explained earlier, the reason is that in many stations the records have been covered by the records of a large earthquake that occurred in the New Zealand–Kermadec seismic zone. On the other hand, the earthquake of 12 March was not large enough to apply the method. Therefore, the investigation of the space and time seismic slip distribution from the inversion of teleseismic P-waveforms was restricted to the first shock of 3 March 2021.
The seismic fault dimensions were chosen large enough to permit the slip upon the fault in all possible directions if it is imposed by the waveform data. Namely, the rectangular fault created was of 32.5 km in length and of 16 km in depth measured from the surface. Taking a fault dip of ~45° the along dip width of the fault is about 25 km. The fault was discretized to 180 sub-faults (cells), 18 of them along strike and 10 along dip. Each point source response was computed with a code based on the generalized ray theory (e.g., [28]) and the use of the crustal velocity model with the specifications shown in Table 1. We adopted the relocated hypocenter obtained after our analysis, which was set at horizontal distance of ~19 km from the southeast edge of the fault. The exact way the synthetics were constructed followed the discussion by [29].
According to the fault-plane solutions available for the 3 March 2021 strong earthquake (Table S2) the fault plane dips towards either NE or SW. However, a fault dipping NE is consistent with the active tectonics of the area (Figure 1). After several inversion iterations the strike of 312° and dip of 45° were found to better fit the data for the NE-dipping fault. As we will see later, this is consistent with the source solution found after InSAR analysis too. Although fault-plane solutions indicate a rake of about −90°, which implies nearly pure normal fault, the rake vector was allowed to vary within the range from −60° to −150° during the inversion procedure. The procedure was performed repeatedly setting different values of rupture velocity, varying from 2.5 to 3.0 km/s. As the rupture velocity did not change during each one of the inversion iterations, six time windows were inserted with 0.3 s time lag. This option allowed a rise time of up to 1.8 s to be taken on each sub-fault, if required by the observations. Table 2 summarizes the most important parameters involved in the inversion process.

2.5. Rupture Process from InSAR

Copernicus is a European Commission initiative, which, in cooperation with the European Space Agency (ESA), developed the new family of Sentinel satellites. Sentinel-1 carries a sophisticated Synthetic Aperture Radar (SAR) instrument for capturing images of the Earth’s surface. The radar instrument uses C-band of microwave radiation and can operate in four modes, but the standard product is the Interferometric Wide Swath (IWS). Concerning the IWS polarimetry the wave has a single mode polarization (Vertical–Vertical or Horizontal–Horizontal). The default IWS mode over land has a swath width of 250 km and a ground resolution of 5 × 20 m. This mode images in three sub-swaths using the Terrain Observation with Progressive Scans SAR (TOPSAR), while the actual repeat period is 6 days. One of the main applications of the IWS mode scenes concerns the monitoring of land deformation.
Sentinel-1 SAR scenes assure a series of advantages: (a) continuous, all-weather day and night imagery, (b) rapid revisit period in the same imaging mode (6 days), (c) constant and regular acquisition to build up a large global archive, (d) wide area coverage, thanks to the 250 km image swath width, and (e) narrow orbital tube.
In order to detect and measure surface deformation caused by the earthquake activity during March 2021, Sentinel-1 IWS Single Look Complex (SLC) products (Table S3), covering the study area were downloaded from the Copernicus Open Access Hub (https://scihub.copernicus.eu/dhus/#/home, accessed on 14 April 2021). The sensing dates range from 25 February to 15 March 2021 for four ascending passes and from 24 February to 14 March 2021 for three descending passes. The digital elevation model (DEM) used is based on the NASA’s Shuttle Radar Topography Mission (SRTM) 3 arc-seconds DEM (https://srtm.csi.cgiar.org/10, accessed on 14 April 2021), which is of spatial resolution of approximately 90 m/pixel.
Spaceborne SAR interferometry produces 3D topographic data of the Earth’s surface directly from two SAR images [30]. An extension of the basic technique, called Differential SAR Interferometry (DInSAR), allows measurements of land deformation [31,32,33]. DInSAR exploits the phase difference between two or more coherent complex-valued images, i.e., SLC products, in order to derive path-length differences in the scale of the carrier wavelength and below. The capability of SAR interferometry to remotely monitor areas much wider than traditional surveying techniques, makes this technique particularly suitable for both regional and local scales [34].
In the case of Sentinel-1, DInSAR processing presents some peculiarities because of the special TOPSAR mode used by the SAR sensor to acquire the Interferometric Wide-Swath (IWS) data. The S1 IWS SLC product, used for interferometric applications, consists of three sub-swaths and each sub-swath image consists of a series of bursts. What we needed for our analysis was (i) the minimum of two SAR images taken before (master scene) and after (slave scene) the earthquake event and forming an interferometric pair, and (ii) a DEM of the area under study. Table S4 lists features of the master and slave scenes used in the present study.
The main processing steps followed are the following: co-registration of the two complex images, topography elimination using the DEM of the area, baseline estimation, generation of the interferogram, DEM/ellipsoid interferogram flattening, adaptive filtering/estimation and generation of the interferometric coherence, phase unwrapping, phase to displacement. These steps were performed with the use of the ENVI SARscape® software (L3Harris Geospatial, Boulder, CO, USA).
After applying the above main steps, DInSAR was only able to measure the path length difference in its Line of Sight (LoS) direction. Therefore, DInSAR-derived displacements represent the 1D deformation along the LoS direction. LoS represents the direction/distance between the SAR sensor and the target at hand. This is an essential and general limitation of SAR systems. By using ascending and descending LoS deformation maps we decomposed LoS displacements [35,36] into vertical (up–down) and horizontal (east–west) deformation maps. After obtaining the shapefile of sampled points from the raster DInSAR map, the co-seismic signal was modeled through Non-Linear and Linear inversions [37], thus allowing to infer the geometry, kinematics and slip distribution in the seismic fault.
The displacement model and the determination of a single fault with distributed slip are produced by following several steps. First an image sampling is required, using the LoS displacement, i.e., the observed displacement, to set a number of points to model. The image sampling was carried out using the equally spaced points approach. To produce the surface displacement, which is induced by a rectangular fault plane in a homogeneous and elastic half-space, a well-known elastic dislocation approach [38] was followed through Non-Linear Inversion. The best-fit source is determined by a set of fault parameters (dip, rake, strike, length), which better predict the observed displacement data. After finding the best-fit solution, inversion is carried out to determine the slip distribution over the fault plane constrained via Non-Linear inversion.
The above procedure was applied sequentially for the three strong earthquakes under investigation.

3. Results

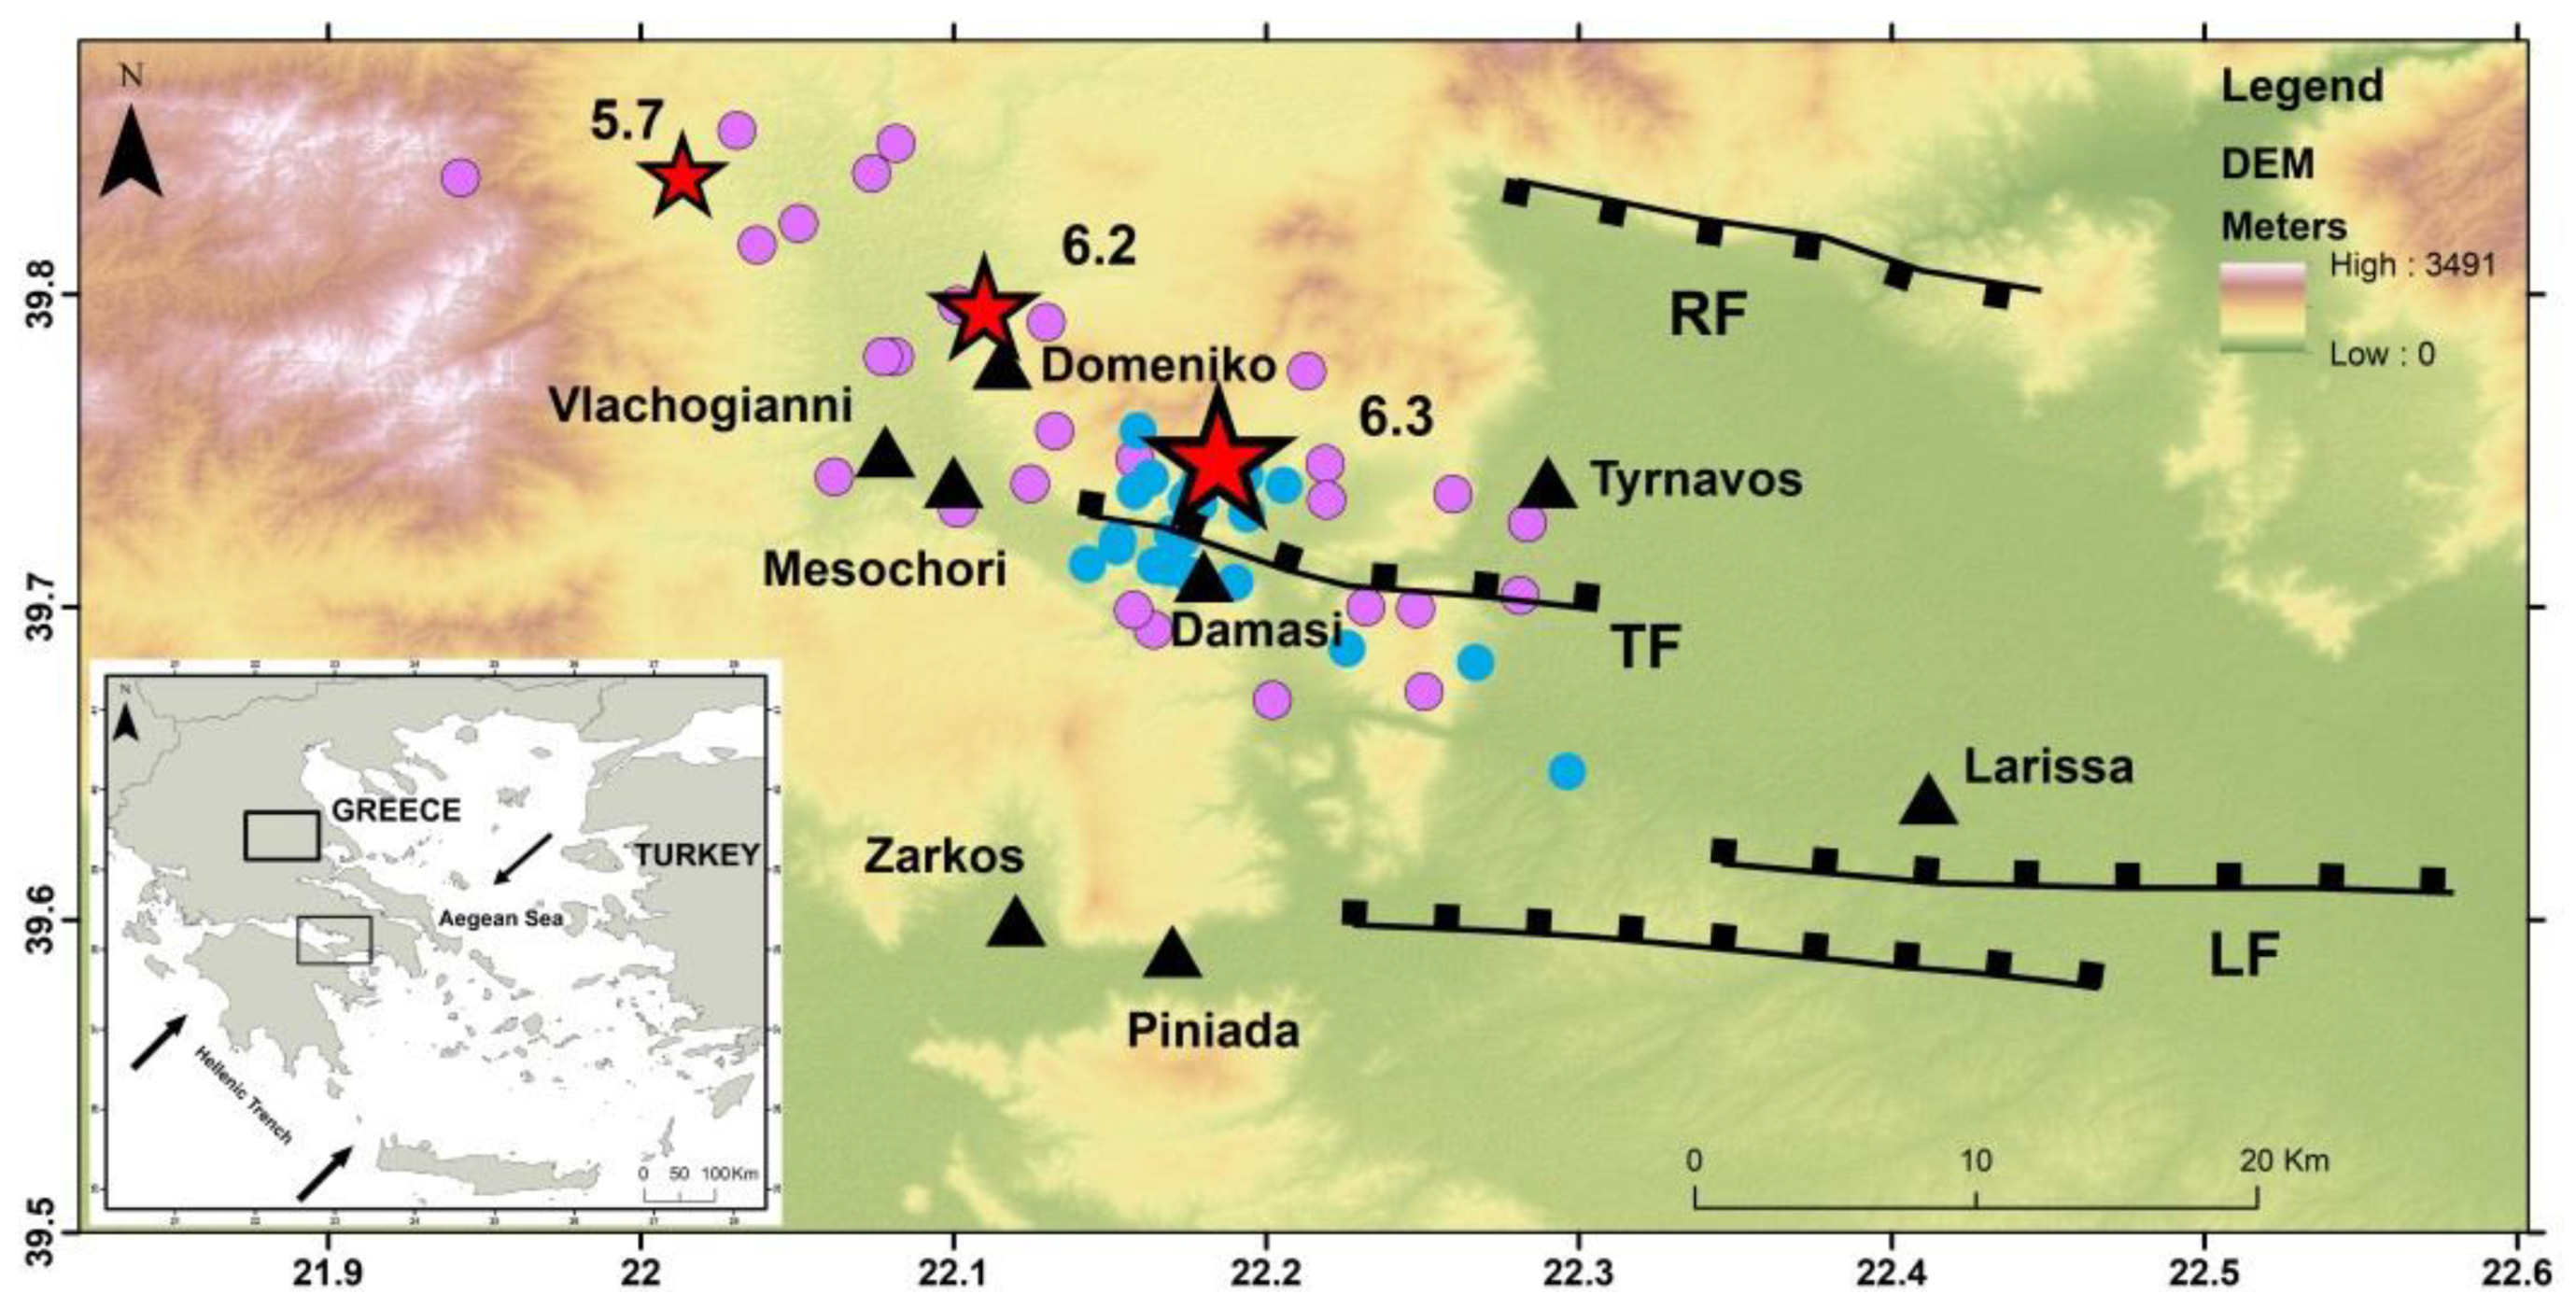
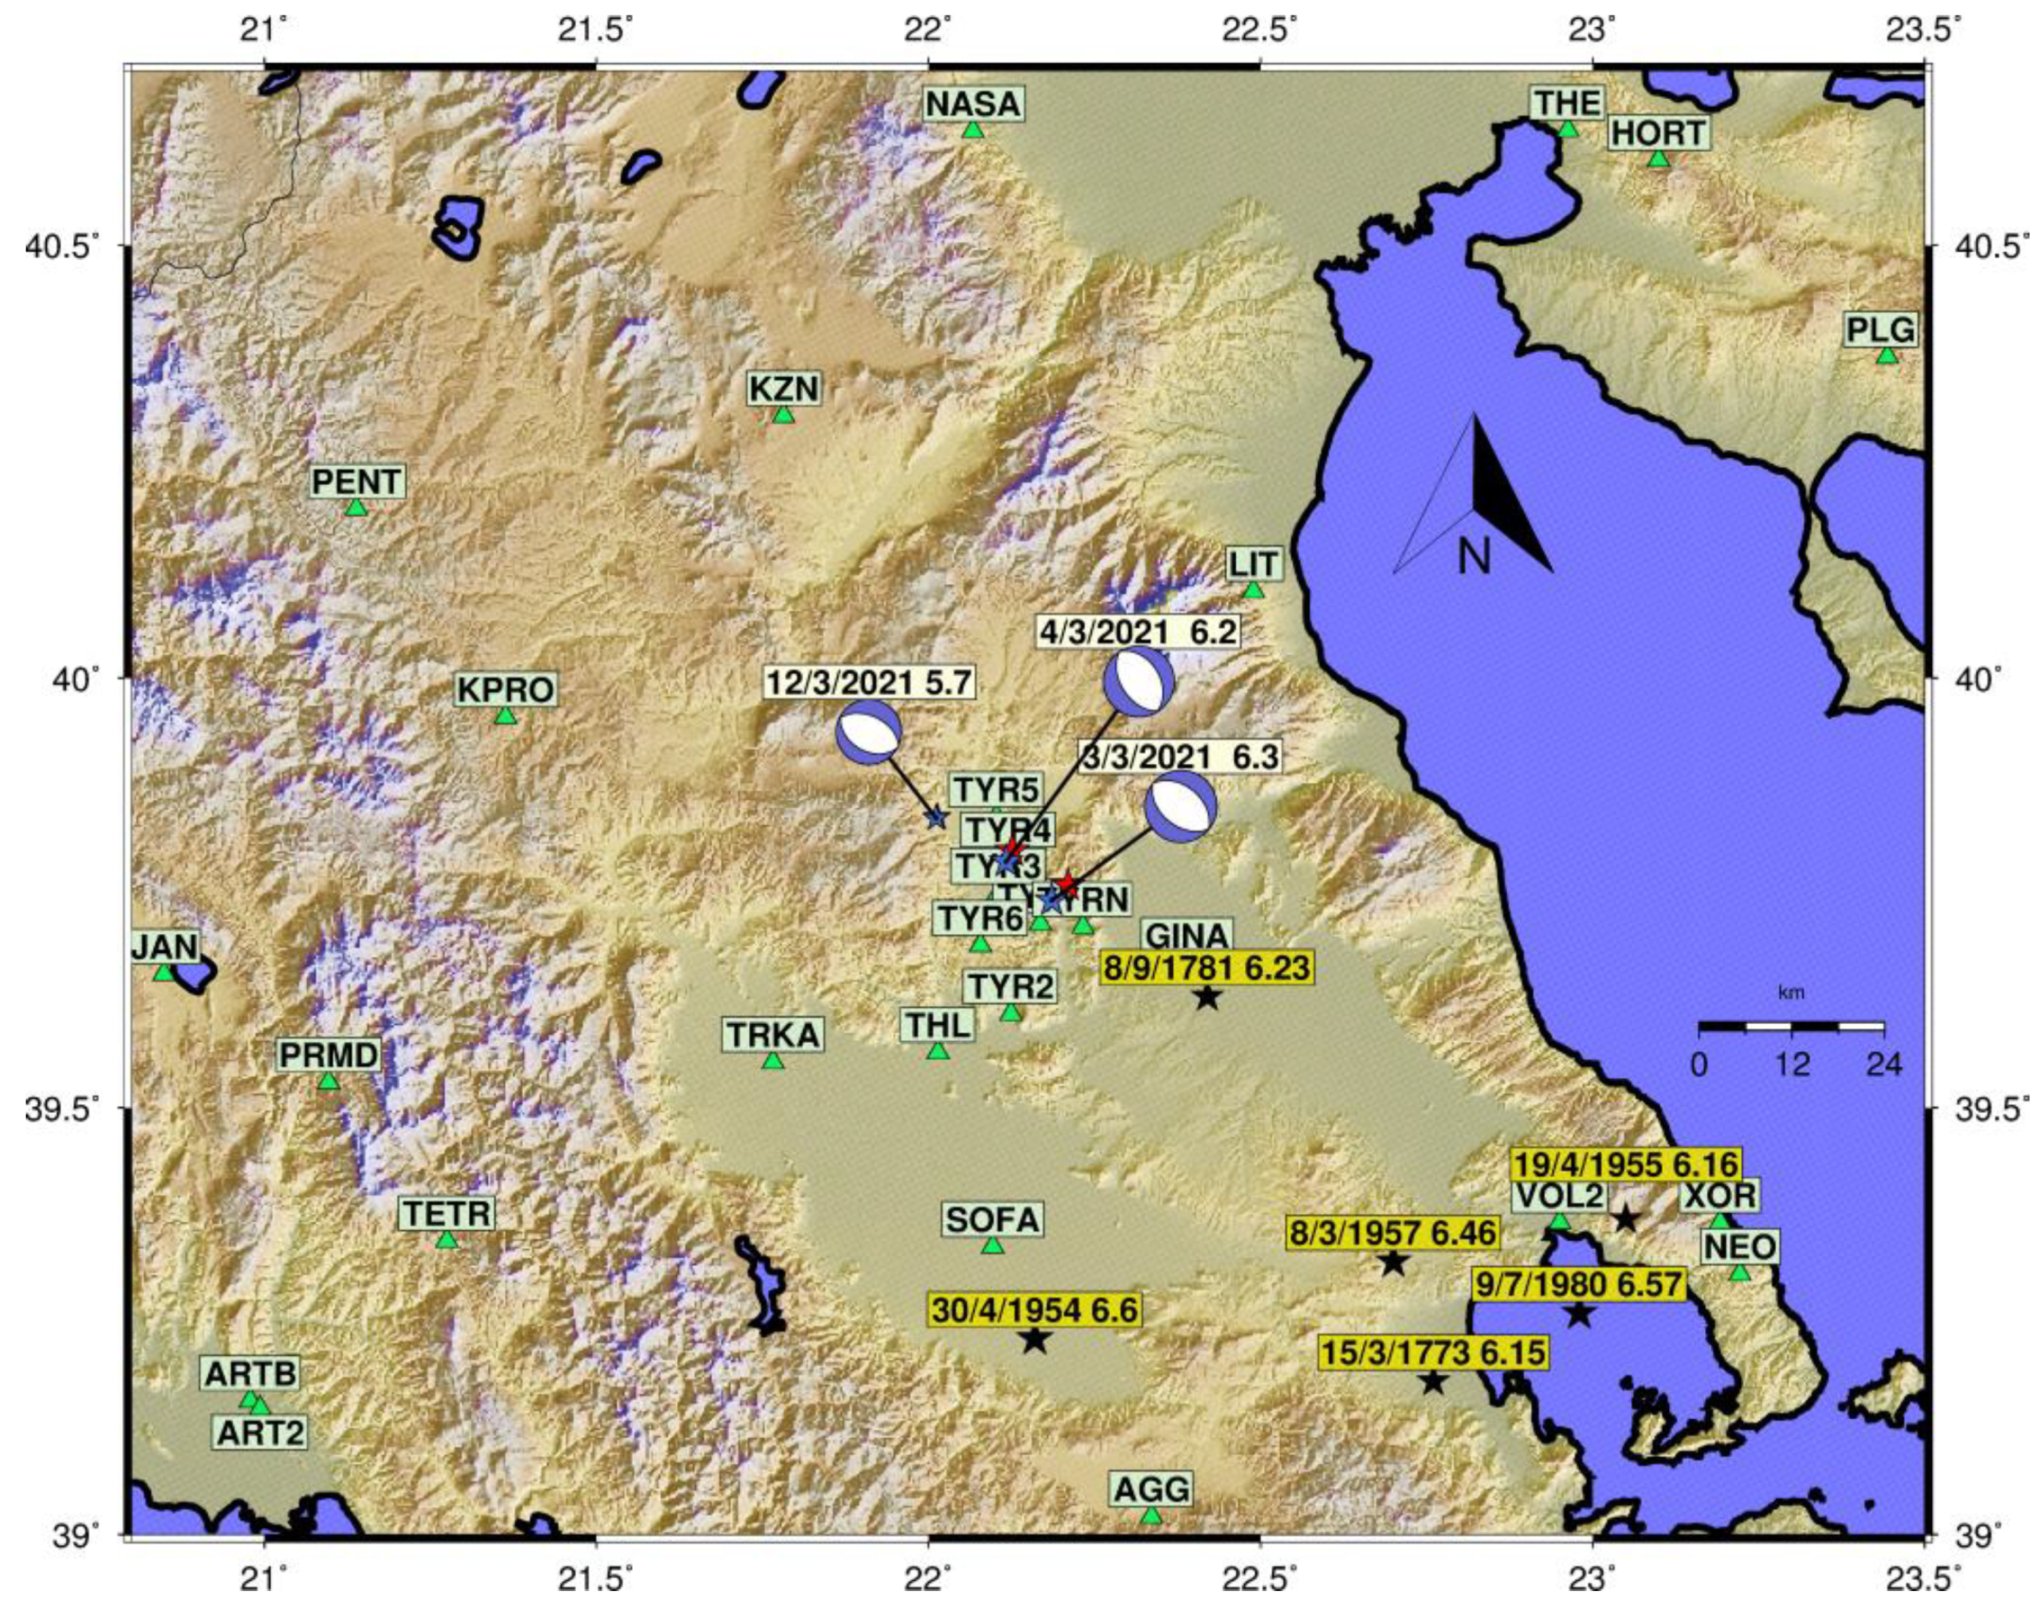
3.1. Hypocentral Relocation

The relocated hypocenters of the three strongest earthquakes of the seismic sequence are listed in Table 3 and displayed in Figure 2. As regards the first and second earthquakes the new epicenters are shifted towards SW about 2.5 and 1.5 km away from the respective NOA’s epicenters. For the third earthquake, however, the relocated and the NOA’s epicenters are very close, which is due to the fact that NOA’s routine determinations are improved thanks to the installation and operation of six portable seismograph stations by the Geophysical Laboratory, Aristotelian University of Thessaloniki, before the occurrence of the third earthquake.
The RMS found for the three relocated hypocenters are less than 0.22, while in NOA’s solutions it is equal to 0.67, 0.47 and 0.41 for the 1st, 2nd and 3rd strong earthquakes, respectively. It is noteworthy that according to the calculated focal depths, h, the second and third earthquakes were found quite shallow, with h = 4.0 km and h = 4.5 km, respectively, as compared to the 3 March first shock (h = 10.5 km). The respective focal depths determined by NOA are 8.5 km, for the first shock, and 4.8 and 7.0 km for the next two earthquakes. However, the centroid depths found from the inversion of teleseisic records (Table 2) and of InSAR data (Section 3.3) as well as from the moment tensor solutions produced by the various centers (Table S1) are in general larger than the focal depths particularly of the second and third earthquakes.

3.2. Earthquake Focal Mechanisms

From the results summarized in Table 4, it is revealed that the solutions produced for each one of the three earthquakes are consistent each other since the average strikes, dip and rake have small standard deviations. Comparing the three earthquakes, we found that they are characterized by a strike which is about NW–SE or WNW–ESE. On the other hand, both nodal planes (NPs) of the first two earthquakes have nearly the same average dip, which ranges between 44° and 49° but it is either 39° or 54° for the third earthquake. The values of the average rake imply that the faulting style of the three earthquakes is nearly pure normal with a small strike-slip component. However, the strike-slip component is relatively larger in the third earthquake.

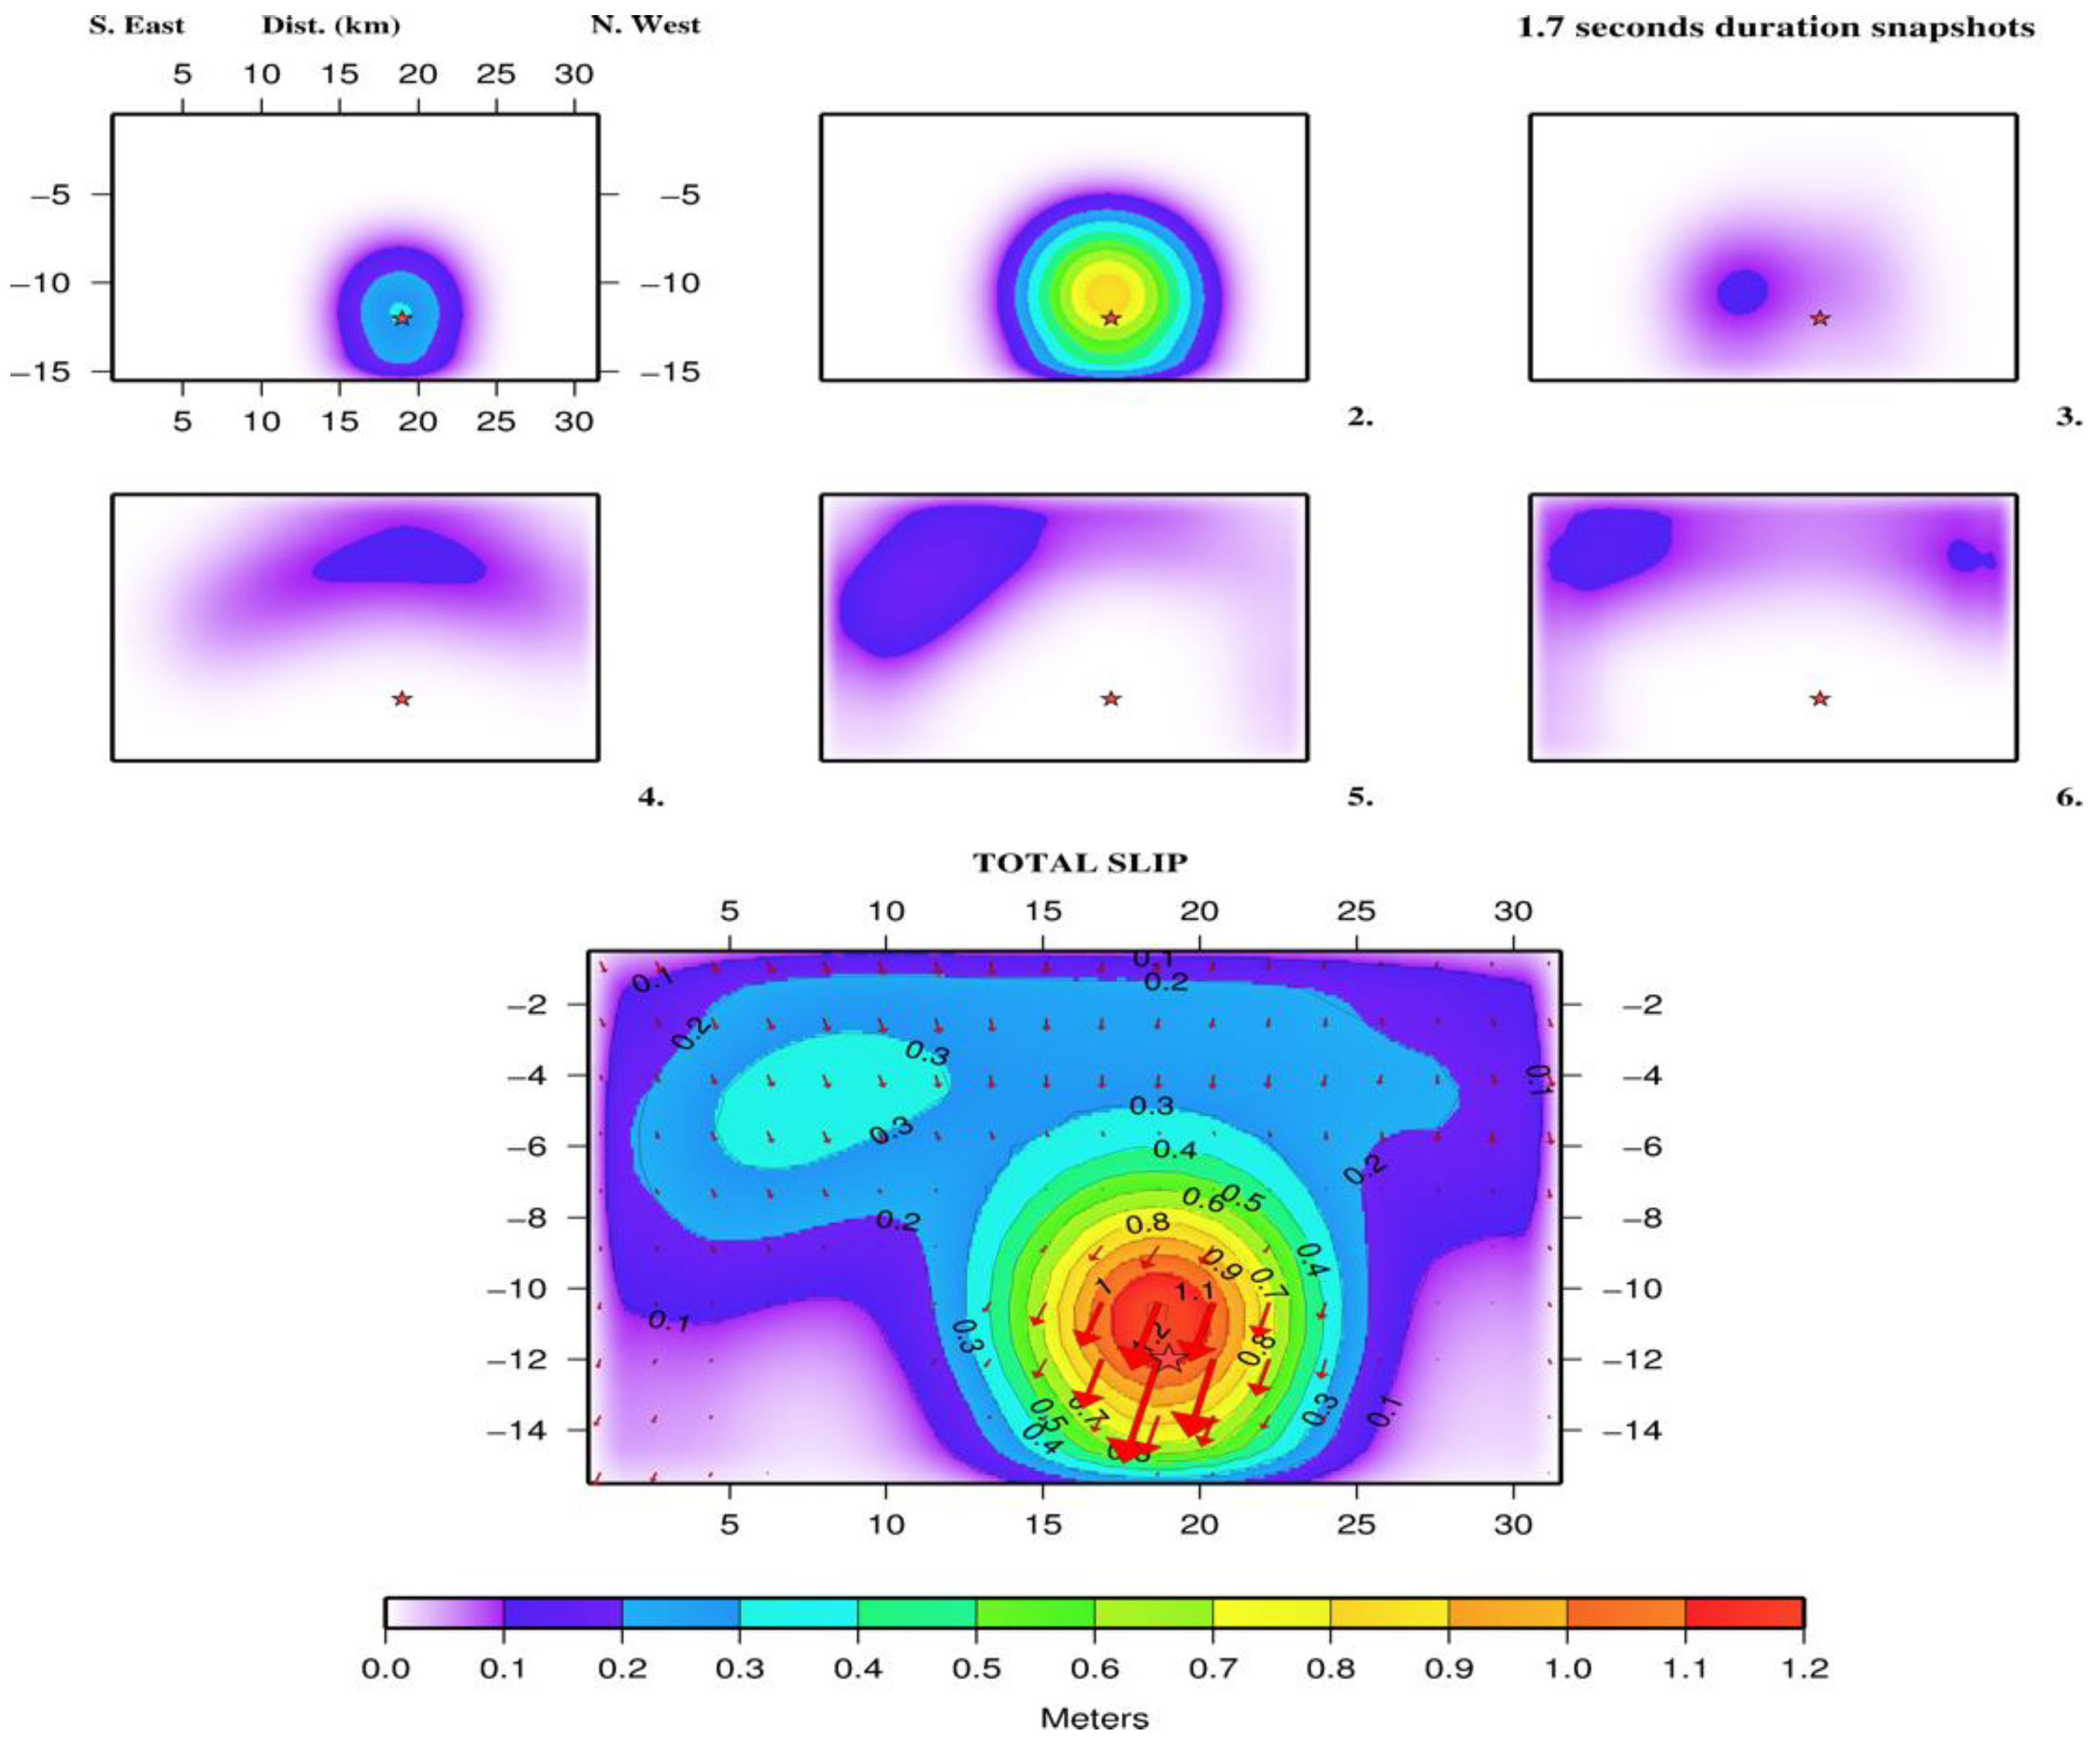
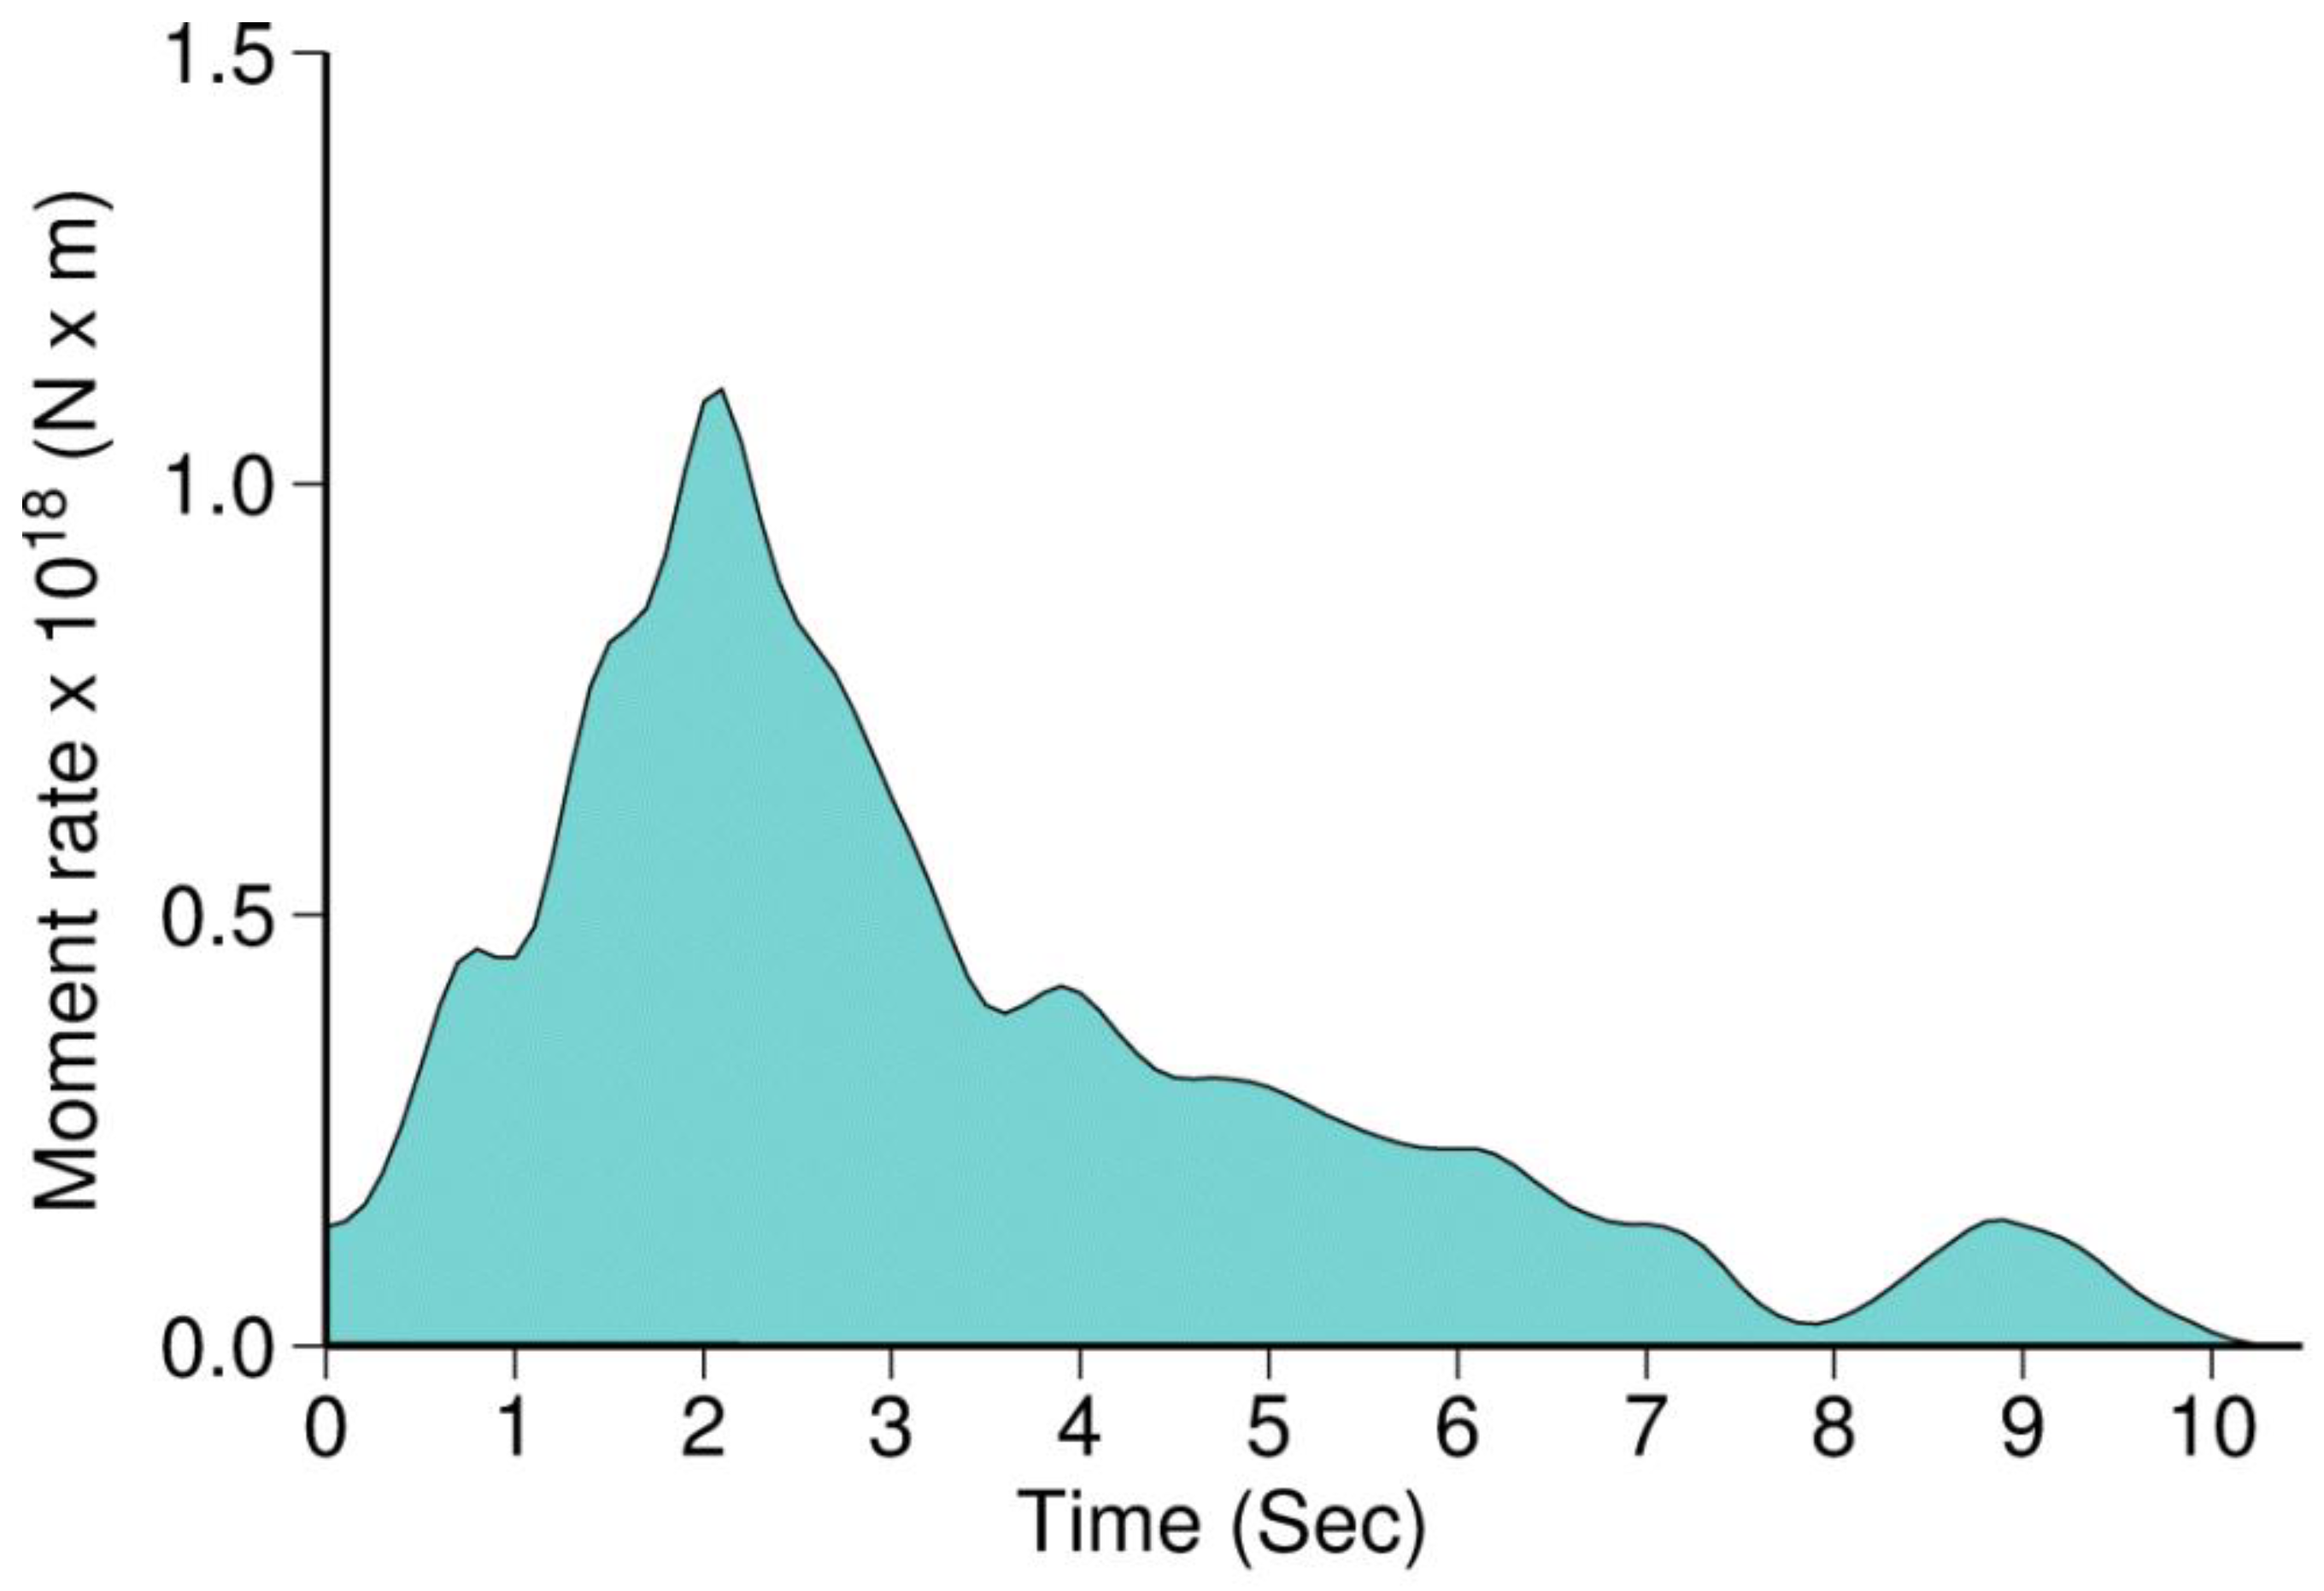
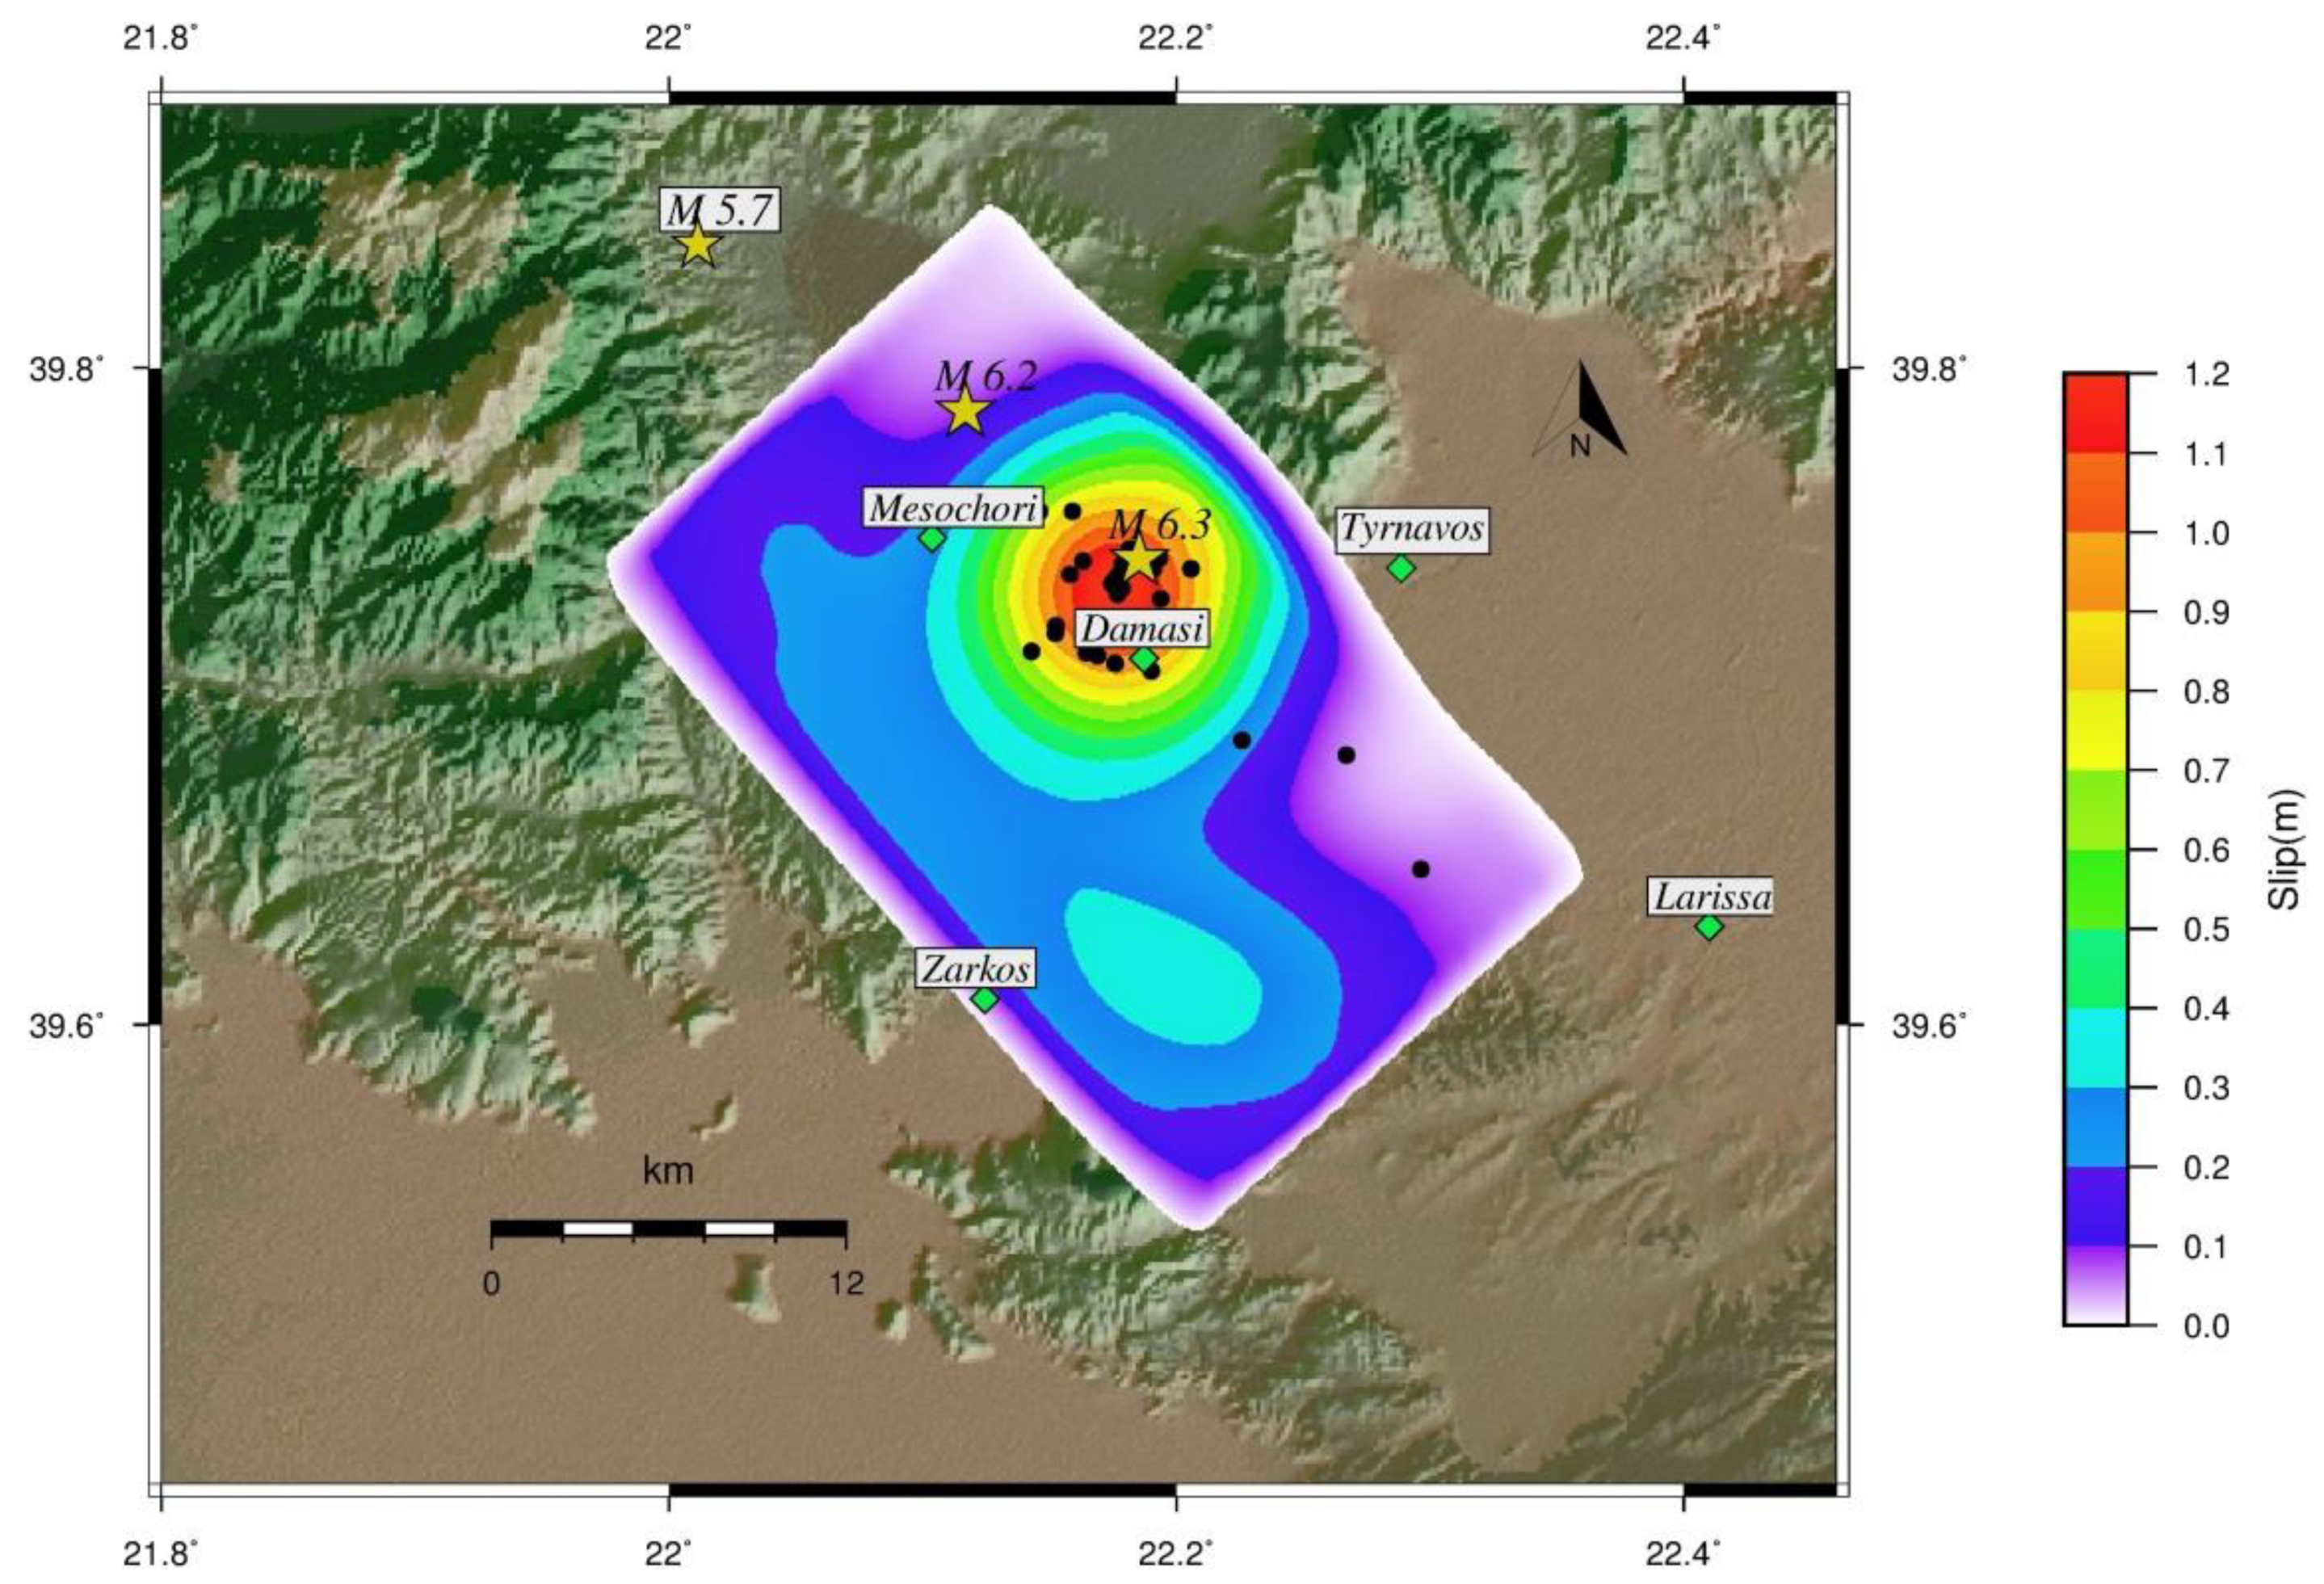
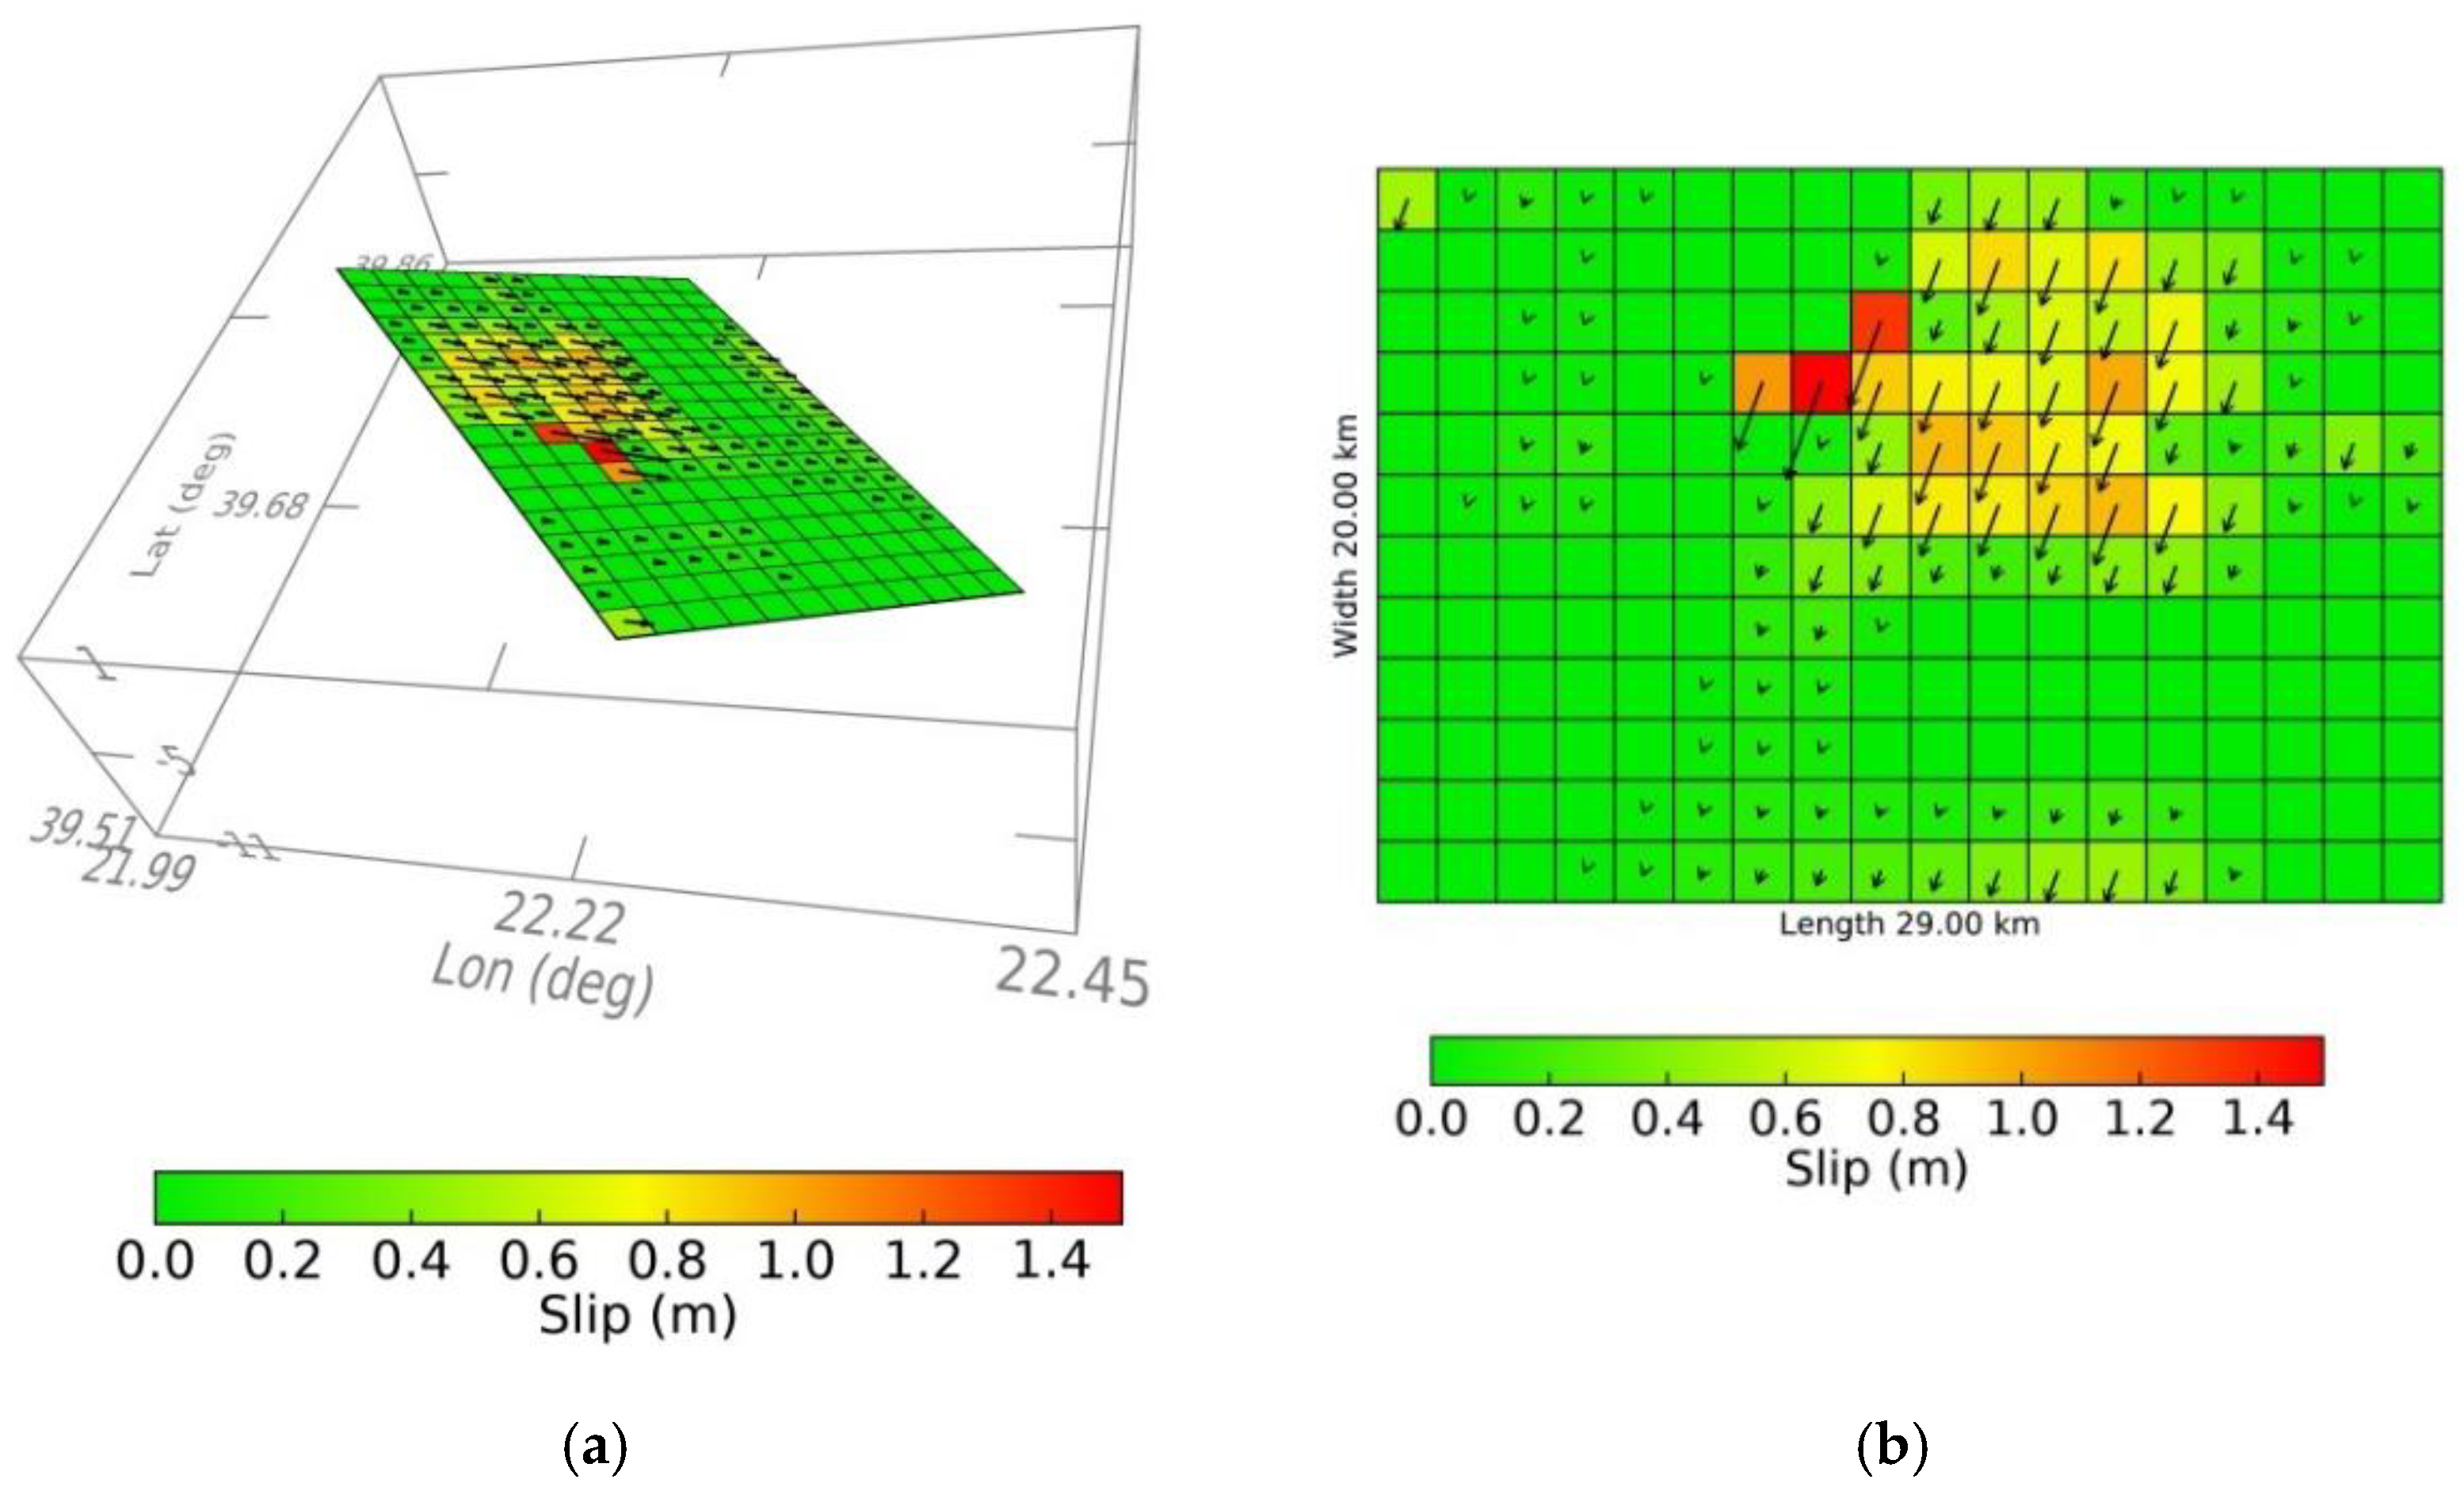
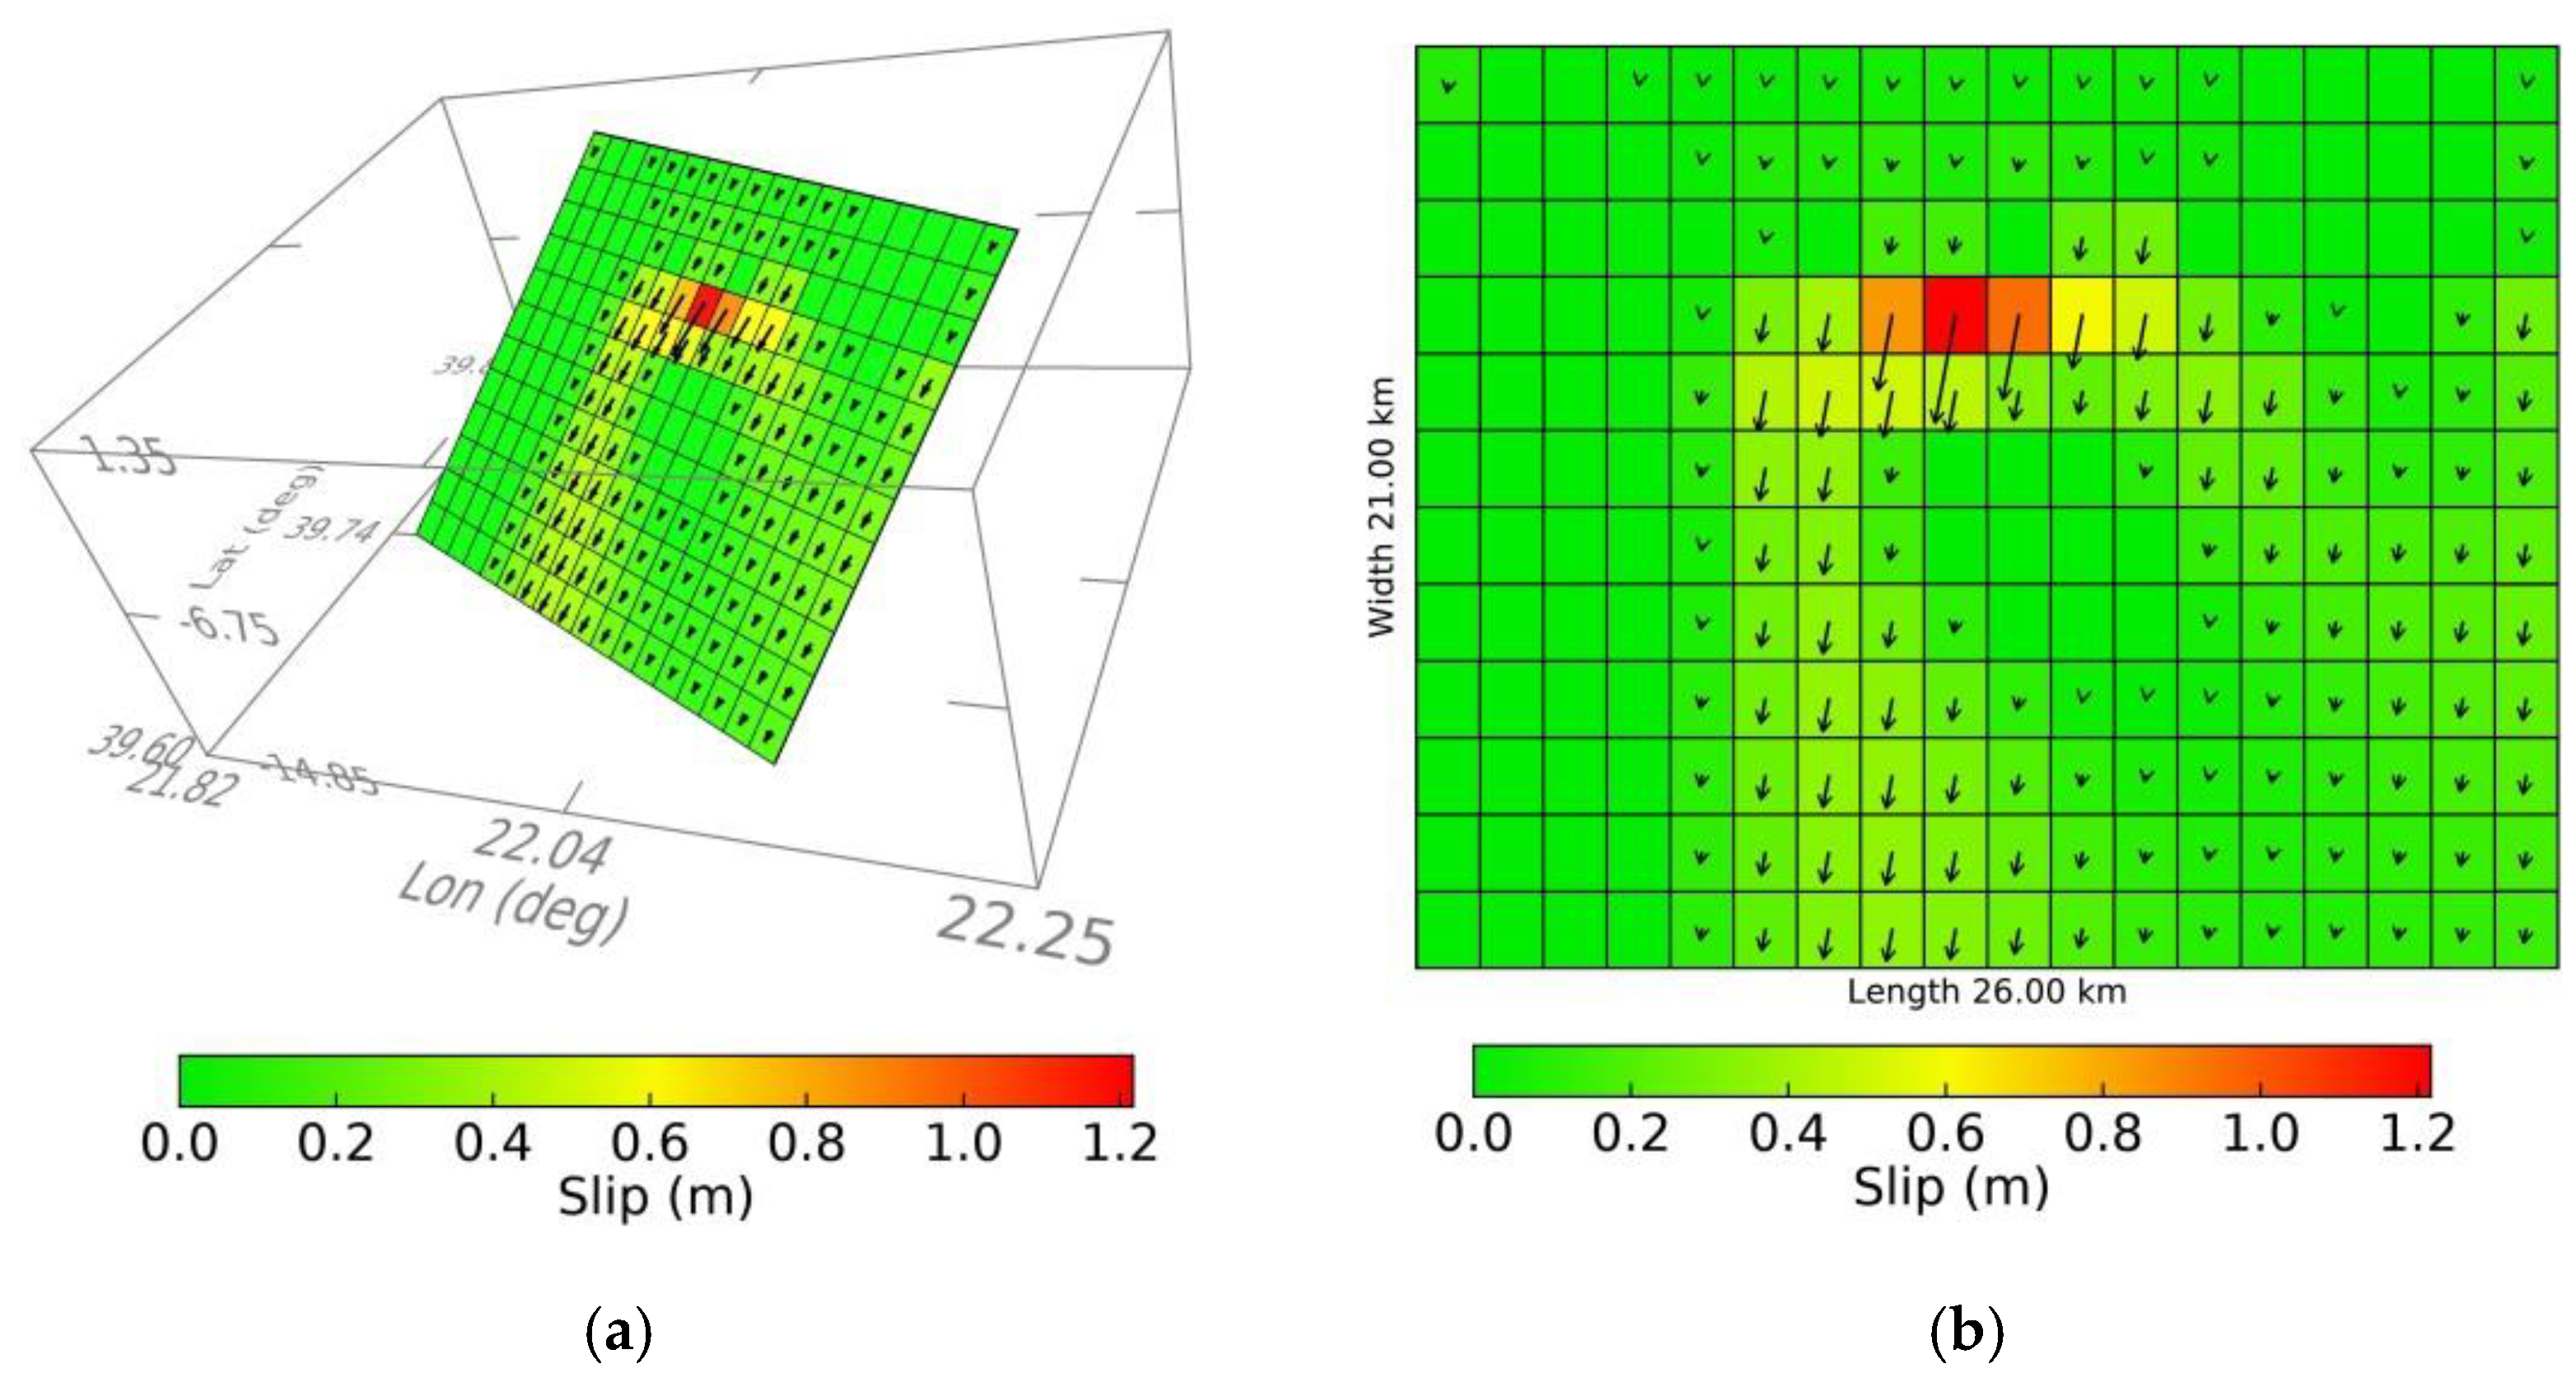
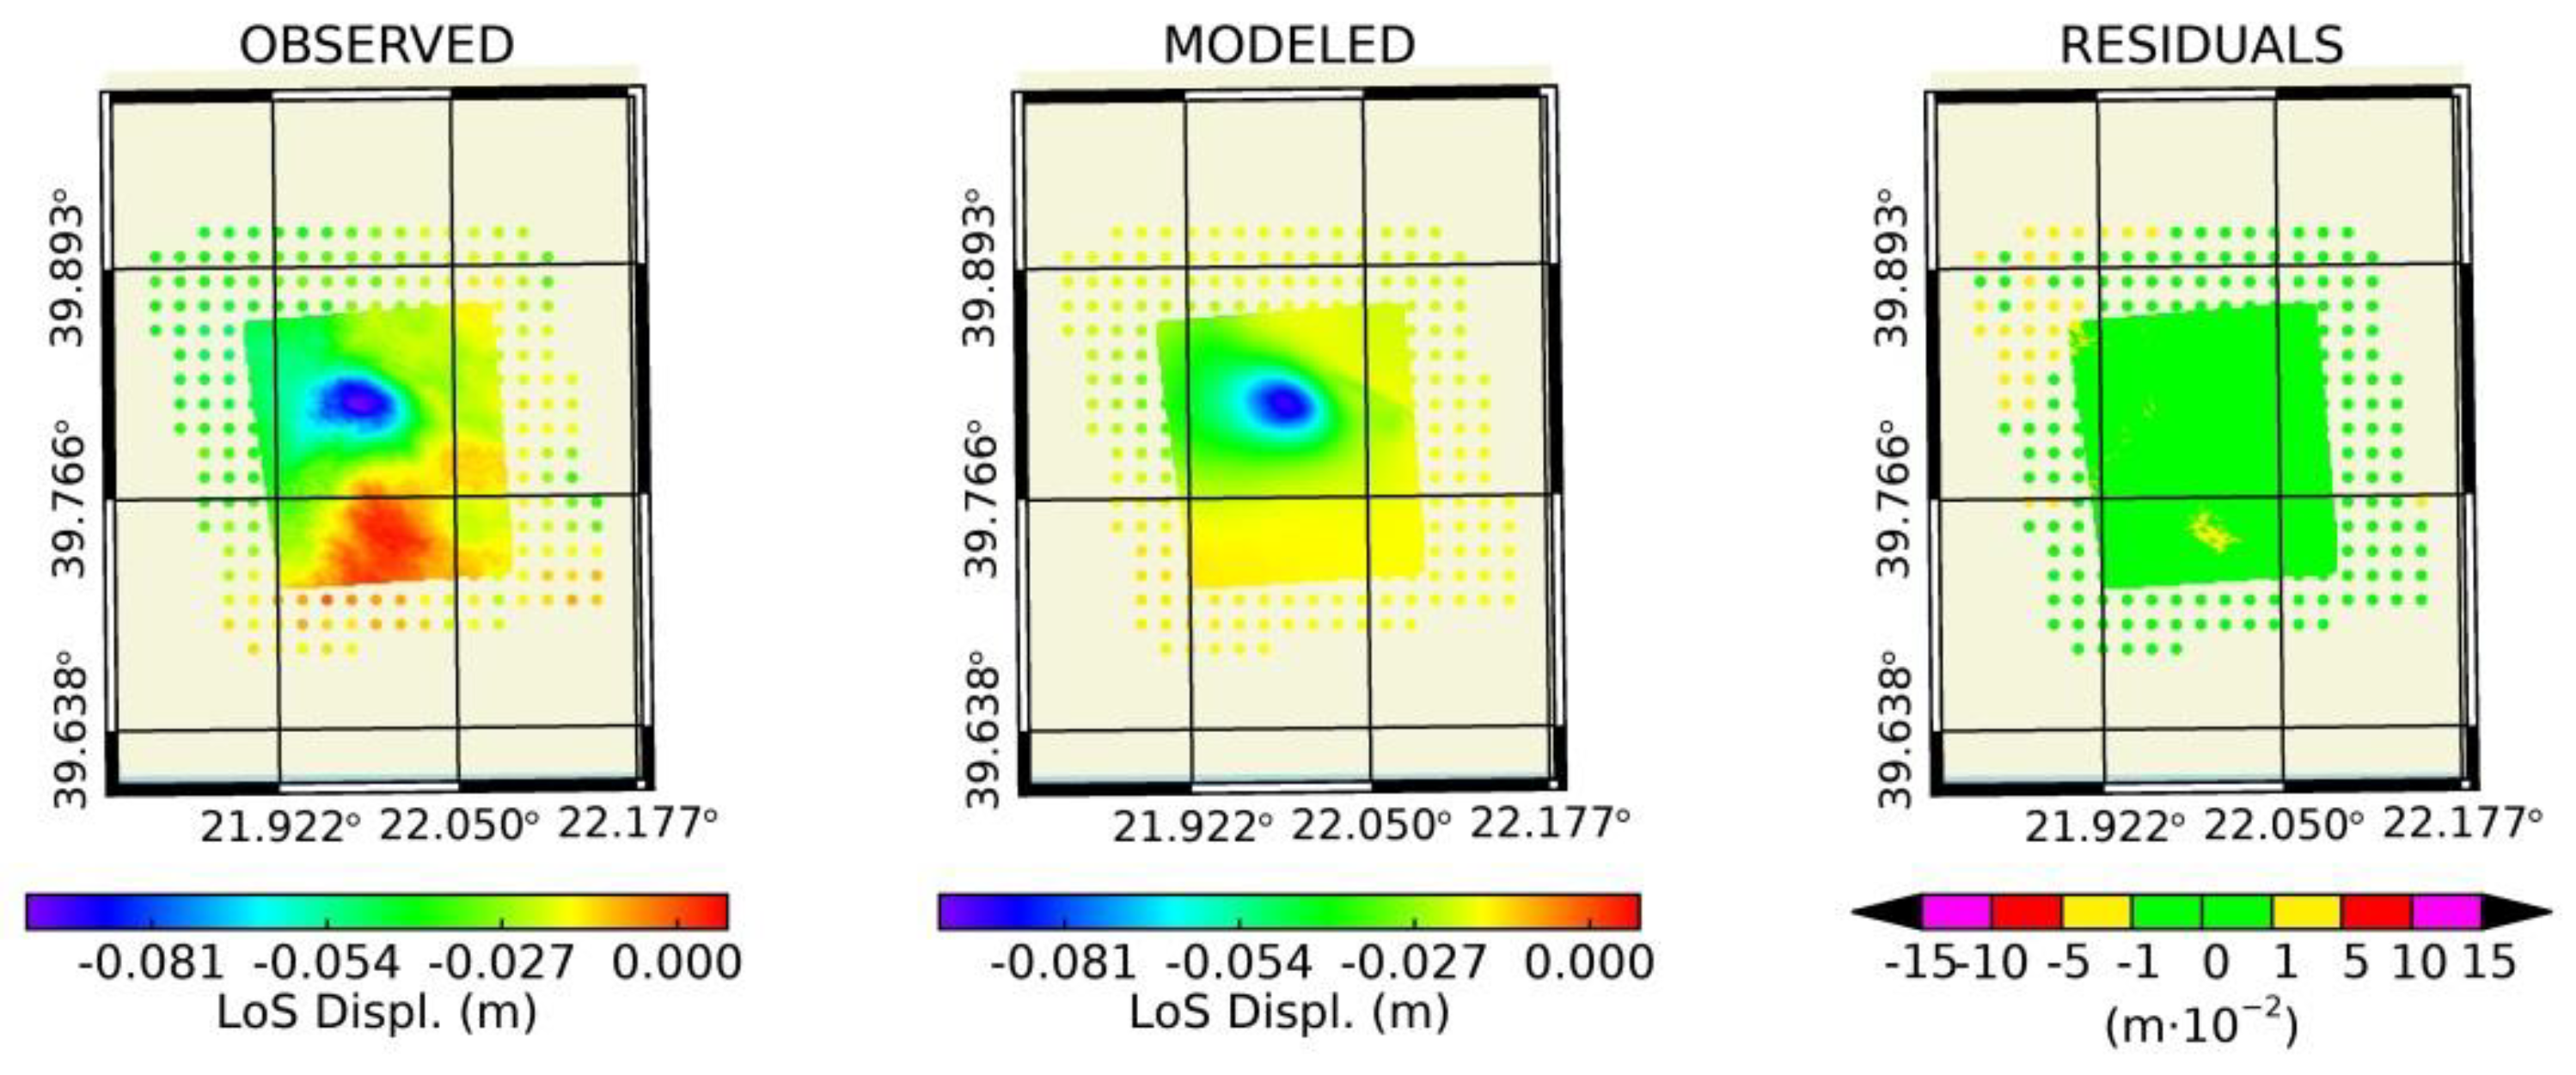
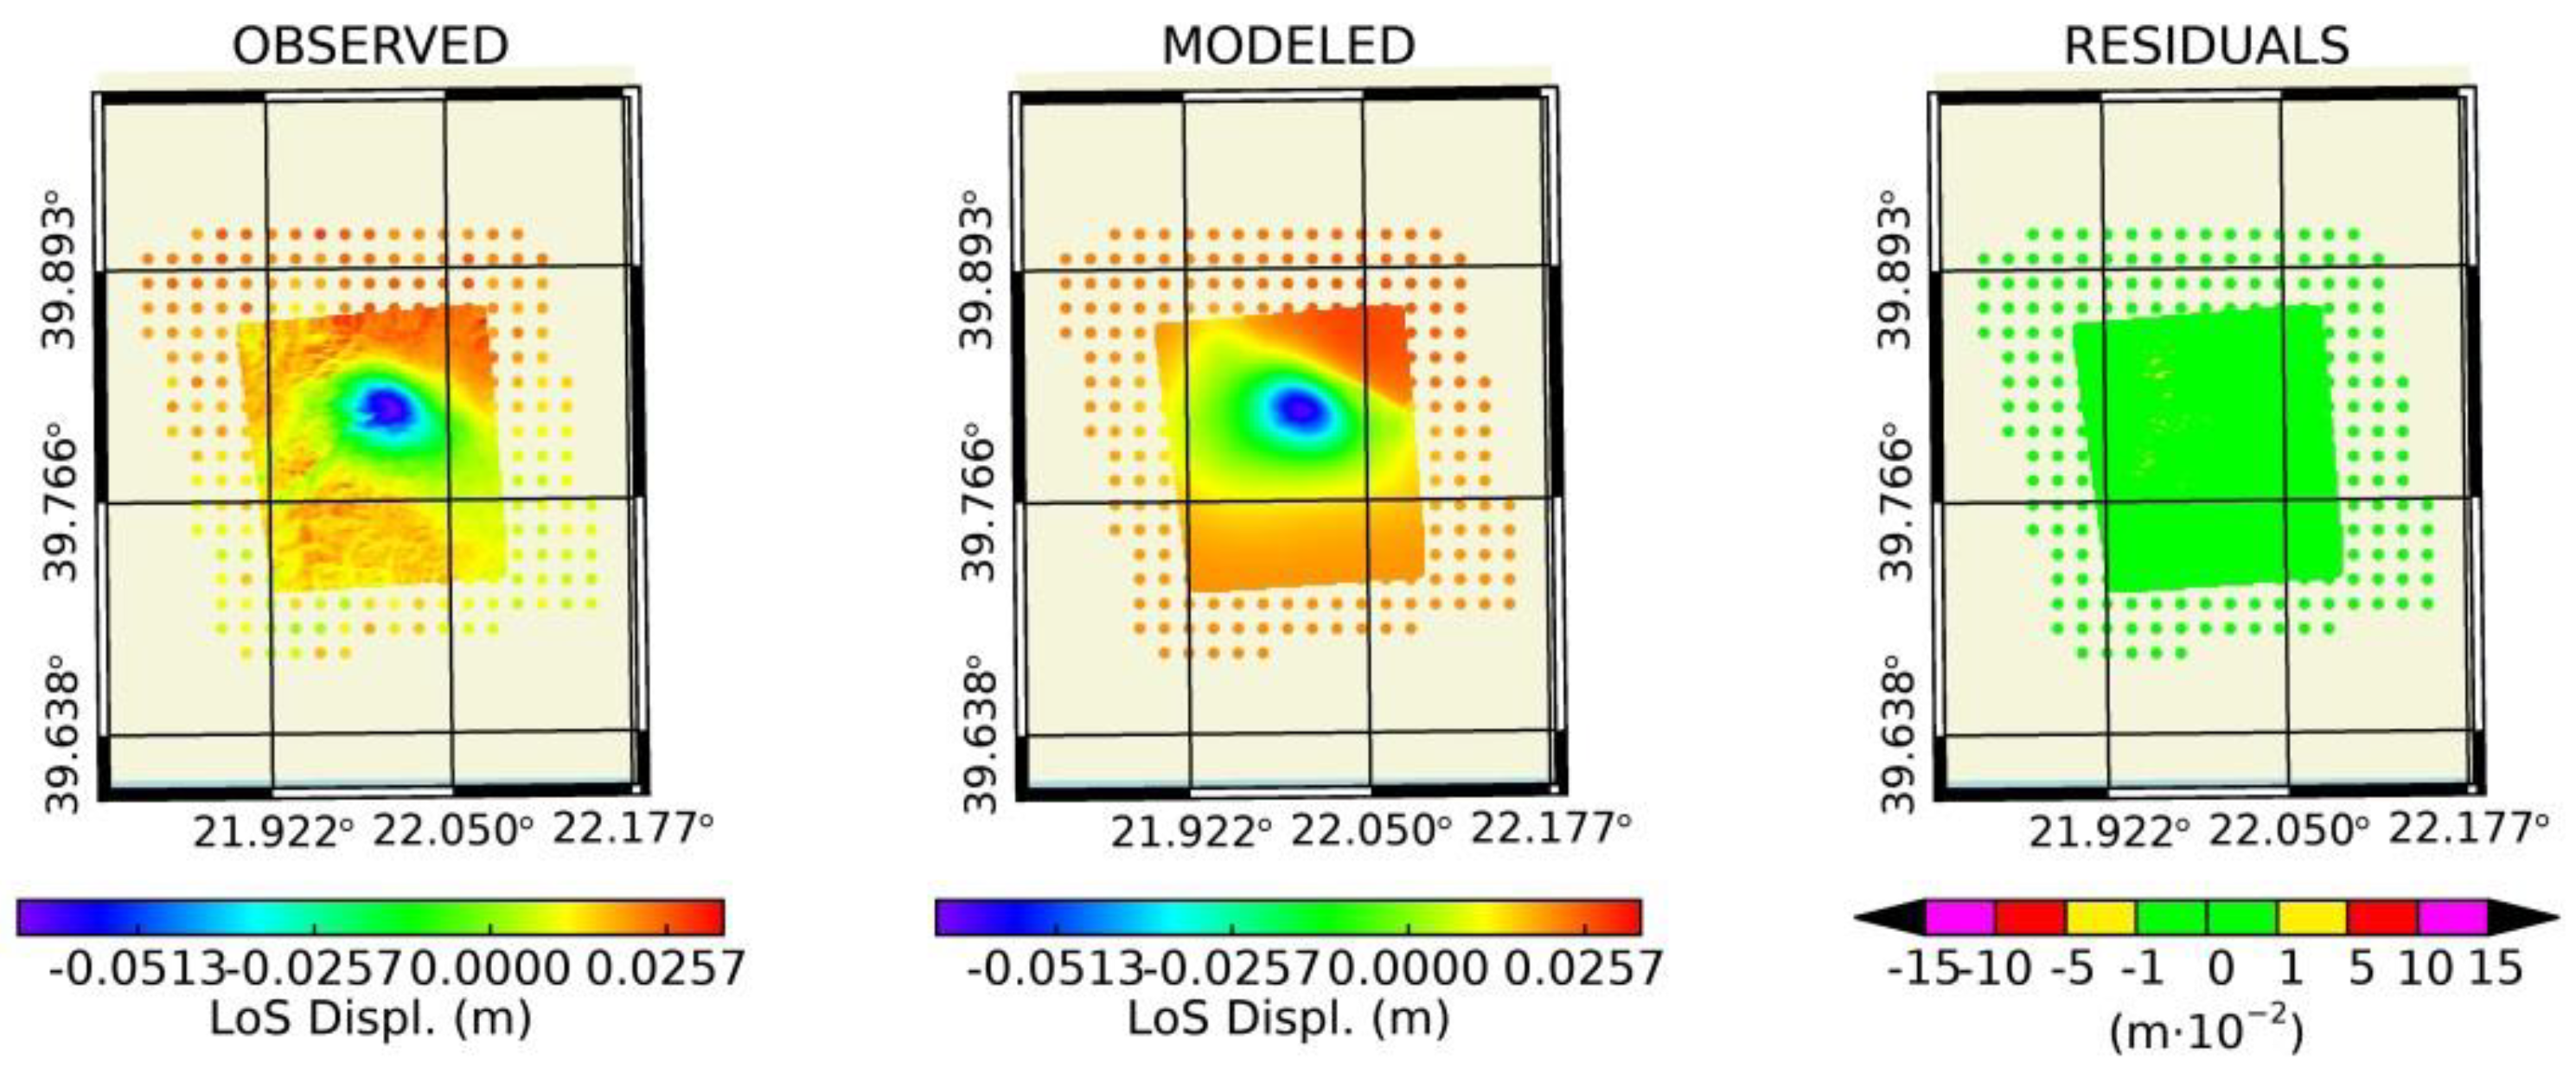
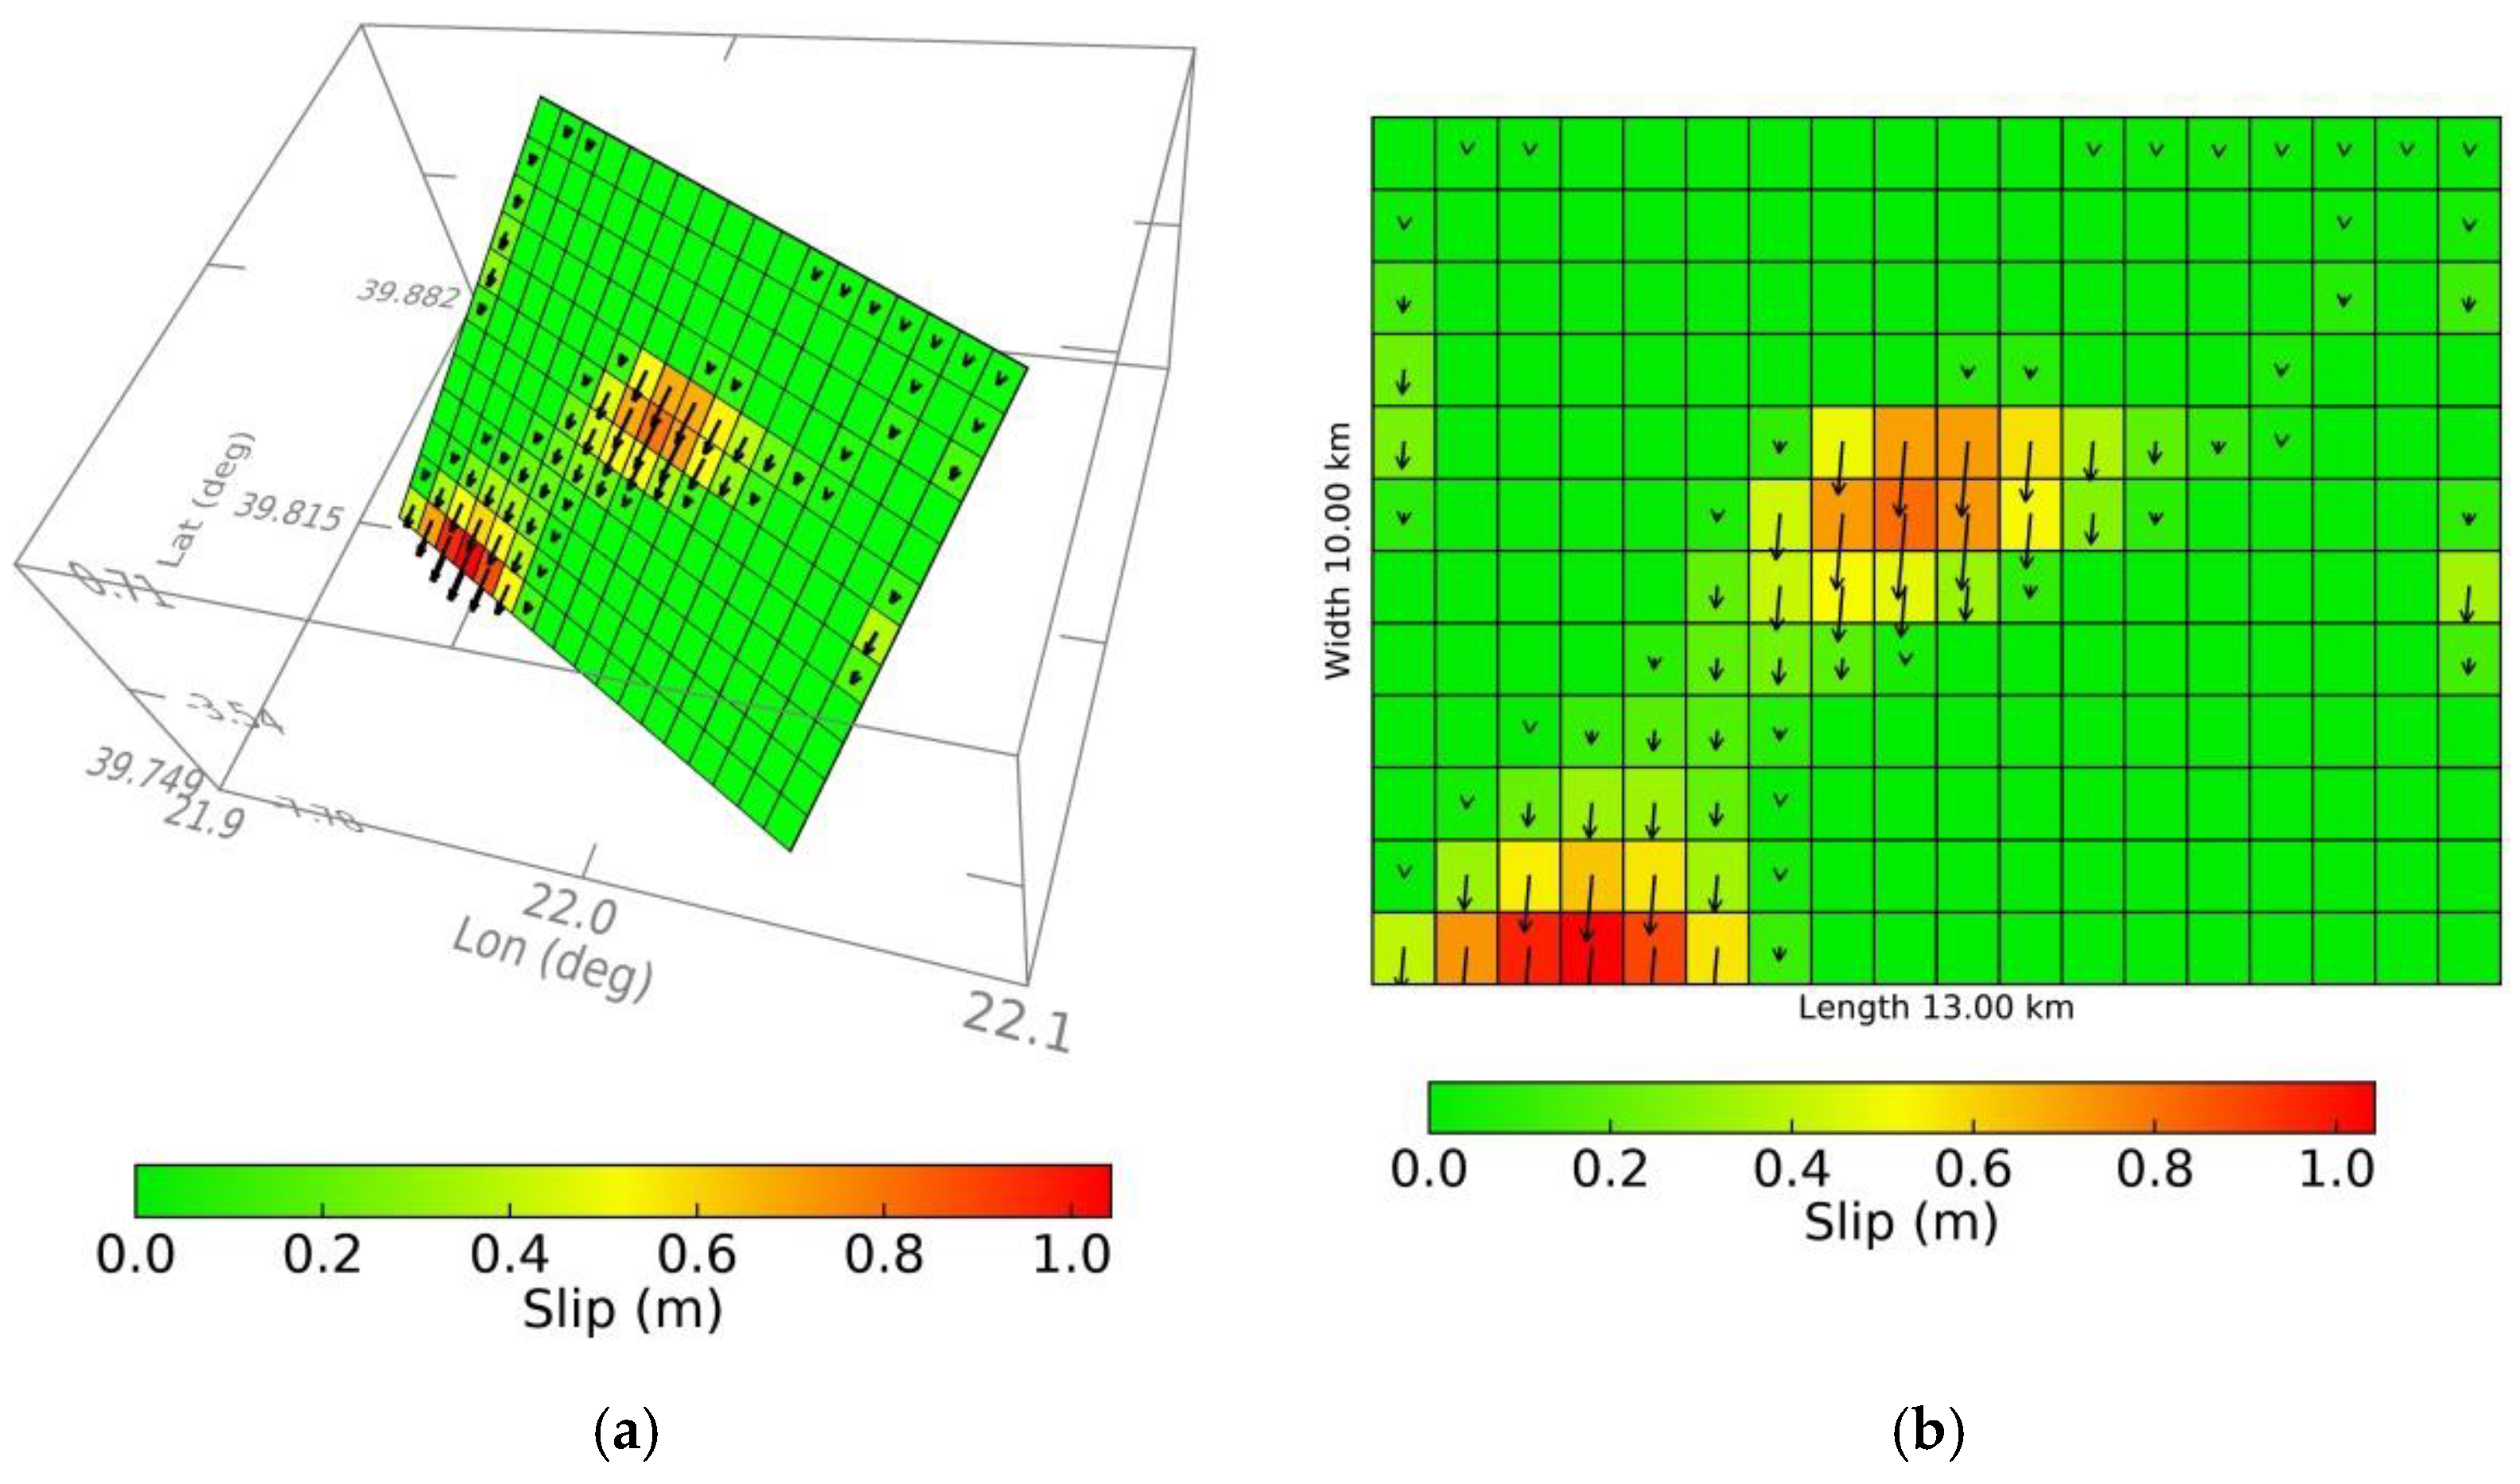
3.3. Seismic Slip Distribution

The synthetics obtained for the 3 March 2021 first shock fit well-enough the recorded waveforms (Figure 5). The heterogeneous spatial slip distribution, which is illustrated in a SE–NW cross-section of the fault area (Figure 6), shows that seismic slip occurred in a main patch of the fault plane and in a secondary patch situated to the southeast but at shallower depth with respect to the main one. The main slip area is concentrated at depths from 6 to 15 km with the maximum slip of ~1.20 m concentrated at depths of 10–12 km. The minimum slip of ~20 cm occurred near the surface. The rupture length, L, changes with depth, being L~15 km at depths from 8 to 15 km and L~22 km from below the surface down to 8 km. The increase of L to the upper part of the fault plane is due to the fact that the secondary slip patch was developed at shallower depths with respect to the main patch. From the inversion procedure we found that the rake values upon the fault plane varies between −80° and −115° but the mean rake value in the main patch of slip is about −95°, which is consistent with the average rake of −93° (Table 4) calculated from the various fault-plane solutions (Table S2).
The total seismic moment released was estimated at Mo = 3.5 × 10¹⁸ N*m, which corresponds to Mw = 6.3. The moment rate function shows that the total duration of the seismic rupture process was ~10.2 s but the main moment release occurred within the first 4 s of rupture (Figure 7). From the time evolution of seismic slip, which is illustrated by six sequential snapshots with time step of nearly 1.7 s (Figure 6), it is evident that after the initiation of the process the rupture propagated mainly upwards for about 7 s. After reaching close to the surface the rupture propagated bilaterally but mainly towards SE where the secondary patch of slip developed.
The horizontal projection of the rupture area of the first shock (Figure 8) shows that the most affected villages from the first earthquake, like Mesochori and Damasi [1], are situated within the rupture area. On the contrary, in the town of Tyrnavos and in the city of Larissa, which are situated outside the rupture area, less damage was reported. It is also evident that most of the foreshocks that preceded the first shock from the 28 February to the 3 March 2021 occurred within the main asperity that ruptured.

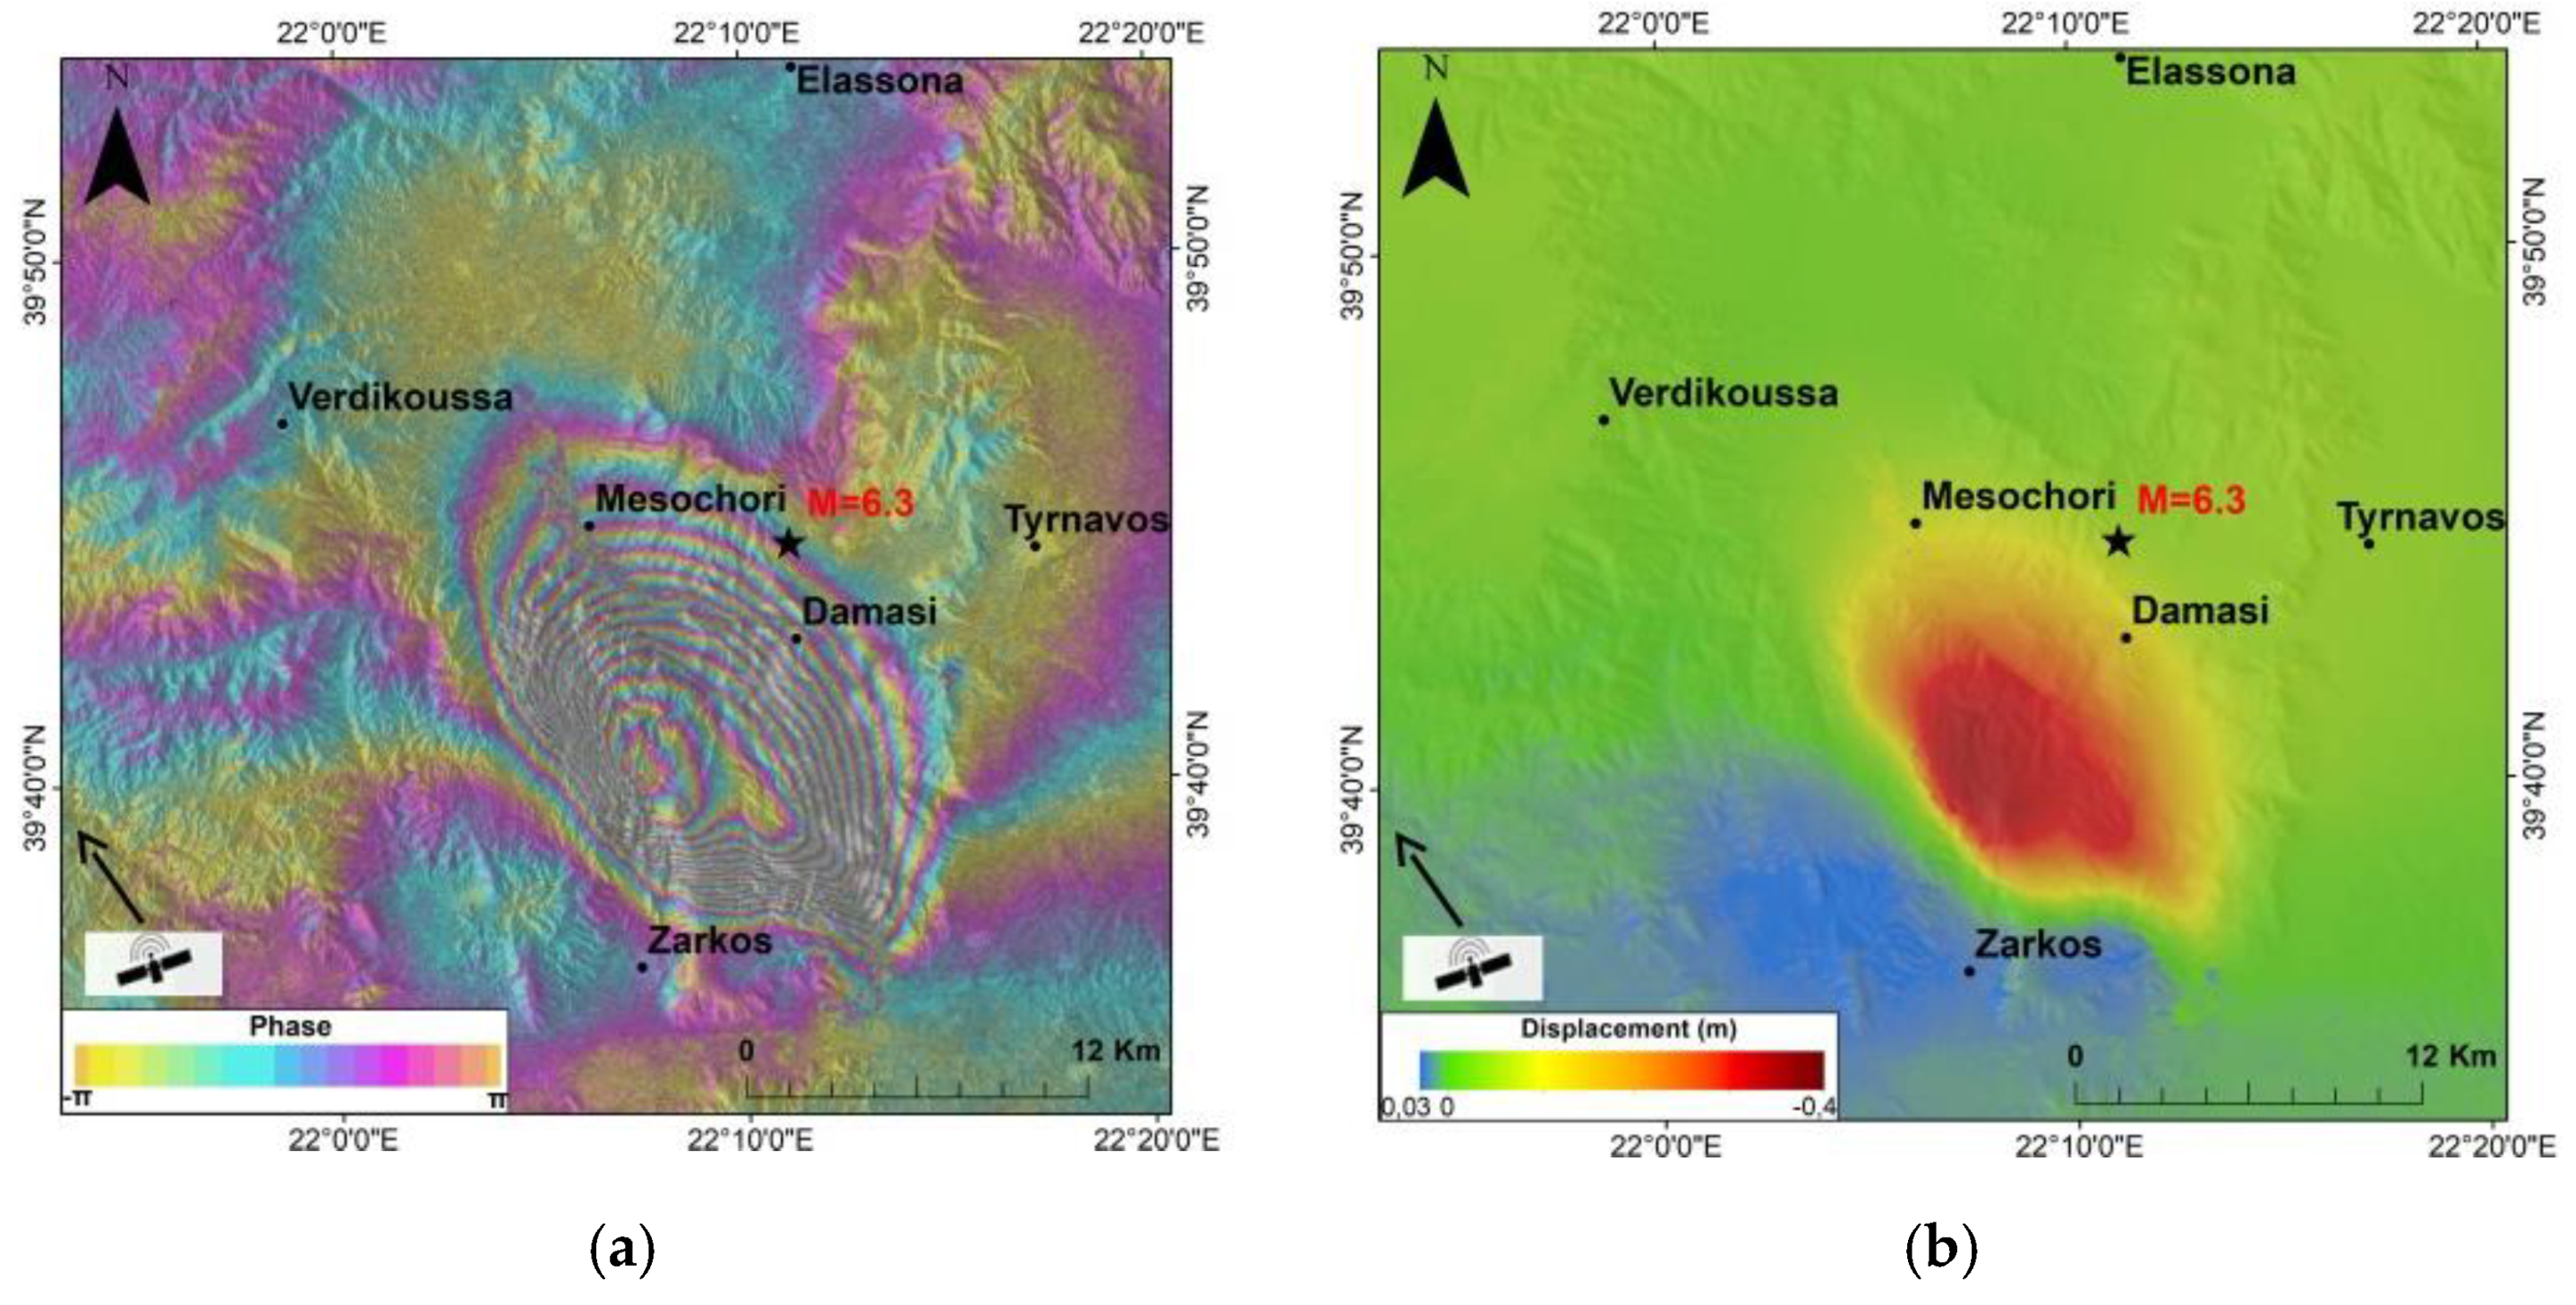
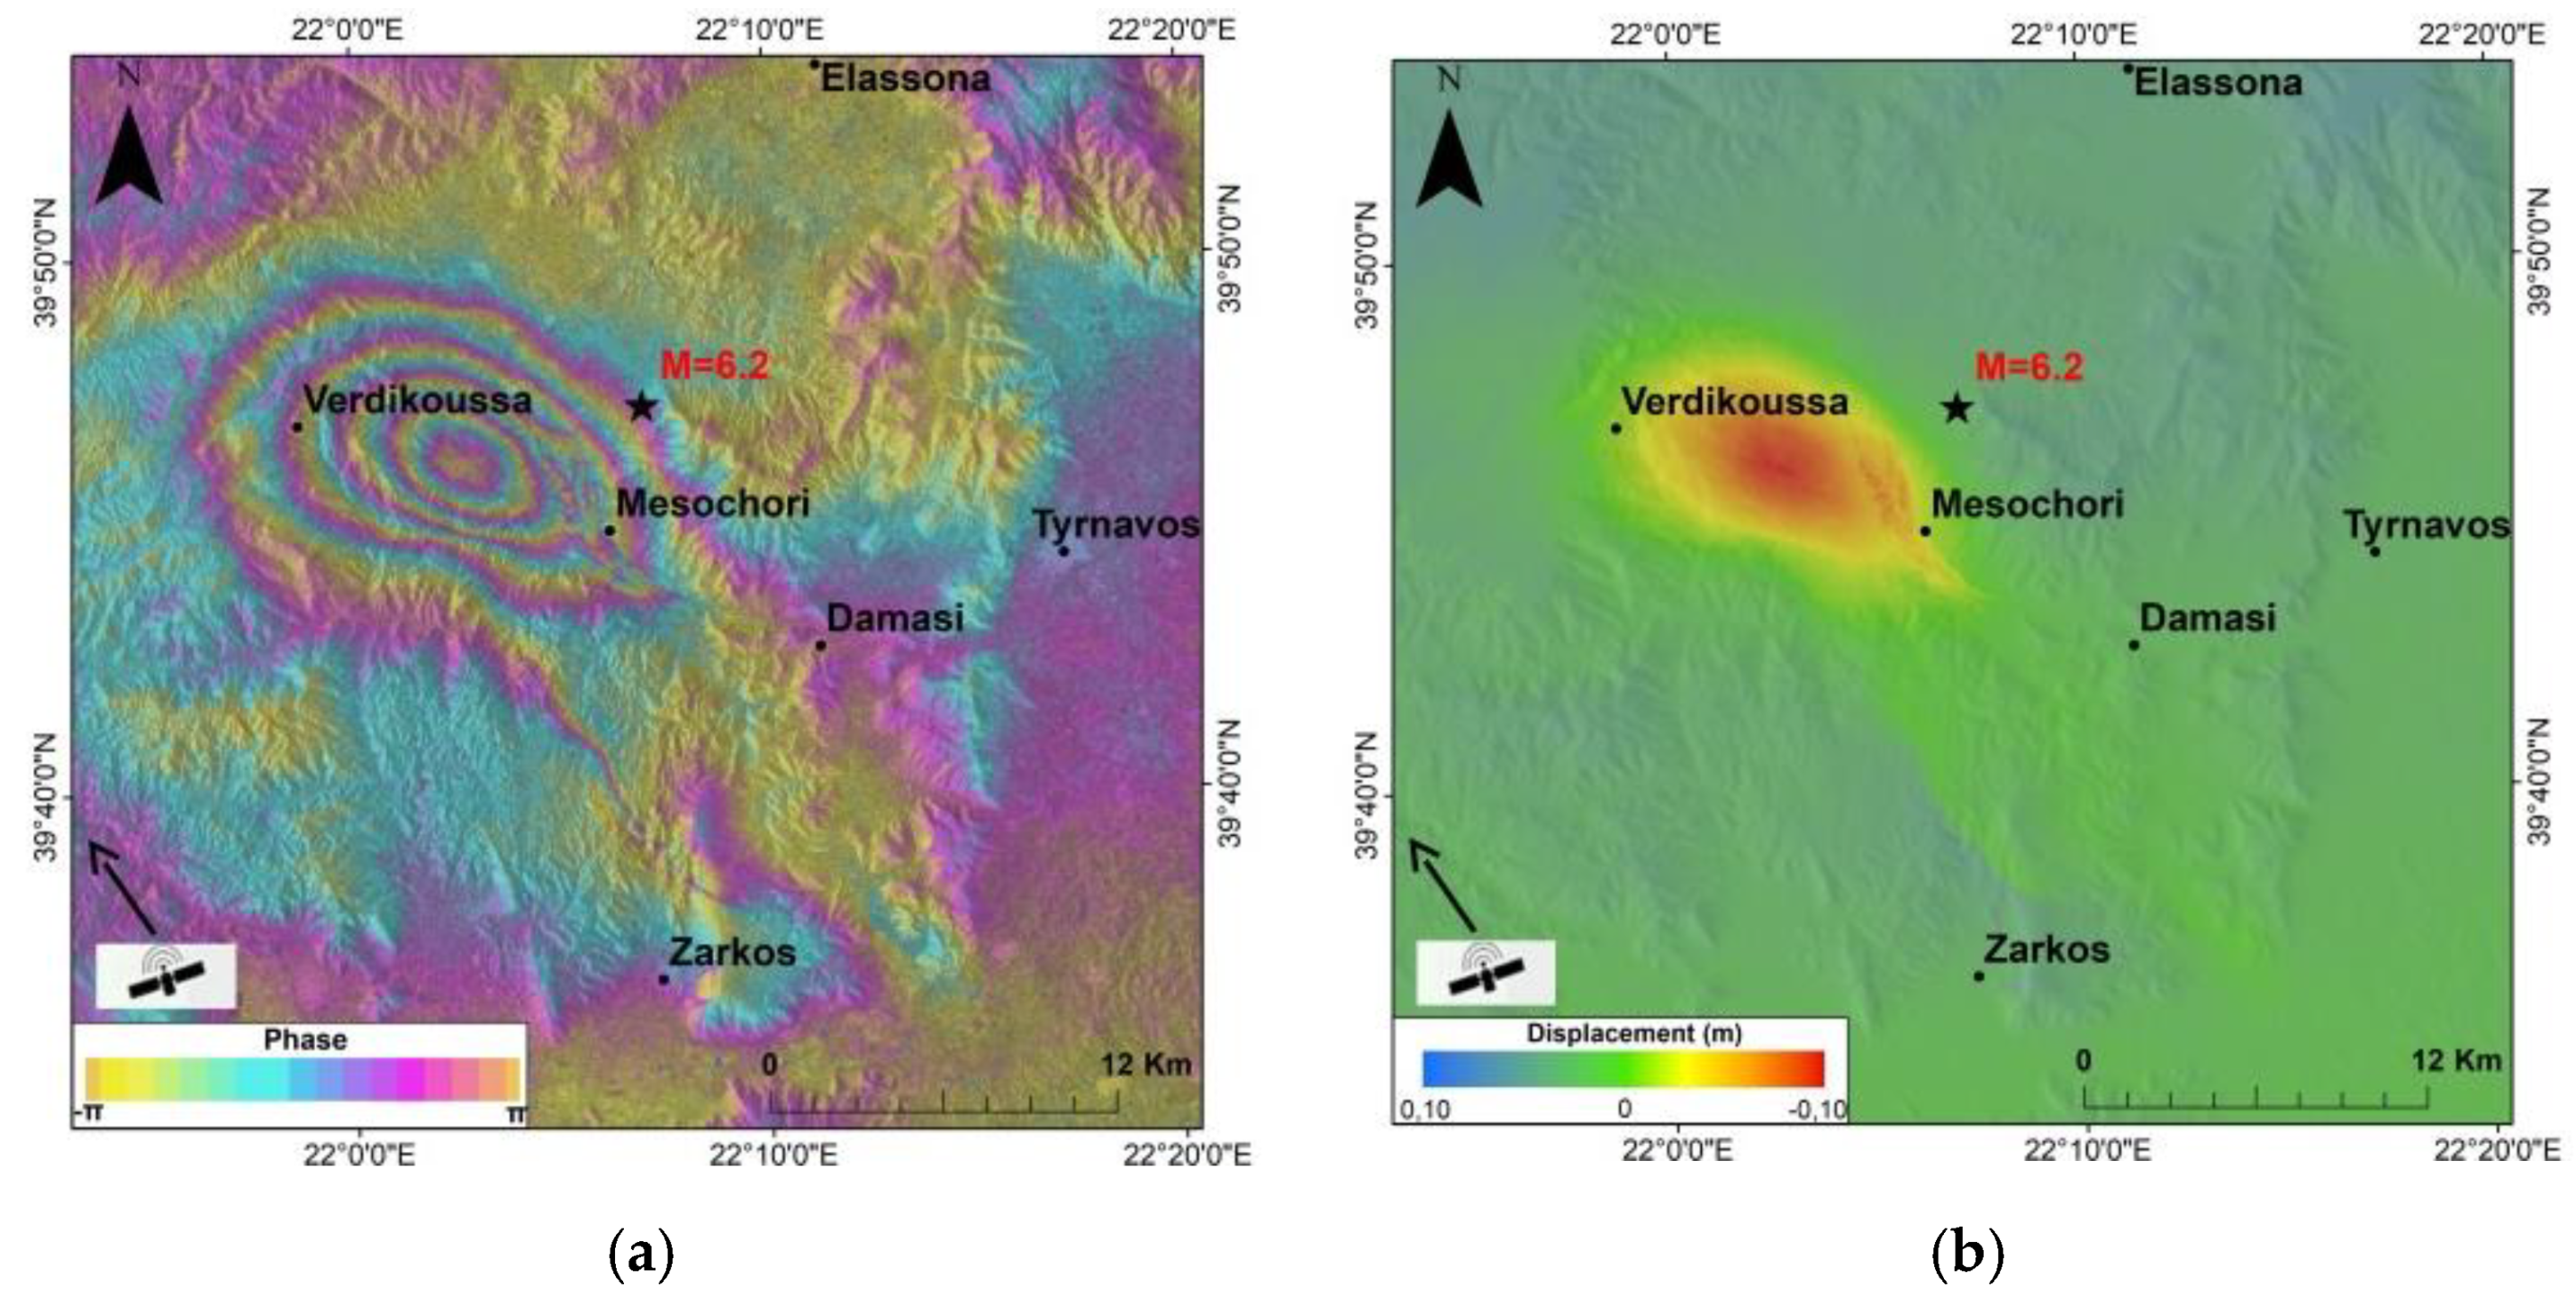
3.4. Ground Deformation from INSAR

The results obtained from InSAR analysis are characterized by coherent values ranging from 0.0 to 1.0, the value 1 corresponding to very high coherence. The DInSAR process produced images in radian unit in the range −π to π, which caused ambiguity problems. Although the pattern of deformation could be detected, the main information regarding the deformation value could not be read properly. In order to get results of deformation containing metric value, an unwrapping process was performed, and the phase unit was transformed into metric units in LoS for every interferometric pair. This unwrapping step was undertaken with the use of the Minimum Cost Flow method [39].

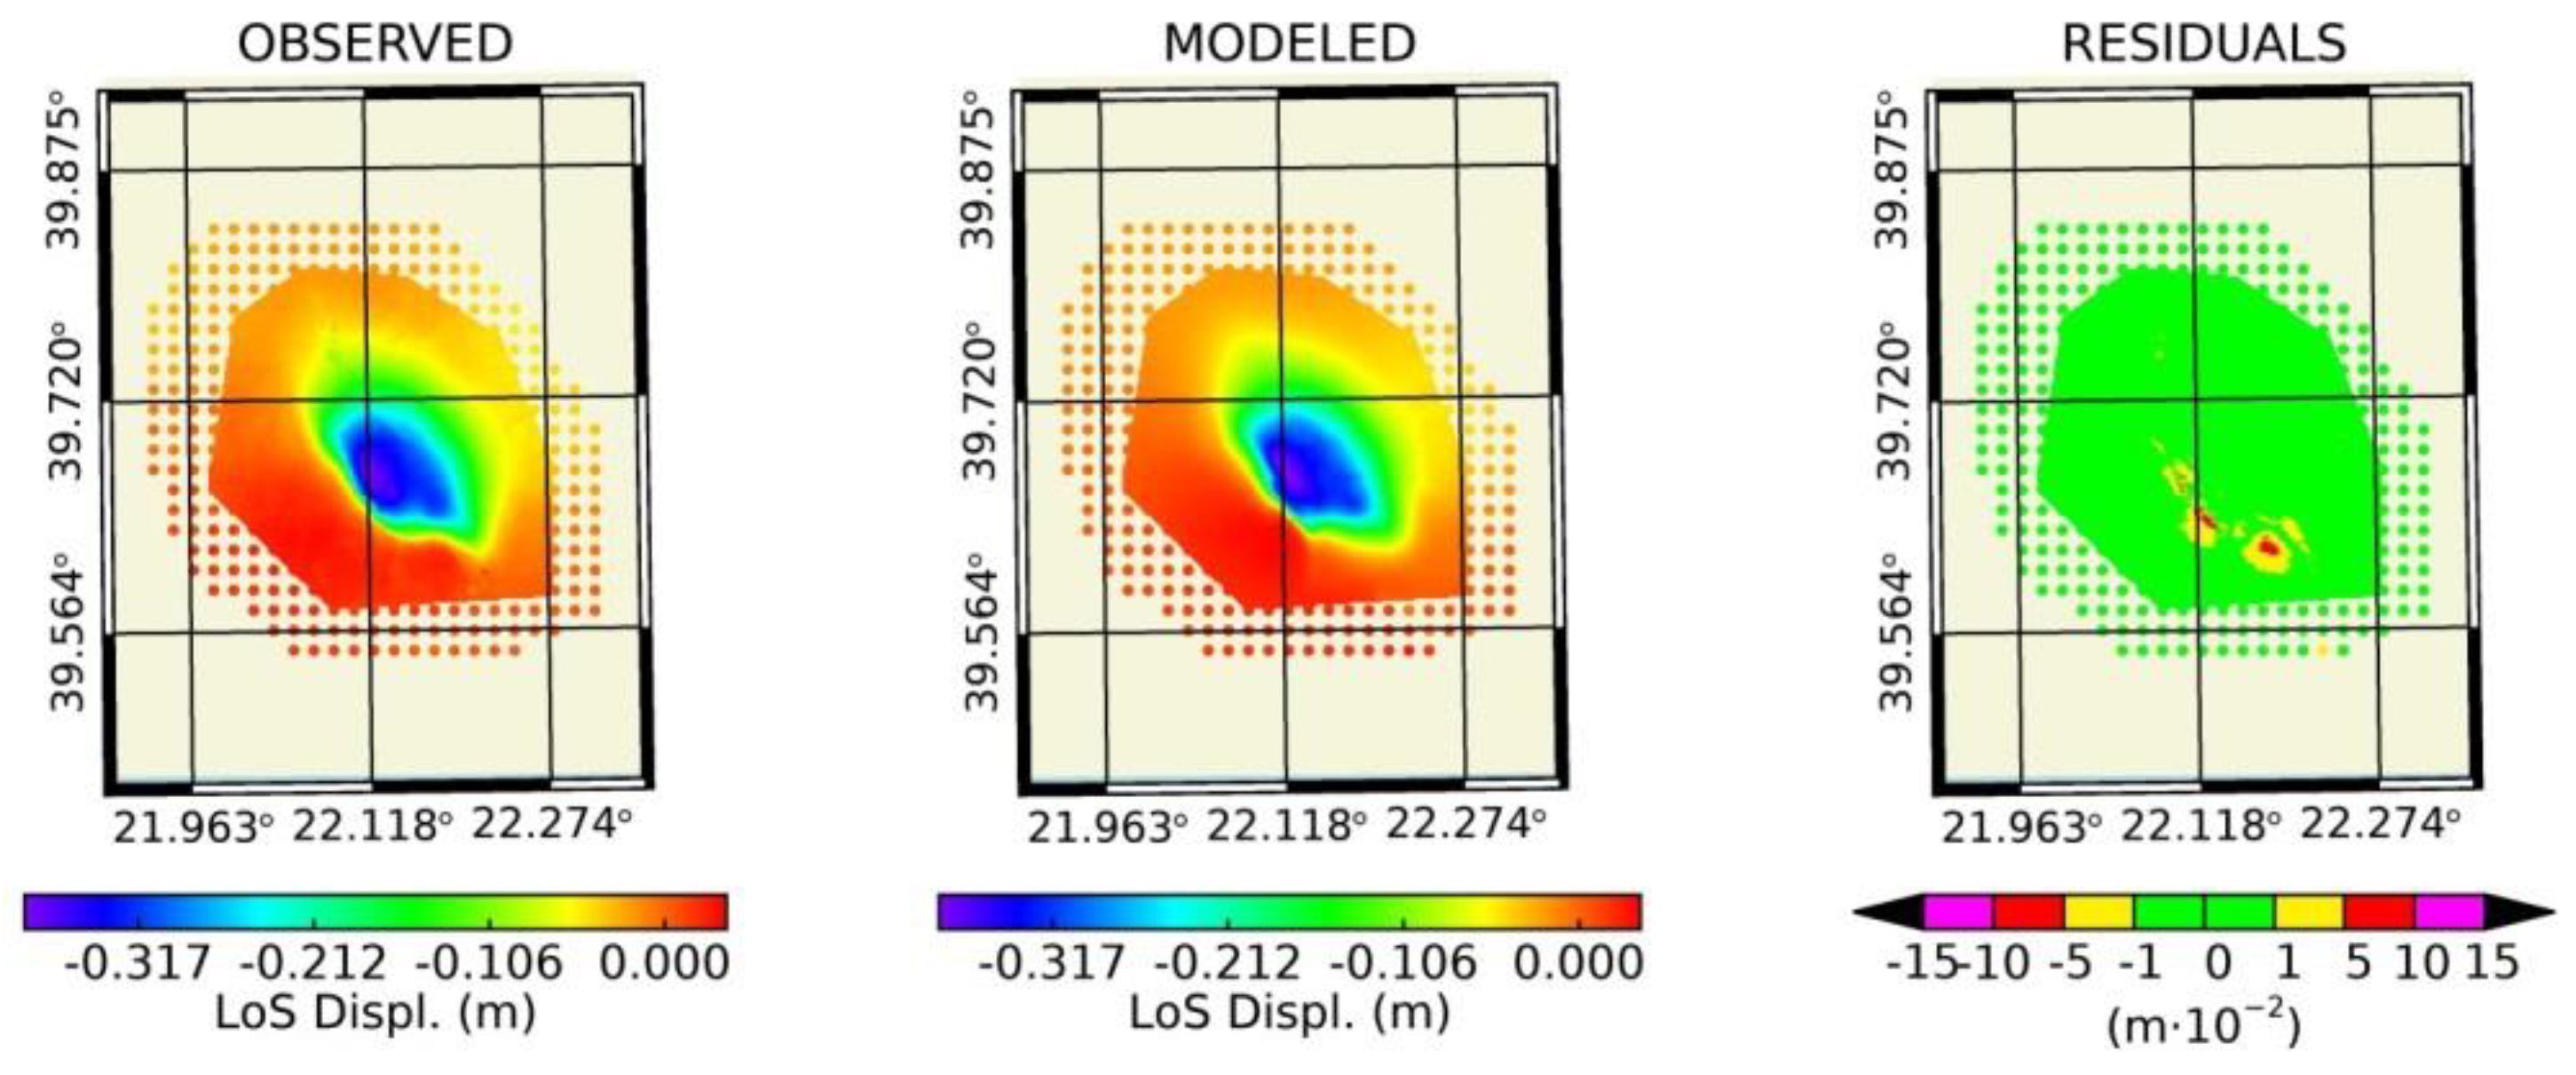
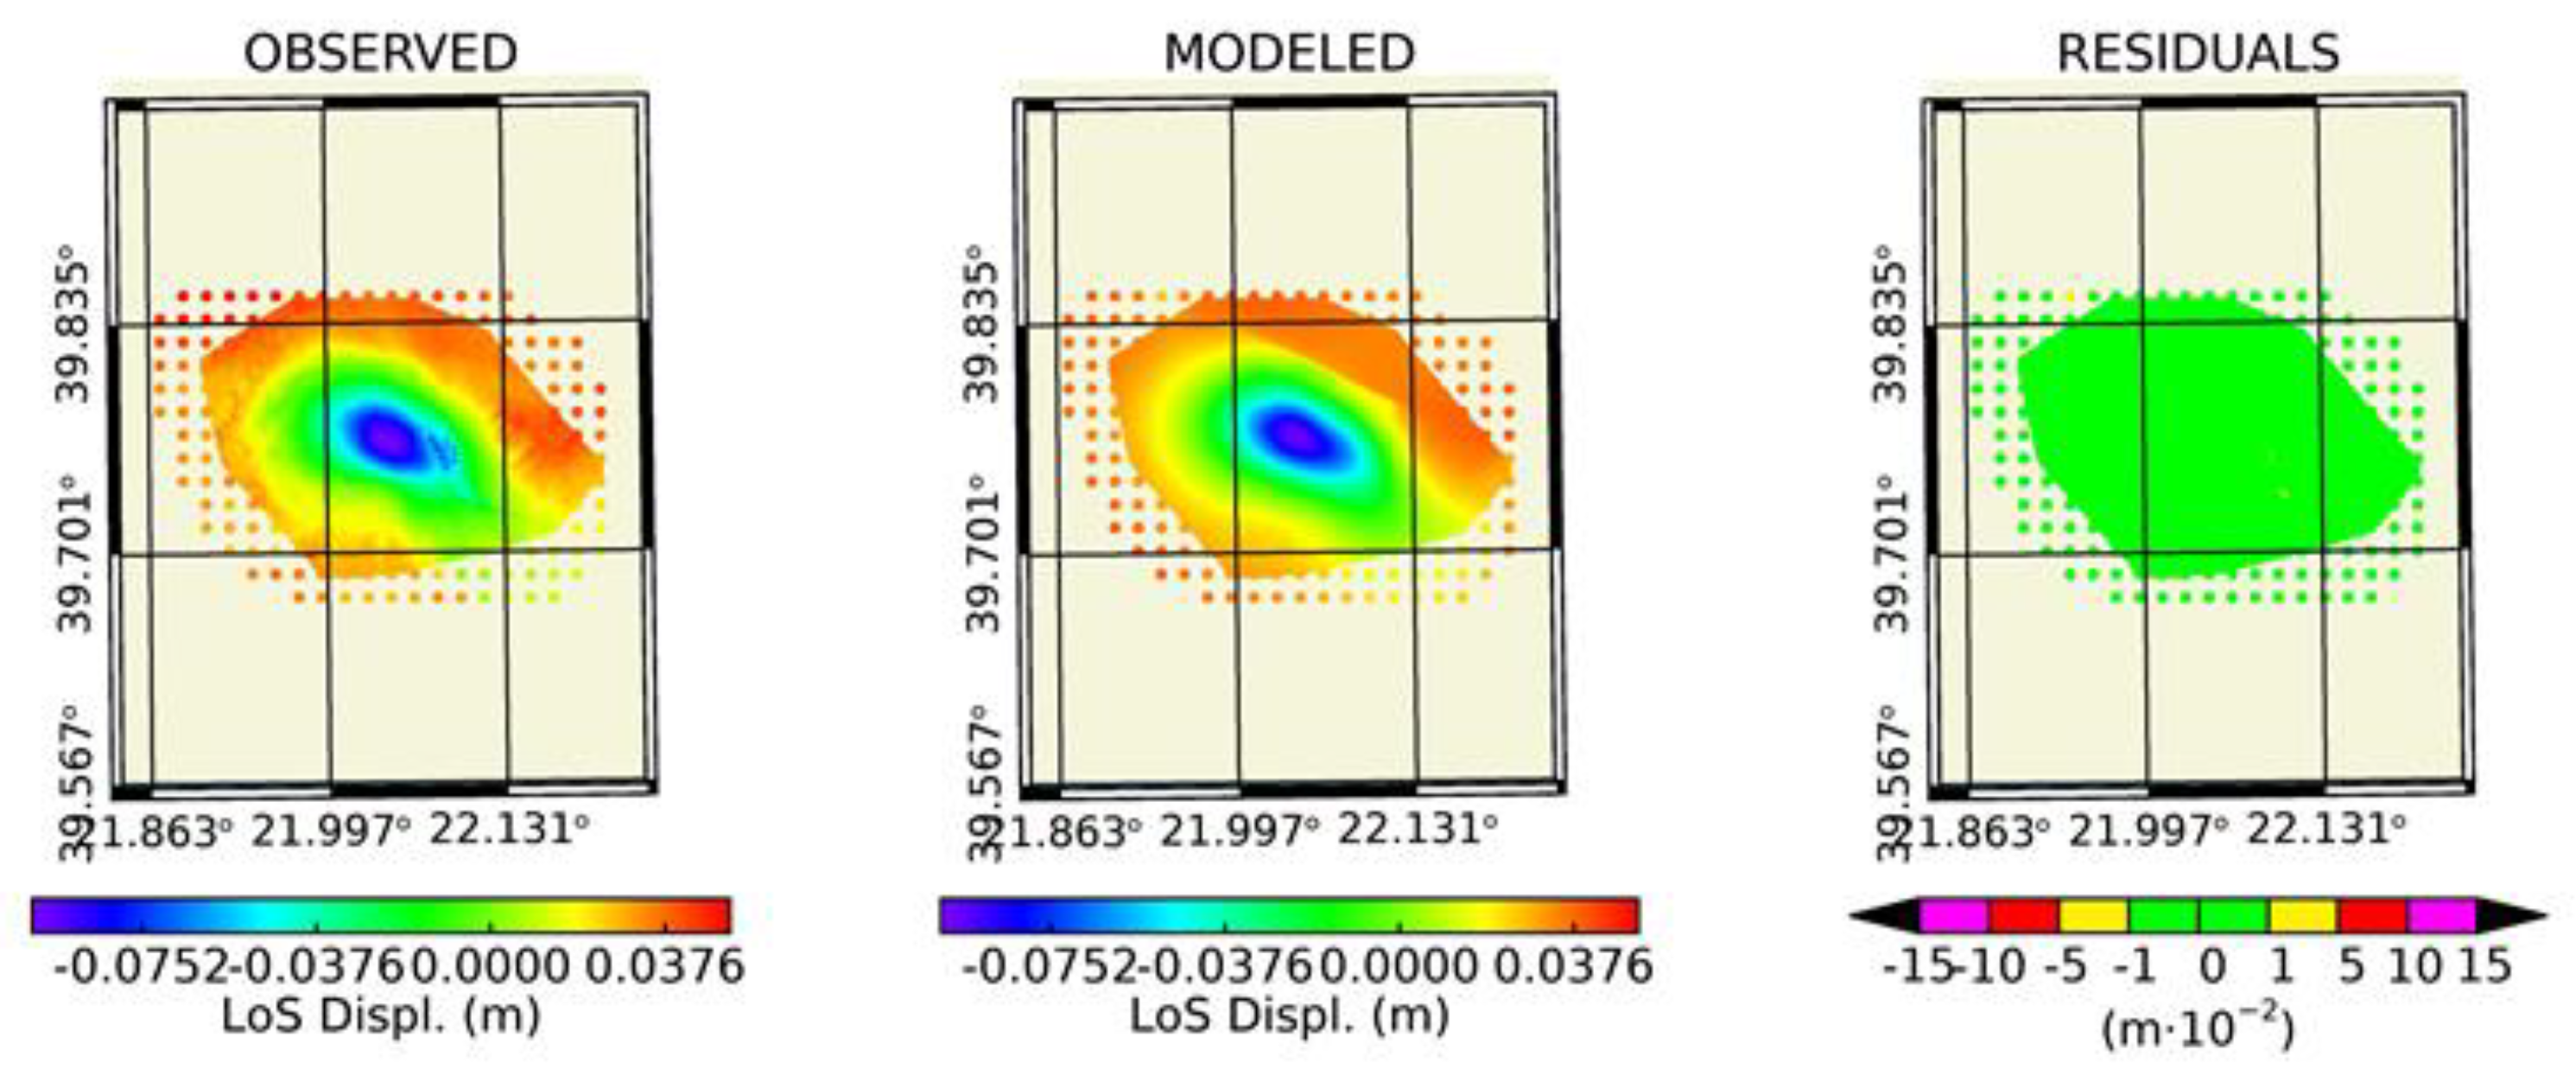
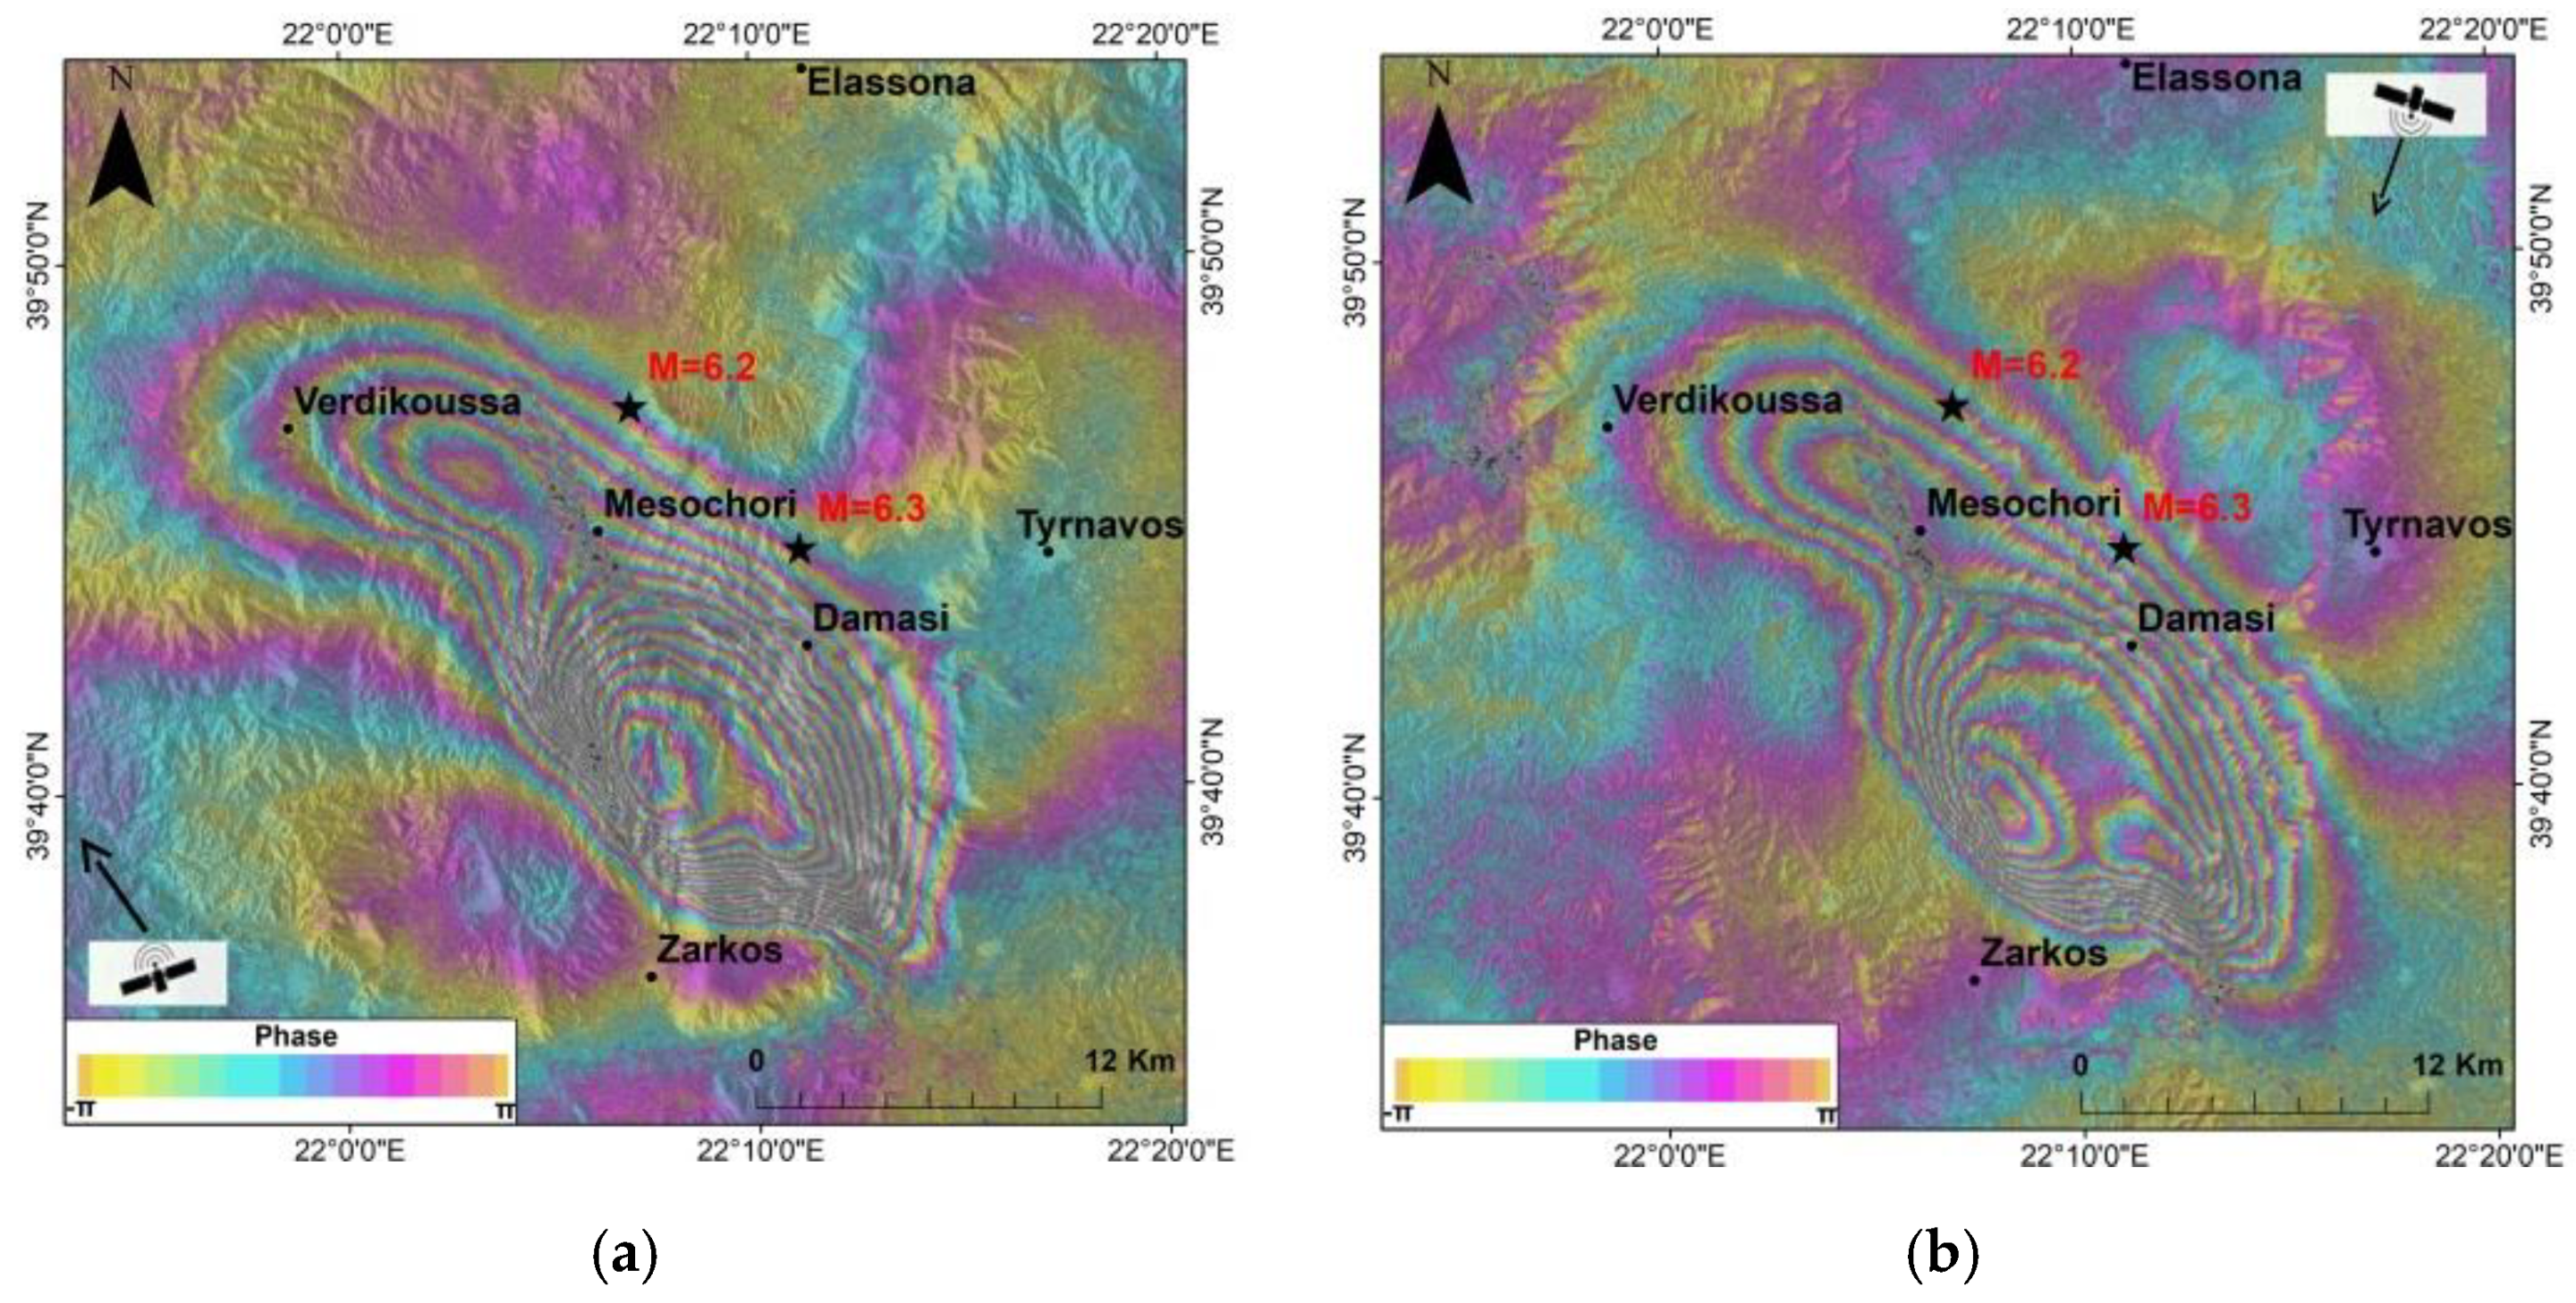
3.4.1. The First Shock of 3 March 2021

The wrapped interferogram of the 3 March earthquake and the corresponding displacement map (Figure 9) based on the interferometric pair are composed by Sentinel 1 SLC images taken in ascending mode on 25 February 2021 and 3 March 2021 for the master and slave images, respectively. A clear pattern of 14 fringes is evident, which forms a lobe showing subsidence. From the displacement map the subsidence amplitude is estimated up to about −40 cm. The subsidence domain is nearly identical with the main patch of rupture obtained from the inversion of P waveforms (Figure 8). In the southern part of the lobe of fringes an incomplete fringe is also recognized corresponding to uplift, the amplitude of which from the displacement map is estimated up to ~3 cm. The comparison of LoS displacements obtained from the observed and modeled data are nearly identical given that only minimal residuals were received (Figure 10).
The best-fit solution found for the source (Table 5, Figure 11) is in general consistent with the solution determined from the inversion of teleseismic P waveforms. The geodetic source solution provides a seismic fault dipping to NE with strike SE–NW (317°), dip angle of 30° and rake −110°. The geodetic seismic moment (Table 5) calculated through the Okada formalism analyzed in [38] results in earthquake magnitude Mw = 6.3, which coincides with the seismically determined magnitude. The maximum slip found is 1.5 m at depth 5–7 km, which is shallower than the depth of 10–12 km determined from the seismic inversion method. This is probably due to that the geodetic fault dip angle is smaller than the one (45°) found from both the seismic inversion method and the average angle (48°) of the various fault plane solutions published (Table 4).

3.4.2. The Earthquake of 4 March 2021

For the second strong seismic event of 4 March, the wrapped interferogram and the displacement map (Figure 12) are based on the interferometric pair composed by Sentinel 1 SLC images taken in ascending mode on 3 March 2021 and 9 March 2021 for the master and slave images, respectively. The deformation pattern is illustrated by four fringes, which form a lobe showing ground subsidence of estimated amplitude up to about −10 cm. The comparison of LoS displacements obtained from the observed and modeled data are identical given that zero residuals were received (Figure 13). The earthquake epicenter falls at the north-eastern margin of the subsidence domain, which is consistent with the small focal depth of the earthquake. However, the average centroid depth of ~13 km is projected well inside the subsidence domain.
The best-fit geodetic source solution (Table 5, Figure 14) provides a seismic fault dipping to about SW with strike ESE–WNW (116°), dip angle of 40° and rake −101°. The geodetic fault solution is consistent with one of the two average NPs found from various seismic fault-plane solutions (Table 4). The geodetic seismic moment (Table 5) results in earthquake magnitude Mw = 6.2. Seismic slip on the fault occurred at depths ranging from 5 to 20 km but the maximum slip of 1.2 m was found at depth ~7 km.

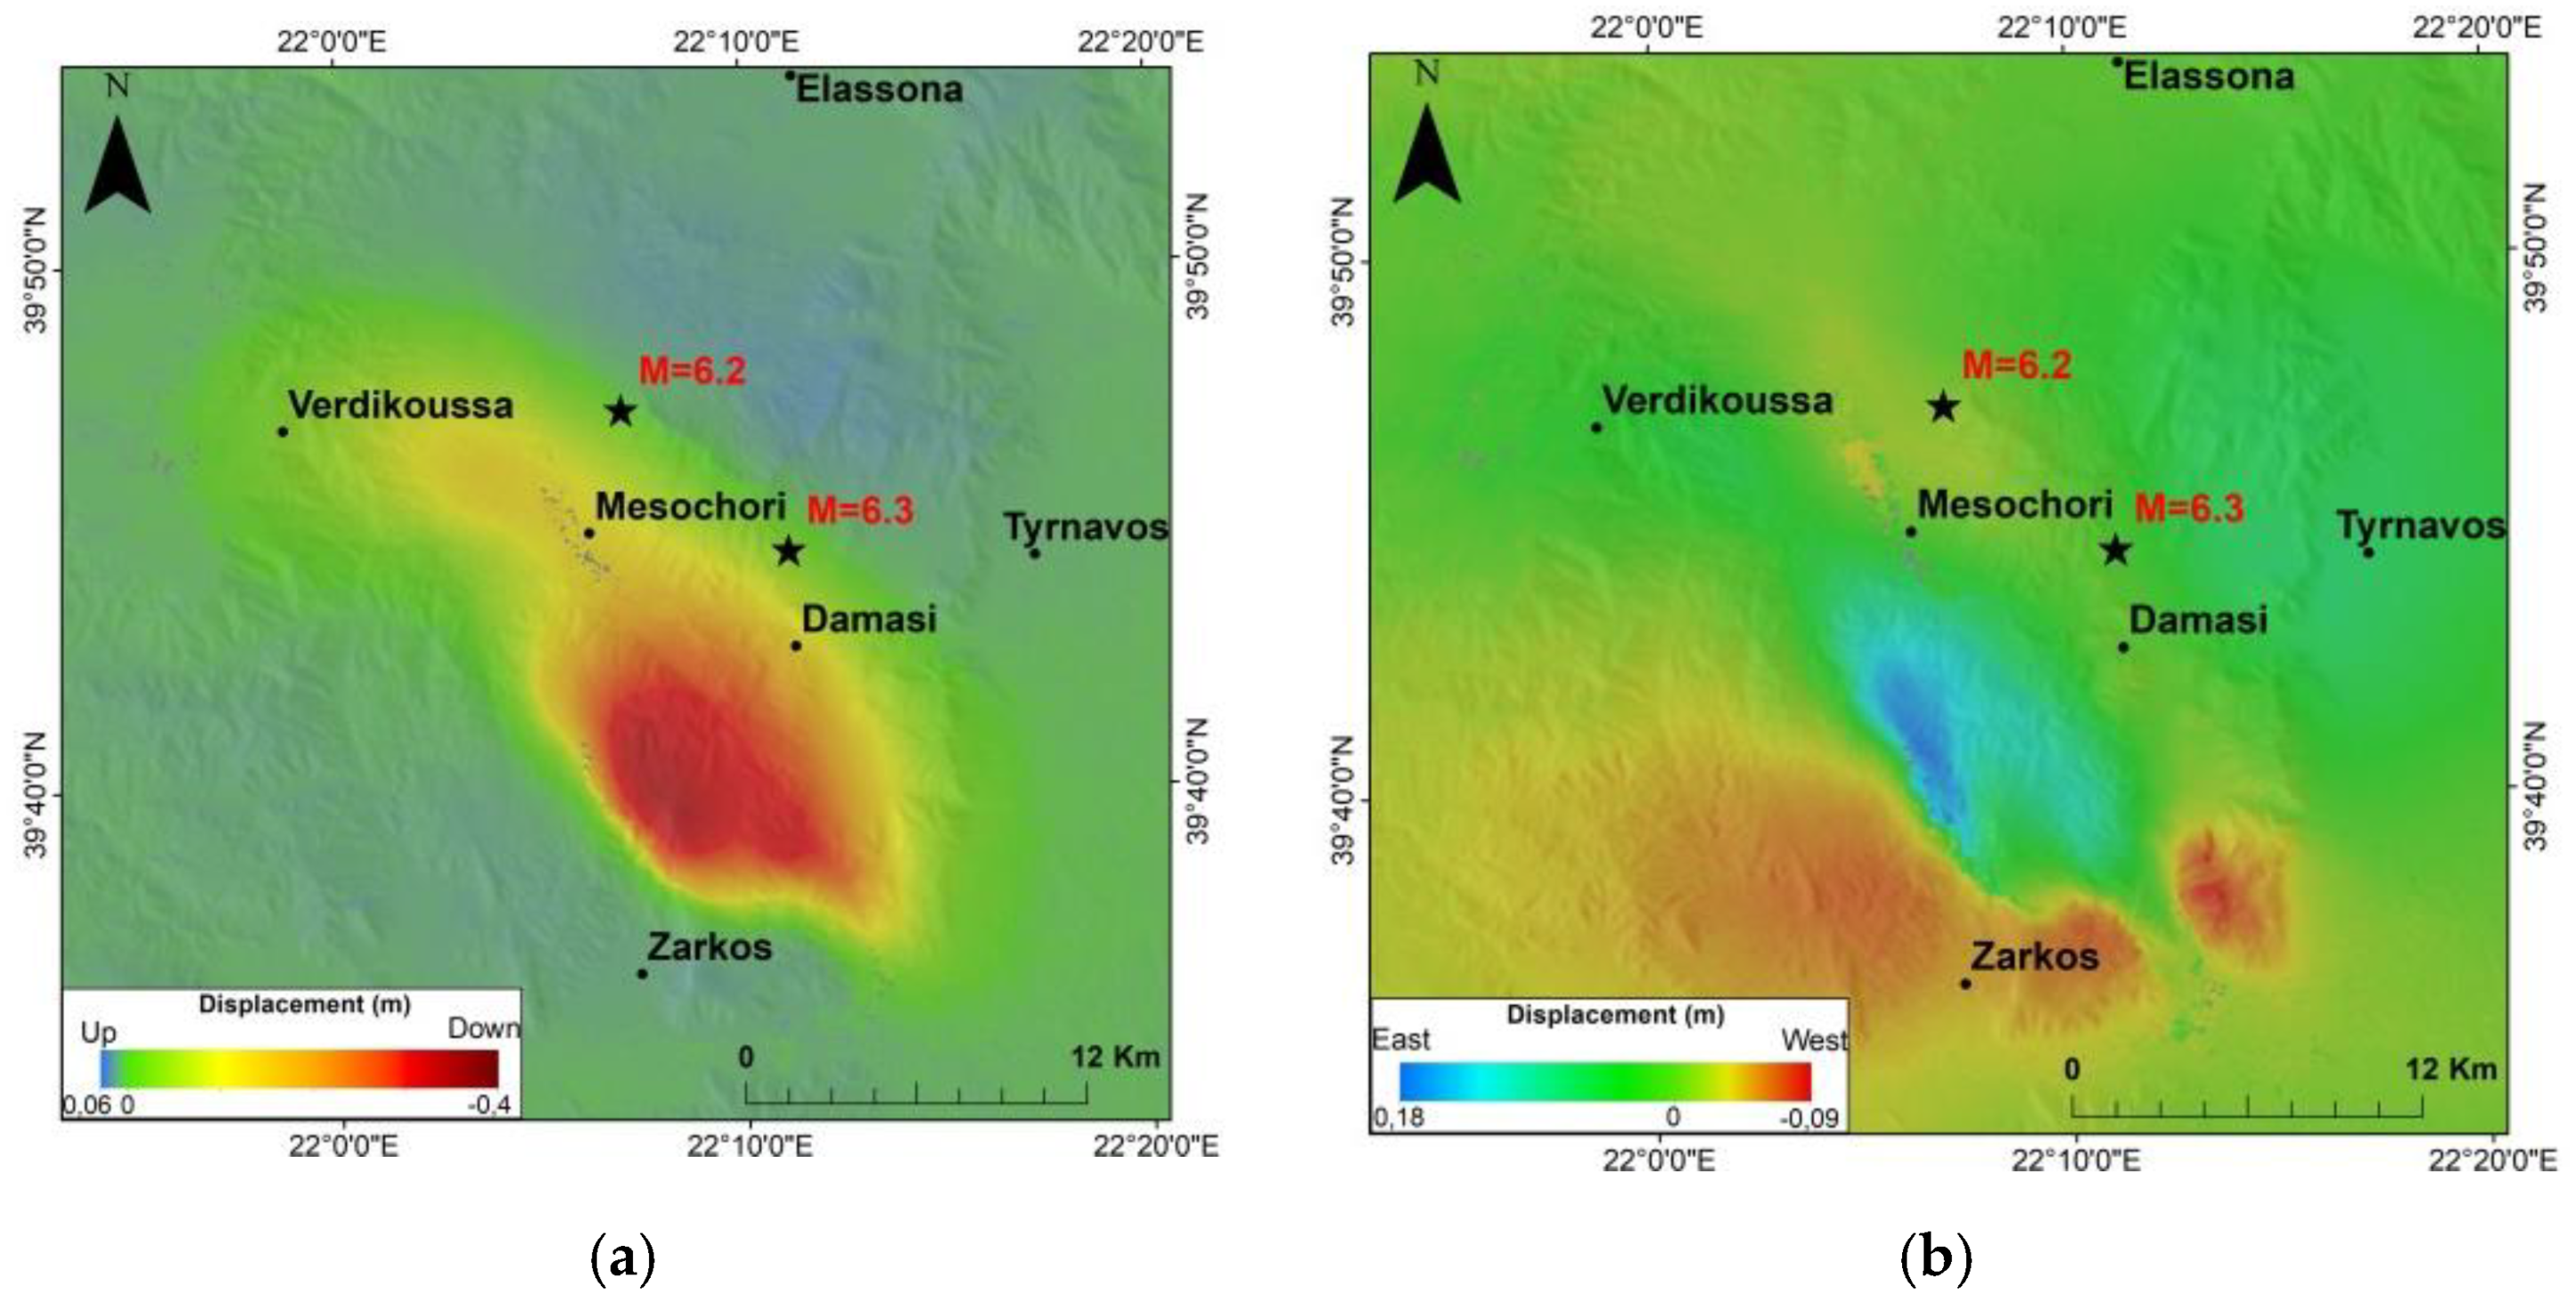
3.4.3. The Earthquakes of 3 and 4 March 2021 Combined

Displacement decomposition including both the seismic events of 3 and 4 March 2021 was also produced from interferometric pairs in ascending mode, taken on 25 February 2021 and 9 March 2021 for master and slave images, and in descending mode taken on 24 February 2021 and 8 March 2021 for master and slave images. The wrapped interferograms clearly show the migration of the ground deformation towards NW (Figure 15). The opposite subsidence/uplift pattern in the two earthquakes is evident in the vertical displacement map (Figure 16a), which verifies that the first normal fault dips toward NE while the second dips towards SW. Τhe two earthquakes are also characterized by opposite polarity in the horizontal displacement (Figure 16b).
The solutions obtained imply that with the second earthquake the activated fault was subparallel and antithetic to the one activated with the first earthquake. This is a reminder of similar seismotectonics characterizing the strong earthquake sequence that ruptured the eastern Gulf of Corinth on 24 and 25 February and again on 4 March 1981 in Central Greece [40,41] to the south of Thessaly (Figure 1). This case is discussed further later.

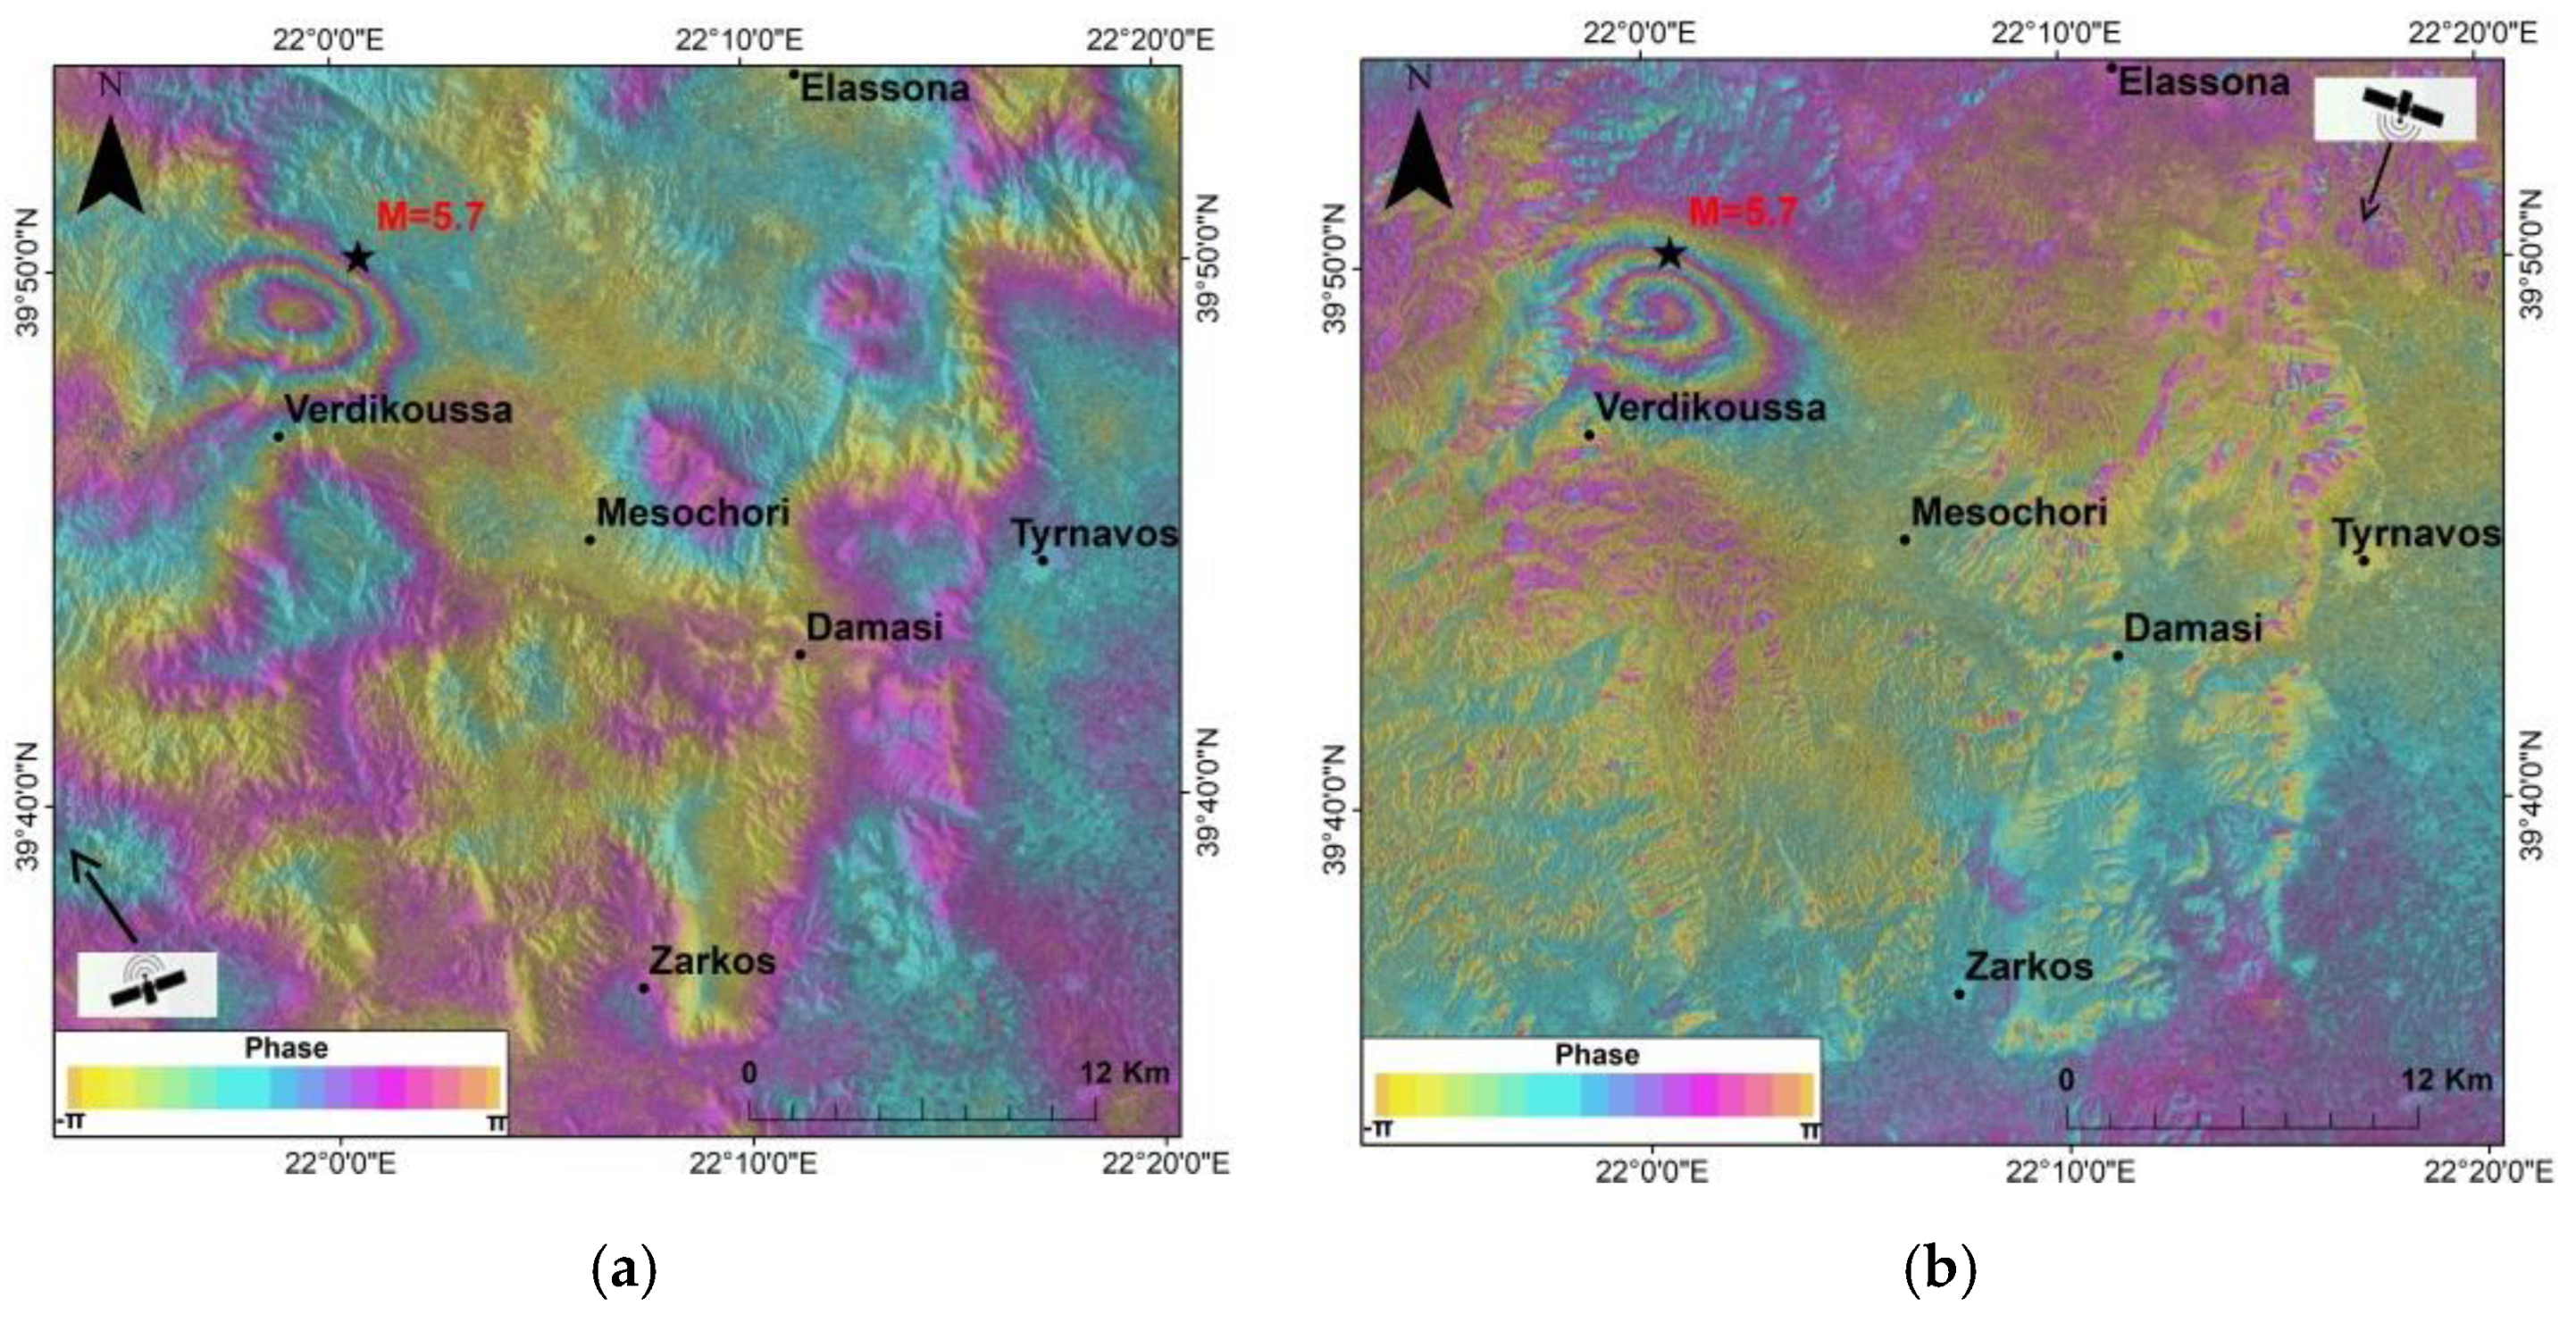
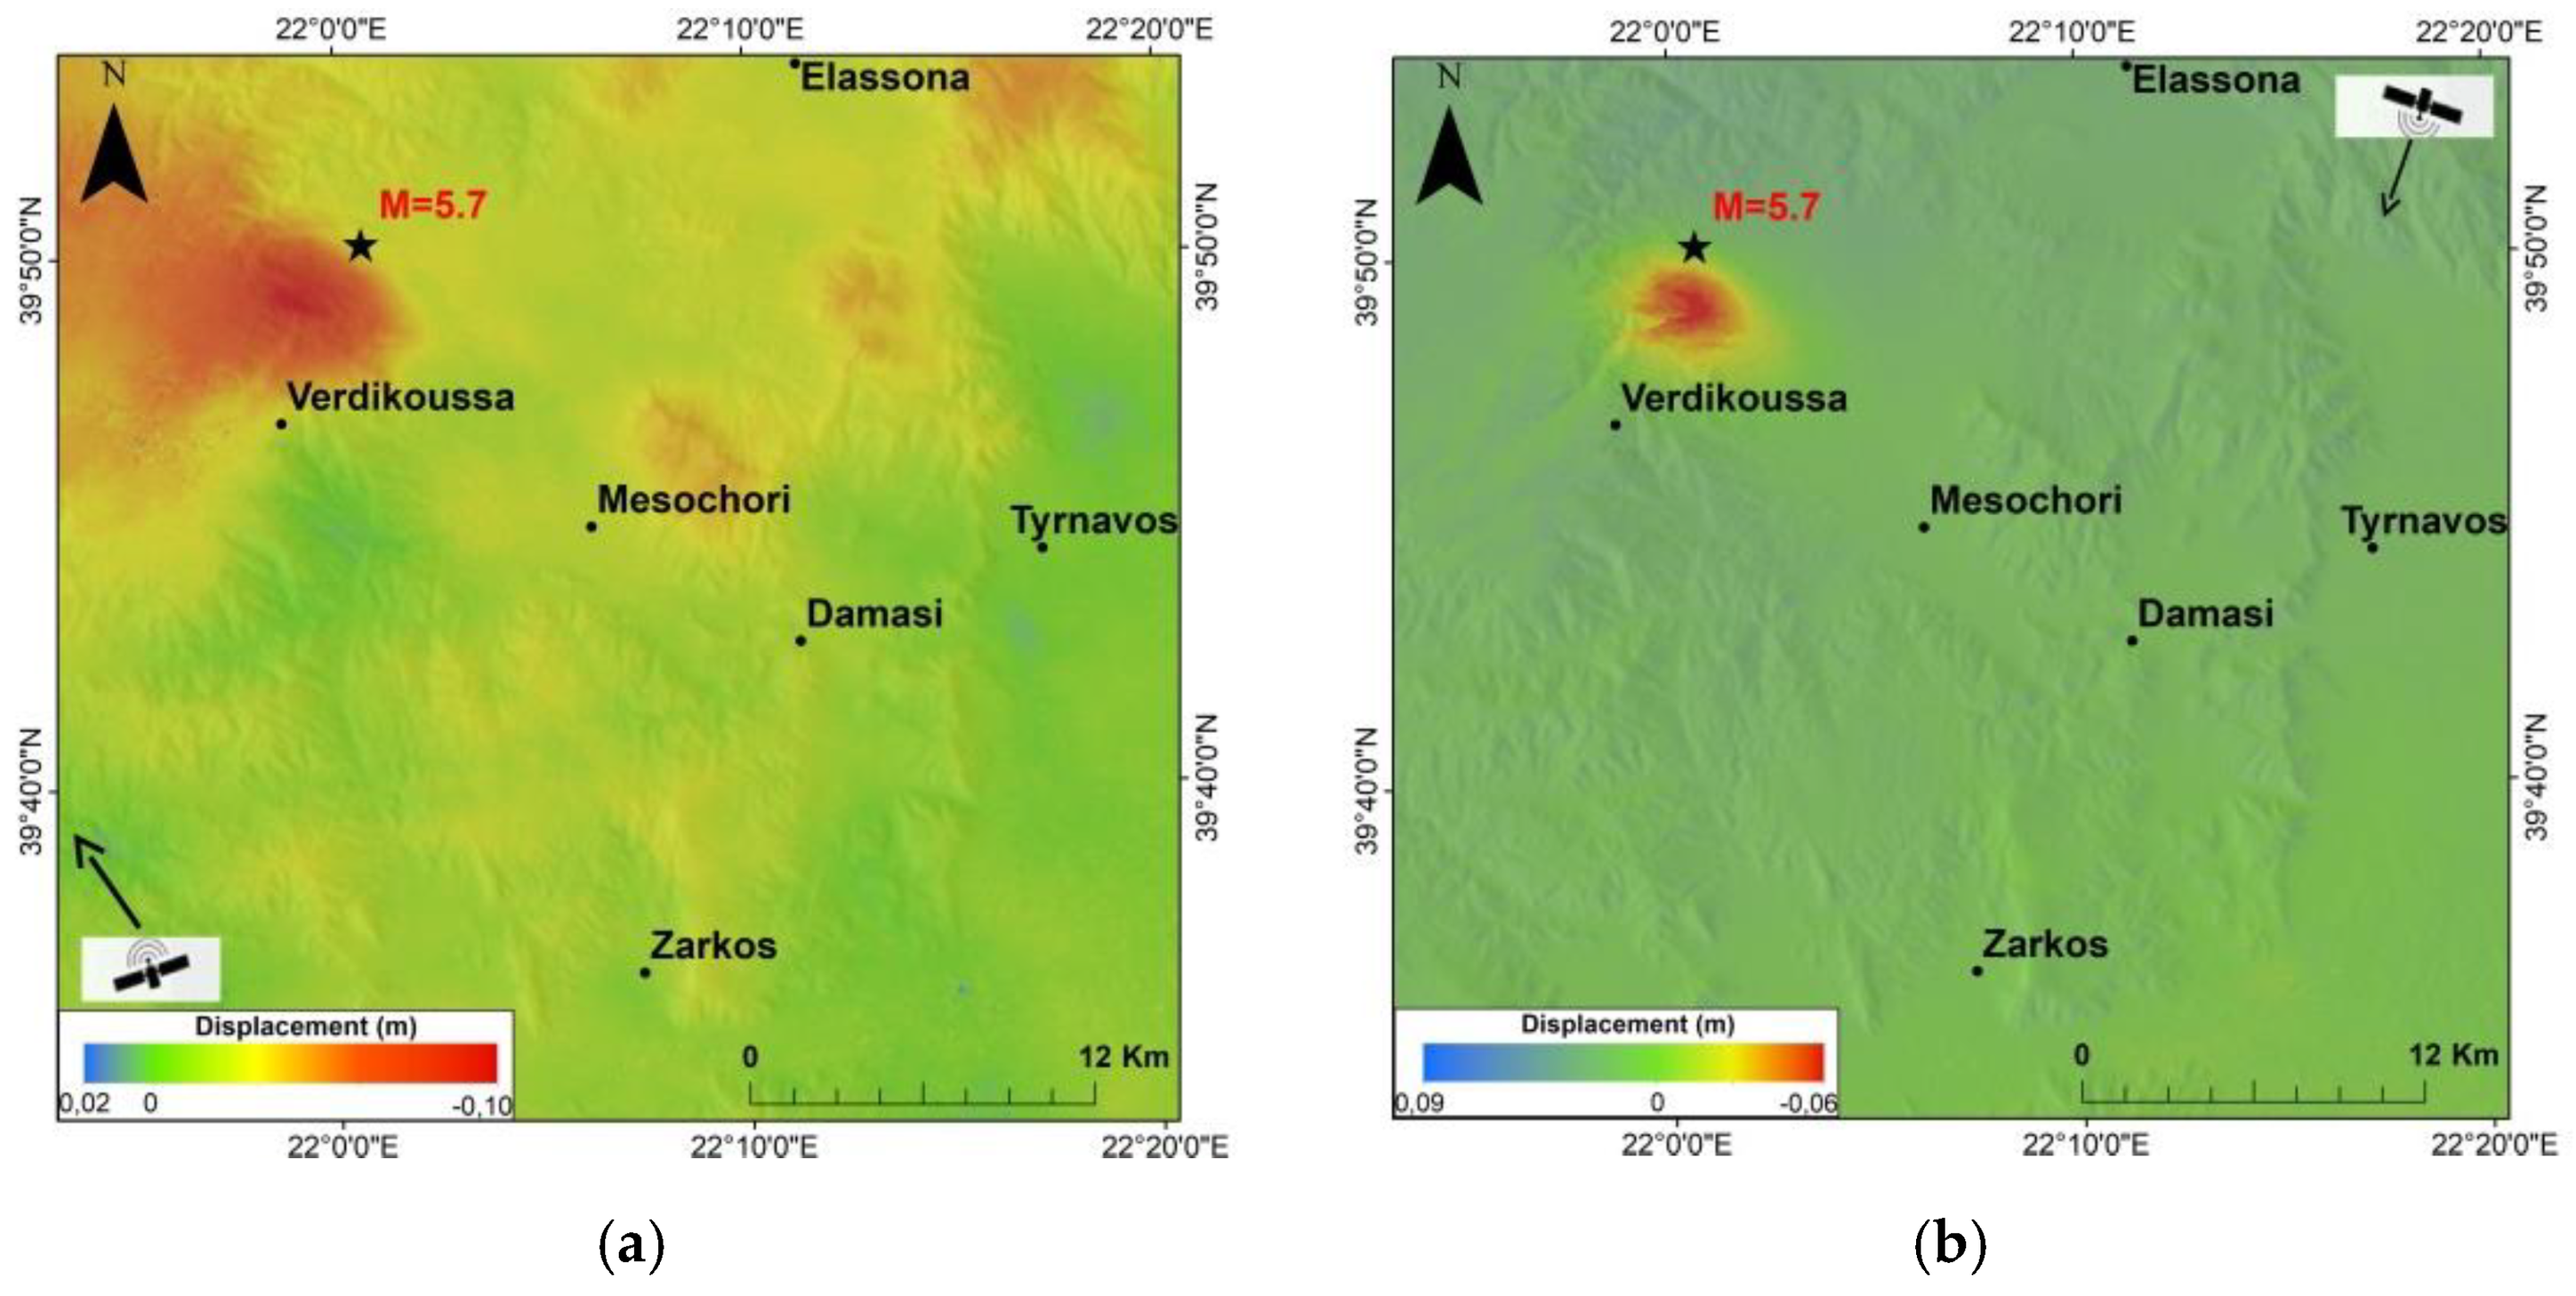
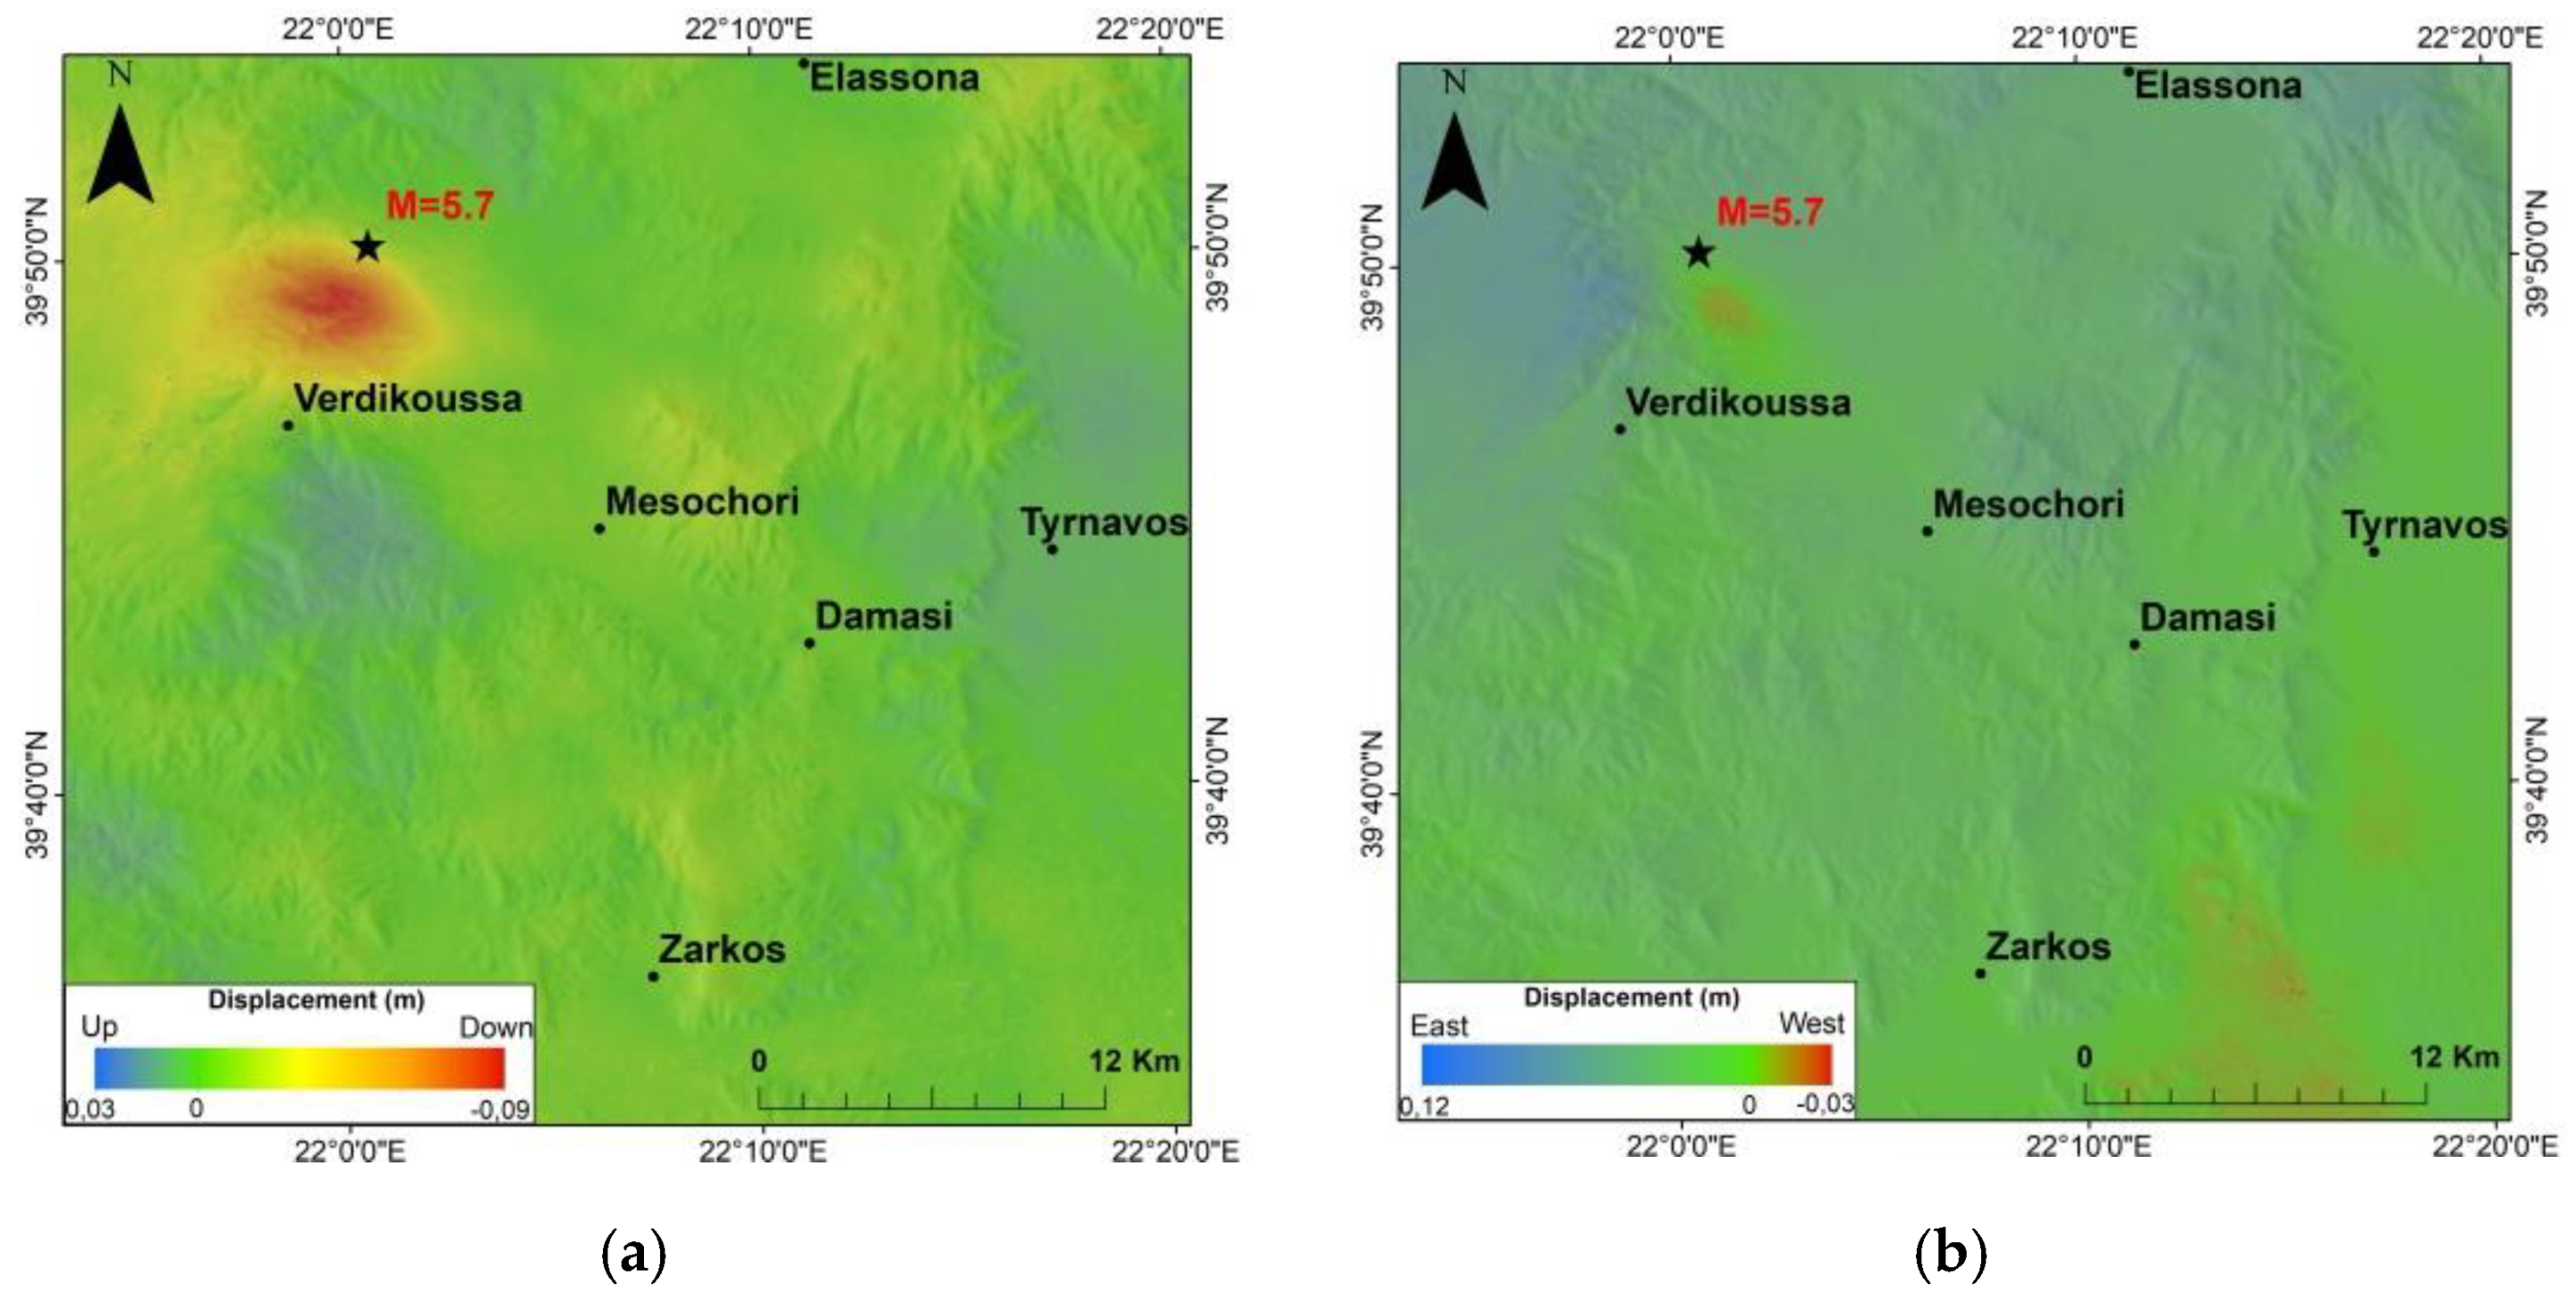
3.4.4. The Earthquake of 12 March 2021
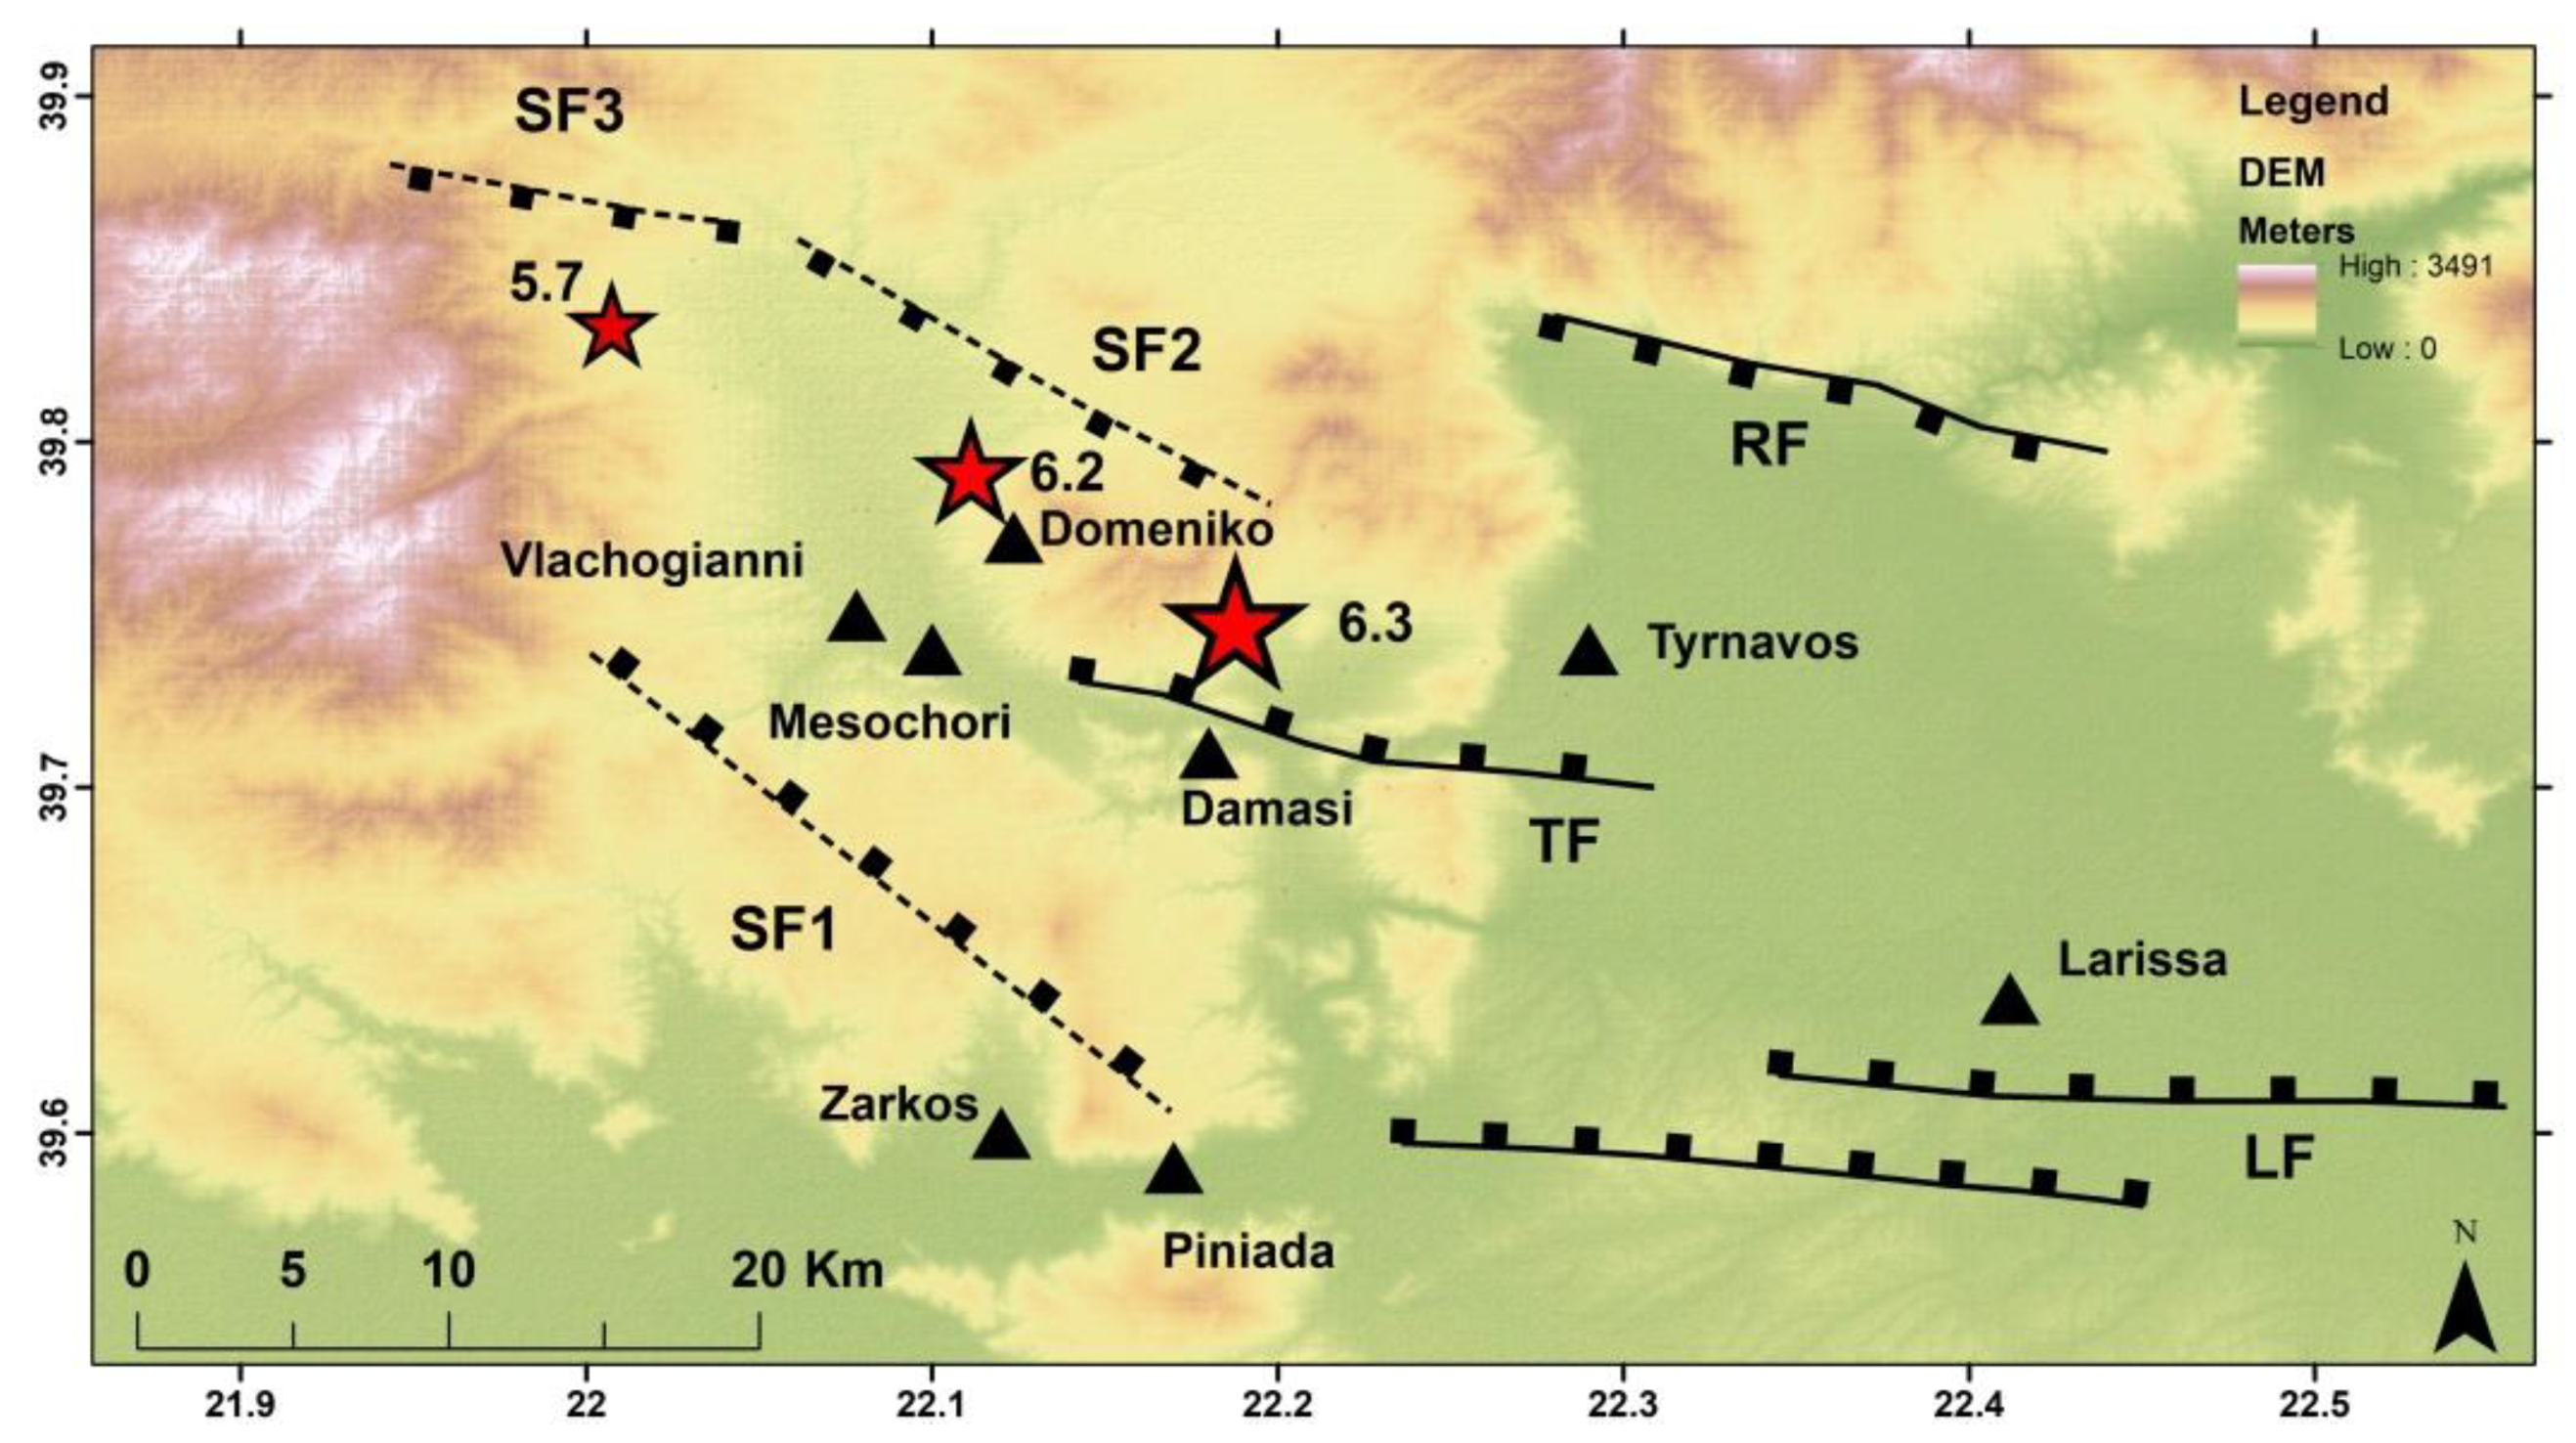
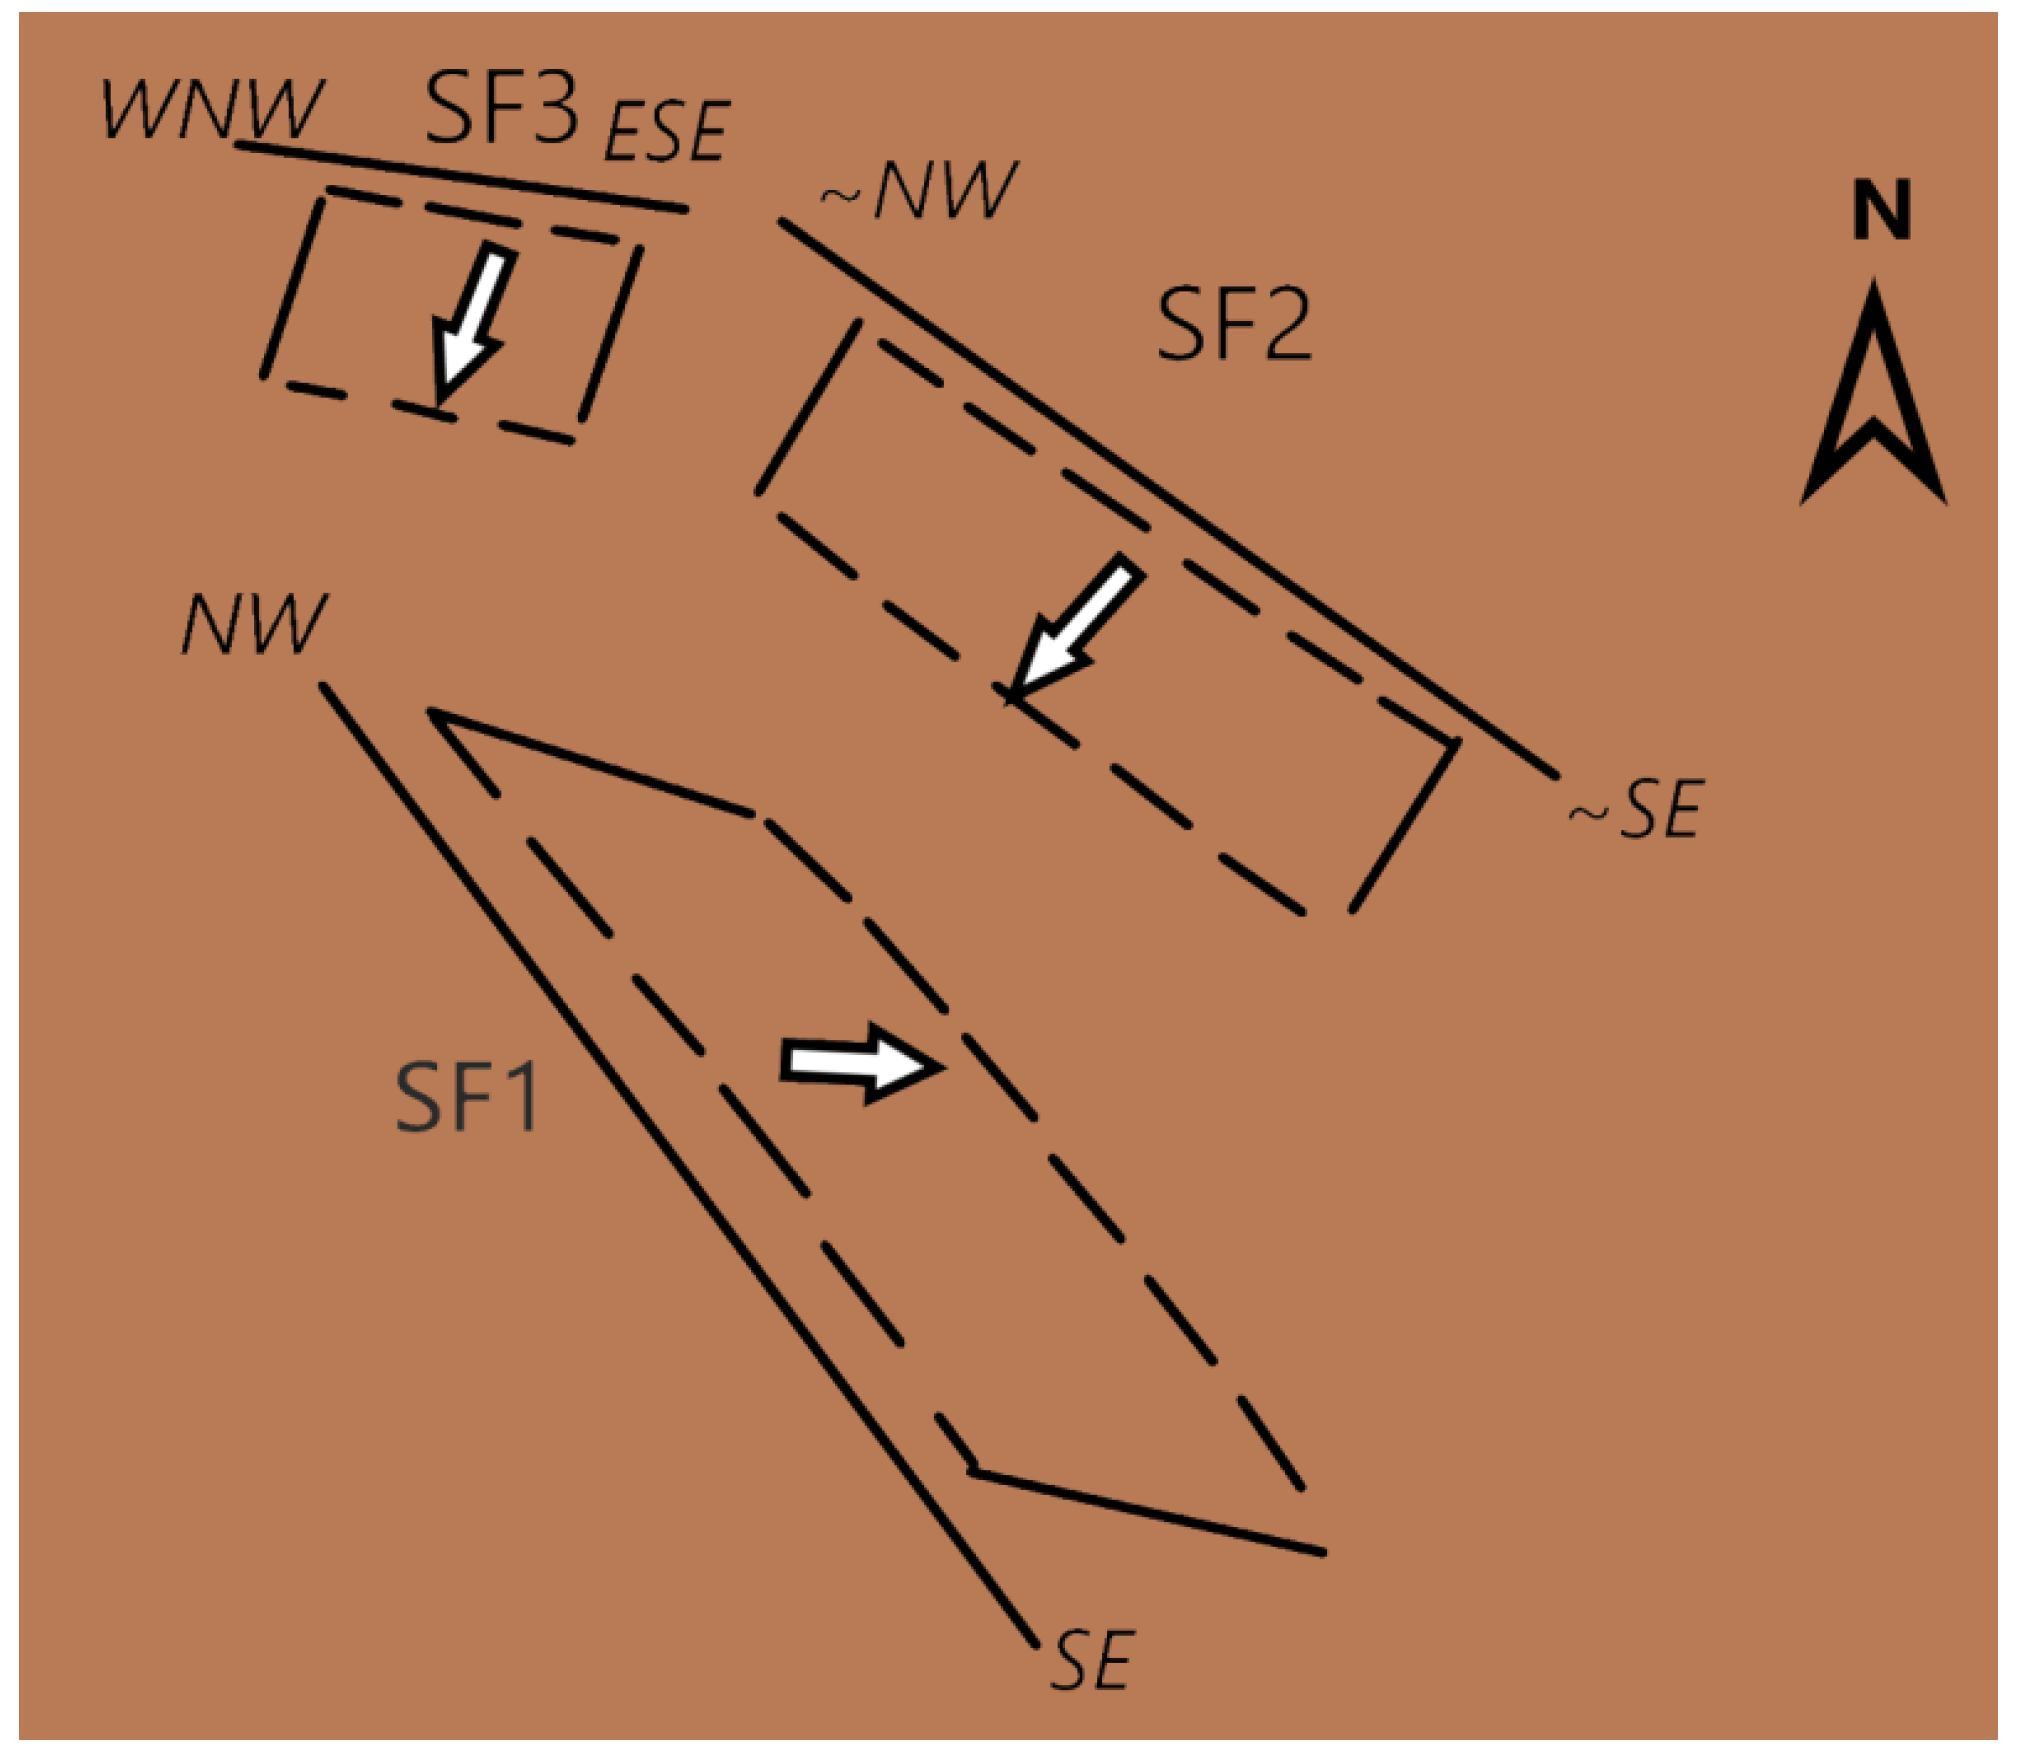
The ground deformation caused by the third seismic event of 12 March 2021 is illustrated in wrapped interferograms, in LoS displacement maps as well as in vertical and east–west decomposed displacement maps (Figure 17, Figure 18 and Figure 19). A clear pattern of three fringes forming a relative small lobe showing subsidence is evident (Figure 17). From the displacement maps the ground subsidence is estimated up to about −10 cm, while from the decomposition displacement the subsidence amplitude is estimated up to −9 cm. The comparison of LoS displacements found from the observed and modeled data shows small residuals at the southern part of the deformation domain obtained from the ascending mode (Figure 20). In the southern part of the lobe of fringes in the ascending pair (Figure 17) it is also recognized an incomplete fringe corresponding to ground uplift, which from displacement maps is measured up to 2 cm. From the decomposition displacement (Figure 18) it is measured up to 3 cm of uplift, but no displacement is observed in the west–east direction (Figure 19). However, the residuals are equal to zero at the descending mode (Figure 21). For this reason, this LoS displacement is a preferred one and indicates subsidence of ~5 cm in the central side of the deformation field and uplift of ~2.5 cm in the NE side of the deformed area.
As observed also in the case of the 4 March 2021 earthquake, the epicenter of the third earthquake falls at the north-eastern margin of the subsidence domain. This is again consistent with the small relocated (h = 4.5 km) focal depth of the earthquake. However, the average centroid depth of ~9 km falls well inside the subsidence domain.
The best-fit geodetic source solution for the earthquake of 12 March 2021 (Table 5, Figure 22) provides a seismic fault dipping to about SW with strike ESE–WNW (117°), dip angle of 45° and rake −95°. This solution is similar to the one obtained for the second earthquake of 4 March 2021 as well as to one of the two average NPs found from various seismic fault-plane solutions (Table 4). The geodetic moment (Table 5) results in magnitude Mw = 5.7, which is consistent with the Mw~5.6 determined from seismic moment tensor solutions (Table S1). Seismic slip on the fault occurred mainly in two distinct patches at depth of ~5 km the first and ~10 km the second (Figure 22). The maximum slip of ~1.0 m, however, occurred within the deeper patch, which is situated to the southwest with respect to the first.

4. Discussion

The seismotectonic implications of the results obtained from the source solutions for the first and second earthquakes are important since they imply that the fault activated with the second earthquake is subparallel and antithetic to the one associated with the first earthquake (Figure 23 and Figure 24). This is similar to the seismotectonics characterizing the strong earthquake sequence that ruptured the area of the eastern Gulf of Corinth on 24 February 1981 (Mw = 6.58), 25 February 1981 (Mw = 6.32) and again on 4 March 1981 (Mw = 6.23) (magnitudes taken from [40]) in Central Greece to the south of Thessaly province (Figure 1). During the first two 1981 earthquakes, surface fault-ruptures striking roughly WSW–ENE and dipping to ~NNW were detected, while a roughly parallel but antithetic fault was activated with the third earthquake, e.g., [41,42]. However, during March 2021 the faults activated are blind, unmapped and remained unknown so far. Complex normal fault systems that involve antithetic fault segments have been described in several cases of seismic sequences with multiple earthquake ruptures, e.g., the Kozani-Grevena (NW Greece) earthquake (Mw = 6.5) of 13 May 1995 [43], the 26 December 2003 Ban earthquake (Mw = 6.5) in Iran [44], and the Central Italy earthquakes on 24 August and 26 and 30 October 2016 (Mw = 6.1, 5.9, and 6.5) [45].
The four times less amplitude of the geodetic subsidence displacement, d, found for the second strong earthquake of 4 March (d = −10 cm), with respect to the one found for the first shock of 3 March (d = −40 cm), is better explained by a moment magnitude of 6.0 or 6.1, produced by national seismological institutes for the second earthquake (Table S1), or even by our geodetic estimation of Mw = 6.2, than by the Mw = 6.3 determined by GEOFON/GFZ, which perhaps is an overestimation.
The third earthquake of 12 March ruptured to the NW continuation of the second rupture. The comparison of LoS displacements found from the observed and modeled InSAR data shows small residuals at the southern part of the deformation domain obtained from the ascending mode (Figure 20). However, the residuals are equal to zero at the descending mode (Figure 21). For this reason, the last LoS displacement is a tentatively preferred one and indicates subsidence of ~5 cm in the central side of the deformation field and uplift of ~2.5 cm in the NE side. Our best-fit geodetic source solution for the third earthquake (strike/dip/rake: 117°/45°/−95°) is quite similar to the one obtained for the second earthquake and consistent with published moment tensor solutions (average values for one nodal plane: 106°/39°/−105°). The mean of the dip angle determined geodetically (Table 5) and from moment tensor solutions (Table 4) is 42°. A Mw = 5.7 was determined, which is consistent with the Mw = 5.6 found from moment tensor solutions, while the maximum slip of 1.0 m occurred at depth of ~10 km. However, further research is needed in the future, e.g., regarding space–time aftershocks distribution, to verify that our preferred fault geometry is a valid one. Otherwise, we do not rule out that a fault geometry similar to that associated with the first shock may fit better to the case of the 12 March aftershock.
The relocated epicenters of both the second and third earthquakes fall at the NE margin of the down-dip projection of the geodetic fault solutions. One may argue that epicentral locations shifted by a few km to SW would fit better the SW-dipping fault planes. However, such an epicentral shift requires focal depths of ~14.5 and ~11.5 km instead of the very shallow relocated hypocenters of 4.0 and 4.5 km found for the 2nd and 3rd earthquakes, respectively. However, the surface projection of the average centroid depth of ~9–10 km of these earthquakes is shifted towards SW and falls well inside the subsidence domains.
The 3 March earthquake was preceded by a short-living foreshock sequence occurring from 28 February to 3 March 2021. Most of the foreshocks occurred within the main asperity that ruptured. A different pattern was found regarding the ~6-month lasting foreshocks preceding the 25 October 2018 mainshock (Mw = 6.8), associated with the thrust-oblique-slip rupture offshore Zakynthos Isl., Ionian Sea [47]. Namely, the foreshocks bounded the mainshock asperity up-dip and at the north of it. However, the two largest imminent foreshocks (Mw = 4.1, Mw = 4.8) occurred very close to the 2018 mainshock hypocenter as happened also with the imminent foreshocks of the 3 March 2021 shock.
Our seismotectonic interpretation for the March 2021 earthquake sequence is different from the one that considers that the three earthquakes ruptured at spatially sequential segments of a normal fault system striking SE–NW and dipping NE [16]. Such a fault model requires focal depths of ~15 km to explain the position of the epicenters of the second and third earthquakes at the northeast sides of the respective surface deformation fields, a point already discussed as regards our seismotectonic model. In addition, the NE/SW uplift/subsidence pattern recognized in our geodetic results for the second and third earthquakes (Figure 13, Figure 16 and Figure 21) is better explained by the fault model proposed in this paper. However, our interpretation is consistent with the suggestion [16] that the activated fault system is clearly belonging to the Tyrnavos Graben that started forming in the middle-late Pleistocene, and whose bordering structures are still in a growing phase.

5. Conclusions

From our results we concluded that the sequence of strong earthquakes that occurred in Thessaly province, Central Greece, during March 2021 was produced by a quite complicated rupture process. The three strong earthquakes of the 3, 4 and 12 March 2021, were associated with three main blind, unmapped and unknown so far fault segments of nearly pure normal faulting with a small strike-slip component. The entire system of normal fault segments activated forms a graben-like structure. The first earthquake of 4 March (Mw = 6.3) was produced by a fault segment striking SE-NW and dipping towards NE. With the strong earthquake of 4 March (Mw = 6.2) the rupture propagated further NW but in an antithetic fault segment dipping ~SW and striking ~SE–NW. A segment of possibly the same fault, striking ESE–WNW was ruptured with the strong earthquake (Mw = 5.7) of 12 March. The new findings shed light in the Thessaly seismotectonics, particularly in the north side of this area, which remained seismically silent since AD 1781. The new knowledge acquired provides important insights for the better assessment of the seismic hazard level in the area.

Supplementary Materials

The following are available online at https://0-www-mdpi-com.brum.beds.ac.uk/article/10.3390/geosciences11080311/s1, Table S1: Source parameters of the three strongest earthquakes recorded in Thessaly area during March 2021; Table S2: Geometric features of the two nodal planes determined in moment tensor solutions produced by several seismological centers for the three strong earthquakes; Table S3: Specifications of the Sentinel-1 SAR SLC images used in our InSAR analysis; Table S4: Master and slave scenes forming interferometric pairs used to detect and measure deformation of the three earthquake events.

Author Contributions

Conceptualization, E.L., G.A.P. and I.P.; methodology, G.A.P. and I.P.; software, A.A., A.K. and I.T.; data curation, A.A., A.K. and I.T.; writing—original draft preparation, G.A.P., A.A., A.K. and I.T.; writing—review and editing, all; supervision, G.A.P. All authors have read and agreed to the published version of the manuscript.

Funding

This research received no external funding.

Institutional Review Board Statement

Not applicable.

Informed Consent Statement

Not applicable.

Data Availability Statement

https://scihub.copernicus.eu/, accessed on 7 June 2021.

Acknowledgments

This paper is a contribution to the Post-Graduate Program “Environmental, Disaster, and Crises Management Strategies”, Department of Dynamic, Tectonic and Applied Geology, Faculty of Geology and Geoenvironment, National and Kapodistrian University of Athens, Greece. We are thankful to the three anonymous reviewers for their comments that contributed to improve the initial submission. Maps have been produced with the use of ArcMap 10.1 and Generic Mapping Tools-GMT 5 [48].

Conflicts of Interest

The authors declare no conflict of interest.

References

  1. Lekkas, E.; Agorastos, K.; Mavroulis, S.; Kranis, H.; Skourtsos, E.; Carydis, P.; Gogou, Μ.; Katsetsiadou, K.N.; Papadopoulos, G.; Triantafyllou, I.; et al. The early March 2021 Thessaly (Greece) earthquake sequence. Newsl. Environ. Disaster Crises Manag. Strateg. 2021, 22, 1–195. [Google Scholar] [CrossRef]
  2. Caputo, R. Geological and structural study of the recent and active brittle deformation of the Neogene-Quaternary Basins of Thessaly (Central Greece). Aristotle Univ. Thessalon. Sci. Ann. 1990, 2, 252. [Google Scholar]
  3. Caputo, R. Morphotectonics and kinematics along the Tirnavos Fault, northern Larissa Plain, mainland Greece. Zeit. Für Geomorph. 1993, 94, 167–185. [Google Scholar]
  4. Caputo, R.; Pavlides, S. Late Cainozoic geodynamical evolution of Thessaly and surroundings (central-northern Greece). Tectonophysics 1993, 223, 339–362. [Google Scholar] [CrossRef]
  5. Caputo, R.; Helly, B.; Pavlides, S.; Papadopoulos, G. Palaeoseismological investigation of the Tyrnavos Fault (Thessaly, Central Greece). Tectonophysics 2004, 394, 1–20. [Google Scholar] [CrossRef]
  6. Caputo, R.; Helly, B.; Pavlides, S.; Papadopoulos, G.A. Archaeo-and palaeoseismological investigations in Northern Thessaly (Greece): Insights for the seismic potential of the region. Nat. Hazards 2006, 39, 195–212. [Google Scholar] [CrossRef]
  7. Tsodoulos, I.; Stamoulis, K.; Caputo, R.; Koukouvelas, I.; Chatzipetros, A.; Pavlides, S.; Gallousi, C.; Papachristodoulou, C.; Ioannides, K. Middle-Late Holocene earthquake history of the Gyrtoni Fault, Central Greece: Insight from optically stimulated luminescence (OSL) dating and paleoseismology. Tectonophysics 2016, 687, 14–27. [Google Scholar] [CrossRef]
  8. Caputo, R.; Chatzipetros, A.; Pavlides, S.; Sboras, S. The Greek Database of Seismogenic Sources (GreDaSS): State-of-the-art for northern Greece. Ann. Geophys. 2013, 55, 859–894. [Google Scholar] [CrossRef]
  9. Papadopoulos, G.A. Rupture zones of strong earthquakes in the Thessalia region, Central Greece. In Proceedings of the XXIII General Assembly, European Seismological Commission, Prague, Czech Republic, 7–12 September 1992; Geophysical Institute, Czechoslovak Academy of Science: Prague, Czech Republic, 1993; pp. 337–340. [Google Scholar]
  10. Papadopoulos, G.A. Tectonic and seismic processes of various space and time scales in the Greek area. In Recent Evolution and Seismicity of the Mediterranean Region; Boschi, E., Mantovani, E., Morelli, A., Eds.; Kluwer: Dordrecht, The Netherlands, 1993; pp. 239–249. [Google Scholar]
  11. Caputo, R. A possible seismic gap of Northern Thessaly, Greece, as inferred from geological data. Bull. Geol. Soc. Greece 1994, 30, 263–272. [Google Scholar]
  12. Caputo, R. Inference of a Seismic Gap from Geological Data: Thessaly (Central Greece) as a Case Study. Ann. Geophys. 1995, 38, 1–19. Available online: https://www.annalsofgeophysics.eu/index.php/annals/article/view/4127 (accessed on 29 May 2021). [CrossRef]
  13. Papadimitriou, E.; Karakostas, V. Episodic occurrence of strong (Mw≥6.2) earthquakes in Thessalia area (central Greece). Earth Planet Sci. Lett. 2003, 215, 395–409. [Google Scholar] [CrossRef]
  14. Caputo, R. Comment on “Episodic occurrence of strong (Mw≥6.2) earthquakes in Thessalia area (central Greece)” by EE Papadimitriou and VG Karakostas [Earth Planet. Sci. Lett. 215 (2003) 395–409]. Earth Planet Sci. Lett. 2004, 231, 347–352. [Google Scholar] [CrossRef]
  15. Papadimitriou, E.; Karakostas, V. Occurrence patterns of strong earthquakes in Thessalia area (Greece) determined by the stress evolutionary model. Earth Planet Sci. Lett. 2005, 235, 766–770. [Google Scholar] [CrossRef]
  16. Tolomei, C.; Caputo, R.; Polcari, M.; Famiglietti, N.A.; Maggini, M.; Stramondo, S. The Use of Interferometric Synthetic Aperture Radar for Isolating the Contribution of Major Shocks: The Case of the March 2021 Thessaly, Greece, Seismic Sequence. Geosciences 2021, 11, 191. [Google Scholar] [CrossRef]
  17. Pavlides, S.; Chatzipetros, A.; Sboras, S.; Kremastas, E.; Chatziioannou, A. The Northern Thessaly Strong Earthquakes of March 3 and 4 and Their Neotectonic Setting; Earthquake Geology Team, Aristotle University Thessaloniky: Thessaloniky, Greece, 2021; p. 10. Available online: http://eqgeogr.weebly.com/ (accessed on 7 June 2021).
  18. Papadopoulos, G.A.; Lefkopoulos, A. Magnitude-distance relations for liquefaction in soil from earthquakes. Bull. Seism. Soc. Am. 1993, 83, 925–938. [Google Scholar]
  19. Lomax, A.; Virieux, J.; Volant, P.; Berge-Thierry, C. Probabilistic earthquake location in 3D and layered models. In Advances in Seismic Event Location, 1st ed.; Thurber, C.H., Rabinowitz, N., Eds.; Springer: Dordrecht, The Netherlands, 2000; pp. 101–134. [Google Scholar] [CrossRef]
  20. Lomax, A.A.; Michelini, A.; Curtis, A. Earthquake Location, Direct, Global-Search Methods. In Encyclopedia of Complexity and System Science, 2nd ed.; Meyers, R.A., Ed.; Springer: New York, NY, USA, 2014; pp. 1–33. [Google Scholar] [CrossRef]
  21. Tarantola, A.; Valette, B. Generalized nonlinear inverse problems solved using the least squares criterion. Rev. Geophys. 1982, 20, 219–232. [Google Scholar] [CrossRef]
  22. Karastathis, V.K.; Papoulia, J.; Di Fiore, B.; Makris, J.; Tsambas, A.; Stampolidis, A.; Papadopoulos, G.A. Deep structure investigations of the geothermal field of the North Euboean Gulf, Greece, using 3-D local earthquake tomography and Curie Point Depth analysis. J. Volcanol. Geotherm. Res. 2011, 206, 106–120. [Google Scholar] [CrossRef]
  23. Karastathis, V.K.; Mouzakiotis, E.; Ganas, A.; Papadopoulos, G.A. High-precision relocation of seismic sequences above a dipping Moho: The case of the January-February 2014 seismic sequence on Cephalonia island (Greece). Solid Earth 2015, 6, 173–184. [Google Scholar] [CrossRef] [Green Version]
  24. Hartzell, S.H.; Heaton, T.H. Inversion of strong ground motion and teleseismic waveform data for the fault rupture history of the 1979 Imperial Valley, California, earthquake. Bull. Seismol. Soc. Am. 1983, 73, 1553–1583. [Google Scholar] [CrossRef]
  25. Hartzell, S.H.; Liu, P.; Mendoza, C. The 1994 Northridge, California earthquake: Investigation of rupture velocity, rise time and high-frequency radiation. J. Geophys. Res. 1996, 101, 20091–20108. [Google Scholar] [CrossRef]
  26. Mendoza, C.; Hartzell, S.H. Finite-Fault Source Inversion Using Teleseismic P Waves: Simple Parameterization and Rapid Analysis. Bull. Seism. Soc. Am. 2013, 103, 834–844. [Google Scholar] [CrossRef]
  27. Papadopoulos, G.A.; Agalos, A.; Charalampakis, M.; Kontoes, C.; Papoutsis, I.; Atzori, S.; Svigkas, S.; Triantafyllou, I. Fault models for the Bodrum-Kos tsunamigenic earthquake (Mw6.6) of 20 July 2017 in the east Aegean Sea. J. Geodyn. 2019, 131. [Google Scholar] [CrossRef]
  28. Langston, C.A.; Helmberger, D.V. A procedure for modeling shallow dislocation sources. Geophys. J. Royal. Astron. Soc. 1975, 42, 117–130. [Google Scholar] [CrossRef] [Green Version]
  29. Heaton, T. The 1971 San Fernando earth quake: A double event? Bull. Seism. Soc. Am. 1982, 72, 2037–2062. [Google Scholar] [CrossRef]
  30. Bamler, R.; Hartl, P. Synthetic aperture radar interferometry. In Inverse Problems; IOP Publishing Limited: Bristol, UK, 1998. [Google Scholar]
  31. Massonnet, D.; Rossi, M.; Carmona, C.; Adragna, F.; Peltzer, G.; Feigl, K.; Rabaute, T. The displacement field of the Landers earthquake mapped by radar interferometry. Nature 1993, 364, 138–142. [Google Scholar] [CrossRef]
  32. Zebker, H.A.; Rosen, P.A.; Goldstein, R.M.; Gabriel, A.; Werner, C.L. On the derivation of coseismic displacement fields using differential radar interferometry: The Landers earthquake. J. Geophys. Res. 1994, 99, 19617–19634. [Google Scholar] [CrossRef]
  33. Massonnet, D.; Feigl, K.L. Radar interferometry and its application to changes in the earth’s surface. Rev. Geophys. 1998, 36, 441–500. [Google Scholar] [CrossRef] [Green Version]
  34. Bally, P. Satellite Earth Observation for Geohazard Risk Management—The Santorini Conference, Santorini, Greece, 21–23 May 2012; ESA Publ. STM-282; European Space Agency: Paris, France, 2014. [Google Scholar] [CrossRef]
  35. Wright, T.J.; Parsons, B.E.; Lu Toward, Z. Mapping surface deformation in three dimensions using InSAR. Geophys. Res. Lett. 2004, 31, L01607. [Google Scholar] [CrossRef] [Green Version]
  36. Raucoules, D.; De Michele, M.; Malet, J.-P.; Ulrich, P. Time-variable 3D ground displacements from high-resolution synthetic aperture radar (SAR). Application to La Valette landslide (South French Alps). Remote Sens. Environ. 2013, 139, 198–204. [Google Scholar] [CrossRef] [Green Version]
  37. SARmapModeling Tutorial 2020, Version 5.5.3. p. 24. Available online: https://www.sarmap.ch/tutorials/ModelingTutorial_v553.pdf (accessed on 27 March 2021).
  38. Okada, Y. Internal deformation due to shear and tensile faults in a half-space. Bull. Seism. Soc. Am. 1992, 82, 1018–1040. [Google Scholar]
  39. Costantini, M. A novel phase unwrapping method based on network programming. IEEE Trans. Geosci. Remote Sens. 1998, 36, 813–821. [Google Scholar] [CrossRef]
  40. International Seismological Centre. ISC-GEM Earthquake Catalogue; ISC: Berkshire, UK, 2021. [Google Scholar] [CrossRef]
  41. Jackson, J.A.; Gagnepain, J.; Houseman, G.; King, G.C.P.; Papadimitriou, P.; Soufleris, C.; Virieux, J. Seismicity, normal faulting and the geomorphological development of the Gulf of Corinth (Greece): The Corinth earthquakes of February and March 1981. Earth Planet. Sci. Lett. 1982, 57, 377–397. [Google Scholar] [CrossRef]
  42. Hubert, A.; King, G.C.P.; Mayer, B.; Papanastasiou, D. Fault re-activation, stress interaction and rupture propagation of the 1981 Corinth earthquake sequence. Earth Planet Sci. Lett. 1996, 142, 573–585. [Google Scholar] [CrossRef] [Green Version]
  43. Resor, P.G.; Pollard, D.D.; Wright, T.J.; Beroza, G.C. Integrating high-precision aftershock locations and geodetic observations to model coseismic deformation associated with the 1995 Kozani-Grevena earthquake, Greece. J. Geophys. Res. 2005, 110, B09402. [Google Scholar] [CrossRef] [Green Version]
  44. Parcharidis, I.; Zare, M.; Foumelis, M.; Lagios, E. Seismotectonic investigation on the Bam earthquake prone area (Iran) based on ASAR interferometry. In Proceedings of the 2nd International Conference Recent Advances Space Technologies, Istanbul, Turkey, 9–11 June 2005; pp. 673–677. [Google Scholar] [CrossRef]
  45. Cheloni, D.; De Novellis, V.; Albano, M.; Antonioli, A.; Anzidei, M.; Atzori, S.; Avallone, A.; Bignami, C.; Bonano, M.; Calcaterra, S. Geodetic model of the 2016 Central Italy earthquake sequence inferred from InSAR and GPS data. Geophys. Res. Lett. 2017, 44, 6778–6787. [Google Scholar] [CrossRef]
  46. Wells, D.L.; Coppersmith, K.J. New empirical relationships among magnitude, rupture length, rupture width, rupture area, and surface displacement. Bull. Seism. Soc. Am. 1994, 84, 974–1002. [Google Scholar]
  47. Papadopoulos, G.A.; Agalos, A.; Minadakis, G.; Triantafyllou, I.; Krassakis, P. Short-Term Foreshocks as Key Information for Mainshock Timing and Rupture: The Mw6.8 25 October 2018 Zakynthos Earthquake, Hellenic Subduction Zone. Sensors 2020, 20, 5681. [Google Scholar] [CrossRef] [PubMed]
  48. Wessel, P.; Smith, W.H.F.; Scharroo, R.; Luis, J.; Wobbe, F. Generic Mapping Tools: Improved Version Released. EOS Trans. AGU 2013, 94, 409–410. [Google Scholar] [CrossRef] [Green Version]
Figure 1. The Thessaly area, Central Greece, that ruptured by three strong earthquakes on 3, 4 and 12 March 2021 with magnitudes, Mw, of 6.3, 6.2 and 5.7, respectively, as determined in this study; stars show strong earthquake epicenters relocated in the present study. Blue and purple colored circles illustrate foreshocks and aftershocks occurring from 28 February to 3 March and from 3 to 15 March, respectively (epicentral determinations by NOA, http://www.gein.noa.gr/en/seismicity/earthquake-catalogs, last access 25 May 2021). Black lines and black triangles show the main normal faults in the area [2,3,4,5,6,7,8] and settlements reported in the main text, respectively; fault name codes: LF = Larissa Fault, TF = Tyrnavos Fault, RF = Rodia Fault. In the inset map, arrows illustrate directions of main lithospheric motions; thick and thin rectangles show the study area and the east Corinth Gulf area, respectively, the last one discussed in the main text.
Geosciences 11 00311 g001
Figure 2. Epicenters (black stars), dates and magnitudes of strong historical earthquakes that occurred in Thessaly province and are mentioned in the text. Epicenters of the strong earthquakes of the 3, 4 and 12 March 2021 are shown by red (NOA’s epicenters) and blue (relocated by epicenters) stars. NOA’s epicenter of the third earthquake is not shown since it is nearly identical with the relocated one. Positions (green triangles) and code names of the stations used for relocation are also plotted. Beach-balls show the fault-plane solutions of the three 2021 earthquakes produced by the GEOFON/GFZ system.
Geosciences 11 00311 g002
Figure 3. (a,b). Soil liquefaction observed after the 3 March 2021 Mw = 6.3 earthquake near the Pinior river bank, a few km east of Piniada village (see location in Figure 1).
Geosciences 11 00311 g003
Figure 4. Geographic distribution of the teleseismic stations at epicentral distances (30° < Δ < 90°) from where P-wave records of the 3 March 2021 earthquake were used; beach-ball shows the earthquake focal mechanism.
Geosciences 11 00311 g004
Figure 5. Scaled fit between real waveforms (blue lines) and synthetics (red lines) for the 30 stations; station name (e.g., TIXI), station epicentral distance in degrees (Dis.) and azimuth (Az.) are also shown.
Geosciences 11 00311 g005
Figure 6. Snapshots showing the space–time evolution of slip upon the fault which is striking at 138° and dipping northeast; star denotes the hypocenter, fault plane dimension is in km, slip contours are in m. Slip amplitude in m is shown in color and the motion direction, i.e., the rake angle, of the hanging wall relative to the footwall, is indicated with red arrows showing direction and amplitude of slip.
Geosciences 11 00311 g006
Figure 7. Moment rate function of the 3 March 2021 earthquake of Mw = 6.3.
Geosciences 11 00311 g007
Figure 8. Horizontal projection of the slip distribution for the 3 March rupture. Stars from SE to NW show relocated epicenters of the first, second and third earthquakes; magnitudes determined in this study (see later sections). Black circles illustrate foreshocks recorded from 28th February to 3 March 2021; epicenters are from NOA’s determinations (http://bbnet.gein.noa.gr/HL/databases/database, accessed on 15 May 2021).
Geosciences 11 00311 g008
Figure 9. (a) Wrapped interferogram and (b) LoS displacement for the first seismic event of 3 March 2021 from master and slave images taken in ascending mode on 25 February 2021 and 3 March 2021, respectively; star shows relocated epicenter.
Geosciences 11 00311 g009
Figure 10. Comparison of LoS displacements from observed and modeled data for the first earthquake (3 March 2021) using the ascending mode.
Geosciences 11 00311 g010
Figure 11. Modelled geodetic seismic fault for the first shock of 3 March 2021 in (a) 3D illustration and (b) vertical profile along strike (SE–NW).
Geosciences 11 00311 g011
Figure 12. (a) Wrapped interferogram and (b) LoS displacement for the second seismic event of 4 March 2021 from master and slave images taken in ascending mode on 3 March 2021 and 9 March 2021, respectively; star shows relocated epicenter.
Geosciences 11 00311 g012
Figure 13. Comparison of LoS displacements from observed and modeled data for the second earthquake (4 March 2021) using the ascending mode.
Geosciences 11 00311 g013
Figure 14. Modelled geodetic seismic fault for the earthquake of 4 March 2021 in (a) 3D illustration and (b) vertical profile along strike (ESE–WNW).
Geosciences 11 00311 g014
Figure 15. Wrapped interferograms for both the 3 and 4 March 2021 earthquakes: (a) ascending and (b) descending modes. Stars show the relocated epicenters; magnitudes according to our geodetic determinations.
Geosciences 11 00311 g015
Figure 16. Displacements in (a) vertical and (b) east–west directions for both the 3 and 4 March 2021 earthquakes. Stars and magnitudes as in Figure 15.
Geosciences 11 00311 g016
Figure 17. Earthquake of 12 March 2021: Wrapped interferograms in (a) ascending (9 March 2021 master and 15 March 2021 slave image) and (b) descending (8 March 2021 master and 14 March 2021 slave image) mode; star illustrates the relocated epicenter.
Geosciences 11 00311 g017
Figure 18. Earthquake of 12 March 2021: (a) LoS displacement in ascending mode (9 March 2021 master and 15 March 2021 slave image), (b) LoS displacement in descending mode (8 March 2021 master and 14 March 2021 slave image); star illustrates the relocated epicenter.
Geosciences 11 00311 g018
Figure 19. Earthquake of 12 March 2021: (a) vertical displacement, (b) east–west displacement; star illustrates relocated epicenter.
Geosciences 11 00311 g019
Figure 20. Comparison of LoS displacements from observed and modeled data for the third earthquake (12 March 2021) using the ascending mode.
Geosciences 11 00311 g020
Figure 21. Comparison of LoS displacements from observed and modeled data for the third earthquake (12 March 2021) using the descending mode.
Geosciences 11 00311 g021
Figure 22. Modeled geodetic seismic fault for the earthquake of 12 March 2021 in (a) 3D illustration and (b) vertical profile along strike (ESE–WNW).
Geosciences 11 00311 g022
Figure 23. Inferred surface projections of the blind seismic faults that activated with the 3 (SF1, Zarkos Fault), 4 (SF2, Domeniko Fault) and 12 March 2021 (SF3, Kalivia Fault) earthquakes according to our interpretation of the combined seismic and geodetic analysis. Strikes and dip angles of SF1, SF2, SF3 were adopted as the respective averages of strikes and dip angles calculated from the different methods (Table 4 and Table 5): 314°/41° for SF1, 123°/44° for SF2, 112°/42° for SF3. Positions of the three faults were adopted by taking into account the fault models, resulted from the inversion of teleseismic P waveforms and of InSAR data, as well as the respective relocated focal depth (Table 3) and the average dip angle for each fault. Lengths of about 23, 17 and 11 km were calculated for SF1, SF2 and SF3, respectively, by taking into account rupture lengths determined from our seismic and geodetic fault models (Figure 8, Figure 11, Figure 14 and Figure 22) and a worldwide empirical relationship between subsurface rupture length and magnitude found for normal earthquakes [46]. Εpicenters (stars) and magnitudes of the strong earthquakes of 3, 4 and 12 March 2021, as well as of the main faults (black lines) in the Thessaly area, as in Figure 1.
Geosciences 11 00311 g023
Figure 24. Not-in-scale 3D cartoon that illustrates the three normal seismic fault (SF) segments that activated with the earthquakes of the 3 (SF1), 4 (SF2) and 12 March (SF3) 2021.
Geosciences 11 00311 g024
Table 1. Specifications of the seismic velocity model used; Vp and Vs are velocities of P and S waves, respectively; D is layer thickness.
Vp (km/s)Vs (km/s)D (km)
2.91.680.00
4.52.601.50
5.83.354.00
6.13.527.00
6.33.6412.00
6.83.9318.00
Table 2. Best fit model parameters for the fault plane. L: fault length, H: depth of faulting, v: rupture velocity, h: focal depth of centroid, Mo: seismic moment (N*m), Mw: moment magnitude. Dip direction of the fault is to northeast, rake is calculated at the main slip patch of the fault (see text).
StrikeDipRakeL (km)H (km)v (km/s)h (km)MoMw
312°45°−95°32.5162.7123.5 × 10186.3
Table 3. Relocated hypocenters for the three strong earthquakes.
DateTime (UTC)Lat (φοΝ)Long (λοΕ)Depth (km)MwGap°Erz (km)Erh (km)
DD.MM.YYYYHH:MM:SS
3.3.202110:16:0839.741722.185410.56.3591.00.68
4.3.202118:38:1939.786922.11684.06.2560.670.76
12.3.202112:57:5039.837422.01144.55.7410.50.54
Table 4. Average (Av) geometric features of the nodal planes (NPs) determined in fault-plane solutions produced by several national and international seismological centers (see Table S2) for the three strong earthquakes.
DateTimeNPAv Strike (°)Av Dip (°)Av Rake (°)
DD.MM.YYYYHH:MM:SS
3.3.202110:16:081130 ± 949 ± 7−93 ± 11
2314 ± 748 ± 8−88 ± 12
4.3.202118:38:191125 ± 13 46 ± 10−91 ± 2
2303 ± 1644 ± 10−90 ± 2
12.3.202112:57:501106 ± 939 ± 7−105 ± 16
2304 ± 1154 ± 8−80 ± 11
Table 5. Seismic source solutions determined from InSAR analysis for the three strong earthquakes of March 2021.
DateTimeStrike (°)Dip (°)Rake (°)Moment (×1018 N*m)MwMaximum Slip (m)
DD.MM.YYYYHH:MM:SS
3.3.202110:16:0831730−1103.026.31.5
4.3.202118:38:1911640−1012.086.21.2
12.3.202112:57:5011745−950.375.71.0
Publisher’s Note: MDPI stays neutral with regard to jurisdictional claims in published maps and institutional affiliations.

