Article

Sediment-Peridotite Reaction Controls Fore-Arc Metasomatism and Arc Magma Geochemical Signatures

by
Michael W. Förster
1,2,*,
Yannick Bussweiler
3,4,
Dejan Prelević
5,
Nathan R. Daczko
1,
Stephan Buhre
5,
Regina Mertz-Kraus
5 and
Stephen F. Foley
1,2
1
Department of Earth and Environmental Sciences, Macquarie University, Sydney 2109, Australia
2
Research School of Earth Sciences, Australian National University, Canberra 0200, Australia
3
TOFWERK AG, 3600 Thun, Switzerland
4
Institut für Mineralogie, Universität Münster, 48149 Münster, Germany
5
Institut für Geowissenschaften, Johannes-Gutenberg-Universität, 55099 Mainz, Germany
*
Author to whom correspondence should be addressed.
Submission received: 30 July 2021 / Revised: 26 August 2021 / Accepted: 30 August 2021 / Published: 3 September 2021

Abstract

:
Subduction of oceanic crust buries an average thickness of 300–500 m of sediment that eventually dehydrates or partially melts. Progressive release of fluid/melt metasomatizes the fore-arc mantle, forming serpentinite at low temperatures and phlogopite-bearing pyroxenite where slab surface reaches 700–900 °C. This is sufficiently high to partially melt subducted sediments before they approach the depths where arc magmas are formed. Here, we present experiments on reactions between melts of subducted sediments and peridotite at 2–6 GPa/750–1100 °C, which correspond to the surface of a subducting slab. The reaction of volatile-bearing partial melts derived from sediments with depleted peridotite leads to separation of elements and a layered arrangement of metasomatic phases, with layers consisting of orthopyroxene, mica-pyroxenite, and clinopyroxenite. The selective incorporation of elements in these metasomatic layers closely resembles chemical patterns found in K-rich magmas. Trace elements were imaged using LA-ICP-TOFMS, which is applied here to investigate the distribution of trace elements within the metasomatic layers. Experiments of different duration enabled estimates of the growth of the metasomatic front, which ranges from 1–5 m/ky. These experiments explain the low contents of high-field strength elements in arc magmas as being due to their loss during melting of sedimentary materials in the fore-arc.

1. Introduction

In the plate tectonic cycle, oceanic crust is continuously subducted and remixed into the mantle. Along with basaltic oceanic crust, a layer of sediments with highly variable thickness (up to 300–500 m) is recycled to mantle depths [1]. Rising pressure and temperature during burial drives progressive metamorphism of the sediments and hydrothermally altered oceanic crust, causing the release of fluids [2]. Partial melting of the subducted sedimentary material begins at temperatures >675 °C, depending on the pressure and chemical composition of the sediment [3,4]. Partial melts of the subducted and metamorphosed sedimentary rocks eventually separate from their source, rise, react with, and hybridize the mantle wedge beneath arcs to generate subduction-related magmatism [5]. These arc magmas are generally known for their strong depletion in high field strength elements (HFSE), which is commonly attributed to residual rutile during sediment de-volatilization, trace element filtering by amphibole in the mantle wedge [6], mantle-magma interaction [7], or multiple melt-depletion events [8].
A plethora of studies have been conducted on subduction zone and arc magmatism that can be summarized as showing that the mantle wedge beneath arcs can be divided into three domains (Figure 1). First, the cool region of the fore-arc mantle is metasomatized by hydrous fluids to form serpentinite, as evident from geophysical studies and the abundance of serpentinite in fore-arc seamounts [9,10,11,12] (D, Figure 1A). Second, the deeper, hotter part of the fore-arc mantle contains phlogopite-bearing pyroxenites, formed by infiltration and reaction of sediment-derived hydrous melts that can be activated through slab-rollback [13]. Finally, arc magma forms by flux-melting of peridotite within the convecting asthenospheric mantle wedge (Figure 1A).
Many studies have suggested that phlogopite will be stabilized within the mantle wedge [14,15,16,17,18], but the extent of this metasomatized zone remains unclear. These phlogopite-bearing pyroxenites are a likely source for post-collisional lavas of exotic potassic to ultrapotassic composition which are strongly enriched in large ion lithophile elements (LILE), high field strength elements (HFSE), and rare earth elements (REE) [19,20,21,22]. The formation of phlogopite pyroxenites within the fore-arc mantle is reported from Mexico [23] and is probably a common phenomenon in subduction zones [14], though only visible when activity shifts from the arc into the fore-arc and potassic magmas are erupted.
Most studies have focused on the magmatic arc (Figure 1A), where models suggest magmas are formed either by melting of peridotite fluxed by volatiles and melts of sediments [24,25,26] or mélange [5]. While high-pressure studies [5] reproduce the low HFSE contents of arc magmas by concentrating these elements in an HFSE-enriched residue, experimental designs have not considered the loss of trace elements during fore-arc metamorphism and metasomatism that occurs before the sediment and/or mélange component reaches the sub-arc zone. Eclogites depleted in LILE, HFSE, and LREE have been reported [27] and interpreted as residues of fluid metasomatism beneath the volcanic arc. However, the occurrence of LILE, HFSE, and REE-enriched ultrapotassic magmas [13,23] sourced from the metasomatized fore-arc mantle, strongly suggest that subducted sedimentary components experience depletion of these elements before they reach the common depths of arc magma sources (100–130 km) [2]. Therefore, the sediment-derived components of arc magmas are supplied by the residues of partially melted sediments and not the unmodified sediments as commonly assumed. This focuses attention on a gap in earlier research indicated by a ‘?’ in Figure 1, namely experiments on the interaction between sedimentary rocks and peridotite in the fore-arc of subduction zones where pressures <3 GPa and temperatures below the wet solidus of peridotite (1000 °C, [28]) prevail. Depending on the rate of subduction and the age of the subducting crust, slab-surface temperatures reach >675 °C in the fore-arc (white arrow, Figure 1) [18,29], and therefore, subducted sedimentary components may partially devolatilize and melt to infiltrate and metasomatize the lithospheric mantle in the fore-arc. Element fractionation during these fore-arc processes will change the fundamental geochemical character of the sedimentary component that proceeds to depths where arc magmas form.
Figure 1. Cross section of a subduction zone and the region of fore-arc mantle metasomatism. (A) A–D show pathways of fluid migration at >30 km in front of the volcanic zone as evident from magnetotelluric observations. Reprinted by permission from Springer Nature, Nature, Pathway from subducting slab to surface for melt and fluids beneath Mount Rainier [30] ©2014. (B) At >675 °C [4] (white arrow), sediment-derived volatile-bearing partial melts of dacitic-rhyolitic composition (Figure 2) infiltrate the lithospheric fore-arc mantle at the location of the ‘?’ in front of the wet solidus isotherm of peridotite (blue line, [28]). Arc magmas form in the hot part of the mantle wedge (A) where temperatures are high enough to allow for the fluid- and sediment-fluxed (black arrow) melting of the asthenosphere.
Geosciences 11 00372 g001
In this study, we employ the novel technique of laser ablation-inductively coupled plasma-time of flight-mass spectrometry (LA-ICP-TOFMS) element mapping to visualize and quantify the redistribution of trace elements in high-pressure experiments [31]. The experiments simulate sediment subduction and subduction-related metasomatism within the fore-arc before the sediment enters arc magmatic processes. The trace element mapping has been conducted mainly on well pre-characterized published experiments [32,33,
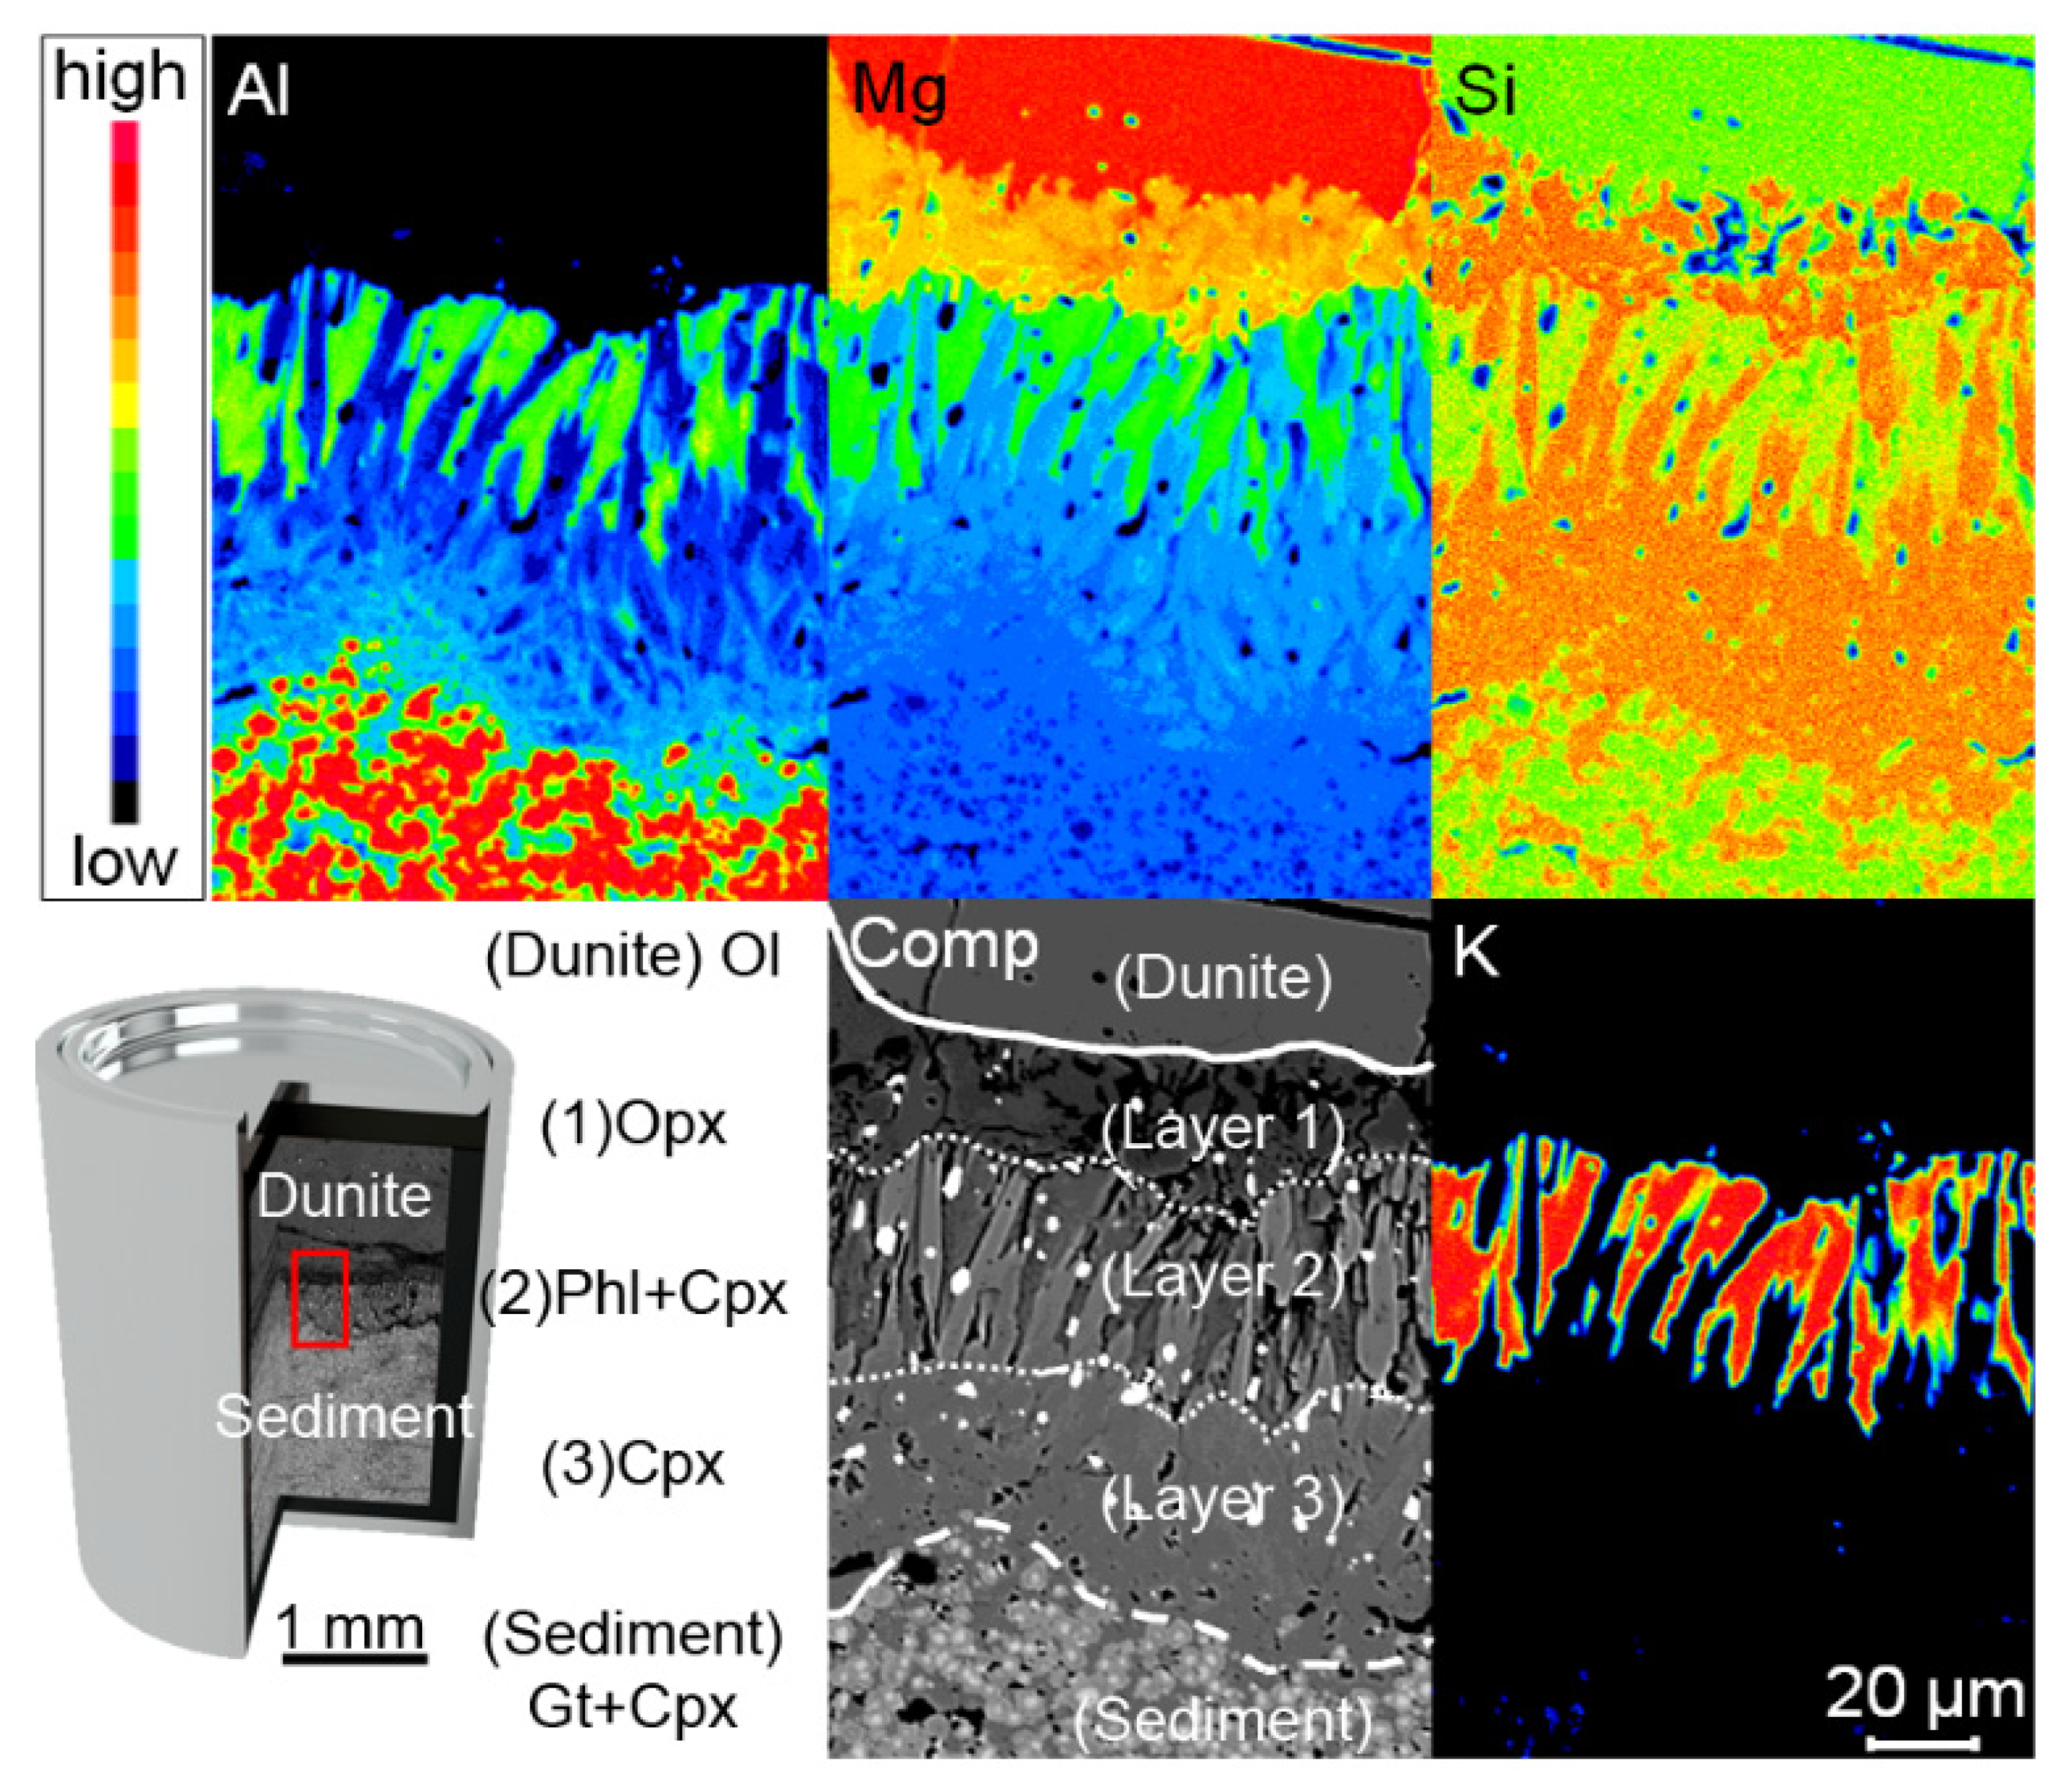
34] that include the reaction of clastic, hydrous and carbonate-bearing sediments from the Mediterranean Sea from the International Ocean Discovery Project (IODP) site ODP 161-976 with depleted peridotite (dunite: containing >97% olivine, ~2% spinel, and <1% clinopyroxene) from the Zedang ophiolite (south Tibet, Zedang, China) at 2–6 GPa and 750–1100 °C.

2. Materials and Methods

The experiments used sediment from the International Ocean Discovery Project (ODP 161–976 B 18 X3 105–106.5), which is a hydrated (<1.5%), carbonate-bearing (<10%) siliciclastic marine sediment (Table A2) with a composition close to globally subducted sediment [1]. The depleted peridotite is a clinopyroxene-bearing dunite (sample ZD11–53) containing olivine (>97%), spinel (~2%), and clinopyroxene (<1%) from the Zedang ophiolite (south Tibet, China). It occurs as a lens-shaped body within harzburgite (Table 1). While dunite may be a subordinate lithology of the fore-arc mantle [35], it has been chosen since it is essentially monomineralic (>97% olivine) and thus easily enables the recognition of metasomatic phases that grow during the experiments.
Experiments were carried out using a piston cylinder-apparatus (1–3 GPa) at the University of Mainz, and a belt apparatus (4–6 GPa) at the University of Frankfurt. Sediment and peridotite were powdered and placed as separate layers in an inner carbon capsule (which controls fO2 via the C + CO equilibrium) inside an outer platinum capsule. For the piston cylinder experiments, the experimental assembly consisted of a pressure cell made of Al2O3 spacers, a graphite furnace, B-type thermocouple, and sintered CaF2 spacer outside the capsule. In the belt apparatus experiments, the materials used were similar to piston-cylinder experiments, but the spacer and capsule holder consisted of natural polycrystalline calcium fluoride. All cell assemblies were first pressurized and subsequently heated at a rate of 50 °C/min. Thermobaric conditions were kept constant for 2–14 days. Charges were quenched at the end of the experiment by switching off the heating. The piston-cylinder apparatus contains extra cooling channels in the bomb plate which aid rapid quenching [36]: quench times to temperatures below 500 °C were 6 s for the piston-cylinder runs, and 8 s for the belt runs. Major element contents of experimental run products were acquired using a JEOL JXA 8200 Superprobe (Tokyo, Japan) electron-probe microanalyzer equipped with 5 wavelength dispersive spectrometers at the University of Mainz using the methods described in [37].
For trace element analysis, the sediment was fused to a 2 mm glass bead on top of an Ir-piece by using a strip-heater device. Trace elements (Tables S1 and S2) were collected by using laser ablation-inductively coupled plasma mass spectrometry (LA-ICP-MS) at the University of Mainz [38]. An ESI NWR193 ArF Excimer laser (Bozeman, MT, USA) ablation system (193 nm wavelength) equipped with a TwoVol2 ablation cell was used for the formation of a dry aerosol from the samples. Ablation was performed with a repetition rate of 10 Hz at 3 J/cm2. The sample was transferred to an Agilent 7500ce (Santa Clara, CA, USA) mass spectrometer by a He-Ar mixed gas flow. Synthetic glass NIST SRM 610 (Gaithersburg, MD, USA) was used as calibration material using published values [39] and 29Si was selected as the internal standard for silicates, using the SiO2 data determined by electron microprobe. For quality control, synthetic NIST SRM 612 and basaltic USGS BCR-2G were measured as unknowns in each run (Table S1). Results for NIST SRM 612 and USGS BCR-2G were, on average, within 10% of the data tabulated in the GeoReM database http://georem.mpch-mainz.gwdg.de/ (accessed on 1 January 2021), [40]. For each analysis, background signals were acquired for 20 s, followed by a dwell time of 30 s with spot sizes of 20 µm. Data processing was carried out using GLITTER 4.4.1 [41].
LA-ICP-TOFMS was used to map trace elements of the experiments by using an icpTOF R (TOFWERK AG, Thun, Switzerland) coupled to an Analyte G2 193 nm excimer laser ablation system equipped with a HelEx II dual-volume ablation cell and an Aerosol Rapid Introduction System (ARIS) for fast washout of the sample aerosol (Teledyne CETAC Technologies, Omaha, USA). The spot size was set to 5 µm with a repetition rate of 30 Hz and a laser fluence of 3 J/cm2. Each pixel represents the signal from a single laser shot [31,42]. The count rates for each element measured by LA-ICP-TOFMS were used to compare element abundances in the reaction zone between the sediment and dunite. For each element, the count rates were averaged from an equal sized area (10,000 µm2) within the reaction zone and the dunite (Figure A5).

3. Results

3.1. Textural Observations

The experimental products contain reaction zones between the sediment and depleted peridotite with thicknesses of 30–1000 µm (Figure 2 and Figure A1), which increased with temperature, melt fraction, and experiment duration, as evident from runs 10 and 11 at 5 GPa/1000 °C with one- and three-days run time (Table 1). Phases present within the reaction zone include phlogopite, clinopyroxene, orthopyroxene, and magnesite at 2–3 GPa and 4 GPa/1100 °C as well as dolomite at 3 GPa/800 °C (Table 1), whereas experiments at 4–6 GPa and <1100 °C differed by the presence of Na-K chlorides and the absence of phlogopite, while all other phases were identical [33]. At 2–3 GPa the sediment partially melted, leaving an eclogite-like residue dominated by Ca-rich garnet and omphacitic clinopyroxene, while at >4 GPa, no melting was observed. The residue contains silica-rich glass of dacitic-rhyolitic composition in all experiments at ≤4 GPa and >750 °C, phengite and apatite at ≤850 °C, as well as coesite at ≤800 °C (Table 1) [32,33]. In contrast, the dunite half is composed of >97% olivine and did not show any changes throughout the experiment outside the reaction zone. Figure 2 and Figure A2 show backscattered electron images and wavelength dispersive X-ray spectroscopy (WDX) maps of the reaction zone of a representative experiment (3 GPa/850 °C). Generally, the hydrous and carbonate-rich melt derived from the sediment rises and reacts with the dunite to form a reaction zone enriched in K, Ca, Al, and Si. This reaction zone consists of three layers that are sandwiched between the two starting materials: (1) Orthopyroxenite: thickness 50–500 µm and in contact with the depleted peridotite; this layer also contains minor amounts of magnesite (Figure A3); (2a) Phlogopite-clinopyroxenite (in experiments at ≤3 GPa): forming a symplectite and measuring 50–200 µm thickness; (2b) Pyroxenite (in experiments at >3 GPa): forming a symplectite of clinopyroxene and orthopyroxene, measuring ~100 µm thickness; (3) Clinopyroxenite: thickness ~100 µm and in contact with the residue of the melt-depleted sediment. Layers (1)–(3) also show minor amounts of Fe-Ni-sulphides, while layer (3) and the melt-depleted former sediment contain accessory amounts of apatite. The orthopyroxenite zone is seen most clearly in the Mg map, in which orange orthopyroxene contrasts with the red of dunitic olivine. Almost all K is concentrated in phlogopite of zone 2, whereas the clinopyroxene of zone 3 is seen as orange in the Si map and blue in the Al map, contrasting with the high Al of the adjacent former sediment layer. Over the whole range of experiments from 2–6 GPa, the reaction zone always contains pyroxene, while phlogopite is absent at p > 4 GPa, where Na-K chlorides occur instead [33].
Figure 2. EPMA WDX- and LA-ICP-TOFMS maps of an experiment at 3 GPa/850 °C. Backscattered electron image (Comp) and qualitative WDX maps showing the distribution of Al, Mg, Si, and K in the reaction zone between dunite and partially molten sediment. Al is highest in garnet grains of the eclogite-like residue of the former sediment (red in Al map) and in phlogopite grains in the reaction zone (green), while clinopyroxene grains show a gradual increase in Al towards the former sediment (blue gradient in Al map). Mg shows a gradual decrease away from the dunite and is higher in phlogopite than in adjacent diopside. Si is high in clinopyroxene and orthopyroxene (both orange in Si map). K is strongly enriched in phlogopite (red in K map), where it forms a symplectite with diopside (dark blue in Al map). Phase abbreviations: Phl—phlogopite, Cpx—Clinopyroxene, Opx—Orthopyroxene, Gt—Garnet.
Geosciences 11 00372 g002
Element mapping by laser ablation inductively coupled plasma time-of-flight mass spectrometry (LA-ICP-TOFMS) reveals selective incorporation of minor and trace elements in the reaction zone (Figure 3): sulphur is enriched in all three sub-layers of the reaction zone, where it combines with Ni and Fe from olivine of the dunite to form Fe-Ni-sulphides. The former contact between sediment and dunite is clearly seen in the strong decrease in Ni in the composite image (Figure 3). Elements of the LILE and HFSE groups are strongly incorporated into and trapped in the layers of the reaction zone, exemplified by Rb and Cs (layer 2a), Th, and Zr (layers 2, 3, and former sediment), whereas the Ce (enriched in layers 2 and 3) and Lu (not enriched) maps indicate strong fractionation of the REE (Table A1).

3.2. Phase Compositions

In all experimental products, the sediment layer (Table A2) re-crystallized to Na-Al-rich clinopyroxene (2–4 wt% Na2O, 7–14 wt% Al2O3) and Ca-rich garnet (12–16 wt% CaO) (Table 2). Garnet is chemically zoned (Mg, Fe, and Ca), with increasing Mg from core to rim, while Ca and Fe decrease. The sediment layer in experiments at ≤3 GPa also contains hydrous silicate glass (EPMA sums ~80–90 wt%) with a calculated melt fraction of 10-30% (Table 1); this melt contains 4–6 wt% K2O and 55–75 wt% SiO2 (Table 2). The reaction zone layers 1–3 replacing the dunite are generally enriched in K, Ca, Al, Si, CO2, and H2O. Clinopyroxene is chemically zoned across the reaction zone, whereby the Na-Al-component is highest at the contact with the partially molten former sediment and gradually decreases from 10 to 3 wt% Al2O3 and 3 to 1 wt% Na2O across layer 3 to 2 (Figure 2). Orthopyroxene is the major phase in layer 1, occurring as veins within the dunite, and contains low amounts of Al2O3 (0.5–1 wt%).
Trace element count rates from LA-ICP-TOFMS of the reaction zone in the 3 GPa/850 °C experiment were normalized to count rates in the dunite (Figure 4) to give a qualitative estimate of element enrichment factors (D) (Table A1). These factors express element transfer during metasomatism, as they compare the element composition of the metasomatic layers to the unreacted dunite. The metasome in the 3 GPa/850 °C experiment shows that trace elements are enriched in a descending order from LILE (6–20 times), HFSE (2–9 times), light REE (2–6 times), and heavy REE (<3 times) (Figure 4A). The composition of the sedimentary starting material, the hydrous and carbonate-rich melt derived from it, which is used up completely in the reaction zone, and the residual, eclogite-like former sediment (garnet and clinopyroxene, Table 2) are shown relative to N-MORB and compared to the composition of Mediterranean lamproites and arc magmas in Figure 4B. The trace element composition of the hydrous and carbonate-rich melt which infiltrated the dunite to form the metasome was calculated using the instantaneous fractional melting equation [43] for 1–50% melt in the 3 GPa/850 °C experiment using the element coefficients between reaction zone and dunite derived above, which resemble bulk enrichment factors (Figure 4A).

4. Discussion

Although the fore-arc mantle is widely interpreted from geophysical measurements to be hydrated [9,10,11], it remains unclear to what degree its major and trace element composition is modified by infiltrating volatile-bearing partial melts derived from sediments. Subducted sediments have low solidus temperatures of about 675 °C, which strongly depend on composition, pressure, and volatile contents [3,4]. Since continental lithologies are usually enriched in potassium compared to peridotitic mantle rocks (K/Na 1–2), they can provide the enrichment in K for potassic-ultrapotassic magmatism [14]. When felsic crustal material is buried to mantle depths, it will preferentially melt and react with the surrounding peridotitic matrix. Given the low solidus of hydrous melts of sediments at ~675 °C [3,4], we propose that these melts rise from the slab surface within the fore-arc of a subduction zone and metasomatize the lithospheric mantle between the sediment solidus (white arrow in Figure 1) and the 1000 °C isotherm (blue line), the wet solidus of peridotite [28]. This is based on the following observations: (1) the eruption of trace-element enriched ultrapotassic lavas that form during rare events of slab-rollback and fore-arc mantle melting [13,23]; (2) the strong HFSE-depletion of arc magmas [7,46], which can be explained either by the retention of HFSE in sediments during the formation of arc magmas or by the redistribution of HFSE to the fore-arc mantle before the sediment components proceed to the depths of arc magma sources; (3) a recent compilation [47] of the global range of subduction zone thermal structures from exhumed blueschists and eclogites shows that pelitic sedimentary rocks reach their solidus at depths as low as 30 to 80 km, indicating that melting of subducted sedimentary rocks in fore-arc regions is probably widespread; (4) the presence of an extensive magnetotelluric low resistivity zone stretching from the mantle to shallow crustal depths (30–80 km) in front of the volcanic arc [30,48,49] that coincides with hot springs on the surface that discharge Cl- and CO2-bearing fluids [50]. Additionally, these fluids are themselves indicative of devolatilization and reaction processes that take place already within the fore-arc mantle.

4.1. Progressive Replacement of Peridotites by Phlogopite Pyroxenites in the Fore-Arc Mantle

The reaction of hydrous and carbonate-rich partial melts derived from sediments with dunite leads to the formation of a metasomatic zone enriched in Na2O, K2O, Al2O3, CaO, TiO2, and SiO
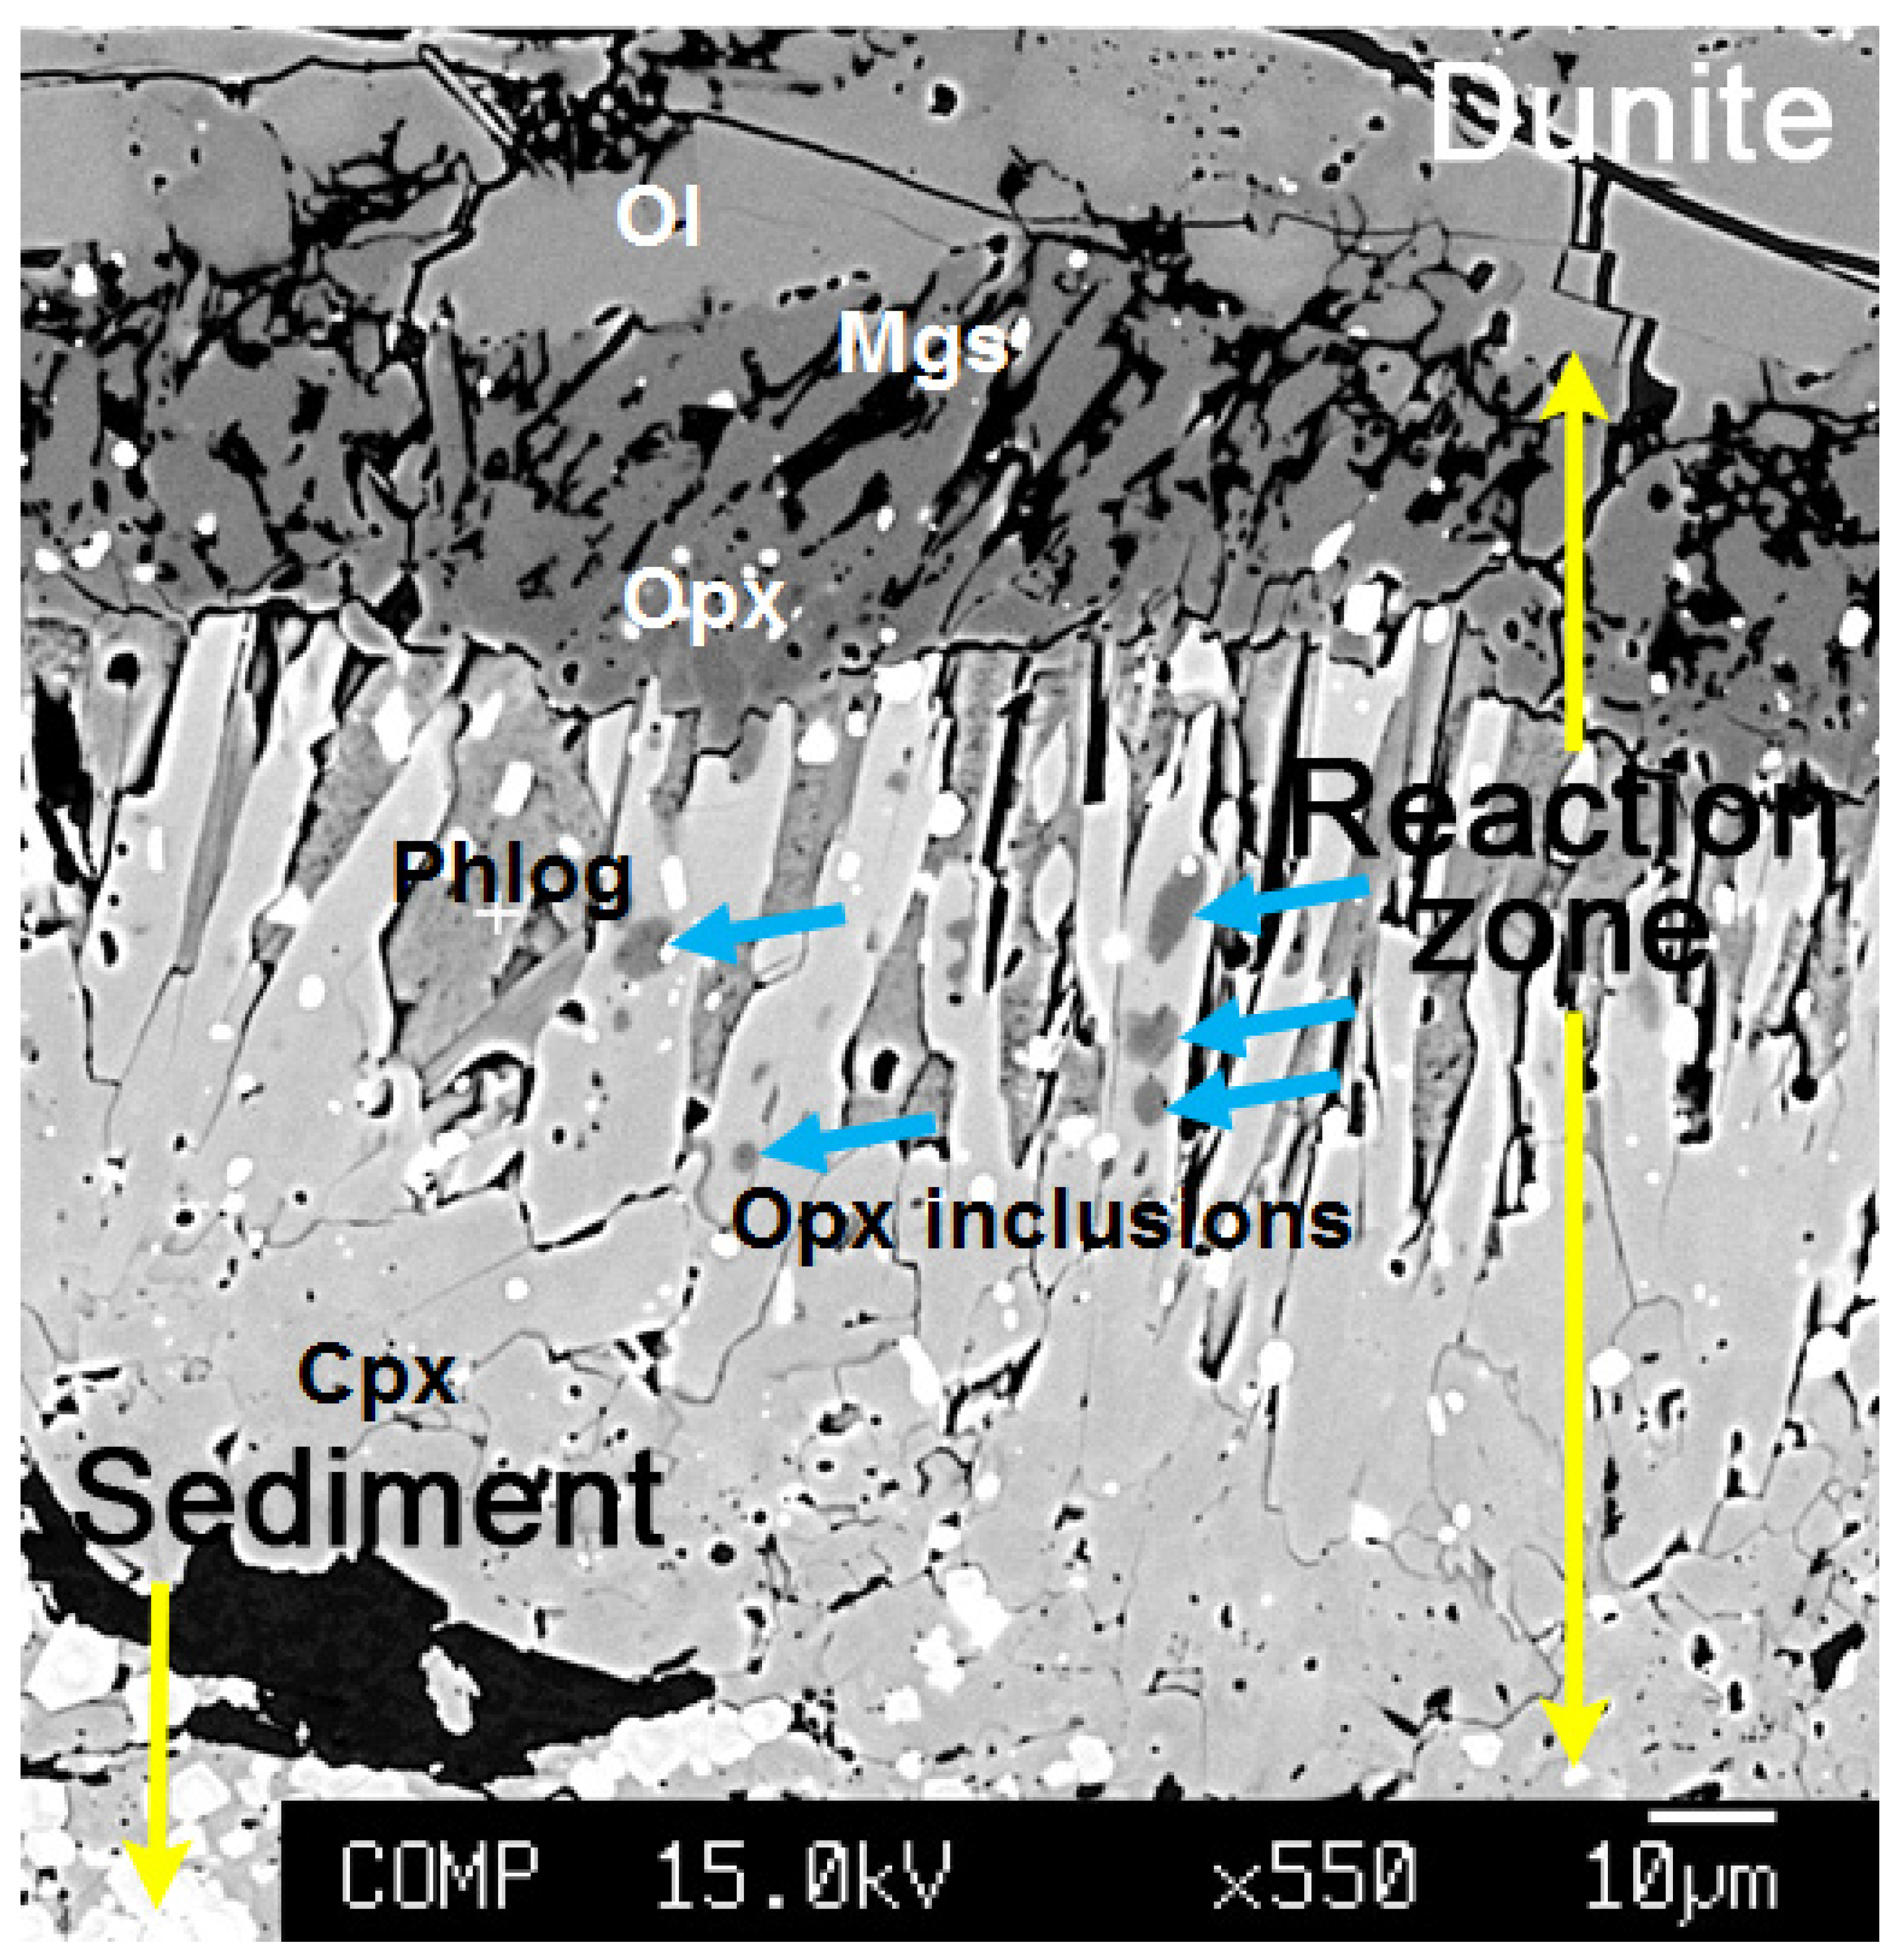
2, as well as in LILE, HFSE, and LREE that consumes olivine. This is illustrated by the preservation of orthopyroxene inclusions in clinopyroxene in layer 3 of the experiments (Figure A3), which originate from the former dunite layer. The growth of phlogopite pyroxenites at 2–3 GPa/800–1000 °C is in accordance with previous studies [14,15,16,17].
The intense metasomatism of the dunite is evident when each metasomatic layer and the average metasome composition is plotted against the unaltered dunite (Figure A4) in an isocon plot [51,52]. The metasomatized reaction zone is progressively enriched in Na2O, K2O, Al2O3, CaO, TiO2, and SiO2 from layer 1 to 3 (Figure A4A) as well as in LILE, HFSE, and LREE (Figure A4B) compared to the un-metasomatized dunite. A Gresens-Grant analysis [51,52] shows that this enrichment is balanced by the progressive decrease of MgO and FeO from layer 1 to layer 3 (Table A4).
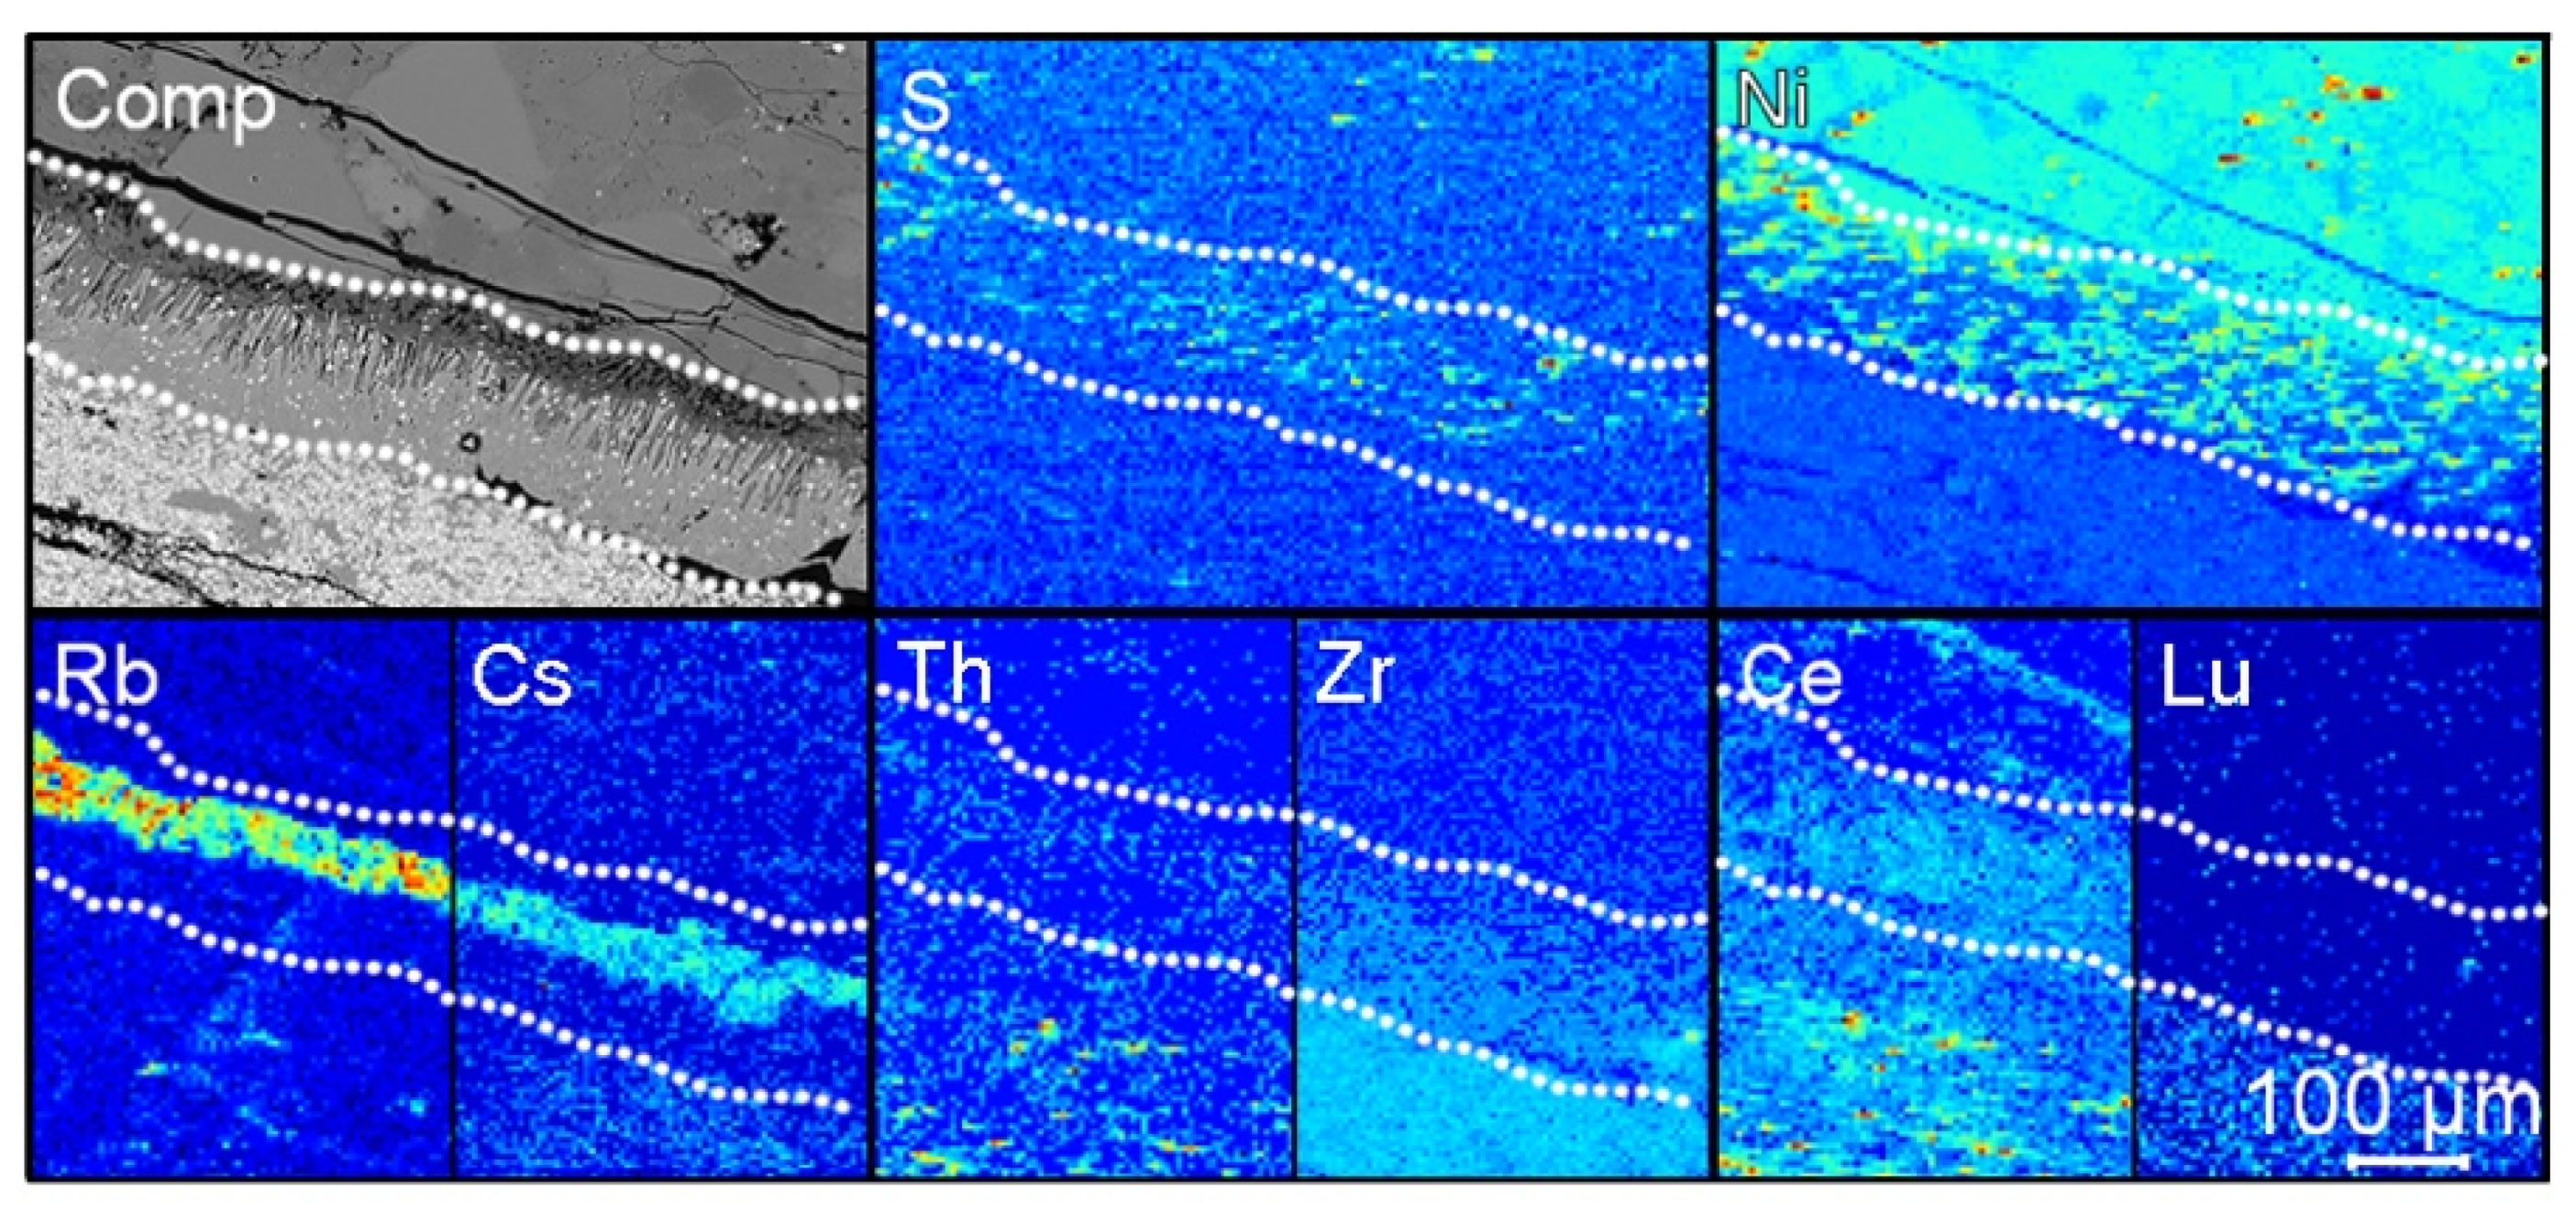
LA-ICP-TOFMS mapping shows that trace elements are heterogeneously redistributed throughout the reaction zone. LILE, HFSE, and light REE are enriched in the reaction zone (layers 1–3) and controlled by the growth of phlogopite, clinopyroxene, and accessory apatite as well as sulphides (Figure 2). These newly grown phases form repositories for distinctive sets of trace elements. The reaction zone remains low in heavy REE because these are retained in garnet in the residue of the partially molten former sedimentary rock as expressed by the low enrichment factors for heavy REE (
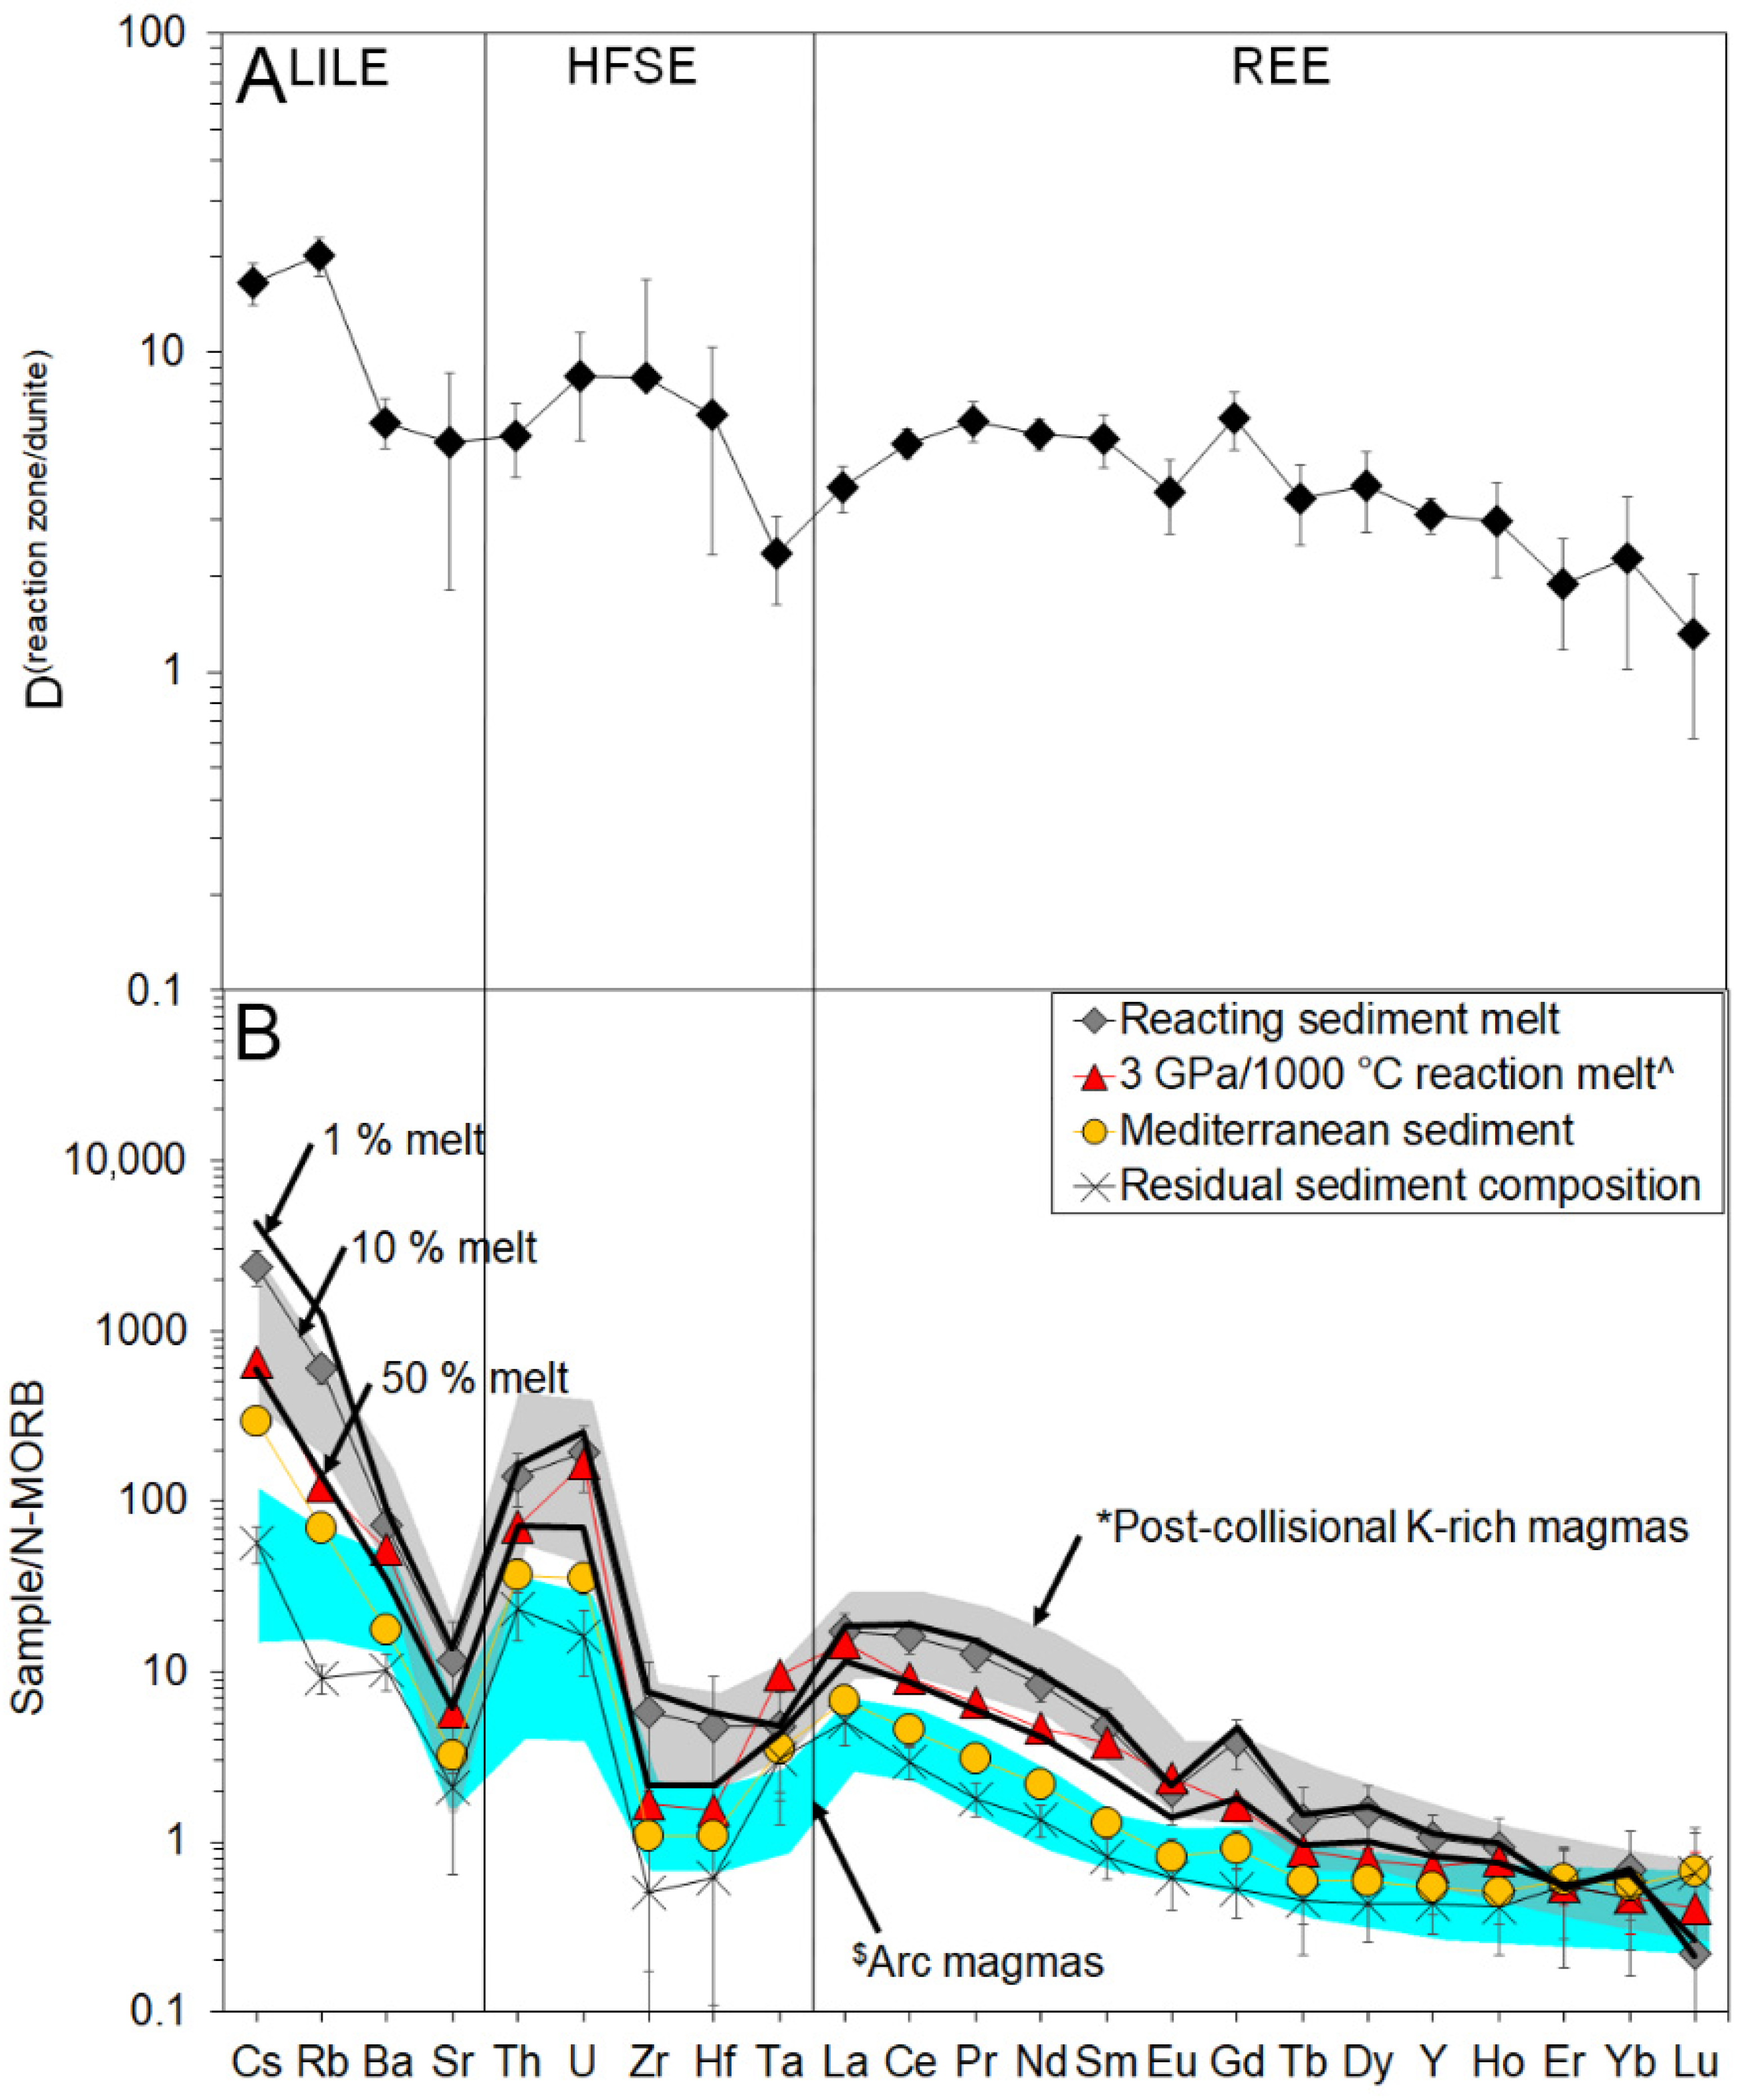
Figure 4A, Table A1). Since the element distribution between reaction zone and dunite is controlled by mineral growth, the enrichment factors (D) represent the metasomatic enrichment of depleted peridotite by hydrous and carbonate-rich partial melts derived from the sedimentary rock layer (Figure 4A).
Assuming subducted sedimentary material is involved in creating the trace element patterns in ultrapotassic magmas, the mechanism of their formation must enrich LILE, HFSE, and LREE more than HREE to satisfy the observed trace element patterns [19]. Using the fractional melting equation [43] and a wide range of fractional melting of 1–50% of the sedimentary rock, LILE, HFSE, and light REE patterns of the metasome-forming melts in the experiments are identical to those of ultrapotassic magmas in post-collisional settings [19] (Figure 4B). Following the cessation of subduction, heating of the metasomes to >1150–1200 °C [53] by e.g., slab-rollback [13,23] could trigger melting and formation of ultrapotassic magmas. During fore-arc metasomatism, the eclogite-like residue from the former sediment is depleted in decreasing order from LILE to heavy REE compared to the sedimentary starting material, as seen by the decrease of D(reaction zone/dunite). This process may explain the presence of LILE-, HFSE-, and LREE-depleted eclogites [27], which have previously been explained as residues of fluid-metasomatism beneath the volcanic arc. The further descent of the eclogite-like residue and its incorporation into the arc magma source at deeper levels of >3 GPa successfully explains the characteristic depleted HFSE and REE <1 (Sm-Lu) [45] signature ascribed to subducted sediments in arc magmas (Figure 4B).

4.2. Location and Geometry of Fore-Arc Metasomes

The range of calculated e.g., [29] and observed [47] subduction-zone temperatures show that hydrous clastic sediments will have already crossed the solidus in the fore-arc. In calculated models [29], thermal gradients of subduction zones stay close to the ‘forbidden zone’ of metamorphism on Earth until ~2.5 GPa and then rapidly heat up in the vicinity of the convecting mantle. In these cases, the solidus of hydrous sedimentary rocks (~675 °C) is reached in a narrow depth zone just in front of the arc. Temperatures from exhumed blueschists and eclogites [47] are 200–400 °C above these calculated models at corresponding depths, suggesting that subducted sedimentary rocks may melt at a greater distance from the arc than has commonly been assumed. However, it has also been argued that temperatures derived from exhumed rocks are biased to higher temperatures as rocks are preferentially exhumed under warm conditions [54]. Nevertheless, as subducting sediment heats up from ambient temperature at the surface to that of the convecting mantle beneath the arc, any subduction zone will have a region where volatile-bearing melt from sediments infiltrates and reacts with mantle to produce metasomes, but where temperatures are still too low to generate arc magma. Hence, the thermal gradient in a subduction zone dictates the extent and location of fore-arc metasomatism, which consequently means that young and hot subduction zones offer more favorable conditions for producing metasomes over a wide area within the fore-arc. If the globally present magnetotelluric anomalies [30,48,49,50] of fore-arcs represent these metasomes as demonstrated by synthetic magnetotelluric modelling [18], they are up to ~30–50 km wide and 40 km high and reach along the strike of the subduction zone.

4.3. Rates of Metasomatism

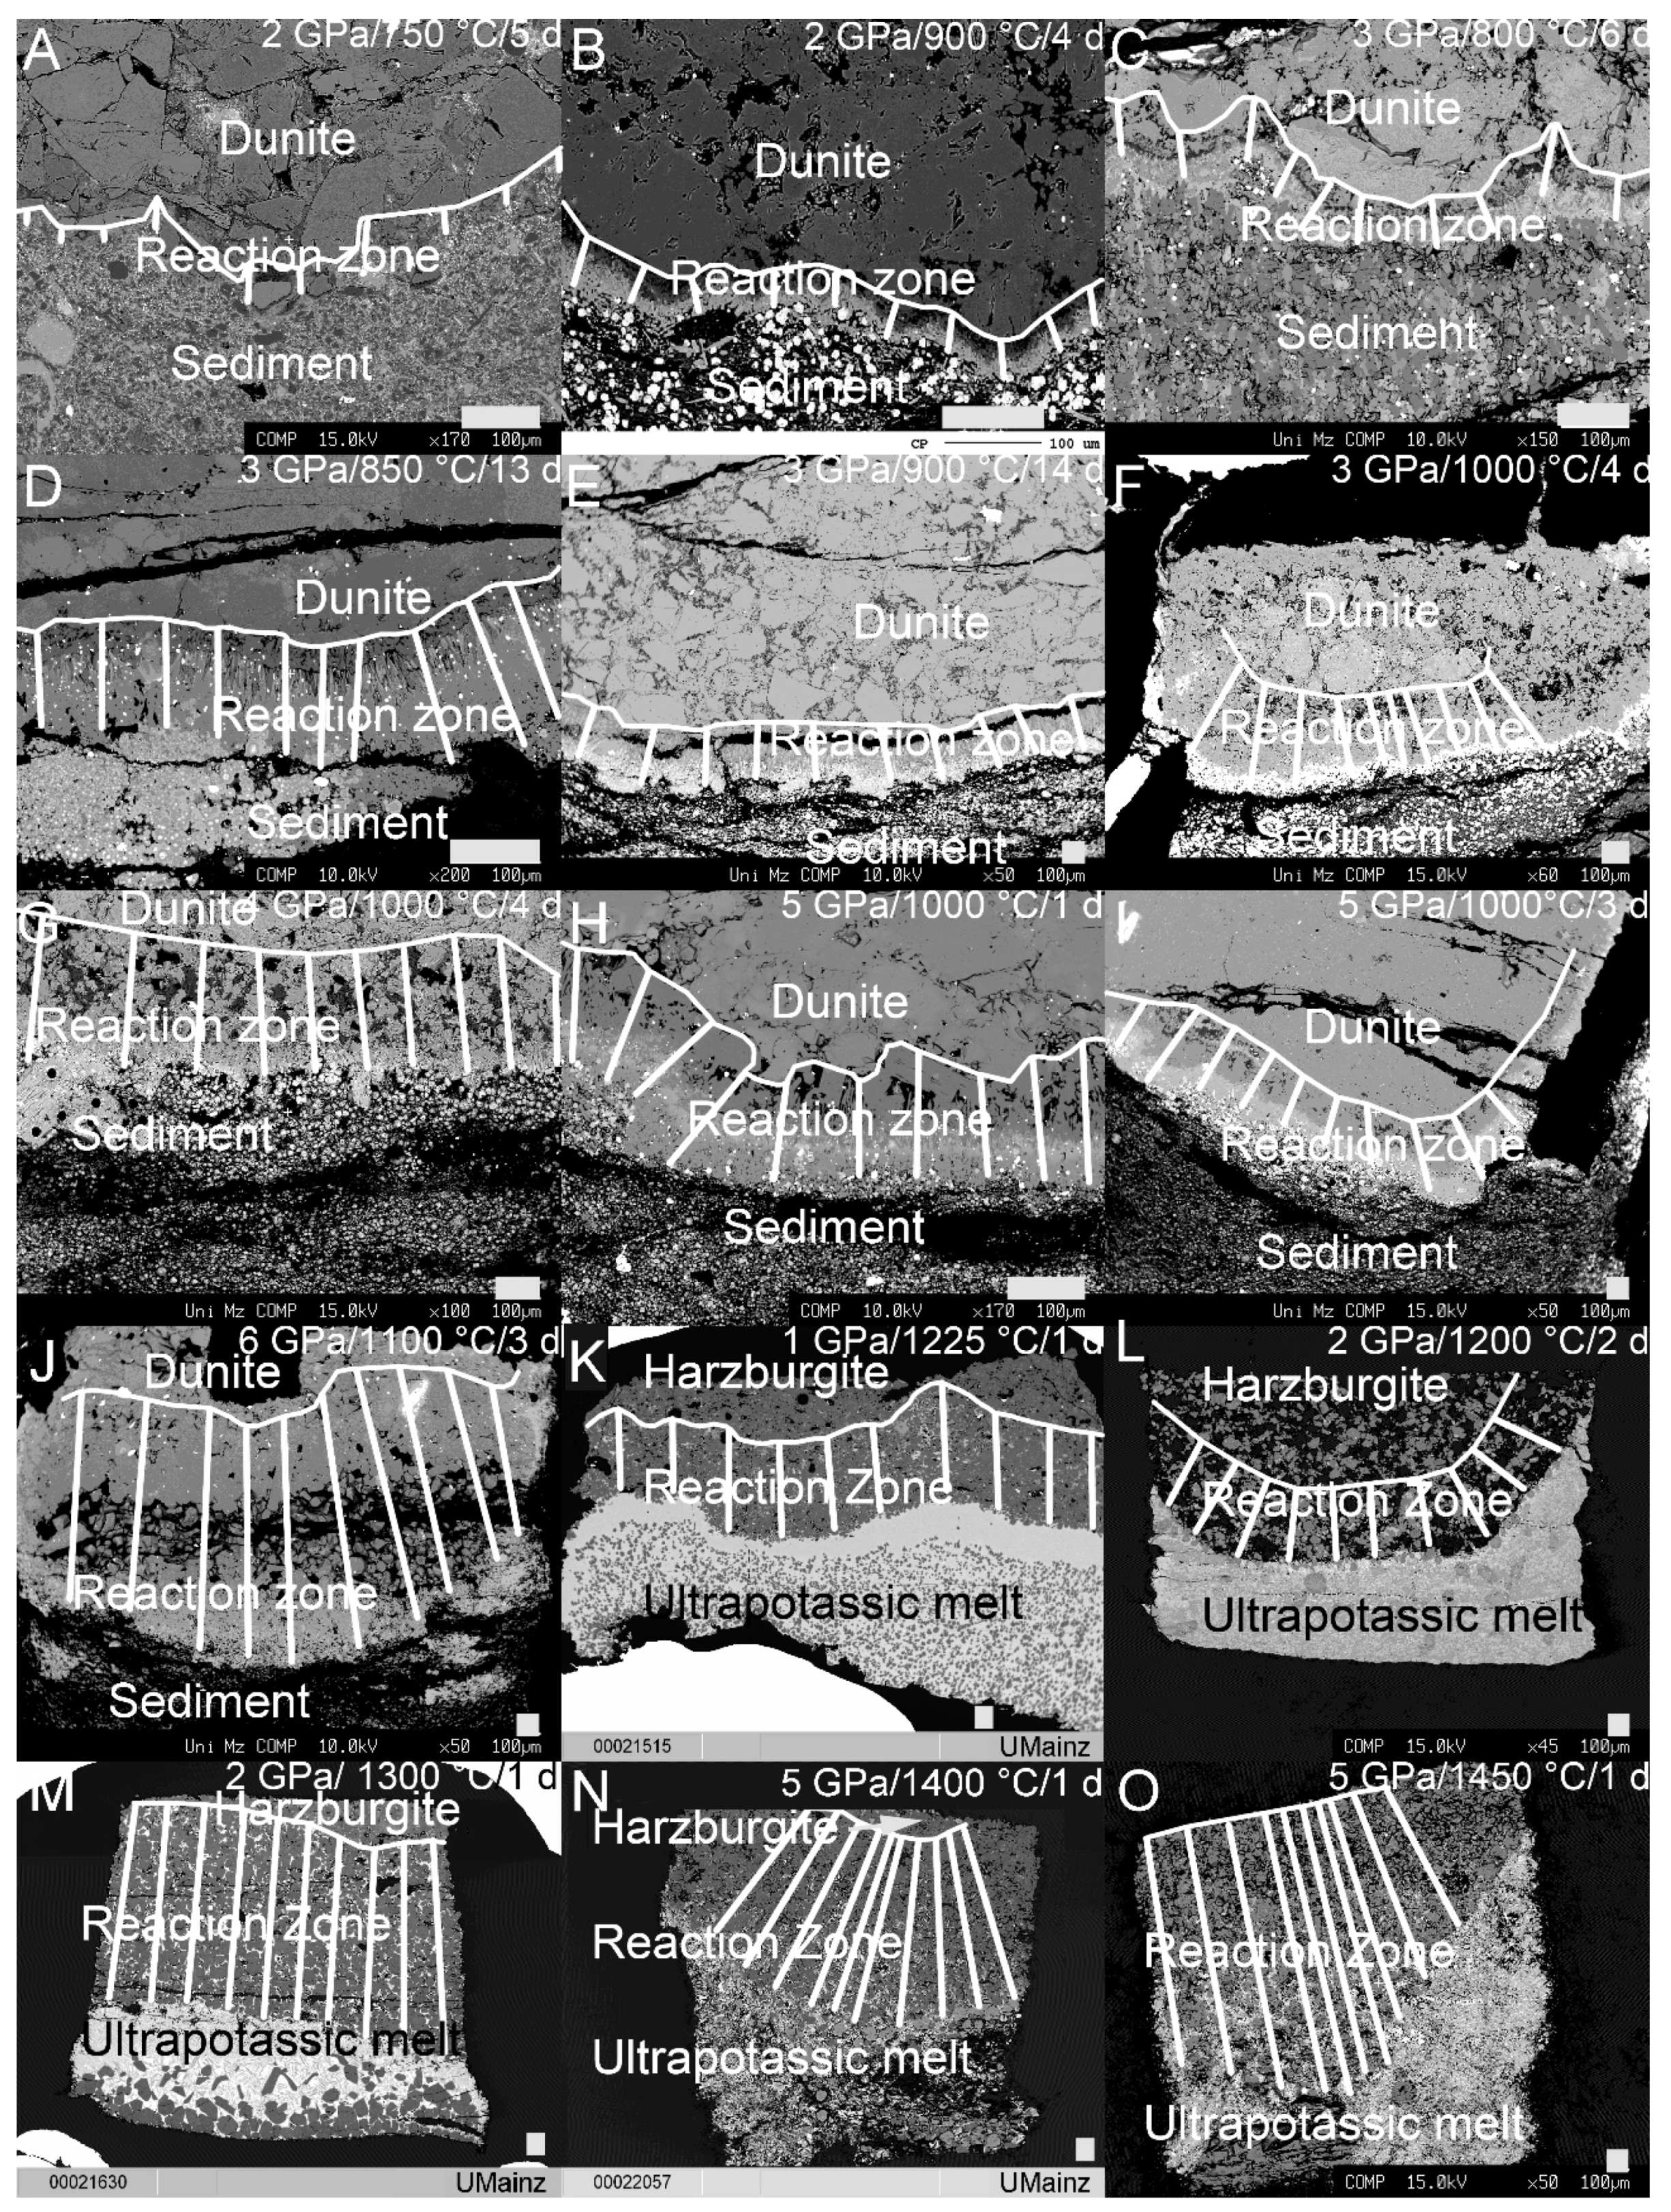
The reaction zone forms by the infiltration of siliceous sediment melt that is completely consumed as it reacts with the dunite. The reaction zone thickness was found to increase with temperature and experiment duration. Calculated growth rates exhibit an exponential dependency on temperature (R2 = 0.91) (Figure 5). Infiltration of ultramafic potassic melt [37,53] exhibits a similar exponential dependency on temperature (R2 = 0.66) and is in accordance with experiments that examined percolation of basaltic melts within peridotite [55,56]. Both styles of metasomatism, i.e., by volatile-bearing silicic partial melts derived from sediments and by ultramafic potassic melts, follow a similar trend with temperature (R2 = 0.91). An extrapolation of reaction zone growth rates translates to hypothetical rates of metasomatism that cover a range of 3–500 m/ky for temperatures of 750–1450 °C (Figure 5). For a cool fore-arc environment, metasome growth rates are <5 m/ky for temperatures <900 °C to <1 m/ky for temperatures <700 °C. These growth rates are about an order of magnitude below the rate of subduction which varies between 10–100 m/ky [57]. Since the sediment melts to a fraction of ~10%, the rate of replenishment of the sediment by continued subduction approximately matches the growth of the reaction zone. If no subduction erosion of this metasome happens, it may reach a thickness of ~1 km in ~1 million years. However, this metasome growth should be taken only as a speculative estimate since the migration rate of the reaction zone in the experiments is driven by grain sizes as well as the combination of chemical and thermal gradients. Thus, it is unclear how the processes within the capsule scale to a natural environment, which is likely more dynamic than an experiment under constant hydrostatic pressure. Therefore, if melt extraction and supply to the fore-arc mantle is channelized, percolation rates [58] could increase significantly and will probably be similar to the extraction rates of silica-rich melt within migmatites [59], which reaches rates of up to ~20 m/ky. Hence, the percolation rate estimated for silica-rich melt in channelized melt flow could be taken as a maximum for melt infiltration within the fore-arc mantle, while the estimated metasome growth rates of 1–5 m/ky from the experiments could be regarded as a minimum.

5. Conclusions

Our results provide direct experimental evidence of metasome growth within the fore-arc mantle (Figure 1) and reveal the following key insights into subduction-related mantle metasomatism:
(1) The low solidus of volatile-bearing clastic sediments (~675 °C, [3,4]), compared to that of depleted peridotites and volatile-bearing partial melts derived from them, will lead to infiltration in the fore-arc mantle wedge long before the volatile-bearing solidus of peridotite [28,60] is reached in the source regions of arc magmas. The large difference in solidus temperatures leads to reaction and crystallization as well as to trapping of infiltrating melt, while low amounts of partial melt may be retained in the eclogite-like residue.
(2) All experiments resulted in a layered reaction zone where the redistribution of major and trace elements was controlled by mineral growth, which effectively separates distinct sets of elements because of the minerals formed. Trace element enrichment was highest for LILE, followed by HFSE and light REE, while the reaction zone was low inHREE.
(3) Whereas the dunite was heavily metasomatized by infiltration of, and reaction with, hydrous and carbonate-rich partial melts, the residual sediment was transformed to an eclogite-like mineralogy, comprising mainly garnet and clinopyroxene.
(4) Calculation of the metasome composition shows that a wide range (1–50%) of fractional melting of the sediment successfully explains the geochemical signature of sediments in the source of post-collisional K-enriched magmas, while the depleted residue from this reaction corresponds to the geochemical characteristics of the sediment component in arc magmas. The general depletion in HFSE in arc magmas results from the loss of these elements to the fore-arc metasome since they are also enriched in the reaction zone (Figure 5). Thus, the sediment component in arc magmas is delivered by the residue after partial melting of subducted sedimentary rocks has already occurred in the fore-arc, rather than being due to unmodified subducted sediment.
(5) For a temperature range of 700–900 °C, the rates at which fore-arc metasomes form and spread are in the order of 1–5 m/ky, which is 1–2 orders of magnitude lower than rates of subduction. After <1 million years of subduction, the metasome may grow to an aggregated thickness of >1 km.
(6) Slab rollback is able to introduce heat into the metasomatized zone of the fore-arc and triggers melting of the phlogopite pyroxenites, resulting in trace element-rich high-K lavas, as observed in Mexico [23] and Turkey [13].

Supplementary Materials

The following are available online at https://0-www-mdpi-com.brum.beds.ac.uk/article/10.3390/geosciences11090372/s1, Table S1: Reference materials for quality control, Table S2: Trace element mass fractions of the ODP 161–976 sediment.

Author Contributions

Conceptualization, M.W.F., D.P., N.R.D. and S.F.F.; methodology, Y.B., S.B. and R.M.-K.; writing—original draft preparation, M.W.F.; writing—review and editing, M.W.F., Y.B., D.P., N.R.D. and S.F.F.; visualization, M.W.F.; supervision, S.F.F. All authors have read and agreed to the published version of the manuscript.

Funding

M.W.F. is funded by Macquarie University grant MQRF0001074-2020. D.P. was supported through the Deutsche Forschungsgemeinschaft (DFG) project PR 1072/9-1. S.F.F. is funded by ARC Laureate Grant FL180100134. Y.B. and N.R.D. gratefully acknowledges support through a Marie Skłodowska-Curie Fellowship (Project ID 746518) and an Australian Research Council (ARC) Discovery Grant DP200100482, respectively. The International Ocean Discovery Project provided the marine sediment sample.

Institutional Review Board Statement

Not applicable.

Informed Consent Statement

Not applicable.

Data Availability Statement

The data are available within the appendix and the supplementary tables. Additional data can be requested from the corresponding author.

Acknowledgments

Thomas Kautz (Goethe University, Frankfurt) is thanked for assisting with the belt apparatus experiments.

Conflicts of Interest

Y.B. is an employee of TOFWERK AG which provided the LA-ICP-TOFMS analyses.

Appendix A

Figure A1. Metasome thicknesses and infiltrated melt distances in reaction experiments at 2 GPa (A,B), 3 GPa (CF), 4 GPa (G), 5 GPa (H,I), and 6 GPa (J). Each reaction zone was measured 10 times (along white lines) to calculate the growth rate of the reaction zone (Table 1). Additional experiments using ultrapotassic melts at a similar pressure range of 1-5 GPa (last 5 images, [37,53]) show infiltration rates of 505 ± 60 µm/d (K), 371 ± 24 µm/d (L), 1039 ± 31 µm/d (M), 983 ± 44 µm/d (N), and 1127 ± 187 µm/d (O). Scale bar is 100 µm in every image.
Geosciences 11 00372 g0a1
Figure A2. Phases present within the dunite (A), reaction zone (B), and sediment layer (C) of the 3 GPa/850 °C experiment. (Phases: Ol—olivine, Opx—Orthopyroxene, Cpx—Clinopyroxene, Gt—Garnet, Mgs—Magnesite, Phl—phlogopite, Phe—Phengite).
Geosciences 11 00372 g0a2
Table A1. LA-ICP-TOFMS raw element count rates. Element count rates are averaged from 400 individual LA-ICP-TOFMS measured spots of 5 µm diameter within the reaction zone and the dunite.
ElementReaction Zone [N = 400]Dunite [N = 400]Ratio Reaction Zone/Dunite
S1166 ± 1001114 ± 47~1.1
Ca110 ± 5730 ± 7~4
Ti82 ± 616 ± 4~15
V51 ± 810.5 ± 0.8~100
Cr9 ± 615 ± 8~0.6
Mn140 ± 92103 ± 22~1.4
Fe32F74 ± 40605925 ± 720~0.6
Ni33 ± 6445 ± 21~0.7
Ga1.1 ± 1.30.09 ± 0.27~12
Rb27 ± 381.4 ± 1.2~20
Sr34 ± 226 ± 36~5
Y1.0 ± 1.20.32 ± 0.5~3
Zr8 ± 710.8 ± 0.6~8
Cs3 ± 40.2 ± 0.4~17
Ba322 ± 55753 ± 57~6
La1.1 ± 1.80.3 ± 0.7~4
Ce2.8 ± 2.80.6 ± 1.0~5
Pr0.7 ± 0.90.11 ± 0.3~6
Nd1.08 ± 1.160.19 ± 0.46~6
Sm0.3 ± 0.60.06 ± 0.21~5
Eu0.21 ± 0.520.06 ± 0.20~4
Gd0.26 ± 0.510.04 ± 0.19~6
Tb0.16 ± 0.430.05 ± 0.22~4
Dy0.16 ± 0.420.04 ± 0.21~4
Ho0.13 ± 0.390.04 ± 0.19~3
Er0.09 ± 0.320.05 ± 0.19~2
Yb0.09 ± 0.540.04 ± 0.18~2
Lu0.05 ± 0.290.04 ± 0.18~1
Hf0.38 ± 0.450.06 ± 0.29~6
Ta0.16 ± 0.460.07 ± 0.25~2
Pb54 ± 2678 ± 40~0.7
Th0.41 ± 1.060.07 ± 0.25~6
U2.8 ± 2.90.33 ± 0.70~8
Figure A3. Close-up of reaction zone. Orthopyroxene inclusions within clinopyroxene (indicated by blue arrows) reveal growth of the metasome layer at the expense of dunite. (Phases: Ol—olivine, Opx—Orthopyroxene, Cpx—Clinopyroxene, Mgs—Magnesite, Phl—phlogopite).
Geosciences 11 00372 g0a3
Table A2. Major element compositions of starting materials.
SampleLOI [wt%]Sum [wt%]SiO2 [wt%]Al2O3 [wt%]Na2O [wt%]Fe2O3 [wt%]MgO [wt%]P2O5 [wt%]SO3 [wt%]TiO2 [wt%]CaO [wt%]K2O [wt%]MnO [wt%]Cl [wt%]F [wt%]C * [wt%]H * [wt%]
Sediment15.34100.542.2914.081.555.173.010.162.330.5911.162.571.630.420.188.21.8
Dunite−1.6699.5440.440.080.0311.1949.0800.120.010.130.010.1300--
* Determined by automated CHNS analyzer (method from Huong et al. [61]): CH4: 4.0–5.3 wt%, H2O: 0–1.5 wt%, CO: 9.7–12.0 wt%.

Appendix A.1. Mass Balance Calculations

In this study, we performed reaction experiments where a sedimentary lithology melts and reacts with a depleted peridotite (dunite) to produce a reaction zone at the base of the dunite, while the sediment results in an eclogite-like assemblage. The dynamics of the reaction experiment led to progressive growth of the reaction zone at the expense of dunite and melt (Table A3).
The modal proportions of the phases (M) were obtained by solving the Equations (1) C bulk   C i = n phase [ M n · C n i ] and (2) Σ R 2 = i component [ C bulk   C i C bulk   S i ] 2 to minimize ∑R2 whereby i = SiO2, TiO2, Al2O3, FeO, MnO, MgO, CaO, Na2O, and K2O; n = minerals and melts; C bulk   C i = the calculated bulk concentration of component i, C n i = concentration of phase n, and C bulk   S i = concentration of the starting material in the capsule.
The fractions on both sides, the sediment and dunite involved in the reaction on the educt side, as well as the newly grown phases on the product side were iteratively balanced until R2 was maximized and showed the best fit. A high proportion of reacted dunite leads to low mass fractions of oxides such as CaO and Al2O3 (which are nearly absent in the dunite, see Table A2) but increases MgO within the reacted products. As such, the least-squares best fit of the mass balance calculation is taken to correspond to the best solution for the amount of sediment and dunite involved in the reaction. The calculation achieves an R2 of 0.99 (Table A3) and each oxide species of the balanced reaction phase resembles that of the starting condition within ~25% deviation except for Na2O, which are interpreted to be accommodated in a fluid phase, and FeO (which could have been lost to the metal outer capsule during the experiment).

Appendix A.2. Gresens-Grant Analysis of Metasomatic Alteration

Isocon diagrams show the change in mass fraction from the initial un-metasomatized rock composition to the altered composition [51,52]. Figure A4 shows the major element composition of the metasomatized layers 1–3 and its average composition versus the un-metasomatized dunite (A) and the relative enrichment in minor and trace elements of the average of the metasomatized layers (B). Since the composition of the unaltered dunite is known, no immobile major elements have been identified. Within the minor elements, Ni (sourced from dunite) behaves as immobile and combines with S (sourced from sediment) to sulphide that is stabilized within the reaction zone (Figure A4B).
To define enrichment and depletion bands (100:1–1:100), Figure A4 is presented as a log-log plot [62]. The metasomatized reaction zone is most strongly enriched in Na2O, K2O, Al2O3, and CaO (Figure A4A) as well as in LILE, HFSE, and LREE (Figure A4B) as they plot at ~10:1 to >100:1 enrichment compared to the un-metasomatized dunite. The enrichment of the metasome layers is balanced by the progressive decrease of MgO and FeO from layer 1 to layer 3.
Table A4 shows the mass balance of the metasome layers 1–3 and the average metaome composition against the initial un-metasomatized dunite. The difference of the sum of each oxide species within the metasome (∑Ci metasome) and dunite (∑Ci dunite) is close to 0, demonstrating that the metasomatic enrichment in Na2O, K2O, Al2O3, and CaO (Figure A4A) as well as in LILE, HFSE, and LREE is balanced by the progressive depletion of the metasomatized layers in MgO and FeO.
Table A3. This table shows the mass balance of experiment 4 (3 GPa/850 °C) using the average phase compositions from Table 2. Modes of measured glass and crystalline phases of the experiments (yellow box) are calculated (green box) and compared to the starting composition (grey box).
Sediment + Dunite = Glass + Orthopyroxene + Clinopyroxene + Garnet + Phengite + Phlogopite + Magnesite
CiSedimentDuniteSediment+Dunite Bulk SNorm. 100%Difference Starting Mix-Sum of Experimental PhasesDeviation Calc. Sed/Sed [%]Σ Phases Bulk CNorm. 100%GlassOpxCpxGtPhePhl§ Mgs
SiO2 [wt%]42.2940.4441.8348.59−3.156.4948.6451.7566.0056.0055.0041.2050.0042.000.00
TiO2 [wt%]0.590.010.450.520.1325.480.360.390.210.050.150.700.950.720.00
Al2O3 [wt%]14.080.0810.5812.29−0.927.4712.4213.2113.001.407.0022.4026.5011.300.00
FeO [wt%]4.609.965.946.902.6438.244.014.260.137.001.3010.000.705.000.00
MnO [wt%]1.630.131.261.460.2214.861.171.240.150.200.404.000.050.060.00
MgO [wt%]3.0149.0814.5316.880.301.7515.5916.580.1036.0014.0010.005.2022.0047.76
CaO [wt%]11.160.138.409.760.131.329.059.631.400.1919.0013.401.002.000.00
Na2O [wt%]1.550.031.171.360.4533.410.850.910.800.032.400.120.210.200.00
K2O [wt%]2.570.011.932.240.219.171.912.044.500.040.300.0410.008.000.00
Sum [wt%]81.4899.8786.081000.000.0094.010086.29100.9199.55101.8694.6191.2847.76
Modal proportions75%25% R2 = 0.99 15%13%28%25%9%3%7%
Phases: Glass—Glass from pelitic melt, Opx—Orthopyroxene, Cpx—Clinopyroxene, Gt—Garnet, Phe—Phengite, Phl—phlogopite, § Mgs—Magnesite (phase was identified by electron dispersive x-ray fluorescence, composition is given stoichiometrically).
Figure A4. Isocon plots of the metasomatized layers versus the unaltered dunite composition. (A) Major oxide composition of the metasomatic layers as determined by EPMA. K2O, CaO, and Al2O3 are most strongly enriched and plot above the 100:1 enrichment band. This enrichment is balanced by progressive decrease in FeO and MgO from layer 1 to 3. (B) Relative enrichment (cts—signal counts) of the average reaction zone as determined by LA-ICP-TOFMS (black circles—major and minor elements, yellow circles—LILEs, red circles—HFSEs, green circles—LREEs, and blue circles—HREEs + Y).
Geosciences 11 00372 g0a4
Table A4. Gresens-Grant analysis of the metasomatic layers of experiment 4 (3 GPa/850 °C). Oxide species depleted within the metasomatized layers are highlighted in red.
CiDunite (Unaltered)Metasome Layer 1 (0.75 Opx + 0.25 Mgs)Metasome Layer 2 (0.5Phl + 0.5 Cpx)Metasome Layer 3 (Cpx)Average Metasome Composition
SiO2 [wt%]40.4442.0048.5055.0049.80
TiO2 [wt%]0.010.040.440.150.24
Al2O3 [wt%]0.081.059.157.006.67
FeO [wt%]9.965.253.151.302.83
MnO [wt%]0.130.150.230.400.28
MgO [wt%]49.0838.9418.0014.0020.59
CaO [wt%]0.130.1410.5019.0011.83
Na2O [wt%]0.030.021.302.401.48
K2O [wt%]0.010.034.150.301.79
H2O [wt%]004.3602.61
CO3 [wt%]013.06001.74
Sum [wt%]99.87100.6899.7899.5599.87
∑Ci metasome [wt%]—∑Ci dunite [wt%]-+0.79−0.11−0.34−0.02
Figure A5. LA-ICP-TOFMS map of vanadium. Scale bar corresponds to 100 µm. The map depicts two areas of 10,000 µm2 within the reaction zone and within the dunite. The location of the marked area is chosen to represent the most homogeneous part of the reaction zone, while cracks and holes disturb the image in the lower half. The count rates were taken from both areas and used to calculate the enrichment factor of the reaction zone.
Geosciences 11 00372 g0a5

References

  1. Plank, T. The chemical composition of subducting sediments. Treatise Geochem. 2014, 4, 607–629. [Google Scholar]
  2. Schmidt, M.W.; Poli, S. Experimentally based water budgets for dehydrating slabs and consequences for arc magma generation. Earth Planet. Sci. Lett. 1998, 163, 361–379. [Google Scholar] [CrossRef]
  3. Hermann, J.; Spandler, C.; Hack, A.; Korsakov, A.V. Aqueous fluids and hydrous melts in high-pressure and ultra-high pressure rocks: Implications for element transfer in subduction zones. Lithos 2006, 92, 399–417. [Google Scholar] [CrossRef]
  4. Spandler, C.; Mavrogenes, J.; Hermann, J. Experimental constraints on element mobility from subducted sediments using high-P synthetic fluid/melt inclusions. Chem. Geol. 2007, 239, 228–249. [Google Scholar] [CrossRef]
  5. Cruz-Uribe, A.M.; Marschall, H.R.; Gaetani, G.A.; Le Roux, V. Generation of alkaline magmas in subduction zones by partial melting of mélange diapirs—An experimental study. Geology 2018, 46, 343–346. [Google Scholar] [CrossRef]
  6. Foley, S.; Tiepolo, M.; Vannucci, R. Growth of early continental crust controlled by melting of amphibolite in subduction zones. Nature 2002, 417, 837. [Google Scholar] [CrossRef]
  7. Kelemen, P.B.; Johnson, K.T.M.; Kinzler, R.J.; Irving, A.J. High-field-strength element depletions in arc basalts due to mantle–magma interaction. Nature 1990, 345, 521. [Google Scholar] [CrossRef]
  8. Woodhead, J.; Eggins, S.; Gamble, J. High field strength and transition element systematics in island arc and back-arc basin basalts: Evidence for multi-phase melt extraction and a depleted mantle wedge. Earth Planet. Sci. Lett. 1993, 114, 491–504. [Google Scholar] [CrossRef]
  9. Bostock, M.G.; Hyndman, R.D.; Rondenay, S.; Peacock, S.M. An inverted continental Moho and serpentinization of the forearc mantle. Nature 2002, 417, 536. [Google Scholar] [CrossRef]
  10. Brocher, T.M.; Parsons, T.; Tréhu, A.M.; Snelson, C.M.; Fisher, M.A. Seismic evidence for widespread serpentinized forearc upper mantle along the Cascadia margin. Geology 2003, 31, 267–270. [Google Scholar] [CrossRef]
  11. Hyndman, R.D.; Peacock, S.M. Serpentinization of the forearc mantle. Earth Planet. Sci. Lett. 2003, 212, 417–432. [Google Scholar] [CrossRef]
  12. Fryer, P.; Ambos, E.L.; Hussong, D.M. Origin and emplacement of Mariana forearc seamounts. Geology 1985, 13, 774–777. [Google Scholar] [CrossRef]
  13. Gülmez, F.; Genç, Ş.C.; Prelević, D.; Tüysüz, O.; Karacik, Z.; Roden, M.F.; Billor, Z. Ultrapotassic volcanism from the waning stage of the Neotethyan subduction: A key study from the Izmir–Ankara–Erzincan Suture Belt, Central Northern Turkey. J. Petrol. 2016, 57, 561–593. [Google Scholar] [CrossRef]
  14. Wyllie, P.J.; Sekine, T. The formation of mantle phlogopite in subduction zone hybridization. Contrib. Mineral. Petrol. 1982, 79, 375–380. [Google Scholar] [CrossRef]
  15. Konzett, J.; Ulmer, P. The Stability of Hydrous Potassic Phases in Lherzolitic Mantle—an Experimental Study to 9.5 GPa in Simplified and Natural Bulk Compositions. J. Petrol. 1999, 40, 629–652. [Google Scholar] [CrossRef]
  16. Tumiati, S.; Fumagalli, P.; Tiraboschi, C.; Poli, S. An Experimental Study on COH-bearing Peridotite up to 3·2 GPa and Implications for Crust–Mantle Recycling. J. Petrol. 2012, 54, 453–479. [Google Scholar] [CrossRef] [Green Version]
  17. Malaspina, N.; Hermann, J.; Scambelluri, M. Fluid/mineral interaction in UHP garnet peridotite. Lithos 2009, 107, 38–52. [Google Scholar] [CrossRef]
  18. Förster, M.W.; Selway, K. Melting of subducted sediments reconciles geophysical images of subduction zones. Nat. Commun. 2021, 12, 1320. [Google Scholar] [CrossRef]
  19. Prelević, D.; Foley, S.F.; Romer, R.; Conticelli, S. Mediterranean Tertiary lamproites derived from multiple source components in postcollisional geodynamics. Geochim. Et Cosmochim. Acta 2008, 72, 2125–2156. [Google Scholar] [CrossRef]
  20. Prelević, D.; Jacob, D.E.; Foley, S.F. Recycling plus: A new recipe for the formation of Alpine–Himalayan orogenic mantle lithosphere. Earth Planet. Sci. Lett. 2013, 362, 187–197. [Google Scholar] [CrossRef]
  21. Avanzinelli, R.; Lustrino, M.; Mattei, M.; Melluso, L.; Conticelli, S. Potassic and ultrapotassic magmatism in the circum-Tyrrhenian region: Significance of carbonated pelitic vs. pelitic sediment recycling at destructive plate margins. Lithos 2009, 113, 213–227. [Google Scholar] [CrossRef]
  22. Su, H.-M.; Jiang, S.-Y.; Zhang, D.-Y.; Wu, X.-K. Partial Melting of Subducted Sediments Produced Early Mesozoic Calc-alkaline Lamprophyres from Northern Guangxi Province, South China. Sci. Rep. 2017, 7, 4864. [Google Scholar] [CrossRef] [Green Version]
  23. Vigouroux, N.; Wallace, P.J.; Kent, A., Jr. Volatiles in high-K magmas from the western Trans-Mexican Volcanic Belt: Evidence for fluid fluxing and extreme enrichment of the mantle wedge by subduction processes. J. Petrol. 2008, 49, 1589–1618. [Google Scholar] [CrossRef]
  24. Bulatov, V.K.; Brey, G.P.; Girnis, A.V.; Gerdes, A.; Höfer, H.E. Carbonated sediment–peridotite interaction and melting at 7.5–12 GPa. Lithos 2014, 200, 368–385. [Google Scholar] [CrossRef]
  25. Rapp, R.P.; Watson, E.B. Dehydration melting of metabasalt at 8–32 kbar: Implications for continental growth and crust-mantle recycling. J. Petrol. 1995, 36, 891–931. [Google Scholar] [CrossRef]
  26. Woodland, A.B.; Bulatov, V.K.; Brey, G.P.; Girnis, A.V.; Höfer, H.E.; Gerdes, A. Subduction factory in an ampoule: Experiments on sediment–peridotite interaction under temperature gradient conditions. Geochim. Cosmochim. Acta 2018, 223, 319–349. [Google Scholar] [CrossRef]
  27. John, T.; Scherer, E.E.; Haase, K.; Schenk, V. Trace element fractionation during fluid-induced eclogitization in a subducting slab: Trace element and Lu–Hf–Sm–Nd isotope systematics. Earth Planet. Sci. Lett. 2004, 227, 441–456. [Google Scholar] [CrossRef]
  28. Wang, J.; Takahashi, E.; Xiong, X.; Chen, L.; Li, L.; Suzuki, T.; Walter, M.J. The Water-Saturated Solidus and Second Critical Endpoint of Peridotite: Implications for Magma Genesis Within the Mantle Wedge. J. Geophys. Res. Solid Earth 2020, 125, 10, e2020JB019452. [Google Scholar] [CrossRef]
  29. Syracuse, E.M.; van Keken, P.E.; Abers, G.A. The global range of subduction zone thermal models. Phys. Earth Planet. Inter. 2010, 183, 73–90. [Google Scholar] [CrossRef]
  30. McGary, R.S.; Evans, R.L.; Wannamaker, P.E.; Elsenbeck, J.; Rondenay, S. Pathway from subducting slab to surface for melt and fluids beneath Mount Rainier. Nature 2014, 511, 338. [Google Scholar] [CrossRef]
  31. Bussweiler, Y.; Gervasoni, F.; Rittner, M.; Berndt, J.; Klemme, S. Trace element mapping of high-pressure, high-temperature experimental samples with laser ablation ICP time-of-flight mass spectrometry–Illuminating melt-rock reactions in the lithospheric mantle. Lithos 2020, 352, 105282. [Google Scholar] [CrossRef]
  32. Förster, M.W.; Prelević, D.; Buhre, S.; Mertz-Kraus, R.; Foley, S.F. An experimental study of the role of partial melts of sediments versus mantle melts in the sources of potassic magmatism. J. Asian Earth Sci. 2019, 177, 76–88. [Google Scholar] [CrossRef]
  33. Förster, M.W.; Foley, S.F.; Marschall, H.R.; Buhre, S. Melting of sediments in the deep mantle produces saline fluid inclusions in diamonds. Sci. Adv. 2019, 5, eaau2620. [Google Scholar] [CrossRef] [Green Version]
  34. Förster, M.W.; Buhre, S.; Xu, B.; Prelević, D.; Mertz-Kraus, R.; Foley, S.F. Two-Stage Origin of K-Enrichment in Ultrapotassic Magmatism Simulated by Melting of Experimentally Metasomatized Mantle. Minerals 2020, 10, 41. [Google Scholar] [CrossRef] [Green Version]
  35. Le Roux, V.; Dick, H.J.B.; Shimizu, N. Tracking flux melting and melt percolation in supra-subduction peridotites (Josephine ophiolite, USA). Contrib. Mineral. Petrol. 2014, 168, 1064. [Google Scholar] [CrossRef]
  36. Ziaja, K.; Foley, S.F.; White, R.W.; Buhre, S. Metamorphism and melting of picritic crust in the early Earth. Lithos 2014, 189, 173–184. [Google Scholar] [CrossRef]
  37. Förster, M.W.; Prelević, D.; Schmück, H.R.; Buhre, S.; Marschall, H.R.; Mertz-Kraus, R.; Jacob, D.E. Melting phlogopite-rich MARID: Lamproites and the role of alkalis in olivine-liquid Ni-partitioning. Chem. Geol. 2018, 476, 429–440. [Google Scholar] [CrossRef]
  38. Nehring, F.; Jacob, D.E.; Barth, M.G.; Foley, S.F. Laser-ablation ICP-MS analysis of siliceous rock glasses fused on an iridium strip heater using MgO dilution. Microchim. Acta 2008, 160, 153–163. [Google Scholar] [CrossRef]
  39. Jochum, K.P.; Weis, U.; Stoll, B.; Kuzmin, D.; Yang, Q.; Raczek, I.; Jacob, D.E.; Stracke, A.; Birbaum, K.; Frick, D.A. Determination of reference values for NIST SRM 610–617 glasses following ISO guidelines. Geostand. Geoanalytical Res. 2011, 35, 397–429. [Google Scholar] [CrossRef]
  40. Jochum, K.P.; Nohl, U.; Herwig, K.; Lammel, E.; Stoll, B.; Hofmann, A.W. GeoReM: A new geochemical database for reference materials and isotopic standards. Geostand. Geoanalytical Res. 2005, 29, 333–338. [Google Scholar] [CrossRef]
  41. Griffin, W.L. GLITTER: Data reduction software for laser ablation ICP-MS. In Laser Ablation ICP-MS in the Earth Sciences: Current Practices and Outstanding Issues; Mineralogical Association of Canada: Quebec, QC, Canada, 2008; pp. 308–311. [Google Scholar]
  42. Bussweiler, Y.; Borovinskaya, O.; Tanner, M. Laser Ablation and inductively coupled plasma-time-of-flight mass spectrometry-A powerful combination for high-speed multielemental imaging on the micrometer scale. Spectroscopy 2017, 32, 14–20. [Google Scholar]
  43. Shaw, D.M. Trace element fractionation during anatexis. Geochim. Cosmochim. Acta 1970, 34, 237–243. [Google Scholar] [CrossRef]
  44. Gale, A.; Dalton, C.A.; Langmuir, C.H.; Su, Y.; Schilling, J.-G. The mean composition of ocean ridge basalts. Geochem. Geophys. Geosystems 2013, 14, 489–518. [Google Scholar] [CrossRef] [Green Version]
  45. Pearce, J.A.; Peate, D.W. Tectonic implications of the composition of volcanic arc magmas. Annu. Rev. Earth Planet. Sci. 1995, 23, 251–285. [Google Scholar] [CrossRef]
  46. Foley, S.F.; Barth, M.G.; Jenner, G.A. Rutile/melt partition coefficients for trace elements and an assessment of the influence of rutile on the trace element characteristics of subduction zone magmas. Geochim. Cosmochim. Acta 2000, 64, 933–938. [Google Scholar] [CrossRef] [Green Version]
  47. Penniston-Dorland, S.C.; Kohn, M.J.; Manning, C.E. The global range of subduction zone thermal structures from exhumed blueschists and eclogites: Rocks are hotter than models. Earth Planet. Sci. Lett. 2015, 428, 243–254. [Google Scholar] [CrossRef] [Green Version]
  48. Worzewski, T.; Jegen, M.; Kopp, H.; Brasse, H.; Castillo, W.T. Magnetotelluric image of the fluid cycle in the Costa Rican subduction zone. Nat. Geosci. 2011, 4, 108. [Google Scholar] [CrossRef] [Green Version]
  49. Pommier, A.; Evans, R.L. Constraints on fluids in subduction zones from electromagnetic data. Geosphere 2017, 13, 1026–1041. [Google Scholar] [CrossRef]
  50. Kawamoto, T.; Yoshikawa, M.; Kumagai, Y.; Mirabueno, M.H.T.; Okuno, M.; Kobayashi, T. Mantle wedge infiltrated with saline fluids from dehydration and decarbonation of subducting slab. Proc. Natl. Acad. Sci. USA 2013, 110, 9663–9668. [Google Scholar] [CrossRef] [PubMed] [Green Version]
  51. Grant, J.A. The isocon diagram; a simple solution to Gresens’ equation for metasomatic alteration. Econ. Geol. 1986, 81, 1976–1982. [Google Scholar] [CrossRef]
  52. Grant, J.A. Isocon analysis: A brief review of the method and applications. Phys. Chem. Earth Parts A/B/C 2005, 30, 997–1004. [Google Scholar] [CrossRef]
  53. Förster, M.W.; Prelević, D.; Schmück, H.R.; Buhre, S.; Veter, M.; Mertz-Kraus, R.; Foley, S.F.; Jacob, D.E. Melting and dynamic metasomatism of mixed harzburgite+ glimmerite mantle source: Implications for the genesis of orogenic potassic magmas. Chem. Geol. 2017, 455, 182–191. [Google Scholar] [CrossRef]
  54. van Keken, P.E.; Wada, I.; Abers, G.A.; Hacker, B.R.; Wang, K. Mafic high-pressure rocks are preferentially exhumed from warm subduction settings. Geochem. Geophys. Geosystems 2018, 19, 2934–2961. [Google Scholar] [CrossRef] [Green Version]
  55. Connolly, J.A.D.; Schmidt, M.W.; Solferino, G.; Bagdassarov, N. Permeability of asthenospheric mantle and melt extraction rates at mid-ocean ridges. Nature 2009, 462, 209. [Google Scholar] [CrossRef] [PubMed]
  56. Watson, E.B. Melt infiltration and magma evolution. Geology 1982, 10, 236–240. [Google Scholar] [CrossRef]
  57. Allegre, C.o.; Courtillot, V.; Tapponnier, P.; Hirn, A.; Mattauer, M.; Coulon, C.; Jaeger, J.J.; Achache, J.; Schärer, U.; Marcoux, J. Structure and evolution of the Himalaya–Tibet orogenic belt. Nature 1984, 307, 17. [Google Scholar] [CrossRef]
  58. Aharonov, E.; Whitehead, J.A.; Kelemen, P.B.; Spiegelman, M. Channeling instability of upwelling melt in the mantle. J. Geophys. Res. 1995, 100, 20433–20450. [Google Scholar] [CrossRef]
  59. Sawyer, E.W. Disequilibrium melting and the rate of melt–residuum separation during migmatization of mafic rocks from the Grenville Front, Quebec. J. Petrol. 1991, 32, 701–738. [Google Scholar] [CrossRef]
  60. Green, D.H.; Hibberson, W.O.; Rosenthal, A.; Kovács, I.; Yaxley, G.M.; Falloon, T.J.; Brink, F. Experimental study of the influence of water on melting and phase assemblages in the upper mantle. J. Petrol. 2014, 55, 2067–2096. [Google Scholar] [CrossRef] [Green Version]
  61. Huong, L.T.T.; Otter, L.M.; Förster, M.W.; Hauzenberger, C.A.; Krenn, K.; Alard, O.; Macholdt, D.S.; Weis, U.; Stoll, B.; Jochum, K.P. Femtosecond Laser Ablation-ICP-Mass Spectrometry and CHNS Elemental Analyzer Reveal Trace Element Characteristics of Danburite from Mexico, Tanzania, and Vietnam. Minerals 2018, 8, 234. [Google Scholar] [CrossRef] [Green Version]
  62. Otter, L.M.; Macholdt, D.S.; Jochum, K.P.; Stoll, B.; Weis, U.; Weber, B.; Scholz, D.; Haug, G.H.; Al-Amri, A.M.; Andreae, M.O. Geochemical insights into the relationship of rock varnish and adjacent mineral dust fractions. Chem. Geol. 2020, 551, 119775. [Google Scholar] [CrossRef]
Figure 3. Trace element maps recorded by LA-ICP-TOFMS show the distribution of S, Ni, Rb, Cs, Th, Zr, Ce, and Lu in relation to the mineralogy shown in the backscattered electron (Comp) image. Rb, Cs, and S are enriched in the reaction zone in phlogopite and sulphides. The sulphides also host Ni, explaining its heterogeneous occurrence inside the reaction zone. Th, Zr, and Ce are present within the reaction zone, while Lu is confined to the residue of the former sediment.
Geosciences 11 00372 g003
Figure 4. Element fractionation within the reaction zone. (A) Element distribution plot, showing element enrichment factors (D) calculated from LA-ICP-TOFMS raw counts in the reaction zone normalized to the depleted peridotite (dunite). (B) N-MORB normalized trace element contents [44] of the original sedimentary rock and the calculated metasome composition compared to post-collisional K-rich magmas [19,20]. The enrichment factors from (A) were used with the fractional melting equation [43] to calculate the trace element concentrations of the infiltrating and reacting melt. The metasome represents a 1–50% fractional melt of the sediment which reacts out completely as it infiltrates the dunite. The calculated composition of this reacting sediment melt is close to the observed array of trace elements of post-collisional K-rich magmas which are sourced from sediment-melt metasomatized mantle * [13,23], while the calculated residue of this reaction plots within the compositional range of arc magmas $ [45]. The trace element pattern of the 3 GPa/1000 °C reaction melt ^ [32], where the sediment melted to ~30%, plots within this calculated 1–50% range.
Geosciences 11 00372 g004
Figure 5. Rates of metasomatism. Daily metasome growth by infiltrating a reacting sediment melt (black diamonds in this study) and infiltration of potassic melt per day (blue circles, [37,53]) in other reaction experiments correlates exponentially with temperature. Rates of metasomatism are about 10–300 µm/d, which translates to 3–100 m/ky. At fore-arc temperatures (<950 °C), typical rates of infiltration of reacting siliceous melt are 3–5 m/ky, which is an order of magnitude lower than values for estimates of melt extraction rates in migmatites during regional metamorphism (grey square, [59]). Infiltrating potassic melt lies about 1–2 magnitudes higher and reaches 200–500 m/ky, in accordance with values determined for basaltic melts (yellow circle [56], orange triangles [55]).
Geosciences 11 00372 g005
Table 1. Experimental conditions and run products of the reaction of sediment + H2O + CO2 with dunite.
#T [°C]P [GPa]Duration [d]% MeltAssemblage in Former Sediment Reaction Zone Composition of Layers 1–3Reaction Zone Thickness [µm]SDEV [µm]Growth Rate [µm/d]
175024~0Cpx + Coe + Cc + PhePhl + Cpx (+ Opx)31106
2 b90024~20Cpx + Gt + glassPhl + Cpx + Opx + Mgs53413
3 a8003610Cpx + Gt + Coe + Cc + Phe + glassCpx + Opx + Dol + Mgs (+Phl)791413
485031315Cpx + Gt + Phe + glassPhl + Cpx + Opx + Mgs1371911
5 a90031420Cpx + Gt + glassPhl + Cpx + Opx (+ Mgs)2481118
6 b100034~30Cpx + Gt + glassOpx + Cpx (+ Phl)3024876
7 a90042~0Cpx + GtCpx + Opx + Mgs + Chlr---
8 a100043~0Cpx + GtCpx + Opx + Mgs + Chlr2713290
911004325Gt + glassCpx + Opx (+ Phl)---
10 a100051~0Cpx + GtCpx + Opx + Mgs + Chlr14719147
11100053~0Cpx + GtCpx + Opx + Mgs + Chlr2725291
12 a110063~0Cpx + GtCpx + Opx + Mgs + Chlr980133327
P—pressure, T—temperature, SDEV—1. Standard deviation, Phases: Chlr—Chloride, Cc—Calcite, Coe—Coesite, Cpx—Clinopyroxene, Dol—Dolomite, Gt—Garnet, Mgs—Magnesite, Opx—Orthopyroxene, Phe—Phengite, Phl—phlogopite, a [33], b [32].
Table 2. Average compositions of analyzed phases for each experiment.
Sample [Measured #]Na2OK2OMnOSiO2MgOFeOAl2O3CaOTiO2Total
Dunite Ol [30]0.01(1)0.01(1)0.14(2)40.2(3)50.3(2)8.4(3)0.01(1)0.02(1)0.02(2)99.1(3)
2 GPa/750 °C Phl [10]0.4(2)7.8(5)0.8(5)43(3)19(4)6(1)16(2)2(2)0.4(2)95(2)
2 GPa/900 °C Ol [5]0.02(2)0.01(1)0.13(2)40.5(1)50.5(1)8.61(4)0.02(1)0.04(1)0.01(1)99.8(3)
2 GPa/900 °C Glass [20]1.8(3)4.8(7)0.2(1)62(2)0.7(4)1.0(5)14.7(3)4(1)0.27(4)89(2)
2 GPa/900 °C Phl [10]0.26(5)8.5(9)0.09(5)41(1)25(3)3.6(3)12(1)1(1)0.3(2)91(2)
2 GPa/900 °C Cpx [10]1.5(2)0.13(8)1.0(4)48.8(9)11(1)5(1)10(2)19(1)0.48(8)97.3(6)
2 GPa/900 °C Gt [5]0.2(2)0.2(1)6(2)40(2)7.2(5)10.4(5)20.1(9)13.6(7)1.6(4)99.7(3)
3 GPa/800 °C Glass [10]1.4(4)3.4(3)0.11(4)66(2)0.4(4)0.3(1)13.6(5)2.2(6)0.22(2)89(2)
3 GPa/800 °C Phe [10]0.45(9)10.4(2)0.05(4)49(1)3.6(1)0.96(7)28.1(5)0.12(6)0.86(1)94.5(8)
3 GPa/800 °C Phl [10]0.4(3)8(1)0.13(9)44(2)25(2)1.1(1)12(1)2(1)0.6(1)95(1)
3 GPa/800 °C Cpx [10]3.0(6)0.2(3)0.7(3)53(3)13(3)1.9(6)7(2)16(1)0.23(7)96(4)
3 GPa/800 °C Gt [10]0.2(1)0.2(3)7(1)39(4)5.8(5)12(1)21(1)11.5(9)5(3)99(1)
3 GPa/850 °C Glass [10]0.8(2)4.5(8)0.15(7)66(5)0.10(6)0.13(4)13(1)1.4(5)0.21(4)86(6)
3 GPa/850 °C Phe [10]0.21(6)10.0(5)0.05(4)50(1)5.2(5)0.7(1)26.5(6)1(1)0.95(9)95.1(3)
3 GPa/850 °C Phl [15]0.2(1)8.0(6)0.06(3)42(3)22(1)5(1)11.3(8)2(2)0.72(7)91(4)
3 GPa/850 °C Cpx [10]2.4(5)0.3(4)0.4(2)55(1)14(2)1.3(3)7(2)19(1)0.15(6)99(1)
3 GPa/850 °C Opx [5]0.03(2)0.04(4)0.20(3)56(1)36(1)7(1)1.4(7)0.19(6)0.05(3)100(1)
3 GPa/850 °C Gt [10]0.12(7)0.04(3)4(2)41.2(8)10(2)10(1)22.4(3)13.4(7)0.7(2)101.7(2)
3 GPa/900 °C Ol [10]0.03(3)0.01(1)0.13(2)40.8(4)50.3(3)8.6(3)0.01(1)0.06(3)0.01(1)100.2(7)
3 GPa/900 °C Gl. [6]0.9(1)5.1(7)0.11(2)61.6(6)0.41(6)0.72(3)10.6(5)2.8(4)0.27(1)83(1)
3 GPa/900 °C Phl [20]0.8(5)9.3(4)0.09(4)42(1)23.7(7)3.1(2)13.8(7)0.3(2)0.6(1)94(1)
3 GPa/900 °C Cpx [10]1.3(3)0.1(1)0.3(1)54.1(6)16.2(8)2.5(3)3.7(7)22.0(6)0.17(3)100.5(8)
3 GPa/900 °C Opx [20]0.02(2)0.02(2)0.29(6)57(1)37(1)5.2(4)1.0(4)0.16(3)0.07(2)100(1)
3 GPa/900 °C Gt [10]0.08(2)0.02(2)4(1)40.3(9)12(3)12(5)22.9(4)8.3(8)0.4(1)101.1(6)
3 GPa/1000 °C Ol [5]0.02(1)0.01(1)0.20(6)39.8(2)50.20(8)8.3(2)0.02(2)0.04(1)0.02(1)98.6(2)
3 GPa/1000 °C Glass [6]1.1(1)3.8(1)0.71(9)47(1)4.6(3)2.7(2)13.5(3)9.5(6)0.87(7)83.9(7)
3 GPa/1000 °C Phl [10]0.22(2)9.26(6)0.08(3)40.2(3)23.6(1)2.4(1)15.4(3)0.01(1)1.2(1)92.5(6)
3 GPa/1000 °C Cpx [10]0.84(8)0.03(3)0.71(6)51.9(6)14.9(7)3.1(3)5(1)21.9(2)0.22(6)98.6(4)
3 GPa/1000 °C Opx [10]0.02(2)0.03(3)0.43(4)54.9(9)34.3(5)4.9(2)2.5(6)0.7(3)0.08(3)98.3(8)
3 GPa/1000 °C Gt [10]0.02(3)0.02(2)4.2(4)40.5(6)12(1)8.6(6)21.9(5)11.1(5)0.33(5)99.1(2)
4 GPa/1100 °C Phl [20]0.26(7)8.4(6)0.20(3)46 (2)23(1)4.1(6)10(2)0.2(2)1.1(2)94(2)
4 GPa/1100 °C Gt [20]0.04(4)0.01(1)4(2)41(2)12(7)12(6)22.9(8)10(3)0.4(2)101.7(4)
5 GPa/1000 °C Ol [10]0.01(1)0.01(1)0.14(2)40.2(3)50.3(2)8.4(3)0.01(1)0.02(1)0.02(2)99.1(3)
5 GPa/1000 °C Cpx [10]3.4(6)0.1(1)0.43(4)54.4(4)14(1)2.0(2)7(1)18.0(9)0.14(3)98.5(4)
5 GPa/1000 °C Opx [10]0.04(3)0.04(3)0.20(5)56.3(8)35.6(7)4.9(1)0.61(9)0.3(1)0.09(4)98.3(7)
5 GPa/1000 °C Gt [10]0.18(5)0.06(2)3.1(5)39.9(5)10.7(9)8.3(8)22.3(3)13.9(7)0.6(2)99.0(4)
Ol—Olivine, Opx—Orthopyroxene, Cpx—Clinopyroxene, Gt—Garnet, Phl—Phlogopite. Numbers in parentheses refer to the 1 sigma standard deviation on the last digit.
Publisher’s Note: MDPI stays neutral with regard to jurisdictional claims in published maps and institutional affiliations.

