Article

Seismicity Patterns Prior to the Thessaly (Mw6.3) Strong Earthquake on 3 March 2021 in Terms of Multiresolution Wavelets and Natural Time Analysis

by
Filippos Vallianatos
1,2,*,
Georgios Michas
1,2 and
George Hloupis
2,3
1
Institute of Physics of the Earth’s Interior and Geohazards, UNESCO Chair on Solid Earth Physics and Geohazards Risk Reduction, Hellenic Mediterranean University Research Center, 73133 Chania, Greece
2
Section of Geophysics—Geothermics, Department of Geology and Geoenvironment, National and Kapodistrian University of Athens, 15784 Athens, Greece
3
Department of Surveying and Geoinformatics Engineering, University of West Attica, Egaleo Campus, 12244 Athens, Greece
*
Author to whom correspondence should be addressed.
Submission received: 9 August 2021 / Revised: 2 September 2021 / Accepted: 8 September 2021 / Published: 9 September 2021
(This article belongs to the Special Issue Morphogenic Faulting: Current Practices and Future Challenges)

Abstract

:
On 3 March 2021, a strong, shallow earthquake of moment magnitude, Mw6.3, occurred in northern Thessaly (Central Greece). To investigate possible complex correlations in the evolution of seismicity in the broader area of Central Greece before the Mw6.3 event, we apply the methods of multiresolution wavelet analysis (MRWA) and natural time (NT) analysis. The description of seismicity evolution by critical parameters defined by NT analysis, integrated with the results of MRWA as the initiation point for the NT analysis, forms a new framework that may possibly lead to new universal principles that describe the generation processes of strong earthquakes. In the present work, we investigate this new framework in the seismicity prior to the Mw6.3 Thessaly earthquake. Initially, we apply MRWA to the interevent time series of the successive regional earthquakes in order to investigate the approach of the regional seismicity at critical stages and to define the starting point of the natural time domain. Then, we apply the NT analysis, showing that the regional seismicity approached criticality a few days before the occurrence of the Mw6.3 earthquake, when the κ1 natural time parameter reached the critical value of κ1 = 0.070.

1. Introduction

On 3 March 2021, an MW6.3 earthquake occurred in northern Thessaly (Central Greece), close to the cities of Tyrnavos, Elassona and Larisa (Figure 1). The earthquake occurred in a region that is one of the most seismically active in Greece, mainly characterized by normal faulting along NW–SE striking faults, which belong to the Thessaly fault zone [1,2,3,4,5,6,7,8,9,10]. Based on the provided focal plane solutions [11], the mainshock was generated by the activation of an NW–SE striking normal fault (Figure 1) [12]. The mainshock was widely felt in the Thessaly basin and in the surrounding areas, from Athens in the south to the northern borders of Greece.
The Thessaly basin has a well-known history of large earthquakes, with mainshocks presenting typical magnitudes between 6.0 and 7.0 [3,4,5,6,7,8,9,10,11,12,13,14,15]. During the last century, eight major earthquakes, with magnitudes equal to or larger than 6.0, have occurred in this area. The M = 7.0, 1954 Sofades earthquake was the most destructive event, resulting in heavy damages in the broader southern Thessaly region (Papazachos and Papazachou, 2002; [15]). The M = 6.8, 1957 Velestino earthquake and the M = 6.5, 1980 Almyros earthquake, are two more significant events, with similarly destructive consequences.
Strong arguments show that the earthquake generation process can be considered as a critical point phenomenon that culminates with a large event as some critical point is approached [16,17,18,19,20,21,22,23,24,25]. New findings regarding the complex dynamics that characterize various geodynamic phenomena illustrate stimulating features in the framework of new concepts, as that of non-extensive statistical physics [22,23,24,25], multiresolution wavelets analysis [26,27,28] and of the novel time domain, termed as natural time [29,30,31,32,33,34,35,36,37,38,39].
The concept of natural time (NT) has been introduced recently to analyze possible pre-seismic signals [29,30,35]. The analysis of various complex systems in the NT domain enables the optimal extraction of signal information by reducing the uncertainties related to the conventional time, as well as the identification of long-range correlations in the evolution of the system, even in the presence of “heavy tails” [40]. The usefulness of NT analysis has been discussed in a number of applications to known critical phenomena, such as fracturing, earthquakes, the 2-D Ising model and 3-D turbulent flow [24,35], and references therein, and it has been tested experimentally in fracturing experiments in the laboratory by analyzing acoustic emissions time series [23,41].
Furthermore, wavelet-based methods have been introduced to characterize fractal signals [42,43,44,45] and to overcome effects associated with non-stationarities [46,47], a very frequent effect in the time dynamics of an earthquake sequence.
The goal of the present work is to test and evaluate the seismicity patterns in terms of MRWA and NT analyses, as applied in the evolution of seismicity prior to the recent Mw6.3 Thessaly strong event. The recent upgrading of the regional seismological networks [48] provides an accurate catalogue of microseismicity in the area and enables the application of such methodologies. The earthquake catalogs used herein are taken from the Hellenic Unified Seismological Network (HUSN) (http://eida.gein.noa.gr/, last accessed on 27 May 2021), where instruments belonging to the HL (National Observatory of Athens, Institute of Geodynamics, 1997) [49] and HT (Aristotle University of Thessaloniki Seismological Network, 1981) [50] networks provide a complete spatial coverage in the broader area of Greece, with a magnitude of completeness (Mc) down to 2.0. Figure 2 presents the seismic activity observed in the region of Thessaly for a period starting in January 2016, approximately 1900 days before the 3 March 2021 mainshock and within an area of radius, R = 80 km, around its epicenter. The main objective of this study is to investigate the applicability of NT analysis, as presented in the regional seismic activity prior to the Mw6.3 Thessaly earthquake, integrated with the results of MRWA applied to the interevent time series of the successive events, in order to define, with an objective technique, the starting point for the analysis in the NT domain. The description of seismicity evolution with the NT parameters, integrated with the results of MRWA, represents a novel framework that may lead to a better understanding of the evolution of earthquake generation processes.

2. Multiresolution Wavelets Analysis in the Seismicity of Thessaly Region

The temporal evolution of seismicity and the time-scaling properties are of crucial importance [51,52,53] for understanding the correlation properties of seismicity [54]. The analysis of time intervals between successive seismic events can be grouped in exponential or power laws revealing similar behaviours over different scales [55].
A Wavelet Transform (WT) involves the decomposition of a signal function into simpler, fixed building blocks at different scales and positions. In a similar way to Fourier transform (FT), WT operates on a signal and transforms it from the time domain to a different domain, offering a new representation. In Fourier analysis, the sine and cosine functions are used as a basis and localized in the frequency domain with a difficulty to process a function having components that are localized in the time domain. As a result, a small frequency change in FT produces changes everywhere in this domain. On the other hand, wavelet functions are localized both in frequency or scale, and in time, via dilations and translations of the mother wavelet, respectively. This leads to compact representation of large classes of functions in the wavelet domain. This is one of the major advantages of WT: an event can be simultaneously described in the frequency domain as well as in the time domain, unlike the usual Fourier transform where an event is accurately described either in the frequency or in the time domain. As a consequence, MRWA of data with different behaviour on different scales can greatly benefit from the use of WT.
The discrete wavelet transform (DWT) transforms a data vector of length M into a different vector of the same length. A wavelet basis is characterized by a particular set of parameters, called wavelet filter coefficients. In practice, DWT is commonly implemented using dyadic multirate filter banks, which divide the signal frequency band into sub bands [28]. For a point process such as that of the interevent times sequence, the wavelet coefficients can be derived from
W m , n w a v = 2 m / 2 i = 1 L t i ψ ( 2 m i n )
where the scale variable m and the translation variable n are integers, L represents the total number of interevent times ti analysed and ψ is the wavelet function. The DWT is evaluated at the points (m, n) in the scale-interval-number plane. Smaller scales correspond to more rapid variations and, therefore, to higher frequencies.
In the current study, we perform MRWA by examining the standard deviation of wavelet coefficients as a function of scale, as described from
σ w a v ( m ) = 1 N 1 n = 1 N ( W m , n w a v W m , n w a v ) 2
where N is the number of wavelet coefficients at a given scale m and the brackets indicate the average among the coefficients at a scale m. Figure 3 presents the interevent times between two successive events versus the occurrence time of the second event until the major seismic event, in a region within a circle of radius, R = 80 km, around the epicenter and a magnitude threshold, Mth = 2.0. The time period that was covered for MRWA of interevent times spanned from January 2016 until 3 March 2021, when the main event of Mw6.3 occurred. In Figure 4 the time– earthquake magnitude plot for a radius R = 80 km around the epicenter and a magnitude threshold, Mth = 2.0 is presented.
The wavelet choice is dictated by the requirement to identify a rather sharp change in a possible cyclic sequence. Following the same pre-processing approach as in [28], we tested several candidate wavelets at small scales up to m = 4 and received quite similar results. Thus, in the current work, we present results from the analysis using the db4 wavelet.
We investigated the time evolution of the σwav(m), using fixed event number windows of 16 events shifting through the entire series. The shift between successive windows was set in two events. Consistently with the length of the time window, we analysed the time variation of the σwav(m) for lower scales (m = 1 to 4) since the number of available events is limited. Each calculated value is associated with the time of the last event in the window. Figure 5 shows a representative set of results for the time evolution of the σwav(m) using the db4 wavelet with four scales for MRWA, for the seismicity observed in three circles around the epicenter of the mainshock and within a radius of 30 km, 50 km and 80 km, respectively.
An initial comment from Figure 5 is the significant temporal variability in the strength of the multiscale properties of the interevent times. As observed in previous studies [26,27], before the major event of the seismic sequence a traceable decrease in the temporal evolution of the σwav, m(t) appeared, especially at lower scales. Plots at Figure 5 dictate the search for a time marker beginning several months before the major event for all the scales analyzed. The sharp decrease at lower scales (m = 1 and m = 2), which is observed before the major event, can be qualified as such a time marker since the decrease is evident for several days and is clearly identifiable.
Translating the result from lower scales in an alternative way, we propose the use of the observed time markers, which appear a few months before the major event, as the initiation point for the natural time analysis that follows. The main purpose is to combine the two independent methods (MRWA and NT analysis) that have been successfully used for the identification of critical stages in earthquake preparation processes, in a joint approach that will maximize the advantages of each one. More specifically, the initial application of MRWA in a broader time period reveals time segments where the NT analysis is then used to investigate for indicators suggesting the entrance to the critical stage.

3. Natural Time Analysis of Seismicity before the Thessaly Mw6.3, March 2021 Earthquake
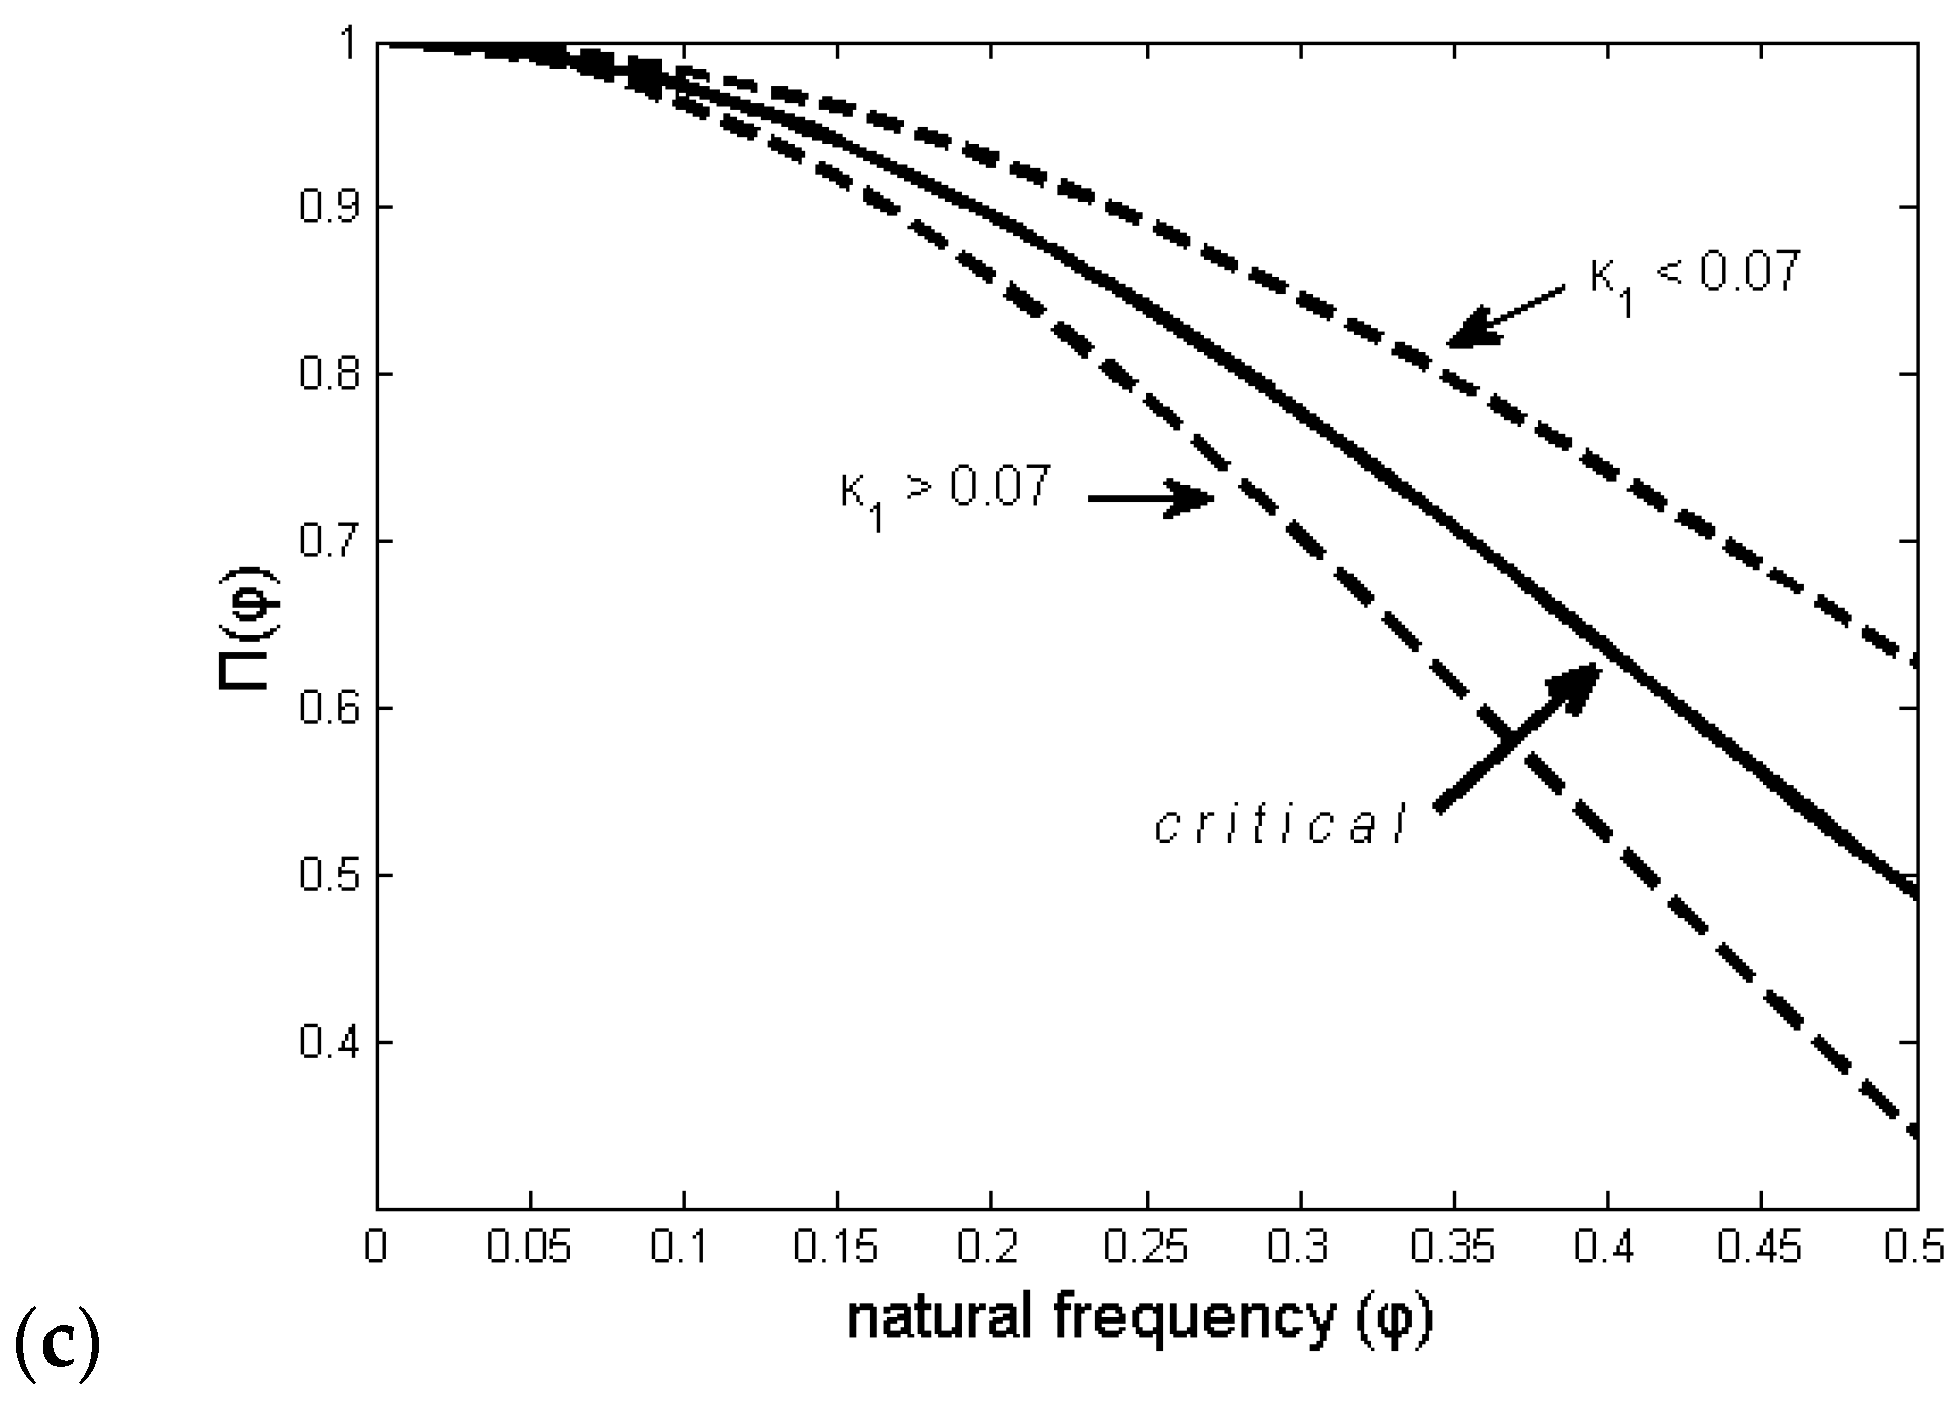
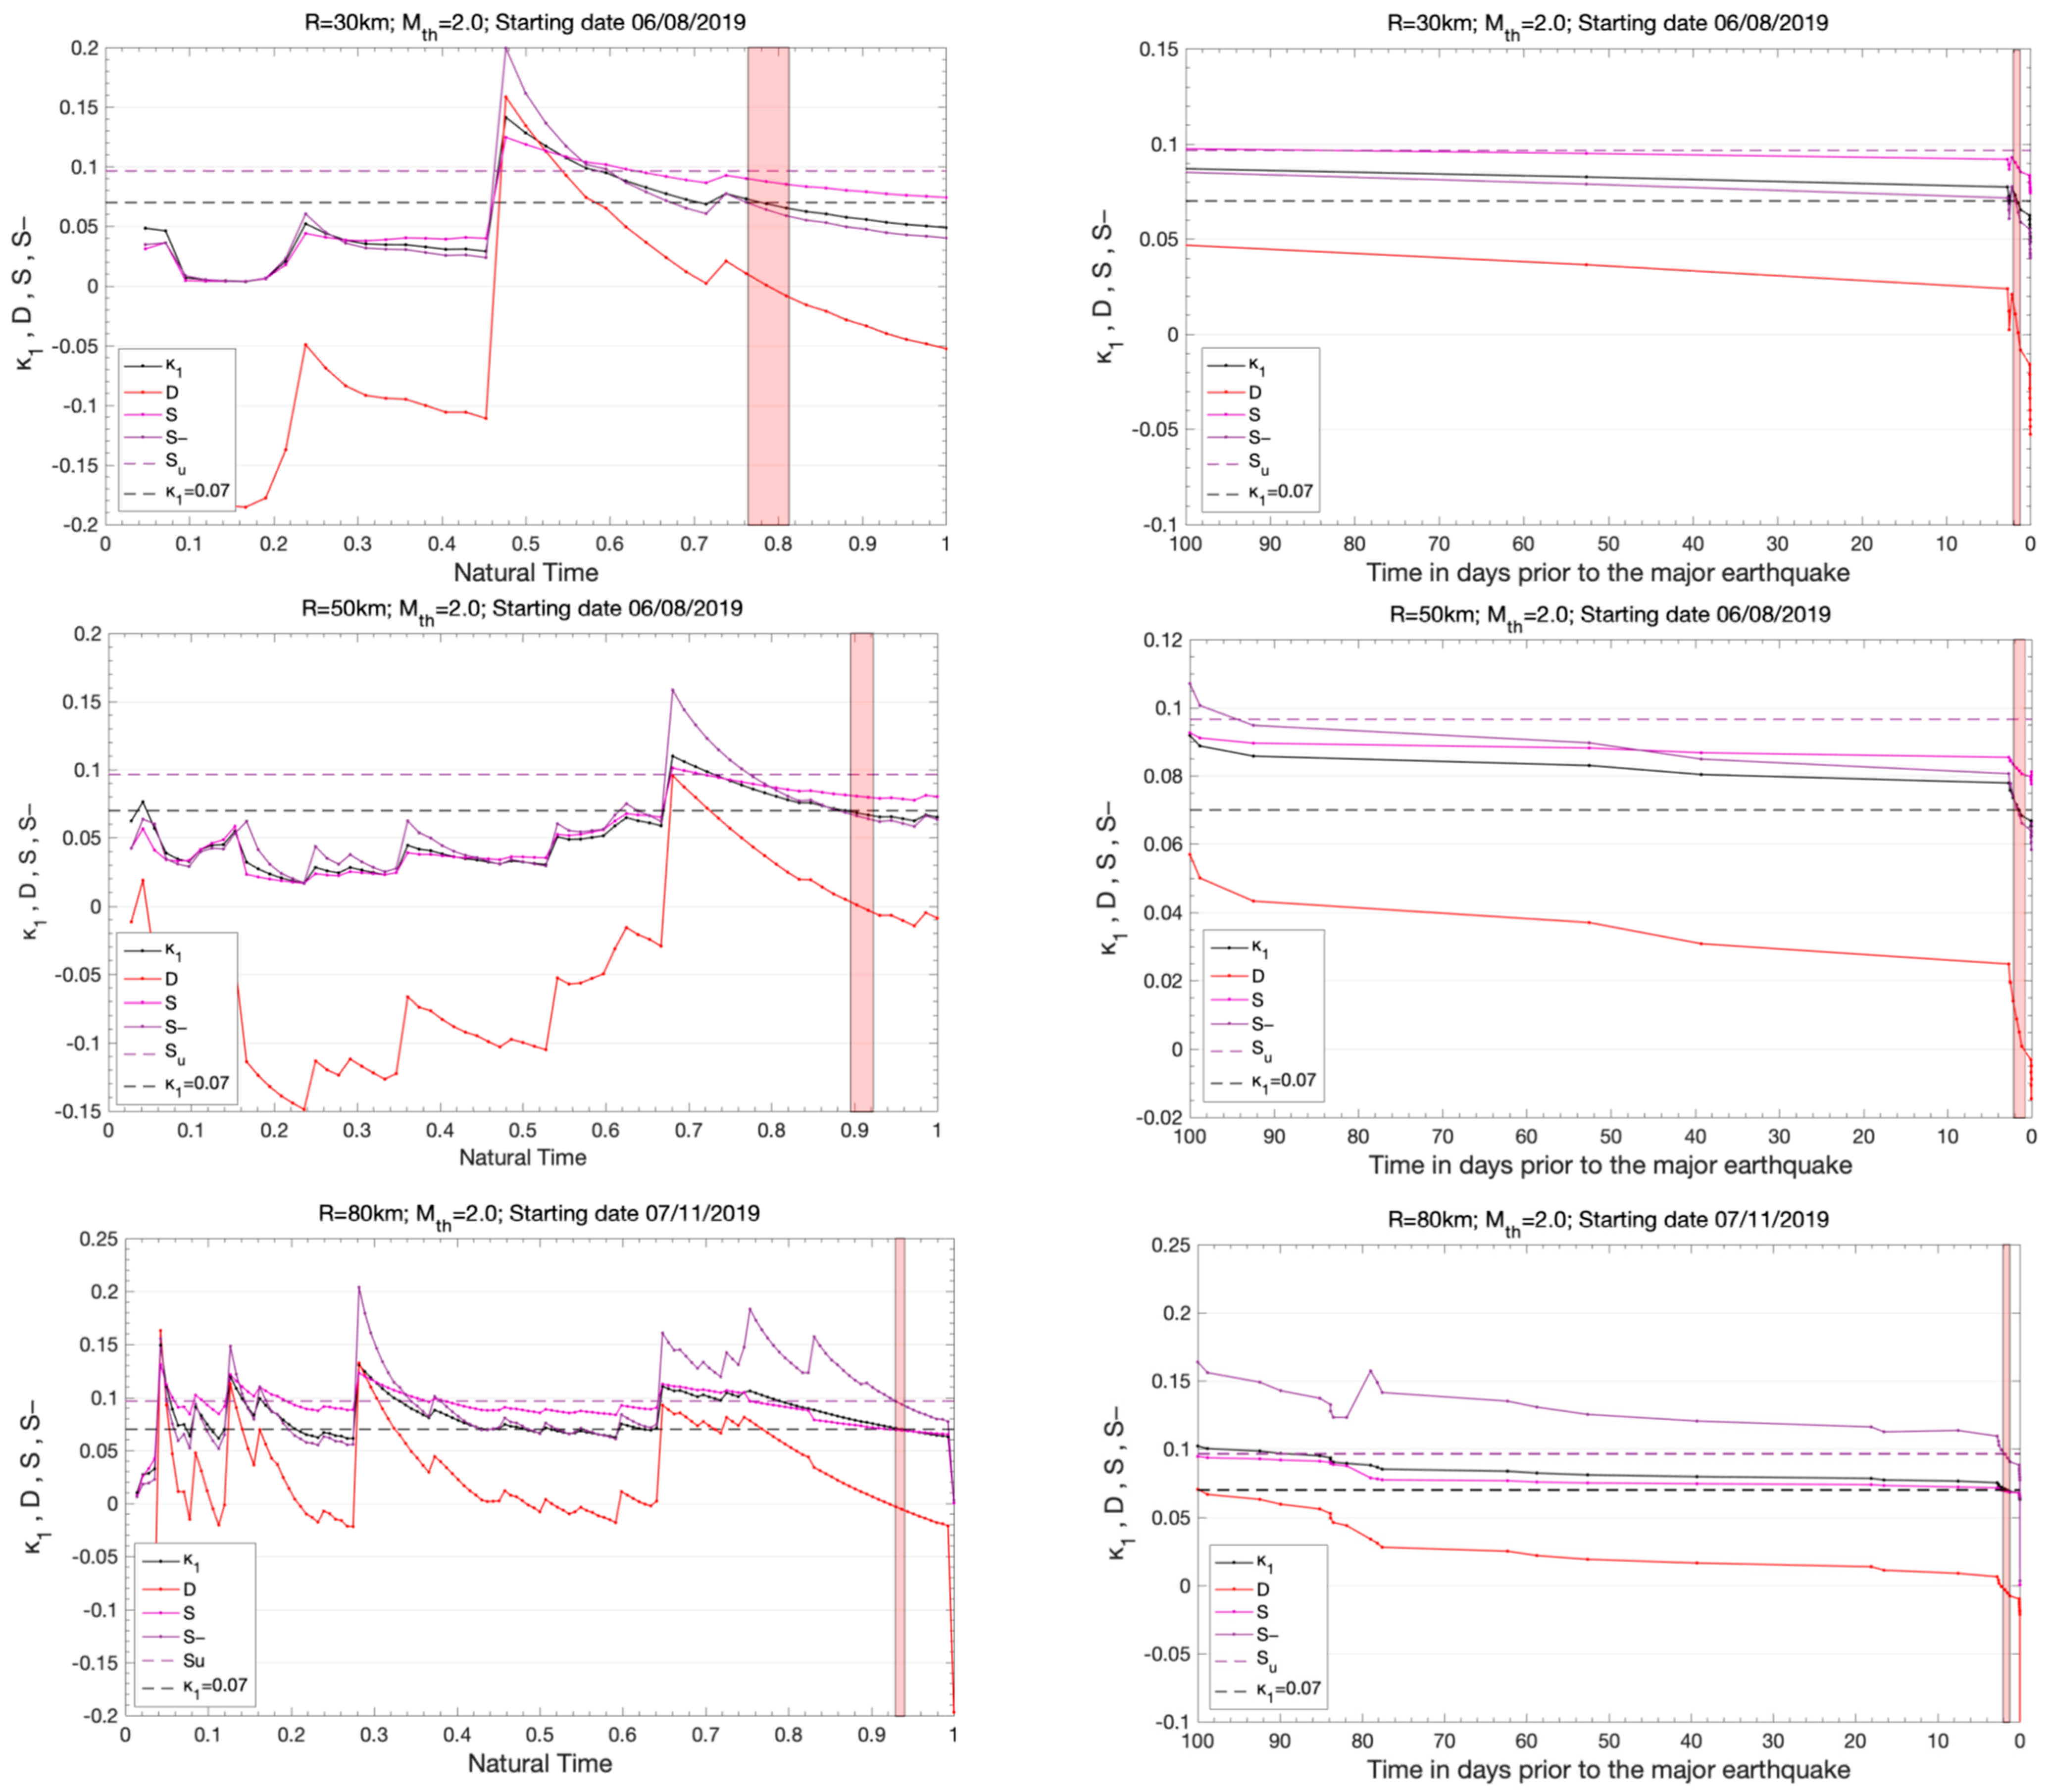
The analysis of a complex system in the NT domain has been introduced in [29,35]. In the case of seismicity, the natural time χ, defined as χ k = k / N , serves as an index for the occurrence of the kth event out of N total events. The seismic moment released during the kth event is then considered, forming the pair (χk, Mk) for further analysis (see [28]). The evolution of (χk, Mk) is further described by the continuous function F(ω), defined as: F ( ω ) = k = 1 N M k e x p ( i ω k N ) (3) where ω = 2 π ϕ and ϕ stands for the natural frequency.
F(ω) is normalized by division with F(0)
Φ ( ω ) = k = 1 N M k e x p ( i ω k N ) n = 1 N M n = k = 1 N p k e x p ( i ω k N )
where p k = M k / n = 1 N M n . The quantity pk describes the probability to observe an earthquake event at natural time χk. The normalized power spectrum can then be obtained from (4), as Π ( ω ) = | Φ ( ω ) | 2 . In the context of probability theory, and for natural frequencies of ϕ less than 0.5, Π(ω) reduces to a characteristic function for the probability distribution pk. It has been shown that the following relation holds [29,56]
Π ( ω ) = 18 5 ω 2 6 cos ω 5 ω 2 12 sin ω 5 ω 3
According to probability theory, once the behavior of the characteristic function of the distribution is known around zero, then the moments and, hence, the distribution itself can be approximately determined. For ω → 0, (4) leads to
Π ( ω ) 1 κ 1 ω 2
where κ1 is the variance in natural time, given as
κ 1 = χ 2 χ 2 = k = 1 N p k χ k 2 ( k = 1 N p k χ k ) 2
It has been shown that the properties of Π(ω) at ω → 0, i.e., the values of κ1 = 0.07, can signify the approach of a complex system towards some critical point [35], such as that of an impending large earthquake (see [24,31,37] and references therein). Figure 6 shows an earthquake timeseries in conventional (Figure 6a) and natural time (Figure 6b) domains. Figure 6c shows the corresponding power spectrum Π(ω) for the critical stage with κ1 = 0.070, based on Equation (6), while the two other curves are for non-critical stages. Theoretically, it has been shown that κ1 approaches 0.083 as N → ∞, when there are no long-ranged correlations in the system [35].
As a new event occurs, the pair (χk, pk) is rescaled and κ1 varies. It has been verified that when the parameter κ1 converges to the value 0.070, the system enters a critical state [33,35,56].
Furthermore, the entropy in the NT domain, Snt, is defined as [35]
S n t = χ l n χ χ l n χ = k = 1 N p k χ k l n χ κ ( κ = 1 Ν p k χ k )   l n ( κ = 1 Ν p k χ k )
where f ( χ ) = κ = 1 Ν p k f ( χ k ) .
The entropy, Snt, is a dynamic quantity that depends on the sequential order of events. Moreover, upon the time reversal T, i.e., Tpm = pN − m + 1, the entropy, Snt, is further defined. When the analysed seismicity approaches a “true” critical state, the following conditions should be fulfilled [35,56]:
(i).
The “average” distance D, defined by the normalized power spectra Π(ω) of the evolving seismicity and by the theoretical estimation of Π(ω) for κ1 = 0.070, should be less than 10−2.
(ii).
The parameter κ1 should approach the critical value of κ1 = 0.070 by “descending from above”.
(iii).
Both natural time entropies, Snt and Snt, should be lower than the entropy of uniform noise Su = (ln2/2) − 1/4 when κ1 approaches 0.070.
(iv).
Since the dynamic evolution of the system is expected to be self-similar in the critical state, the time of the true coincidence should not vary upon changing (within reasonable limits) either the magnitude threshold, Mth, or the area used in the calculation.
In [28], the authors proposed the use of the time marker indicated by MRWA in the seismicity evolution before the major event as the initiation point for the NT analysis. In the frame of this approach, the two independent methods (MRWA and NT analysis) were integrated to identify the approach to the critical stage in the earthquake preparation process. In particular, the initial application of MRWA in a broader time period of the regional seismicity before the major event reveals time segments where the NT analysis is going to investigate for indicators suggesting the entrance to the critical stage.
In Figure 7, the computed Π(ϕ) curves are shown as they approach the critical Π(ϕ) in the regional seismicity, for a threshold magnitude of Mth = 2.0 and for areas of radius R = 30 km, R = 50 km and R = 80 km, respectively, around the epicenter of the main event. This analysis clearly demonstrates that, from 28 February to 2 March 2021, one to three days before the Mw6.3 earthquake of 3 March 2021, the critical Π(ϕ) was approached. In all cases, for R = 30 km, R = 50 km and R = 80 km, the NT analysis starts at approximately one to two months around the corresponding time markers indicated by MRWA (see Figure 5). It may, thus, be considered that the critical point for the regional seismicity was approached around that time. What happened during the last time period before the main event can be seen in Figure 7, which depicts the time evolution of Π(ϕ), for 0 ≤ ϕ ≤ 0.5, for Mth ≥ 2.0 and R = 30 km, 50 km and 80 km, when calculations started on 6 August 2019 for R = 30 km and R = 50 km and on 7 November 2019 for R = 80 km. It also becomes interesting that around that time, when the critical point was reached, seismicity started to occur in the epicentral region registering a few shallow, weak earthquakes prior to the mainshock. These events, which may be considered as foreshocks, do not affect the analysis, as their occurrence coincides with the approach to the critical point.
Applying the NT analysis to the seismicity that occurred prior to the Mw6.3 event in the Thessaly region, starting the analysis from approximately the time markers in the lower scales indicated by MRWA and up to the time of the mainshock occurrence, we observe that all criticality requirements are fulfilled. The latter is more clearly demonstrated by the parameters D, κ1, Snt and Snt, as they evolved event by event, and are computed and plotted in the natural time domain and in the conventional time, approximately 100 days before the mainshock (Figure 8). In Figure 8, we observe that all the requirements are fulfilled a few days before the mainshock for all three cases that we study, i.e., for R = 30 km, R = 50 km and R = 80 km around the epicenter of the mainshock. The results, thus, indicate that the regional seismicity presented criticality characteristics a few days before the main event.

4. Concluding Remarks

In the present work, we investigated the regional patterns of seismicity in the area of the Thessaly (Mw6.3) strong earthquake on 3 March 2021, by applying MRWA and NT analysis, two methods that have been used for the identification of critical stages in the preparation process of major earthquakes. The analysis was performed in the natural time domain, with an approximate starting point indicated by MRWA. The latter showed a decrease in the standard deviation of the wavelet coefficients σwav(m) at much lower scales, similar to the observations in [26,27,54] prior to the occurrence of major events. Within this joint approach, the initial application of MRWA in regional seismicity around the epicenter, and for a wide time period before the mainshock, indicated a time segment where the NT analysis was applied in order to explore possible indicators that suggested the entrance to a critical stage.
The results demonstrated that regional seismicity approached criticality a few days before the Mw6.3 earthquake that occurred on 3 March 2021 in the Thessaly region, in agreement with the results in [57]. In other words, the curve of the power spectrum, Π(ϕ), in the natural time domain that characterizes the evolution of the regional seismicity, coincided with the theoretical curve of critical point phenomena a few days before the Mw6.3 mainshock, in a similar way to that of non-equilibrium critical systems. Hence, the analysis of the regional seismicity in the natural time domain, initiated at approximately the time marks indicated by the results of MRWA, pointed to an approximate date of the impending large Mw6.3 earthquake of 3 March 2021, within a narrow time window in the order of a few days. These results lay further support to the methodology introduced in [28] regarding the combination of MRWA and NT analyses for the identification of critical stages of regional seismicity prior to strong earthquakes, providing a novel and promising framework for better understanding the evolution of earthquake generation processes.

Author Contributions

Conceptualization, F.V.; methodology, F.V., G.M. and G.H.; validation, F.V., G.M. and G.H.; resources, F.V., G.M. and G.H.; data curation, F.V.; writing—original draft preparation, F.V.; writing—review and editing, F.V., G.M. and G.H. All authors have read and agreed to the published version of the manuscript.

Funding

We acknowledge support of this study by the project “HELPOS: Hellenic Plate Observing System” (MIS 5002697) which is implemented under the action “Reinforcement of the Research and Innovation Infrastructure”, funded by the Operational Programme “Competitiveness, Entrepreneurship and Innovation” (NSRF 2014–2020) and co-financed by Greece and the European Union European Regional Development Fund.

Data Availability Statement

Data are available at http://eida.gein.noa.gr/, at the National Observatory of Athens, Institute of Geodynamics, doi:10.7914/SN/HL, and the Aristotle University of Thessaloniki Seismological Network, doi:10.7914/SN/HT (last accessed on 1 June 2021).

Acknowledgments

The authors are grateful to the personnel of the Geodynamic Institute of the National Observatory of Athens and the Department of Geophysics of the Aristotle University of Thessaloniki involved in installing, operating and maintaining the stations used in this study, as well as all staff involved in the Hellenic Unified Seismic Network. We thank K. Pavlou for her help in the creation of Figure 2.

Conflicts of Interest

The authors declare no conflict of interest.

References

  1. Caputo, R. Inference of a seismic gap from geological data: Thessaly (Central Greece) as a case study. Ann. Geophys. 1995, 38, 1–19. [Google Scholar] [CrossRef]
  2. Caputo, R.; Chatzipetros, A.; Pavlides, S.; Sboras, S. The Greek Database of Seismogenic Sources (GreDaSS): State-of-the-art for northern Greece. Ann. Geophys. 2013, 55, 859–894. [Google Scholar] [CrossRef]
  3. Caputo, R.; Helly, B.; Pavlides, S.; Papadopoulos, G. Palaeoseismological investigation of the Tyrnavos Fault (Thessaly, Central Greece). Tectonophysics 2004, 394, 1–20. [Google Scholar] [CrossRef]
  4. Caputo, R.; Pavlides, S. Greek Database of Seismogenic Sources (GreDaSS); Università Degli Studi di Ferrara: Ferrara, Italy, 2013. [Google Scholar]
  5. Caputo, R.; Pavlides, S. Late Cainozoic geodynamic evolution of Thessaly and surroundings (central-northern Greece). Tectonophysics 1993, 223, 339–362. [Google Scholar] [CrossRef]
  6. Chatzipetros, A.; Lazos, I.; Pavlides, S.; Pikridas, C.; Bitharis, S. Determination of the active tectonic regime of Thessaly, Greece: A geodetic data based approach. In Proceedings of the XXI International Congress of the CBGA, Salzburg, Austria, 10–13 September 2018; p. 227. [Google Scholar]
  7. Tolomei, C.; Caputo, R.; Polcari, M.; Famiglietti, N.A.; Maggini, M.; Stramondo, S. The use of interferometric synthetic aperture radar for isolating the contribution of major shocks: The case of the march 2021 thessaly, greece, seismic sequence. Geosciences 2021, 11, 191. [Google Scholar] [CrossRef]
  8. Caputo, R.; Helly, B.; Rapti, D.; Valkaniotis, S. Late Quaternary hydrographic evolution in Thessaly (Central Greece): The crucial role of the Piniada Valley. Quat. Int. 2021, in press. [Google Scholar] [CrossRef]
  9. Caputo, R.; Bravard, J.-P.; Helly, B. The Pliocene-Quaternary tecto-sedimentary evolution of the Larissa Plain (Eastern Thessaly, Greece). Geodin. Acta 1994, 7, 219–231. [Google Scholar] [CrossRef]
  10. Caputo, R.; Piscitelli, S.; Oliveto, A.; Rizzo, E.; Lapenna, V. The use of electrical resistivity tomography in active tectonics. Examples from the Tyrnavos Basin. Greece. J. Geodyn. 2003, 36, 19–35. [Google Scholar]
  11. Ganas, A.; Valkaniotis, S.; Briole, P.; Serpetsidaki, A.; Kapetanidis, V.; Karasante, I.; Kassaras, I.; Papathanassiou, G.; Karamitros, I.; Tsironi, V.; et al. Domino-style earthquakes along blind normal faults in Northern Thessaly (Greece): Kinematic evidence from field observations, seismology, SAR interferometry and GNSS. Bull. Geol. Soc. 2021, 58, 37–86. [Google Scholar] [CrossRef]
  12. Ganas, A.; Oikonomou, I.A.; Tsimi, C. NOAfaults: A digital database for active faults in Greece. Bull. Geol. Soc. 2017, 47, 518–530. [Google Scholar] [CrossRef] [Green Version]
  13. Kouskouna, V. The (December 28th, 1891) January 9th, 1892 Larisa (Central Greece) earthquake. Bull. Geol. Soc. 2001, 34, 1425–1432. (In Greek) [Google Scholar]
  14. Papadimitriou, E.; Karakostas, V. Episodic occurrence of strong (Mw ≥ 6.2) earthquakes in Thessalia area (central Greece). Earth Planet. Sci. Lett. 2003, 215, 395–409. [Google Scholar] [CrossRef]
  15. Papazachos, B.C.; Papazachou, C. The Earthquakes of Greece; Ziti Publ. Co.: Thessaloniki, Greece, 2003; p. 286. (In Greek) [Google Scholar]
  16. Bak, P.; Tang, C. Earthquakes as a self-organized critical phenomenon. J. Geophys. Res. Space Phys. 1989, 94, 15635–15637. [Google Scholar] [CrossRef] [Green Version]
  17. Kiyashchenko, D.; Smirnova, N.; Troyan, V.; Vallianatos, F. Dynamics of multifractal and correlation characteristics of the spatio-temporal distribution of regional seismicity before the strong earthquakes. Nat. Hazards Earth Syst. Sci. 2003, 3, 285–298. [Google Scholar] [CrossRef]
  18. Kiyashchenko, D.; Smirnova, N.; Troyan, V.; Vallianatos, F. Seismic hazard precursory evolution: Fractal and multifractal as-pects. Phys. Chem. Earth 2004, 29, 367–378. [Google Scholar] [CrossRef]
  19. Michas, G.; Vallianatos, F.; Sammonds, P. Non-extensivity and long-range correlations in the earthquake activity at the West Corinth rift (Greece). Nonlinear Process. Geophys. 2013, 20, 713–724. [Google Scholar] [CrossRef] [Green Version]
  20. Rundle, J.B.; Turcotte, D.L.; Shcherbakov, R.; Klein, W.; Sammis, C. Statistical physics approach to understanding the multiscale dynamics of earthquake fault systems. Rev. Geophys. 2003, 41, 5-1–5-30. [Google Scholar] [CrossRef] [Green Version]
  21. Sornette, D. Critical Phenomena in Natural Sciences; Springer: Berlin/Heidelberg, Germany, 2000. [Google Scholar]
  22. Tsallis, C. Introduction to Nonextensive Statistical Mechanics: Approaching a Complex World; Springer: Berlin, Germany, 2009. [Google Scholar]
  23. Uritsky, V.; Smirnova, N.; Troyan, V.; Vallianatos, F. Critical dynamics of fractal fault systems and its role in the generation of pre-seismic electromagnetic emissions. Phys. Chem. Earth 2004, 29, 473–480. [Google Scholar] [CrossRef]
  24. Vallianatos, F.; Michas, G.; Benson, P.; Sammonds, P. Natural time analysis of critical phenomena: The case of acoustic emis-sions in triaxially deformed Etna basalt. Phys. A Stat. Mech. Appl. 2013, 392, 5172–5178. [Google Scholar] [CrossRef]
  25. Vallianatos, F.; Michas, G.; Papadakis, G. Non-extensive and natural time analysis of seismicity before the Mw6.4, October 12, 2013 earthquake in the South West segment of the Hellenic Arc. Phys. A Stat. Mech. Appl. 2014, 414, 163–173. [Google Scholar] [CrossRef]
  26. Telesca, L.; Lapenna, V.; Alexis, N. Multiresolution wavelet analysis of earthquakes. Chaos Solitons Fractals 2004, 22, 741–748. [Google Scholar] [CrossRef]
  27. Telesca, L.; Hloupis, G.; Nikolintaga, I.; Vallianatos, F. Temporal patterns in southern Aegean seismicity revealed by the mul-tiresolution wavelet analysis. Commun. Nonlinear Sci. Numer. Simul. 2007, 12, 1418–1426. [Google Scholar] [CrossRef]
  28. Vallianatos, F.; Michas, G.; Hloupis, G. Multiresolution wavelets and natural time analysis before the January–February 2014 Cephalonia (Mw6.1 & 6.0) sequence of strong earthquake events. Phys. Chem. Earth 2015, 85, 201–209. [Google Scholar]
  29. Varotsos, P.A.; Sarlis, N.; Skordas, E. Long-range correlations in the electric signals that precede rupture. Phys. Rev. E 2002, 66, 11902. [Google Scholar] [CrossRef] [Green Version]
  30. Varotsos, P.A.; Sarlis, N.; Skordas, E.; Lazaridou, M.S. Natural entropy fluctuations discriminate similar-looking electric signals emitted from systems of different dynamics. Phys. Rev. E 2005, 71, 11110. [Google Scholar] [CrossRef] [Green Version]
  31. Varotsos, P.; Sarlis, N.; Tanaka, H.K.; Skordas, E. Similarity of fluctuations in correlated systems: The case of seismicity. Phys. Rev. E 2005, 72, 41103. [Google Scholar] [CrossRef] [Green Version]
  32. Varotsos, P.A.; Sarlis, N.; Skordas, E.; Tanaka, H.K.; Lazaridou, M.S. Entropy of seismic electric signals: Analysis in natural time under time reversal. Phys. Rev. E 2006, 73, 31114. [Google Scholar] [CrossRef] [PubMed] [Green Version]
  33. Varotsos, P.A.; Skordas, E.; Sarlis, N.; Lazaridou, M.S. Fluctuations, under time reversal, of the natural time and the entropy distinguish similar looking electric signals of different dynamics. J. Appl. Phys. 2008, 103, 14906. [Google Scholar] [CrossRef] [Green Version]
  34. Varotsos, P.; Sarlis, N.; Skordas, E. Detrended fluctuation analysis of the magnetic and electric field variations that precede rupture. Chaos Interdiscip. J. Nonlinear Sci. 2009, 19, 23114. [Google Scholar] [CrossRef] [Green Version]
  35. Varotsos, P.A.; Sarlis, N.; Skordas, E.S. Natural Time Analysis: The New View of Time. In Natural Time Analysis: The New View of Time; Springer: New York, NY, USA, 2011. [Google Scholar]
  36. Varotsos, P.; Sarlis, N.V.; Skordas, E.S.; Uyeda, S.; Kamogawa, M. Natural time analysis of critical phenomena. Proc. Natl. Acad. Sci. USA 2011, 108, 11361–11364. [Google Scholar] [CrossRef] [PubMed] [Green Version]
  37. Sarlis, N.; Skordas, E.; Lazaridou, M.S.; Varotsos, P. Investigation of seismicity after the initiation of a Seismic Electric Signal activity until the main shock. Proc. Japan Acad. Ser. B 2008, 84, 331–343. [Google Scholar] [CrossRef]
  38. Sarlis, N.; Skordas, E.; Varotsos, P. Multiplicative cascades and seismicity in natural time. Phys. Rev. E 2009, 80, 22102. [Google Scholar] [CrossRef] [PubMed] [Green Version]
  39. Sarlis, N.; Skordas, E.; Varotsos, P. Nonextensivity and natural time: The case of seismicity. Phys. Rev. E 2010, 82, 21110. [Google Scholar] [CrossRef] [Green Version]
  40. Abe, S.; Sarlis, N.V.; Skordas, E.S.; Tanaka, H.K.; Varotsos, P.A. Origin of the Usefulness of the Natural-Time Representation of Complex Time Series. Phys. Rev. Lett. 2005, 94, 170601. [Google Scholar] [CrossRef] [Green Version]
  41. Saltas, V.; Vallianatos, F.; Triantis, D.; Stavrakas, I. Complexity in Laboratory Seismology: From Electrical and Acoustic Emis-sions to fracture. In Complexity of Seismic Time Series; Chelidze, T., Telesca, L., Eds.; Elsevier: Amsterdam, The Netherlands, 2018. [Google Scholar]
  42. Thurner, S.; Lowen, S.B.; Feurstein, M.C.; Heneghan, C.; Feichtinger, H.G.; Teich, M.C. Analysis, Synthesis, and Estimation of Fractal-Rate Stochastic Point Processes. Fractals 1997, 5, 565–595. [Google Scholar] [CrossRef] [Green Version]
  43. Abry, P.; Flandrin, P.; Taqqu, M.S.; Veitch, D. Wavelets for the analysis, estimation, and synthesis of scaling data. In Self-Similar Network Traffic and Performance Evaluation; Wiley: Hoboken, NJ, USA, 2000. [Google Scholar]
  44. Abry, P.; Flandrin, P.; Taqqu, M.S.; Veitch, D. Self-similarity and long-range dependence through the wavelet lens. In Theory and Applications of Long-Range Dependence; Doukhan, P., Oppenheim, G., Taqqu, M.S., Eds.; Birkhäuser: Basel, Switzerland, 2002; pp. 527–556. [Google Scholar]
  45. Abry, P.; Veitch, D. Wavelet analysis of long-range-dependent traffic. IEEE Trans. Inf. Theory 1998, 44, 2–15. [Google Scholar] [CrossRef]
  46. Wornell, G.W.; Gaumond, C.F. Signal Processing with Fractals: A Wavelet Based Approach. J. Acoust. Soc. Am. 1999, 105, 18. [Google Scholar] [CrossRef] [Green Version]
  47. Teich, M.C.; Heneghan, C.; Lowen, S.B.; Turcott, R.G. Estimating the Fractal Exponent of Point Processes in Biological Systems Using Wavelet- and Fourier-Transform Methods. In WAVELETS in Medicine and Biology; Informa UK Limited: London, UK, 2017; pp. 383–412. [Google Scholar]
  48. Evangelidis, C.P.; Triantafyllis, N.; Samios, M.; Boukouras, K.; Kontakos, K.; Ktenidou, O.-J.; Fountoulakis, I.; Kalogeras, I.; Melis, N.S.; Galanis, O.; et al. Seismic Waveform Data from Greece and Cyprus: Integration, Archival, and Open Access. Seism. Res. Lett. 2021, 92, 1672–1684. [Google Scholar] [CrossRef]
  49. National Observatory of Athens, Institute of Geodynamics. National Observatory of Athens Seismic Network; National Observatory of Athens, Institute of Geodynamics: Athens, Greece, 1997. [Google Scholar] [CrossRef]
  50. Aristotle University of Thessaloniki Seismological Network. Permanent Regional Seismological Network Operated by the Aristotle University of Thessaloniki; Aristotle University of Thessaloniki Seismological Network: Thessaloniki, Greece, 1981. [Google Scholar] [CrossRef]
  51. Godano, C.; Caruso, V. Multifractal analysis of earthquake catalogues. Geophys. J. Int. 1995, 121, 385–392. [Google Scholar] [CrossRef] [Green Version]
  52. Öncel, A.O.; Main, I.G.; Alptekin, O.; Cowie, P.A. Spatial variation in the fractal properties of seismicity in the north Anatolian fault zone. Tectonophysics 1996, 257, 189–202. [Google Scholar] [CrossRef]
  53. Hainzl, S.; Scherbaum, F.; Beauval, C. Estimating Background Activity Based on Interevent-Time Distribution. Bull. Seismol. Soc. Am. 2006, 96, 313–320. [Google Scholar] [CrossRef] [Green Version]
  54. Corral, Á.; Christensen, K. Comment on “Earthquakes Descaled: On Waiting Time Distributions and Scaling Laws.”. Phys. Rev. Lett. 2006, 96, 109801. [Google Scholar] [CrossRef]
  55. Abe, S.; Suzuki, N. Scale-free statistics of time interval between successive earthquakes. Phys. A Stat. Mech. Appl. 2005, 350, 588–596. [Google Scholar] [CrossRef] [Green Version]
  56. Uyeda, S.; Kamogawa, M.; Tanaka, H. Analysis of electrical activity and seismicity in the natural time domain for the volcanic-seismic swarm activity in 2000 in the Izu Island region, Japan. J. Geophys. Res. Space Phys. 2009, 114, 2310. [Google Scholar] [CrossRef] [Green Version]
  57. Chatzopoulos, G. Accelerating deformation seismicity patterns before the 3 March 2021 Thessaly strong earthquake. First results. Bull. Geol. Soc. 2021, 58, 87–104. [Google Scholar] [CrossRef]
Figure 1. Earthquake epicenters of the aftershock sequence of the 3 March 2021, Thessaly earthquake (yellow star), from 3 March 2021 to 18 April 2021 (M ≥ 2.0). The focal mechanisms of the mainshock and the largest aftershock are also indicated, along with the regional faults shown with black solid lines (for details see the text).
Geosciences 11 00379 g001
Figure 2. The observed seismicity in the Thessaly region between January 2016 and 3 March 2021, in an area of radius R = 80 km around the mainshock (star).
Geosciences 11 00379 g002
Figure 3. Interevent times between two successive events versus occurrence time of each event for a radius R = 80 km around the epicenter and a magnitude threshold, Mth = 2.0.
Geosciences 11 00379 g003
Figure 4. Time–Magnitude plot for a radius R = 80 km around the epicenter and a magnitude threshold, Mth = 2.0.
Geosciences 11 00379 g004
Figure 5. Time variation of σwav(m) with scale m ranging from 1 up to 4, for moving windows with length of 16 events and a shift of 2 events. Interevent times were estimated using the HUSN catalogue (from January 2016 until 3 March 2021), for events within a radius R = 30 km (top 4 plots), 50 km (middle 4 plots) and 80 km (bottom 4 plots) around the Mw = 6.3 epicenter and a magnitude threshold, Mth = 2.0. Red vertical line indicates the day of minimum in variance, observed at each scale.
Geosciences 11 00379 g005aGeosciences 11 00379 g005b
Figure 6. Time series of seismic events (a) in conventional time t and (b) in the natural time χ. (c) Schematic diagram showing the power spectrum Π(ϕ) in natural time. Solid line is Π(ϕ) obtained from Equation (4) for the critical stage (κ1 = 0.070), whereas two other lines are for κ1 > 0.07 and κ1 < 0.07.
Geosciences 11 00379 g006aGeosciences 11 00379 g006b
Figure 7. Time evolution of Π(ϕ), for 0 ≤ ϕ ≤ 0.5, of the seismic activity, for Mth ≥ 2.0 and R = 30 km (top), R = 50 km (middle), and R = 80 km (bottom), when calculations start on 6 August 2019 for R = 30 km and R = 50 km and on 7 November 2019 for R = 80 km. Π(ϕ) curves (dashed lines) fall on the theoretical Π(ϕ) curve (red solid lines), calculated from Equation (6), as the critical stage is approached.
Geosciences 11 00379 g007aGeosciences 11 00379 g007b
Figure 8. Time evolution of the NT analysis parameters κ1, D, Snt and Snt−, in natural time (left) and conventional time (right), as they evolve event by event prior to the Thessaly Mw6.3 mainshock, considering an area with radius of R = 30 km (top), R = 50 km (middle), and R = 80 km (bottom) around the epicenter and for a magnitude threshold Mth = 2.0. The analysis was started on 6 August 2019 for R = 30 km and R = 50 km and on 7 November 2019 for R = 80 km. The dashed horizontal lines indicate the entropy limit of Su = 0.0966 and the value κ1= 0.070. The shaded rectangle marks the time when the critical stage is approached.
Geosciences 11 00379 g008
Publisher’s Note: MDPI stays neutral with regard to jurisdictional claims in published maps and institutional affiliations.

