
Determination of Total Mercury and Carbon in a National Baseline Study of Urban House Dust


1
Exposure and Biomonitoring Division, Environmental Health Science and Research Bureau, HECS Branch, Health Canada, 251 Sir Frederick Banting Driveway, Ottawa, ON K1A 0K9, Canada
2
Department of Earth and Environmental Sciences, University of Ottawa, 140 Louis Pasteur, Ottawa, ON K1N 6N5, Canada
*
Author to whom correspondence should be addressed.
Geosciences 2022, 12(2), 52; https://0-doi-org.brum.beds.ac.uk/10.3390/geosciences12020052
Submission received: 17 December 2021
/
Revised: 14 January 2022
/
Accepted: 19 January 2022
/
Published: 22 January 2022
(This article belongs to the Special Issue Medical Geology in the Urban Environment)
Abstract
:Mercury (Hg) is one of the top ten chemicals of concern for public health, according to the World Health Organization. This study investigates Hg concentrations in house dust collected from urban single family homes, to better understand typical indoor residential exposures. Using direct solid sample analysis, total Hg and carbon (TC) were determined in the <80 µm fraction of settled dust samples collected under the Canadian House Dust Study. Hg concentrations displayed a log-normal distribution with median/geomean of 0.68/0.70 mg/kg (n = 995). A small subset (<1%) of homes exhibited anomalously high dust Hg concentrations (>9.0 mg/kg). A comparison of Hg concentrations in fresh dust and household vacuum dust collected from the same homes indicated no significant difference in the two sampling methods. Total carbon concentrations displayed a median/geomean of 29.3/28.5% (n = 1011). A significant correlation between total Hg and TC in house dust (p < 0.00001) reflects the association between Hg and organic carbon previously observed in soil and sediments. The results of this study indicate a 10-fold enrichment in house dust compared with the average background concentrations reported for soil and sediments (0.07 mg/kg). The observed enrichment is attributable to Hg emissions from indoor sources and/or Hg carried home from occupational sources.
1. Introduction
Mercury (Hg) is a toxic metal identified by the World Health Organization (WHO) as one of the top ten chemicals of concern for public health [1]. A combination of anthropogenic and natural sources and processes has contributed to the enrichment of Hg in the surface environment and food chain globally [2,3]. Mercury occurs in the environment as gaseous elemental Hg, inorganic Hg2+ compounds, and organic compounds of which methylmercury is the most toxic form [4]. Methylmercury bioaccumulates along the food chain posing a risk for human health through consumption of high trophic level aquatic species [2,5]. Results of the Canadian Health Measures Survey (2007–2009), which included 5319 respondents aged 6–79 years, demonstrated that fish and shellfish consumption significantly influenced blood Hg levels in the Canadian population, attributable to methylmercury ingestion [6]. Total blood Hg levels were also influenced by smoking, alcohol consumption, and number of dental amalgams [6]. Amongst other health impacts, exposure to Hg can impair the nervous system, respiratory function, and the gastrointestinal system and can lead to death in cases of extreme exposure [2,3]. Canada-wide legislation and standards for Hg management have been established since the 1990s, in cooperation with the United States and Mexico, with the intention of limiting the use of Hg and its release into the environment, thus decreasing human exposure to Hg and minimizing impacts on health [7,8].
All of the populations are exposed to Hg to some extent, and exposure to elemental and inorganic Hg mainly occurs in occupational settings through contact with products containing Hg and contaminated outdoor environments [3,4]. Throughout the 20th century, Hg was used in a wide variety of consumer products and medical devices, including switches, relays, fluorescent lamps, barometers, thermostats, dental amalgams, thermometers, vaccines, and eyedrops [5,7]. Nowadays, most uses of Hg have been reduced or replaced by alternatives, such as light-emitting diode (LED) bulbs rather than fluorescent lamps, and lithium, silver, and alkaline batteries rather than Hg-containing batteries [9]. Nevertheless, Hg is still found in relatively high concentrations in the indoor environment. For this reason, it is regarded as a “re-emerging chemical” [10].
Indoor monitoring for Hg exposures is generally associated with workplace air quality [3] and there are relatively few studies that quantify Hg exposures in indoor residential environments. Majewski et al. [11] found that gaseous elemental Hg in the indoor environment tends to adsorb strongly onto fine particulate matter (PM) resulting in enrichment of Hg in indoor PM1 relative to outdoor PM1. As house dust is a sink for inorganic and organic contaminants, it serves as a useful indicator of indoor exposures [12]. Studies of homes not impacted by local Hg mining or smelting activities or other industrial sources of Hg [13,14,15] have indicated elevated Hg concentrations in indoor settled dust samples compared with the corresponding outdoor soil and dust samples. In outdoor environmental media, Hg displays an affinity for organic matter: The mercuric ion is strongly sequestered by organic compounds in soil and sediments, and consequently total Hg concentrations tend to correlate with organic matter concentrations in these media [16,17,18]. As the organic carbon content of house dust tends to be 5-fold higher than the corresponding garden soil [19], it follows that Hg may display a similar affinity for organic carbon in the indoor environment.
The methods established for Hg determination in soil and sediments are appropriate for house dust. One of the most commonly used techniques for quantifying total Hg in these media is acid digestion (e.g., aqua regia) followed by stannous chloride reduction and spectroscopic determination. Wet digestion methods must take steps to ensure that no Hg is lost throughout the process, and thus tend to be more labor intensive than the direct solid sample analysis [20]. Another challenge associated with wet digestion is the difficulty of dissolving low solubility Hg compounds, such as Hg sulfide [21]. Instrumental neutron activation analysis (INAA) is also listed amongst the techniques that can be used successfully for Hg quantification. However, due to its high cost and infrastructure requirements, it is not widely used. In addition, higher limits of detection (LOD) associated with this method further restrict the application of INAA. Thermal decomposition with subsequent trapping by amalgamation, followed by atomic absorption spectrophotometry (e.g., US-EPA Method 7473), is another approach used to quantify Hg [22]. A key advantage of this method is that the sample pre-treatment is limited to drying and sieving, which provides a fast turn-around time [20]. To investigate the above-mentioned affinity of Hg for organic carbon, a method is also needed to determine the carbon content of house dust. The most commonly used methods for the determination of TC in environmental samples are: Time-of-flight mass spectrometry techniques, dry combustion by automated system, wet chemical oxidation, and loss-on ignition [23,24,25]. In these methods, the total carbon (TC) content of a sample corresponds to the sum of total organic carbon (TOC) and total inorganic carbon (TIC) [23]. TC is quantified by the complete oxidation of all of the carbon forms present in a sample, whereas TOC is determined by first eliminating TIC from the sample using an acid treatment [23]. Based on this relationship (TC = TOC + TIC), the indirect quantification of TIC is typically performed by quantifying TC and TOC, then calculating TIC by subtraction [25,26].
The present study was undertaken to characterize total Hg concentrations in house dust collected from typical urban Canadian homes, and to investigate whether the Hg–carbon relationship that is observed in outdoor media is also observed in indoor dust. Direct solid sample analytical methods were selected for this purpose: The DMA-80 direct mercury analyzer for total Hg and the VarioMAXTM CN carbon analyzer for total C determination. The accuracy and reproducibility of both methods were evaluated using certified reference materials. The solid sample methodologies were applied to samples collected under the Canadian House Dust Study [27,28], to obtain a nationally representative baseline for total Hg and C concentrations in house dust. Finally, an evaluation of sample collection and sample preparation methods was undertaken to inform the design of future house dust studies.
2. Materials and Methods
2.1. Sample Collection and Preparation
Settled house dust samples were collected from 1025 urban single family homes across Canada under the Canadian House Dust Study (CHDS), as described previously [27,28]. The goal of the statistical design was to obtain urban baseline datasets representative of the country, not individual provinces, regions or cities. The homes were selected using a stratified random sampling design. The homes identified for recruitment were randomly selected from a total of 107 dissemination areas (DAs), which were randomly selected from 13 cities with a population greater than 100,000 [27]. During the house visit, technicians documented basic house characteristics (e.g., heating practices, dates of construction, proximity to industry, occupations). None of the sampled DAs were located in the vicinity of Hg mining or smelting activities or any other Hg-releasing industries.
The samples were collected during the winter season over 4 years, from 2007 to 2010. The sampling protocol generated two types of vacuum samples per home: The household vacuum dust (hereafter “HD”) and the fresh or “active” house dust (hereafter “FD”). The HD sample was collected from the participant’s vacuum system, which was used for their regular cleaning activities. The FD sample was a composite sample of active dust collected from floors or carpets of all the available living spaces within each house. The FD sample was collected by technicians using a Pullman Holt vacuum cleaner (Model 102 ASB-12PD) [28], who vacuumed areas that were part of the regular cleaning routine of the participants, with the exception of wet areas (e.g., bathrooms, workshops). These areas were avoided in order to preserve sample integrity.
All of the vacuum samples (HD and FD) were air-dried for a minimum of 24 h prior to their size fractionation using stainless steel sieves (W.S. Tyler, Mentor, OH, USA; Cat. Nos. 2451, 5209, 5205). The <80 µm size fraction was stored in amber glass bottles with PTFE-lined cap (Fisher Scientific, Waltham, MA, USA) at −4 °C until elemental determination. Previous research [19] showed that the <80 µm size fraction of house dust had the advantage of greater homogeneity and typically higher metal concentrations than coarser fractions. Finer dust fractions also have greater relevance for particle resuspension models and childhood exposure estimates [12,29]. No further sample preparation was required for the direct solid-sample analytical techniques used in this study. Although most homes were represented by both HD and FD samples originally, there was insufficient FD sample mass remaining for many homes after the completion of elemental analyses for previous studies. For homes lacking an adequate FD sample, HD samples were used instead, for 112 homes in the case of Hg determination and for 203 homes in the case of TC determination. A comparison of Hg concentrations in a matched set of HD and FD samples was conducted in the present study, for 29 homes that were represented by both sample types.
2.2. Mercury Instrumentation
A total of 995 dust samples was analyzed for total Hg using the DMA-80 Direct Mercury Analyzer (Milestone Inc., Bergamo, Italy), which is a solid sample analyzer based on the principle of atomic absorption spectrometry. The DMA-80 is equipped with a dual spectrophotometer cell and a silicon UV photodetector. High purity oxygen (Linde Canada Inc., Ottawa, ON, Canada) was used as the combustion and carrier gas. Quartz sample boats were pre-cleaned to avoid contamination using the following procedure: Soaked overnight in a 4% aqueous based HNO3 solution (HNO3, 67–70%, Seastar Chemical Inc., Sydney, BC, Canada), rinsed with deionized water (DIW, Milli-Q 18.2 MΩ), then dried and heated in a muffle furnace (Model 650-14, Fisher Scientific, Waltham, MA, USA) until its temperature reached 900 °C. The DMA-80 analytical approach and settings followed US-EPA Method 7473 [22]. The dust samples were mixed thoroughly to ensure homogeneity and a mass of 250 mg was weighed directly into the quartz boat using an Excellence Plus XP analytical balance (XP205; Mettler Toledo, Mississauga, ON, Canada). The sample was dried inside the DMA-80 for 60 s at 300 °C. Then, the furnace temperature was increased to 650 °C for 180 s, which allowed for sample decomposition. Subsequently, the Hg vapors were transported, by the carrier gas (flow rate 8 L/h), to the catalyst tube where the impurities were removed. This procedure converted all forms of Hg in the sample to elemental Hg, which was carried as vapor to the gold amalgamator where it was quantitatively trapped. After the amalgamator had completed its flash heat cycle (at 850 °C), Hg was released into the atomic absorption spectrophotometer where the absorption intensity was measured at a wavelength of 253.65 nm. Finally, the resulting Hg peak height was integrated by the EasyDoc software (Milestone Inc., Bergamo, Italy) and the total Hg concentration was reported in mg/kg.
The Hg calibration curve was assessed daily using two Certified Reference Materials (CRMs) obtained from the National Institute of Standards and Technology (NIST) (Gaithersburg, MD, USA) as recommended by US-EPA Method 7473 [22]. The DMA-80 was calibrated over a range of 0.5 to 500 ng of Hg. NIST 2587 (trace elements in soil containing lead from paint, nominal 3000 mg/kg lead) was used to calibrate spectrophotometer cell 1, which reads low concentrations (0 to 15 ng Hg). In addition, NIST 2584 (trace elements in indoor dust, nominal 1% lead) was used to calibrate spectrophotometer cell 2, which reads higher concentrations (up to 500 ng Hg). When the observed concentrations were within 20% of their true value, the calibration curve was considered to be valid and the analysis could begin. If the returned values did not meet the acceptance criteria, a new calibration curve was built using fresh CRMs. Before each batch of sample analysis, the DMA-80 was flushed through three consecutive readings of an empty sample location. Quartz boat cleaning efficiency was assessed using the mean of three consecutive analyses of empty boats.
2.3. Carbon Instrumentation
A total of 1011 dust samples was analyzed for TC by dry oxidative combustion using an Elementar VarioMAXTM carbon analyzer (Elementar Ltd., Langenselbold, Germany) equipped with a thermal conductivity detector (TCD). The carbon analyzer furnace reaction tubes and drying tubes were prepared according to the manufacturer’s specifications using the prescribed fillings: Corundum balls (Elementar Americas Inc., New York, NY, USA; Cat. No. 50 008 467), copper oxide fine granular (Elementar Americas Inc., New York, NY, USA; Cat. No. 05 001 039), copper wire (Elementar Americas Inc., New York, NY, USA; Cat. No. 05 000 699), platinum catalyst (Elementar Americas Inc., New York, NY, USA; Cat. No. 03 002 262), tungsten granulates (Elementar Americas Inc., New York, NY, USA; Cat. No. 12.01-0045), and phosphorus pentoxide (Elemental Microanalysis, Okehampton, UK; Cat. No. B1197). The instrument was operated in CN mode and the calibration curve was built using L-glutamic acid (Sigma-Aldrich, St-Louis, USA; Cat. No. G1251). Stainless steel crucibles were pre-cleaned with DIW followed by a cup burn at 900 °C in a muffle furnace (Model 650-14; Fisher Scientific, Waltham, MA, USA) prior to the analysis. The dust samples (100 mg) were weighed directly in the cleaned steel crucibles using an Excellence Plus XP analytical balance (XP205; Mettler Toledo, Mississauga, ON, Canada). The weighed samples were introduced to the furnace at an incineration temperature of 900 °C in the combustion tube, followed by post-combustion at 900 °C and reduction at 830 °C. As recommended by the manufacturer, the combustion gas (high purity oxygen from Linde Canada Inc., Ottawa, ON) was set to 4 bar, while the carrier gas (ultra-high purity helium from Linde Canada Inc., Ottawa, ON) was adjusted to 2.5 bar for a flow rate of 681 mL/min. Carbon dioxide released during the oxidation process was measured and the signal was integrated by the VarioMAXTM software (version 7.0). An extended calibration curve was built using 1 to 1000 mg of L-glutamic acid (TC: 40.78%).
A rough leak test was performed daily to ensure proper sealing of the system. As part of the daily measurement routine, any carbon normally accumulated while the instrument was idle was flushed until the resulting C peak area reached the baseline level (≤100). At this point, 250 mg of L-glutamic acid was run in triplicate, which served two purposes: Conditioning the instrument (i.e., gas flow, gas pressure, proper component functionality) and minimizing the memory effect. Subsequently, the daily calibration correction factor was computed based on a triplicate analysis of 100 mg of L-glutamic acid, which allowed for the adjustment of the calibration curve to the daily ambient conditions (e.g., air pressure). The observed daily factors were within the 10% tolerance (0.9 and 1.1) and varied from 0.994 to 1.084 throughout the project.
2.4. Quality Control
To evaluate the accuracy (recovery) and reproducibility of Hg results, NIST 2584 trace elements in dust (n = 83) or NIST 2587 trace elements in soil (n = 142) was included after every 10 samples. The Hg limit of detection (LOD) was determined as 0.005 mg/kg based on 3 times the standard deviation of method blanks (empty quartz boat; n = 243). All of the method blanks were less than 10% of the lowest Hg concentration (<0.04 mg/kg) measured in the dust samples in accordance with the quality criteria of US-EPA Method 7473 [22]. All of the samples were analyzed for Hg in duplicate and if the difference between the duplicates exceeded 20%, additional replicates were analyzed (and all of the replicates were subsequently averaged). Total carbon results were evaluated using NIST 2710 (Montana Soil) and EuroVector Soil 1 (Elemental Analysis Quality Assurance Laboratory, Milan, Italy). The TC LOD was determined as 0.035% based on 3 times the standard deviation of procedural blanks (empty crucible; n = 118). Moreover, NIST 2710 (n = 71) or EuroVector Soil 1 (n = 31) was included at the beginning and at the end of each analytical batch for quality assessment. Sample duplicates were inserted approximately after every 10 samples.
As part of the CHDS protocol, subsamples (0.5 g) of FD were initially sent to an external laboratory (ActLabs Inc.; Ancaster, ON, Canada) for non-destructive instrumental neutral activation analysis (INAA). As the Hg concentrations of most of the dust samples were below their reported LOD for INAA (1 mg/kg), the sensitivity of this technique was deemed inadequate for the present study. The INAA FD samples were saved for subsequent analysis (after “cooling” to negligible Gamma emission) as only a limited quantity of FD material was available from each home. Before using these INAA FD samples for the present study, testing of CRMs (i.e., NIST 2583 (n = 11), NIST 2584 (n = 10), NIST 2586 (n = 13), NIST 2702 (n = 10), NIST 2710 (n = 7), NIST 2711 (n = 3), LKSD-2 (n = 6), LKSD-4 (n = 7), and Till-1 (n = 4)) that had been included in the INAA submission was conducted using the DMA-80 direct mercury analyzer, to determine whether Hg losses had occurred during irradiation or subsequent storage. As shown in Figure 1, there was a strong linear relationship (R2 > 0.99) between the observed and certified concentrations for the previously irradiated CRMs. Recoveries averaged 103% for previously irradiated CRMs containing <0.5 mg/kg Hg (Figure 1a) and 96% for CRMs containing 1 to 35 mg/kg Hg (Figure 1b). These results confirmed that the use of valuable FD subsamples was appropriate for subsequent Hg analysis using the more sensitive approach.
2.5. Data Analysis
Statistical analyses were conducted using the Analyze-It add-in software for Microsoft Excel 2016. Duplicate measurements (n = 984 pairs for Hg and 158 pairs for TC) were averaged. No sample concentrations were below LOD for Hg or TC. Duplicate uncertainty was calculated according to Synek’s equation [30]. The Hg dataset was log-normally distributed (skewness = 0.333, kurtosis = 0.868), while the log-transformed TC dataset displayed a near-normal distribution (skewness = −1.01, kurtosis = 3.20). The inter quartile range (IQR) approach was used to identify anomalously elevated Hg concentrations as follows: Concentrations exceeding the 75th percentile + 1.5 IQR were identified as “anomalous”, where IQR is equal to the difference between the 75th and 25th percentile value. Statistical significance for Pearson correlation and Student’s t-tests was established at a probability level of p < 0.05 (95% CI).
3. Results and Discussion
3.1. Total Hg and TC in Certified Reference Materials and CHDS Samples
The results for CRMs presented in Table 1 demonstrate that both solid sample analysis techniques provide accurate and reproducible analyses of total Hg and TC. The recoveries obtained for CRMs were within 99–102% for Hg and within 97–102% for TC. These techniques proved suitable for house dust analysis as the measured concentrations of all the collected samples exceeded LODs (Hg LOD = 0.005 mg/kg and TC LOD = 0.035%). In addition, both techniques showed good reproducibility, with percent relative standard deviations (%RSDs) below 10% (Table 1).
Table 2 shows the summary statistics for total Hg and TC measured in the <80 µm fraction of house dust collected from the CHDS homes. These results indicate that concentrations found in the indoor urban environment are higher than the typical environmental background concentrations (i.e., not including hotspots, such as ore deposits or industrial contamination). For example, the median/geomean house dust Hg concentration in the CHDS (0.68/0.70 mg/kg; n = 995 homes; Table 2) is 10 times higher than the global soil average (0.07 mg/kg [31]). Moreover, the median/geomean Hg house dust concentration in Table 2 is an order of magnitude higher than the Hg concentrations reported for Ontario soil (mean = 0.07 mg/kg [32]), and other typical background environmental samples, such as bottom sediments collected from Canadian lakes and streams (0.072–0.075 mg/kg [16,33]). This observation of higher Hg concentrations in house dust compared with outdoor environmental media is consistent with a previous Canadian study, which reported higher Hg levels in indoor dust (median = 1.61 mg/kg) than in the corresponding garden soil (median = 0.05 mg/kg) and street dust (median = 0.02 mg/kg) in the city of Ottawa [13]. Similarly, a recent study in the town of Maribor, Slovenia [15] reported that median Hg concentrations were 3-fold higher in indoor dust (0.316; 63 µm; n = 27) than in street dust and soil (approx. 0.1 mg/kg).
The observed enrichment of Hg in house dust suggests the influence of indoor sources, highlighting the importance of monitoring this legacy chemical in indoor residential environments. Potential indoor Hg sources include wood combustion and releases from Hg-containing thermostats, building materials, and consumer products [4,34]. Huang et al. [35] reported that domestic wood combustion may be an important source of oxidized mercury (mostly in the particulate phase) in northern climates in winter. Their measurements determined that Hg is emitted from domestic biomass combustion as gaseous elemental Hg, gaseous oxidized Hg, and fine particle-bound Hg, in proportions that vary depending on combustion conditions, including the type of fuel (e.g., pellets or wood) and combustion temperature [35]. Of the 1025 participating homes in the present study, 308 (30%) used wood fuel for space heating. Therefore, biomass combustion may be a source of Hg in the dust from these homes. As the mean ± SD date of construction of the CHDS homes was 1965 ± 27 [28], older-model thermostats that use Hg switches may be an indoor source of Hg [36], particularly in homes using electric baseboard heating (n = 181 or 18% of CHDS homes). In older homes, Hg may be released from building materials, such as gypsum wallboard [37], cement foundations [38], and latex paint [39].
Of note, the median Hg concentration in house dust from typical urban Canadian homes (0.68 mg/kg) is lower than the median values reported for homes located in hotspot areas. For example, a study of 100 homes located near smelting activities in southwest China reported a median Hg concentration of 1.8 mg/kg [40]. Other studies of homes in Hg mining and smelting areas reported Hg concentrations in house dust ranging from 6.4 to 120 mg/kg (median 20.9 mg/kg; n = 16) in Idrija, Slovenia [41] and 3.06 to 926 mg/kg (median 63.3 mg/kg; n = 60) in Huancavelica, Peru [42].
The TC median value of 29.3% (n = 1011; Table 2) measured in the present study is similar to the previous Canadian study, which reported a median of 28.9% for TC in house dust, more than 5 times higher than the median TC content of 5.21% for garden soil collected from the same homes [19]. Similarly, the median TC content was 26.8% (n = 15; <125 µm) for house dust collected in Slovenia [41] and 29.1% (n = 32; <63 µm) in the United Kingdom [43]. Results of the present study are consistent with previous studies which concluded that carbon concentrations are elevated in indoor dust compared with outdoor soil [19,41]. In southern Ontario, for example, the average soil organic carbon content is 2.34% [44], and TC concentrations vary between 1.82 and 3.39% in typical agricultural soil [45]. The sources of organic carbon in house dust are varied and include human and pet hair, skin flakes, fibers, synthetic compounds (e.g., musks, phthalates, flame retardants) and products of combustion, including cooking activities and wood fuel [12,35,46]. Soil is also a source of organic carbon in indoor dust, as soil particles tracked indoors may contribute organic carbon to house dust, particularly when outdoor footwear is not removed [46,47].
3.2. Relationship between Hg and TC in House Dust
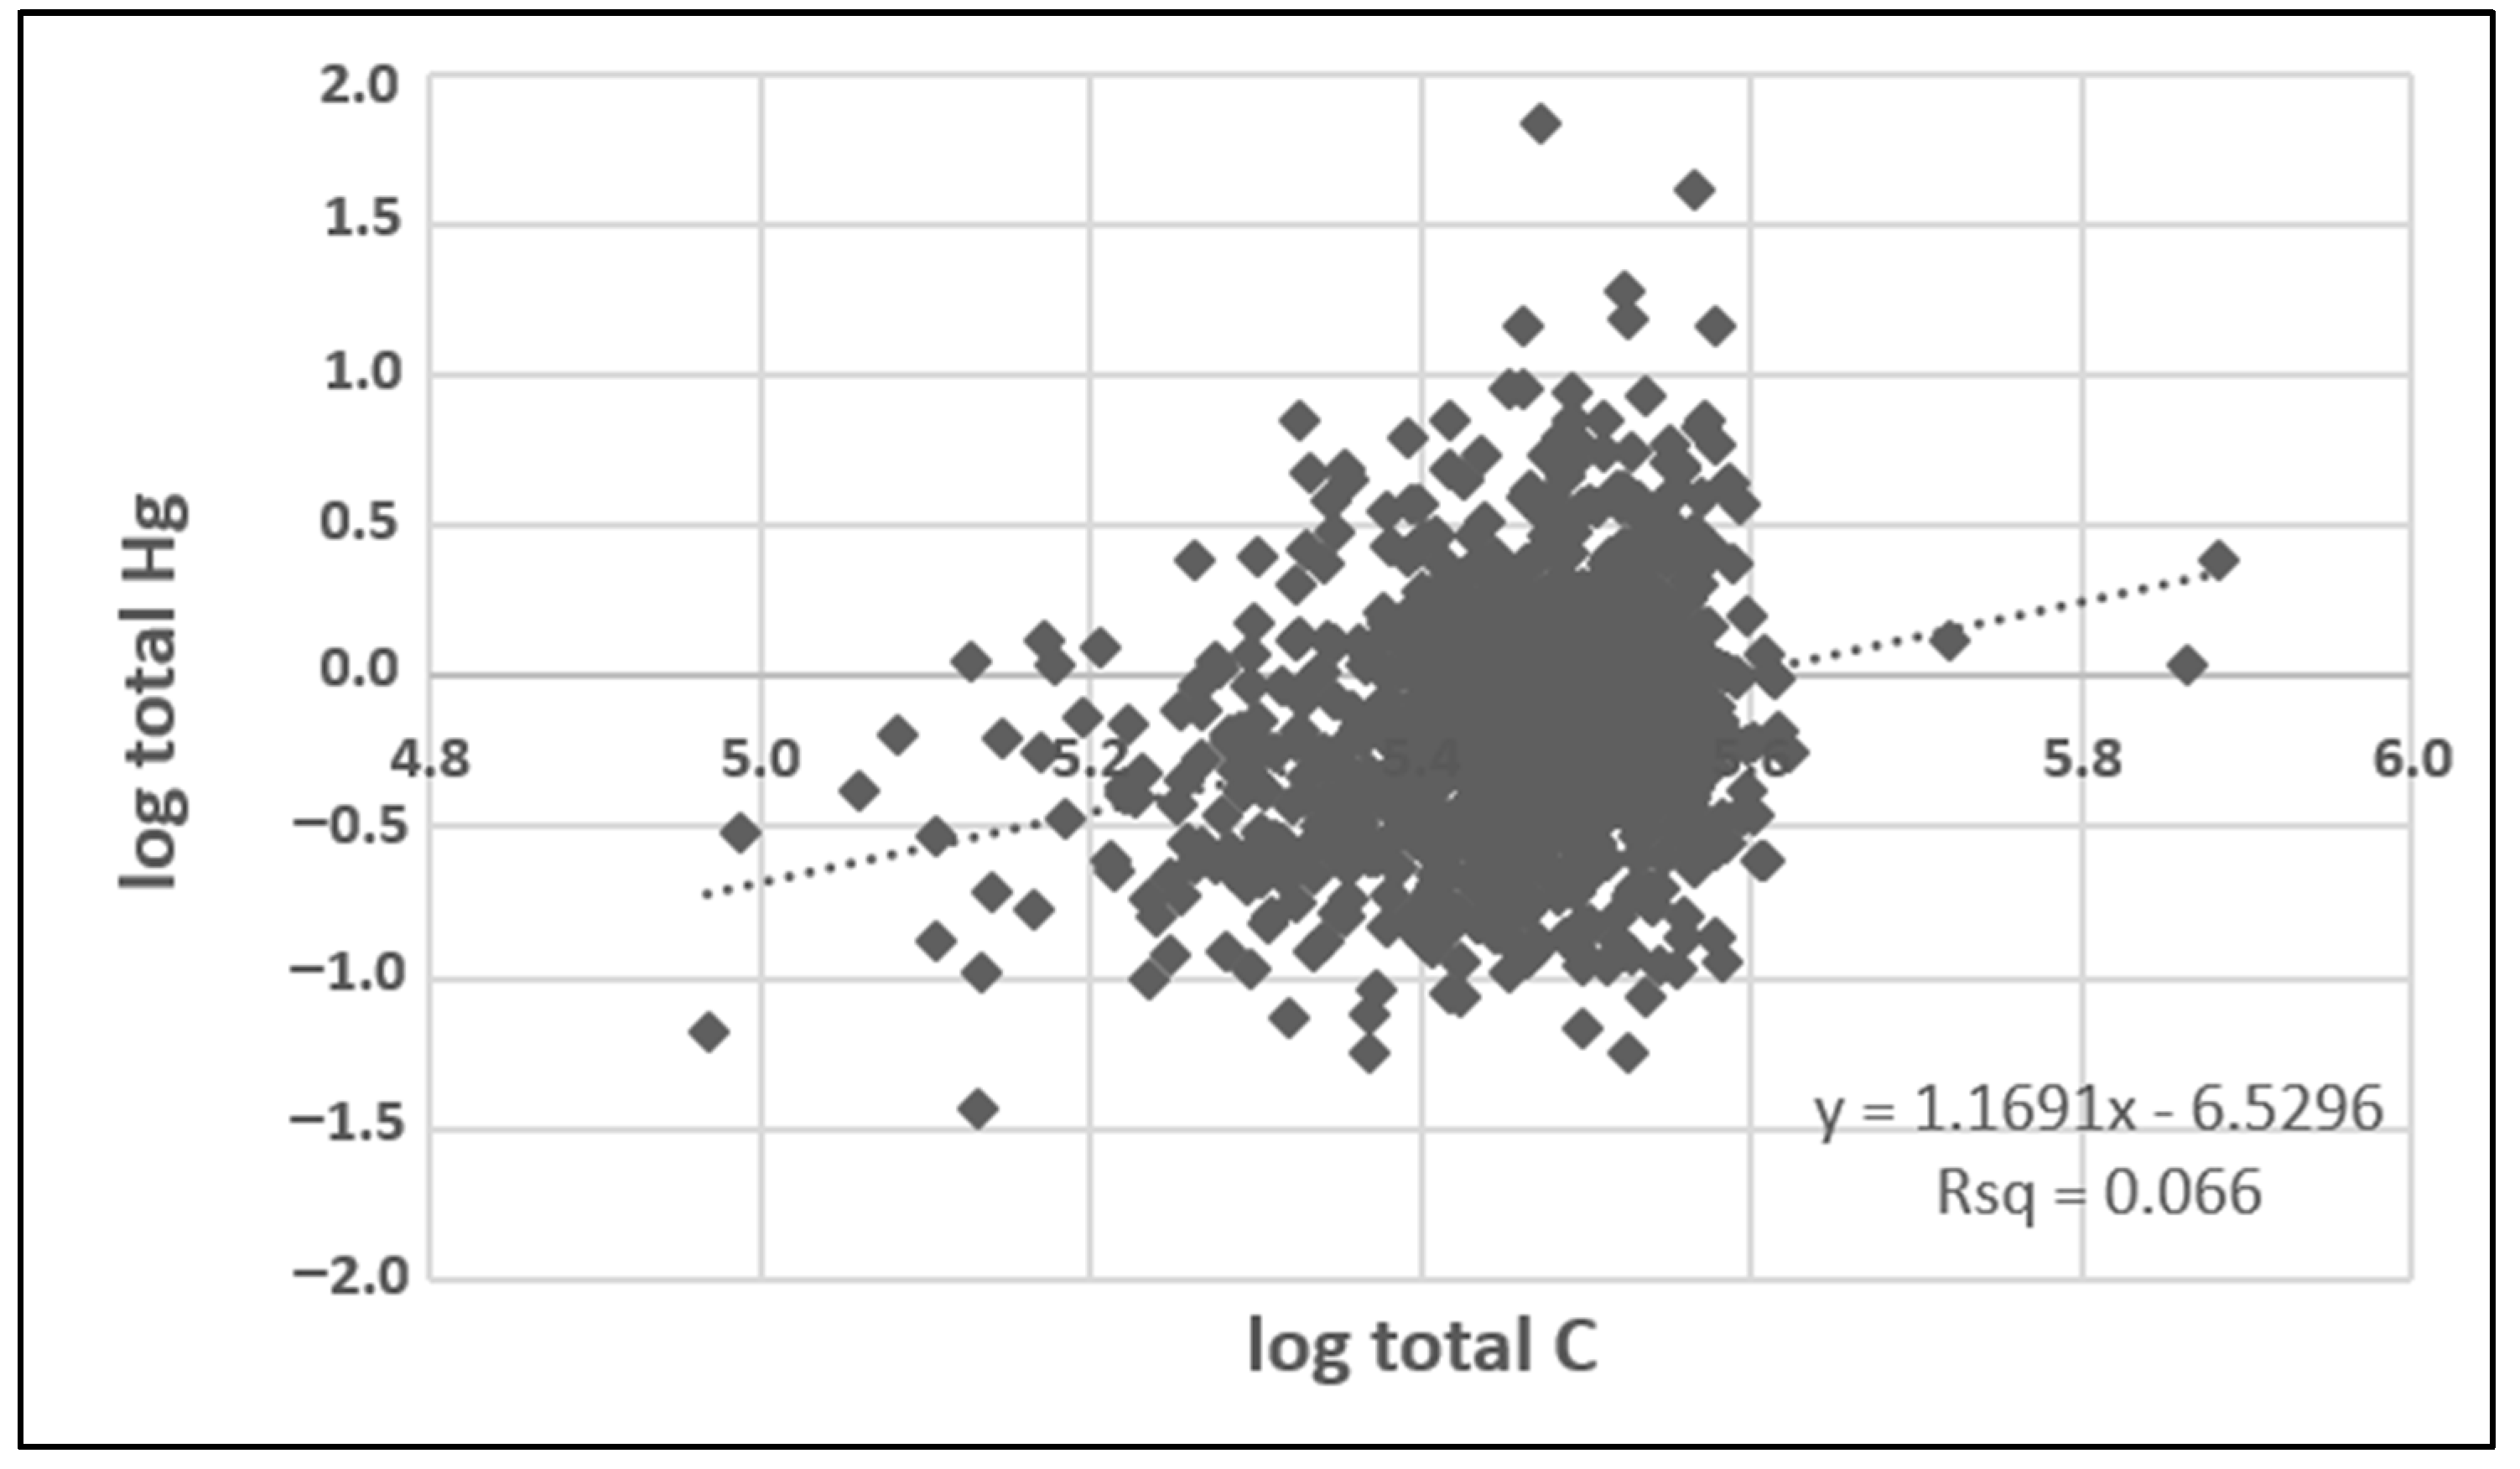
The Pearson correlation analysis indicated a significant association between Hg and TC (r = 0.26; p < 0.00001) in indoor dust (n = 991 paired samples), illustrated by the scatter plot in Figure 2. This observation is consistent with studies of outdoor environmental media (soil and sediments), which show strong correlations between Hg and TC, attributed to the tendency of Hg to bind to organic carbon [16,17,18]. Previous studies have reported that TC in house dust consists predominantly of organic carbon (TOC) with minor carbonate carbon (inorganic carbon, TIC). For example, a median concentration of 27.8% for TOC compared with 1.11% for TIC was reported for house dust samples collected in Ottawa, Canada [19]. Similarly, Bavec et al. [41] reported median concentrations of 22.6% TOC and 3.9% TIC in Slovenian house dust samples. As these studies showed that organic carbon accounted for about 85–97% of the house dust TC content, it is assumed that the TC content measured in the present study is predominantly organic carbon, as well. These results contrast with a previous urban house dust study in Poland, which reported a lack of correlation between Hg and carbon [48].
The CHDS appears to be the first study to demonstrate a correlation between Hg and carbon in house dust. This correlation may indicate a common source for both Hg and carbon, such as particle-bound Hg emitted from biomass combustion. Alternatively, Hg and carbon may originate from separate sources in the home, in which case the correlation occurs where carbon compounds in the settled dust are trapping Hg that has been released in elemental or oxidized form (via adsorption and/or organic ligands). Further research would be needed, involving detailed particle characterization and/or stepwise thermal decomposition, to identify the species of Hg and carbon present in settled dust and to better understand their origins.
3.3. Duplicate Uncertainty
House dust is a complex mixture of inorganic and organic particles. Therefore, it is known to be highly heterogeneous [12]. For this reason, house dust samples (<80 µm) were analyzed in duplicate for the assessment of sample heterogeneity. The duplicate uncertainty for Hg was calculated based on the typical concentration range (i.e., values falling between the 25th and 75th percentile), and observed/certified results for CRMs were used for comparison (Table 3). The results presented in Table 3 demonstrate that uncertainties calculated for the <80 µm house dust samples are comparable with uncertainties reported for the homogenized and milled CRM powders. In the case of TC, the results show that the <80 µm particle size fraction of house dust tends to be equally homogeneous as CRMs. This finding is consistent with previous conclusions that smaller house dust fractions have the advantage of greater homogeneity [19]. These results have relevance to the selection of an optimal particle size fraction for future house dust studies.
3.4. Comparison of Sampling Methods (FD vs. HD)
Total Hg concentrations were compared for a subset of matched samples of household vacuum dust (HD) and fresh dust (FD) collected from the same homes (n = 29 pairs; Table 4). The subset of homes used for the sampling method comparison (Table 4) was selected to represent the Hg concentration range of the entire dataset (Table 2). The Pearson correlation analysis of the two log-transformed Hg datasets (i.e., HD vs. FD) indicated a strong and significant positive correlation between the HD and FD samples (r = 0.671; p < 0.0001). Furthermore, there was no significant difference between the geomean values (Student’s t-test p = 0.3886) of the HD and FD datasets. These observations are consistent with previous studies of synthetic organics in dust (e.g., musks, phthalates, organophosphate esters, bisphenol A,) which reported significant correlations for most compounds determined in matched HD and FD samples [49,50,51,52]. Similarly, Rasmussen et al. [53] reported significant positive correlations (p < 0.001) between concentrations measured in matched HD and FD samples for 17 metals, with moderate to strong Spearman rho values (0.40–0.76). These results demonstrate that dust samples collected from the household vacuum system can be used as a viable and cost-effective alternative to fresh (or “active”) dust samples collected by trained technicians.
3.5. Hg Distribution in the CHDS Homes
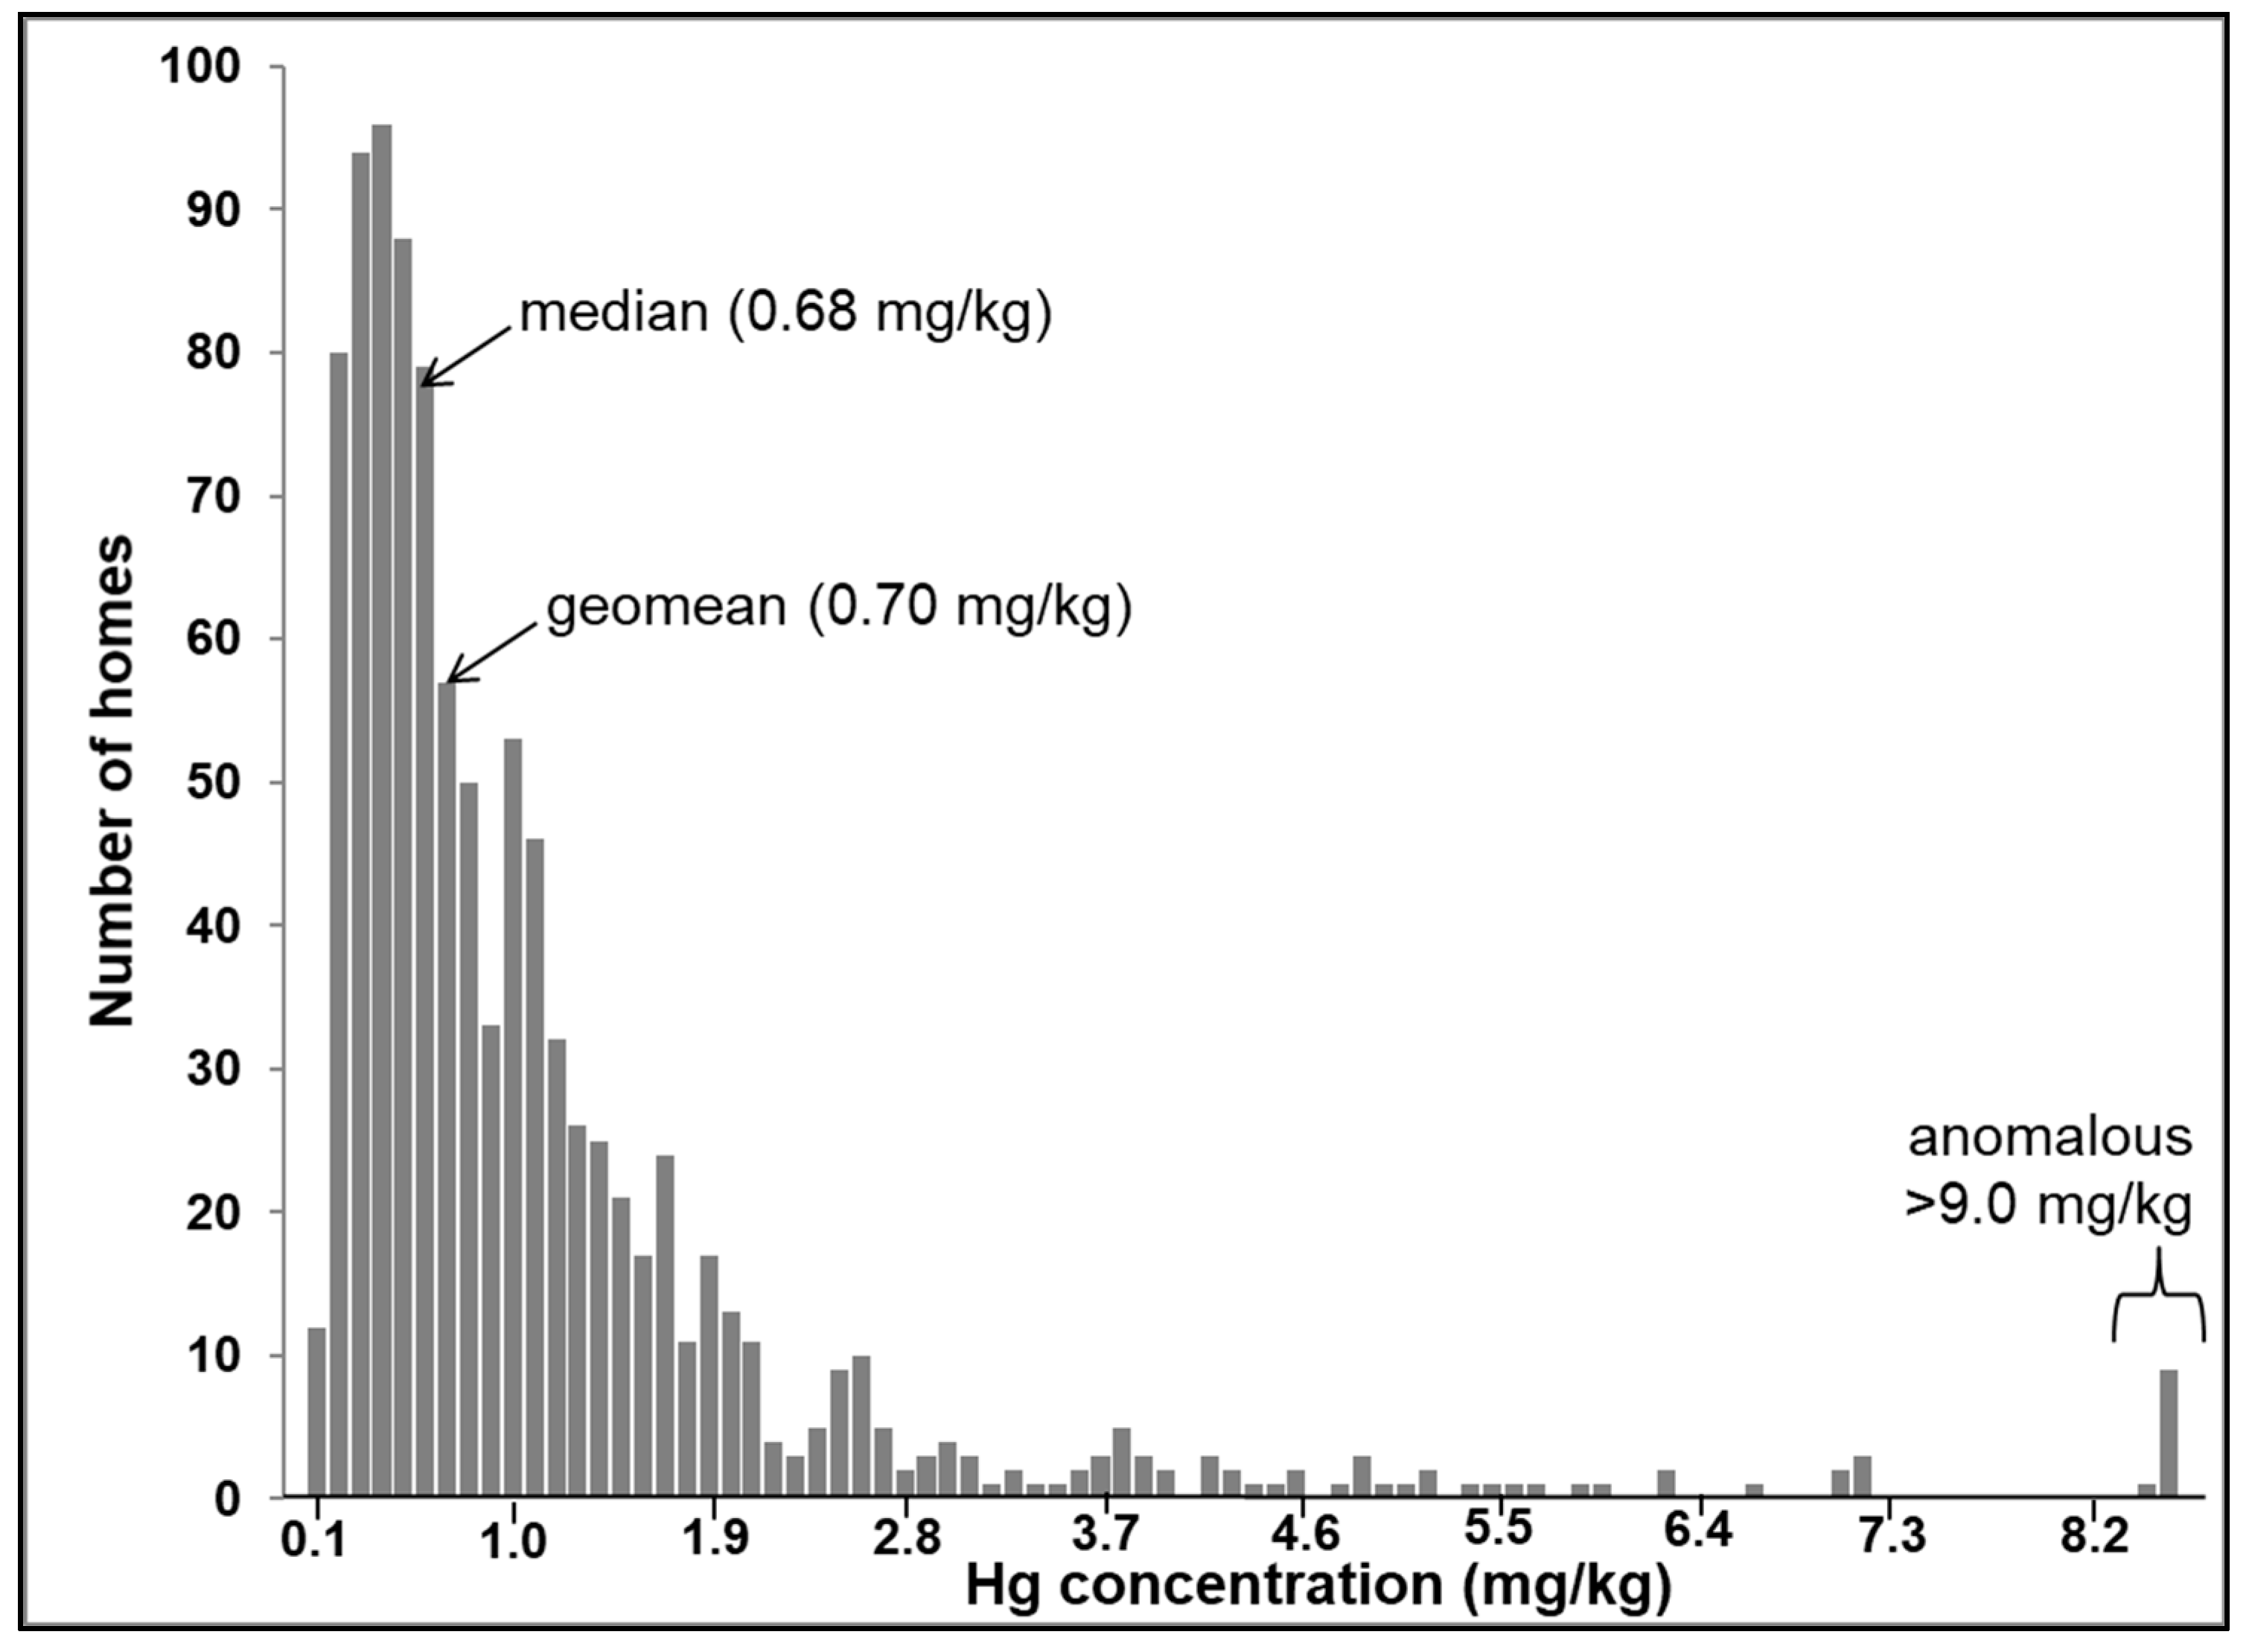
Figure 3 displays the frequency distribution of total Hg concentrations within the CHDS. The log-normal distribution of the Hg dataset contrasts with the distribution of other metals measured in the CHDS dust samples, which was not normally or log-normally distributed [28]. The Hg concentrations vary between 0.04 and 68.56 mg/kg, which represent a wider range than previous urban house dust studies, for example, 0.012 to 37.1 mg/kg (n = 48) in Canada [13] and 0.005 to 1.566 mg/kg (n = 64) in Serbia [14]. The larger Hg concentration range observed in the present study is likely due to the fact that a wider variety of homes was captured by the larger sample size (n = 995).
The distribution in Figure 3 shows that while most of the datapoints are below 7.0 mg/kg, there is a subset of anomalous samples characterized by concentrations higher than 9.0 mg/kg. The highest observed Hg value in the CHDS (68.6 mg/kg) occurred in house dust collected from a home in which two occupants were employed in a dental office (as a dentist and a dental hygienist). Mercury is used in dental amalgam compounds to form a hard and stable restorative material [54]. Therefore, it is likely that the high Hg concentration in this home reflects “take-home” Hg from an occupational setting. It is well-recognized that lead (Pb) can be carried home from an occupational site in this way [55]. At the time of sample collection (2007–2010), there were numerous possible anthropogenic sources of Hg in the indoor environment as traditionally Hg was found in many consumer products, for example, latex based paint in older homes, thermometers, mercury thermostats, tilt-switches, compact fluorescent bulbs, dental amalgam, anti-microbial agents, and cosmetics [34]. Spilled elemental Hg, from a broken thermometer or Hg switch, is difficult to clean and tends to soak into porous building materials, such as carpeting, clothing, drywall, fiberboard, unfinished wood, and upholstered furniture [36]. Therefore, apart from possible occupational sources, the anomalous values in Figure 3 could reflect re-emission from past accidental Hg spills.
This study has provided a nationally representative urban baseline for Hg in house dust (for 2007–2010) that will enable future decision-makers to evaluate the progress of Hg reduction programs and risk management strategies. The CHDS was not designed or intended to characterize the influence of external point sources, such as mining/smelting or to identify specific indoor sources of metals within the studied homes [28]. Although the track-in of Hg from outdoor sources is feasible, none of the CHDS homes were located in the vicinity of Hg mining or smelting activities or other Hg-releasing industries. As noted above, studies of house dust collected from homes near Hg hotspots tend to display higher values than the present study. In this regard, these urban baseline Hg results from the CHDS may be used as a point of comparison for residential risk assessments on or near Hg-contaminated sites.
4. Conclusions
In this present article, the key conclusions are as follows:
- This study has produced the first nationally representative baseline dataset for Hg in urban house dust. The median/geomean Hg concentration observed for indoor dust (0.68/0.70 mg/kg; n = 995) is 10 times higher than the average background concentrations reported for soil, glacial sediments, and lake sediments (0.07 mg/kg). The dust Hg dataset is log-normally distributed and reveals a subset of anomalously high Hg concentrations (>9.0 mg/kg; 0.7% of the studied homes). These results are consistent with elevated indoor/outdoor Hg ratios previously observed in previous smaller studies (n <65 homes), which were conducted in urban areas not impacted by mining or smelting activities or other Hg-releasing industries. In addition, they indicate the influence of anthropogenic Hg from indoor sources and/or carried home from occupational sources.
- A significant positive correlation was observed between total Hg and TC (r = 0.26; p < 0.00001) in indoor dust, which reflects the association between Hg and organic carbon previously observed in outdoor environmental media (soil and sediments). Total carbon concentrations determined in house dust (median 29.3%, geomean 28.5%; n = 1011) are consistent with previously published studies, which reported that the carbon content of indoor dust samples is typically 5–6 times higher than the corresponding garden soil samples.
- Based on quality assessment results, it is concluded that the solid sample analysis techniques used in the present study are well-suited for the determination of total Hg and TC in house dust. Analysis of certified reference materials for both analytes demonstrated excellent accuracy and reproducibility (within 97–102% recovery and <10% RSD). Additionally, this study showed that samples previously irradiated for neutron activation analysis (Hg LOD = 1 mg/kg) may be re-analyzed for Hg by the more sensitive DMA-80 method used in the present study (Hg LOD = 0.005 mg/kg).
- Duplicate analysis of the <80 µm dust samples yielded reproducibilities of 12% RSD for Hg and 2% RSD for TC, which are comparable with reproducibilities reported for certified reference materials that have been ground and milled to maximize homogeneity. These results support the use of the <80 µm particle size fraction for house dust monitoring studies.
- The comparison of sampling methods indicated no significant difference in Hg concentration between household vacuum samples and fresh or “active” dust samples collected from the same homes, indicating that collecting dust samples from the household vacuum system is a viable and cost-effective sampling approach for residential Hg monitoring.
Author Contributions
Conceptualization, P.E.R.; methodology, P.E.R. and C.L.; analytical analysis, C.L.; data analysis, C.L. with assistance from P.E.R.; data interpretation, C.L. and P.E.R.; writing—original draft preparation, C.L.; writing—revised draft preparation, P.E.R.; supervision, P.E.R.; funding acquisition, P.E.R. All authors have read and agreed to the published version of the manuscript.
Funding
This project was funded by Health Canada’s Chemical Management Plan.
Institutional Review Board Statement
The Canadian House Dust Study was approved by Health Canada’s Research Ethics Board.
Informed Consent Statement
Informed consent was obtained from the owners of the sampled homes included in the study.
Acknowledgments
This project was funded by Health Canada’s Chemical Management Plan. The authors are grateful to Lorraine Seed and Guillaume Pelletier for valuable internal review comments. Sincere thanks to Dave Gardner for assistance with statistical analyses and to Water & Earth Science Associates (WESA) Inc., Carp, ON, Canada for sample collection.
Conflicts of Interest
The authors declare no conflict of interest.
References
- World Health Organization. Mercury and Health. Fact Sheet; World Health Organization: Geneva, Switzerland, 2017; Available online: www.who.int/mediacentre/factsheets/fs361/en/ (accessed on 20 October 2021).
- Tchounwou, P.B.; Ayensu, W.K.; Ninashvili, N.; Sutton, D. Review: Environmental Exposure to Mercury and Its Toxicopathologic Implications for Public Health. Wiley Period. Inc. 2003, 18, 149–175. [Google Scholar] [CrossRef] [PubMed]
- Ciani, F.; Rimondi, V.; Costagliola, P. Atmospheric mercury pollution: The current methodological framework outlined by environmental legislation. Air Qual. Atmos. Health 2021, 14, 1633–1645. [Google Scholar] [CrossRef]
- AMAP/UN Environment. Technical Background Report for the Global Mercury Assessment 2018; Arctic Monitoring and Assessment Programme: Oslo, Norway; UN Environment Programme, Chemicals and Health Branch: Geneva, Switzerland, 2019. [Google Scholar]
- Clarkson, T.W. The Three Modern Faces of Mercury. Environ. Health Perspect. 2002, 110, 11–23. [Google Scholar] [CrossRef] [PubMed] [Green Version]
- Lye, E.; Legrand, M.; Clarke, J.; Probert, A. Blood total mercury concentrations in the Canadian population: Canadian Health Measures Survey cycle 1, 2007–2009. Can. J. Public Health 2013, 104, e246–e251. [Google Scholar] [CrossRef] [PubMed] [Green Version]
- North American Regional Action Plan on Mercury (NARAP). North American Implementation Task Force on Mercury—Phase II; NARAP: Montreal, QC, Canada, 2000; 31. [Google Scholar]
- Legrand, M.; Feeley, M.; Tikhonov, C.; Schoen, D.; Li-Muller, A. Methylmercury Blood Guidance Values for Canada. Can J Public Health 2010, 101, 28–31. [Google Scholar] [CrossRef] [PubMed]
- UNEP. Many Products Still Contain Mercury. These Alternatives Could Replace Them; UN Environment Program: Nairobi, Kenya, 2019; Available online: https://www.unep.org/news-and-stories/story/many-products-still-contain-mercury-these-alternatives-could-replace-them (accessed on 8 June 2021).
- Salthammer, T. Emerging indoor pollutants. Int. J. Hyg. Environ. Health 2020, 224, 113423. [Google Scholar] [CrossRef]
- Majewski, G.; Kociszewska, K.; Rogula-Kozłowska, W.; Pyta, H.; Rogula-Kopiec, P.; Mucha, W.; Pastuszka, J.S. Submicron Particle-Bound Mercury in University Teaching Rooms: A Summer Study from Two Polish Cities. Atmosphere 2016, 7, 117. [Google Scholar] [CrossRef] [Green Version]
- Butte, W.; Heinzow, B. Pollutants in House Dust as Indicators of Indoor Contamination. Rev. Environ. Contam. Toxicol. 2002, 175, 1–46. [Google Scholar]
- Rasmussen, P.E.; Subramanian, K.S.; Jessiman, B.J. A multi-element profile of housedust in relation to exterior dust and soils in the city of Ottawa, Canada. Sci. Total Environ. 2001, 267, 125–140. [Google Scholar] [CrossRef]
- Nedić, A.B.; Mira, M.; Pucarević, M.M.; Ninkov, J.M.; Nataša, S.; Stojić, N.S.; Milić, D.M. Mercury content and distribution in household dust and soil in the town of Šid. Matica Srpska J. Nat. Sci. Novi Sad. 2019, 137, 33–41. [Google Scholar] [CrossRef] [Green Version]
- Gaberšek, M.; Gosar, M. Towards a holistic approach to the geochemistry of solid inorganic particles in the urban environment. Sci. Total Environ. 2021, 763, 144214. [Google Scholar] [CrossRef]
- Rasmussen, P.E.; Friske, P.W.B.; Azzaria, L.M.; Garrett, R.G. Mercury in the Canadian Environment: Current Research Challenges. Geosci. Can. 1998, 25, 1–13. [Google Scholar]
- Rasmussen, P.E.; Villard, D.J.; Gardner, H.D.; Fortescue, J.A.C.; Schiff, S.L.; Shilts, W.W. Mercury in lake sediments of the Precambrian Shield near Huntsville, Ontario, Canada. Environ. Geol. 1998, 33, 170–182. [Google Scholar] [CrossRef]
- Pant, P.; Allen, M.; Tansel, B. The role of organic carbon in facilitating mercury sorption and retention in the soil: Some field evidence from Oak Ridge, Tennessee-10391. In Proceedings of the WM2010 Conference, Phoenix, AZ, USA, 7–11 March 2010. [Google Scholar]
- Rasmussen, P.E.; Beauchemin, S.; Nugent, M.; Dugandzic, R.; Lanouette, M.; Chénier, M. Influence of Matrix Composition on the Bioaccessibility of Copper, Zinc, and Nickel in Urban Residential Dust and Soil. Hum. Ecol. Risk Assess. 2008, 14, 351–371. [Google Scholar] [CrossRef]
- Zhang, S.; Zhou, M. Comparison of DMA-80 and ICP-MS Combined with Closed-Vessel Microwave Digestion for the Determination of Mercury in Coal. J. Anal. Methods Chem. 2020, 8867653. [Google Scholar] [CrossRef]
- Gilli, R.S.; Karlen, C.; Weber, M.; Rüegg, J.; Barmettler, K.; Biester, H.; Boivin, P.; Kretzschmar, R. Speciation and Mobility of Mercury in Soils Contaminated by Legacy Emissions from a Chemical Factory in the Rhône Valley in Canton of Valais, Switzerland. Soil Syst. 2018, 2, 44. [Google Scholar] [CrossRef] [Green Version]
- US-EPA. Method 7473: Mercury in Solids and Solutions by Thermal Decomposition, Amalgamation and Atomic Absorption Spectrophotometry; U.S. Environmental Protection Agency: Washington, DC, USA, 2007; p. 17.
- Bissuti, I.; Hilke, I.; Raessler, M. Determination of total organic carbon—An overview of current methods. Trends Anal. Chem. 2004, 23, 716–726. [Google Scholar] [CrossRef]
- Peña-Méndez, E.A.; Gajdošová, D.; Havel, J. Direct laser desorption ionisation time-of-flight (TOF) mass spectrometry of soil organic matter for fast soil fingerprints. Chem. Ecol. 2010, 26, 167–175. [Google Scholar] [CrossRef]
- Wang, X.; Wang, J.; Zhang, J. Comparisons of Three Methods for Organic and Inorganic Carbon in Calcareous Soils of Northwestern China. PLoS ONE 2012, 7, e44334. [Google Scholar] [CrossRef] [Green Version]
- Leogrande, R.; Vitti, C.; Castellini, M.; Mastrangelo, M.; Pedrero, F.; Vivaldi, G.A.; Stellacci, A.M. Comparison of Two Methods for Total Inorganic Carbon Estimation in Three Soil Types in Mediterranean Area. Land 2021, 10, 409. [Google Scholar] [CrossRef]
- Rasmussen, P.E.; Beauchemin, S.; Chénier, M.; Levesque, C.; MacLean, L.C.W.; Marro, L.; Jones-Otazo, H.; Petrovic, S.; McDonald, L.T.; Gardner, H.D. Canadian house dust study: Lead bioaccessibility and speciation. Environ. Sci. Technol. 2011, 45, 4959–4965. [Google Scholar] [CrossRef] [PubMed]
- Rasmussen, P.E.; Levesque, C.; Chénier, M.; Gardner, H.D. Canadian House Dust Study: Population-based concentrations, loads and loading rates of arsenic, cadmium, chromium, copper, nickel, lead, and zinc inside urban homes. Sci. Total Environ. 2013, 443, 520–529. [Google Scholar] [CrossRef] [PubMed]
- Rasmussen, P.E.; Levesque, C.; Chénier, M.; Gardner, H.D. Contribution of metals in resuspended dust to indoor and personal inhalation exposures: Relationships between PM10 and settled dust. Build. Environ. 2018, 143, 513–522. [Google Scholar] [CrossRef]
- Synek, V. Evaluation of the standard deviation from duplicate results. Accred. Qual. Assur. 2008, 13, 335–337. [Google Scholar] [CrossRef]
- Kabata-Pendias, A. Trace Elements in Soils and Plants, 4th ed.; CRC Press: Boca Raton, FL, USA, 2011; ISBN 9781420093681. [Google Scholar]
- Government of Ontario, Ontario Typical Range Soil Chemistry: Inorganics. Open Access Data. Available online: https://data.ontario.ca/dataset/ontario-typical-range-soil-chemistry/resource/05325545-6fa8-4dd8-9968-c250c347b6e7 (accessed on 9 September 2021).
- Nars, M.; Ogilvie, J.; Castonguay, M.; Rencz, A.; Arp, P.A. Total Hg concentrations in stream and lake sediments: Discerning geospatial patterns and controls across Canada. Appl. Geochem. 2011, 26, 1818–1831. [Google Scholar] [CrossRef]
- US-EPA. Mercury in Consumer Products. 2021. Available online: https://www.epa.gov/mercury/mercury-consumer-products#list (accessed on 18 October 2021).
- Huang, J.; Hopke, P.K.; Choi, H.D.; Laing, J.R.; Cui, H.; Zananski, T.J.; Chandrasekaran, S.R.; Rattigan, O.V.; Holsen, T.M. Mercury (Hg) emissions from domestic biomass combustion for space heating. Chemosphere 2011, 84, 1694–1699. [Google Scholar] [CrossRef]
- Baughman, T.A. Elemental mercury spills. Environ. Health Perspect. 2006, 114, 147–152. [Google Scholar] [CrossRef] [PubMed] [Green Version]
- Shock, S.S.; Noggle, J.J.; Bloom, N.; Yost, L.J. Evaluation of potential for mercury volatilization from natural and FGD gypsum products using flux-chamber tests. Environ. Sci. Technol. 2009, 43, 2282–2287. [Google Scholar] [CrossRef]
- Ogunbileje, J.O.; Sadagoparamanujam, V.M.; Anetor, J.I.; Farombi, E.O.; Akinosun, O.M.; Okorodudu, A.O. Lead, mercury, cadmium, chromium, nickel, copper, zinc, calcium, iron, manganese and chromium (VI) levels in Nigeria and United States of America cement dust. Chemosphere 2013, 90, 2743–2749. [Google Scholar] [CrossRef]
- Agocs, M.M.; Etzel, R.A.; Parrish, R.G.; Paschal, D.C.; Campagna, P.R.; Cohen, D.S.; Kilbourne, E.M.; Hesse, J.L. Mercury exposure from interior latex paint. N. Engl. J. Med. 1990, 323, 1096–1101. [Google Scholar] [CrossRef]
- Cao, S.; Chen, X.; Zhang, L.; Xing, X.; Wen, D.; Wang, B.; Qin, N.; Wei, F.; Duan, X. Quantificational Exposure, Sources and Health Risks Posed by Heavy Metals in Indoor and Outdoor Household Dust in a Typical Smelting Area in China. Indoor Air 2020, 30, 872–884. [Google Scholar] [CrossRef]
- Bavec, Š.; Gosar, M.; Miler, M.; Biester, H. Geochemical investigation of potentially harmful elements in household dust from a mercury-contaminated site, the town of Idrija (Slovenia). Environ. Geochem. Health 2017, 39, 443–465. [Google Scholar] [CrossRef] [PubMed]
- Hagan, N.; Robin, N.; Hsu-Kim, H.; Halabi, S.; Gonzales, R.D.E.; Richter, D.; Vanderberg, J. Residential Mercury Contamination in Adobe Brick Homes in Huancavelica, Peru. PLoS ONE 2013, 8, e75179. [Google Scholar] [CrossRef]
- Turner, A.; Simmonds, L. Elemental concentrations and metal bioaccessibility in UK household dust. Sci. Total Environ. 2006, 371, 74–81. [Google Scholar] [CrossRef] [PubMed]
- Warren, C.J.; Saurette, D.D.; Gillespie, A.W. Soil organic carbon content: Decreases partly attributed to dilution by increased depth of cultivation in southern Ontario. Can. J. Soil Sci. 2021, 101, 335–338. [Google Scholar] [CrossRef]
- Laamrani, A.; Voroney, P.R.; Berg, A.A.; Gillespie, A.W.; March, M.; Deen, B.; Martin, R.C. Temporal Change of Soil Carbon on a Long-Term Experimental Site with Variable Crop Rotations and Tillage Systems. Agronomy 2020, 10, 840. [Google Scholar] [CrossRef]
- Leppänen, M.; Peräniemi, S.; Koponen, H.; Sippula, O.; Pasanen, P. The effect of the shoeless course on particle concentrations and dust composition in schools. Sci. Total Environ. 2020, 710, 136272. [Google Scholar] [CrossRef] [PubMed]
- Hunt, A.; Johnson, D.L.; Griffith, D.A. Mass transfer of soil indoors by track-in on footwear. Sci. Total Environ. 2006, 370, 360–371. [Google Scholar] [CrossRef] [PubMed]
- Wiśniewska, K.; Lewandowska, A.U.; Witkowska, A. Factors determining dry deposition of total mercury and organic carbon in house dust of residents of the Tri-city and the surrounding area (Baltic Sea coast). Air Qual. Atmos. Health. 2017, 10, 821–832. [Google Scholar] [CrossRef] [PubMed] [Green Version]
- Kubwabo, C.; Fan, X.; Rasmussen, P.E.; Wu, F. Determination of synthetic musk compounds in indoor house dust by gas chromatography–ion trap mass spectrometry. Anal. Bioanal. Chem. 2012, 404, 467–477. [Google Scholar] [CrossRef] [PubMed]
- Kubwabo, C.; Rasmussen, P.E.; Kosarac, I.; Wu, F.; Zidek, A.; Kuchta, S.L. Analysis of selected phthalates in Canadian indoor dust collected using household vacuum and standardized sampling techniques. Indoor Air 2013, 23, 506–514. [Google Scholar] [CrossRef] [PubMed]
- Fan, X.; Kubwabo, C.; Rasmussen, P.E.; Wu, F. Simultaneous determination of thirteen organophosphate esters in settled indoor house dust and a comparison between two sampling techniques. Sci. Total Environ. 2014, 491-492, 80–86. [Google Scholar] [CrossRef] [PubMed]
- Kubwabo, C.; Fan, X.; Rasmussen, P.E.; Wu, F.; Kosarac, I. Expanding the number of phthalates monitored in house dust. J. Environ. Anal. Chem. 2016, 96, 667–681. [Google Scholar] [CrossRef]
- Rasmussen, P.E.; Levesque, C.; Chénier, M.; Gardner, H.D. Rare earth elements and select actinoids in the Canadian House Dust Study. Indoor Air 2017, 27, 965–976. [Google Scholar] [CrossRef] [PubMed]
- FDA. Dental Amalgam Fillings. Available online: https://www.fda.gov/medical-devices/dental-devices/dental-amalgam-fillings (accessed on 30 July 2021).
- Rosco, R.J.; Gittleman, J.L.; Deddens, J.A.; Petersen, M.R.; Helperin, W.E. Blood Lead Levels Among Children of Lead-Exposed Workers: A Meta-Analysis. Am. J. Ind. Med. 1999, 36, 475–481. [Google Scholar] [CrossRef]
Figure 1.
Linear relationship between the measured and certified concentrations of Hg in certified reference materials (CRMs) (a) containing low concentrations (<0.5 mg/kg Hg) and (b) containing high concentrations (1 to 35 mg/kg Hg), all of which were previously subjected to neutron activation analysis (n = 3 to 13 replicates per CRM).

Figure 2.
Scatter plot displaying the linear fit of correlation between log-transformed total Hg and total carbon concentrations determined in vacuum samples from the Canadian House Dust Study (n = 991; no outliers have been removed).
Figure 2.
Scatter plot displaying the linear fit of correlation between log-transformed total Hg and total carbon concentrations determined in vacuum samples from the Canadian House Dust Study (n = 991; no outliers have been removed).

Figure 3.
Frequency distribution of total Hg in house dust samples collected from the CHDS homes (n = 995).
Figure 3.
Frequency distribution of total Hg in house dust samples collected from the CHDS homes (n = 995).


Table 1.
Accuracy and reproducibility assessment for solid sample analysis using DMA-80 for total mercury and VarioMAXTM CN for total carbon.
Table 1.
Accuracy and reproducibility assessment for solid sample analysis using DMA-80 for total mercury and VarioMAXTM CN for total carbon.
| Total Mercury (mg/kg) | ||
| NIST 2584 | Observed | 5.1 ± 0.44 |
| (n = 83) | Certified | 5.2 ± 0.24 |
| Recovery | 99% | |
| RSD | 8.5% | |
| NIST 2587 | Observed | 0.294 ± 0.023 |
| (n = 142) | Certified | 0.290 ± 0.009 |
| Recovery | 102% | |
| RSD | 7.79% | |
| Total Carbon (%) | ||
| NIST 2710 | Observed | 3.1 ± 0.11 |
| (n = 71) | Informative value | 3 |
| Recovery | 102% | |
| RSD | 3.6% | |
| EuroVector Soil 1 | Observed | 3.4 ± 0.03 |
| (n = 31) | Certified | 3.5 ± 0.066 |
| Recovery | 97% | |
| RSD | 0.92% |
Table 2.
Summary statistics for total Hg and TC in house dust (<80 µm fraction) of the Canadian House Dust Study.
Table 2.
Summary statistics for total Hg and TC in house dust (<80 µm fraction) of the Canadian House Dust Study.
| Hg (mg/kg) | TC (%) | |
|---|---|---|
| N | 995 | 1011 |
| LOD | 0.005 | 0.035 |
| Geomean | 0.70 | 28.5 |
| Arithmetic Mean ± SD | 1.24 ± 2.93 | 29.2 ± 5.83 |
| Range (min–max) | 0.04–68.6 | 9.30–76.4 |
| Percentiles | ||
| 5 | 0.15 | 19.4 |
| 10 | 0.21 | 21.8 |
| 25 | 0.37 | 26.0 |
| 50 (median) | 0.68 | 29.3 |
| 75 | 1.30 | 33.0 |
| 90 | 2.39 | 35.8 |
| 95 | 3.73 | 37.0 |
| 97.5 | 5.20 | 38.4 |
| 98 | 5.88 | 39.0 |
| 99 | 7.25 | 40.2 |
Table 3.
Uncertainty (U) of mercury and total carbon analyses of CHDS dust samples (<80 μm fraction) calculated using duplicates, compared with observed/certified U of certified reference materials (CRM): One NIST indoor dust CRM (2584), two NIST soil CRMs (2587 and 2710), and one EuroVector soil CRM.
| Mercury | Total Carbon | ||
|---|---|---|---|
| House dust duplicates | House dust duplicates | ||
| Concentration range (mg/kg) | 0.23–1.39 | Concentration range (%) | 9–48 |
| No. duplicate pairs in range | 480 | No. duplicate pairs in range | 56 |
| relative SD of duplicates a | 12% | relative SD of duplicates a | 2% |
| CRMs | CRMs | ||
| NIST 2584 (n = 83) | EuroVector Soil 1 (n = 31) | ||
| Observed relative U b | 9% | Observed relative U b | 1% |
| Certified relative U c | 5% | Certified relative U c | 2% |
| NIST 2587 (n = 142) | NIST 2710 (n = 71) | ||
| Observed relative U b | 8% | Observed relative U b | 8% |
| Certified relative U c | 3% | Certified relative U c | NR |
a Averaged RSD based on the relative SD of CHDS duplicates. b SD/mean based on replicates of NIST and EuroVector CRMs. c Uncertainty/mean reported on the CRM certificate of analysis. NR: Not reported on the certificate of analysis.
Table 4.
Comparison of total Hg concentration (mg/kg) measured in household vacuum dust (HD) vs. fresh dust (FD) collected from the same homes (n = 29 pairs).
Table 4.
Comparison of total Hg concentration (mg/kg) measured in household vacuum dust (HD) vs. fresh dust (FD) collected from the same homes (n = 29 pairs).
| HD | FD | |
|---|---|---|
| Mean ± SD | 1.05 ± 1.32 | 1.30 ± 1.75 |
| Geomean | 0.67 | 0.76 |
| Median | 0.90 | 0.72 |
| Range (min–max) | 0.10–7.25 | 0.13–8.74 |
Publisher’s Note: MDPI stays neutral with regard to jurisdictional claims in published maps and institutional affiliations. |
© 2022 by the authors. Licensee MDPI, Basel, Switzerland. This article is an open access article distributed under the terms and conditions of the Creative Commons Attribution (CC BY) license (https://creativecommons.org/licenses/by/4.0/).
Share and Cite
MDPI and ACS Style
Levesque, C.; Rasmussen, P.E. Determination of Total Mercury and Carbon in a National Baseline Study of Urban House Dust. Geosciences 2022, 12, 52. https://0-doi-org.brum.beds.ac.uk/10.3390/geosciences12020052
AMA Style
Levesque C, Rasmussen PE. Determination of Total Mercury and Carbon in a National Baseline Study of Urban House Dust. Geosciences. 2022; 12(2):52. https://0-doi-org.brum.beds.ac.uk/10.3390/geosciences12020052
Chicago/Turabian StyleLevesque, Christine, and Pat E. Rasmussen. 2022. "Determination of Total Mercury and Carbon in a National Baseline Study of Urban House Dust" Geosciences 12, no. 2: 52. https://0-doi-org.brum.beds.ac.uk/10.3390/geosciences12020052
Note that from the first issue of 2016, this journal uses article numbers instead of page numbers. See further details here.