
Zircon from Altered Monzonite Rocks Provides Insights into Magmatic and Mineralizing Processes at the Douay Au Project, Abitibi Greenstone Belt

 ,
,
Abstract
:1. Introduction
2. Geological Setting
3. Materials and Methods
3.1. Petrography and Whole Rock Chemistry
3.2. Zircon Chemistry and Geochronology
4. Results
4.1. Fieldwork
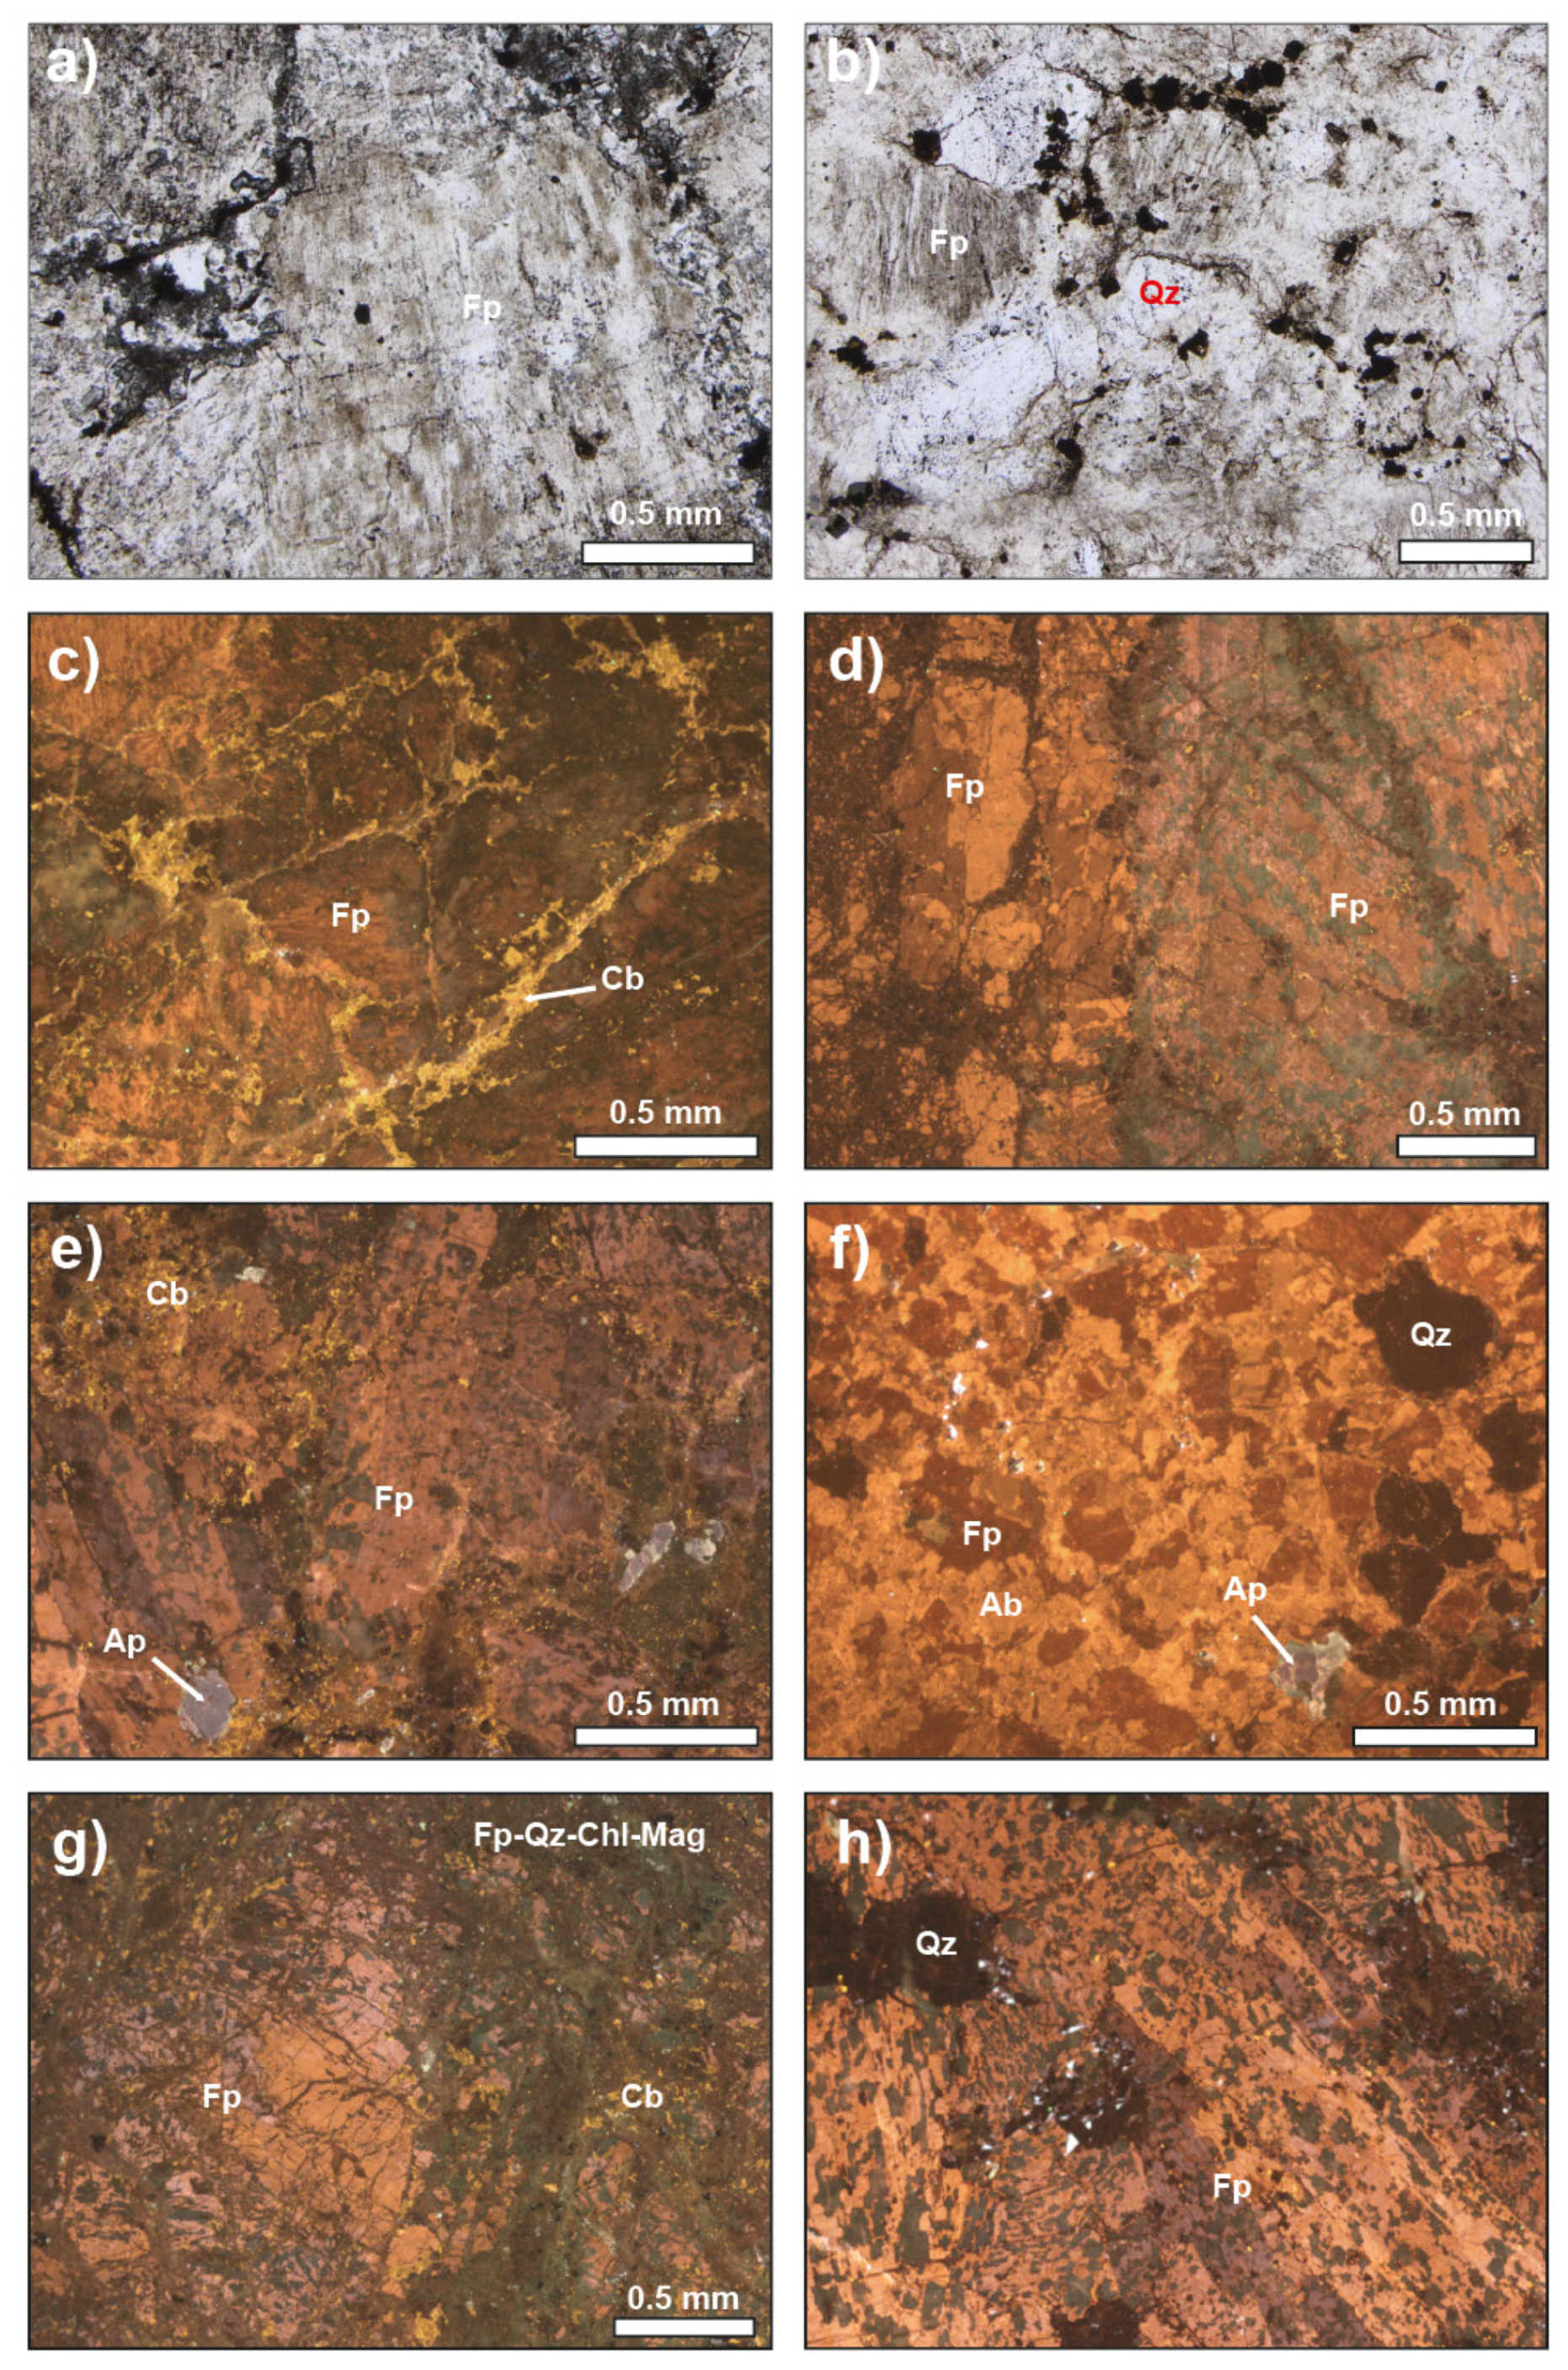
4.2. Petrography
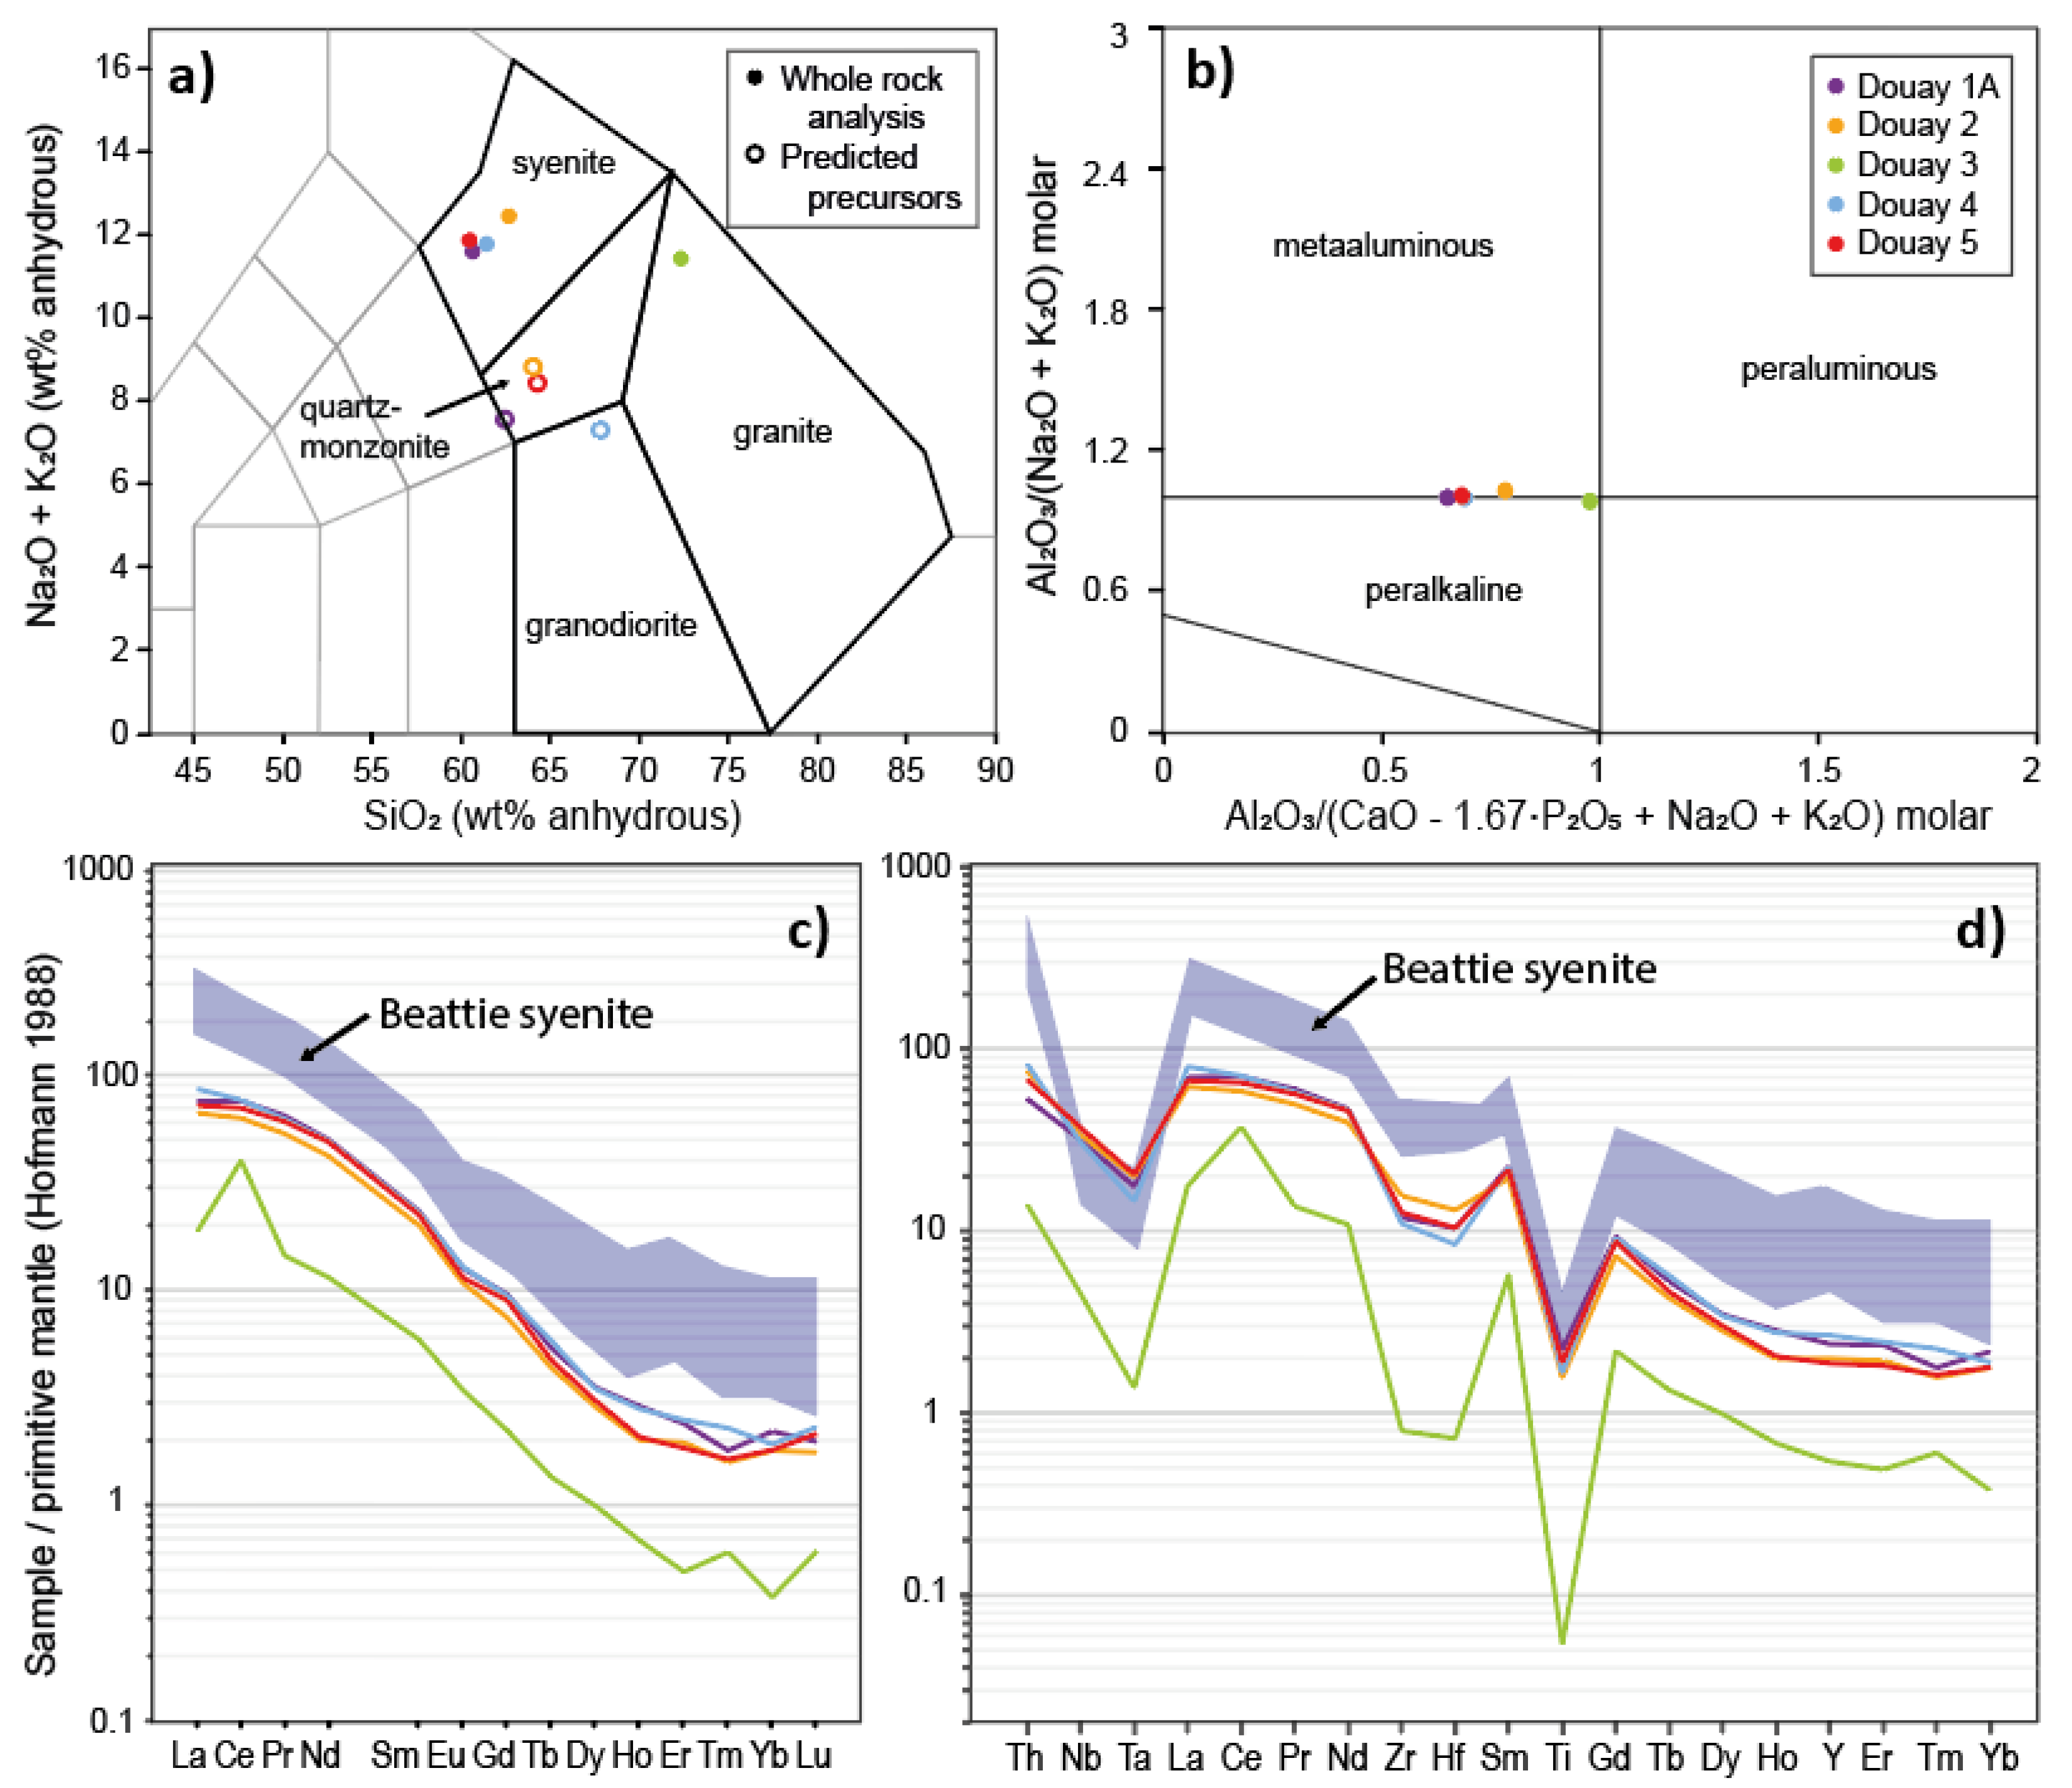
4.3. Whole Rock Chemistry

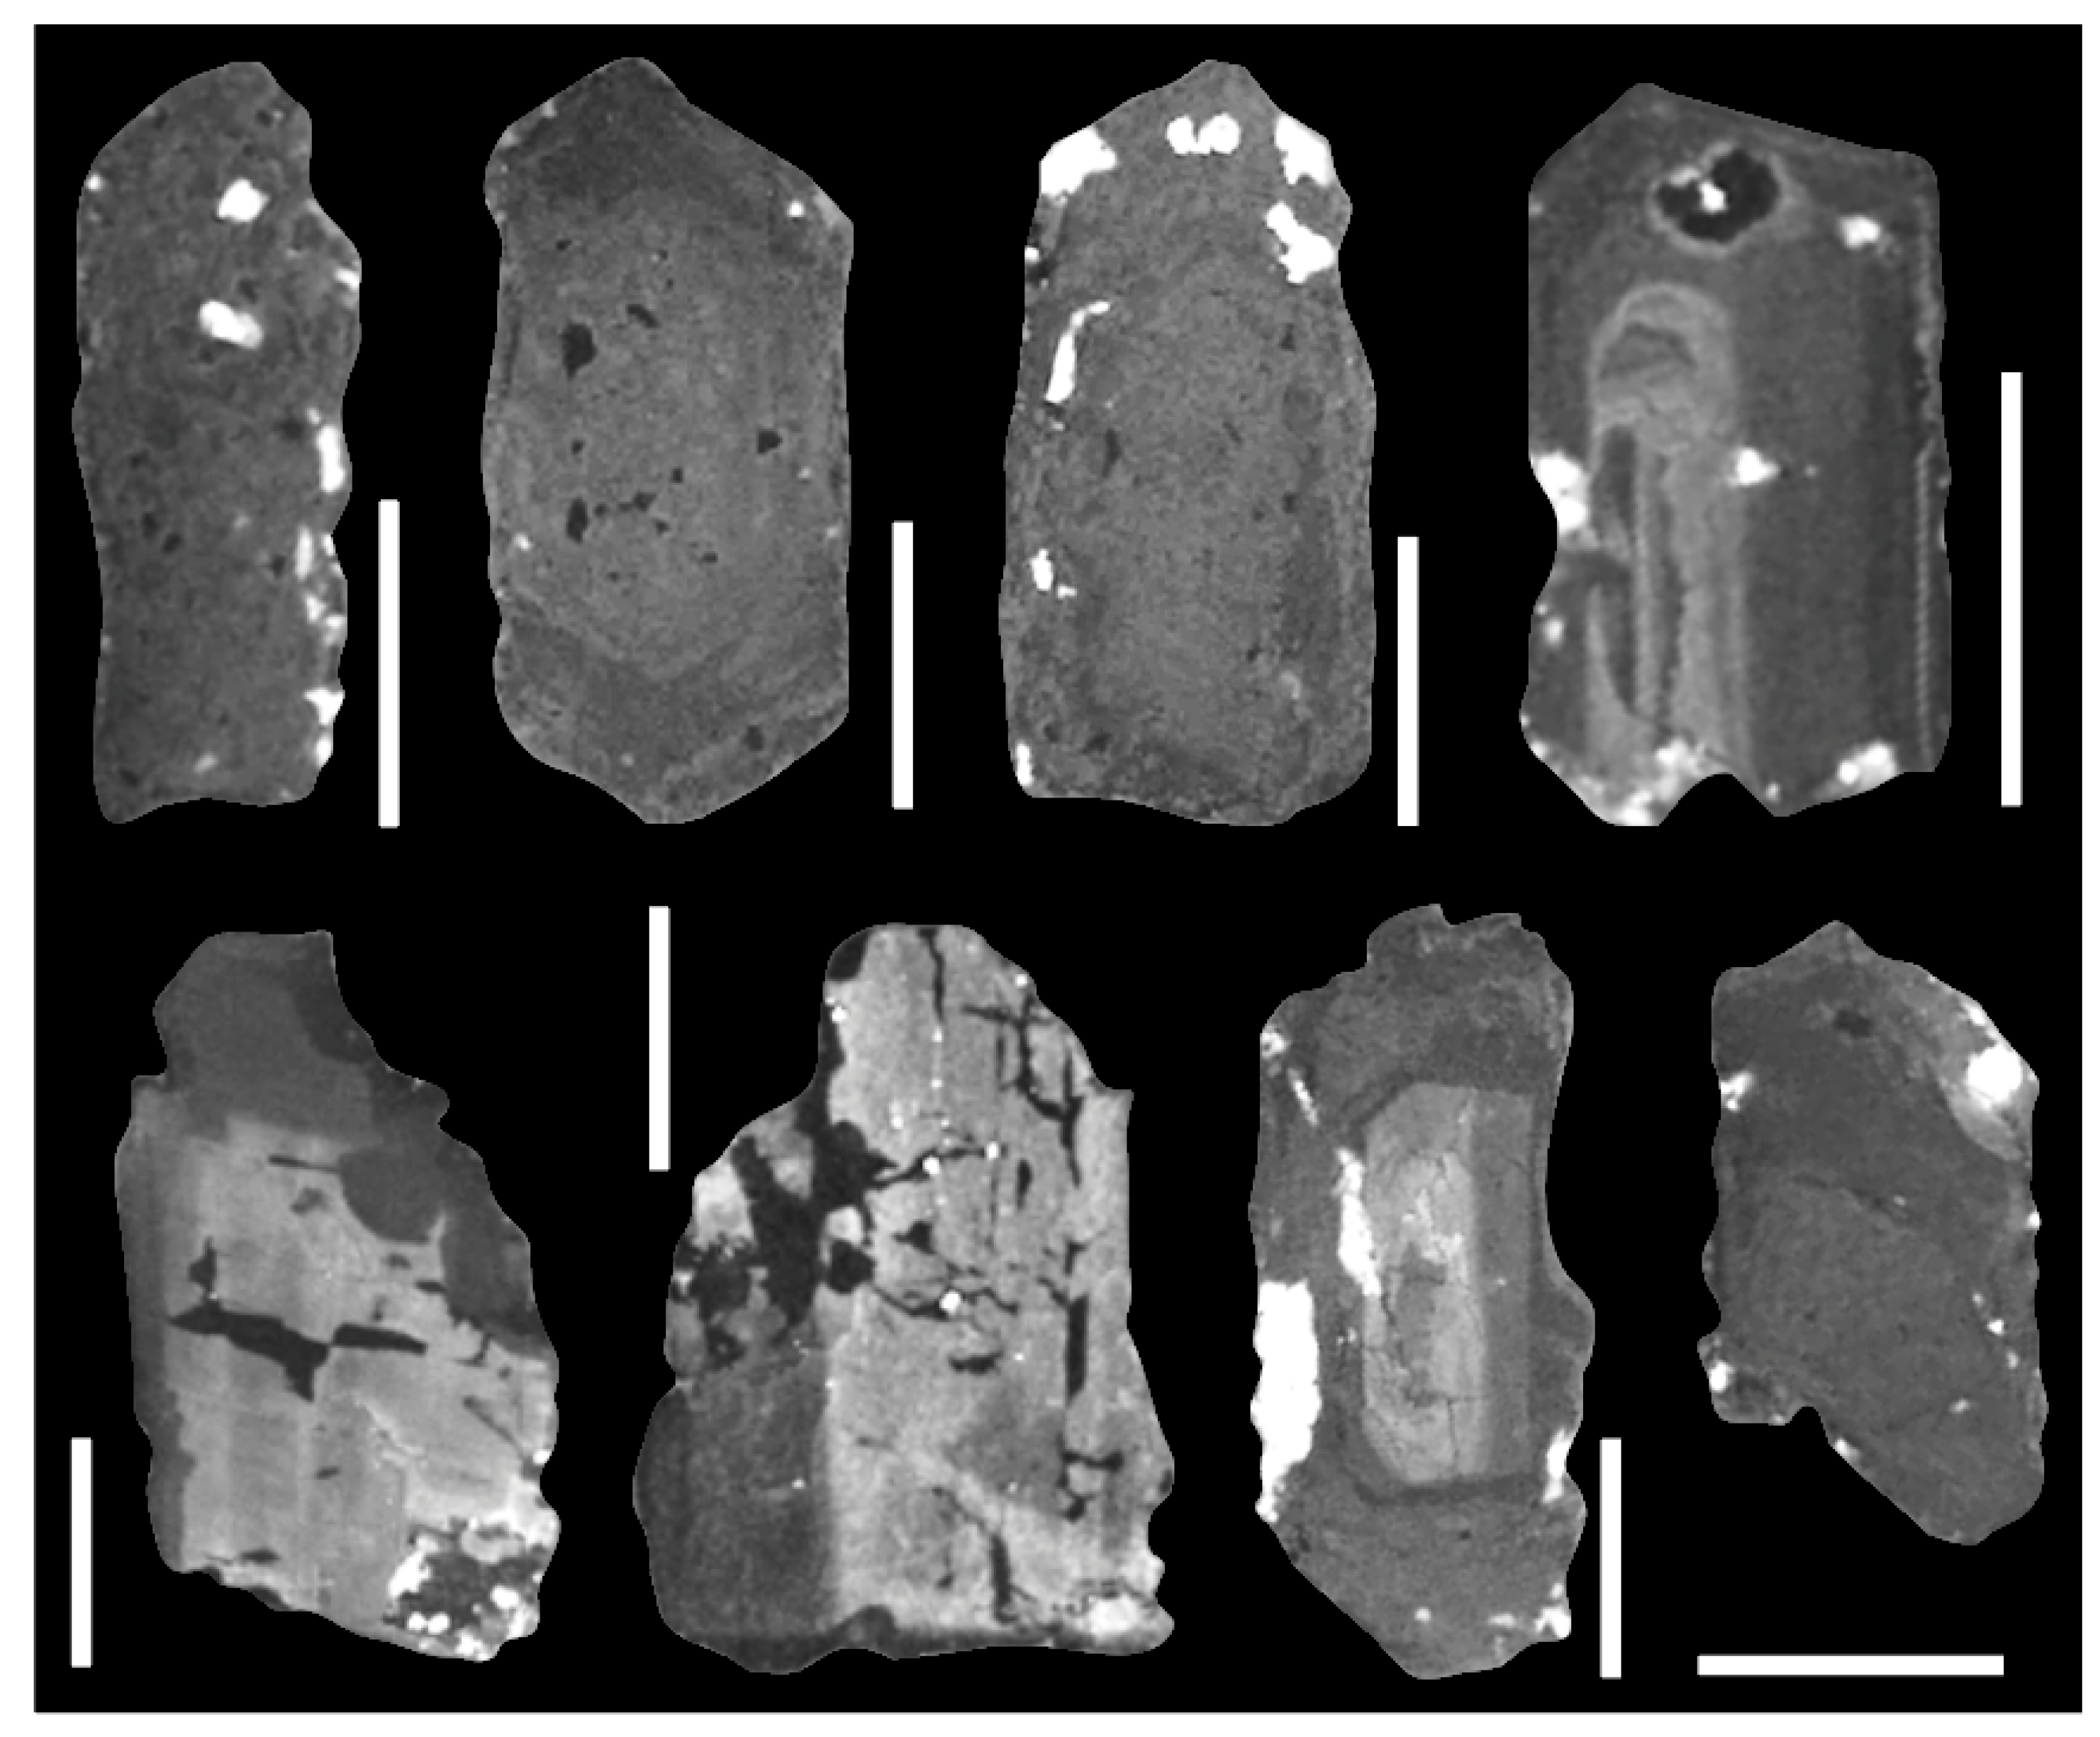
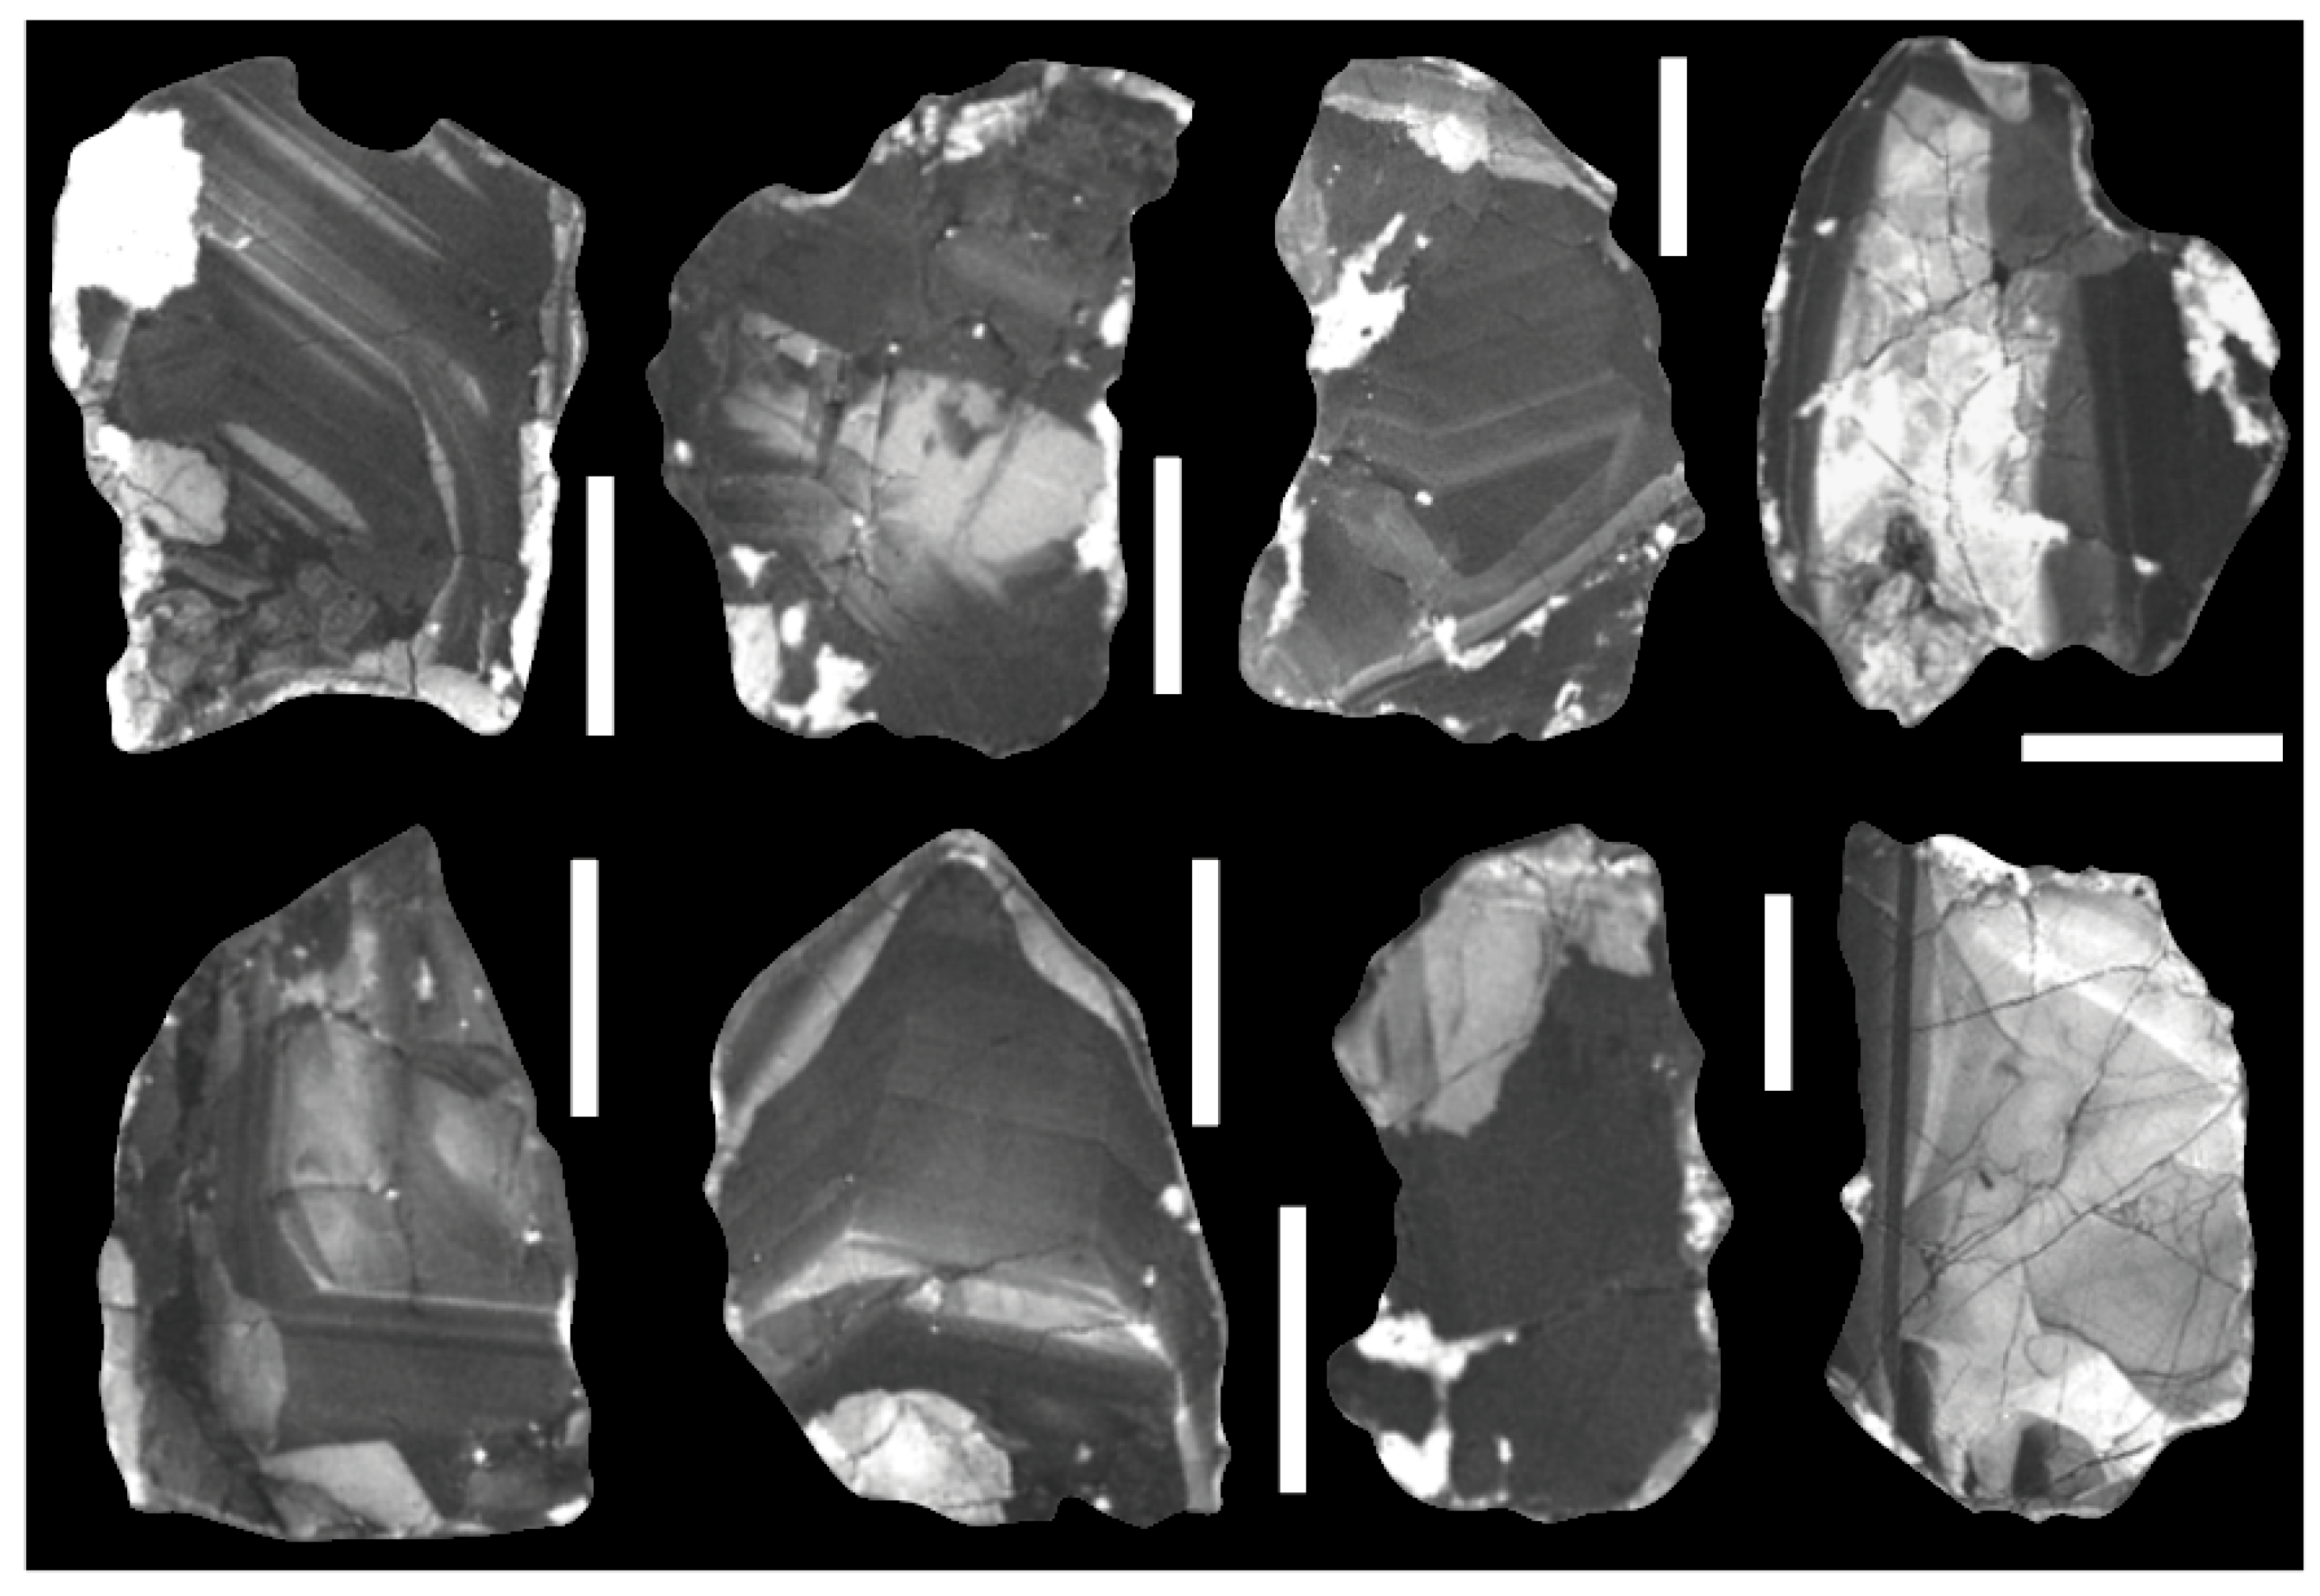
4.4. Texture of Zircon Grains and Ages
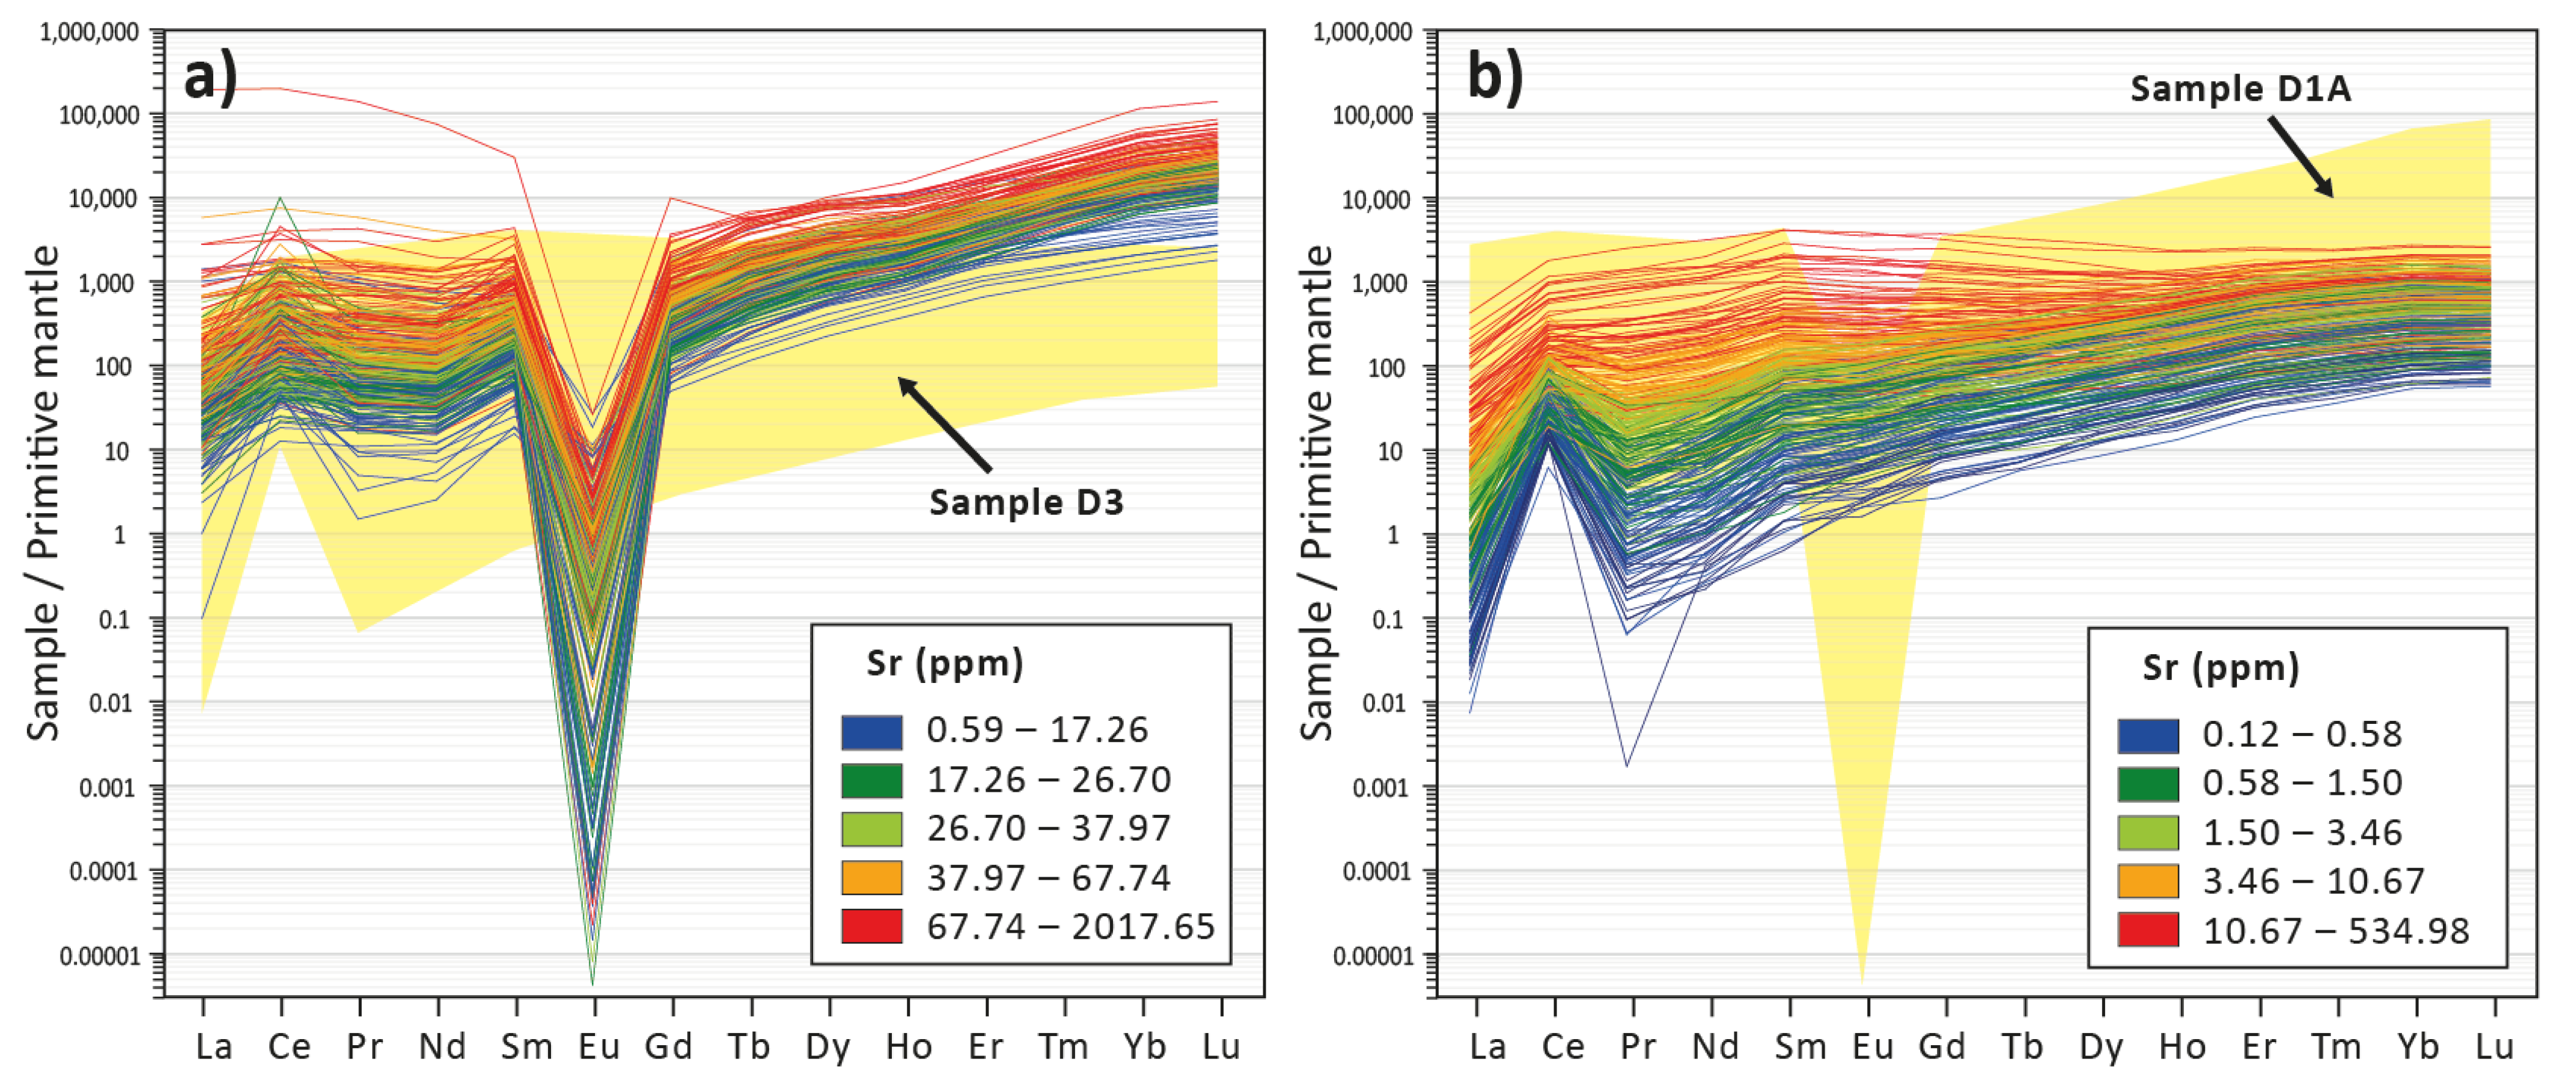
4.5. Chemistry of Zircon Grains

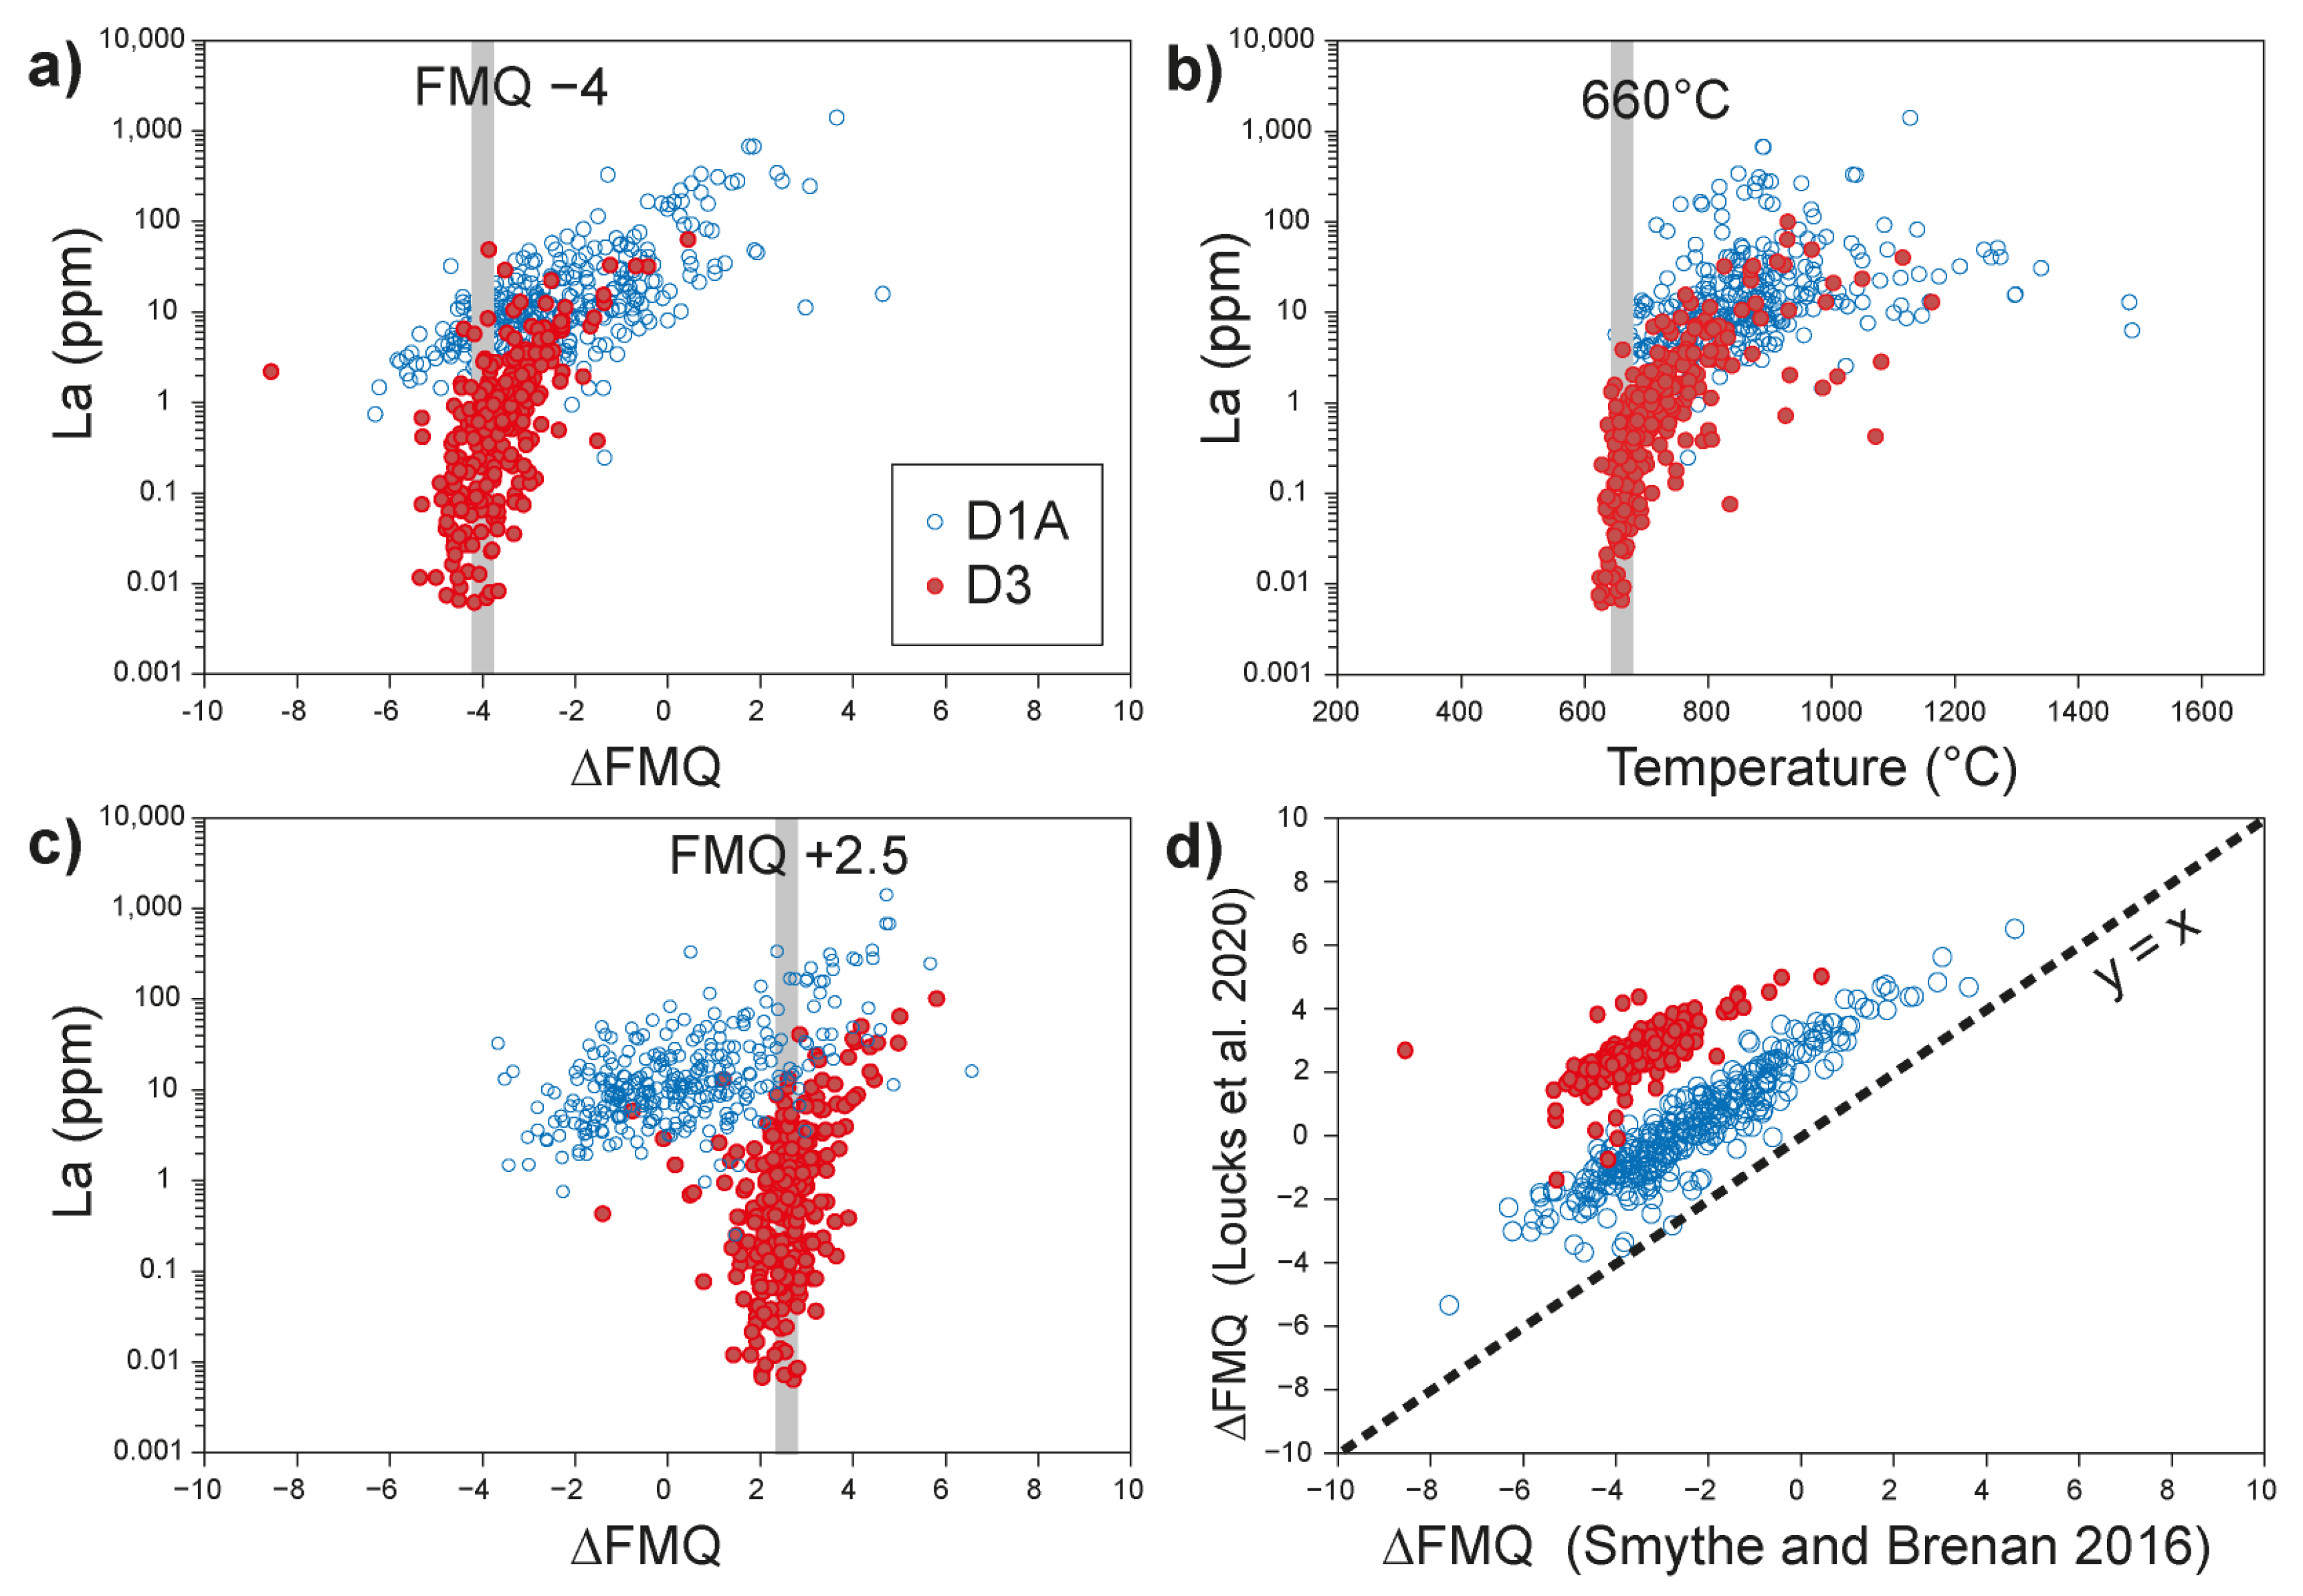
4.6. Calculating the fO2 and Temperature Parameters
4.7. Comparison with Another Carbonatite-Bearing Intrusive Complex
5. Discussion
5.1. Rock Type and Intrusive Phases
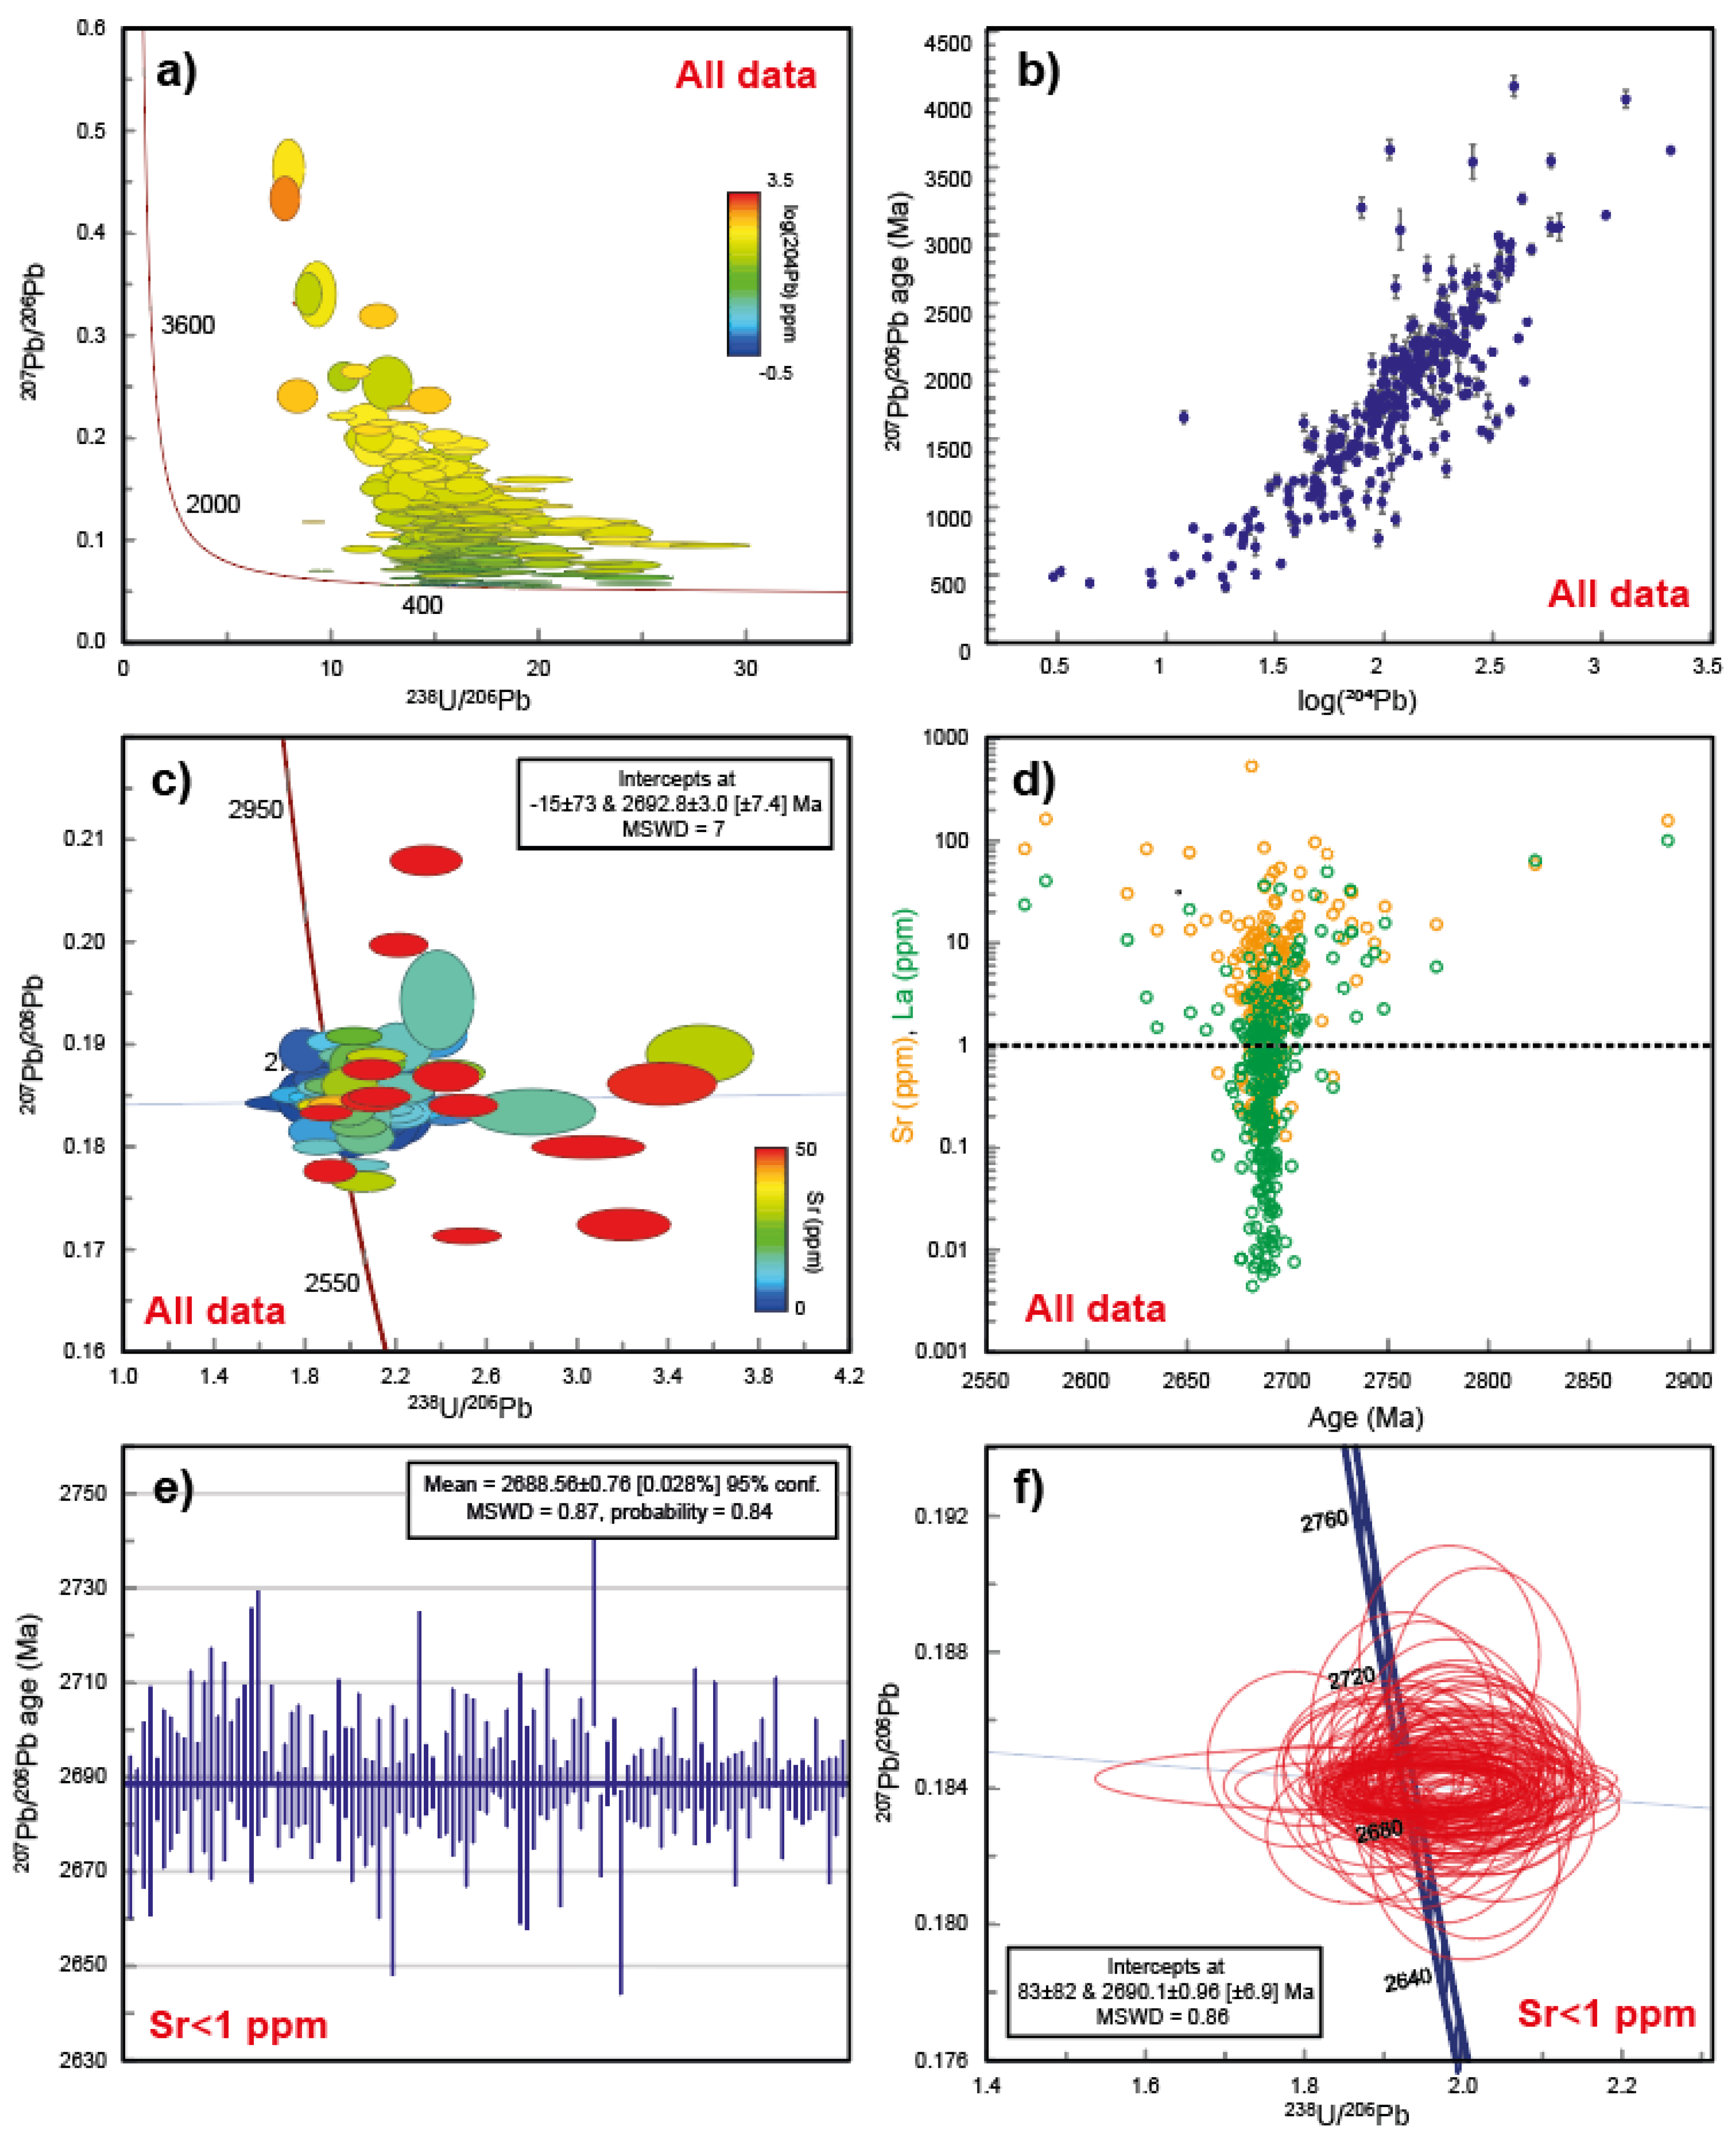
5.2. Timing of Zircon Crystallization
5.3. Physical-Chemical Properties
5.4. Chemical Composition of Zircon
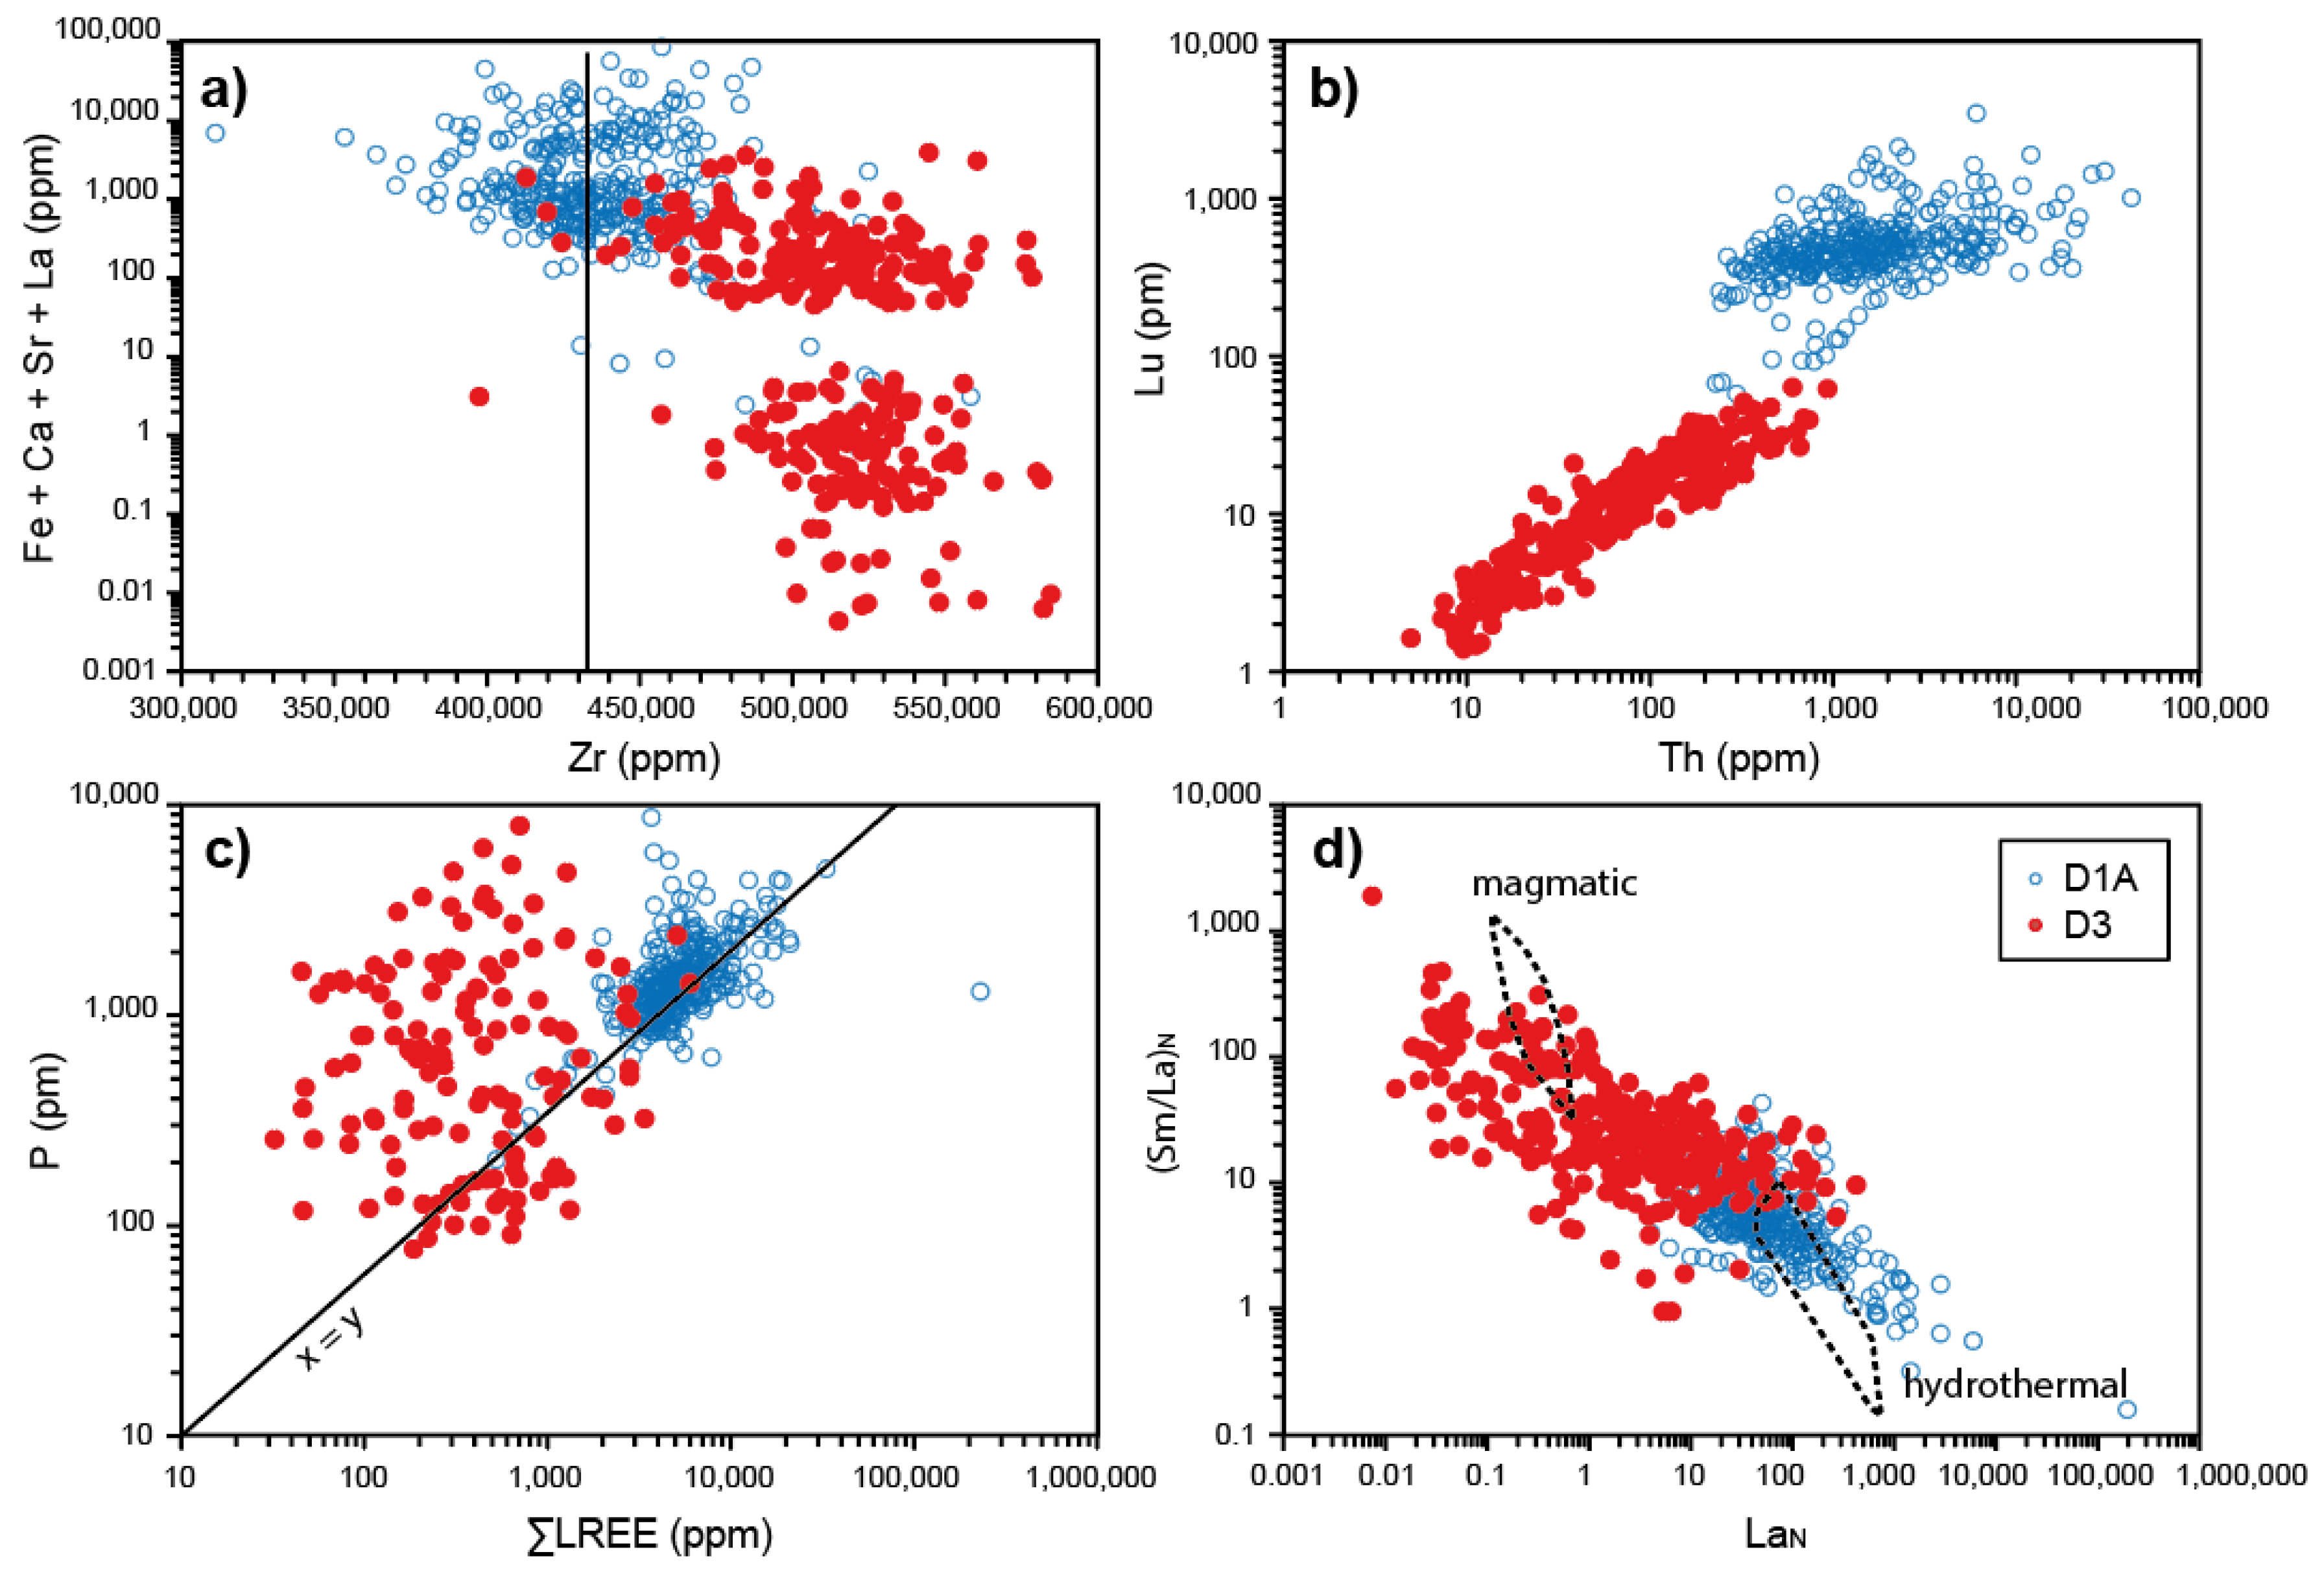
5.5. Discrimination Diagrams
6. Conclusions
Supplementary Materials
Author Contributions
Funding
Data Availability Statement
Acknowledgments
Conflicts of Interest
References
- Robert, F. Syenite-associated disseminated gold deposits in the Abitibi greenstone belt, Canada. Miner. Depos. 2001, 36, 503–516. [Google Scholar] [CrossRef]
- Mathieu, L. Intrusion-Associated Gold Systems and Multistage Metallogenic Processes in the Neoarchean Abitibi Greenstone Belt. Minerals 2021, 11, 261. [Google Scholar] [CrossRef]
- Dubé, B.; Mercier-Langevin, P. Gold Deposits of the Archean Abitibi Greenstone Belt, Canada. In Geology of the World’s Major Gold Deposits and Provinces; Society of Economic Geologists: Littleton, CO, USA, 2020; Volume 23, pp. 669–708. ISBN 978-1629496-42-9. [Google Scholar]
- Meng, X.; Richards, J.P.; Kontak, D.J.; Simon, A.C.; Kleinsasser, J.M.; Marsh, J.H.; Stern, R.A.; Jugo, P.J. Variable Modes of Formation for Tonalite-Trondhjemite-Granodiorite-Diorite (TTG)-related Porphyry-type Cu-Au Deposits in the Neoarchean Southern Abitibi Subprovince (Canada): Evidence from Petrochronology and Oxybarometry. J. Petrol. 2021, 62, egab079. [Google Scholar] [CrossRef]
- Katz, L.R.; Kontak, D.J.; Dubé, B.; McNicoll, V. The geology, petrology, and geochronology of the Archean Côté Gold large-tonnage, low-grade intrusion-related Au (±Cu) deposit, Swayze greenstone belt, Ontario, Canada. Can. J. Earth Sci. 2017, 54, 173–202. [Google Scholar] [CrossRef] [Green Version]
- Mathieu, L.; Racicot, D. Petrogenetic study of the multiphase chibougamau pluton: Archaean magmas associated with cu-au magmato-hydrothermal systems. Minerals 2019, 9, 174. [Google Scholar] [CrossRef] [Green Version]
- Pilote, P.; Allard, G.O.; Bellevance, Y.; Blais, A.; Brisson, H.; Chown, E.H.; Daigneault, R.; de Corta, H.; Dion, C.; Gervais, D.; et al. Géologie et Métallogénie du District Minier de Chapais-Chibougamau: Nouvelle Vision du Potentiel de Découverte; MRN Report DV-98-03; Ministère des Ressources Naturelles: Québec, QC, Canada, 1998. [Google Scholar]
- Fayol, N.; Jébrak, M. Archean sanukitoid gold porphyry deposits: A new understanding and genetic model from the Lac Bachelor gold deposit, Abitibi, Canada. Econ. Geol. 2017, 112, 1913–1936. [Google Scholar] [CrossRef] [Green Version]
- Groves, D.I.; Goldfarb, R.J.; Gebre-Mariam, M.; Hagemann, S.G.; Robert, F. Orogenic gold deposits: A proposed classification in the context of their crustal distribution and relationship to other gold deposit types. Ore Geol. Rev. 1998, 13, 7–27. [Google Scholar] [CrossRef]
- Phillips, G.N.; Powell, R. Formation of gold deposits: A metamorphic devolatilization model. J. Metamorph. Geol. 2010, 28, 689–718. [Google Scholar] [CrossRef]
- El Rassi, D. Technical Report on the Douay Gold Project, Northwestern Québec, Canada; Technical Report NI 43-101; Maple Gold Mines Ltd.: Vancouver, BC, Canada, 2019. [Google Scholar]
- Wen, Z.H.; Li, L.; Li, S.R.; Santosh, M.; Alam, M.; Yuan, M.W.; Li, S.S.; Zhi, Z.Y.; Liu, J.W. Gold forming potential of the granitic plutons in the Xiaoqinling gold province, southern margin of the North China Craton: Perspectives from zircon U-Pb isotopes and geochemistry. Geol. J. 2020, 55, 5725–5744. [Google Scholar] [CrossRef]
- Mathieu, L.; Madon, B.; Hamilton, M.A. Physico-chemical parameters of Neoarchean syntectonic magmatism: The example of the Muscocho Pluton, Abitibi Subprovince. Ore Geol. Rev. 2020, 125, 103670. [Google Scholar] [CrossRef]
- Madon, B.; Mathieu, L.; Marsh, J.H. Oxygen fugacity and volatile content of syntectonic magmatism in the Neoarchean Abitibi greenstone belt, Superior Province, Canada. Minerals 2020, 10, 966. [Google Scholar] [CrossRef]
- Botcharnikov, R.E.; Linnen, R.L.; Wilke, M.; Holtz, F.; Jugo, P.J.; Berndt, J. High gold concentrations in sulphide-bearing magma under oxidizing conditions. Nat. Geosci. 2011, 4, 112. [Google Scholar] [CrossRef]
- Laurent, O.; Martin, H.; Moyen, J.-F.; Doucelance, R. The diversity and evolution of late-Archean granitoids: Evidence for the onset of “modern-style” plate tectonics between 3.0 and 2.5 Ga. Lithos 2014, 205, 208–235. [Google Scholar] [CrossRef]
- Beakhouse, G.P. The Abitibi Subprovince Plutonic Record: Tectonic and Metallogenic Implications; Open File Report 6268; Ontario Geological Survey: Sudbury, ON, Canada, 2011.
- Mathieu, L.; Snyder, D.B.; Bedeaux, P.; Cheraghi, S.; Lafrance, B.; Thurston, P.; Sherlock, R. Deep into the Chibougamau Area, abitibi greenstone belt: Structure of a Neoarchean crust revealed by seismic reflection profiling. Tectonics 2020, 39, e2020TC006223. [Google Scholar] [CrossRef]
- Mortensen, J.K. U-Pb geochronology of the eastern Abitibi Subprovince. Part 2: Noranda-Kirkland Lake area. Can. J. Earth Sci. 1993, 30, 29–41. [Google Scholar] [CrossRef]
- Thurston, P.C.; Ayer, J.A.; Goutier, J.; Hamilton, M.A. Depositional gaps in Abitibi greenstone belt stratigraphy: A key to exploration for syngenetic mineralization. Econ. Geol. 2008, 103, 1097–1134. [Google Scholar] [CrossRef] [Green Version]
- Leclerc, F.; Roy, P.; Pilote, P.; Bédard, J.H.; Harris, L.B.; McNicoll, V.J.; van Breemen, O.; David, J.; Goulet, N. Géologie de la Région de Chibougamau; MERN Report RG 2015-03; Ministère de l’Énergie et des Ressources Naturelles: Québec, QC, Canada, 2017.
- Daigneault, R.; St-Julien, P.; Allard, G.O. Tectonic evolution of the northeast portion of the Archean Abitibi greenstone belt, Chibougamau area, Quebec. Can. J. Earth Sci. 1990, 27, 1714–1736. [Google Scholar] [CrossRef]
- Davis, W.J.; Lacroix, S.; Gariépy, C.; Machado, N. Geochronology and radiogenic isotope geochemistry of plutonic rocks from the central Abitibi subprovince: Significance to the internal subdivision and plutono-tectonic evolution of the Abitibi belt. Can. J. Earth Sci. 2000, 37, 117–133. [Google Scholar] [CrossRef]
- Legault, M.; Gauthier, M.; Jébrak, M.; Davis, D.W.; Baillargeon, F. Evolution of the subaqueous to near-emergent Joutel volcanic complex, Northern volcanic zone, Abitibi Subprovince, Quebec, Canada. Precambrian Res. 2002, 115, 187–221. [Google Scholar] [CrossRef]
- Davis, D.W.; David, J.; Dion, C.; Goutier, J.; Bandyayera, D.; Rhéaume, P.; Roy, P. Datations U-Pb Effectuées en Support aux Travaux de Cartographie Géologique et de Compilation Géoscientifique du SGNO (2003-2004); MRNF Report RP 2005-02; Ministère des Ressources Naturelles et de la Faune: Québec, QC, Canada, 2005.
- Pilote, P. Géologie de la Région de Casa-Bérardi, Dieppe, Collet et Laberge; MERN Report MB 89-43; Ministère de l’Énergie et des Ressources Naturelles: Québec, QC, Canada, 1989.
- Bigot, L.; Jébrak, M. Gold mineralization at the syenite-hosted Beattie gold deposit, Duparquet, Neoarchean Abitibi Belt, Canada. Econ. Geol. 2015, 110, 315–335. [Google Scholar] [CrossRef]
- Bigot, L. Gold Mineralizations at the Syenite-Hosted Beattie Gold Deposit at Duparquet, Neoarchean Abitibi Belt, Québec, Canada. Master’s Thesis, Université du Québec à Montréal, Montréal, QC, Canada, 2012, unpublished. [Google Scholar]
- Bourdeau, J. Petrology, mineralogy and geochemistry of the Beattie syenite and country rocks, Abitibi greenstone belt, Québec. Master’s Thesis, University of Ottawa, Ottawa, ON, Canada, 2013, unpublished. [Google Scholar]
- Kylander-Clark, A.R.; Hacker, B.R.; Cottle, J.M. Laser-ablation split-stream ICP petrochronology. Chem. Geol. 2013, 345, 99–112. [Google Scholar] [CrossRef]
- Paton, C.; Hellstrom, J.; Paul, B.; Woodhead, J.; Hergt, J. Iolite: Freeware for the visualisation and processing of mass spectrometric data. J. Anal. At. Spectrom. 2011, 26, 2508–2518. [Google Scholar] [CrossRef]
- Petrus, J.A.; Kamber, B.S. VizualAge: A Novel Approach to Laser Ablation ICP-MS U-Pb Geochronology Data Reduction. Geostand. Geoanalytical Res. 2012, 36, 247–270. [Google Scholar] [CrossRef]
- Stern, R.A.; Bodorkos, S.; Kamo, S.L.; Hickman, A.H.; Corfu, F. Measurement of SIMS instrumental mass fractionation of Pb isotopes during zircon dating. Geostand. Geoanalytical Res. 2009, 33, 145–168. [Google Scholar] [CrossRef]
- Davis, D.W. U–Pb geochronology of Archean metasedimentary rocks in the Pontiac and Abitibi subprovinces, Quebec, constraints on timing, provenance and regional tectonics. Precambrian Res. 2002, 115, 97–117. [Google Scholar] [CrossRef]
- Marsh, A.D.; Parker, W.G.; Stockli, D.F.; Martz, J.W. Regional correlation of the Sonsela Member (Upper Triassic Chinle Formation) and detrital U-Pb zircon data from the Sonsela Sandstone bed near the Sonsela Buttes, northeastern Arizona, USA, support the presence of a distributive fluvial system. Geosphere 2019, 15, 1128–1139. [Google Scholar] [CrossRef] [Green Version]
- Wiedenbeck, M.; Hanchar, J.M.; Peck, W.H.; Sylvester, P.; Valley, J.; Whitehouse, M.; Kronz, A.; Morishita, Y.; Nasdala, L.; Fiebig, J. Further characterisation of the 91500 zircon crystal. Geostand. Geoanalytical Res. 2004, 28, 9–39. [Google Scholar] [CrossRef]
- Wiedenbeck, M.; Alle, P.; Corfu, F.Y.; Griffin, W.L.; Meier, M.; Oberli, F.V.; von Quadt, A.; Roddick, J.C.; Spiegel, W. Three natural zircon standards for U Th Pb, Lu Hf, trace element and REE analyses. Geostand. Newsl. 1995, 19, 1–23. [Google Scholar] [CrossRef]
- Mathieu, L.; Crépon, A.; Kontak, D.J. Tonalite-dominated magmatism in the abitibi subprovince, canada, and significance for Cu-Au magmatic-hydrothermal systems. Minerals 2020, 10, 242. [Google Scholar] [CrossRef] [Green Version]
- Trépanier, S.; Mathieu, L.; Daigneault, R.; Faure, S. Precursors predicted by artificial neural networks for mass balance calculations: Quantifying hydrothermal alteration in volcanic rocks. Comput. Geosci. 2016, 89, 32–43. [Google Scholar] [CrossRef] [Green Version]
- Mathieu, L. Quantifying hydrothermal alteration: A review of methods. Geoscience 2018, 8, 245. [Google Scholar] [CrossRef] [Green Version]
- Frost, B.R.; Barnes, C.G.; Collins, W.J.; Arculus, R.J.; Ellis, D.J.; Frost, C.D. A geochemical classification for granitic rocks. J. Petrol. 2001, 42, 2033–2048. [Google Scholar] [CrossRef]
- Hofmann, A.W. Chemical differentiation of the Earth: The relationship between mantle, continental crust, and oceanic crust. Earth Planet. Sci. Lett. 1988, 90, 297–314. [Google Scholar] [CrossRef] [Green Version]
- Pearce, J.A. Geochemical fingerprinting of oceanic basalts with applications to ophiolite classification and the search for Archean oceanic crust. Lithos 2008, 100, 14–48. [Google Scholar] [CrossRef]
- Watson, E.B.; Harrison, T.M. Zircon saturation revisited: Temperature and composition effects in a variety of crustal magma types. Earth Planet. Sci. Lett. 1983, 64, 295–304. [Google Scholar] [CrossRef]
- Borisov, A.; Aranovich, L. Zircon solubility in silicate melts: New experiments and probability of zircon crystallization in deeply evolved basic melts. Chem. Geol. 2019, 510, 103–112. [Google Scholar] [CrossRef]
- Hayden, L.A.; Watson, E.B. Rutile saturation in hydrous siliceous melts and its bearing on Ti-thermometry of quartz and zircon. Earth Planet. Sci. Lett. 2007, 258, 561–568. [Google Scholar] [CrossRef]
- Corfu, F.; Hanchar, J.M.; Hoskin, P.W.; Kinny, P. Atlas of zircon textures. Rev. Mineral. Geochem. 2003, 53, 469–500. [Google Scholar] [CrossRef]
- Pupin, J.P. Zircon and granite petrology. Contrib. Mineral. Petrol. 1980, 73, 207–220. [Google Scholar] [CrossRef]
- Hoskin, P.W.O.; Schaltegger, U. The composition of zircon and igneous and metamorphic petrogenesis. Rev. Mineral. Geochem. 2003, 53, 27–62. [Google Scholar] [CrossRef]
- Hoskin, P.W.O. Patterns of chaos: Fractal statistics and the oscillatory chemistry of zircon. Geochim. Cosmochim. Acta 2000, 64, 1905–1923. [Google Scholar] [CrossRef]
- Speer, J.A. Zircon. In Orthosilicates; Burns, R.G., Ed.; De Gruyter: Boston, MA, USA, 2018; pp. 67–112. ISBN 1501508628. [Google Scholar]
- Hoskin, P.W.O. Trace-element composition of hydrothermal zircon and the alteration of Hadean zircon from the Jack Hills, Australia. Geochim. Cosmochim. Acta 2005, 69, 637–648. [Google Scholar] [CrossRef]
- Smythe, D.J.; Brenan, J.M. Magmatic oxygen fugacity estimated using zircon-melt partitioning of cerium. Earth Planet. Sci. Lett. 2016, 453, 260–266. [Google Scholar] [CrossRef] [Green Version]
- Loucks, R.R.; Fiorentini, M.L.; Henriquez, G.J. New magmatic oxybarometer using trace elements in zircon. J. Petrol. 2020, 61, egaa034. [Google Scholar] [CrossRef]
- Ferry, J.M.; Watson, E.B. New thermodynamic models and revised calibrations for the Ti-in-zircon and Zr-in-rutile thermometers. Contrib. Mineral. Petrol. 2007, 154, 429–437. [Google Scholar] [CrossRef]
- Groulier, P.-A.; Turlin, F.; André-Mayer, A.-S.; Ohnenstetter, D.; Crépon, A.; Boulvais, P.; Poujol, M.; Rollion-Bard, C.; Zeh, A.; Moukhsil, A. Silicate-carbonate liquid immiscibility: Insights from the Crevier alkaline intrusion (Quebec). J. Petrol. 2020, 61, egaa033. [Google Scholar] [CrossRef]
- Watson, E.B. Zircon saturation in felsic liquids: Experimental results and applications to trace element geochemistry. Contrib. Mineral. Petrol. 1979, 70, 407–419. [Google Scholar] [CrossRef]
- Hanchar, J.M.; Watson, E.B. Zircon saturation thermometry. Rev. Mineral. Geochem. 2003, 53, 89–112. [Google Scholar] [CrossRef]
- Kogarko, L.N. Ore-forming potential of alkaline magmas. Lithos 1990, 26, 167–175. [Google Scholar] [CrossRef]
- Marr, R.A.; Baker, D.R.; Williams-Jones, A.E. Chemical controls on the solubility of Zr-bearing phases in simplified peralkaline melts and application to the Strange Lake Intrusion, Quebec-Labrador. Can. Mineral. 1998, 36, 1001–1008. [Google Scholar]
- Pidgeon, R.T.; Nemchin, A.A.; Hitchen, G.J. Internal structures of zircons from Archaean granites from the Darling Range batholith: Implications for zircon stability and the interpretation of zircon U-Pb ages. Contrib. to Mineral. Petrol. 1998, 132, 288–299. [Google Scholar] [CrossRef]
- Geisler, T.; Schaltegger, U.; Tomaschek, F. Re-equilibration of zircon in aqueous fluids and melts. Elements 2007, 3, 43–50. [Google Scholar] [CrossRef]
- Miller, C.F.; McDowell, S.M.; Mapes, R.W. Hot and cold granites? Implications of zircon saturation temperatures and preservation of inheritance. Geology 2003, 31, 529–532. [Google Scholar] [CrossRef]
- Meldrum, A.; Boatner, L.A.; Zinkle, S.J.; Wang, S.-X.; Wang, L.-M.; Ewing, R.C. Effects of dose rate and temperature on the crystalline-to-metamict transformation in the ABO 4 orthosilicates. Can. Mineral. 1999, 37, 207–221. [Google Scholar]
- Gao, Y.-Y.; Li, X.-H.; Griffin, W.L.; O’Reilly, S.Y.; Wang, Y.-F. Screening criteria for reliable U-Pb geochronology and oxygen isotope analysis in uranium-rich zircons: A case study from the Suzhou A-type granites, SE China. Lithos 2014, 192, 180–191. [Google Scholar] [CrossRef]
- Huguet, J. Pétrographie et Géochimie du Pluton de Chevrillon et Relation Structurale avec le Groupe d’Opémisca (Région de Chibougamau, Québec). Master’s Thesis, University of Ottawa, Ottawa, ON, Canada, 2019, unpublished. [Google Scholar]
- Bédard, L.P.; Chown, E.H. The Dolodau dykes, Canada: An example of an Archean carbonatite. Mineral. Petrol. 1992, 46, 109–121. [Google Scholar] [CrossRef]
- Augland, L.E.; David, J.; Pilote, P.; Leclerc, F.; Goutier, J.; Hammouche, H.; Lafrance, I.; Takam, T.F.; Deschênes, P.L.; Guemache, M. Datations U-Pb dans les Provinces de Churchill et du Supérieur Effectuées au GEOTOP en 2012-2013; MERN Report RP 2015-01; Ministère de l’Énergie et des Ressources Naturelles: Québec, QC, Canada, 2016.
- Tilton, G.R.; Bell, K. Sr-Nd-Pb isotope relationships in Late Archean carbonatites and alkaline complexes: Applications to the geochemical evolution of Archean mantle. Geochim. Cosmochim. Acta 1994, 58, 3145–3154. [Google Scholar] [CrossRef]
- Holtz, F.; Johannes, W. Maximum and minimum water contents of granitic melts: Implications for chemical and physical properties of ascending magmas. Lithos 1994, 32, 149–159. [Google Scholar] [CrossRef]
- Xing, Y.; Mei, Y.; Etschmann, B.; Liu, W.; Brugger, J. Uranium transport in F-Cl-bearing fluids and hydrothermal upgrading of U-Cu ores in IOCG deposits. Geofluids 2018, 2018, 1–22. [Google Scholar] [CrossRef] [Green Version]
- Rowins, S.M.; Cameron, E.M.; Lalonde, A.E.; Ernst, R.E. Petrogenesis of the late Archean syenitic Murdock Creek pluton, Kirkland Lake, Ontario: Evidence for an extensional tectonic setting. Can. Mineral. 1993, 31, 219. [Google Scholar]
- Rayner, N.; Stern, R.A.; Carr, S.D. Grain-scale variations in trace element composition of fluid-altered zircon, Acasta Gneiss Complex, northwestern Canada. Contrib. Mineral. Petrol. 2005, 148, 721–734. [Google Scholar] [CrossRef]
- Trail, D.; Watson, E.B.; Tailby, N.D. Ce and Eu anomalies in zircon as proxies for the oxidation state of magmas. Geochim. Cosmochim. Acta 2012, 97, 70–87. [Google Scholar] [CrossRef]
- Liu, W.; Etschmann, B.; Migdisov, A.; Boukhalfa, H.; Testemale, D.; Muller, H.; Hazemann, J.-L.; Brugger, J. Revisiting the hydrothermal geochemistry of europium (II/III) in light of new in-situ XAS spectroscopy results. Chem. Geol. 2017, 459, 61–74. [Google Scholar] [CrossRef]
- Hastie, A.R.; Kerr, A.C.; Pearce, J.A.; Mitchell, S.F. Classification of altered volcanic island arc rocks using immobile trace elements: Development of the Th-Co discrimination diagram. J. Petrol. 2007, 48, 2341–2357. [Google Scholar] [CrossRef] [Green Version]
- Wu, Y.; Zheng, Y. Genesis of zircon and its constraints on interpretation of U-Pb age. Chin. Sci. Bull. 2004, 49, 1554–1569. [Google Scholar] [CrossRef]
- Rubatto, D.; rg Hermann, J. Zircon behaviour in deeply subducted rocks. Elements 2007, 3, 31–35. [Google Scholar] [CrossRef]
- Möller, A.; O’Brien, P.J.; Kennedy, A.; Kröner, A. Linking growth episodes of zircon and metamorphic textures to zircon chemistry: An example from the ultrahigh-temperature granulites of Rogaland (SW Norway). Geol. Soc. London, Spec. Publ. 2003, 220, 65–81. [Google Scholar] [CrossRef]


| Sample | Latitude | Longitude | Description |
|---|---|---|---|
| D1A | 49.531720 | −78.142188 | coarse-grained intrusive phase (carbonatized) |
| D2 | 49.531588 | −78.142307 | coarse-grained intrusive phase (carbonatized) |
| D3 | 49.531649 | −78.142220 | aplite dyke |
| D4 | 49.531677 | −78.142260 | strongly altered intrusive phase (‘red rock’) |
| D5 | 49.531620 | −78.142139 | coarse-grained feldspar-phyric intrusive phase (carbonatized) |
| Sample | CaO | FeOT | K2O | MgO | Na2O | SiO2 |
|---|---|---|---|---|---|---|
| D1A | 0.84 1 | −0.53 | 1.31 | −0.89 | 2.12 | −4.71 |
| D2 | 0.14 | −0.74 | 0.58 | −0.74 | 1.11 | −10.85 |
| D3 | calculation failed (invalid Al/Ti ratio) | |||||
| D4 | 0.56 | −0.77 | −0.07 | −0.63 | 2.80 | −15.17 |
| D5 | 1.13 | −0.21 | 0.60 | −0.60 | 1.28 | −11.51 |
| Sample D3 | Sample D1A | |||
|---|---|---|---|---|
| ˂3 ppm Sr 1 | ˃3 ppm Sr | ˂32 ppm Sr | ˃32 ppm Sr | |
| P (ppm) | 451.88 | 670.62 | 1210.88 | 1548.60 |
| Ca | not detected | 2274.88 | 4958.04 | 6298.40 |
| Sc | 220.17 | 227.61 | 529.38 | 1019.42 |
| Ti | 2.57 | 5.93 | 12.49 | 19.89 |
| Fe | 114.02 | 235.30 | 580.58 | 1110.12 |
| Sr | 0.83 | 9.84 | 19.57 | 56.73 |
| Y | 228.16 | 591.78 | 2091.35 | 2627.67 |
| Zr | 52,0568 | 508,821 | 434,006 | 433,971 |
| Nb | 0.88 | 1.46 | 153.38 | 221.65 |
| La | 0.20 | 1.88 | 7.28 | 18.22 |
| Ce | 22.11 | 54.18 | 78.03 | 167.98 |
| Pr | 0.47 | 4.92 | 6.14 | 18.34 |
| Nd | 4.26 | 31.16 | 25.88 | 82.25 |
| Sm | 3.93 | 20.58 | 25.45 | 68.28 |
| Eu | 1.83 | 8.19 | 0.05 | 0.07 |
| Gd | 9.59 | 37.62 | 59.02 | 121.49 |
| Tb | 2.23 | 8.11 | 28.57 | 52.14 |
| Dy | 21.52 | 68.82 | 354.73 | 594.33 |
| Ho | 7.00 | 19.43 | 123.94 | 185.67 |
| Er | 32.27 | 80.66 | 682.79 | 949.87 |
| Tm | 6.70 | 14.92 | 183.55 | 248.54 |
| Yb | 55.53 | 115.15 | 1973.78 | 2760.02 |
| Lu | 8.68 | 17.46 | 403.29 | 561.33 |
| Hf | 5811.33 | 5457.94 | 27,517.40 | 29,958.15 |
| Th | 42.29 | 133.44 | 492.80 | 1606.59 |
| Ta | 0.09 | 0.13 | 134.90 | 190.82 |
| U | 110.07 | 209.28 | 5388.84 | 8383.87 |
Publisher’s Note: MDPI stays neutral with regard to jurisdictional claims in published maps and institutional affiliations. |
© 2022 by the authors. Licensee MDPI, Basel, Switzerland. This article is an open access article distributed under the terms and conditions of the Creative Commons Attribution (CC BY) license (https://creativecommons.org/licenses/by/4.0/).
Share and Cite
Mathieu, L.; Wasuita, T.D.; Sherlock, R.; Speidel, F.; Marsh, J.H.; Dubé, B.; Côté-Mantha, O. Zircon from Altered Monzonite Rocks Provides Insights into Magmatic and Mineralizing Processes at the Douay Au Project, Abitibi Greenstone Belt. Geosciences 2022, 12, 114. https://0-doi-org.brum.beds.ac.uk/10.3390/geosciences12030114
Mathieu L, Wasuita TD, Sherlock R, Speidel F, Marsh JH, Dubé B, Côté-Mantha O. Zircon from Altered Monzonite Rocks Provides Insights into Magmatic and Mineralizing Processes at the Douay Au Project, Abitibi Greenstone Belt. Geosciences. 2022; 12(3):114. https://0-doi-org.brum.beds.ac.uk/10.3390/geosciences12030114
Chicago/Turabian StyleMathieu, Lucie, Taylor D. Wasuita, Ross Sherlock, Fred Speidel, Jeffrey H. Marsh, Benoît Dubé, and Olivier Côté-Mantha. 2022. "Zircon from Altered Monzonite Rocks Provides Insights into Magmatic and Mineralizing Processes at the Douay Au Project, Abitibi Greenstone Belt" Geosciences 12, no. 3: 114. https://0-doi-org.brum.beds.ac.uk/10.3390/geosciences12030114