
Down under and under Cover—The Tectonic and Thermal History of the Cooper and Central Eromanga Basins (Central Eastern Australia)


Energy and Mineral Resources Group (EMR), Institute of Geology and Geochemistry of Petroleum and Coal, RWTH Aachen University, Lochnerstr. 4-20, 52056 Aachen, Germany
*
Author to whom correspondence should be addressed.
Geosciences 2022, 12(3), 117; https://0-doi-org.brum.beds.ac.uk/10.3390/geosciences12030117
Submission received: 14 December 2021
/
Revised: 23 January 2022
/
Accepted: 1 February 2022
/
Published: 2 March 2022
(This article belongs to the Special Issue Temperature in Sedimentary Basins II)
Abstract
:The Cooper subregion within the central Eromanga Basin is the Swiss army knife among Australia’s sedimentary basins. In addition to important oil and gas resources, it hosts abundant coal bed methane, important groundwater resources, features suitable conditions for enhanced geothermal systems, and is a potential site for carbon capture and storage. However, after seven decades of exploration, various uncertainties remain concerning its tectonic and thermal evolution. In this study, the public-domain 3D model of the Cooper and Eromanga stacked sedimentary basins was modified by integrating the latest structural and stratigraphic data, then used to perform numerical basin modelling and subsidence history analysis for a better comprehension of their complex geologic history. Calibrated 1D/3D numerical models provide the grounds for heat flow, temperature, thermal maturity, and sediment thickness maps. According to calibrated vitrinite reflectance profiles, a major hydrothermal/magmatic event at about 100 Ma with associated basal heat flow up to 150 mW/m2 caused source rock maturation and petroleum generation and probably overprinted most of the previous hydrothermal events in the study area. This event correlates with sedimentation rates up to 200 m/Ma and was apparently accompanied by extensive crustal shear. Structural style and depocentre migration analysis suggest that the Carboniferous–Triassic Cooper Basin initially has been a lazy-s shaped triplex pull-apart basin controlled by the Cooper Basin Master Fault before being inverted into a piggy-back basin and then blanketed by the Jurassic–Cretaceous Eromanga Basin. The interpreted Central Eromanga Shear Zone governed the tectonic evolution from the Triassic until today. It repeatedly induced NNW-SSE directed deformation along the western edge of the Thomson Orogen and is characterized by present-day seismicity and distinct neotectonic features. We hypothesize that throughout the basin evolution, alternating tectonic stress caused frequent thermal weakening of the crust and facilitated the establishment of the Cooper Hot Spot, which recently increased again its activity below the Nappamerri Trough.
1. Introduction
Since the 1950s, the intracontinental Cooper Basin (CB) in conjunction with the overlying Eromanga Basin (EB) in central eastern Australia (Figure 1a) has constituted Australia’s most important onshore petroleum province [1,2]. With a combined sediment thickness of up to 5000 m and with an area of ca. 127,000 km2, the CB is covering parts of NE South Australia and SW Queensland [3,4].
Although widely studied, the region recently again became the subject of numerous investigations aiming to reassess its petroleum potential, including source rock characterization and identification of new unconventional hydrocarbon targets [4,5,6,7,8]. Among other objectives, the latest investigations also aim to improve Australia’s domestic energy market and water supply through studying the development of enhanced geothermal systems (EGS), hydrogeological conditions, and the evaluation of carbon capture and underground storage (CCS) potential [9,10,11,12,13,14,15,16,17].
The study area is located in central eastern Australia (outline of the CB after [3]; Figure 1b) and comprises at least four superimposed sedimentary basin sequences: (1) the Cambrian to Ordovician Warburton Basin (WB), (2) the late Carboniferous to Triassic CB, (3) the Jurassic to Cretaceous EB, and (4) the Cenozoic Lake Eyre Basin (LEB). Several attempts have been made to reconstruct the subsidence history and thermal evolution of the Cooper and Eromanga basins [18,19,20,21,22,23,24,25,26,27]. However, conclusions are often contradictory, and the debate on the responsible tectonic opening mechanism of the superimposed basins (intracratonic vs. foreland vs. rift-related, etc.) is still ongoing [4,7,28,29]. In Figure 1c,d, two cross sections (2D extractions from the numerical 3D model) are displayed proceeding through the main troughs and ridges of the study area. The cross sections are intersecting each other in the centre of the Nappamerri Trough, approximately at the deepest point of the Cooper Basin.
Initial exploration activities in the study area began in 1945. Drilled by Santos in 1959, wildcat well Innamincka-1 for the first time intersected the entire Cooper Basin and revealed first hydrocarbon shows in Mesozoic and Permian rocks. In 1963, the first commercial gas was found at Gidgealpa-2 and in the following years, further hydrocarbon discoveries were made mainly in anticlinal structures and along basement ridges [30,31].
Since 2009, exploration activities have focused on development of unconventional resources [5,32] and total petroleum prospectivity [8], but also include ground water, EGS, and CCS [9,15,16,17]. In 2015, approximately 160 oil fields (84 in Queensland, 82 in South Australia) and nearly 250 gas fields (158 of which are located in Queensland, 98 in South Australia) were productive [7]. Conventional and unconventional plays of the Cooper–Eromanga basin couplet contain 447 MMbbl of oil, 160 MMbbl of condensates, 220 MMbbl of liquefied petroleum gas (LPG), and 10.2 Tcf (2.9 Tcm) of natural gas (combined remaining identified and produced hydrocarbons, as of December 2014 [33]).
Multi-1D and pseudo-3D petroleum system models provided a first insight into the hydrocarbon generation potential, timing of expulsion, and retained volumes [7,8]. The publicly available Cooper Basin regional petroleum system model [34] includes regional-scale 3D interpretations of main stratigraphic surfaces, updated stratigraphic ages, erosion estimates, facies maps, and Permo-Triassic source rocks properties maps (thickness, total organic carbon (TOC), and original hydrogen index (HI)). This dataset serves as the most detailed available framework for regional-scale resource assessment and petroleum system analysis [4] and was recently used for a comprehensive prospectivity study [8].
Subsurface temperature variations and thermal pulses throughout the geologic history are still poorly understood. This is due to local abnormally high present-day heat flow, inconclusive apatite and zircon fission track data, and some gaps in otherwise remarkably comprehensive vitrinite reflectance profiles [35,36]. Further, proposed unconformities due to episodes of erosion, Cretaceous glaciation, and probable effects of the enigmatic Tookoonooka meteorite impact [28,37,38,39,40] have been either overlooked and/or have not yet been considered in existing reports and models. Numerous evidence for strike-slip tectonics and considerable amounts of compression and uplift have been reported [41,42,43,44,45,46,47,48,49], but they were probably underestimated in recent prospectivity and modelling studies. Recently, revision of well data and interpretation of gravity maps and new 3D seismic surveys revealed widespread magmatic intrusions and volcanic flows in the basin center [27,29,50,51].
For improved exploration of hydrocarbons, geothermal systems, and groundwater and for a safe CCS assessment in the Cooper and Eromanga basins, it is fundamental to understand the tectonic evolution of this specific region. Specifically, the impact of the thermal history on the timing of source rock maturation and hydrocarbon generation and the faults’ slip tendency and permeability require detailed examination.
Figure 1.
Overview map of the study area with basement topography, main structural elements, and key well locations. (a) Eromanga (light green), Cooper (brown), and Warburton (dark green) basin outlines in central eastern Australia. Tasman Line after [52,53]. (b) Outline of the Cooper Basin after [3] with Cooper basement topography after [34] and with main structural features: thrusts and basement lineaments modified after [45,51]; anticlines and troughs modified after [4]; magmatic intrusions after [50,51]; hydrothermal province after [29]; Tookoonooka Impact after [39]. WA = Western Australia, NT = Northern Territory, SA = South Australia, QLD = Queensland, NSW = New South Wales, VIC = Victoria, TAS = Tasmania, GMI = Gidgealpa-Merrimelia-Innamincka, DNC = Della-Nappacoongee, DW = Dullingari-Wollgolla, JNP = Jackson-Naccowlah-Pepita. (c) Cross section (southwest to northeast) through the Nappamerri Trough, the main depocentre of the stacked Cooper and Eromanga basins, with ages of deposition. (d) Cross section (northwest to southeast) through the stacked Cooper and Eromanga basins with ages of deposition. For orientation of cross sections see Figure 1b.


In this study, the thermo-tectonic evolution of the Cooper–Eromanga couplet is reconstructed based on the existing 3D petroleum system model [34], the well database of Geoscience Australia [54], and additional input data. Source rock data from the Jurassic Birkhead and the Cretaceous Murta formations were integrated [55] and 1D burial history modelling was performed. Basal heat flow trends and amounts of erosion were constrained based on identified unconformities, calibrated thermal maturity (vitrinite reflectance) profiles, and Horner-corrected borehole temperature (BHT). Reconstructed thermo-tectonic evolution scenarios and their implications on the petroleum system are summarized and discussed. The applied workflow, which combines basin modelling, thermal calibration, subsidence history analysis, and a reality-check with the present-day tectonic situation is easily applicable in other sedimentary basins worldwide, when sufficient data are available.
2. Geological Background
Several Palaeozoic to Triassic stacked sedimentary basins in central eastern Australia (e.g., Warburton, Cooper, Galilee, and Bowen basins) are blanketed by widespread sedimentary sequences of the Early Jurassic to Late Cretaceous intra-continental Great Artesian Basin (GAB). Together with the Carpentaria Basin in the North and the Surat Basin in the East, the EB represents one of three major depressions of the GAB [1,56]. In the study area it directly overlays the Pennsylvanian to Middle Triassic CB (see Figure 1c,d) and features its maximum present-day thickness of locally more than 2 km [57]. Sporadically, 100–200 m of sandstones of the endorheic LEB are covering the eastern and central EB [2,57]. The GAB including the EB represents a large intra-continental sag basin [45,58] and the WB is broadly accepted as a metamorphic overprinted back-arc-basin [59].
The CB unconformable overlies a Palaeozoic basement (Warburton Unconformity), which predominantly consists of the Early Palaeozoic WB in South Australia and the Late Palaeozoic Thomson Beds on the Queensland side [1,2,60]. The NW-striking Karmona-Naccowlah Fault Zone (KNFZ, often also referred to as Jackson-Naccowlah-Pepita (JNP) trend) divides the basement topography of the CB into a high NE domain and a deeper, more complex SW domain ([61], also see Figure 1b,d).
The main depocentres in the NE domain (Windorah Trough, Ullenburry, and Thompson depressions) form a rather smooth relief and are separated by gentle NNW- and NNE-striking anticlines [2]. In comparison, the three relatively deep, NE-trending and subparallel oriented Patchawarra (PT), Nappamerri (NT), and Tenappera (TT) troughs in the SW domain are generally better defined and are divided by distinct NE-aligned basement ridges, namely the Gidgealpa-Merrimelia-Innamincka (GMI), Della-Nappacoongee (DNC), and Murteree ridges [62]. The basement ridges are associated with major thrusts and are laterally displaced by NW-striking lineaments [45]. These lineaments are oriented subparallel to the KNFZ and often feature an apparent dextral shear sense, probably originating from repeated strike-slip tectonics during the Proterozoic and Palaeozoic [63].
The basement of the SW CB also comprises numerous magmatic features. For example, the arcuate Ella Belt hosts plutonic bodies of Cambrian to Silurian age [28]. This chain of S-type granitic intrusions proceeds subparallel to the Currawinya Fault Zone (the eastward extension of the KNFZ) and bends towards the SW to form a line with the Metticka Embayment, the Tenappera Trough (TT), and the Weena Trough (WT). Additional sequences of probably Silurian intrusive bodies were identified further southwest along the Tasman Line (TL), a continental-scale structural boundary separating Precambrian (western) from Phanerozoic (eastern) Australia and also near the transition to the Adavale Basin in the east of the study area ([50], also see Figure 1b). The Late Carboniferous Big Lake Suite (BLS, dated: 320 ± 10 Ma) represents a second generation of S-type magmatic activity in the study area [35,64,65]. These granodiorites are restricted to the NT in South Australia (Figure 1b), oriented subparallel to the Ella Belt, and associated with a prominent geothermal anomaly with corresponding temperatures of about 270 °C at depths of 4 to 5 km [27,50].
2.1. Cooper Basin
The intracontinental CB developed from late Carboniferous to Middle Triassic and was filled with glacial, fluvio-deltaic, and lacustrine sediments [2,45]. The fully terrestrial stratigraphy of the CB (Figure 2a) subdivides into (1) the late Carboniferous to late Permian Gidgealpa Group (Gp) and (2) the late Permian to Middle Triassic Nappamerri Gp:
- Sedimentation of the Gidgealpa Gp (304–252 Ma) started after the Alice Springs Orogeny with the deposition of the terminoglacial Merrimelia Formation during the late Pennsylvanian and continued with the proglacial outwash and fluvial successions of the Tirrawarra Sandstone in the earliest Permian. Terrestrial sedimentation prevailed until the Capitanian and is represented locally by more than 1 km thick alternating (often coal-bearing) fluvio-deltaic, fluvio-lacustrine, and floodplain deposits of the Patchawarra Formation, Murteree Shale, Epsilon Formation, Roseneath Shale, and Daralingie Formation. The Gidgealpa Gp is interrupted by the Capitanian to Wuchiapingian Daralingie Unconformity (263–258 Ma), caused by far-field basin inversion due to an early northeast-southwest directed compressional pulse of the Hunter-Bowen Orogeny and separates the Daralingie Formation from the coal-bearing meandering fluvial Toolachee Formation [2,8,66].
- The Nappamerri Gp (252–237 Ma) starts with the braided fluvial and floodplain deposits of the Arrabury Formation on the Queensland side and its South Australian equivalents Callamurra, Paning, and Wimma Sandstone members. Sandy shales of the meandering fluvial Tinchoo Formation represent the uppermost successions of the Nappamerri Gp. Throughout the remaining Triassic period, the study area was subject to folding, uplift, and erosion caused by intraplate far-field stress of the east-west directed final pulse of the Hunter-Bowen Orogeny. This renewed basin inversion period is represented by the widespread Nappamerri Unconformity (237–200 Ma; [2,8,16,66]). Volcanic material, intersected by various wells (i.e., Kappa-1, Lambda-1, Orientos-2, Warnie East-1), provides a broad range of possible ages from Triassic to Cretaceous (e.g., [29,67]; personal communication with Ian R. Duddy), but most features seem to be of effusive origin and could be often chronologically and stratigraphically correlated with the Nappamerri Unconformity.
2.2. Eromanga Basin
The evolution of the EB (194–95 Ma) started due to thermal subsidence since the Jurassic. Its stratigraphy (Figure 2b) divides into four sub-sequences [4]:
- The chronologically isolated Late Triassic Cuddapan Formation (210–203 Ma, Figure 2a) represents the precursor of the extensive sedimentary blanket of the Eromanga Basin and consists of fluvial deposits and erosional remnants. Basin-wide sedimentation re-established only in the Early Jurassic.
- The Lower Jurassic to Lower Cretaceous fluvio-lacustrine succession (194–130 Ma) comprises the carbonaceous sandstones of the Poolowanna Formation, the fluvial Hutton Sandstone, and the fluvio-lacustrine Birkhead Formation. After the Birkhead Unconformity (160–155 Ma, see [28]), siliciclastic sedimentation resumed with the Adori Sandstone, Westbourne Formation, Namur Sandstone, and fluvio-lacustrine Murta Formation on the Queensland side and their South Australian equivalent, the Algebuckina Sandstone.
- The shallow marine Cadna-owie Formation introduces the Lower Cretaceous marginal marine to shallow marine sub-sequence (130–101 Ma). The distinct seismic “C”-horizon marks a short-lived unconformity [68] that coincides with the Tookoonooka structure (125 Ma, [39,69]), a large meteorite impact crater located at the eastern edge of the study area (Figure 1b). Its diameter is approximately 60 km, and the impact was accompanied by a twin, the Talundilly meteorite, which hit the surface about 300 km further north just outside the study area [39]. Following the Cadna-owie Unconformity (125–120 Ma), the Wyandra Sandstone Member, the shallow marine Wallumbilla, Toolebuc, and Allaru formations in Queensland and their South Australian equivalents (Bulldog Shale, Coorikiana, and Oodnatta sandstones) formed. This Aptian–Albian transgressive sequence finishes with the basin-wide marginal marine siltstones of the Mackunda Formation.
- The fluvial Upper Cretaceous Winton Formation (101–95 Ma) represents the uppermost sub-sequence of the EB and features the highest sedimentation rate of all formations in the study area, possibly due to enhanced subsidence before Gondwana break-up started [42,43]. Expressed by the distinct Winton Unconformity (95–62 Ma), the formation was quickly buried and heated, then rapidly uplifted, extensively eroded, and deeply weathered throughout the remaining Late Cretaceous period.
2.3. Lake Eyre Basin
During the Cenozoic, the endorheic LEB formed, throughout which only occasional sedimentation, frequent ablation, and re-deposition of thin fluvial, lacustrine, and aeolian sands occurred [2,70]. The mid-Cretaceous Winton Formation (Fm) remained exposed to weathering at many places.
Figure 2.
Stratigraphic overview, petroleum system elements, and tectonics of the study area (modified after [6,8]). (a) Stratigraphy of the Cooper Basin. (b) Stratigraphy of the Central Eromanga Basin. T = Tookoonooka meteorite impact [69], 1 = First Eromanga sub-sequence (Cuddapan Formation), 2 = second Eromanga sub-sequence (fluvio-lacustrine), 3 = third Eromanga sub-sequence (marine), 4 = fourth Eromanga sub-sequence (Winton Formation). Kinematic arrows refer to paleo-stress direction (after [49]).


2.4. Petroleum Systems
Hydrocarbon production in the study area is concentrated on fault-controlled traps and anticlines [2] around the depocentres of the SW CB (Figure 3a). In South Australia the Moomba area within the NT, the Patchawarra Trough (PT), and the Mettika Embayment, as well as the GMI, DNC, Murteree, and Dullingari-Wollgolla ridges, host abundant oil and gas fields, whereas there have been few discoveries in the deep NT. Producing fields in Queensland are mainly limited to the JNP Ridge and the Durham Downs Anticline. Many small oil and gas fields are located in the TT and along the southeastern basin margin (Figure 3b). The Arrabury Trough as well as the remaining northern part of the NE CB feature very few scattered hydrocarbon discoveries (Figure 3a).
The Cooper Basin is predominantly hosting gas, whereas oil is common in the Eromanga Basin ([2,71], also see Figure 3c). Main commercial reservoirs, including tight gas and dry coal seam gas in the Cooper Basin, are located in the Patchawarra and Toolachee formations. The Merrimelia, Epsilon, and Daralingie formations as well as the Tirrawarra Sandstone provide additional sporadic reservoirs [1,72]. Although the Winton Formation and most layers of the fluvio-lacustrine succession provide good reservoir properties, the Hutton and the Hooray sandstones represent the most significant reservoir rocks of the Eromanga Basin [2,22].
Throughout the Cooper Basin, the Murteree and Roseneath shales provide the seals to the Patchawarra and the Epsilon formations, respectively. The Nappamerri Gp represents the basin-wide seal to the underlying Gidgealpa Gp [1,72]. The Poolowanna, Birkhead, Westbourne, and Murta formations provide local seals within the Eromanga Basin, and the fine-grained members of the Rolling Downs Gp (Wallumbilla to Mackunda formation) represent the thickest and most effective regional seal of the study area [22].
Trapped hydrocarbons originated exclusively from terrigenous organic matter of fluvio-lacustrine shales, siltstones, and coals [6,22,73]. The majority have been attributed to coals and shales of the Cooper Basin [2], but minor contributions by EB rocks (i.e., Birkhead and Murta formations) and pre-Permian sources are evident [71,74].
3. Materials and Methods
Petroleum well data (well headers, formation tops, completion reports, etc.) and corresponding calibration data from public domain databases [52,75,76,77] served as input for 1D petroleum system models. Heat flow maps and source rock maturation maps were created based on integrating calibrated 1D models with the available regional-scale 3D petroleum system model [34]. The geometry is based on 20 depth maps and includes an interpretation of the pre-Permian basement and the digital elevation model (DEM, after [78]). Layer thickness maps derived from this model and complementary literature serve as additional data for analyzing the basin history. All presented text and images are the result of our own work (if not stated otherwise). Input data used in this study mainly consist of already publicly available datasets provided by Geoscience Australia, Australian Government (links are given in the references list). Additionally created and applied input data for the 1D-modelling are available online as Supplementary Materials (please find the link below).
3.1. Stratigraphic Input
Formation tops from public domain databases and corresponding horizons of the 3D model were assigned with top and bottom layer ages based on combined chronostratigraphic information from the Geoscience Australia Stratigraphic Units Database [64] and supporting literature [4,7,8,20,23,28,40,61,79,80,81,82,83,84,85,86] (see Table 1). Whenever possible and useful, the stratigraphic nomenclature of Queensland was used as a standard.
Selected layers were split by age or based on thickness to obtain additional horizons for the 3D model. The uppermost layer (constrained by the surface topography and the Top Winton Fm) was subdivided into Quaternary, Eyre Fm, and Namba Fm. Similarly, the Toolebuc layer was subdivided into Toolebuc Fm and Wallumbilla Fm; the Murta layer was split into Murta Fm and Namur Sandstone (Sst), the Nappamerri Gp was subdivided into Tinchoo Fm and Arrabury Fm; and the glacial sediments were subdivided into Tirrawarra Fm and Merrimelia Fm. In total, 37 events (numbered from bottom (0 = pre-Permian basement) to top (36 = Quaternary)) were defined, thereof 28 sedimentary layers (deposition events) and 8 unconformities (defined as erosion or hiatus).
For the 3D model, only the erosion map for the Winton Unconformity (taken from [34]) was assigned, as all other unconformities either are based on contradicting information or the amount of eroded thickness is negligible. Only for selected 1D models (e.g., Burley-2, Warnie East-1), the Namba, Eyre, Nappamerri, and Daralingie unconformities were assigned with relatively small values of erosion. Nevertheless, the remaining unconformities were assigned as hiatus events, which serve as placeholders to allow easy changes of the input during future modelling.
If available, facies information for the layers of the 1D models was taken from interpreted electro-facies [6,7,87] and, if required, complemented with additional data from well completion reports and the chronostratigraphic chart. A simplified facies assignment with standard or mixed lithologies was used for the 3D model. Thermal conductivity values for each layer (1D and 3D) were customized based on existing measurements (taken from [65], see Table 2).
3.2. Boundary Conditions
Paleo-water depth trends (PWD, Figure 4a) were modified (after [20,22]) and used to constrain the sediment-water interface temperature (SWIT, Figure 4b), which represents the upper thermal boundary. Automatically calculated values (after [88]; southern hemisphere, Australia, 27°) were manually adjusted considering the present-day annual average surface temperature of 22–24 °C [89] and the Antarctic episode of glaciation during Early Cretaceous [40,90], with estimated annual average temperature of 5 °C from 135 to 115 Ma.
3.3. Petroleum System Settings and Source Rock Assignment
Several formations simultaneously represent source and reservoir rocks (see Figure 2), and petroleum generation potential can be highly variable (see [6,8] and references therein). Table 2 includes the simplified assignment for the petroleum system elements (PSE) used in this study. The PSE chart in Figure 4c also shows the timing of related processes such as petroleum generation, migration and accumulation, critical moment (source rock transformation ratio surpassing 50%), trap formation, and preservation. Assigned source rock properties (kinetic models, TOC content, and hydrogen index based on [6,53,69,91,92,93,94,95]) are summarized in Table 3.
3.4. Heat Flow and Thermal Modelling
Bottom hole temperature (BHT, taken from [72]) and vitrinite reflectance data [52,76,77] were used for thermal calibration of the 1D petroleum system models based on the Easy%RoDL algorithm [96]. Further, thermal history was constrained based on existing information from literature (e.g., [4,6,7,64] and references therein).
4. Results
In the following, an overview is given of the simulation results focusing on reconstructed subsidence history and calibrated thermal history. Although other thermal history scenarios are possible and may also lead to good calibration matches, only the results of the best match are summarized here. Alternative scenarios and other factors affecting the thermal history of the study area are debated in the discussion section.
4.1. Calibration of Bottom Hole Temperature and Thermal Maturity
Table 4 shows the best matching heat flow trends as the calibration results for eight representative 1D models. The trends reveal a background heat flow that is varying between 60 and 80 mW/m2 throughout the study area. Area-wide elevated values occurred between 125 and 85 Ma and peaked at 99.5 Ma, with local maxima reaching from 85 to 150 mW/m2. A renewed heat flow increase since 2 Ma can be observed with locally varying intensity between 62 and 110 mW/m2. The calibrated trends were used to create heat flow maps for each time step, and the resulting heat flow maps were assigned to the 3D model.
The calibration results of four representative South Australian wells (Beanbush-1, Burley-2, Dullingari-1, and Paning-1) are displayed in Figure 5a–d. All four wells are located in the SW CB area. The subsidence history plots show the temperature variation with depth and time. The indicated 100 °C isoline serves as a rough orientation for the onset of the oil generation window and is generally located at depths of approximately 2 km. During the Early Cretaceous glaciation, the temperature gradient was temporarily lower due to low surface temperatures and the 100 °C threshold dropped below 2 km, only to quickly ascend to shallow depths of 800–1200 m during the mid-Cretaceous. The regional subsurface temperature maximum in the mid-Cretaceous was the result of the fast subsidence in combination with simultaneously increasing basal heat flow. Regional uplift and cooling followed during the Upper Cretaceous and resulted in a rather stable temperature distribution throughout the Cenozoic.
The present-day temperature calibration is based on Horner-corrected BHT measurements (values are given in Figure 5 and Figure 6) and generally matches with present-day heat flow values above the global average (60 mW/m2). Thermal conductivity values shown in the temperature/depth plots (in Figure 5 and Figure 6) are the calculated results based on the input values (see Table 2), the assigned rock type (composition, initial porosity, etc.), the subsidence history (compaction), and the current temperature at each individual well location. Whereas at Beanbush-1, Dullingari-1, and Paning-1 the recent heat flow increase since 2 Ma is moderate (see Table 4), at Burley-2, a present-day heat flow of 110 mW/m2 was applied to match the exceptionally high BHT of about 251 °C at a comparably shallow depth of only 3706 m (Figure 5b).
Vitrinite reflectance profiles can be subdivided into three sections. The upper (youngest) section is represented by the events 22 to 36 (Namur Sst until Quaternary, compare Table 1) and mainly features values of 0.2–0.7% Ro along a steep gradient. In the middle section (events 11 to 21, Nappamerri Gp to Westbourne Fm), values are mostly in a range between 0.7 and 1.0% Ro or locally scattered around 1.0% Ro. The lower (oldest) section, represented by events 0 to 10 (basement to Toolachee Fm), shows a less steep maturity gradient with values between 1.0 and 1.5% Ro and has locally (e.g., Burley-2) even reached the dry gas window (vitrinite reflectance > 2.0% Ro). For Burley-2, a paleo-heat flow peak of 150 mW/m2 in the mid-Cretaceous (see Table 4) is required to match the overmature lower section (3.0–6.0% Ro, see Figure 5b). The thermal maturity profiles of the other three South Australian wells match with a mid-Cretaceous heat flow peak of 90 mW/m2.
Figure 6a–d shows the calibration results of four representative wells (Alkina-1, Marengo-1, Springfield-1, and Warnie East-1) located on the Queensland side of the study area. Except for Warnie East-1, these wells are located in the high NE domain of the CB. In comparison with the South Australian wells (Figure 5), the subsidence history is slightly different in two ways. Primarily, because in the deeper SW domain continuous and significant sedimentation already occurred during the Permian (see Figure 5) and substantial sedimentation and subsidence in the NE domain started only in the Early Triassic (Figure 6). Secondly, the amounts of Late Cretaceous uplift and erosion are generally higher in the NE domain (compare Figure 5 and Figure 6). However, the variation of the 100 °C threshold over time and the general thermal history is very similar throughout the entire study area.
Present-day temperatures of the wells drilled in Queensland scatter around 150 °C at depths of 2500 m with associated present-day basal heat flow of 78 to 85 mW/m2 (see Table 4). Alkina-1 and Marengo-1 require a relatively high mid-Cretaceous heat flow peak of 105 mW/m2 and 120 mW/m2 to match their thermal maturity profiles, respectively (compare Table 4 and Figure 6a,b).
The lower section of the maturity profiles of Springfield-1 (Figure 6c) and Warnie East-1 (Figure 6d) are matching with rather low mid-Cretaceous heat flow peaks of 85 mW/m2 and 90 mW/m2, respectively. Further, both wells feature anomalous high thermal maturity values within a narrow part in their lower sections. The cause for the thermal maturity increase of the Tinchoo Fm at Springfield-1 could be due to erroneous measurements or the well just missed a nearby intrusion body (two red calibration points in Figure 6c). At Warnie East-1 a basaltic sill was intersected, which stratigraphically correlates with the Daralingie Fm and was dated 100 ± 6 Ma based on K-Ar pyroxene age (Figure 6d, personal communication with Ian R. Duddy). To match the thermal maturity calibration with the outliers at Warnie East-1, a simple increase of the paleo-heat flow is inapplicable. An intrusion model with facies replacement (basalt vs. sandstone within the Daralingie Fm), associated with short-term temperature increase (>400 °C), fast cooling, and an assigned intrusion age of 100 Ma delivers the best match for this exceptional borehole.
4.2. Tectonic Subsidence and Sedimentation Rate
A collection of time plots (Figure 7) shows calculated tectonic subsidence, sedimentation rate, and thermal evolution and reveals some correlations between these parameters.
Driven by tectonic activity along the convergent Eastern Australian margin [8], tectonic subsidence (Figure 7a) initiated in the early Permian throughout the SW domain and started to extend over the entire study area during the late Permian to Early Triassic. From Upper Triassic to Upper Cretaceous, all wells follow very similar trends and reach their maximum tectonic subsidence after deposition of the Winton Fm (95 Ma). The NT (represented by Burley-2) generally features the fastest and strongest tectonic subsidence during the Palaeozoic and Mesozoic, whereas Alkina-1 and Warnie East-1 exhibit the strongest uplift in the Cenozoic.
Sedimentation rates of Alkina-1 and Burley-2 are displayed in Figure 7b. Both wells show strong variations during the Cooper Basin evolution, but share a very similar development during the Eromanga Basin formation. The most remarkable event is the deposition of the Mackunda and Winton formations during the mid-Cretaceous with high sedimentation rates of up to 200 m/Ma.
4.3. Evolution of Basal Heat Flow and Temperature
The extraordinary “depositional event” around 100 Ma ago coincides with elevated temperatures throughout the basin that were enhanced by a short-lived “hydrothermal event” (Figure 7c, compare Table 4).
The intensity of the mid-Cretaceous hydrothermal event (up to 150 mW/m2) most likely provided enough thermal energy to overprint all past thermal events, complicating pre-Cretaceous thermal history reconstruction. A renewed relatively fast heat flow increase (up to 110 mW/m2; peak I in Figure 7c) has been developing since the Quaternary, but still shows a lower intensity compared to the mid-Cretaceous hydrothermal event (peak II, [20,64,67]). The relevance of possible older heat flow peaks (III–VII, Figure 7c, [26,27,29,50,64]) is debated in the discussion section.
Although the calculated temperature gradient lies between 25 and 42 °C/km throughout most of the geological history, it locally doubled at peak I (52 °C/km at Burley-2) and even tripled at peak II (74 °C/km at Burley-2; Figure 7d). The corresponding heating rates were rather constant and rarely exceeded 10 °C/Ma (Figure 7e), except for the mid-Cretaceous hydrothermal event, during which the temperature suddenly increased locally by 100 °C/Ma between 100.5 and 99.5 Ma (Figure 7f). The subsequent cooling rates were even stronger (up to 150 °C/Ma at Burley-2) between 99.5 and 98.5 Ma before the temperature slowly equilibrated again. Resulting temperature evolution at the basement/sediment interface (Figure 7g) shows two plateaus and two main peaks. After a slow and steady increase throughout the Permo-Triassic, the first plateau lasts from Early Triassic until Early Cretaceous with corresponding temperatures ranging between 50 and 100 °C. The second plateau features temperatures between 100 and 150 °C from Late Cretaceous until Quaternary. The Quaternary peak (I) corresponds with maximum temperatures up to 250 °C, and the second peak (II) locally generated maximum temperatures as high as 320 °C (calculated at Burley-2).
4.4. Evolution of Source Rock Thermal Maturity and Transformation Ratio
In Figure 8 the consequences of the mid-Cretaceous fast subsidence and simultaneous hydrothermal activity for the petroleum source rocks of the study area are illustrated. The evolution of formation temperature (Figure 8a), thermal maturity (Figure 8b), and transformation ratio (Figure 8c) are shown based on four representative well locations.
One well from each state was selected, which represent the general thermal evolution on either side of the state boundary (South Australia: Beanbush-1, Queensland: Marengo-1). Further, two wells near the main depocentre (Warnie East-1 and Burley-2) show remarkably high thermal maturity. Not all source rock intervals are present in all wells, and the stratigraphy in the SW domain (Warnie East-1 and Burley-2) is more complete.
Similar to the basement (Figure 7g), the temperature evolution of the source rocks is mainly characterized by two plateaus separated by the main peak at 100 Ma (Figure 8a). Permian as well as Eromanga source rock intervals exceeded temperatures above 100 °C only after 120 Ma. Permian source rock intervals temporarily reached maximum temperatures of 170 °C at Beanbush-1 and 200 °C at Marengo-1. At Warnie East-1, Toolachee and Daralingie formations reached 261 and 269 °C, respectively, right before the Daralingie Fm got replaced by the basaltic intrusion. At Burley-2, the Permian source rocks witnessed even higher temperatures, i.e., the Patchawarra Fm was exposed to 295 °C at 100 Ma ago. Due to their shallower stratigraphic position, Eromanga source rocks generally feature lower paleo-temperatures than the Permian successions. However, local maxima exceeded 150 °C at some locations (i.e., Marengo-1, Burley-2) and caused a distinct step during the thermal maturation process.
Thermal maturity of all source rock intervals (Figure 8b) remained below 0.5% Ro until 120 Ma ago. Maturation then started to increase and quickly accelerated until its irreversible maximum at 100 Ma. At about that time, Eromanga source rocks entered the oil window at Beanbush-1 (>0.5% Ro), and thermal maturity of Permian source rocks jumped to values between 1.0 and 1.5% Ro. At Marengo-1, thermal maturity of the Toolachee Fm jumped beyond 2.0% Ro, and Eromanga source rocks have ranged between 0.8 and 1.4% Ro since 100 Ma. The thermal evolution of Permian and Eromanga source rocks at Warnie East-1 is very similar to Beanbush-1. However, the intrusion at 100 Ma provided additional heat for the late Permian source intervals, which were closest to (or even replaced by) the intrusion body. Due to this intrusion effect, the Daralingie and Toolachee formations feature exceptional vitrinite reflectance values between 3.5 and 4.0% Ro. Calculated vitrinite reflectance at Burley-2 generally features the highest values compared to all other analysed locations as a result of the exceptionally high heat flow at 100 Ma. This hydrothermal effect shifted the Eromanga source rocks to values between 0.9 and 1.8% Ro and all Permian source rocks beyond 3.0% Ro. In contrast to the intrusion effect observed at Warnie East-1, the thermal maturity sequence is in line with stratigraphic age.
Kerogen transformation from the source rock intervals initiated at 120 Ma and then jumped as a consequence of the exceptionally high heating rate during the mid-Cretaceous event (Figure 8c). The transformation ratio (TR) passed the critical moment (TR > 50%) somewhere near 100 Ma for most of the formations. At Marengo-1 and Burely-2, all source rock intervals yield TRs above 75%. Only at locations where the background heat flow is lower (i.e., Beanbush-1, Warnie East-1) did the TR of the shallow and/or gas-prone intervals mainly remain below 50%.
4.5. Layer Thickness and Depocentre Migration
Figure 9 shows the thickness maps of the most relevant layers of the Cooper Basin to illustrate the spatial distribution and magnitude of sedimentation over time. During an NS-oriented compressional stress regime (compare Figure 2a), deposition of the glacial outwash of the Pennsylvanian Merrimelia Fm (as well as the early Permian Tirrawarra Fm) was restricted to the PT, NT, and WT in the SW domain (Figure 9a). Subsequently, the NT was established as the main depocentre during the deposition of the entire Gidgealpa Gp (Figure 9b–f).
However, the Patchawarra Fm represents the thickest and most dynamic depositional event of the Cooper Basin (Figure 9b). During a period of alternating extensional and compressional NW-SE directed stress (probably caused by slab-roll-back cycles along the eastern continental margin), an apparent SW-NE directed rift axis established in the NT, upon which more than 800 m of sandstone and coal accumulated. In addition, the WT was subjected to continued subsidence. Parallel to the temporary Nappamerri half-graben, the NE-SW oriented GMI Ridge acted as a hinge line, where NT and PT were separated by outcropping basement highs. Intermittent sedimentation in the NE domain beyond the KNFZ only occurred during the Patchawarra Fm along the prolongation of the temporary Nappamerri rift axis (Figure 9b).
Subsequently, minor but steady deposition concentrated in the NT and the TT, separated in the south by the Murteree Ridge (Figure 9c–f). Although the NT always remained the primary depocentre, the other two parallel-oriented secondary Permian troughs exhibit a very different timing: whereas during the early Permian, the PT represented the secondary depocentre (Figure 9a,b), the TT became dominant during the late Permian (Figure 9c–f). Noteworthy sedimentation in the PT re-established only during the early and Middle Triassic (Nappamerri Gp, Figure 9h).
After the Daralingie Unconformity, sedimentation still focused on the central NT (Figure 9g), but then gradually and conformably extended throughout the entire basin (Figure 9h).
The sediment input during the Eromanga Basin evolution was not restricted anymore to the outline of the CB, but highest sedimentation rates still occurred within the established regional depression (Figure 10). With remarkable thickness variations, the Middle Jurassic Hutton Sst covered mainly the NE domain, but also filled several smaller depressions along the CB margin and beyond. Locally, over a distance of a few kilometres, sediment thickness varies between 50 and 700 m. This was probably not entirely caused by erosion, as the subsequent Birkhead Unconformity lasted only about 5 million years and structural indications for strong local uplift are missing. In the SE, a short-lived rhombic mini-basin (a precursor of the Bulloo Lake Basin, BLB) with a diameter of about 50 km was filled with up to 450 m of sediments (Figure 10a). Deposition of the Birkhead Fm extended over a major part of the Cooper area (Figure 10b), whereas the accumulation of the Adori sandstone concentrated in the SW domain (Figure 10c). The relatively thin Late Jurassic Westbourne Fm and the Namur Sst were deposited over most of the study area with relatively constant thickness (Figure 10d,e).
During the fast deposition of the Lower to mid-Cretaceous sedimentary blanket, the depocentre location was very dynamic. The largest thickness of the Wallumbilla Fm is recorded in the SW domain (Figure 10f), whereas the Allaru Mdst is thicker in the north (Figure 10g) and the layer thickness of the Mackunda Fm is again relatively constant throughout the study area (Figure 10h). During the deposition of the Wallumbilla Fm, the remains of the Tookoonooka impact crater (±125 Ma) represented a temporary structural high (Figure 10f).
The Winton Fm is characterized by the highest sedimentation rate (Figure 7b), the largest original thickness (Figure 11a), the largest amount of post-sedimentary erosion (Figure 11b), and the largest preserved thickness (Figure 11c) of all formations. Initially, the study area was entirely covered by at least 300 m of Winton Fm sediments. New depocentres established in the NE domain and up to 1300 m of fluvial sandstones accumulated in the Windorah Trough, the Ullenbury Depression, and the Thompson Depression (Figure 11a).
E-W directed compression and inversion resulted in widespread erosion of the Winton Fm, with highest amounts along the Mt. Howitt Anticline (up to 870 m), along the GMI Ridge and the Murteree Ridge, and along the northern and southern margins of the basin. Lowest amounts of erosion occurred in the PT and WT (Figure 11b).
The preserved thickness of the Winton Fm is highest in the Windorah Trough (up to 1055 m), the Ullenbury Depression, and the Thompson Depression. In addition, the PT and NT locally contain more than 900 m of Winton deposits (Figure 11c). In addition to newly formed anticlines in the NE domain, the KNFZ, the GMI Ridge, and the Murteree Ridge were re-activated during the Late Cretaceous. The area around Warnie East-1 established a smooth dome structure.
4.6. Basal Heat Flow Maps
Heat flow trends from 15 calibrated 1D models (eight located in South Australia, seven in Queensland) were interpolated to generate heat flow maps for defined time steps. Together with PWD and SWIT maps, the heat flow maps were then assigned as boundary conditions to the 3D model to reconstruct the thermal history of the study area in 4D. A selection of resulting heat flow maps is displayed in Figure 12. As a constant heat flow was assigned from the Pennsylvanian to the Early Cretaceous, the focus is on the two youngest hydrothermal events in the mid-Cretaceous and at present day. The intrusion model at Warnie East-1 was not applied in 3D, leaving the heat flow and resulting temperatures underrepresented at this particular location.
Since approximately the time of deposition of the Murta Fm, heat flow started to increase mainly throughout the NT and in the NE domain (Figure 12a–c). With accelerating sedimentation rate during the end of the Early Cretaceous, heat flow locally increased to values around 80 mW/m2 (Figure 12e).
At the peak of hydrothermal activity during the deposition of the Winton Fm (peak II, Figure 12e), heat flow reached values around 100 mW/m2 throughout most of the study area. Highest calculated heat flow values between 130 and 150 mW/m2 occurred at 99.5 Ma mainly along the axis of the NT. In addition, the NE domain was temporarily heated up by values locally as high as 120 mW/m2.
After the mid-Cretaceous hydrothermal activity peak and just before the regional uplift started, heat flow decreased relatively quickly to values between 70 and 90 mW/m2 throughout the study area (Figure 12f). Following the Gondwana breakup, tectonic stabilization occurred in the Late Cretaceous and throughout most of the Cenozoic, heat flow equilibrated again between 60 and 75 mW/m2 (Figure 12g).
The Quaternary hydrothermal pulse (peak I) mainly affects the NT with locally increased heat flow of 110 mW/m2. Although the NE domain is also affected to a lower degree with local maxima around 90 mW/m2, the PT remains apparently unaffected (Figure 12h).
4.7. Thermal Maturity Maps
Resulting present-day thermal maturity for most assigned source rocks is shown in Figure 13. Poolowanna Fm is not shown, because it was merged with Hutton Sst and Westbourne Fm was added, although not assigned with a kinetic model.
In the NT, the Patchawarra Fm (Figure 13a) reached the dry gas window (2.0–4.0% Ro) and is even overmature (>4.0 Ro%) in its deepest/hottest parts. In the Barrolka Trough, the wet gas window (1.3–2.0% Ro) was entered. The Murteree Sh and the Epsilon Fm (Figure 13b,c) are located mainly in the dry gas window throughout the NT, whereas they only reached the early oil (0.55–0.7% Ro) to late oil window (1.0–1.3% Ro) in the PT and the TT. The Roseneath Sh and Daralingie Fm (Figure 13d) show very similar thermal maturity distribution with generally slightly lower values, except that they are absent in the PT. The Toolachee Fm (Figure 13e) was predominantly oil-generating throughout the study area, but is also gas-mature in the Nappamerri and Barrolka troughs.
The calculated thermal maturity of the three Eromanga source rock intervals (Birkhead, Westbourne, and Murta formations, Figure 13f–h) correlates with the early oil window throughout most of the study area. Locally, in the Nappamerri and Barrolka troughs the main oil window was entered, whereas they are predominantly immature in the PT and the TT.
5. Discussion and Remaining Uncertainties
One major uncertainty of the study area is the classification of the basin type and the determination of tectonic boundary conditions during the two different phases of basin formation. This uncertainty can be reduced by regarding basin phases separately, considering surficial structural features, and analyzing their relationship with the regional thermal and tectonic evolution.
5.1. Permo-Triassic Tectonics
Generally, investigating crustal geometry and shape of the Moho below the study area could help to identify the basin opening mechanism. The Moho depth in the Cooper subregion varies between 32 km in the SW domain and 40 km in the NE domain ([97], see Figure 14a,b), and corresponding crustal thickness is generally thinner below the WB and thickens towards the Cambrian to Devonian crystalline basement of the Thomson Fold Belt. Crustal thickness measures approximately 38 km below the Warrabin Trough and less than 29 km below the NT [4]. An axis of crustal stretching (“rifting axis”) is not clearly recognized, but it appears that the Moho shape in the SW domain of the CB mainly resembles the stretched eastern WB and is therefore associated with NE-SW directed extension.
Bouguer gravity variations in the study area suggest that the CB was strongly influenced by movements along the JNP and GMI ridges ([98], see Figure 14c,d), where the faults with the largest vertical offset are also located. Indeed, patterns of sedimentation and erosion during the formation of the Cooper Basin were governed by an array of three main depocentres separated by NE-striking ridges (GMI, DNC, and Murteree; compare Figure 1b, Figure 3b and Figure 9). These parallel-oriented fault zones apparently acted as Riedel shears and connected the ESE-striking KNFZ and the TL already during the Devonian-Carboniferous inversion and uplift of the WB. In the Pennsylvanian, tectonic stress was oriented N-S [48], and a temporary shortcut for the TL formed that proceeded through the PT, the westernmost NT, and the WT (Figure 15a), before NW-SE directed transtensional stress in the Permian caused stretching and subsidence on either side of the GMI Ridge hinge line and sinistral transtension along the KNFZ and the TL (Figure 15b). Together, these three tectonic features acted as the master fault, which facilitated the basin opening in a fault-bend or pull-apart basin style. Indeed, the observed rhomboidal geometry of the SW domain and the course of the master fault is characteristic for pull-apart basins (compare [99,100]).
Considering the PT, NT, and TT as one system of subparallel, elongated, rhomboidal releasing bends (each 50–60 km wide and 150–200 km long; length-to-width ratio, l/w = 3), its shape results in one large rhomb with approximately l/w = 1 (length: ±200 km, width: ±200 km; Figure 15c). Pre-existing structures of the inverted WB simplified the opening of the CB by reverting strike-slip zones and converting former thrusts into oblique extensional slip planes [45]. However, mature rhomboidal pull-apart basins generally show l/w = 3 rather than 1 [101]. To satisfy this geometric rule, a theoretical elongated system along the KNFZ can be assumed, which extended from the Cork Fault in the NW to the Bulloo Lake in the SE (total length approximately 600 km). Permian sediments that would verify this layout were probably completely removed again during episodes of uplift (that led to the formation of the Daralingie and Nappamerri unconformities).
Throughout the Permian, the NT established as the primary depocentre along the Cooper Basin Master Fault (CBMF), whereas the activity of the other troughs greatly varied over time (Figure 15b–e). Initiated as a deep oblique half-graben with a SW-NE oriented rift axis during the Patchawarra Fm, the NT was continuously the focus of subsidence and sediment accumulation until the Triassic (also see Figure 9). The deepest point was constantly located near the Innamincka Dome, where the CBMF bends into the GMI Ridge. A smaller rhomboidal trough with a diameter of about 50 km was active in the SE during the deposition of the Hutton Sst (Figure 15f, compare Figure 10a) and could be an indicator of renewed strike-slip tectonics during the Jurassic but with a different stress field.
The question about the style of the “Permian rifting” might therefore be answered with oblique (relative to the basin axis) strike-slip tectonics and a sinistral pull-apart mechanism. However, various still poorly studied unconformities within the Patchawarra Fm [41,45] as well as the uncertain magnitude of the Daralingie Unconformity testify to a more complex Permian tectonic history that requires additional examination, which is beyond the scope of this study. At least the Daralingie Unconformity was the result of a short-lived basin inversion (push-up phase, see [45]), which was characterized by thrusting, accentuation, and erosion of the ridges, particularly the GMI and JNP. A straight line with low sediment thickness proceeded from the Innamincka Dome towards SSE, indicating an additional temporary ridge (Figure 9g and Figure 15e,f). From Middle to late Permian, the CB can therefore be classified as a push-up or piggyback basin. The Innamincka Dome obviously represents a tectonic wedge, which was uplifted and pushed between the NT and the PT due to NE-SW compression during the Daralingie Unconformity.
Except for some erosional remnants of the Cuddapan Fm, no Upper Triassic sediments are preserved. This stratigraphic gap was often connected with a basin-wide post-rift unconformity of an associated “Triassic rifting event” similar to the one observed in the Surat and Bowen basins [102,103,104]. However, the low-angle Nappamerri Unconformity implies that the far-field effect of the Early Triassic subduction roll-back and subsequent compression along the eastern continental margin during the very dynamic Hunter-Bowen Orogeny (260–210 Ma; [104]) was rather low. Especially in the south, minor uplift and erosion after the deposition of the Tinchoo Fm occurred, but the sediment distribution (see Figure 9g,h) as well as the thermal maturity profiles do not support very large amounts of uplift. Distinct steps in the thermal maturity profiles would underline the hypothesis of strong Triassic post-rift erosion, but exist only locally (see Figure 5 and Figure 6).
The NT acted as the main depocentre during the Toolachee Fm (Figure 9g). The small thickness variations and widespread sedimentation patterns during the Triassic (Figure 9h) represent a gentle basin-wide transition phase rather than continental rifting with rapid post-rift uplift. Additionally, the Moho is not uplifted along an expected NE-SW directed rifting axis (compare [97]). Nevertheless, temporary compression triggered localized uplift and erosion along the ridges and within the NT, but to a lesser extent compared to the Daralingie Unconformity.
5.2. Neotectonics and Topography
Before discussing the tectonics of the Jurassic-Cretaceous Eromanga Basin, it is very insightful to analyze the present-day geomorphology and the present-day stress field. Although the sediments of the Australian Outback are intensely modified by wind and water, numerous geometric features can be drawn on simple satellite images thanks to missing vegetation (Figure 16).
The surface topography is generally higher (mainly above 100 m) and more developed on the Queensland side, with the Innamincka Dome representing a local peak (approximately 260 m elevation). In South Australia, the topography is flat and generally lower (mainly ranging between 20 and 50 m), even dropping below sea level (Lake Callabonna, −5 m; Kati-tanda/Lake Eyre, −17 m). The seasonal Cooper Creek and the Warburton River are draining towards SW to feed the endorheic Lake Eyre [105], located at the lowest point of the entire Australian Continent. The underlying tectonic features of the CB have a complex influence on the course of the rivers, especially the Cooper Creek. Its original SW course is remarkably deviated southward by the NNW-SSE oriented Durham Downs Anticline (apparent river deviation: about 150 km). The muddy sediments of the braided/anabranching river system spread across the Cooper floodplain [105] are occasionally splaying within the endorheic Lake Yamma Yamma and, after crossing the JNP Ridge, fill the rhomboidal Wilson Depression. After passing some important waterholes (“billabongs”), the Cooper Creek then bends westward around the Innamincka Dome into the NT. Here, the river becomes single-thread, crosses the GMI Ridge, meanders towards NW into the PT, and proceeds again towards SW to get deviated once more by the WNW-directed TL (apparent offset: about 100 km). Even the Bulloo River in the East follows a similar pattern. It generally flows in SW direction and charges the endorheic and rhomboidal BLB, which obviously represents a rejuvenation of the Jurassic mini-basin (see Figure 14f). Similarities in shape and size with the Wilson Depression (rhomb with about 50 km in diameter) are certainly not random.
It seems that the old shortcut of the TL, which proceeded subparallel to the Torrens Hinge Zone (THZ) during the late Carboniferous (compare Figure 15a and Figure 16a), meanwhile propagated about 200 km eastward. At least since the mid-Cretaceous, the new shortcut (Figure 15a) obviously forms an active shear zone along the Durham Downs Anticline and crosscuts the CB just at its most interesting point. At this tectonic focal point, the deepest trough, the largest sediment thickness, the largest fault offset, the most prominent uplifted basement structure, the thinnest crust, and a variety of volcanic and magmatic features coexist within a very small radius of only 50 km. In the following, this area is therefore called Cooper Hot Spot (CHS).
The present-day regional maximum horizontal stress (Shmax) is oriented NW-SE on the South Australian side and it swings towards ENE-WSW on the Queensland side [13,14,106,107,108]. The turning point of the stress field seems to be located not very far from the CHS. On the South Australian side, this stress distribution allows dextral movement of the North Australian Craton vs. the South Australian Craton along the TL and provides additional compression of the basement ridges within the CB. The stress field on the Queensland side is able to accentuate the Durham Downs Anticline and is compatible with the interpreted dextral shear of the Thomson Fold Belt along the new shortcut due to SSE directed extensional forces that formed an array of small indent-linked strike-slip basins (e.g., Cooper Plain, Lake Yamma Yamma, Wilson Depression, and Bulloo Lake). Within these topographic lows, river deviations and endorheic lakes are common and are indicating neotectonic activity. Seismicity in the study area is low to moderate (magnitude M 3–4), but epicenters remarkably align with the new shortcut (compare [108]). Based on hydrology and lithospheric structure, this zone of deformation was recently described as the Innamincka Fault System (IFS, [109]).
However, as this deformation zone is apparently intersecting the entire Central EB from the Georgina River to the Darling River, we suggest summarizing this large tectonic landscape as the Central Eromanga Shear Zone (CESZ, see Figure 16). The CESZ probably dragged the originally rhomboidal SW domain constantly along its direction of shear and is obviously responsible for the southward flexure of the NT and TT.
5.3. Jurassic and Cretaceous Tectonics
During the Cooper Basin formation, the migration of the primary depocentre was restricted to a relatively small radius within the NT (Figure 15). Deduced from the preserved layer thickness, sediment distribution in the study area changed in the Jurassic and the primary depocentre jumped across the GMI Ridge (Figure 17a,b). Throughout the Cretaceous, the PT established as the primary depocentre in the SW domain and even Cenozoic sediments are thicker than in the NT.
The depocentre migration within the NT itself remained restricted to a rather small area (Figure 17c,d). The location with the largest preserved sediment thickness repeatedly jumped back and forth between the KNFZ and the conjugate Central Nappamerri Fault (CNF), indicating different times of most active tectonics along these structural elements. Whereas the CNF was more active during the Cooper Basin formation, the KNFZ became dominant during the Eromanga Basin formation, particularly during the Jurassic and the mid-Cretaceous. During the Permian and Triassic, the KNFZ was also the zone of strongest uplift (particularly during late Permian and Late Triassic) and therefore original layer thickness was reduced by erosion. In contrast, episodic depocentre migration towards the NE (during late Permian, Jurassic, and mid-Cretaceous, see Figure 17d) was increasingly driven by activity of the CESZ. In the Cenozoic, subsidence was strongest in the SW domain upon the Wooloo Trough, whereas the JNP Ridge and the Durham Downs Anticline still represent uplifted areas being incorporated to the CESZ. Adding the maximum thickness of each individual layer in the NT results in accumulated thickness of about 5424 m, which exceeds the maximum burial depth (4663 m) by 761 m or 16.3% (Figure 17d). Relatively thick strata compared to burial depth due to depocentre migration is another strong indicator for dominant strike-slip tectonics (compare [100]).
The subsidence history during the Eromanga Basin formation (see Figure 5 and Figure 6) was mainly the result of regional sagging due to continental-scale flexure and increasing sediment input from the uplifting magmatic arc along the eastern Australian continental margin in the context of the Gondwana breakup [110]. However, the first and the last episode of the Eromanga Basin are characterized by the very dynamic deposition of the Hutton Sst during the Middle Jurassic (Figure 10a) and the remarkably thick Winton Fm during the mid-Cretaceous (Figure 10i).
The rhomboidal BLB and other small and deep troughs in the NE domain (i.e., Yamma Yamma Depression) are indicating possible strike-slip tectonics during the Middle Jurassic (see Figure 10a) comparable with the observed present-day setting (Figure 16a). It is plausible that crustal shear along the CESZ already occurred during the Middle Jurassic. E-W directed maximum horizontal stress (Shmax) probably acted after the deposition of the Winton Fm ([49]; see Figure 11) and caused a regional episode of post-sedimentary uplift and erosion along preferably N-S oriented features, especially the Mount Howitt and Durham Downs anticlines, but also strongly uplifted the Innamincka Dome (see Figure 11a and Figure 17a).
The largest layer thickness is preserved along a SW-NE directed alignment of several depressions between the PT and the Warrabin Trough (Figure 11b). The corresponding subsidence pattern and a NW-SE oriented stretching axis would agree with a fixed Mt. Isa Terrane in the North and a southward moving Thomson Fold Belt. Paleo-stress field analysis yielded 80–100 MPa of NS directed Shmax for the study area in the mid-Cretaceous (around 100 Ma, [111]), which is generally compatible with N-S to NW-SE strike-slip motion along the CESZ.
Certainly, the study area was not only overfilled with debris from the east, but also strongly affected by tectonic far-field effects of the orogenic collapse and violent continental breakup along the eastern margin during the mid-Cretaceous [110,112]. It is therefore reasonable that the observed present-day setting (see Figure 16) is predominantly the result of the stress reconfiguration during and directly after the deposition of the Winton Fm (N-S transpression and transtension followed by E-W compression and uplift). An additional period of possible small-scale reactivation of the CESZ happened during the Middle Miocene (Namba Fm, [111]). Southward stretching and thinning of the Thomson Orogen along the CESZ could be the result of a combination of tectonic escape from westward indentation, southward mantle flow, and sub-crustal delamination, which is obviously still ongoing today [109].
5.4. Uncertainties of Thermal History
Several hydrothermal and volcanic events were reported in the study area, and amounts of erosion are rather low (except for the Winton Fm), whereas the fluctuating heat flow seems to have much greater influence on thermal maturity. However, determining the number, exact ages, and magnitudes of thermal events in the study area is challenging. The input of the numerical models in this study considers only the two youngest heat flow peaks (Table 4, peak I and II in Figure 7c, [20,64,67]), because apparently the magnitude of the mid-Cretaceous event (peak II) was high enough to overprint previous thermal events (III–VII in Figure 7c, [26,27,28,50,64]) throughout most of the study area (Figure 5 and Figure 6). Additionally, the differences in the calibration results are too small to identify the exact timing and magnitude of thermal events prior to the mid-Cretaceous with the applied method.
Based on the 1D model along borehole Burley-2, a comparison of alternative thermal calibration scenarios is shown in Figure 18. To emphasize the effects of input variations on calibration, two end-member scenarios with background heat flow (60 mW/m2) and with present-day heat flow (110 mW/m2) are shown (Figure 18a). It is obvious that the background heat flow fits only the youngest sediments and the present-day heat flow would only match the values of the deepest layers. A constant heat flow trend can therefore be safely excluded.
To achieve a satisfying match of the calculated thermal maturity with the very detailed vitrinite profiles (Figure 5 and Figure 6), numerous transient heat flow scenarios lead to similar results (compare Figure 7c and Figure 18b–d), with the oil window located at only 1.2 km and the gas window already at 2 km depth. The results of the best fit scenario (peak II, Figure 18b) can be replicated with additional peaks either in the Middle Jurassic (peak III, Figure 18c) or in the Middle Triassic (peak V, Figure 18d).
5.5. Palaeozoic Thermal Evolution
Possible hydrothermal events due to Permian rifting (peak VI, see Figure 7c, compare [26,64]) cannot be excluded, but would only affect Permian sediments. Required amounts of heat flow and/or erosion to match vitrinite reflectance profiles would exceed those of scenario D (Figure 18d).
Emplacement of BLS granodiorite occurred prior to CB sedimentation (peak VII, see Figure 7c) and was therefore not directly responsible for thermal maturation. However, its high radioactive heat generation (about 10 µW/m3) is responsible for continuously enhanced heat flow into sediments directly above [27,50,64].
5.6. Mesozoic Thermal Evolution
Peak III (150 mW/m2 at 164 Ma) represents the so-called “Warnie Volcanic Province” with increased volcanic activity in the NT during the Middle Jurassic [29]. The same settings for the Triassic-Jurassic boundary (peak IV at 200 Ma, see [64]) delivered similar results, but are not shown.
Peak V represents a theoretical Triassic post-rift unconformity with elevated heat flow and substantial uplift (120 mW/m2 at 237 Ma plus 2 km of Tinchoo Fm erosion). The distinct step in the maturity profile shows a typical “erosion effect”, but only becomes visible with unusually high amounts of removed section.
All calibration scenarios still require peak II (150 mW/m2 at 99.5 Ma) to match the middle section of the vitrinite profile, which emphasizes the dominance of the mid-Cretaceous hydrothermal event. Although hydrothermal activity probably lasted from Early to Late Cretaceous (128–86 Ma, [20,62,67]), the exact timing and magnitude of the peak is crucial. Small shifts in either direction (age or amount of heat flow) leads to large variations in the calibration quality.
At Warnie East-1, a mid-Cretaceous basaltic sill was intersected (K-Ar pyroxene age: 100 Ma [67], see Figure 6). This discovery was eponymous for the “Warnie Volcanic Province”, where numerous volcanic features are often correlating with NW-SE oriented strike-slip faults and which were interpreted to be of Jurassic age [29]. The restriction to Jurassic age is problematic, as additional volcanic material at other locations provides inconclusive or contradicting ages:
- At Kappa-1, undated basalt at the top of the Nappamerri Gp was intersected, directly overlain by Hutton Sst [2].
- Lambda-1 contains a Triassic weathered basalt flow or feeder vent (227 Ma) and is overlain by thermally unaffected Birkhead Fm [67].
- Orientos-2 hosts undated basalt overlain by Adori Sst, whereas volcanic material is absent in Orientos-1 (only 1 km apart, [2]).
Recent comprehensive 3D seismic mapping [29] delivered no hard evidence for volcanic material of Jurassic age and interpretations could also represent sinter cones of different ages (including Cretaceous or younger). Often it remains unclear if mapped features show progressive onlap or intrusive relationships and, until seismic interpretations are not correlated with dated core material, the Jurassic age will remain questionable.
It is quite possible that erratic volcanism occurred throughout the Triassic, in the Middle Jurassic, and in the mid-Cretaceous. As it apparently represents hot spot-related hydrothermal activity and volcanism from various ages, the hydrothermal area around the CHS could also be referred to as “Mesozoic Volcanic Province”. Further, the age dating of Warnie East-1 (100 Ma) and Lambda-1 (227 Ma) suggests that volcanism frequently correlated with episodes of high fault activity (Winton Fm, Nappamerri Unconformity). Any Jurassic volcanism would also agree with increased tectonic activity before/during the deposition of the Hutton Sst (Figure 10a and Figure 17).
The intracontinental CHS could be a product of intraplate convective upwelling, but rather caused by very localized crustal shear and strong mantle flow around the lithospheric keel below the Thomson Orogen [109] than by convective upwelling from the subducting Pacific slab [29]. Future work in the study area should include additional mapping and age correlation of the volcanic features and including them as intrusion bodies in the 3D basin model.
The Tookoonooka meteorite impact probably contributed to the Early Cretaceous glaciation of the Southern hemisphere, but impact-induced shock heating is expected to be restricted to the impact site [113].
5.7. Cenozoic to Present-Day Thermal Evolution
Erratic Mesozoic volcanism and transient heat flow peaks suggest that circulation of hot fluids in the subsurface is directly linked to fault activity and stress field variations. Consequently, high heat flow and volcanism imply episodes of increased fault permeability (dominant extensional horizontal stress), and low heat flow would indicate closed faults (dominant compressional horizontal stress). Indeed, after peak II, subsurface temperatures dropped dramatically due to compression and uplift [20,110] and remained relatively low before hydrothermal activity increased again in the Plio-Pleistocene (peak I; [36,114]).
Present-day heat flow and temperature distribution across Australia shows a remarkable anomaly in the CB [7,75], with highest values in the NT. Despite the relative broad resolution of constructed heat flow maps (Figure 12), modelling results of this work broadly agree with these previous studies.
Assuming the present-day geothermal gradient of locally up to 52 °C/km (e.g., at Burley-2) to be constant with depth implies partial melting of the crust at approximately 15 km (~750 °C) and the transition from lithosphere to asthenosphere at around 26 km (~1333 °C). Although the scarce geophysical surveys resolution, thinned crust and locally abnormal lithospheric thickness below the SW domain are generally supporting this hypothesis [7,97,109,115].
Presumably, a magmatic system was frequently active throughout geologic history, which was regularly feeding magmatic intrusions and was responsible for circulating hot fluids within the network of faults and fractures. In reality, associated hydrothermal activity probably shows much higher local variability than predicted by our model.
5.8. Implications for Hydrocarbon Generation and Exploration Outlook
Minor pulses of kerogen maturation and transformation already occurred in the Permian, at least in the basin center [93], but simulation results indicate that extreme heating rate and high temperatures during peak II (Figure 7) were responsible for the vast majority of petroleum generation in the study area (Figure 8).
The high heating rates in combination with fast subsidence caused all source rocks to transform considerable amounts of their kerogen into oil and gas, simultaneously in a relative short period of time. During such rapid heating, petroleum expulsion and thus accumulation can occur faster from source rocks than at other times due to creation of overpressure and micro-fracturing [116,117,118].
Based on calculated thermal maturity and transformation ratio (Figure 8 and Figure 13), huge volumes of hydrocarbons (especially gas) must have been generated especially in the NT and in the Windorah Trough, but are not preserved (see locations of gas fields in Figure 3). It is plausible that during the fast maturation process, most of the generated hydrocarbons were lost to the atmosphere, because faults were highly permeable and no traps existed in the deep basin center. Accumulations concentrate in a ring around the NT where heating was less extreme, and compartmentalization was possibly due to anticlinal structures and tight sealing layers. It is therefore obvious that, besides further CBM development, the NT is very suitable for EGS projects due to highly permeable faults and very high heat flow. For the same reasons, however, the NT is also a candidate for degassing hydrocarbons and carbon dioxide through the present day, and various waterholes in the area could represent active or intermittent vents. Isolated blocks with good sealing capacity (e.g., Moomba Gas Field) could also act as suitable targets for carbon capture and storage projects [119], but their individual tectonic history should be carefully examined.
Future work with the 3D model should therefore include calibration of pressure, porosity, and permeability to determine exact timing of migration and accumulation and to quantify fault permeability and seal integrity. Combined with earlier studies [8,34], escaped volumes could then be quantified and their contribution to the Late Cretaceous greenhouse could be assessed. Further, a detailed structural model based on combined geomechanical and seismic data could help to understand the slip-tendency and permeability-history of faults and fractures in the study area.
6. Conclusions
The Cooper region within the central Eromanga Basin represents a central weak spot of the Australian continental crust that frequently compensated tectonic movements along the Tasman Line and Torrens Hinge Zone. It was strongly affected by far-field tectonic effects of the dynamic transformation of the eastern continental margin during the Cretaceous, and it is still tectonically and hydrothermally active today.
The application of numerical basin and petroleum system modelling, analyses of burial history, and depocentre migration provided important evidence for strong correlations between tectonics, hydrothermal/volcanic activity, and petroleum source rock maturation in the Cooper Basin and the overlying Eromanga Basin.
Basin opening, depocentre migration, and intermittent episodes of inversion in the Cooper region were governed by major overlapping strike-slip systems and basement ridges. The structural layout of the Cooper region is mainly characterized by the WNW trending Karmona-Naccowlah Fault Zone (KNFZ) and the Jackson-Naccowlah-Pepita (JNP) Ridge, which are subdividing the basement topography into the lower SW domain and the higher NE domain.
Ancient structures of the Eastern Warburton Basin controlled the evolution of the Cooper Basin Master Fault (CBMF) in the SW domain. Along the CBMF, a triplex lazy-s pull-apart basin opened during the Permian, which transformed into a push-up (piggyback) basin before it was blanketed by the Jurassic-Cretaceous Eromanga Basin.
The NE domain was influenced by the structure of the underlying Thomson Orogen, which was subject to frequent E-W indentation, ongoing ENE-WSW compression, and SSE simple shear due to tectonic escape through the present day. Since the Jurassic, tectonic style and depocentre migration in the Cooper region was more and more controlled by the NNW-SSE-oriented Central Eromanga Shear Zone (CESZ), which caused southward flexure of the Nappamerri Trough and the CBMF. The crossing point of the CBMF and the CESZ marks the deepest point of the basement and features a Mesozoic volcanic province upon an inferred Cooper Hot Spot (CHS). The CHS is apparently related to punctual crustal thinning and an associated magma chamber (“pull-apart pluton”), which also caused multiple Palaeozoic intrusions nearby.
Frequent and transient heat flow peaks due to hydrothermal events and occasional volcanism were obviously associated with/caused by episodes of increased fault activity throughout the Phanerozoic. Calibration of the numerical basin model by very detailed vitrinite reflectance profiles suggests an outstanding tectonic and hydrothermal event in the mid-Cretaceous (about 100 Ma ago) with associated sedimentation rates locally of up to 200 m/Ma, heat flow up to 150 mW/m2, and formation temperatures up to 300 °C (Patchawarra Fm), which probably overprinted all previous thermal events. The mid-Cretaceous event was characterized by oversupply of sediments during the Winton Fm, simultaneous substantial shearing along the CESZ and extraordinary hydrothermal fluid circulation through open faults and fractures. This remarkable event shifted Eromanga source rocks to thermal maturity between 0.9 and 1.8% Ro, pushed all Permian source rocks beyond 3.0% Ro, and caused intense kerogen transformation beyond the critical value in the basin center (i.e., Nappamerri and Windorah troughs).
Today, the main oil window is located at 1.2 km, the gas window starts at 2 km, and the dry gas window commences at about 3 km depth. No major oil or gas accumulations occur within the Nappamerri Trough, because most volumes of locally generated hydrocarbons probably had already escaped to the atmosphere during the mid-Cretaceous. An unusually high present-day geothermal gradient and highly permeable faults make the Cooper subregion a suitable province for enhanced geothermal systems (EGS). By combining basin modelling, thermal modelling, subsidence history analysis, and neotectonic analysis, the interdisciplinary approach performed in this study supports the understanding of the tectonic and thermal history of central eastern Australia and serves as an example workflow for other intracratonic sedimentary basins worldwide.
Supplementary Materials
The following supporting information can be downloaded at https://0-www-mdpi-com.brum.beds.ac.uk/article/10.3390/geosciences12030117/s1; Table S1: BHT correction; Table S2: Layer splitting; Table S3: Paleo Water Depth Trends; Table S4: Sedimentation rate; Table S5: Input-data-Alkina-1; Table S6: Input-data-Beanbush-1; Table S7: Input-data-Burley-2; Table S8: Input-data-Daralingie-1; Table S9: Input-data-Dullingari-1; Table S10: Input-data-Jack Lake-1; Table S11: Input-data-Kirby-1; Table S12: Input-data-Marengo-1; Table S13: Input-data-Moothandella-1; Table S14: Input-data-Paning-1; Table S15: Input-data-Springfield-1; Table S16: Input-data-Warnie East-1.
Author Contributions
Conceptualization, methodology, formal analysis, investigation, data curation, visualization, writing—original draft preparation, project administration: J.R. Resources, supervision, validation, writing—review and editing, R.L. All authors have read and agreed to the published version of the manuscript.
Funding
This research received no external funding.
Data Availability Statement
We solely used public-domain data in this modelling study and therefore make all our input data, results and Supplementary Materials available for the public. PetroMod® data (modified maps, simulated 1D and 3D models, etc.) on request.
Acknowledgments
We thank Lisa S. Hall, Chris Boreham, David McKirdy, Bernd Michaelsen, Ian R. Duddy, Scott Bryan, Oliver Gaede, Carolin Mießen, Catharina Lesche, Denise Knebel, John Ostlender, and Dietrich Welte. Further, we are very grateful for Schlumberger Aachen GmbH for providing the academic PetroMod v2020.1 license, which was used to conduct numerical basin and petroleum system modelling.
Conflicts of Interest
The authors declare that they have no known competing financial interests or personal relationships that could have appeared to influence the work reported in this paper.
References
- Draper, J.J. (Ed.) Geology of the Cooper and Eromanga Basins, Queensland. In Queensland Government, Natural Resources and Mines, Queensland Mineral and Energy Review Series; Queensland Government: Brisbane, Australia, 2002. [Google Scholar]
- Gravestock, D.I.; Hibburt, J.E.; Drexel, J.F. (Eds.) Petroleum Geology of South Australia, Volume 4: Cooper Basin. South Australia Department of Industries and Resources, Report Book. September 1998. Available online: https://sarigbasis.pir.sa.gov.au/WebtopEw/ws/samref/sarig1/image/DDD/PGSA004.pdf (accessed on 13 December 2021).
- Raymond, O.L.; Totterdell, J.M.; Woods, M.A.; Stewart, A.J. Australian Geological Provinces 2018.01 edition. Dataset. 2018. Available online: http://pid.geoscience.gov.au/dataset/ga/116823 (accessed on 13 December 2021).
- Hall, L.S.; Hill, A.; Troup, A.; Korsch, R.; Radke, B.; Nicoll, R.S.; Palu, T.; Wang, L.; Stacey, A. Cooper Basin Architecture and Lithofacies: Regional Hydrocarbon Prospectivity of the Cooper Basin, Part 1; Record 2015/31; Geoscience Australia: Canberra, Australia, 2015. Available online: https://0-doi-org.brum.beds.ac.uk/10.11636/Record.2015.031 (accessed on 13 December 2021). [CrossRef]
- Goldstein, B.; Menpes, S.; Hill, A.; Wickham, A.; Alexander, E.; Jarosz, M.; Pepicelli, D.; Malavazos, M.; Staritski, K.; Taliangis, P.; et al. Roadmap for Unconventional Gas Projects in South Australia. South Australia Department for Manufacturing, Innovation, Trade, Resources and Energy, Energy Resources Division. 2012. Available online: https://www.energymining.sa.gov.au/__data/assets/pdf_file/0019/238033/Roadmap_Unconventional_Gas_Projects_SA_12-12-12_web.pdf (accessed on 8 November 2020).
- Hall, L.S.; Boreham, C.J.; Edwards, D.S.; Palu, T.J.; Buckler, T.; Hill, A.J.; Troup, A. Cooper Basin Source Rock Geochemistry: Regional Hydrocarbon Prospectivity of the Cooper Basin, Part 2; Record 2016/06; Geoscience: Canberra, Australia, 2016. [CrossRef]
- Hall, L.S.; Palu, T.J.; Murray, A.P.; Boreham, C.J.; Edwards, D.S.; Hill, A.J.; Troup, A. Cooper Basin Petroleum Systems Analysis: Regional Hydrocarbon Prospectivity of the Cooper Basin, Part 3; Record 2016/29; Geoscience Australia: Canberra, Australia, 2016. [CrossRef]
- Hall, L.S.; Palu, T.J.; Murray, A.P.; Boreham, C.J.; Edwards, D.S.; Hill, A.J.; Troup, A. Hydrocarbon prospectivity of the Cooper Basin, Australia. AAPG Bull. 2019, 103, 31–63. [Google Scholar] [CrossRef] [Green Version]
- Radke, B. Hydrocarbon and Geothermal Prospectivity of Sedimentary Basins in Central Australia: Warburton, Cooper, Pedirka, Galilee, Simpson and Eromanga Basins; Record 2009/25; Geoscience Australia: Canberra, Australia, 2009. Available online: http://www.ga.gov.au/corporate_data/69150/Rec2009_025.pdf (accessed on 13 December 2021).
- Siégel, C.; Bryan, S.; Purdy, D.; Allen, C.; Schrank, C.; Uysal, T.; Gust, D.; Beardsmore, G. Evaluating the role of deep granitic rocks in generating anomalous temperatures in south-west Queensland. In Geological Survey of Queensland: Digging Deeper 10 Seminar Extended Abstracts [Queensland Geological Record 2012/14]; Geological Survey of Queensland, Department of Natural Resource and Mines: Brisbane, Australia, 2012; pp. 95–102. [Google Scholar]
- Siégel, C.; Schrank, C.E.; Bryan, S.E.; Beardsmore, G.R.; Purdy, D.J. Heat-producing crust regulation of subsurface temperatures: A stochastic model re-evaluation of the geothermal potential in southwestern Queensland, Australia. Geothermics 2014, 51, 182–200. [Google Scholar] [CrossRef] [Green Version]
- Meixner, A.J.; Kirkby, A.L.; Horspool, N. Using constrained gravity inversions to identify high-heat-producing granites beneath thick sedimentary cover in the Cooper Basin region of central Australia. Geothermics 2014, 51, 483–495. [Google Scholar] [CrossRef]
- Khair, H.A.; Cooke, D.; Hand, M. Seismic mapping and geomechanical analyses of faults within deep hot granites, a workflow for enhanced geothermal system projects. Geothermics 2015, 53, 46–56. [Google Scholar] [CrossRef]
- Khair, H.A.; Cooke, D.; Hand, M. Paleo stress contribution to fault and natural fracture distribution in the Cooper Basin. J. Struct. Geol. 2015, 79, 31–41. [Google Scholar] [CrossRef]
- Smith, M.; Karim, F.; Sparrow, A.; Cassel, R.; Hall, L. Context statement for the Cooper subregion. In Product 1.1 for the Cooper subregion from the Lake Eyre Basin Bioregional Assessment; Department of the Environment, Bureau of Meteorology, CSIRO and Geoscience Australia: Canberra, Australia, 2015. Available online: https://www.bioregionalassessments.gov.au/assessments/11-context-statement-cooper-subregion (accessed on 13 December 2021).
- Carr, L.; Korsch, R.; Palu, T. Australia’s onshore basin inventory: Volume I. APPEA J. 2016, 56, 591. [Google Scholar] [CrossRef]
- Golding, S.D.; Dawson, G.K.W.; Pearce, J.K.; Farrajota, F.; Mernagh, T.; Boreham, C.; Hall, L.S.; Palu, T.J.; Sommacal, S. Great Artesian Basin Authigenic Carbonates as Natural Analogues for Mineralisation Trapping; CO2CRC Project 1.5.2 ANLEC Project 7-1011-0189; CO2CRC Report No RPT16-5497; Cooperative Research Centre for Greenhouse Gas Technologies: Melbourne, Australia, 2016. [Google Scholar]
- Gallagher, K.; Lambeck, K. Subsidence, sedimentation and sea-level changes in the Eromanga Basin, Australia. Basin Res. 1989, 2, 115–131. [Google Scholar] [CrossRef]
- Moussavi-Harami, R. Burial history. In Petroleum geology of South Australia; Alexander, E.M., Hibburt, J.E., Eds.; Eromanga Basin; South Australia Department of Mines and Energy: Adelaide, Australia, 1996; Volume 2, pp. 125–140. [Google Scholar]
- Deighton, I.; Hill, A.J. Chapter 9: Thermal and burial history. In The Petroleum Geology of South Australia, Volume 4: Cooper Basin. South Australia Department of Primary Industries and Resources, Adelaide; Gravestock, D.I., Hibburt, J.E., Drexel, J.F., Eds.; Report Book, 1998/9; South Australia Department of Primary Industries and Resources: Adelaide, Australia, 1998; pp. 143–155. Available online: https://sarigbasis.pir.sa.gov.au/WebtopEw/ws/samref/sarig1/image/DDD/PGSA004.pdf (accessed on 13 December 2021).
- Zwingmann, H.; Tingate, P.R.; Lemon, N.M.; Hamilton, P.J. K-Ar dating, petrographic and thermal modelling constraints on illite origin in the Cooper Basin, South Australia. In Eastern Australian Basins Symposium 2001; Hill, K.C., Bernecker, T., Eds.; Petroleum Exploration Society of Australia Special Publication: Melbourne, Australia, 2001; pp. 321–327. [Google Scholar]
- Deighton, I.; Draper, J.J.; Hill, A.J.; Boreham, C.J. A hydrocarbon generation model for the Cooper and Eromanga Basins. APPEA J. 2003, 43, 433–451. [Google Scholar] [CrossRef]
- Mavromatidis, A.; Hillis, R. Quantification of exhumation in the Eromanga Basin and its implications for hydrocarbon exploration. Pet. Geosci. 2005, 11, 79–92. [Google Scholar] [CrossRef]
- Mavromatidis, A. Burial/exhumation histories for the Cooper–Eromanga Basins and implications for hydrocarbon exploration, Eastern Australia. Basin Res. 2006, 18, 351–373. [Google Scholar] [CrossRef]
- Mavromatidis, A. Exhumation study in the Cooper-Eromanga Basins, Australia and the implications for hydrocarbon exploration. Energy Sources Part A Recovery Util. Environ. Eff. 2007, 29, 631–648. [Google Scholar] [CrossRef]
- McLaren, S.; Dunlap, W.J. Use of 40Ar/39Ar K-feldspar thermochronology in basin thermal history reconstruction: An example from the Big Lake Suite granites, Warburton Basin, South Australia. Basin Res. 2006, 18, 189–203. [Google Scholar] [CrossRef]
- Meixner, A.J.; Kirkby, A.L.; Lescinsky, D.T.; Horspool, N. The Cooper Basin 3D Map Version 2: Thermal Modelling and Temperature Uncertainty; Record, 60; Geoscience Australia: Canberra, Australia, 2012. Available online: https://ecat.ga.gov.au/geonetwork/srv/api/records/c2c6bbd3-fd68-194b-e044-00144fdd4fa6 (accessed on 13 December 2021).
- Wainman, C.C.; McCabe, P.J.; Crowley, J.L. Solving a tuff problem: Defining a chronostratigraphic framework for Middle to Upper Jurassic nonmarine strata in eastern Australia using uranium–lead chemical abrasion–thermal ionization mass spectrometry zircon dates. AAPG Bull. 2018, 102, 1141–1168. [Google Scholar] [CrossRef]
- Hardman, J.P.; Holford, S.P.; Schofield, N.; Bunch, M.; Gibbins, D. The Warnie volcanic province: Jurassic intraplate volcanism in Central Australia. Gondwana Res. 2019, 76, 322–347. [Google Scholar] [CrossRef]
- O’Neil, B.J. Chapter 2: History of Petroleum Exploration and Development. In The Petroleum Geology of South Australia; Gravestock, D.I., Hibburt, J.E., Drexel, J.F., Eds.; Volume 4: Cooper Basin; Report Book, 1998/9; Department of Primary Industries and Resources, Government of South: Adelaide, Australia, 1998; pp. 7–36. Available online: https://sarigbasis.pir.sa.gov.au/WebtopEw/ws/samref/sarig1/image/DDD/PGSA004.pdf (accessed on 13 December 2021).
- O’Neil, B.J.; Alexander, E.M. History of petroleum exploration and development. In The Petroleum Geology of South Australia Series, 2nd ed.; Cotton, T.B., Boult, P.J., Hibburt, J.E., Eds.; Eromanga Basin; Department of Primary Industries and Resources. Government of South Australia: Adelaide, Australia, 2006; Volume 2. [Google Scholar]
- Menpes, S.; Hill, A.; Pepicelli, D. Characteristics of the Gidgealpa Group composite resource play in the Cooper Basin, South Australia. In Unconventional Resources Technology Conference Abstracts; URTeC Denver: Denver, CO, USA, 2013; pp. 2621–2630. [Google Scholar] [CrossRef]
- AERA: Australian Government; Geoscience Australia. Australian Energy Resources Assessment. Executive Summary. 2020. Available online: https://aera.ga.gov.au/ (accessed on 14 October 2020).
- Hall, L.S.; Palu, T.J. Cooper Basin Regional Petroleum Systems Model; Geoscience Australia: Canberra, Australia, 2016. Available online: http://pid.geoscience.gov.au/dataset/ga/100740 (accessed on 3 November 2020).
- Middleton, M.F. Correlation between well log and surface resistivity measurements? A case study in the Eromanga Basin, Queensland. Explor. Geophys. 1979, 10, 176–178. [Google Scholar] [CrossRef] [Green Version]
- Gallagher, K.L. The subsidence history and thermal state of the Eromanga and Cooper Basins. Ph.D. Thesis, The Australian National University, Open Research Library, Canberra, Australia, 1988. [Google Scholar] [CrossRef]
- Burger, D.; Senior, B.R. A revision of the sedimentary and palynological history of the northeastern Eromanga Basin, Queensland. J. Geol. Soc. Aust. 1979, 26, 121–133. [Google Scholar] [CrossRef]
- Gostin, V.A.; Therriault, A.M. Tookoonooka, a large buried early Cretaceous impact structure in the Eromanga Basin of southwestern Queensland, Australia. Meteorit. Planet. Sci. 1997, 32, 593–599. [Google Scholar] [CrossRef] [Green Version]
- Bron, K.A.; Gostin, V. The Tookoonooka marine impact horizon, Australia: Sedimentary and petrologic evidence. Meteorit. Planet. Sci. 2012, 47, 296–318. [Google Scholar] [CrossRef]
- Alley, N.F.; Hore, S.B.; Frakes, L.A. Glaciations at high-latitude Southern Australia during the Early Cretaceous. Aust. J. Earth Sci. 2020, 67, 1045–1095. [Google Scholar] [CrossRef]
- Kantsler, A.J.; Prudence, T.J.; Cook, A.C.; Zwigulis, M. Hydrocarbon habitat of the Cooper/Eromanga Basin, Australia. Aust. Pet. Explor. Assoc. J. 1983, 23, 75–92. [Google Scholar] [CrossRef]
- Kuang, K.S. History and style of Cooper? Eromanga Basin structures. Explor. Geophys. 1985, 16, 245–248. [Google Scholar] [CrossRef]
- Finlayson, D.M.; Leven, J.H.; Etheridge, M.A. Structural styles and basin evolution in Eromanga region, Eastern Australia. AAPG Bull. 1988, 72, 33–48. [Google Scholar]
- Apak, S.N.; Stuart, W.J.; Lemon, N.M. Compressional control on sediment and facies distribution SW Nappamerri Syncline and adjacent Murteree High, Cooper Basin. APPEA J. 1995, 35, 190–202. [Google Scholar] [CrossRef]
- Apak, S.N.; Stuart, W.J.; Lemon, N.M.; Wood, G. Structural evolution of the Permian–Triassic Cooper Basin, Australia: Relation to hydrocarbon trap styles. AAPG Bull. 1997, 81, 533–555. [Google Scholar]
- Mavromatidis, A. Combined analysis of different logs in quantification of exhumation and its implications for hydrocarbon exploration, a case study from Australia. Geol. Acta: Int. Earth Sci. J. 2006, 4, 355–370. [Google Scholar]
- Grant-Woolley, L.; Kong, A.; Schoemaker, B.; Nasreddin, H.; Montague, E.T. Identification of strike-slip faults provides insights into the further development of mature Cooper Basin fields. In SPE Asia Pacific Oil & Gas Conference and Exhibition; Society of Petroleum Engineers: Adelaide, Australia, 2014. [Google Scholar] [CrossRef]
- Kulikowski, D.; Amrouch, K. Combining geophysical data and calcite twin stress inversion to refine the tectonic history of subsurface and offshore provinces: A case study on the Cooper-Eromanga Basin, Australia. Tectonics 2017, 36, 515–541. [Google Scholar] [CrossRef]
- Kulikowski, D.; Amrouch, K.; Cooke, D.; Gray, M.E. Basement structural architecture and hydrocarbon conduit potential of polygonal faults in the Cooper-Eromanga Basin, Australia. Geophys. Prospect. 2018, 66, 366–396. [Google Scholar] [CrossRef]
- Holgate, F.L. Exploration and Evaluation of the Australian Geothermal Resource. Ph.D. Thesis, The Australian National University, Open Research Library, Canberra, Australia, 2005. [Google Scholar] [CrossRef]
- Purdy, D.J.; Hegarty, R.; Doublier, M.P. Basement geology of the southern Thomson Orogen. Aust. J. Earth Sci. 2018, 65, 893–916. [Google Scholar] [CrossRef]
- Scheibner, E. Fossil fracture zones (transform faults), segmentation and correlation problems in the Tasman Fold Belt System. In The Tasman Geosyncline–A Symposium in Honour of Professor Dorothy Hill; Denmead, A.K., Tweedale, G.W., Wilson, A.F., Eds.; Queensland Division Geological Society of Australia: Brisbane, Australia, 1974; pp. 65–96. [Google Scholar]
- Veevers, J.J.; Powell, C.M. Epi-Adelaidean: Regional shear. In Phanerozoic Earth History of Australia; Veevers, J.J., Ed.; Clarendon Press: Oxford, UK, 1984; pp. 278–284. [Google Scholar]
- GA, Australian Government; Geoscience Australia. National Petroleum Wells Database. 2017. Available online: http://dbforms.ga.gov.au/www/npm.well.search (accessed on 17 August 2020).
- Röth, J.; Baniasad, A.; Froidl, F.; Ostlender, J.; Boreham, C.; Hall, L.S.; Littke, R. The Birkhead and Murta formations-organic geochemistry and organic petrography of Mesozoic fluvio-lacustrine source rocks in the Eromanga Basin, central Australia. Submitted to and under review. Int. J. Earth Sci. 2021; under review. [Google Scholar]
- GA, Australian Government, Geoscience Australia. Great Artesian Basin. 2020. Available online: http://www.ga.gov.au/scientific-topics/water/groundwater/gab (accessed on 22 April 2020).
- Smerdon, B.D.; Ransley, T.R.; Radke, B.M.; Kellett, J.R. Water Resource Assessment for the Great Artesian Basin: A Report to the Australian Government from the CSIRO Great Artesian Basin Water Resource Assessment; CSIRO Water for a Healthy Country Flagship; Australian Government: Canberra, Australia, 2012.
- Cook, A.G.; Bryan, S.E.; Draper, J. Post-Orogenic Mesozoic Basins and Magmatism. In Geology of Queensland (515-575); Jell, P., Ed.; Geological Survey of Queensland: Brisbane, Australia, 2013. [Google Scholar]
- Roberts, D.C.; Carroll, P.G.; Sayers, J. The Kalladeina Formation—A Warburton Basin Cambrian carbonate play. APPEA J. 1990, 30, 166–183. [Google Scholar] [CrossRef]
- Siégel, C.; Bryan, S.E.; Allen, C.M.; Purdy, D.J.; Cross, A.J.; Uysal, I.T.; Gust, D.A. Crustal and thermal structure of the Thomson Orogen: Constraints from the geochemistry, zircon U–Pb age, and Hf and O isotopes of subsurface granitic rocks. Aust. J. Earth Sci. 2018, 65, 967–986. [Google Scholar] [CrossRef] [Green Version]
- McKellar, J.L. The Cooper Basin. Geology of Queensland; Geological Survey of Queensland: Brisbane, Australia, 2013; pp. 204–212.
- Gravestock, D.I.; Jensen-Schmidt, B. Structural Setting. In Petroleum Geology of South Australia; Gravestock, D.I., Hibburt, J.E., Drexel, J.F., Eds.; Petroleum Group, Primary Industries and Resources South Australia: Adelaide, Australia, 1998; Volume 4, pp. 47–67. [Google Scholar]
- Teasdale, J.; Pryer, L.; Etheridge, M.; Romine, K.; Stuart-Smith, P.; Cowan, P.; Loutit, T.; Vizy, J.; Henley, P. Officer Basin SEEBASE Project; Report for Primary Industries and Resources South Australia: Adelaide, Australia, 2001. [Google Scholar]
- Middleton, A.W.; Uysal, I.T.; Bryan, S.E.; Hall, C.M.; Golding, S.D. Integrating 40Ar–39Ar, 87Rb–87Sr and 147Sm–143Nd geochronology of authigenic illite to evaluate tectonic reactivation in an intraplate setting, central Australia. Geochim. Et Cosmochim. Acta 2014, 134, 155–174. [Google Scholar] [CrossRef] [Green Version]
- Beardsmore, G. The influence of basement on surface heat flow in the Cooper Basin. Explor. Geophys. 2004, 35, 223–235. [Google Scholar] [CrossRef]
- GA, Australian Government, Geoscience Australia. Australian Stratigraphic Units Database. 2020. Available online: http://www.ga.gov.au/data-pubs/data-standards/reference-databases/stratigraphic-units (accessed on 22 April 2020).
- Murray, C.G. Basement Cores from the Tasman Fold Belt System Beneath the Great Artesian Basin in Queensland; Department of Minerals and Energy, Government of Queensland: Brisbane, Australia, 1994.
- Lavering, I.H. Observations on the geological origin of the ‘C’-horizon seismic reflection, Eromanga Basin. BMR J. Aust. Geol. Geophys. 1991, 12, 5–12. [Google Scholar]
- Bron, K.A. Accretionary and melt impactoclasts from the Tookoonooka impact event, Australia. Geol. Soc. America. Spec. Pap. 2010, 465, 219–244. [Google Scholar]
- Alley, N.F. Cainozoic stratigraphy, palaeoenvironments and geological evolution of the Lake Eyre Basin. Palaeogeogr. Palaeoclimatol. Palaeoecol. 1998, 144, 239–263. [Google Scholar] [CrossRef]
- Bowering OJ, W.; Harrison, D.M. The Merrimelia oil and gas field–A case history. In Contributions to the Geology and Hydrocarbon Potential of the Eromanga Basins; Gravestock, D.I., Moore, P.S., Pitt, G.M., Eds.; Geological Society of Australia Special Publication: Hornsby, NSW, Australia, 1986; Volume 12, pp. 183–194. [Google Scholar]
- Gray, A.R.G.; Draper, J.J. Petroleum geology. In Geology of the Cooper and Eromanga Basins (63–74); Queensland Department of Natural Resources and Mines: Brisbane, Australia, 2010. [Google Scholar]
- Boreham, C.J.; Hill, A.J. Source rock distribution and hydrocarbon geochemistry. Pet. Geol. S. Aust. 1998, 4, 129–142. [Google Scholar]
- Boreham, C.J.; Summons, R.E. New insights into the active petroleum systems in the Cooper and Eromanga Basins, Australia. APPEA J. 1999, 39, 263–296. [Google Scholar] [CrossRef]
- Holgate, F.; Gerner, E. Oz Temp Well Temperature Data; Geoscience Australia: Canberra, Australia, 2010. Available online: http://www.ga.gov.au/metadata-gateway/metadata/record/gcat_70604 (accessed on 26 February 2019).
- PEPS-SA, Department of State Development South Australia. Legacy Petroleum and Geothermal Attribute Database (Legacy PEPS-SA)2020. 2018. Available online: https://energymining.sa.gov.au/petroleum/data_and_publications/peps-sa (accessed on 17 August 2020).
- QPED, Department of Natural Resources and Mines Queensland Government. Queensland Petroleum Exploration Data (QPED). 2020. Available online: https://www.data.qld.gov.au/dataset/queensland-borehole-series (accessed on 17 August 2020).
- Whiteway, T. Australian Bathymetry and Topography Grid, June 2009; Scale 1:5000000; Geoscience Australia: Canberra, Australia, 2009. Available online: http://www.ga.gov.au/corporate_data/67703/Rec2009_021.pdf (accessed on 26 February 2019).
- Alexander, E.M.; Gravestock, D.I.; Cubitt, C.; Chaney, A. Chapter 6: Lithostratigraphy and environments of deposition. In The Petroleum Geology of South Australia: Cooper Basin; Gravestock, D.I., Hibburt, J.E., Drexel, J.F., Eds.; Department of Primary Industries and Resources South Australia: Adelaide, Australia, 1998; Volume 4, pp. 69–115. [Google Scholar]
- Alexander, E.M.; Sansome, A.; Cotton, T.B. Chapter 5: Lithostratigraphy and environments of deposition. In The Petroleum Geology of South Australia, 2nd ed.; Cotton, T.B., Scardigno, M.F., Hibburt, J.E., Eds.; Eromanga Basin; South Australia Department of Primary Industries and Resources: Adelaide, Australia, 2006; Volume 2, 129p. [Google Scholar]
- NGMA, National Geoscience Mapping Accord. Cooper and Eromanga Basins, Australia, Seismic Mapping Data Sets: Custodian—Department for Manufacturing, Innovation, Trade, Resources and Energy on behalf of the National Geoscience Mapping Accord; Government of South Australia: Adelaide, Australia, 2001. Available online: https://sarig.pir.sa.gov.au/Map (accessed on 3 November 2020).
- DMITRE, Department for Manufacturing, Innovation, Trade, Resources and Energy. Seismic Mapping Data Sets over the Cooper Basin Sector, South Australia 2001. GBA Data Repository GUID: 624DC5D1-5418-44A1-A9E8-6B7DCEC0F26E. 2001. Available online: https://sarig.pir.sa.gov.au/Map (accessed on 3 November 2017).
- DMITRE, Department for Manufacturing, Innovation, Trade, Resources and Energy. Seismic Mapping Data Sets over the Cooper Basin Sector, South Australia 2009. GBA Data Repository GUID: 624DC5D1-5418-44A1-A9E8-6B7DCEC0F26E. 2009. Available online: http://www.energymining.sa.gov.au/petroleum/data_and_publications/seismic/cooper_and_eromanga_basin_mapping_products#horizonmaps (accessed on 3 November 2017).
- Gray, G.A.R.; McKillop, M.; McKellar, J.L. Eromanga Basin stratigraphy. In Geology of the Cooper and Eromanga Basins; Draper, J.J., Ed.; Queensland Department of Natural Resources and Mines: Brisbane, Australia, 2002; pp. 30–56. [Google Scholar]
- Turner, S.; Bean, L.B.; Dettmann, M.; McKellar, J.L.; McLoughlin, S.; Thulborn, T. Australian Jurassic sedimentary and fossil successions: Current work and future prospects for marine and non-marine correlation. Geol. Föreningen I Stockh. Förhandlingar GFF 2009, 131, 49–70. [Google Scholar] [CrossRef]
- Radke, M.B.; Kellett, J.R.; Ransley, T.R.; Bell, J.G. Lexicon of the Lithostratigraphic and Hydrogeological Units of the Great Artesian Basin and Its Cenozoic Cover: A Technical Report to the Australian Government from the CSIRO Great Artesian Basin Water Resource Assessment; Commonwealth Scientific and Industrial Research Organisation Water for a Healthy Country Flagshi: Canberra, Australia, 2012; 175p. [Google Scholar]
- Sun, X.; Camac, B. Cooper Basin Electrofacies Mapping, Adelaide, Australia, South Australia Department of State Development, Resources and Energy. 2004. Available online: https://sarig.pir.sa.gov.au/Map (accessed on 25 April 2017).
- Wygrala, B.P. Integrated Study of an Oil Field in the Southern Po Basin, Northern Italy. Ph.D. Dissertation, University of Cologne, Cologne, Germany, 1989; 217p. [Google Scholar]
- BOM, Australian Government, Bureau of Meteorology. Mean Monthly and Mean Annual Temperature Data. 2015. Available online: http://www.bom.gov.au/jsp/ncc/climate_averages/temperature/index.jsp (accessed on 3 November 2020).
- Ladant, J.B.; Donnadieu, Y. Palaeogeographic regulation of glacial events during the Cretaceous supergreenhouse. Nat. Commun. 2016, 7, 1–9. [Google Scholar] [CrossRef] [Green Version]
- Pepper, A.S.; Dodd, P.J. Simple kinetic models of petroleum formation. Part II: Oil-gas cracking. Mar. Pet. Geol. 1995, 12, 321–340. [Google Scholar] [CrossRef]
- Pepper, A.S.; Corvi, P.J. Simple kinetic models of petroleum formation. Part I: Oil and gas generation from kerogen. Mar. Pet. Geol. 1995, 12, 291–319. [Google Scholar] [CrossRef]
- Pepper, A.S.; Corvi, P.J. Simple kinetic models of petroleum formation. Part III: Modelling an open system. Mar. Pet. Geol. 1995, 12, 417–452. [Google Scholar] [CrossRef]
- Michaelsen, B.H.; McKirdy, D.M. Migration and mixing of oils in the Cooper and Eromanga Basins, Central Australia. In Eastern Australian Basins Symposium 2001; Hill, K.C., Bernecker, T., Eds.; Petroleum Exploration Society of Australia Special Publication: Melbourne, Australia, 2001; pp. 289–300. [Google Scholar]
- Michaelsen, B.H.; McKirdy, D.M. Source rock distribution and hydrocarbon geochemistry. In Petroleum Geology of South Australia Series, 2nd ed.; Cotton, T.B., Scardigno, M.F., Hibburt, J.E., Eds.; Department of Primary Industries and Resources. Government of South Australia: Adelaide, Australia, 2006; Volume 2. [Google Scholar]
- Burnham, A.K. Kinetic models of vitrinite, kerogen, and bitumen reflectance. Org. Geochem. 2019, 131, 50–59. [Google Scholar] [CrossRef]
- Aitken, A.R.A.; Salmon, M.L.; Kennett, B.L.N. Australia’s Moho: A test of the usefulness of gravity modelling for the determination of Moho depth. Tectonophysics 2013, 609, 468–479. [Google Scholar] [CrossRef]
- Bacchin, M.; Milligan, P.R.; Wynne, P.; Tracey, R. Gravity Anomaly Map of the Australian Region, Scale 1:5000000; Geoscience Australia: Canberra, Australia, 2008.
- Mann, P.; Hempton, M.R.; Bradley, D.C.; Burke, K. Development of pull-apart basins. J. Geol. 1983, 91, 529–554. [Google Scholar] [CrossRef]
- Noda, A. Strike-Slip Basin–its Configuration and Sedimentary Facies. Mechanism of Sedimentary Basin Formation–Multidisciplinary Approach on Active Plate Margins; IntechOpen: London, UK, 2013; pp. 27–57. [Google Scholar]
- Aydin, A.; Nur, A. Evolution of pull-apart basins and their scale independence. Tectonics 1982, 1, 91–105. [Google Scholar] [CrossRef]
- Green, P.M.; Hoffmann, K.L.; Brain, T.J.; Gray, A.R.G. The Surat and Bowen Basins, South-East Queensland; Queensland Department of Mines and Energy: Brisbane, Australia, 1997. [Google Scholar]
- Raza, A.; Hill, K.; Korsch, R.J. Mid Cretaceous uplift and denudation of the Bowen and Surat basins, eastern Australia: Relationship to Tasman Sea rifting from apatite fission track and vitrinite reflectance data. Aust. J. Earth Sci. 2009, 56, 501–531. [Google Scholar] [CrossRef]
- Li, P.F.; Rosenbaum, G.; Rubatto, D. Triassic asymmetric subduction rollback in the southern New England Orogen (eastern Australia): The end of the Hunter-Bowen Orogeny. Aust. J. Earth Sci. 2012, 59, 965–981. [Google Scholar] [CrossRef]
- Wakelin-King, G.A.; White, S.Q. Potential Geoheritage Values of landscapes in the Australian Drylands. In A Report to the Commonwealth Department of Sustainability, Environment, Water, Population and Communities (Dept. SEWPaC, Canberra), 2nd ed.; Wakelin Associates Pty. Ltd.: Canberra, Australia, 2016. Available online: https://www.environment.gov.au/system/files/resources/806716b9-dff5-48cb-b7d9-fae6ef053ad4/files/desert-geoheritage-v2.pdf (accessed on 13 December 2021).
- Hillis, R.R.; Reynolds, S.D. The Australian stress map. J. Geol. Soc. 2000, 157, 915–921. [Google Scholar] [CrossRef]
- Reynolds, S.D.; Mildren, S.D.; Hillis, R.R.; Meyer, J.J.; Flottmann, T. Maximum horizontal stress orientations in the Cooper Basin, Australia: Implications for plate-scale tectonics and local stress sources. Geophys. J. Int. 2005, 160, 331–343. [Google Scholar] [CrossRef] [Green Version]
- Hillis, R.R.; Sandiford, M.; Reynolds, S.D.; Quigley, M.C. Present-day stresses, seismicity and Neogene-to-Recent tectonics of Australia’s ‘passive’ margins: Intraplate deformation controlled by plate boundary forces. Geol. Soc. Lond. Spec. Publ. 2008, 306, 71–90. [Google Scholar] [CrossRef] [Green Version]
- Sandiford, M.; Lawrie, K.; Brodie, R.S. Hydrogeological implications of active tectonics in the Great Artesian Basin, Australia. Hydrogeol. J. 2020, 28, 57–73. [Google Scholar] [CrossRef]
- Bryan, S.E.; Cook, A.; Allen, C.M.; Siegel, C.; Purdy, D.; Greentree, J.; Uysal, T. Early-mid Cretaceous tectonic evolution of eastern Gondwana: From silicic LIP magmatism to continental rupture. Episodes 2012, 35, 142–152. [Google Scholar] [CrossRef] [PubMed] [Green Version]
- Müller, R.D.; Dyksterhuis, S.; Rey, P. Australian paleo-stress fields and tectonic reactivation over the past 100 Ma. Aust. J. Earth Sci. 2012, 59, 13–28. [Google Scholar] [CrossRef] [Green Version]
- Röth, J.; Parent, A.; Warren, C.; Hall, L.S.; Palmowski, D.; Koronful, N.; Husein, S.S.; Sachse, V.; Littke, R. Lithospheric evolution, thermo-tectonic history and source-rock maturation in the Gippsland Basin, Victoria. southeastern Australia. Aust. J. Earth Sci. 2022, 69, 83–112. [Google Scholar] [CrossRef]
- Turtle, E.P.; Pierazzo, E.; O’Brien, D.P. Numerical modeling of impact heating and cooling of the Vredefort impact structure. Meteorit. Planet. Sci. 2003, 38, 293–303. [Google Scholar] [CrossRef]
- Pitt, G.M. Geothermal gradients, geothermal histories and the timing of thermal maturation in the Eromanga-Cooper Basins. In Contributions to the Geology and Hydrocarbon Potential of the Eromanga Basin; Gravestock, D.I., Moore, P.S., Pitt, G.M., Eds.; Geological Society of Australia Special Publications: Hornsby, Australia, 1986; Volume 12, pp. 323–351. [Google Scholar]
- Rawlinson, N.; Davies, D.R.; & Pilia, S. The mechanisms underpinning Cenozoic intraplate volcanism in eastern Australia: Insights from seismic tomography and geodynamic modeling. Geophys. Res. Lett. 2017, 44, 9681–9690. [Google Scholar] [CrossRef]
- Leythaeuser, D.; Littke, R.; Radke, M.; & Schaefer, R.G. Geochemical effects of petroleum migration and expulsion from Toarcian source rocks in the Hils syncline area, NW-Germany. In Organic Geochemistry in Petroleum Exploration; Pergamon Press: Oxford, UK, 1988; pp. 489–502. [Google Scholar]
- Littke, R.; Baker, D.R.; Leythaeuser, D. Microscopic and sedimentologic evidence for the generation and migration of hydrocarbons in Toarcian source rocks of different maturities. In Organic Geochemistry in Petroleum Exploration; Pergamon Press: Oxford, UK, 1988; pp. 549–559. [Google Scholar]
- Kutovaya, A.; Kroeger, K.F.; Seebeck, H.; Back, S.; Littke, R. Thermal Effects of Magmatism on Surrounding Sediments and Petroleum Systems in the Northern Offshore Taranaki Basin, New Zealand. Geosciences 2019, 9, 288. [Google Scholar] [CrossRef] [Green Version]
- Santos. Santos Welcomes 1.9 Billion Dollars Technology-Neutral Investment to Reduce Carbon Emissions. Media Release. 17 September 2020. Available online: https://www.santos.com/wp-content/uploads/2020/09/200917-Release-Santos-welcomes-1.9-billion-technology-neutral-investment-to-reduce-carbon-emissions.pdf (accessed on 14 October 2020).
Figure 3.
Hydrocarbon fields and petroleum system overview of the study area. (a) Regional map with outline of the Cooper Basin and distribution of all oil and gas fields. (b) Zoom into the SW Cooper Basin, where oil and gas fields are abundant and are mainly associated with anticlines along basement ridges (compare Figure 1b). DNC = Della-Nappacoongee, GMI = Gidgealpa-Merrimelia-Innamincka, JNP = Jackson-Naccowlah-Pepita, KNFZ = Karmona-Naccowlah Fault Zone. (c) Schematic petroleum system overview showing distribution of hydrocarbon fields and possible migration into anticlinal and fault-related traps (redrawn and modified after [71]).


Figure 4.
Upper thermal boundary conditions and petroleum system elements (PSE) chart. (a) Paleo-water depth (PWD) applied in this study, modified after [20,22]. (b) Sediment/water interface temperature (SWIT) applied in this study based on the algorithm of [88]), Southern hemisphere, Australia, 27°, with glacial period between 135 and 115 Ma. (c) Petroleum system elements (PSE) chart.

Figure 5.
Total subsidence with temperature evolution (left), calibrated present-day temperature based on Horner-corrected bottom hole temperatures (BHT), and calibrated thermal maturity of four selected calibration wells located in South Australia. (a) Beanbush-1, (b) Burley-2, (c) Dullingari-1, (d) Paning-1. Note different scales of x-axis.

Figure 6.
Total subsidence with temperature evolution (left), calibrated present-day temperature based on Horner-corrected bottom hole temperatures (BHT), and calibrated thermal maturity of four selected calibration wells located in Queensland. (a) Alkina-1, (b) Marengo-1, (c) Springfield-1, (d) Warnie East-1. Note different scales of x-axis.

Figure 7.
Selected time-dependent parameters for the analysis of the thermo-tectonic evolution based on eight simulated and calibrated key wells. (a) Tectonic subsidence. (b) Sedimentation rate (for two selected wells only, Alkina-1, Burley-2). (c) Basal heat flow. (d) Temperature gradient. (e,f) Heating rate. (g) Temperature at top basement.


Figure 8.
Thermal evolution, maturation, and kerogen transformation of the assigned source rocks based on four calibrated 1D models (Beanbush-1, Marengo-1, Warnie East-1, and Burley-2). (a) Source rock temperature evolution. (b) Thermal maturity evolution. (c) Transformation ratio evolution. Translation of layer indices: (4) Patchawarra Fm, (5) Murteree Sh, (6) Epsilon Fm, (7) Roseneath Sh, (8) Daralingie Fm, (10) Toolachee Fm, (16) Poolowanna Fm, (18) Birkhead Fm, (23) Murta Fm.


Figure 9.
Layer thickness maps of the Cooper Basin. (a) Merrimelia Fm. (b) Patchawarra Fm. (c) Murteree Sh. (d) Epsilon Fm. (e) Roseneath Sh. (f) Daralingie Fm. (g) Toolachee Fm. (h) Tinchoo Fm. Arraburry Fm (not shown) is very similar to Tinchoo Fm. Tirrawarra Fm is not shown due to its relatively small thickness. Kinematic/tectonic indicators mainly based on [49]. KNFZ = Karmona-Naccowlah Fault Zone.


Figure 10.
Layer thickness maps of the Eromanga Basin. (a) Hutton Sst incl. Poolowanna and Cuddapan formations. (b) Birkhead Fm. (c) Adori Sst. (d) Westbourne Fm. (e) Namur Sst. (f) Wallumbilla Fm. (g) Allaru Mdst. (h) Mackunda Fm. The relatively thin layers of the Murta Fm, Cadna-owie Fm, and Toolebuc Fm are excluded. KNFZ = Karmona-Naccowlah Fault Zone, BLB = Bulloo Lake Basin.


Figure 11.
Impact of uplift and erosion on thickness of the Winton Fm. (a) Original thickness. (b) Assigned erosion map adopted from [23]. (c) Resulting preserved thickness at present day. Kinematic/tectonic indicators based on [49]. KNFZ = Karmona-Naccowlah Fault Zone.

Figure 12.
Calculated basal heat flow maps for selected time steps. (a) 134 Ma. (b) 120 Ma. (c) 108 Ma. (d). 101 Ma. (e) 99.5 Ma, peak of mid-Cretaceous hydrothermal activity. (f) 95 Ma. (g) 62 Ma. (h) Present day, peak of Quaternary hydrothermal activity.
Figure 12.
Calculated basal heat flow maps for selected time steps. (a) 134 Ma. (b) 120 Ma. (c) 108 Ma. (d). 101 Ma. (e) 99.5 Ma, peak of mid-Cretaceous hydrothermal activity. (f) 95 Ma. (g) 62 Ma. (h) Present day, peak of Quaternary hydrothermal activity.


Figure 13.
Calculated present-day thermal maturity maps for most of the assigned source rock intervals. (a) Patchawarra Fm. (b) Murteree Sh. (c) Epsilon Fm. (d) Roseneath Sh. (e) Toolachee Fm. (f) Birkhead Fm. (g) Westbourne Fm. (h) Murta Fm. White areas indicate non-deposition or complete erosion.
Figure 13.
Calculated present-day thermal maturity maps for most of the assigned source rock intervals. (a) Patchawarra Fm. (b) Murteree Sh. (c) Epsilon Fm. (d) Roseneath Sh. (e) Toolachee Fm. (f) Birkhead Fm. (g) Westbourne Fm. (h) Murta Fm. White areas indicate non-deposition or complete erosion.


Figure 14.
Geophysical overview maps of the entire Australian continent and surroundings. (a) Depth to the Moho below Australia (mean Moho elevation, modified after [97] (displayed with permission from Elsevier); CB = Cooper Basin, EB = Eromanga Basin. Please refer to original publication for other abbreviations). (b) Zoom into the study area. (c) Gravity anomaly map of Australia (from [98] (via open license by Geoscience Australia), Bouguer onshore, free-air offshore). (d) Zoom into the study area.

Figure 15.
Phases of tectonic evolution and evolution of depocentre activity in the SW domain of the Cooper Basin from Carboniferous to Jurassic (rotated). (a) Initial basin opening. (b) Main phase of basin formation with oblique rifting and establishment of pull-apart structure. (c) Basin inversion and ridge formation. (d) Continuation of pull-apart basin. (e) Compression, wedging of Innamincka Dome, and transition into piggyback basin. (f) Initiation of SSE directed shearing/dragging and opening of Bulloo Lake Basin (BLB). PT = Patchawarra Trough, NT = Nappamerri Trough, TT = Tenappera Trough, WT = Weena Trough, GMI = Gidgealpa-Merrimelia-Innamincka Ridge, R1, R2 = Riedel shears/ridges.

Figure 16.
Large-scale neotectonic features identified in the Cooper subregion in relation to pre-existing structures. (a) Satellite image (Google Earth) with outline of the Cooper Basin. (b) Interpretation of major structural elements inferred from surface morphology, river deviations, and present-day stress field (image was rotated to show resemblance of the present-day geomorphology with the sketches in Figure 15). BLB = Bulloo Lake Basin, CHS = Cooper Hot Spot, PT = Patchawarra Trough, NT = Nappamerri Trough, TT = Tenappera Trough, WT = Weena Trough, GMI = Gidgealpa-Merrimelia-Innamincka Ridge, Mesozoic volcanic province after [29].

Figure 17.
Depocentre migration of the stacked Cooper and Eromanga basins based on layer thickness variations. (a) Crossline through the main depocentres with age of deposition overlay. (b) Crossline through the main depocentres with layer thickness overlay. (c) Inline through the Nappamerri Trough with age of deposition overlay. (d) Inline through the Nappamerri Trough with layer thickness overlay and comparison of accumulated thickness with burial depth. See location of 2D lines in Figure 16. BLS = Big Lake Suite granodiorite, CESZ = Central Eromanga Shear Zone, CHS = Cooper Hot Spot.

Figure 18.
Thermal modelling/calibration scenarios and burial history discussion based on the vitrinite reflectance profile at Burley-2. (a) Overview of compared heat flow trends with vitrinite reflectance calibration points and calculated thermal maturity including constant heat flow scenarios. (b) Best-fit scenario used to calibrate the 3D model. (c) Alternative calibration with additional heat flow peak in the Jurassic. (d) Alternative calibration with additional heat flow peak in the Triassic combined with erosion.


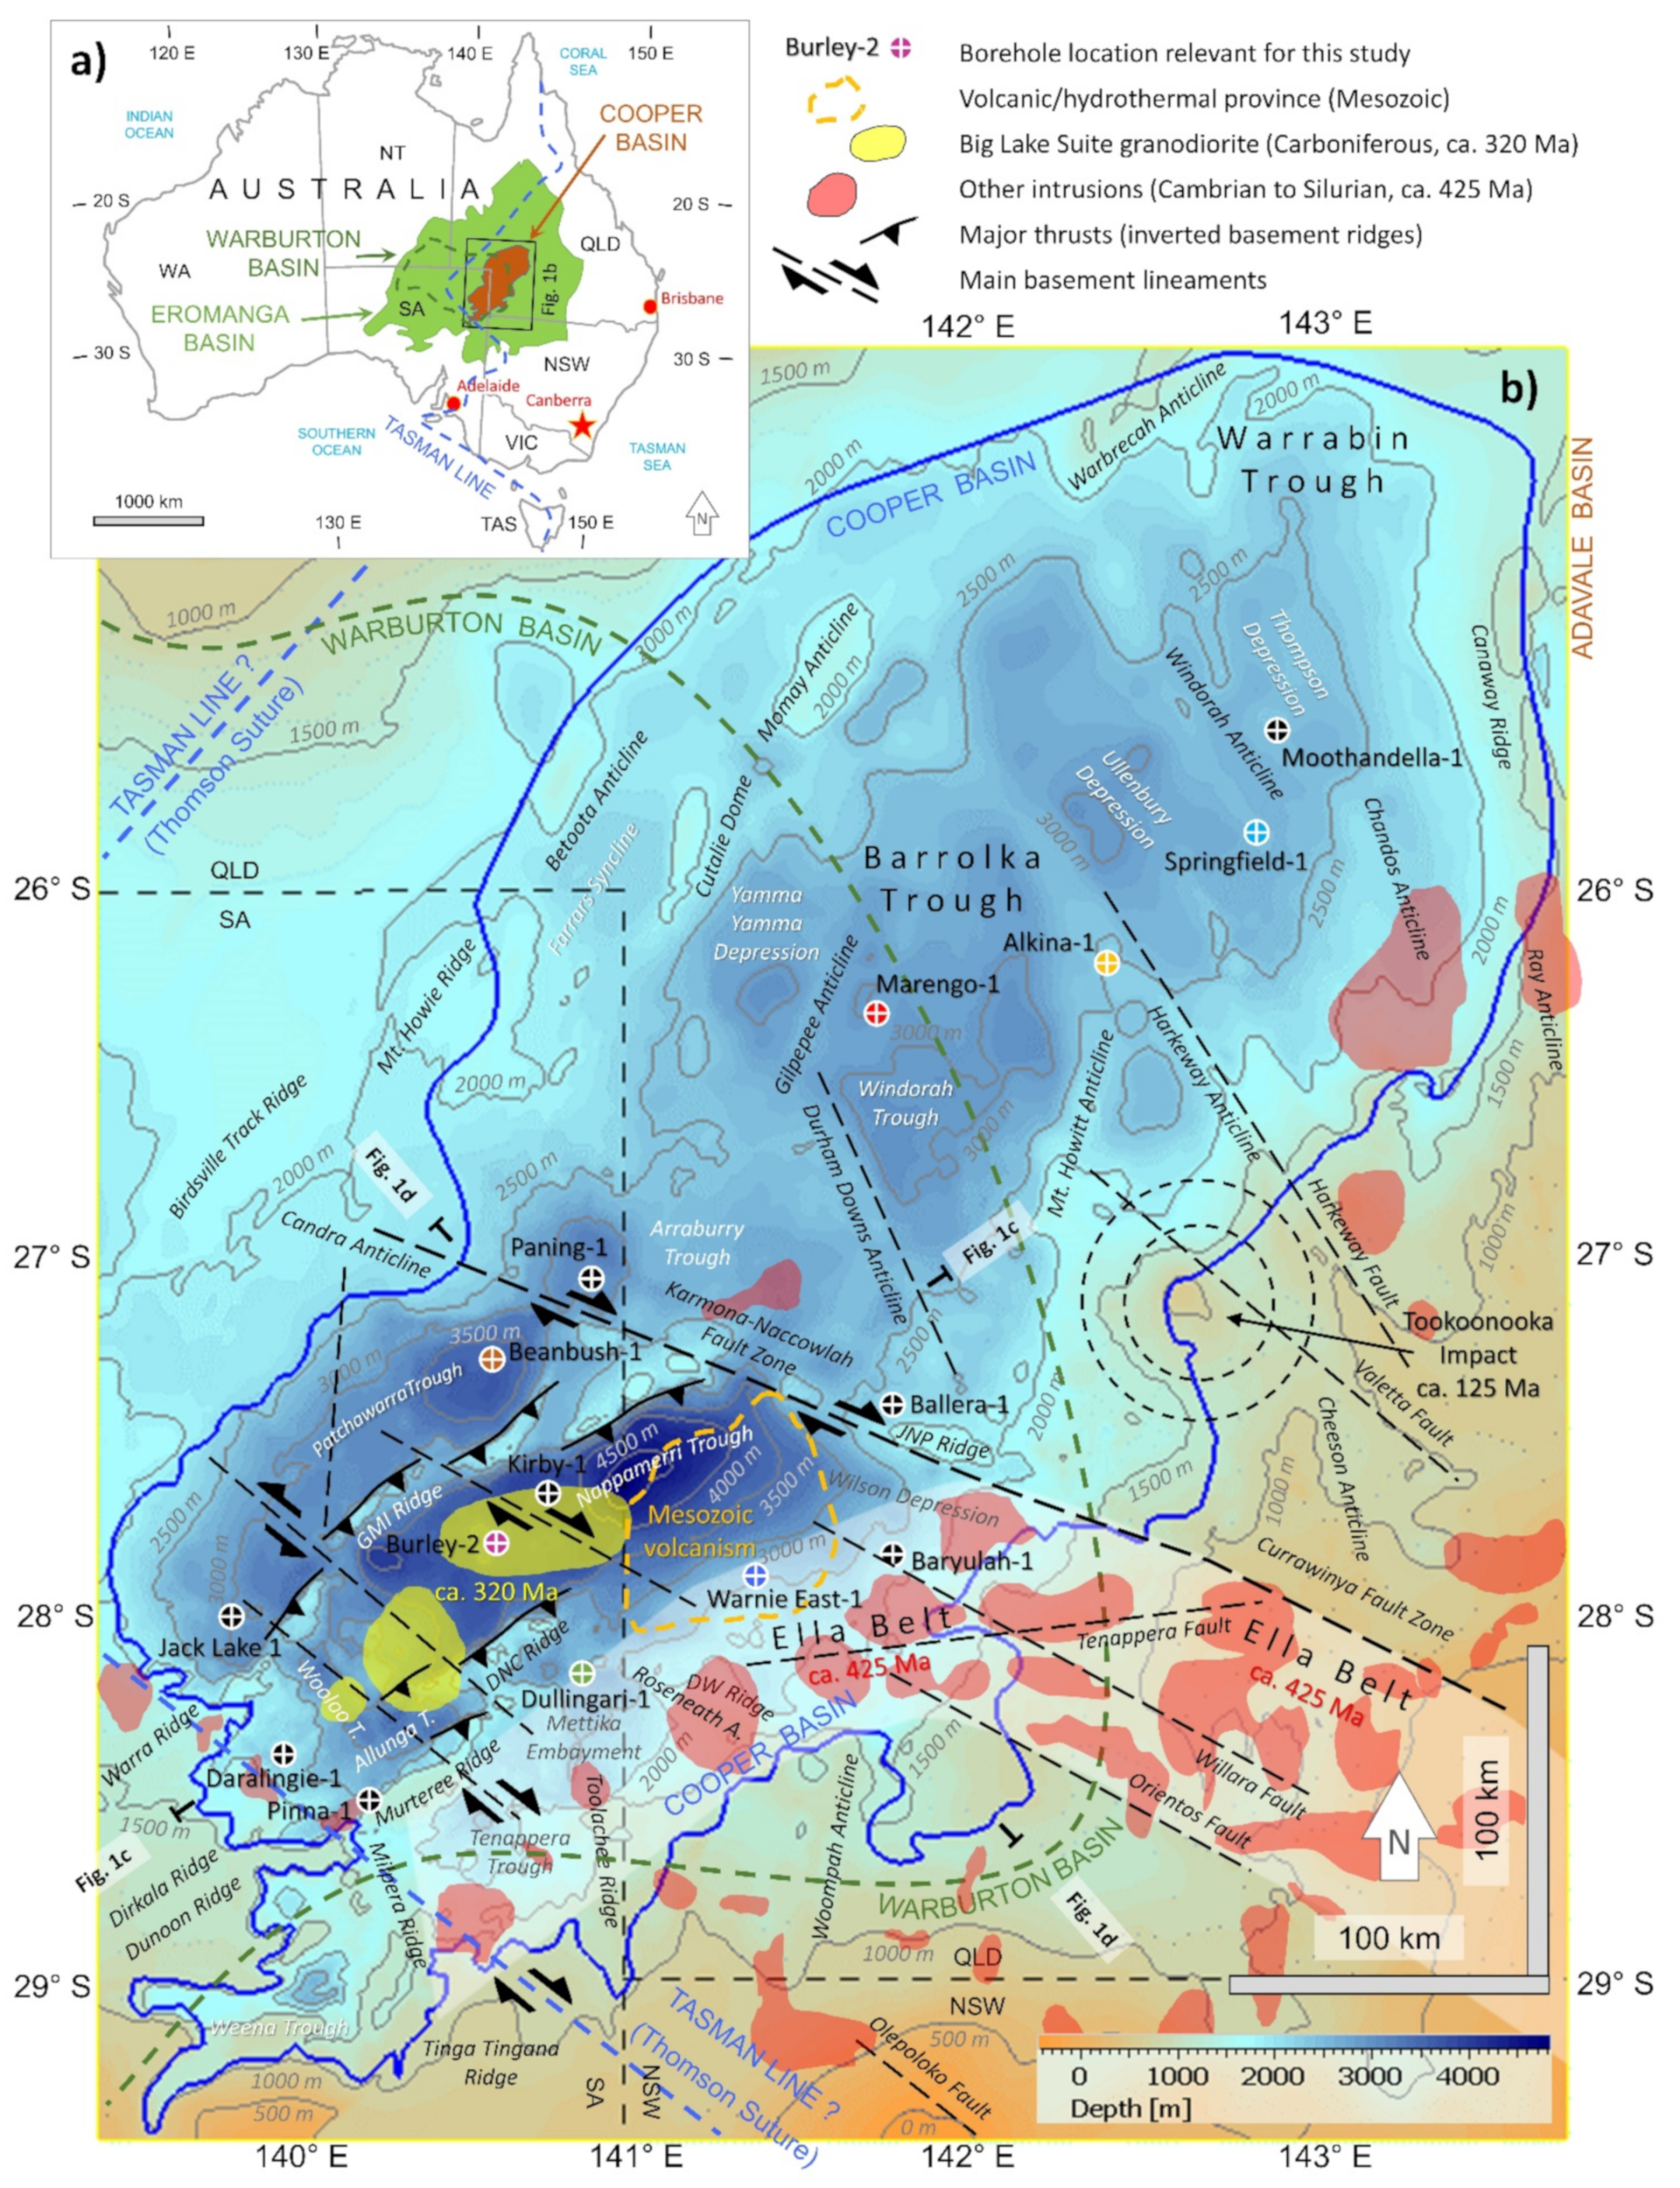
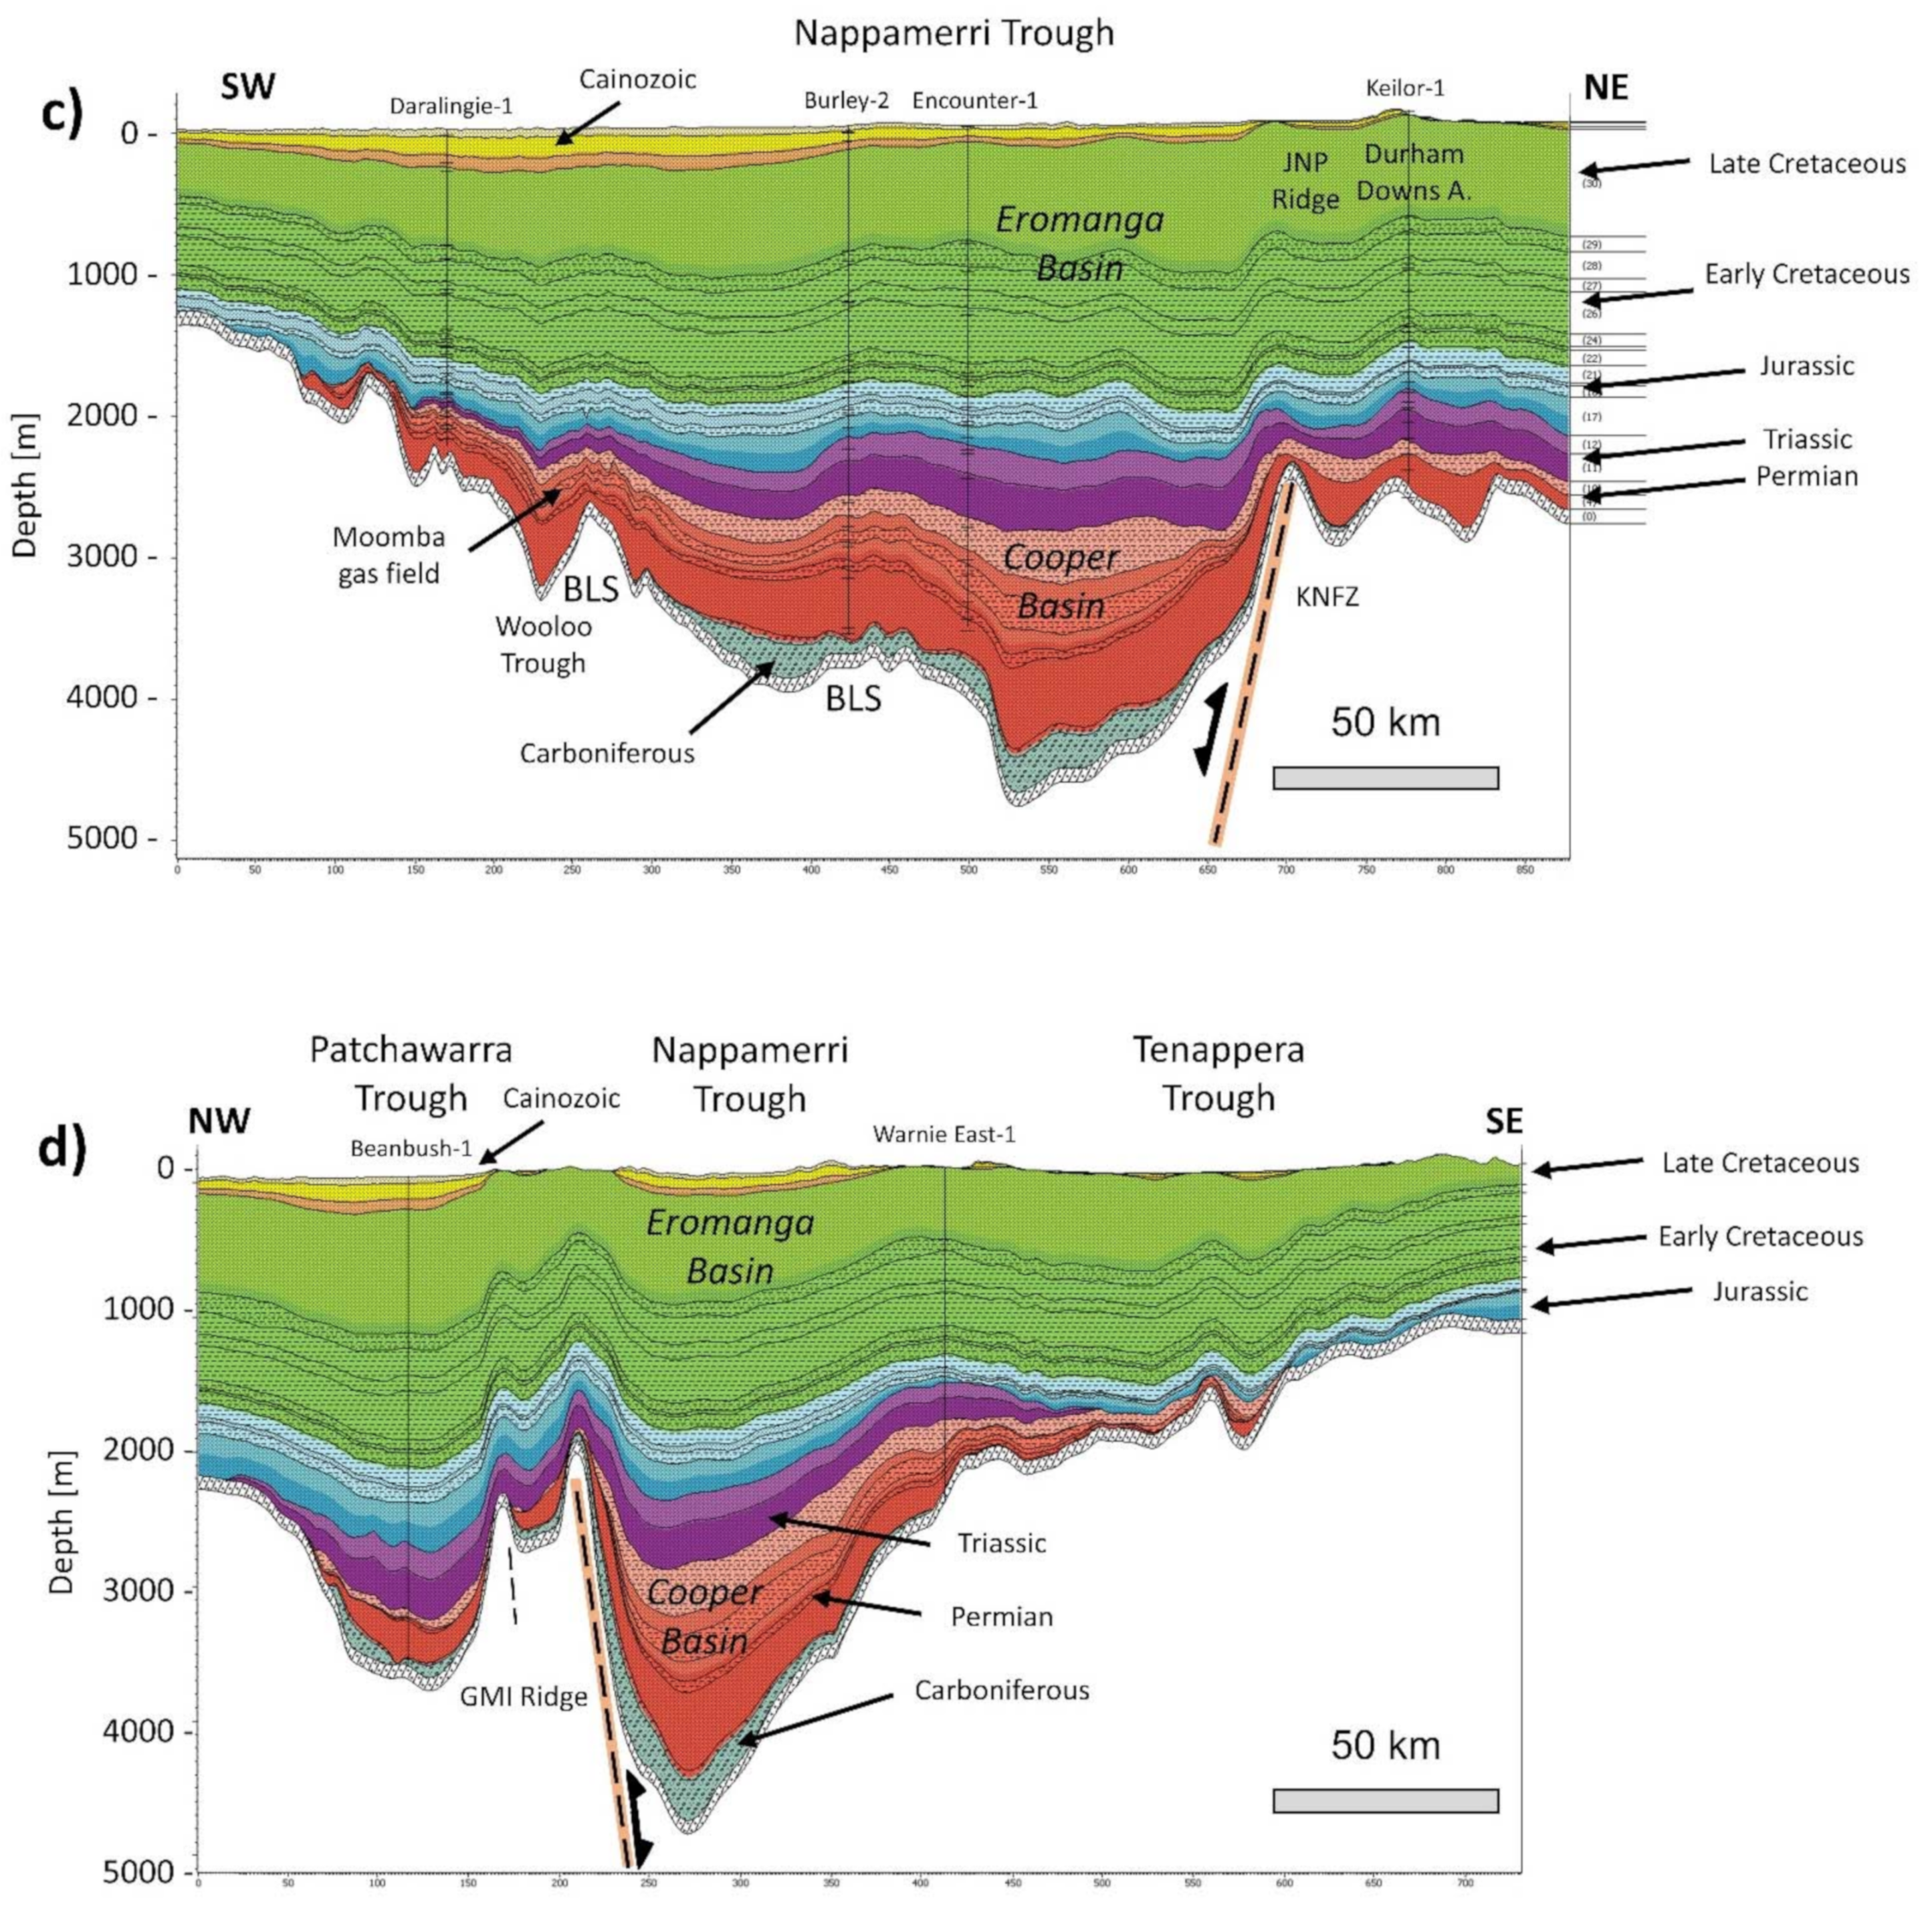
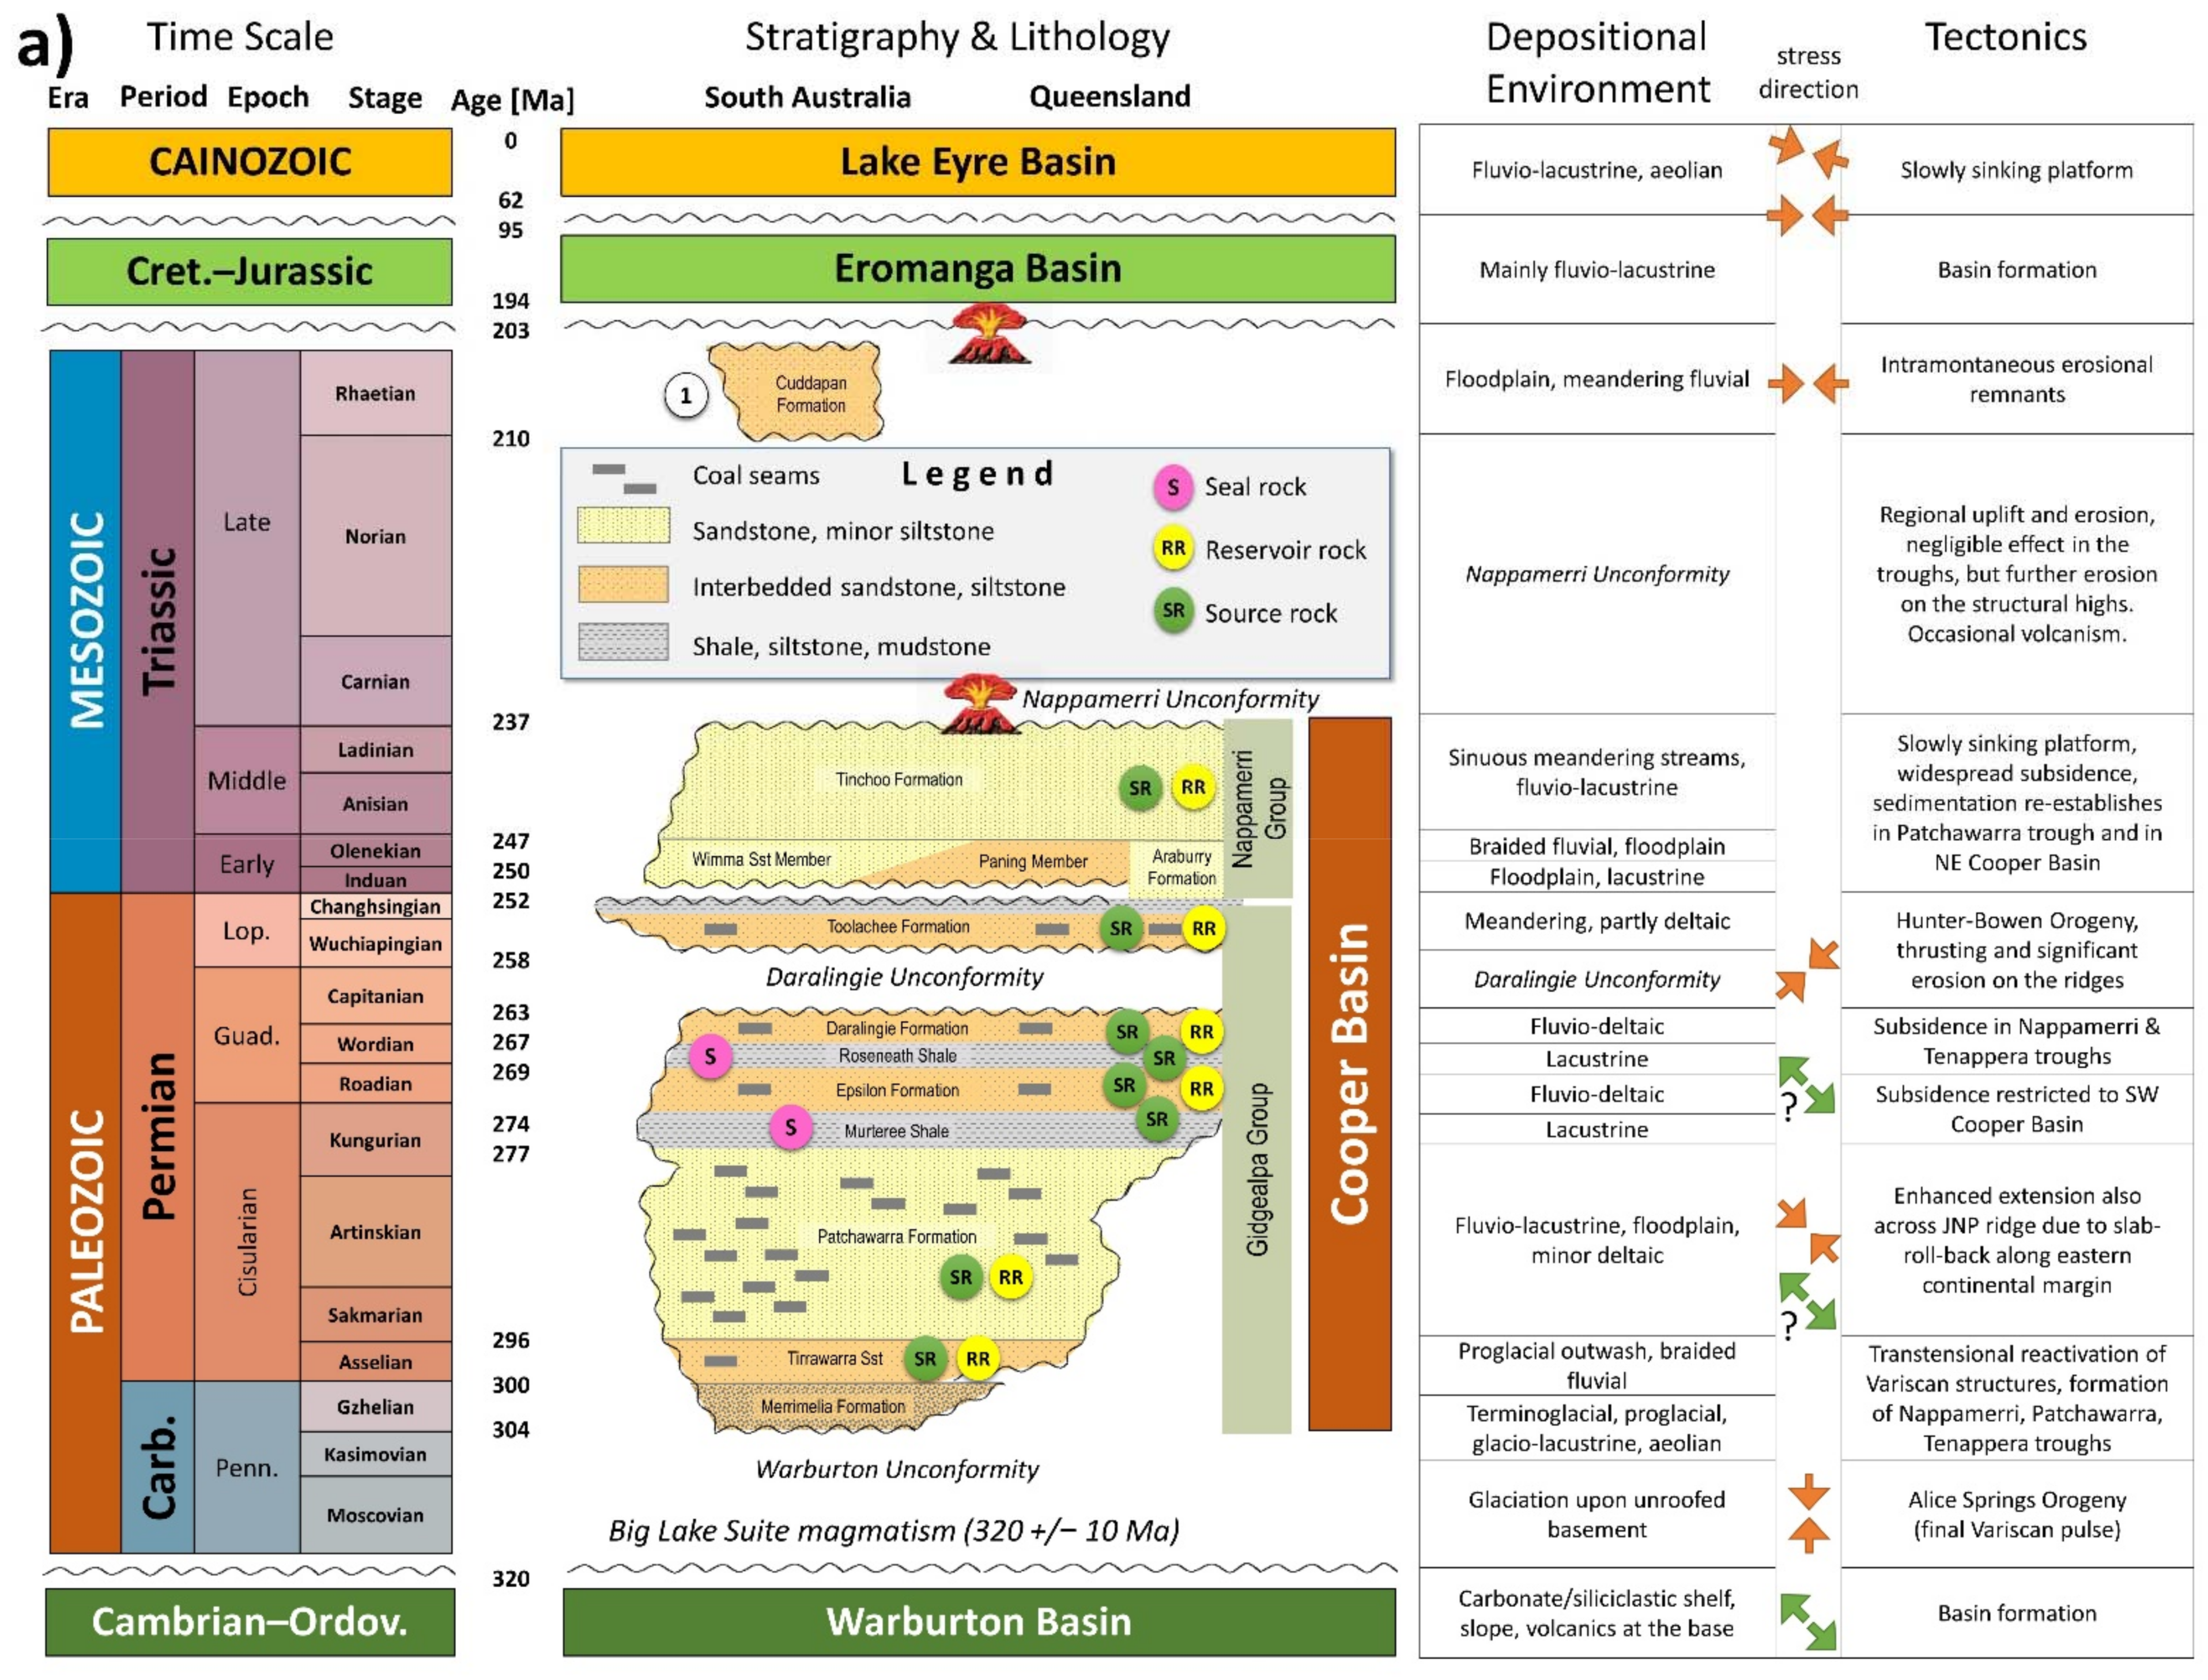
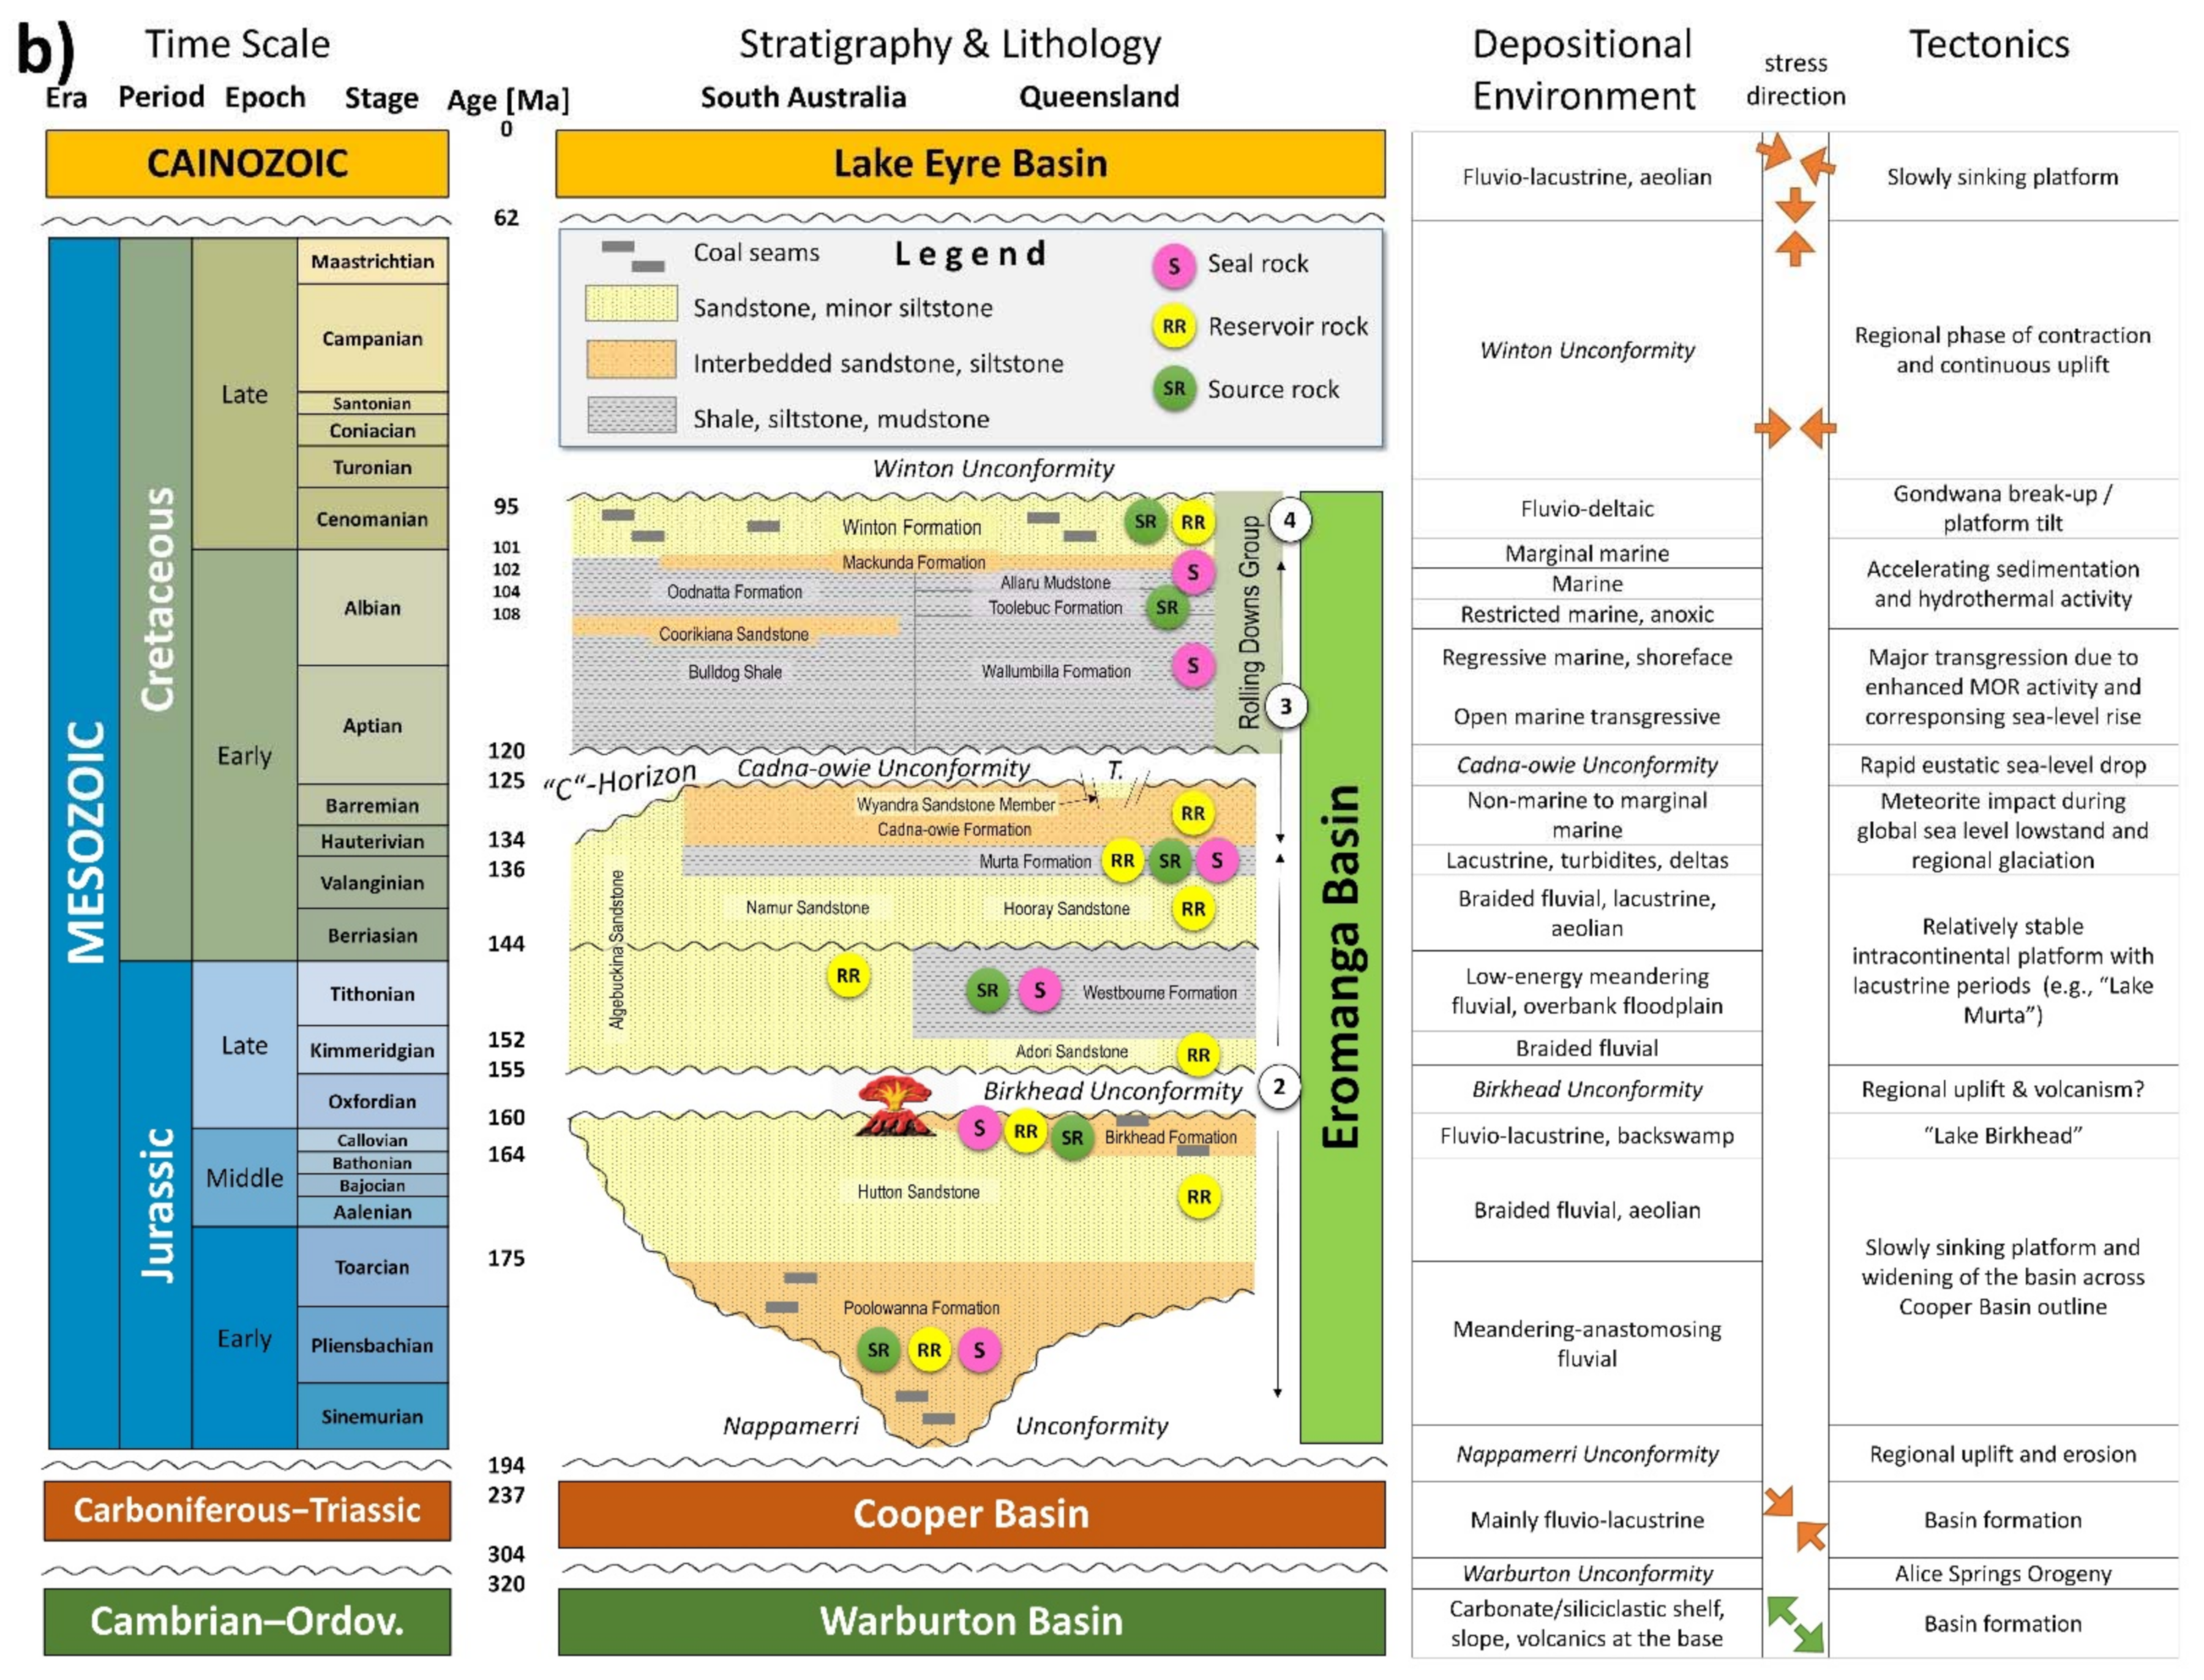
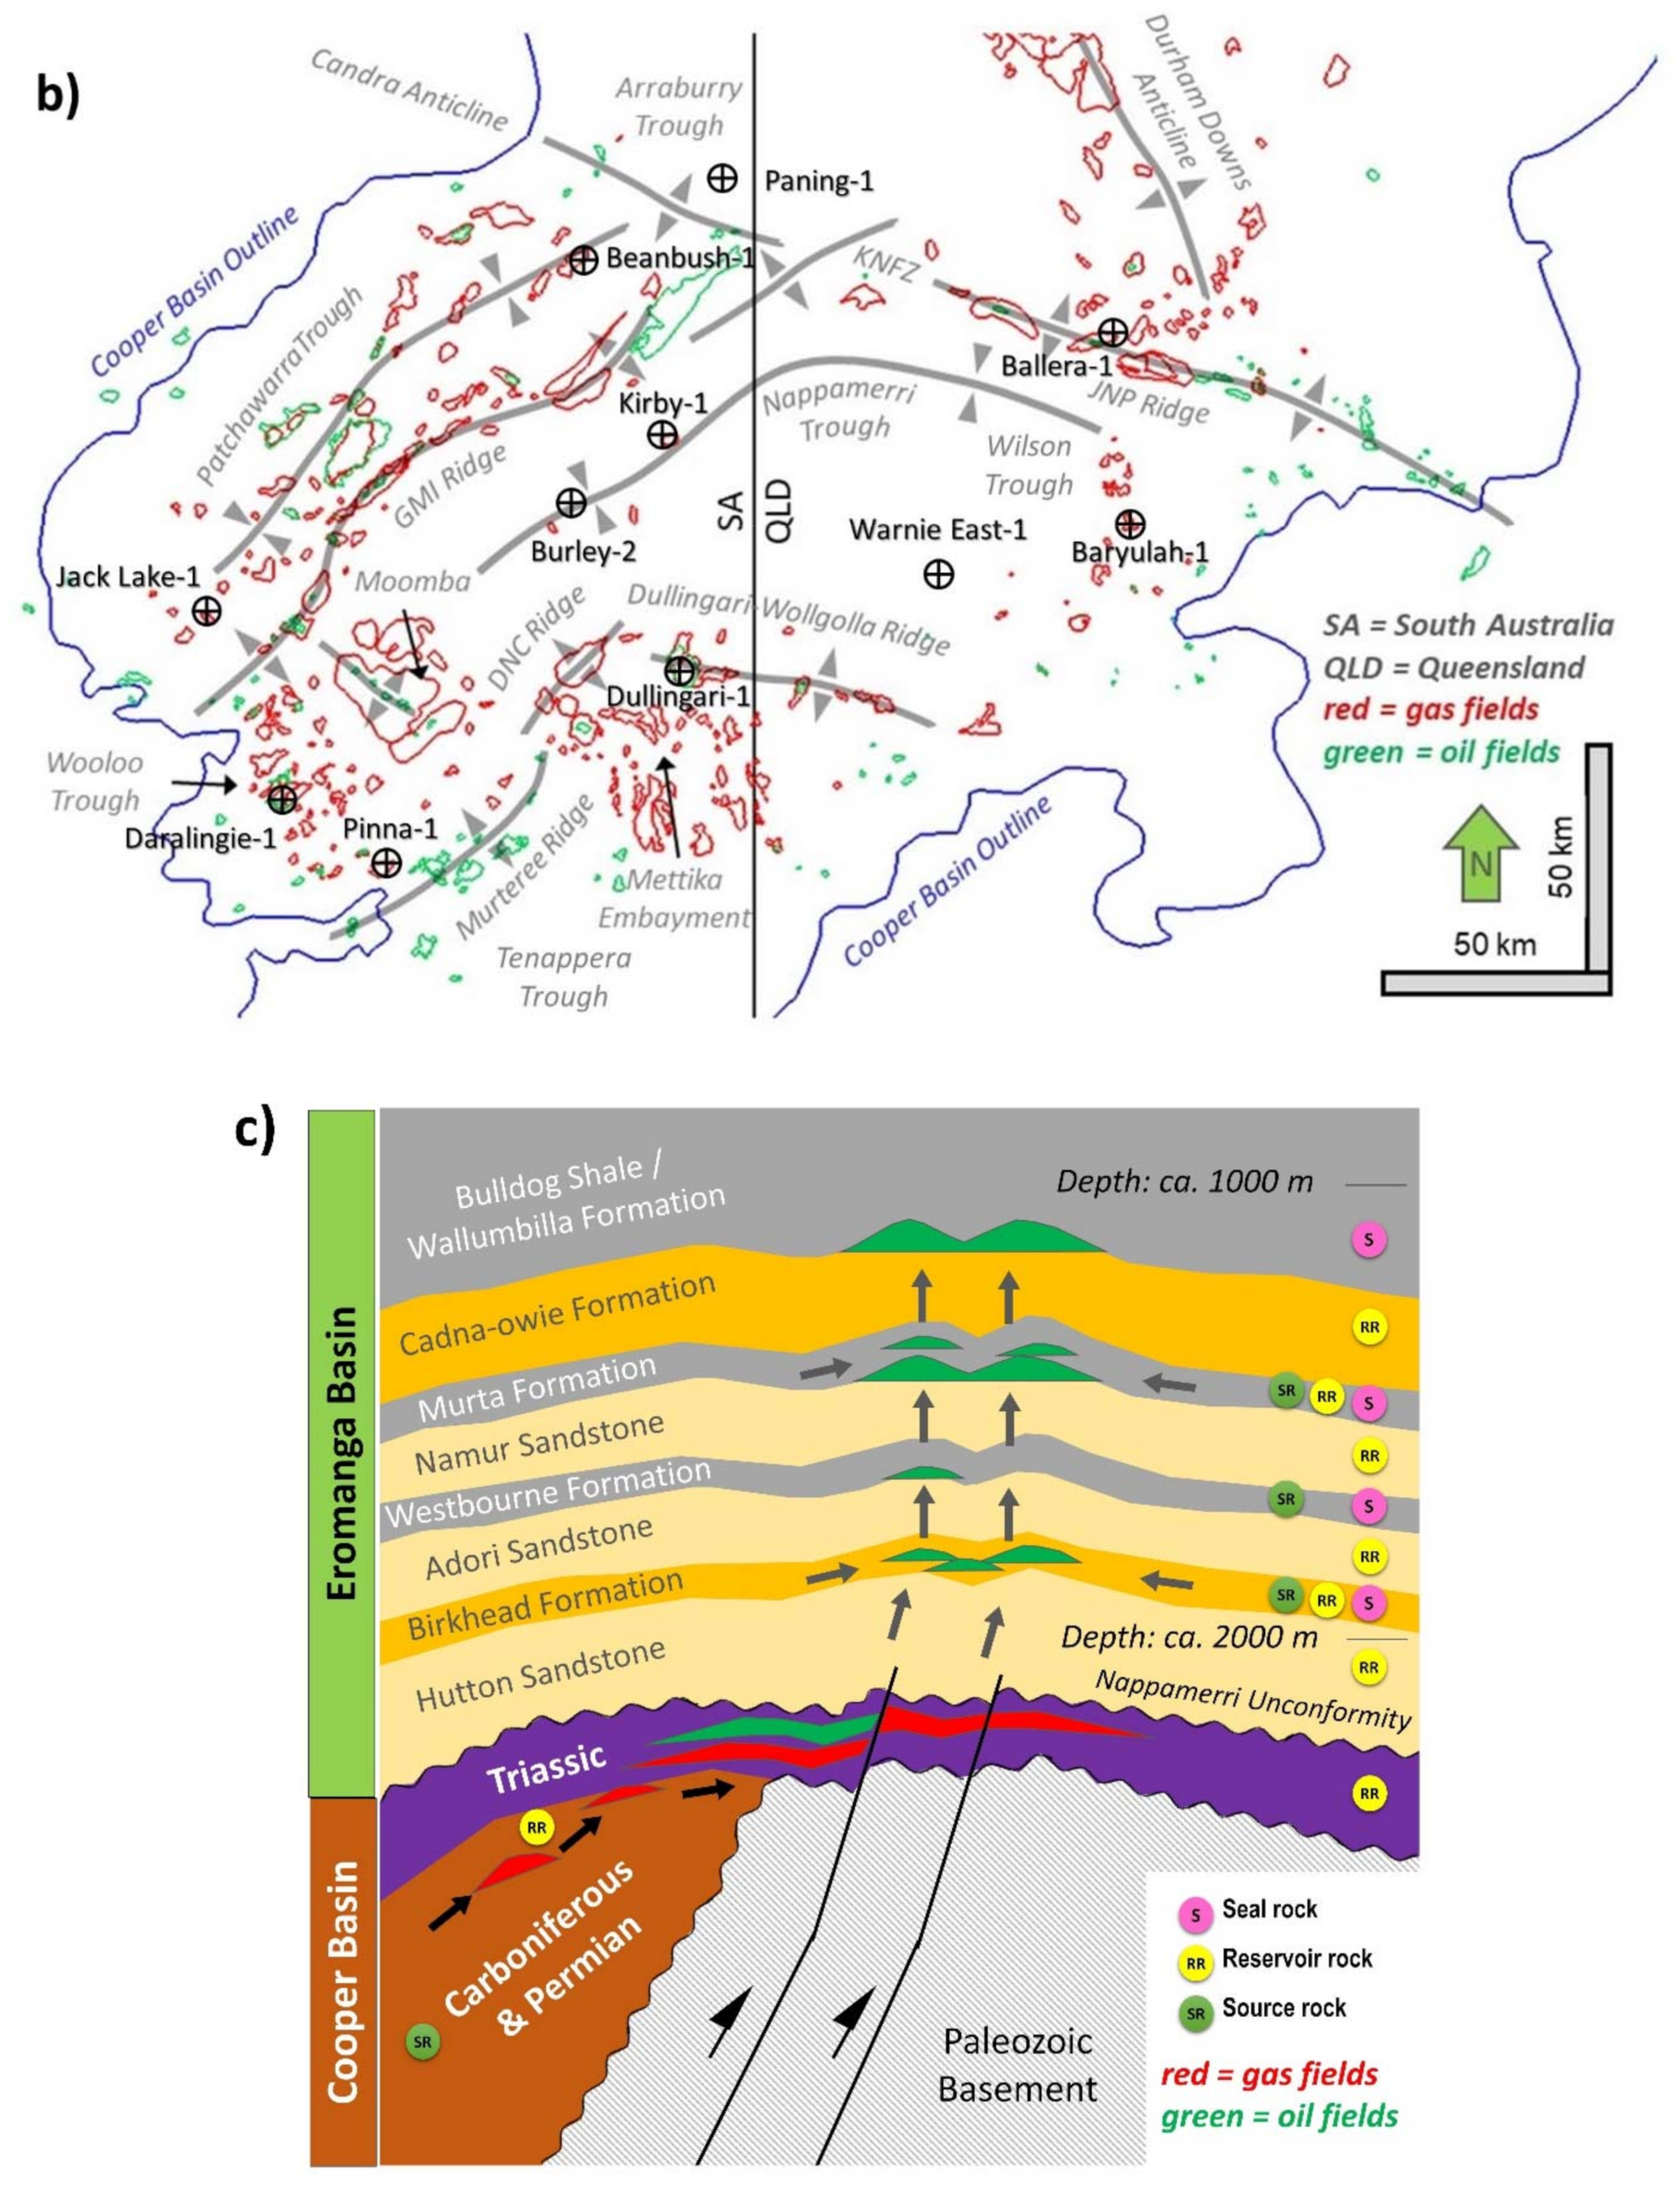
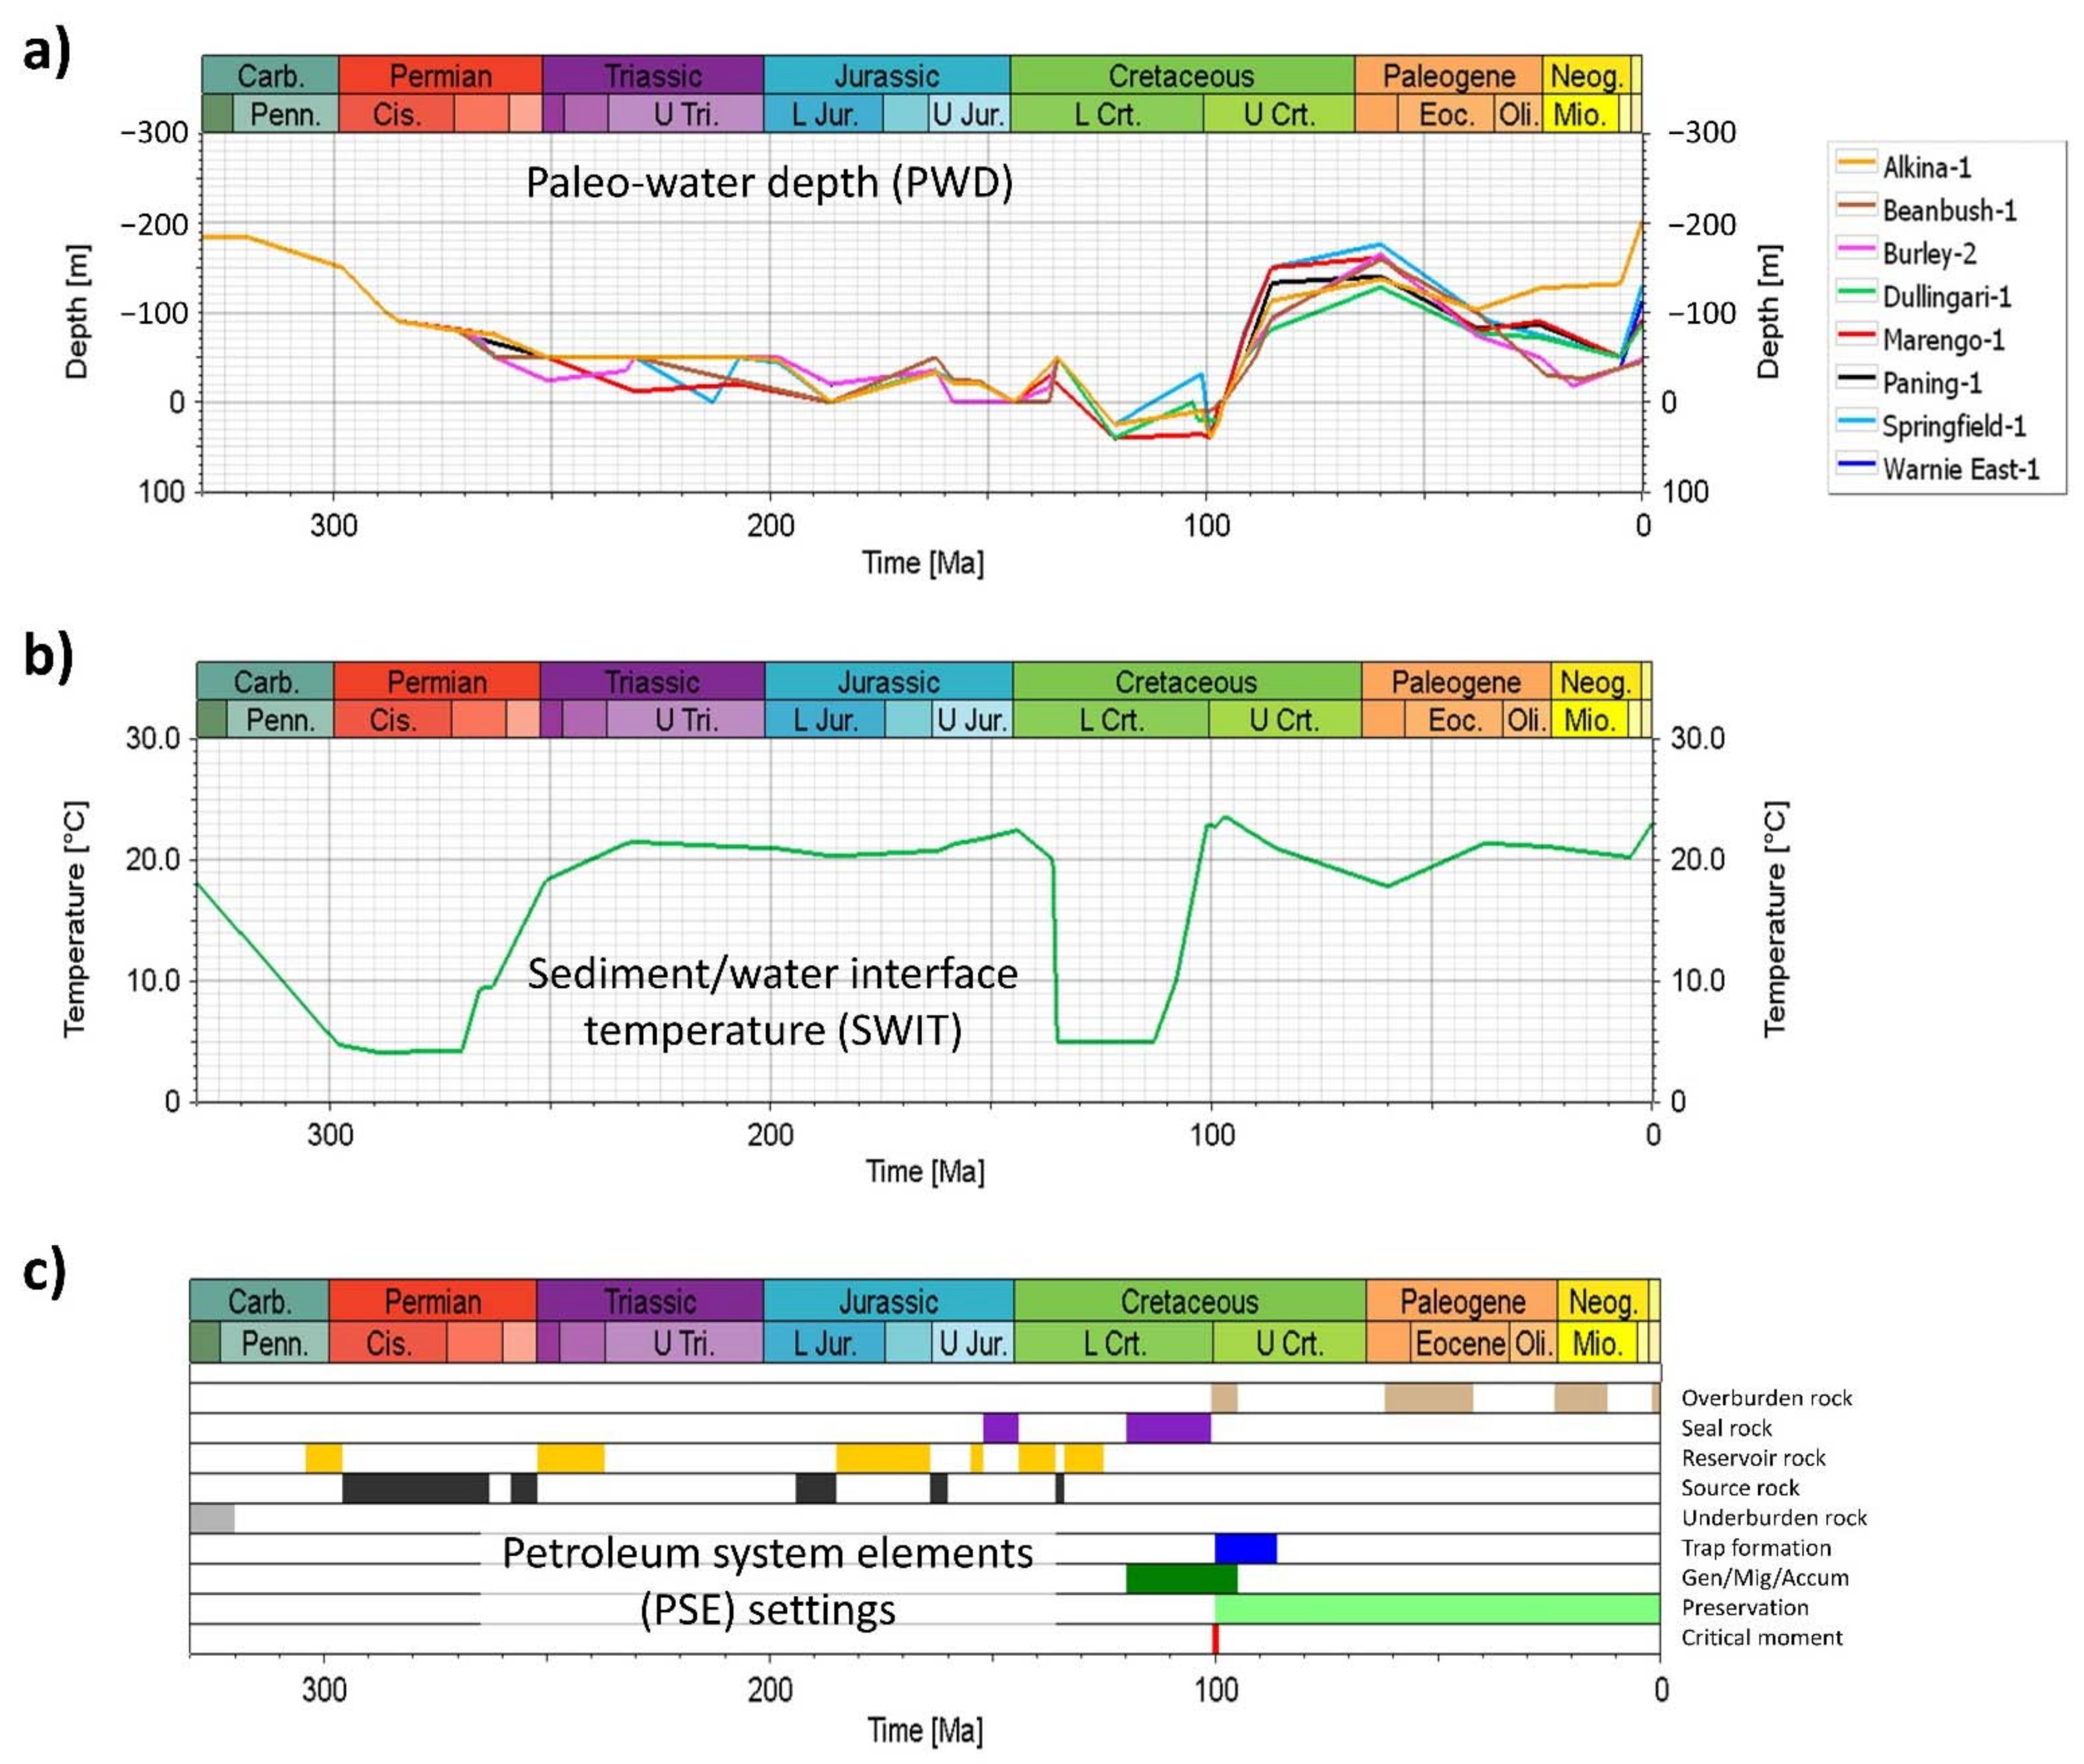
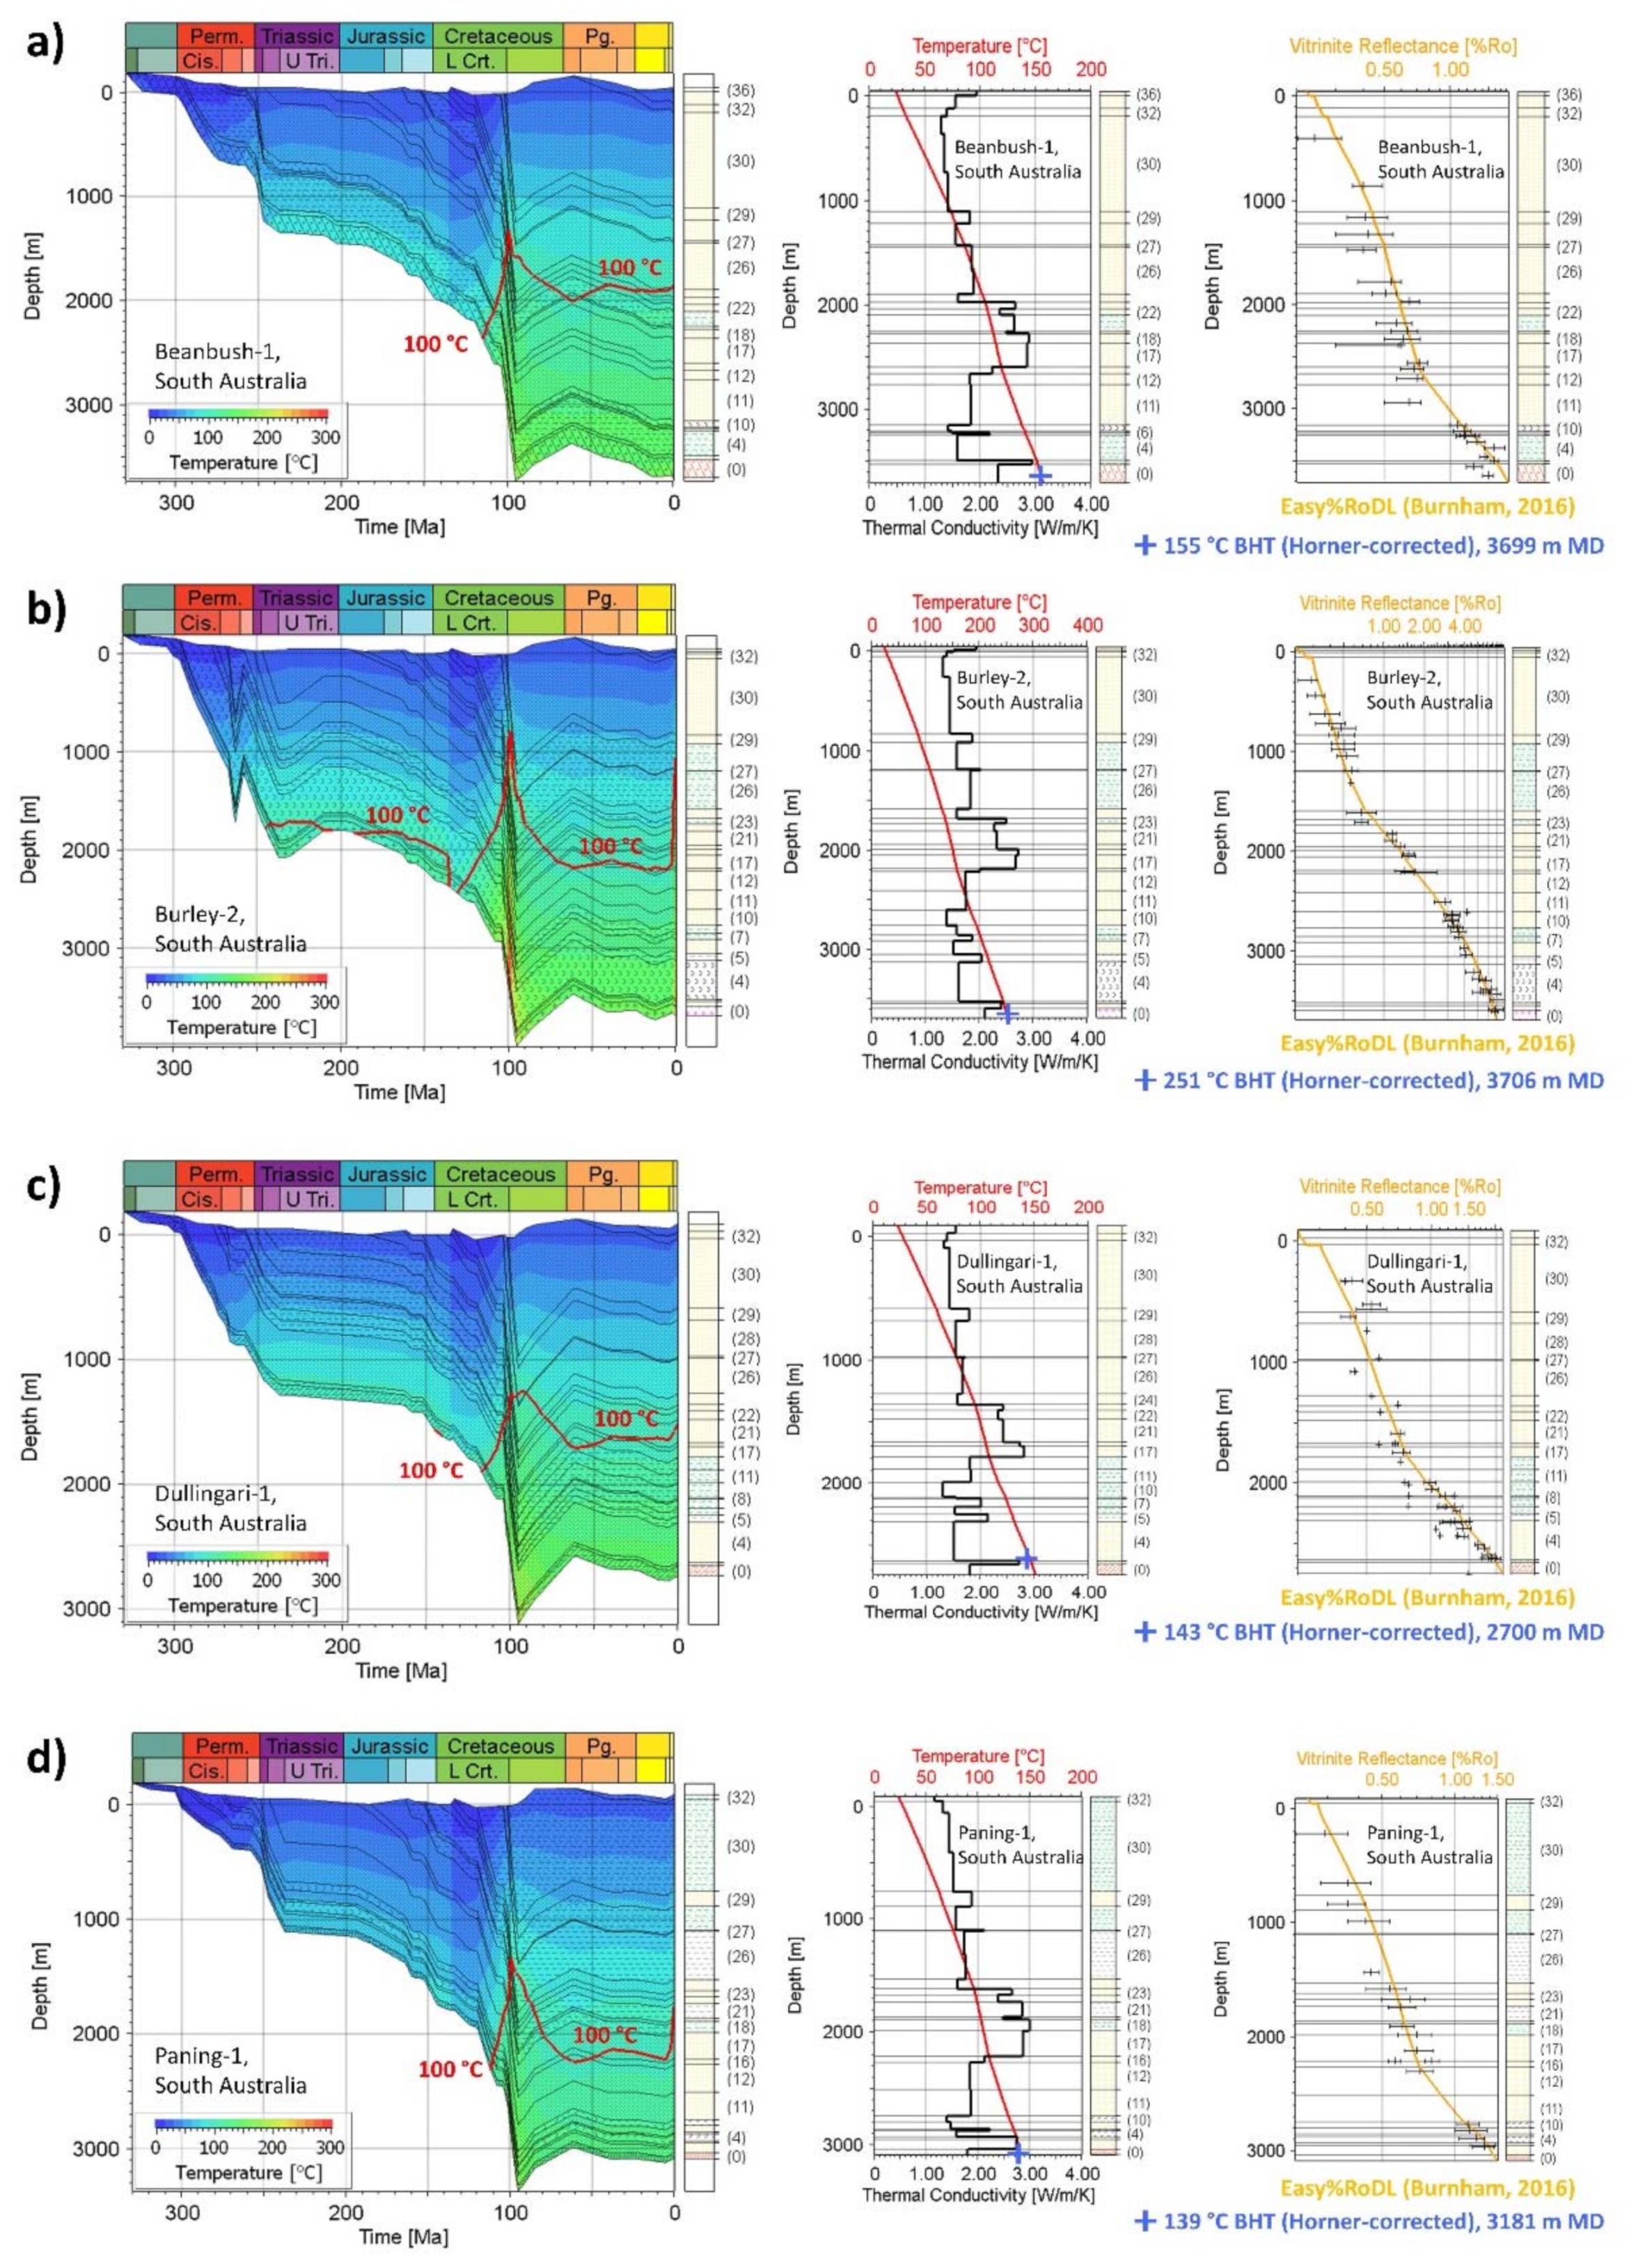
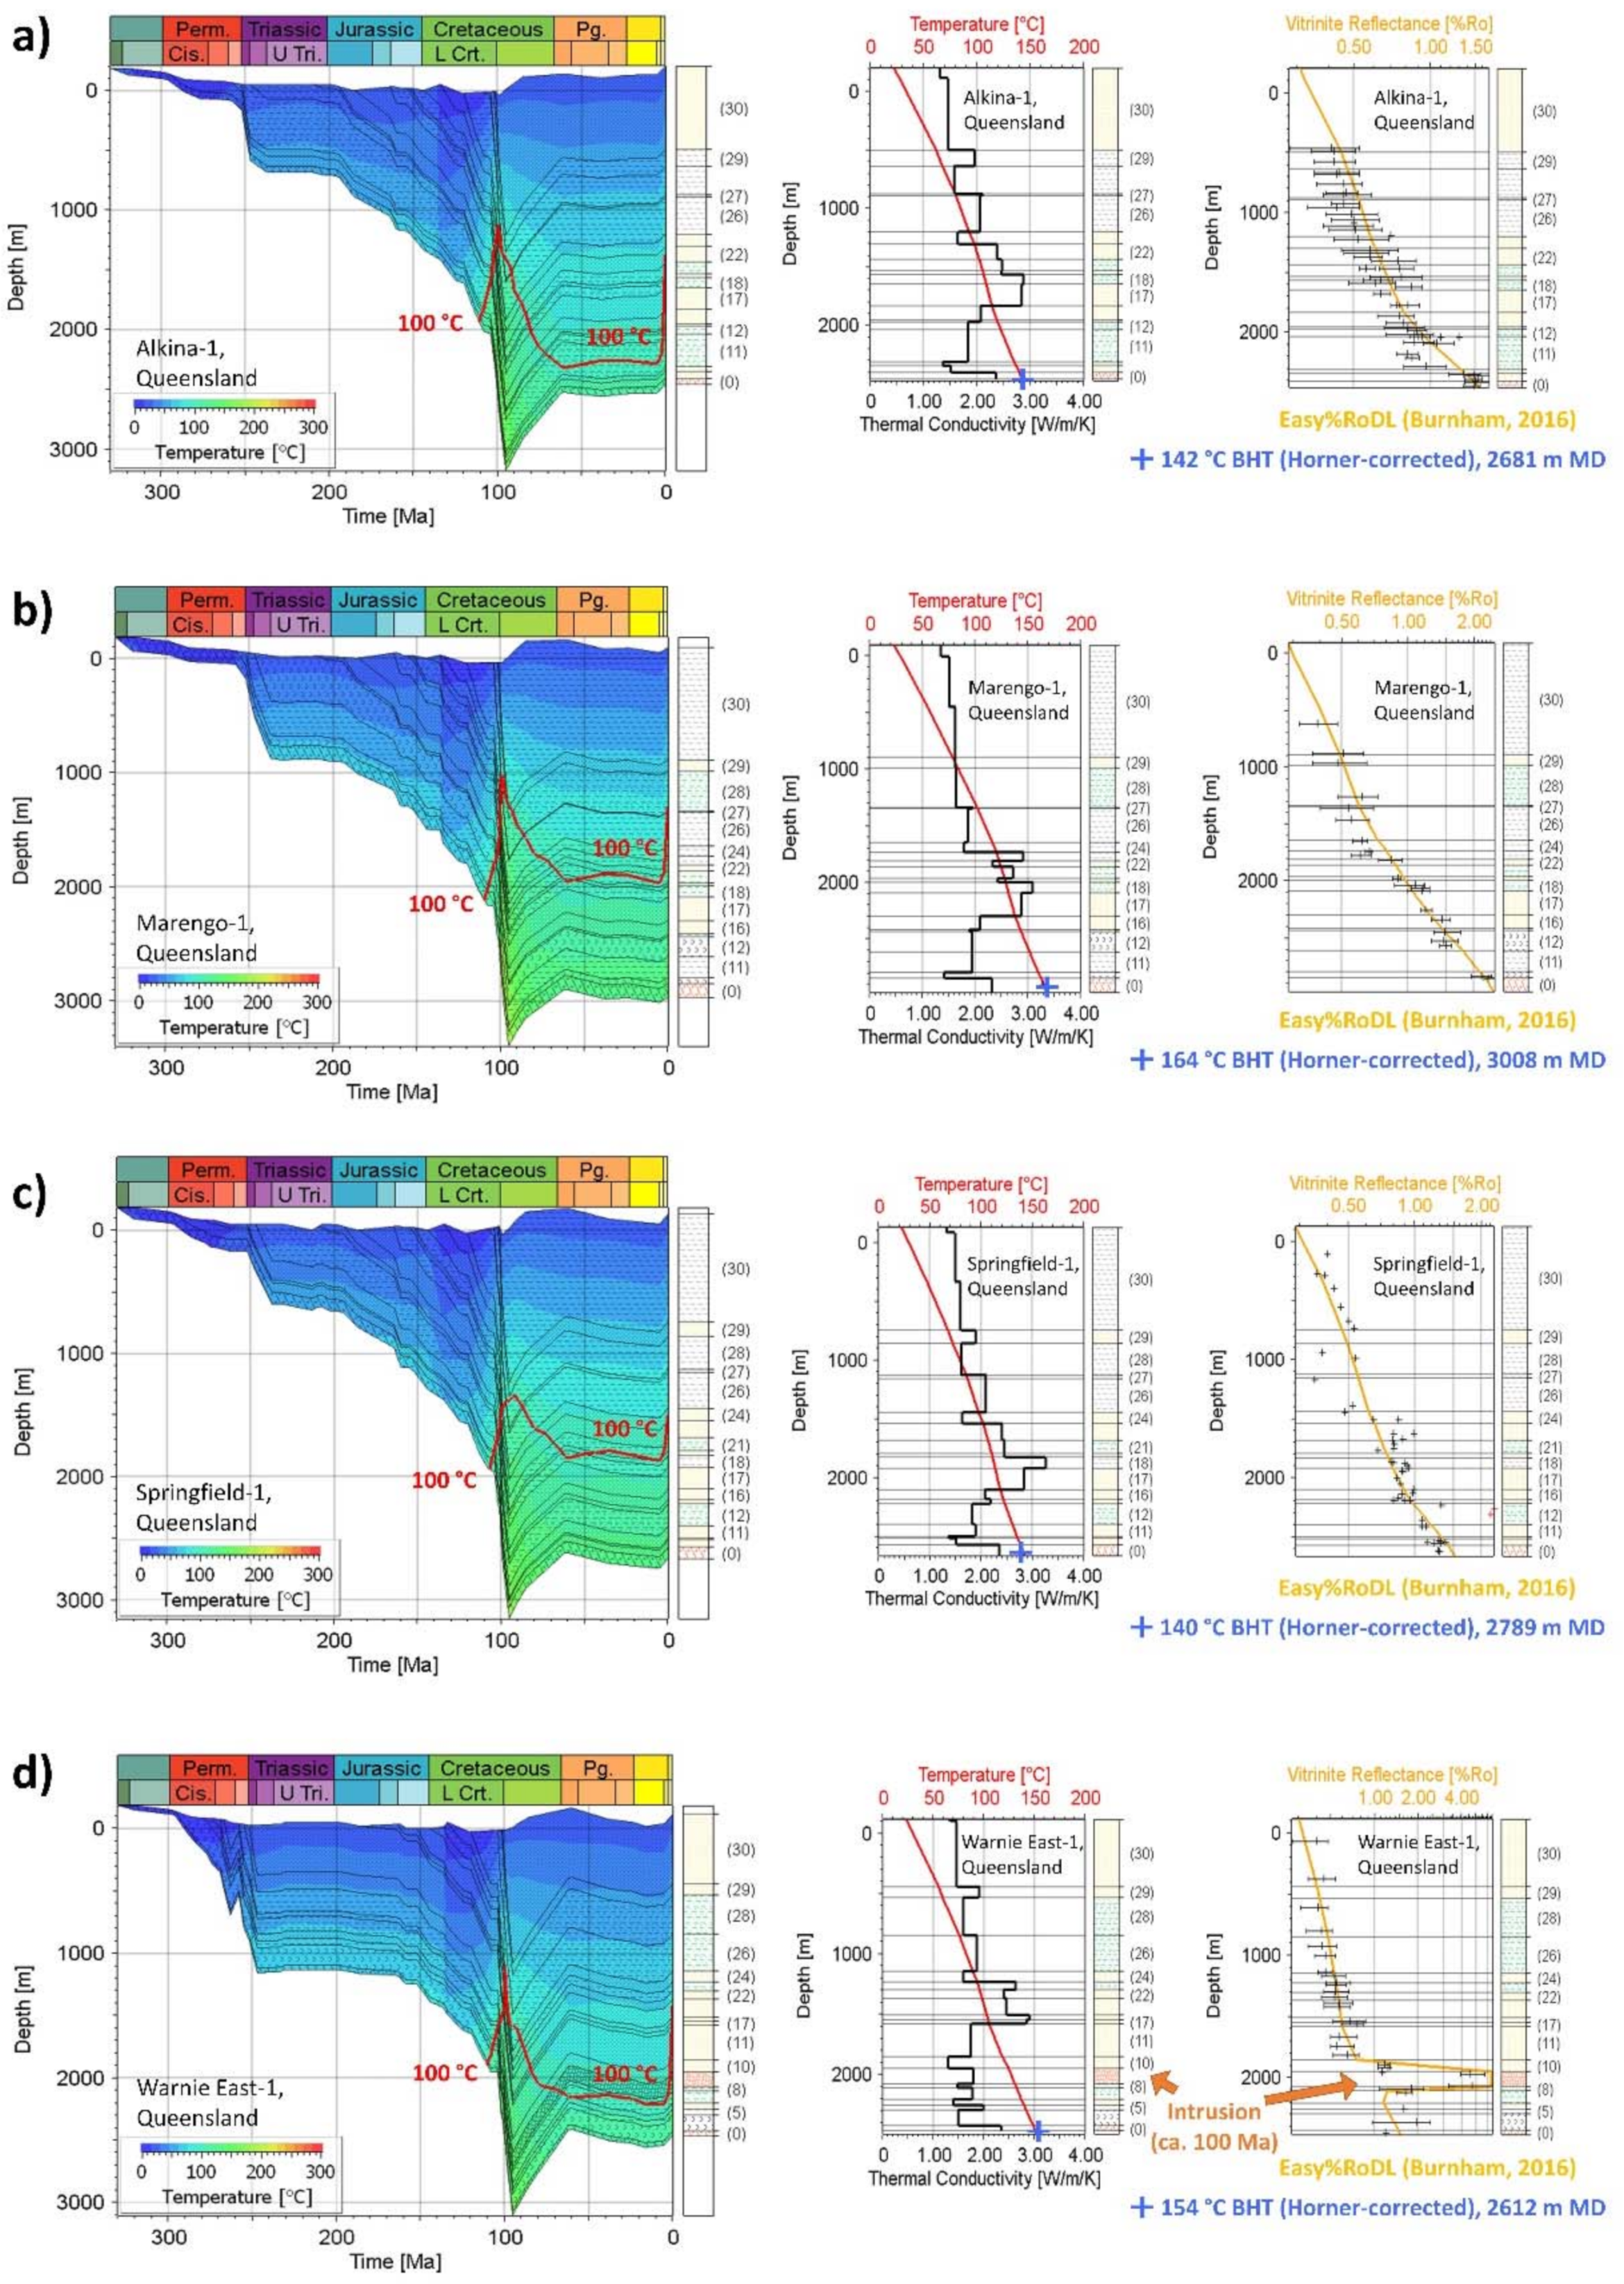
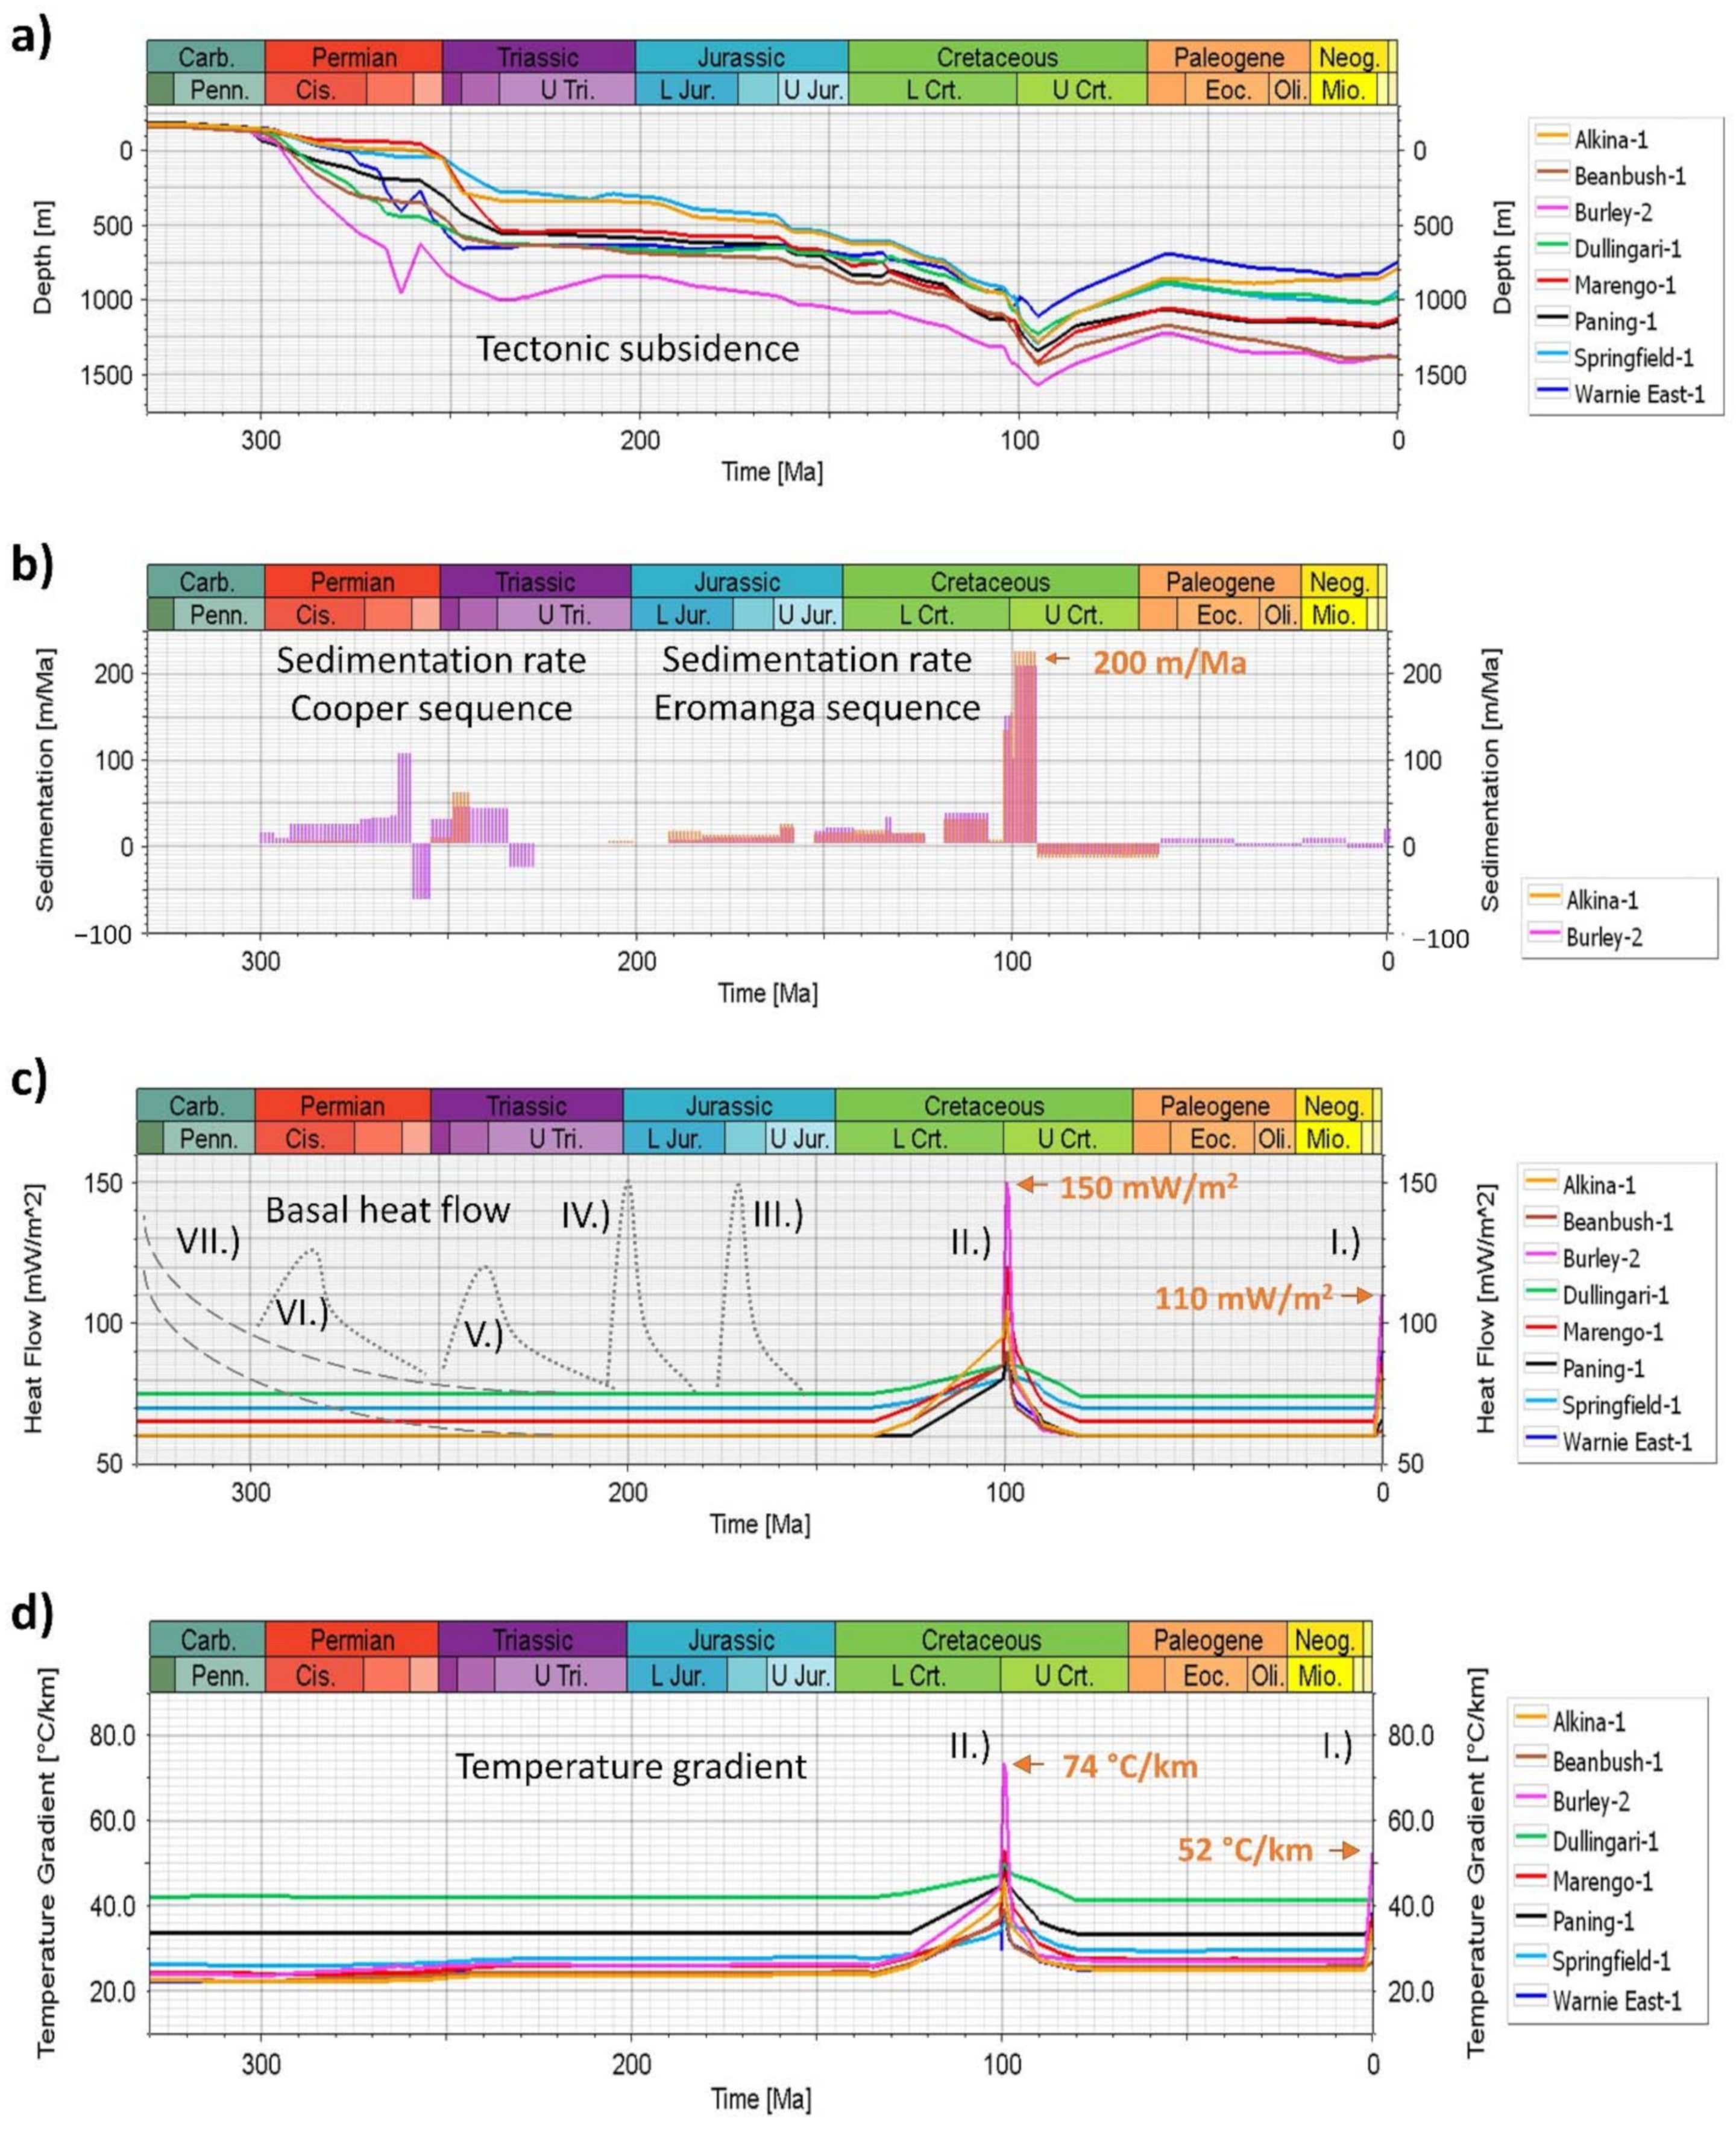
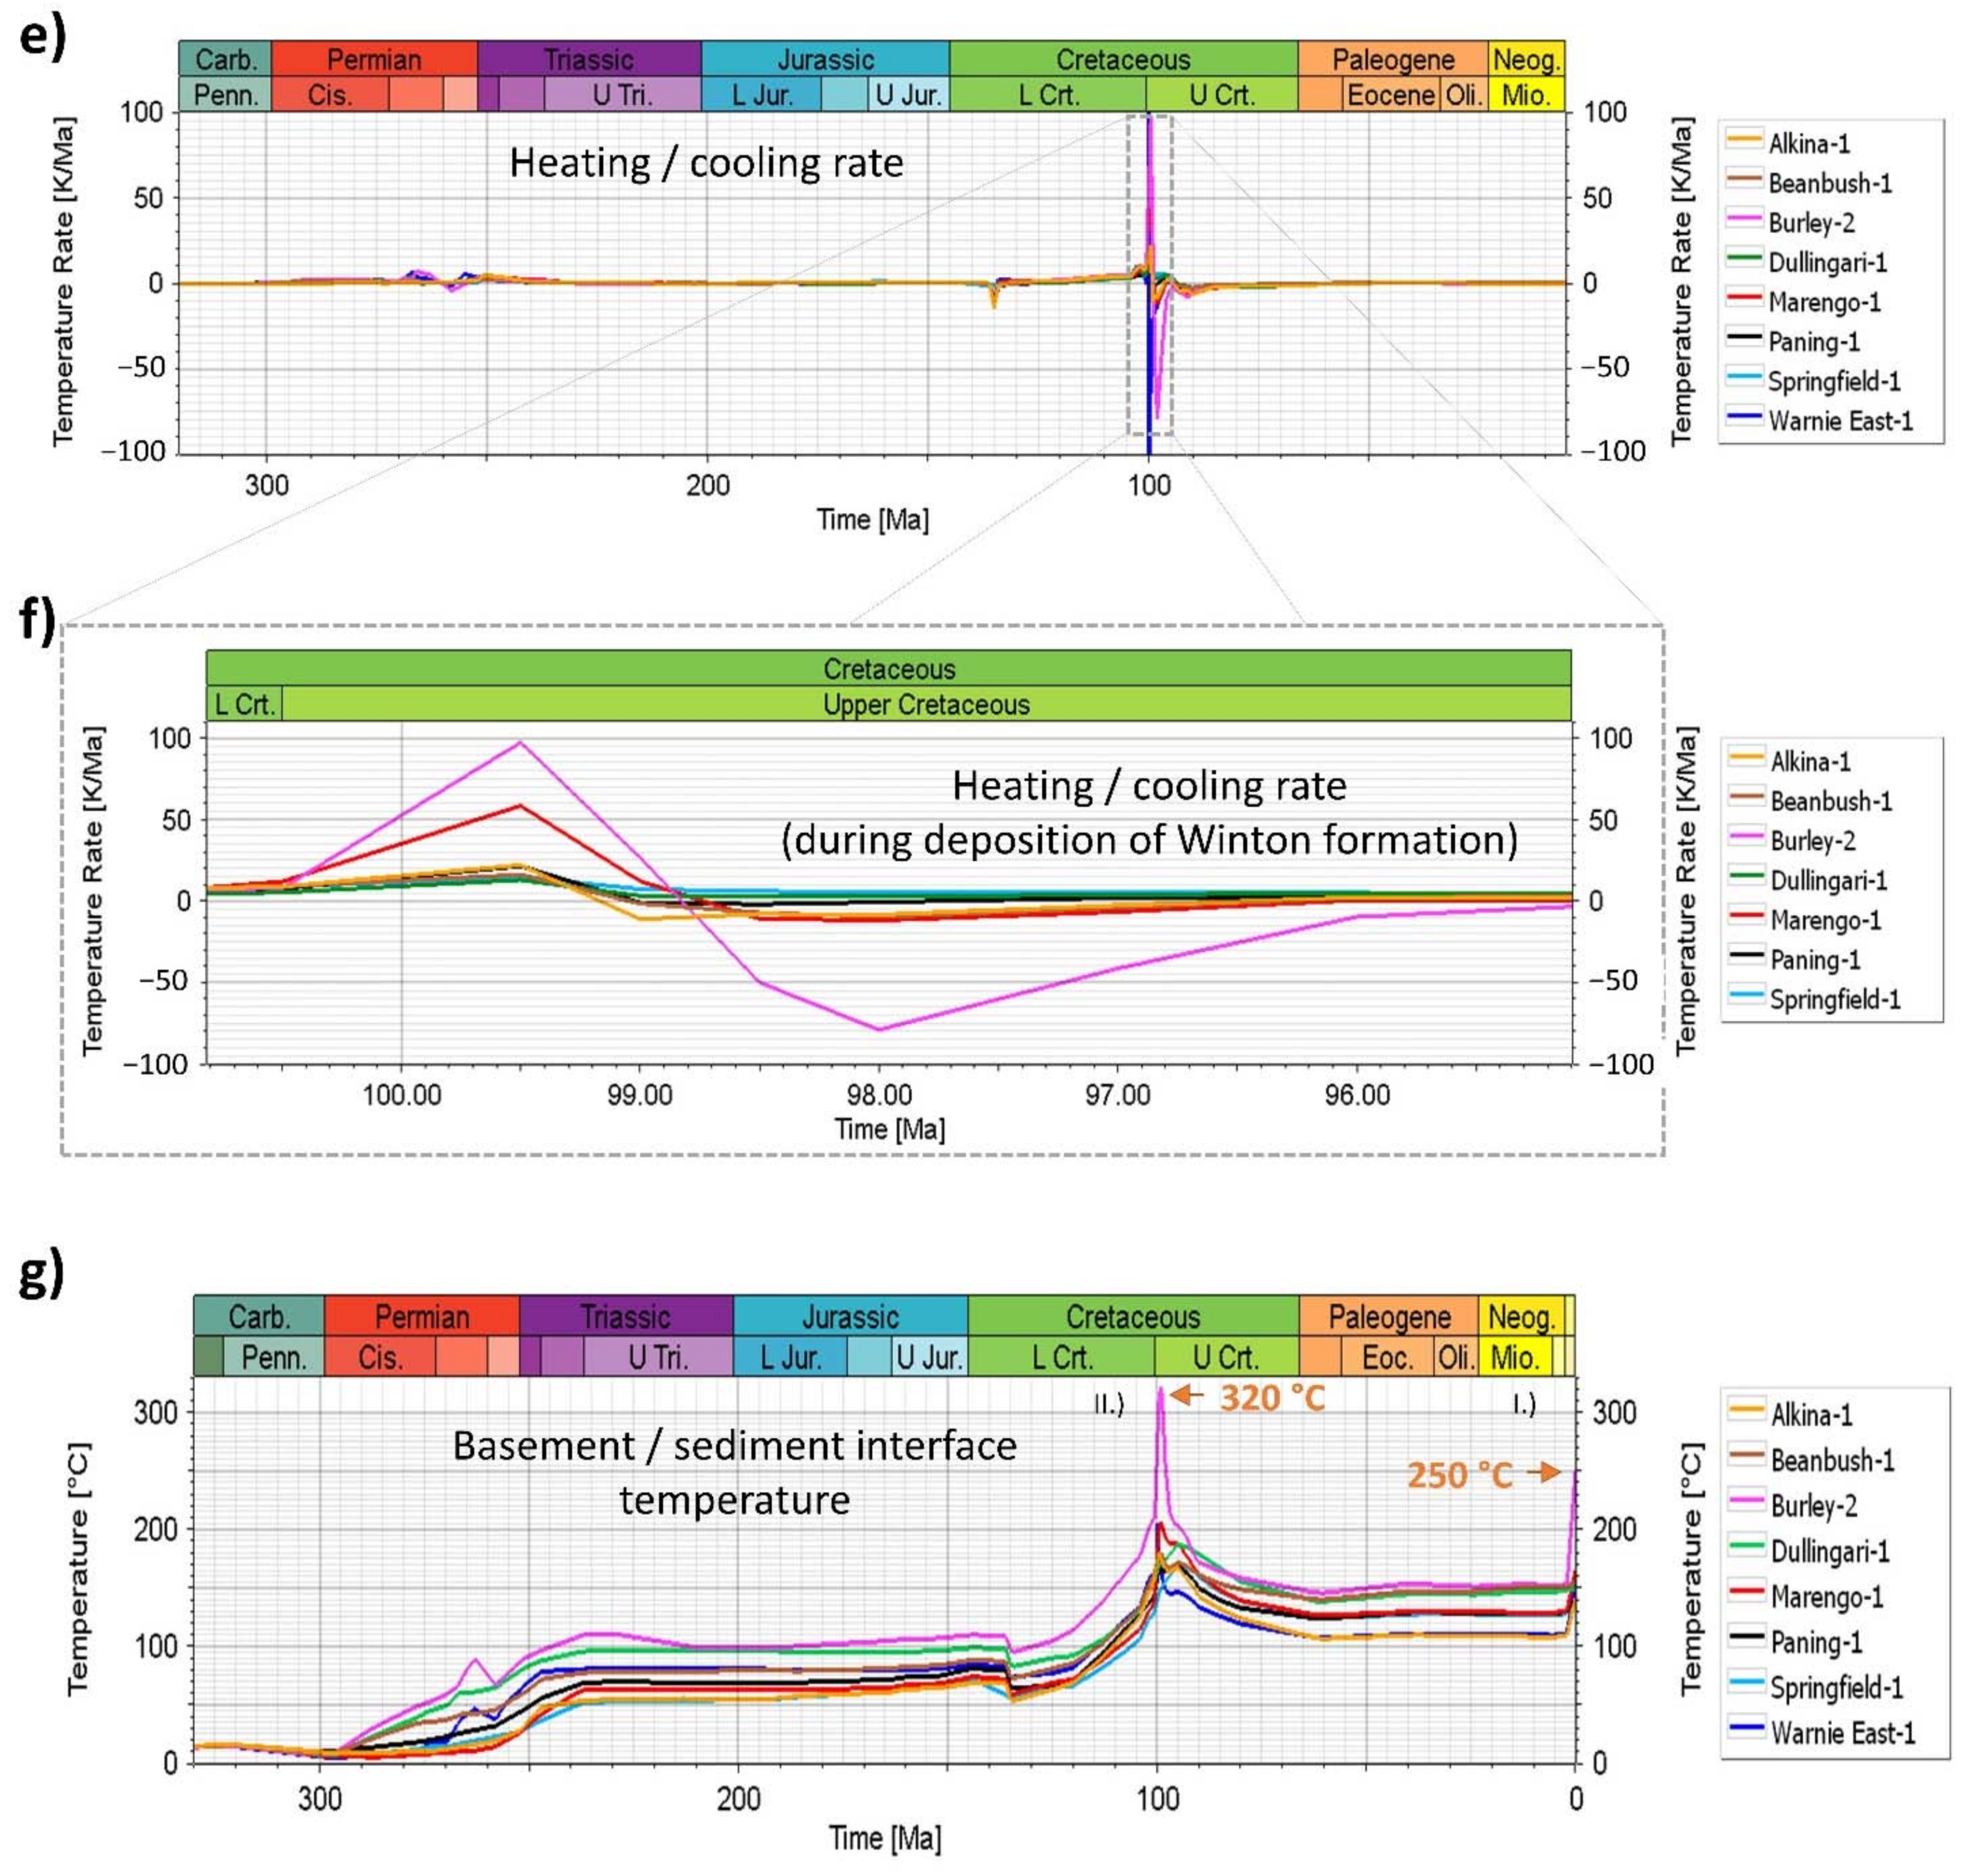
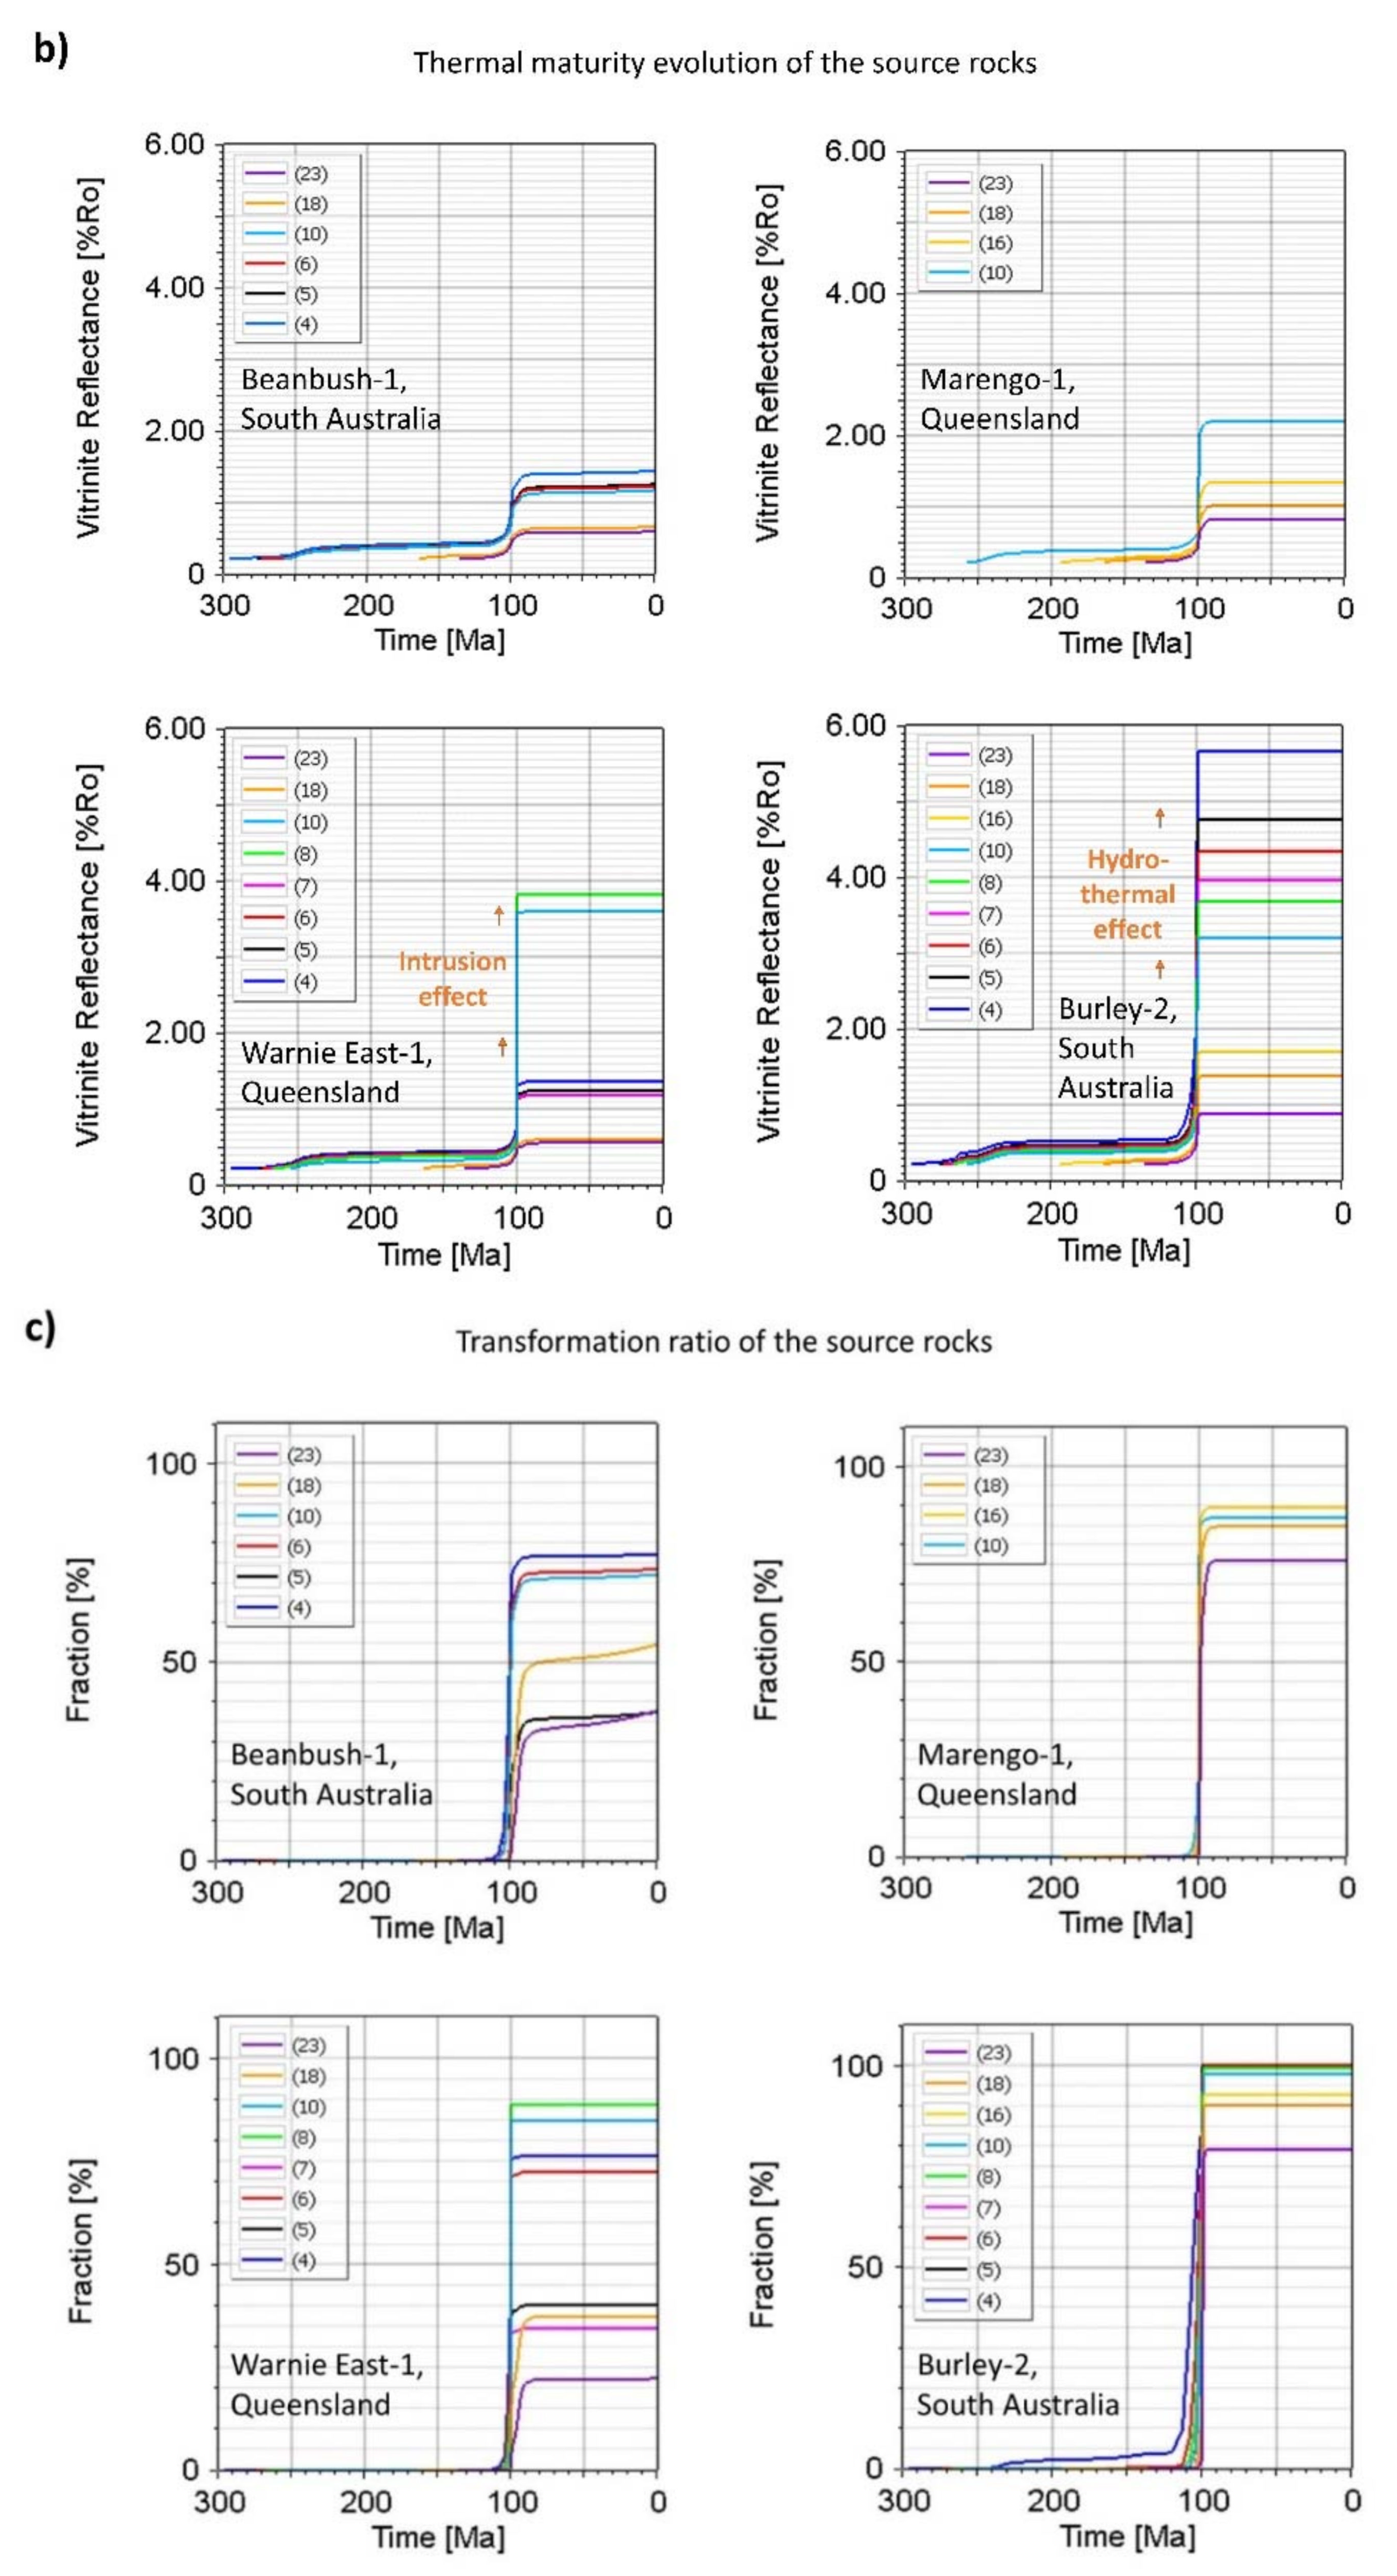
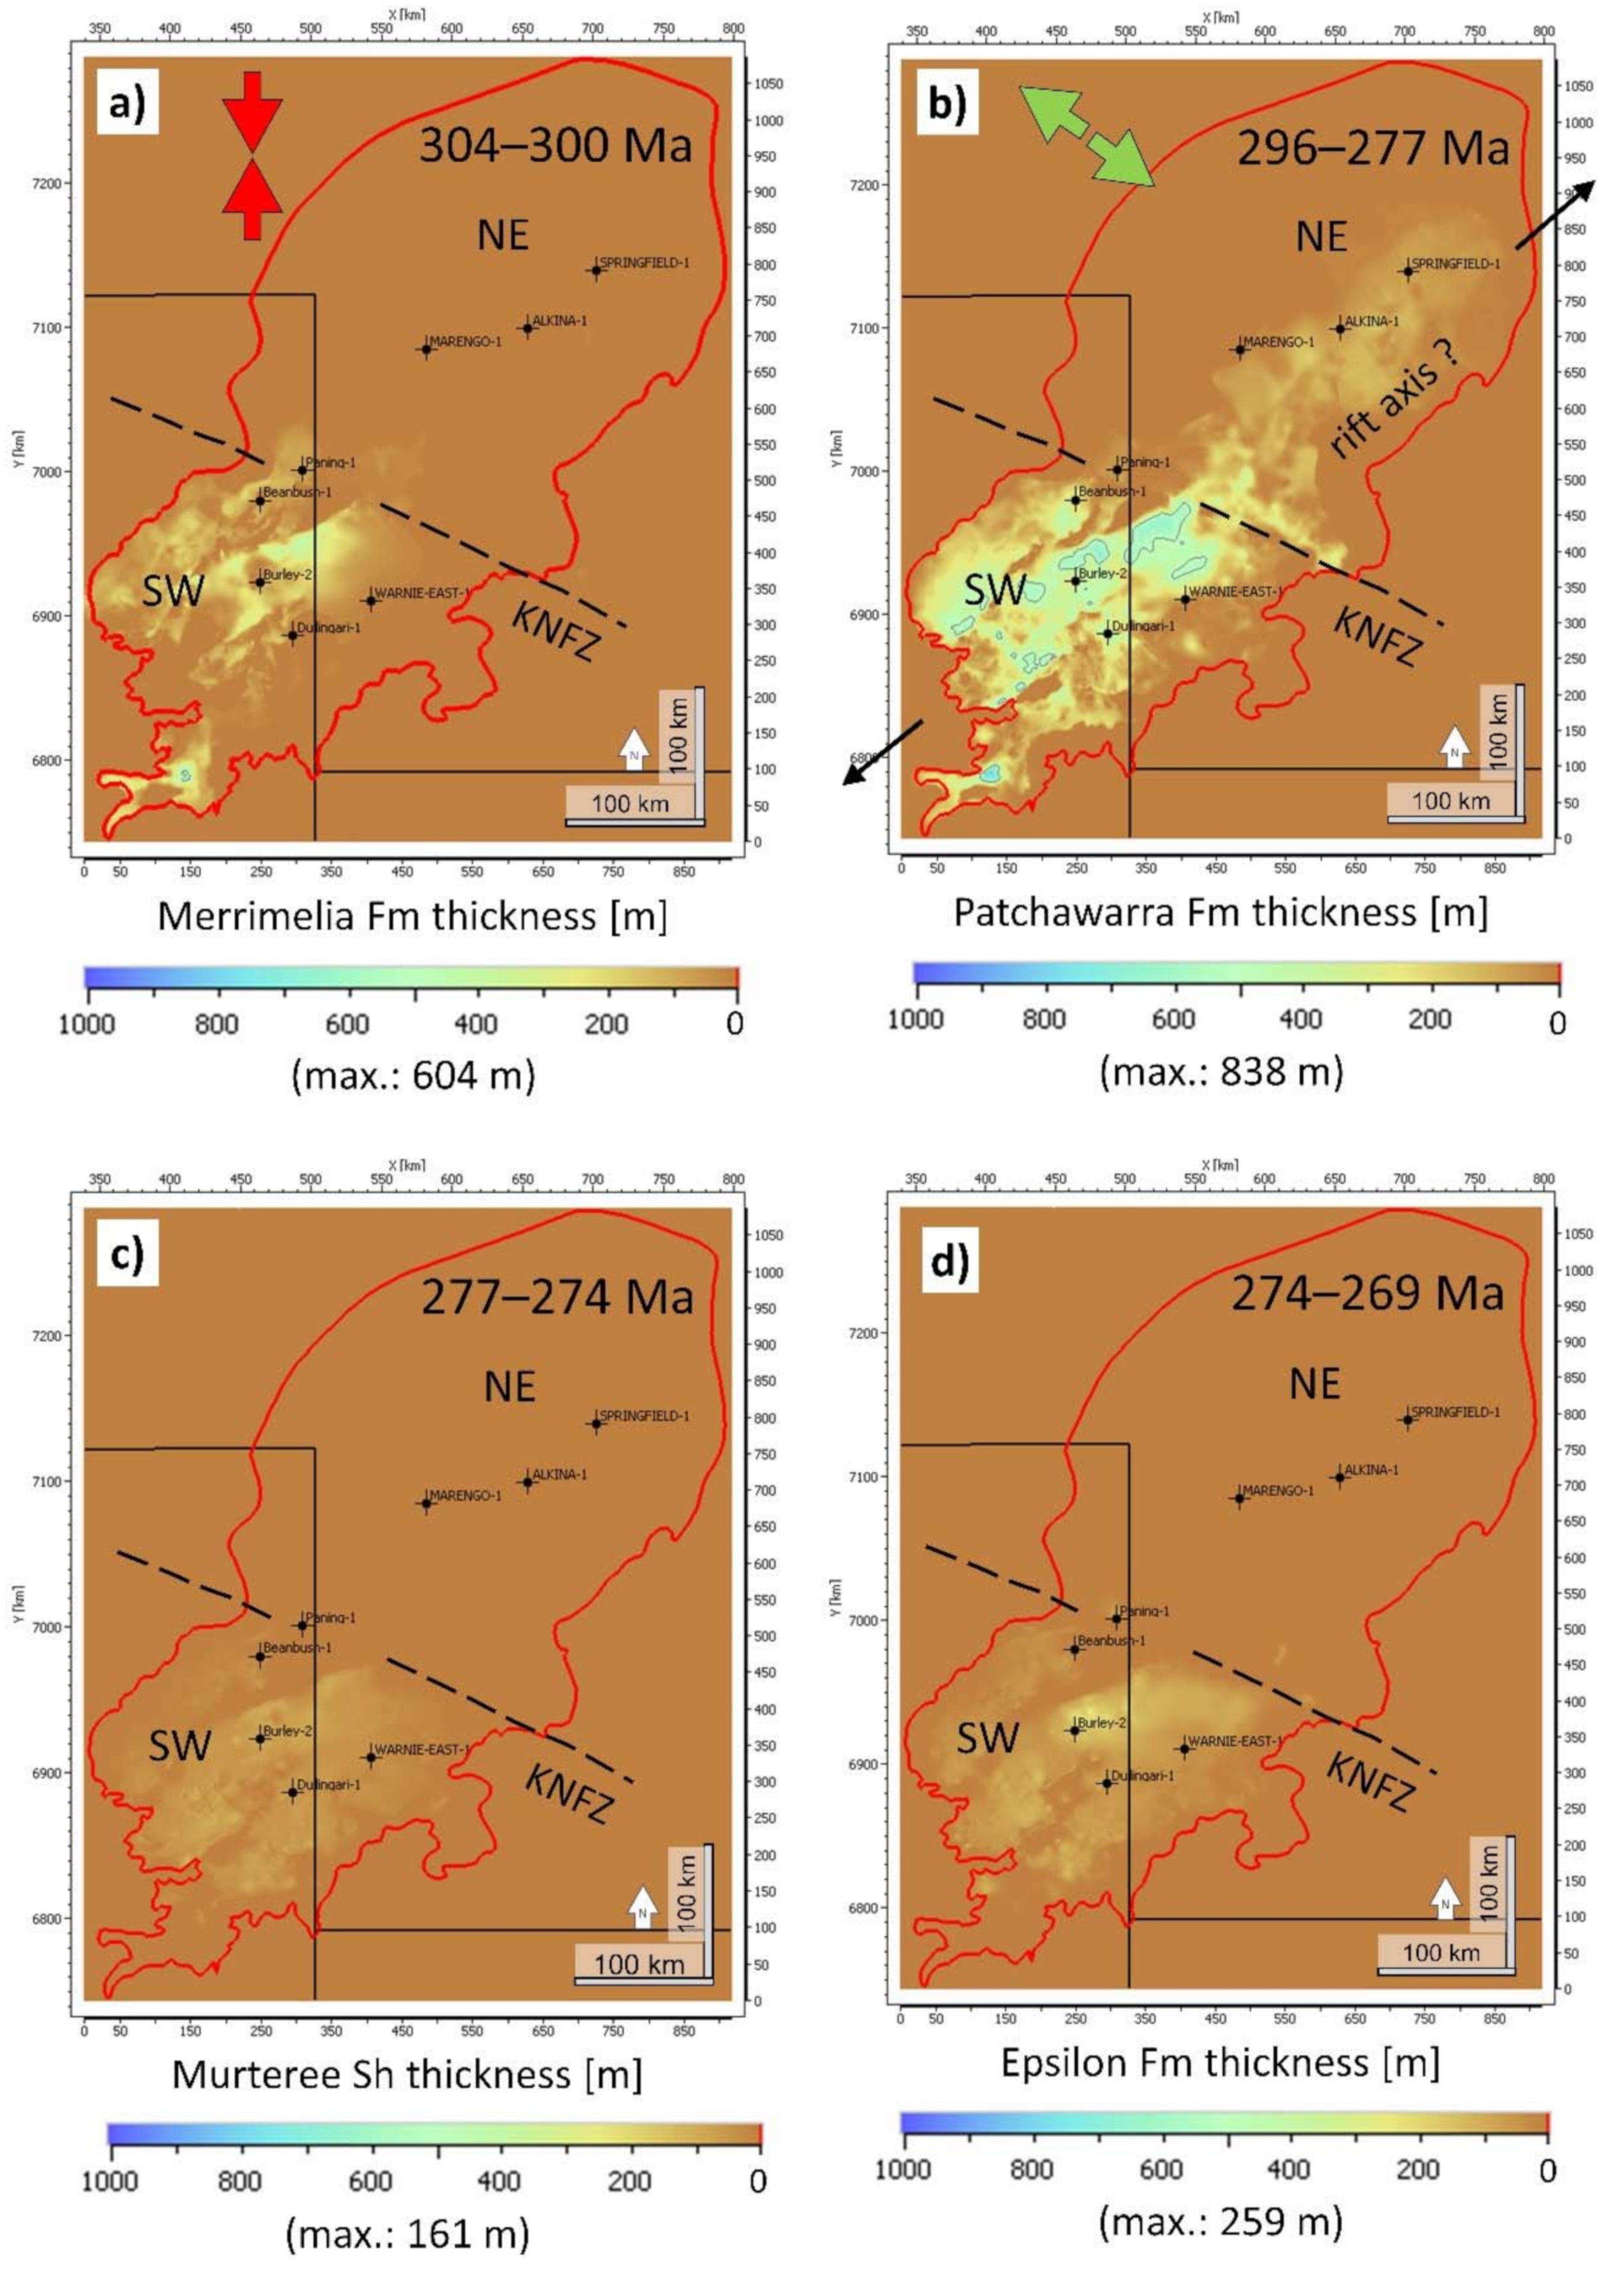
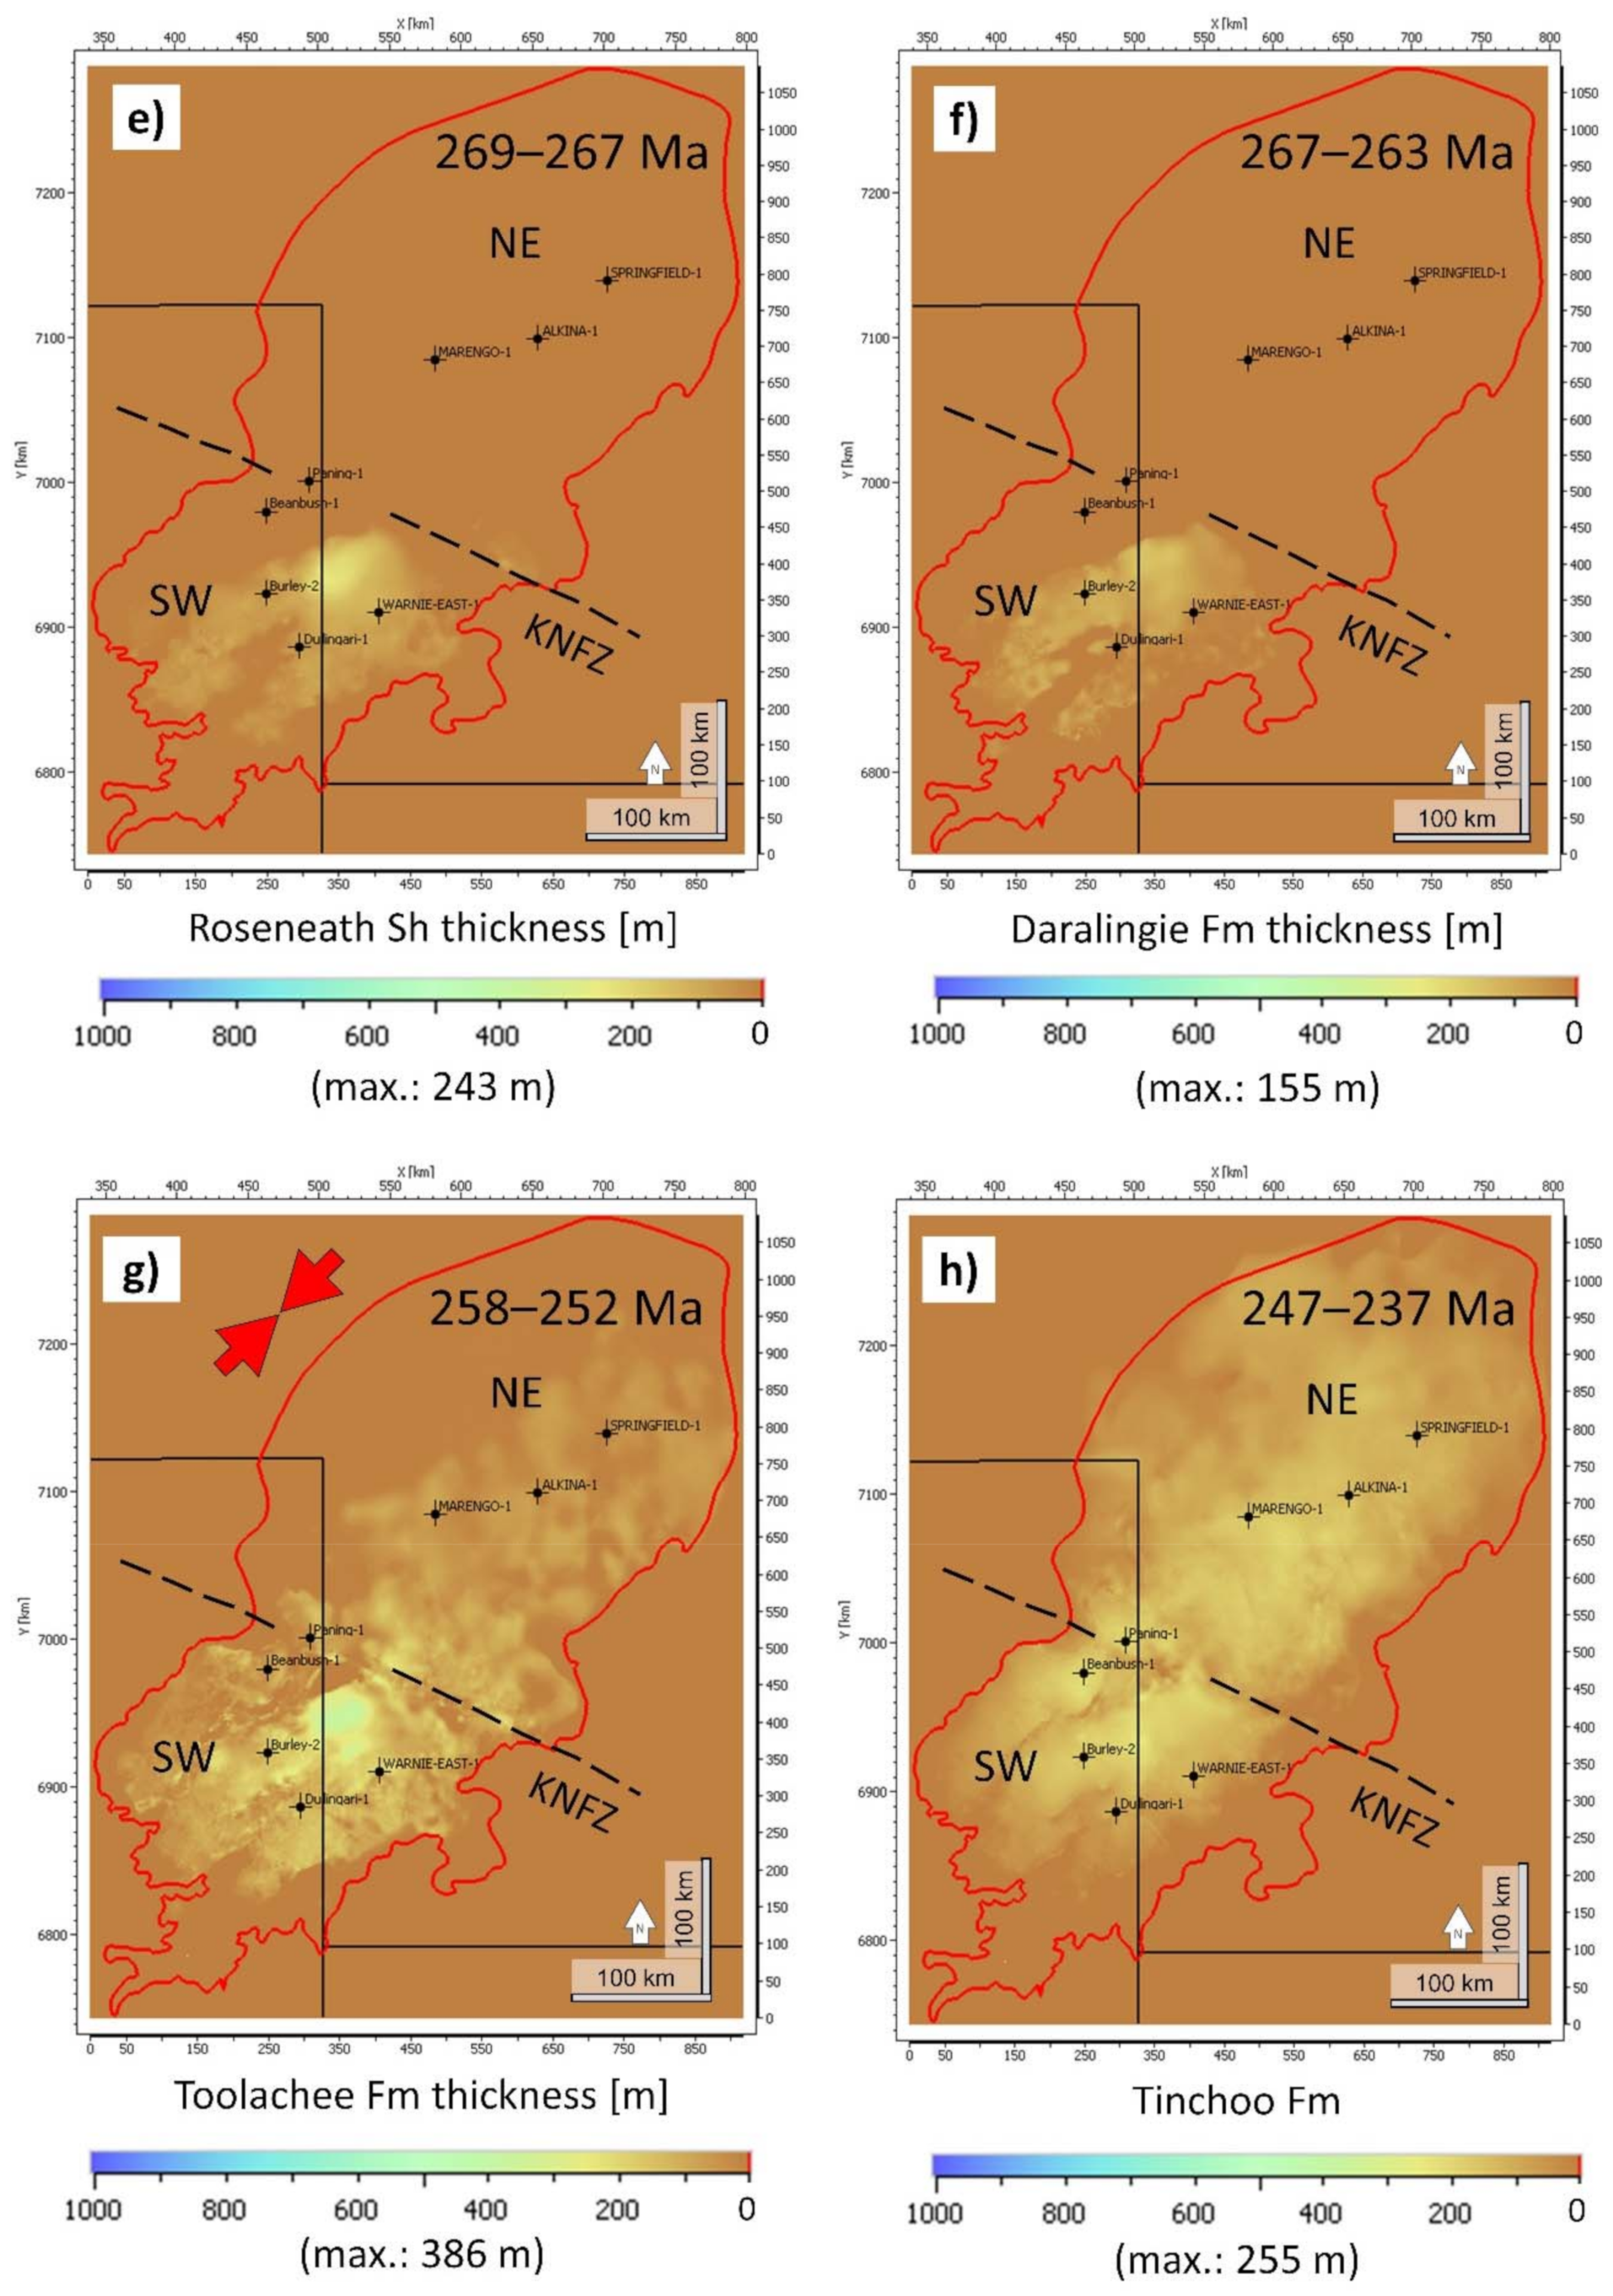
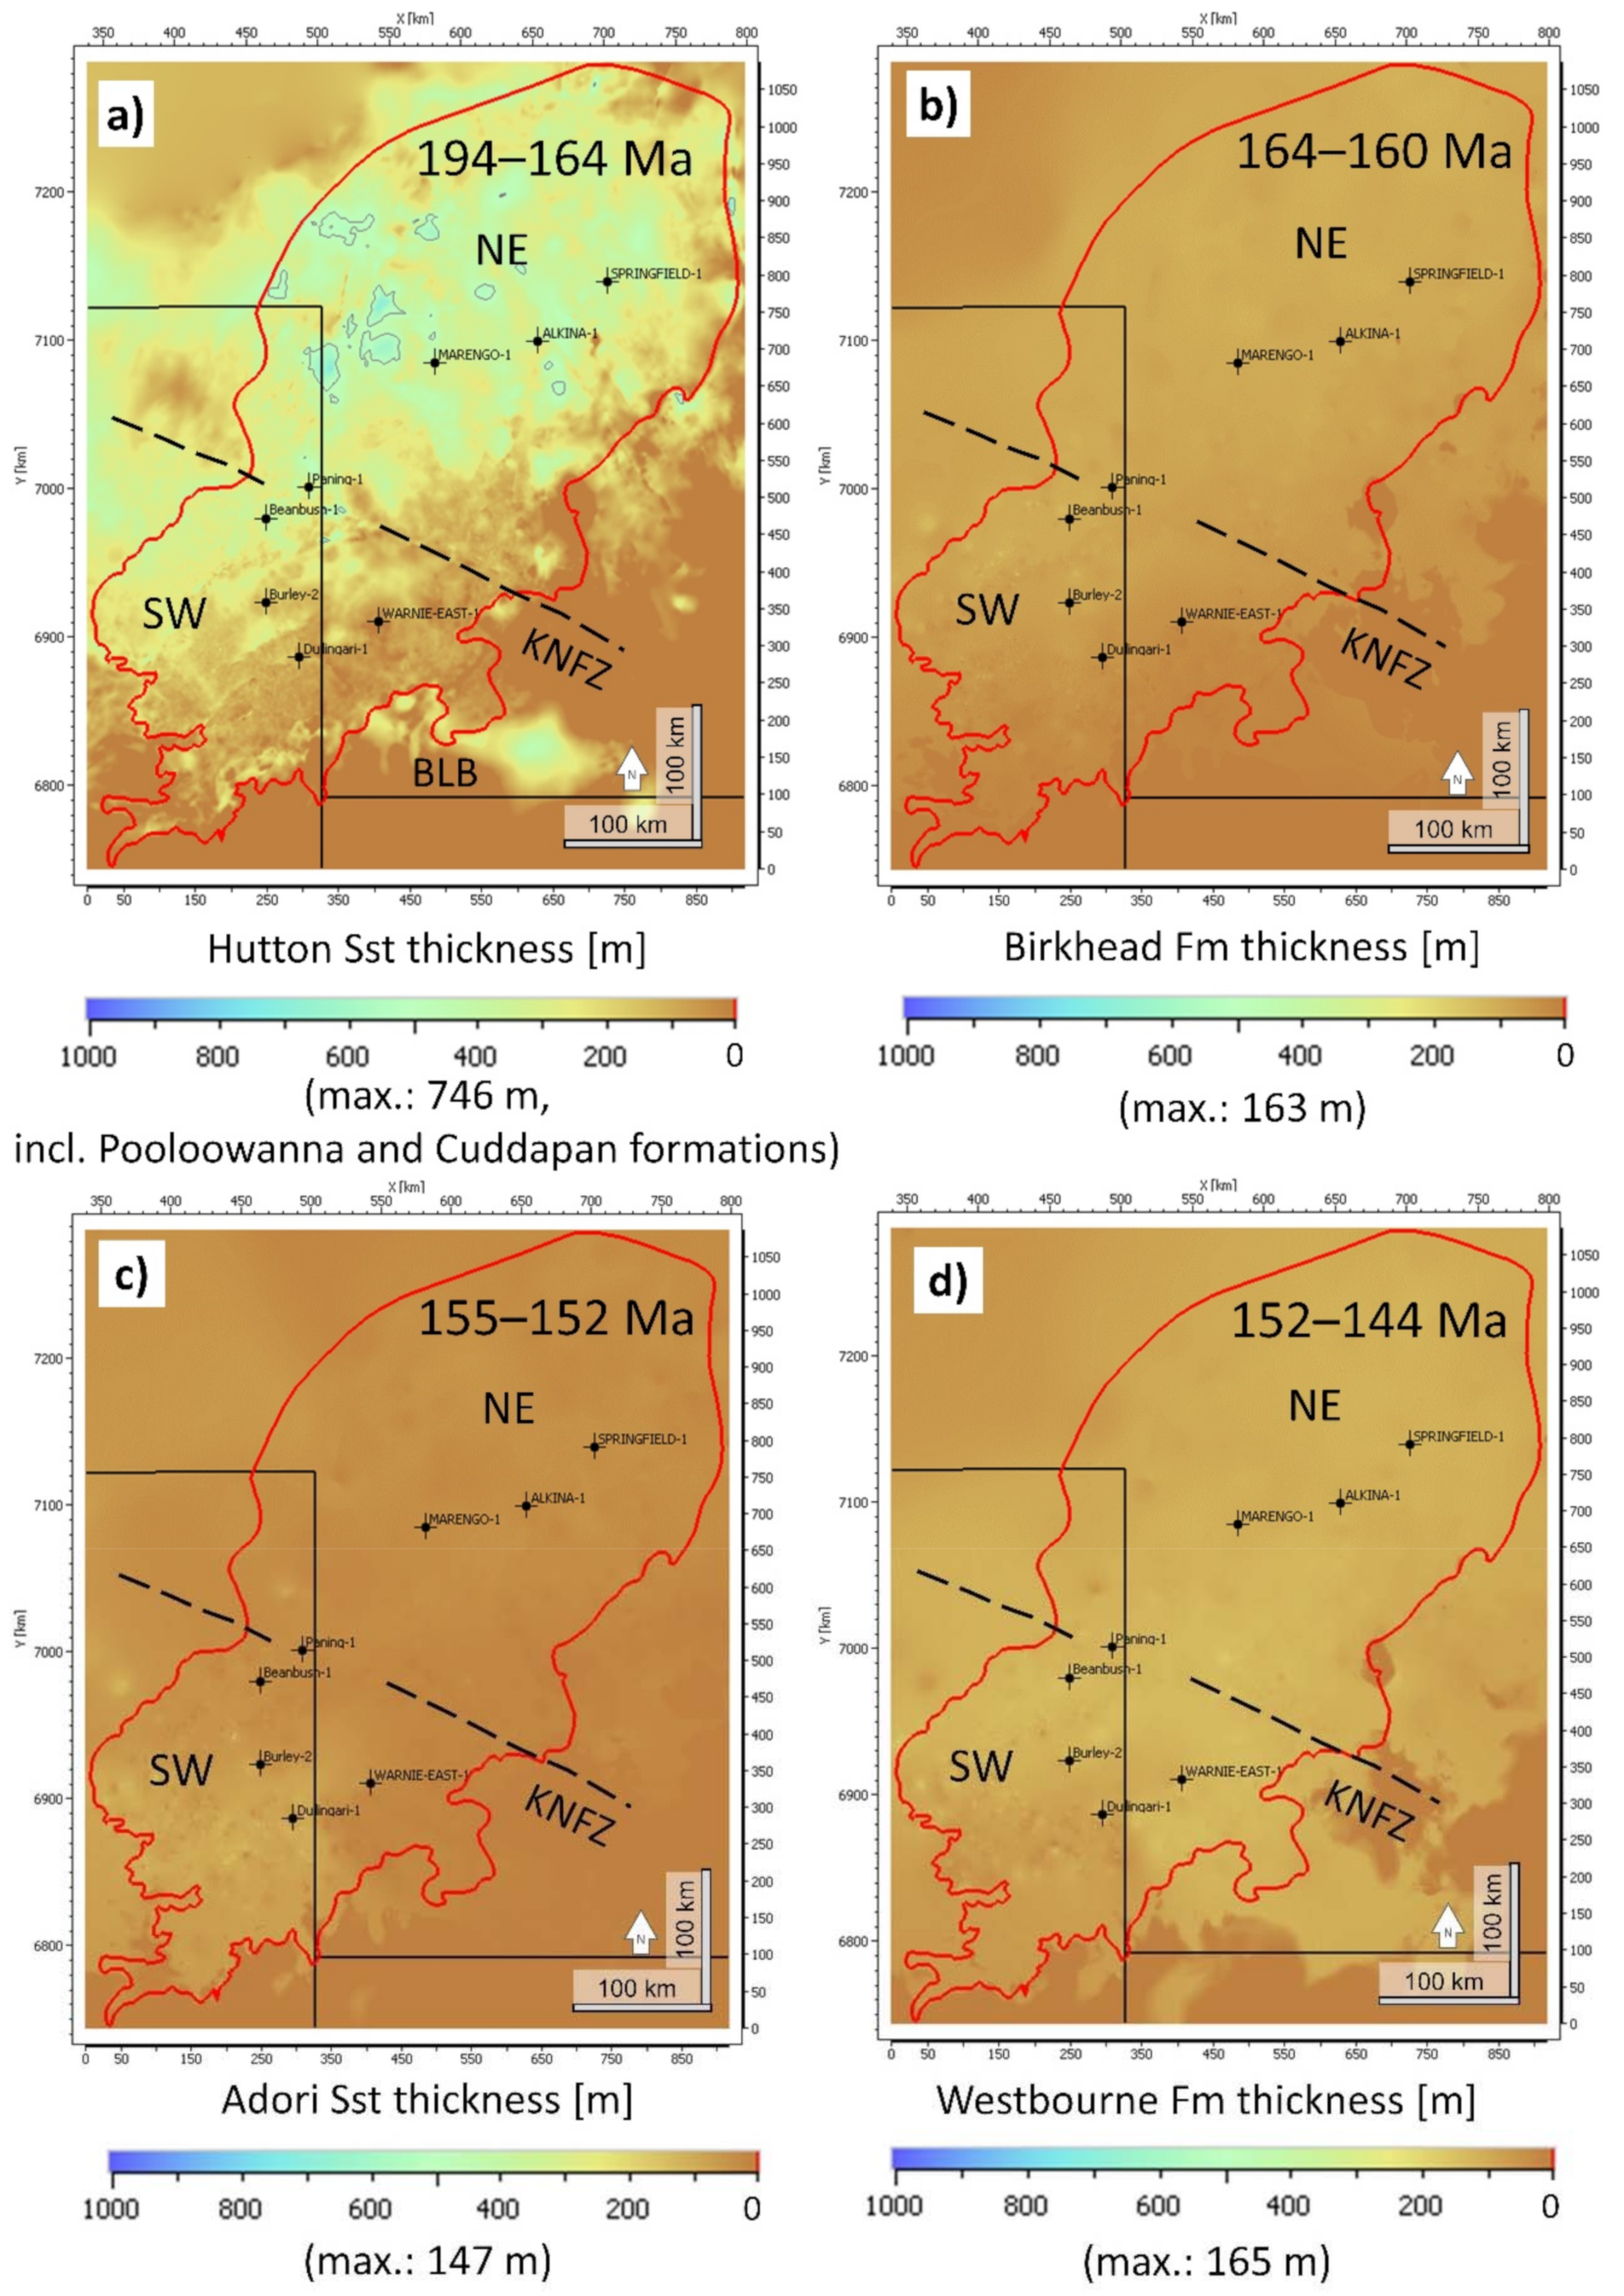
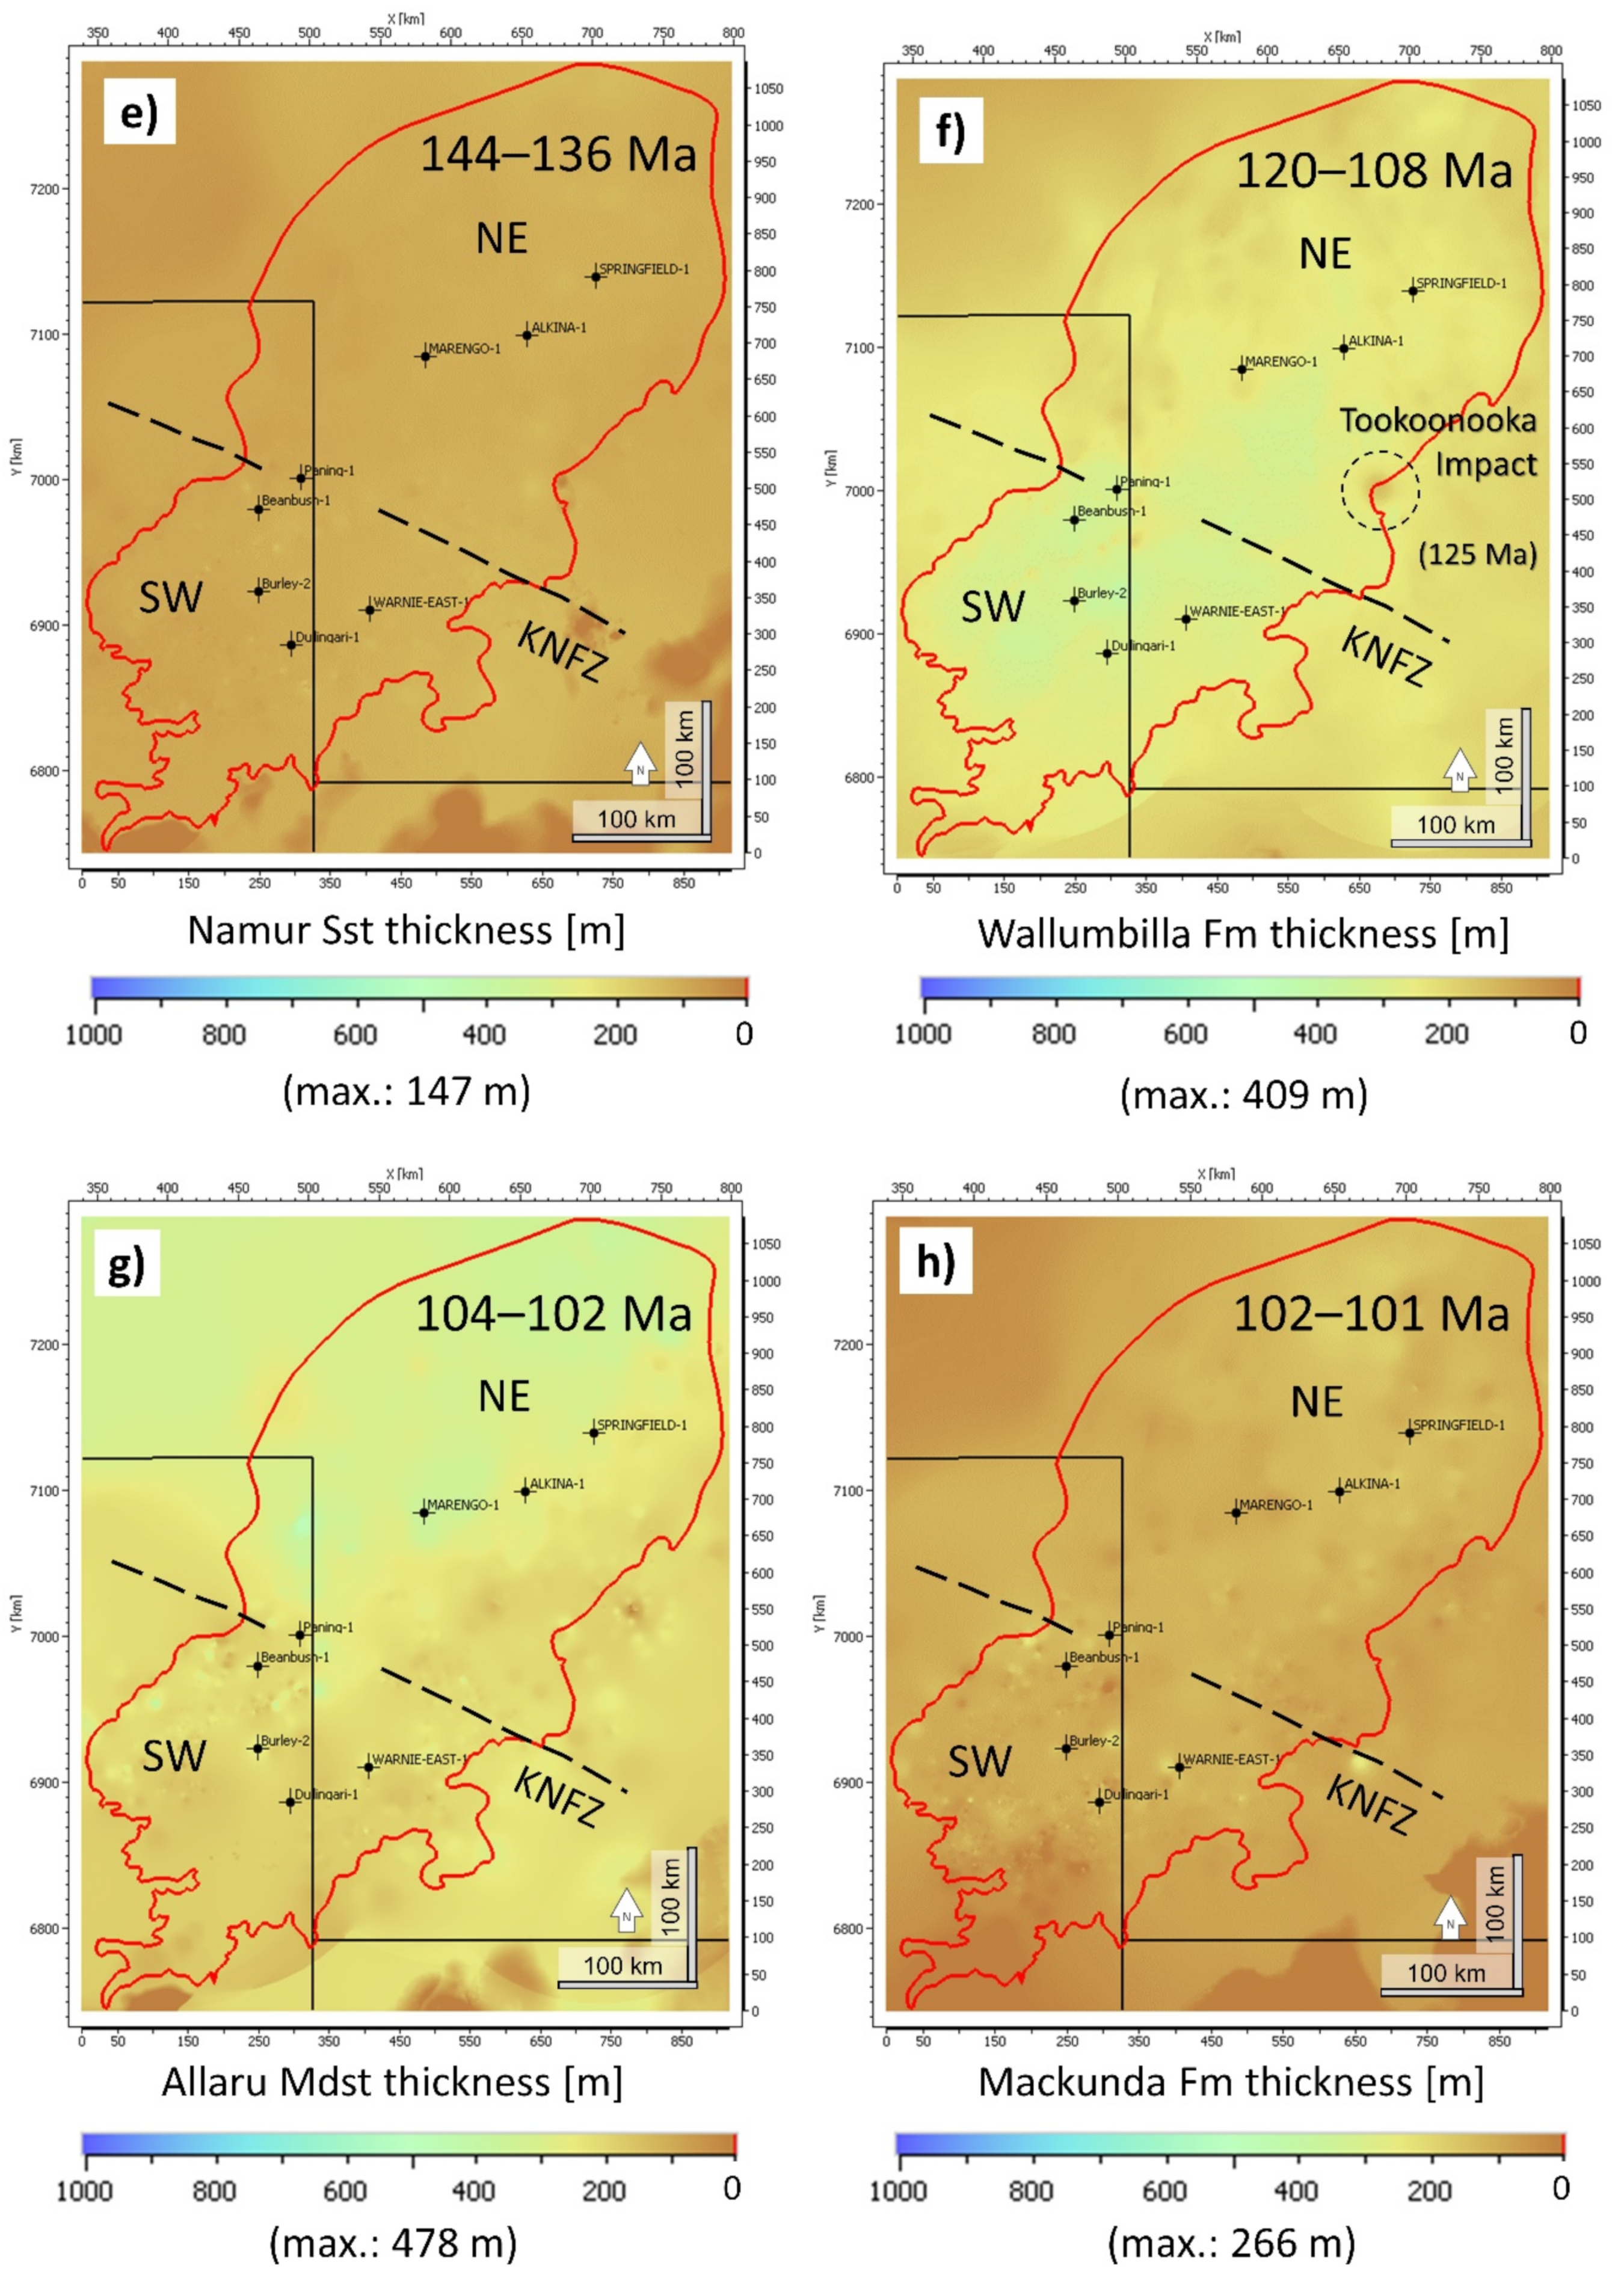
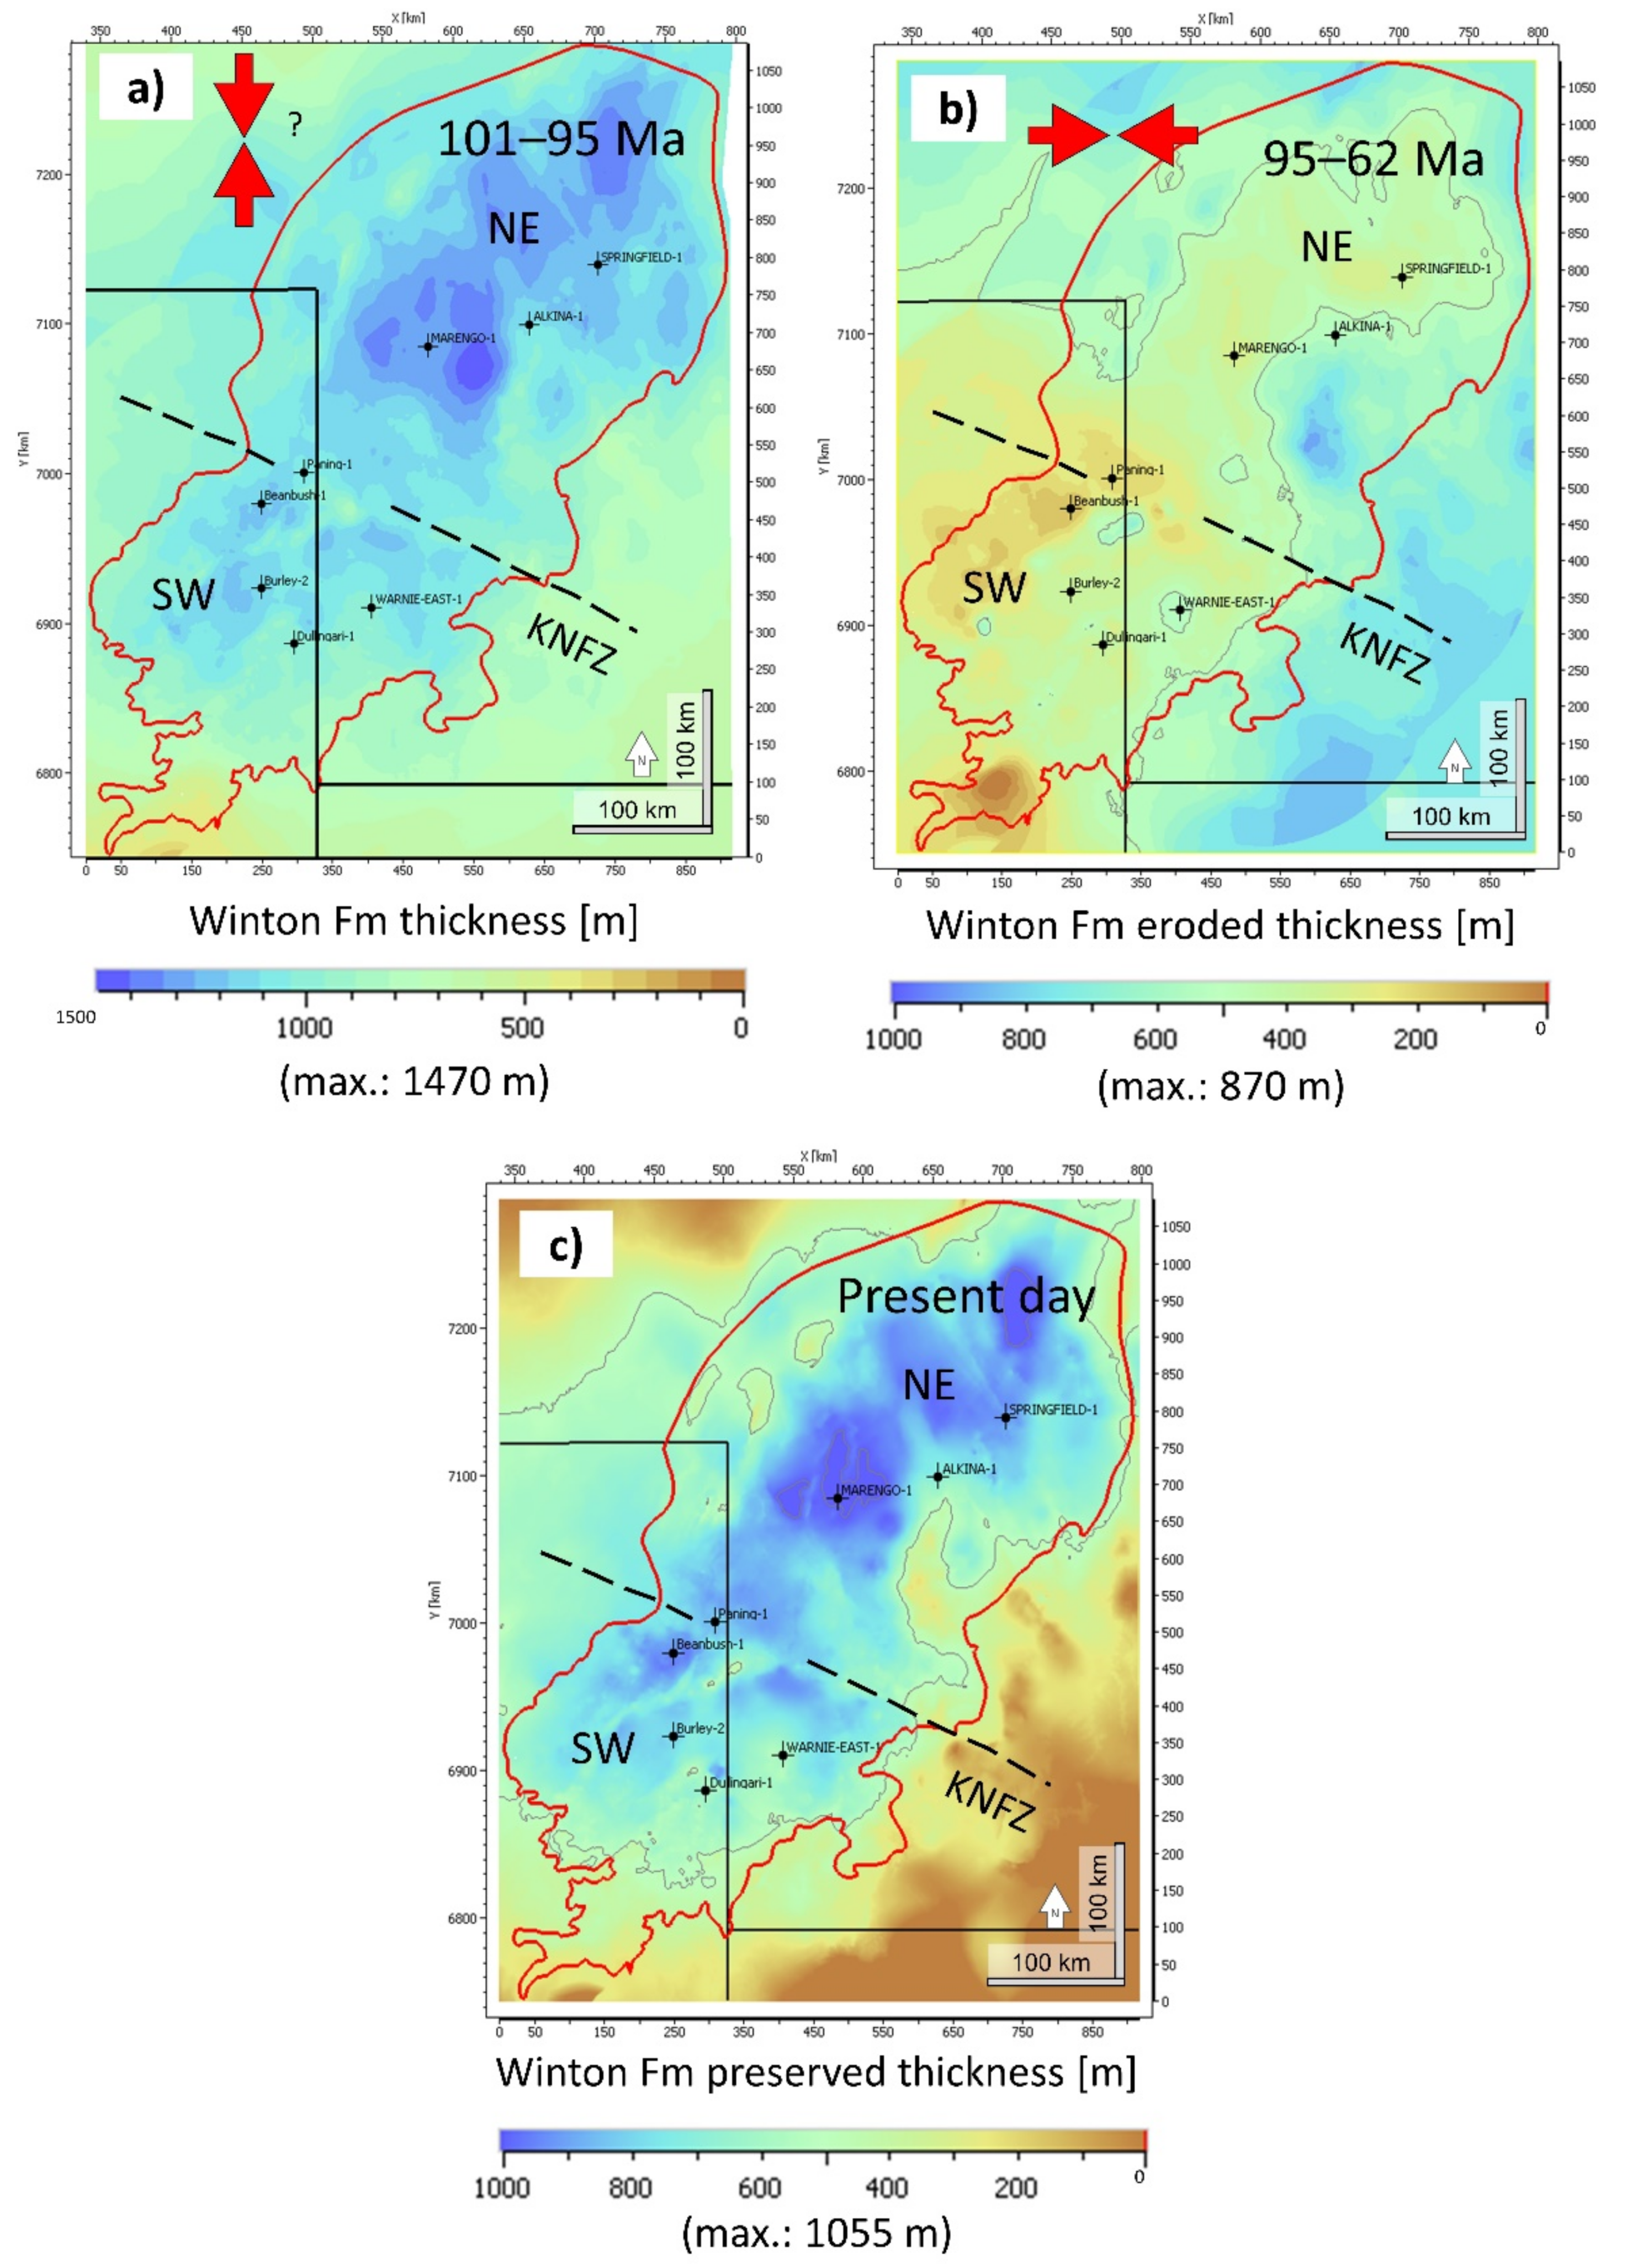
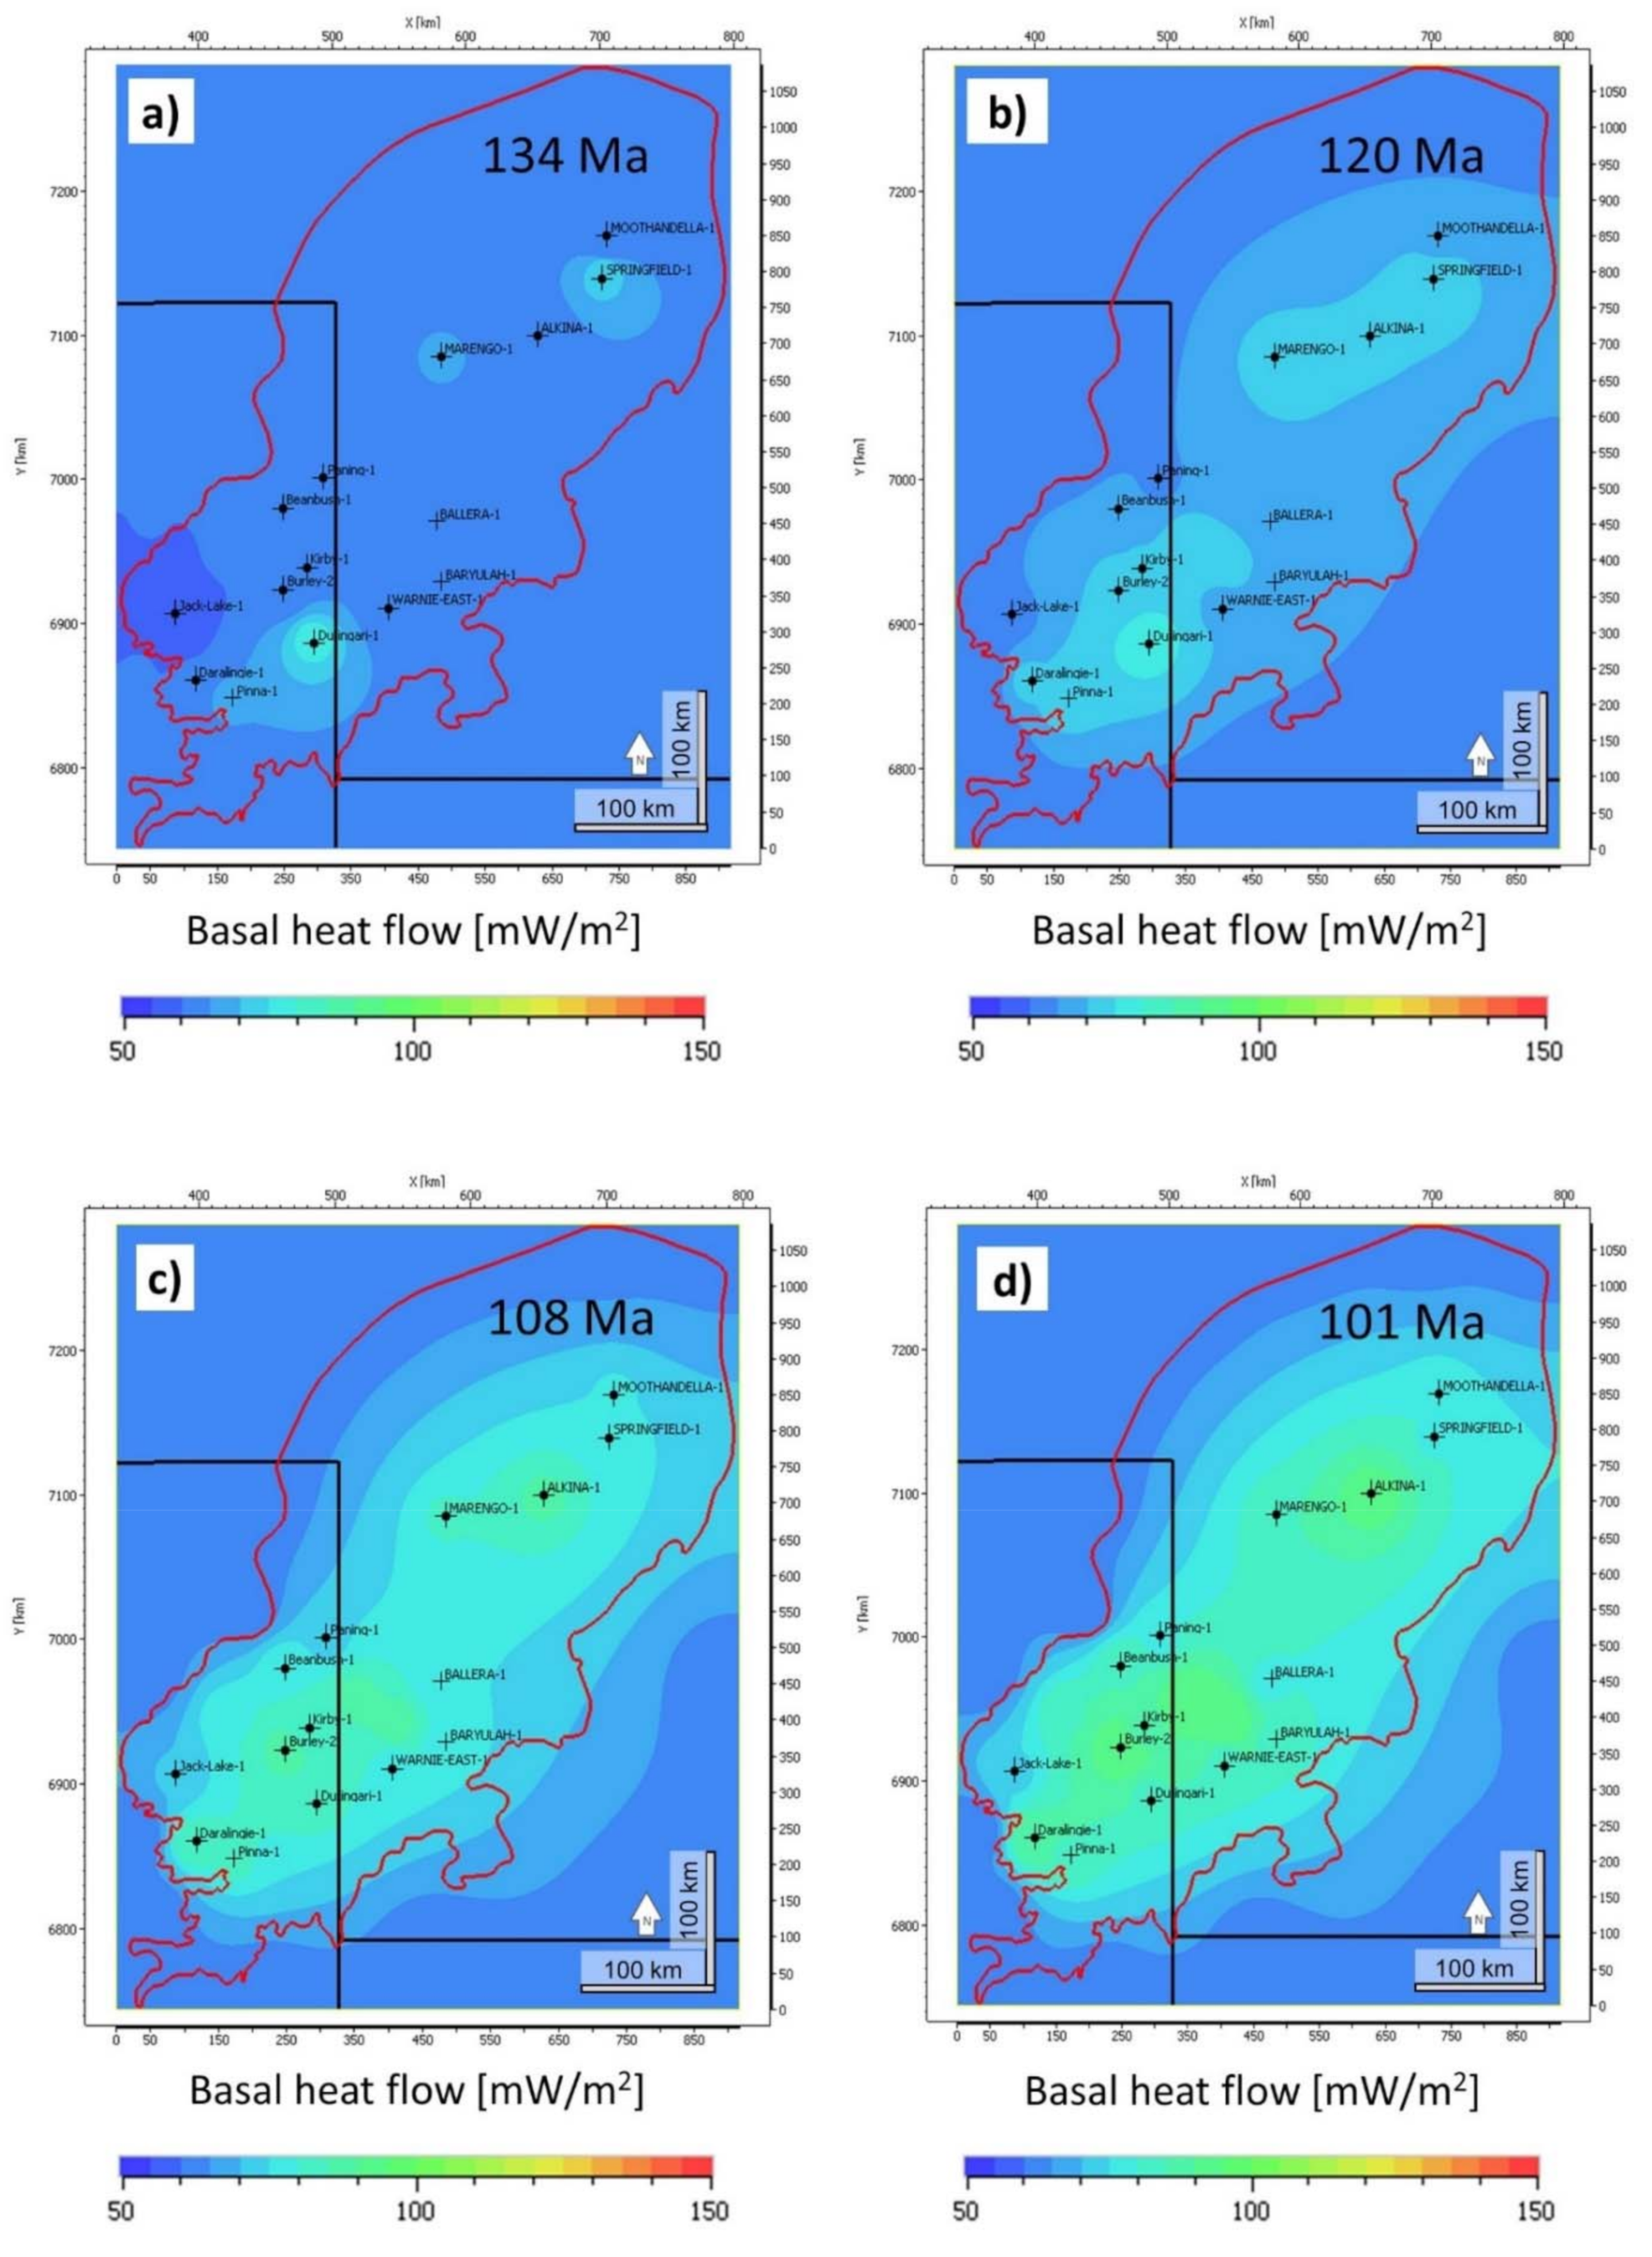
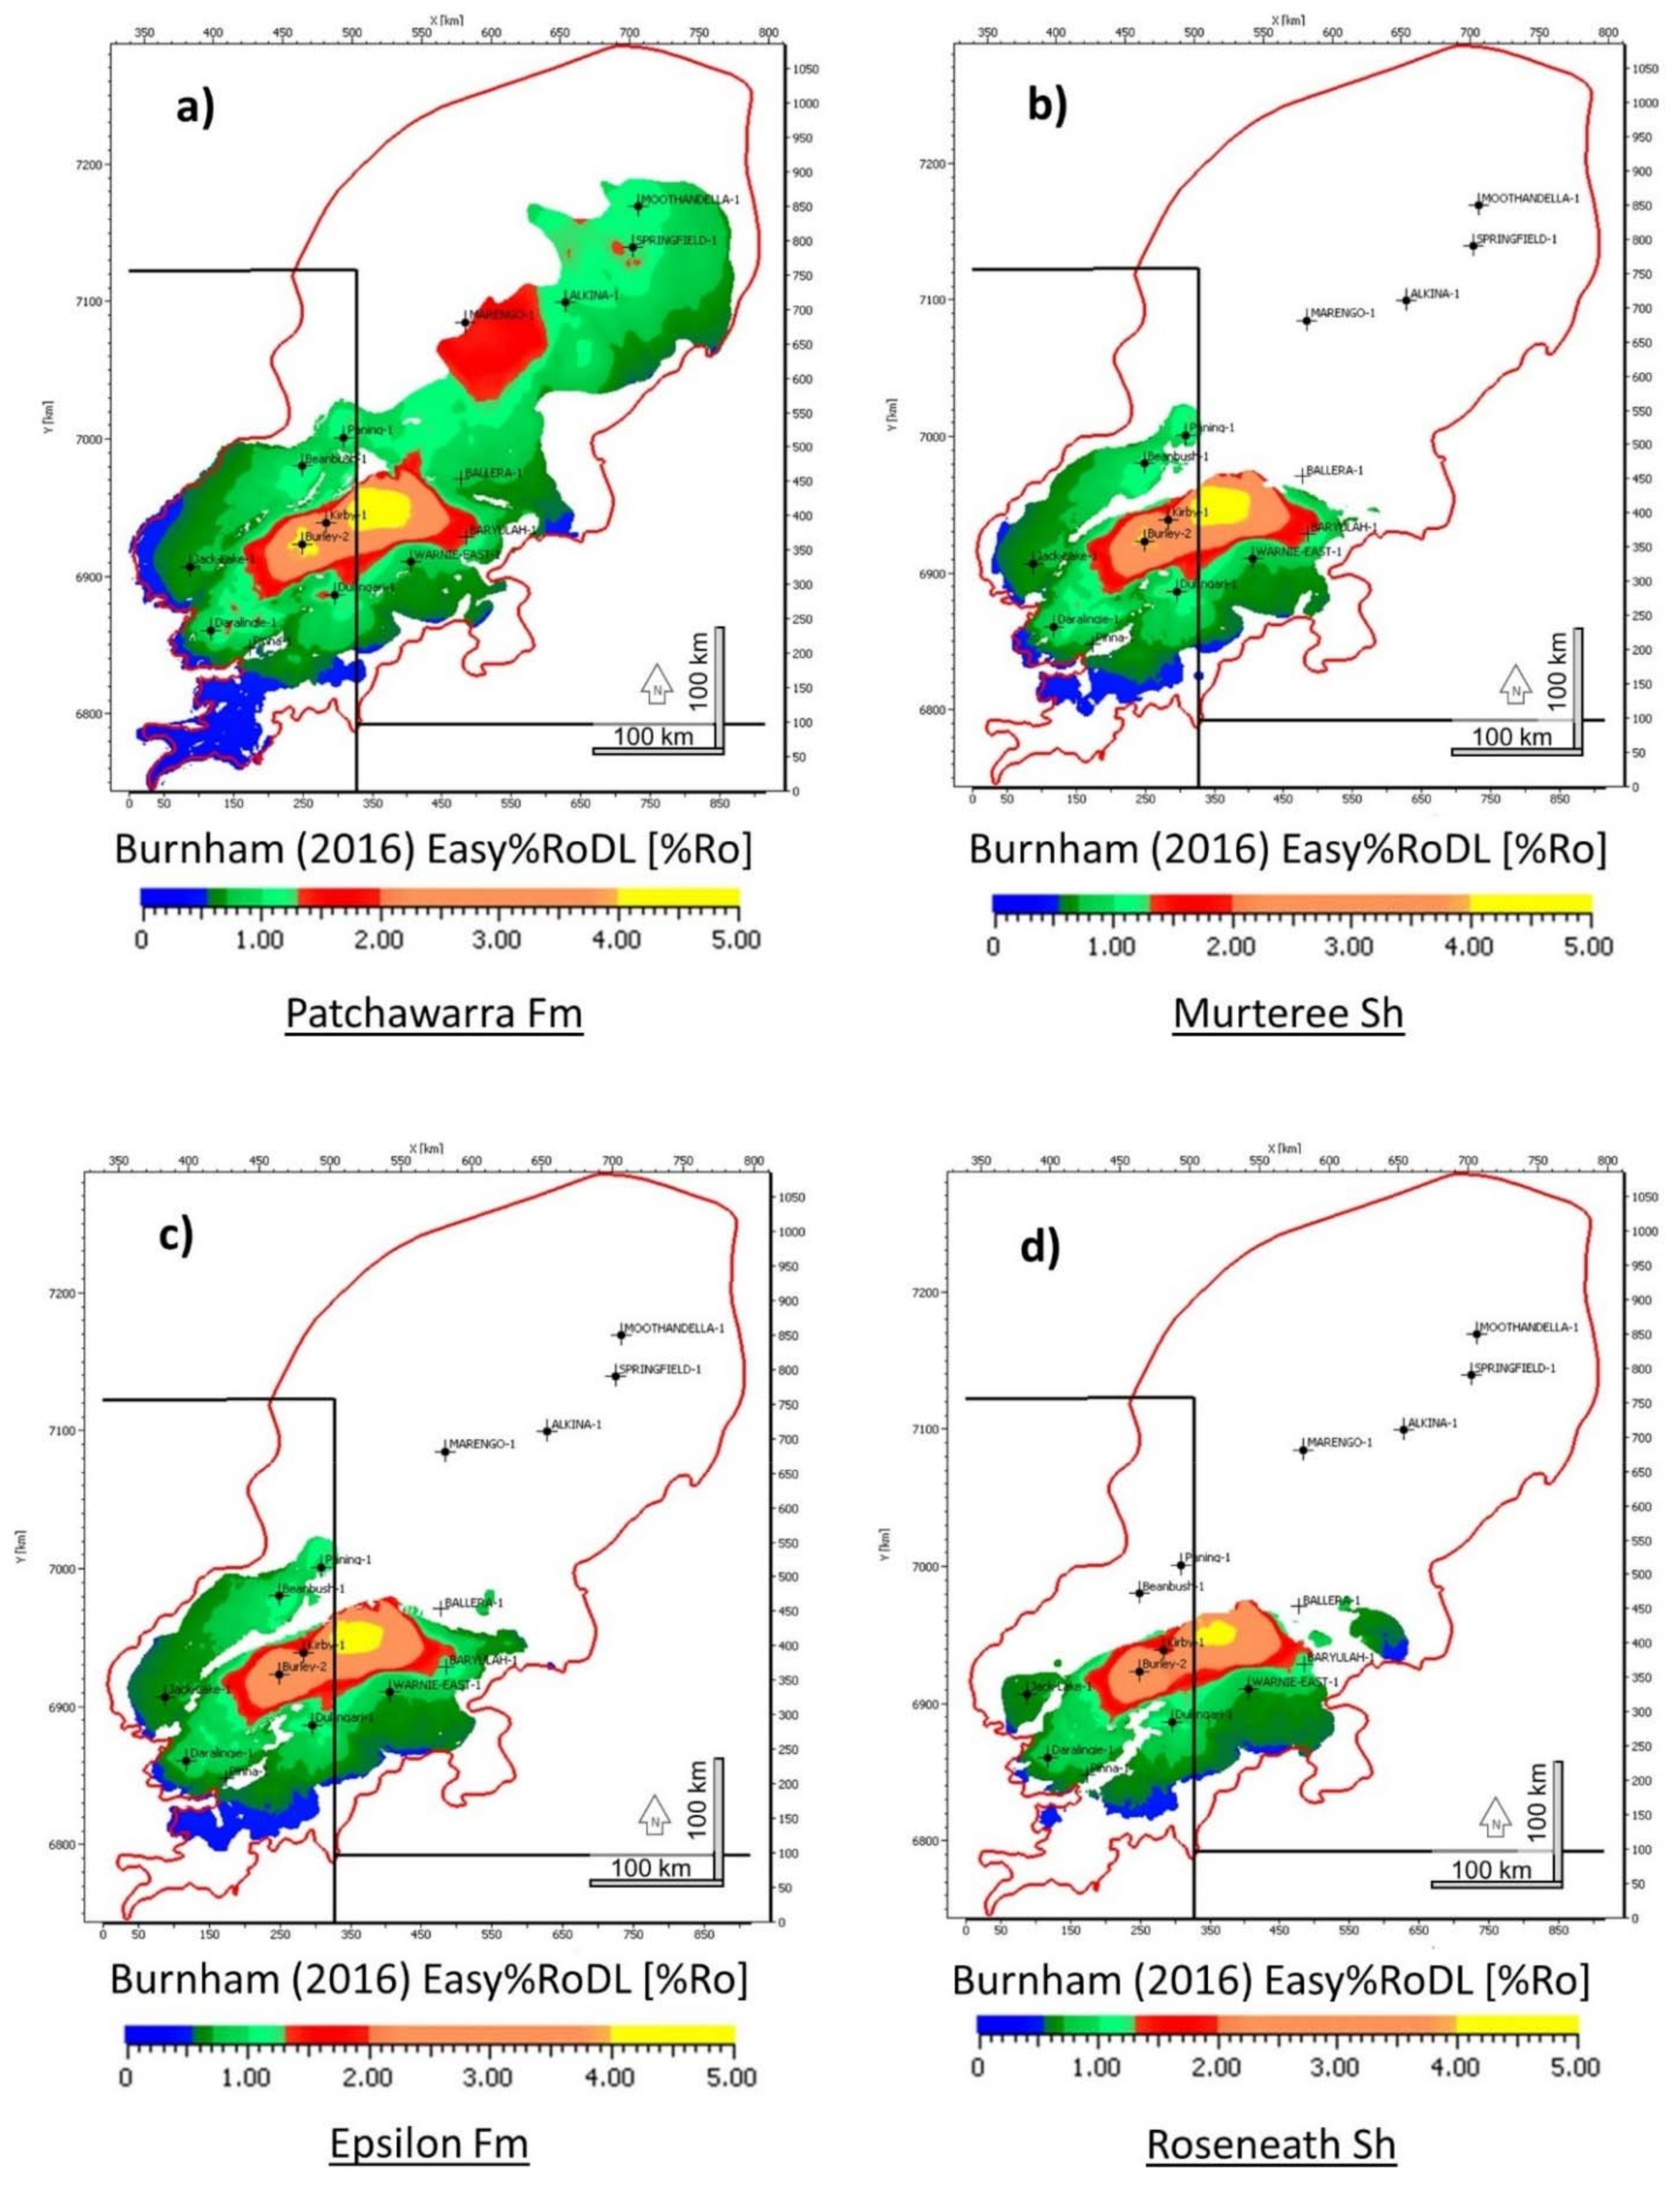
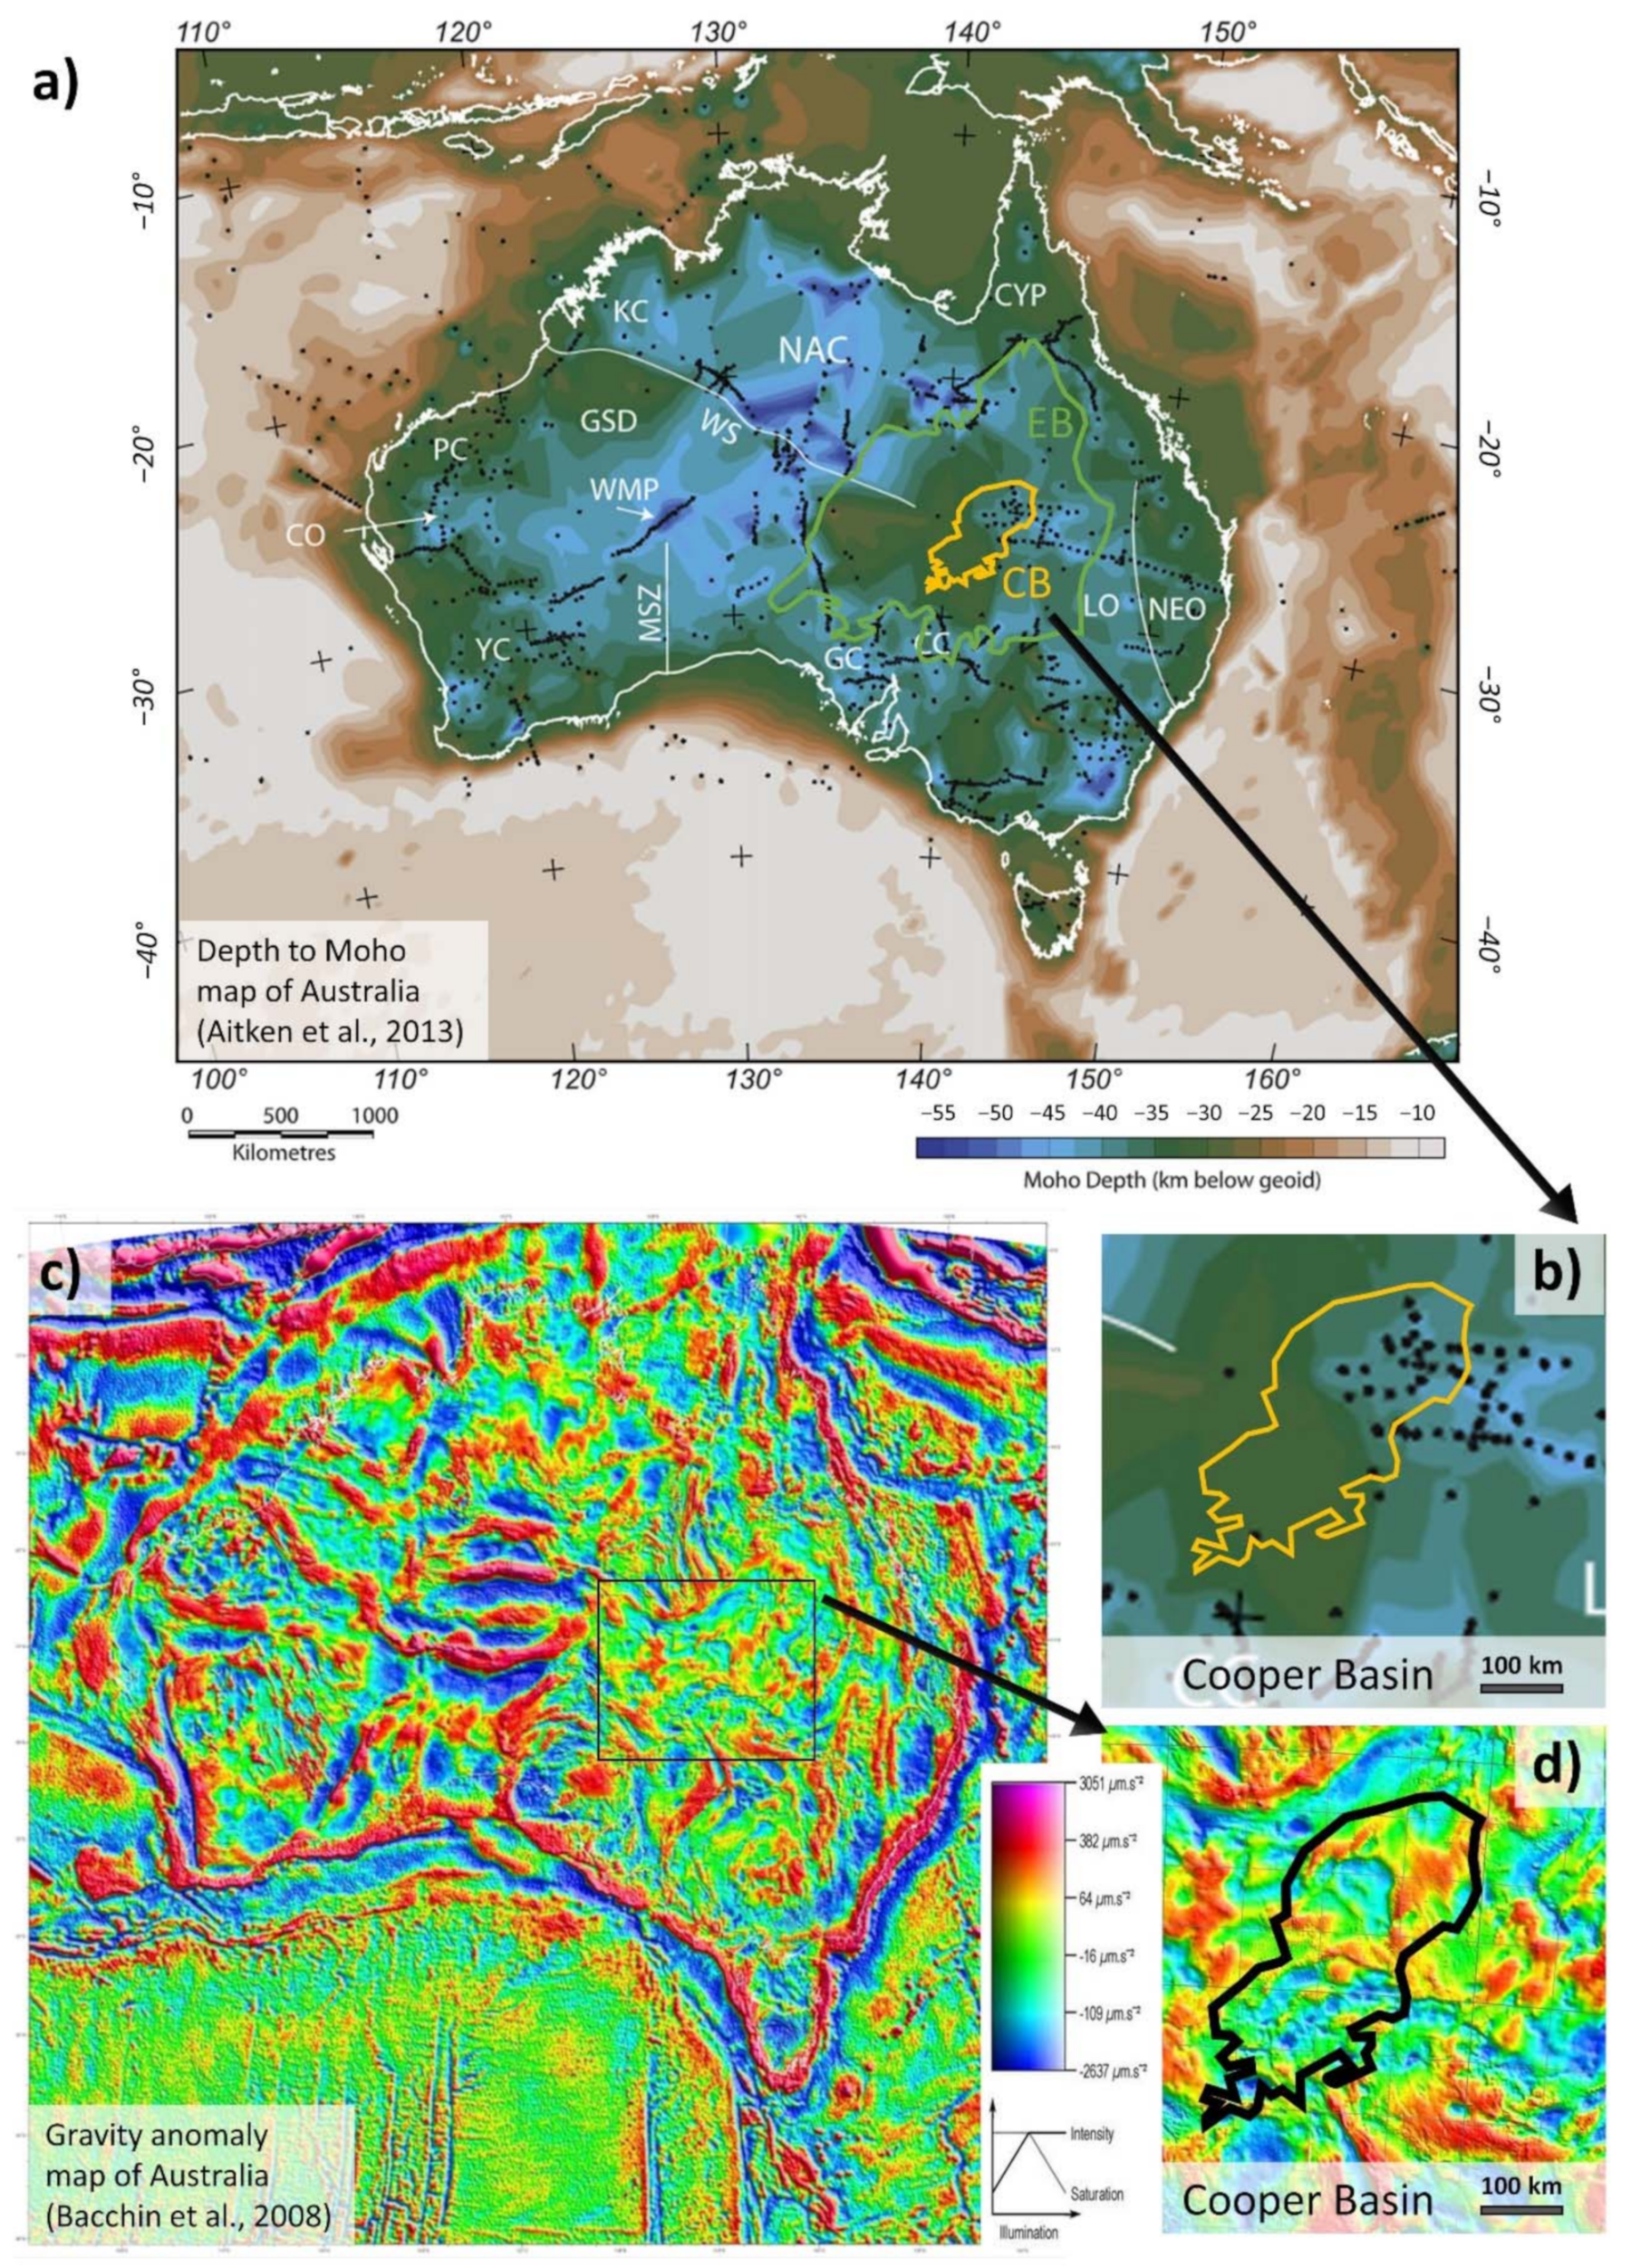
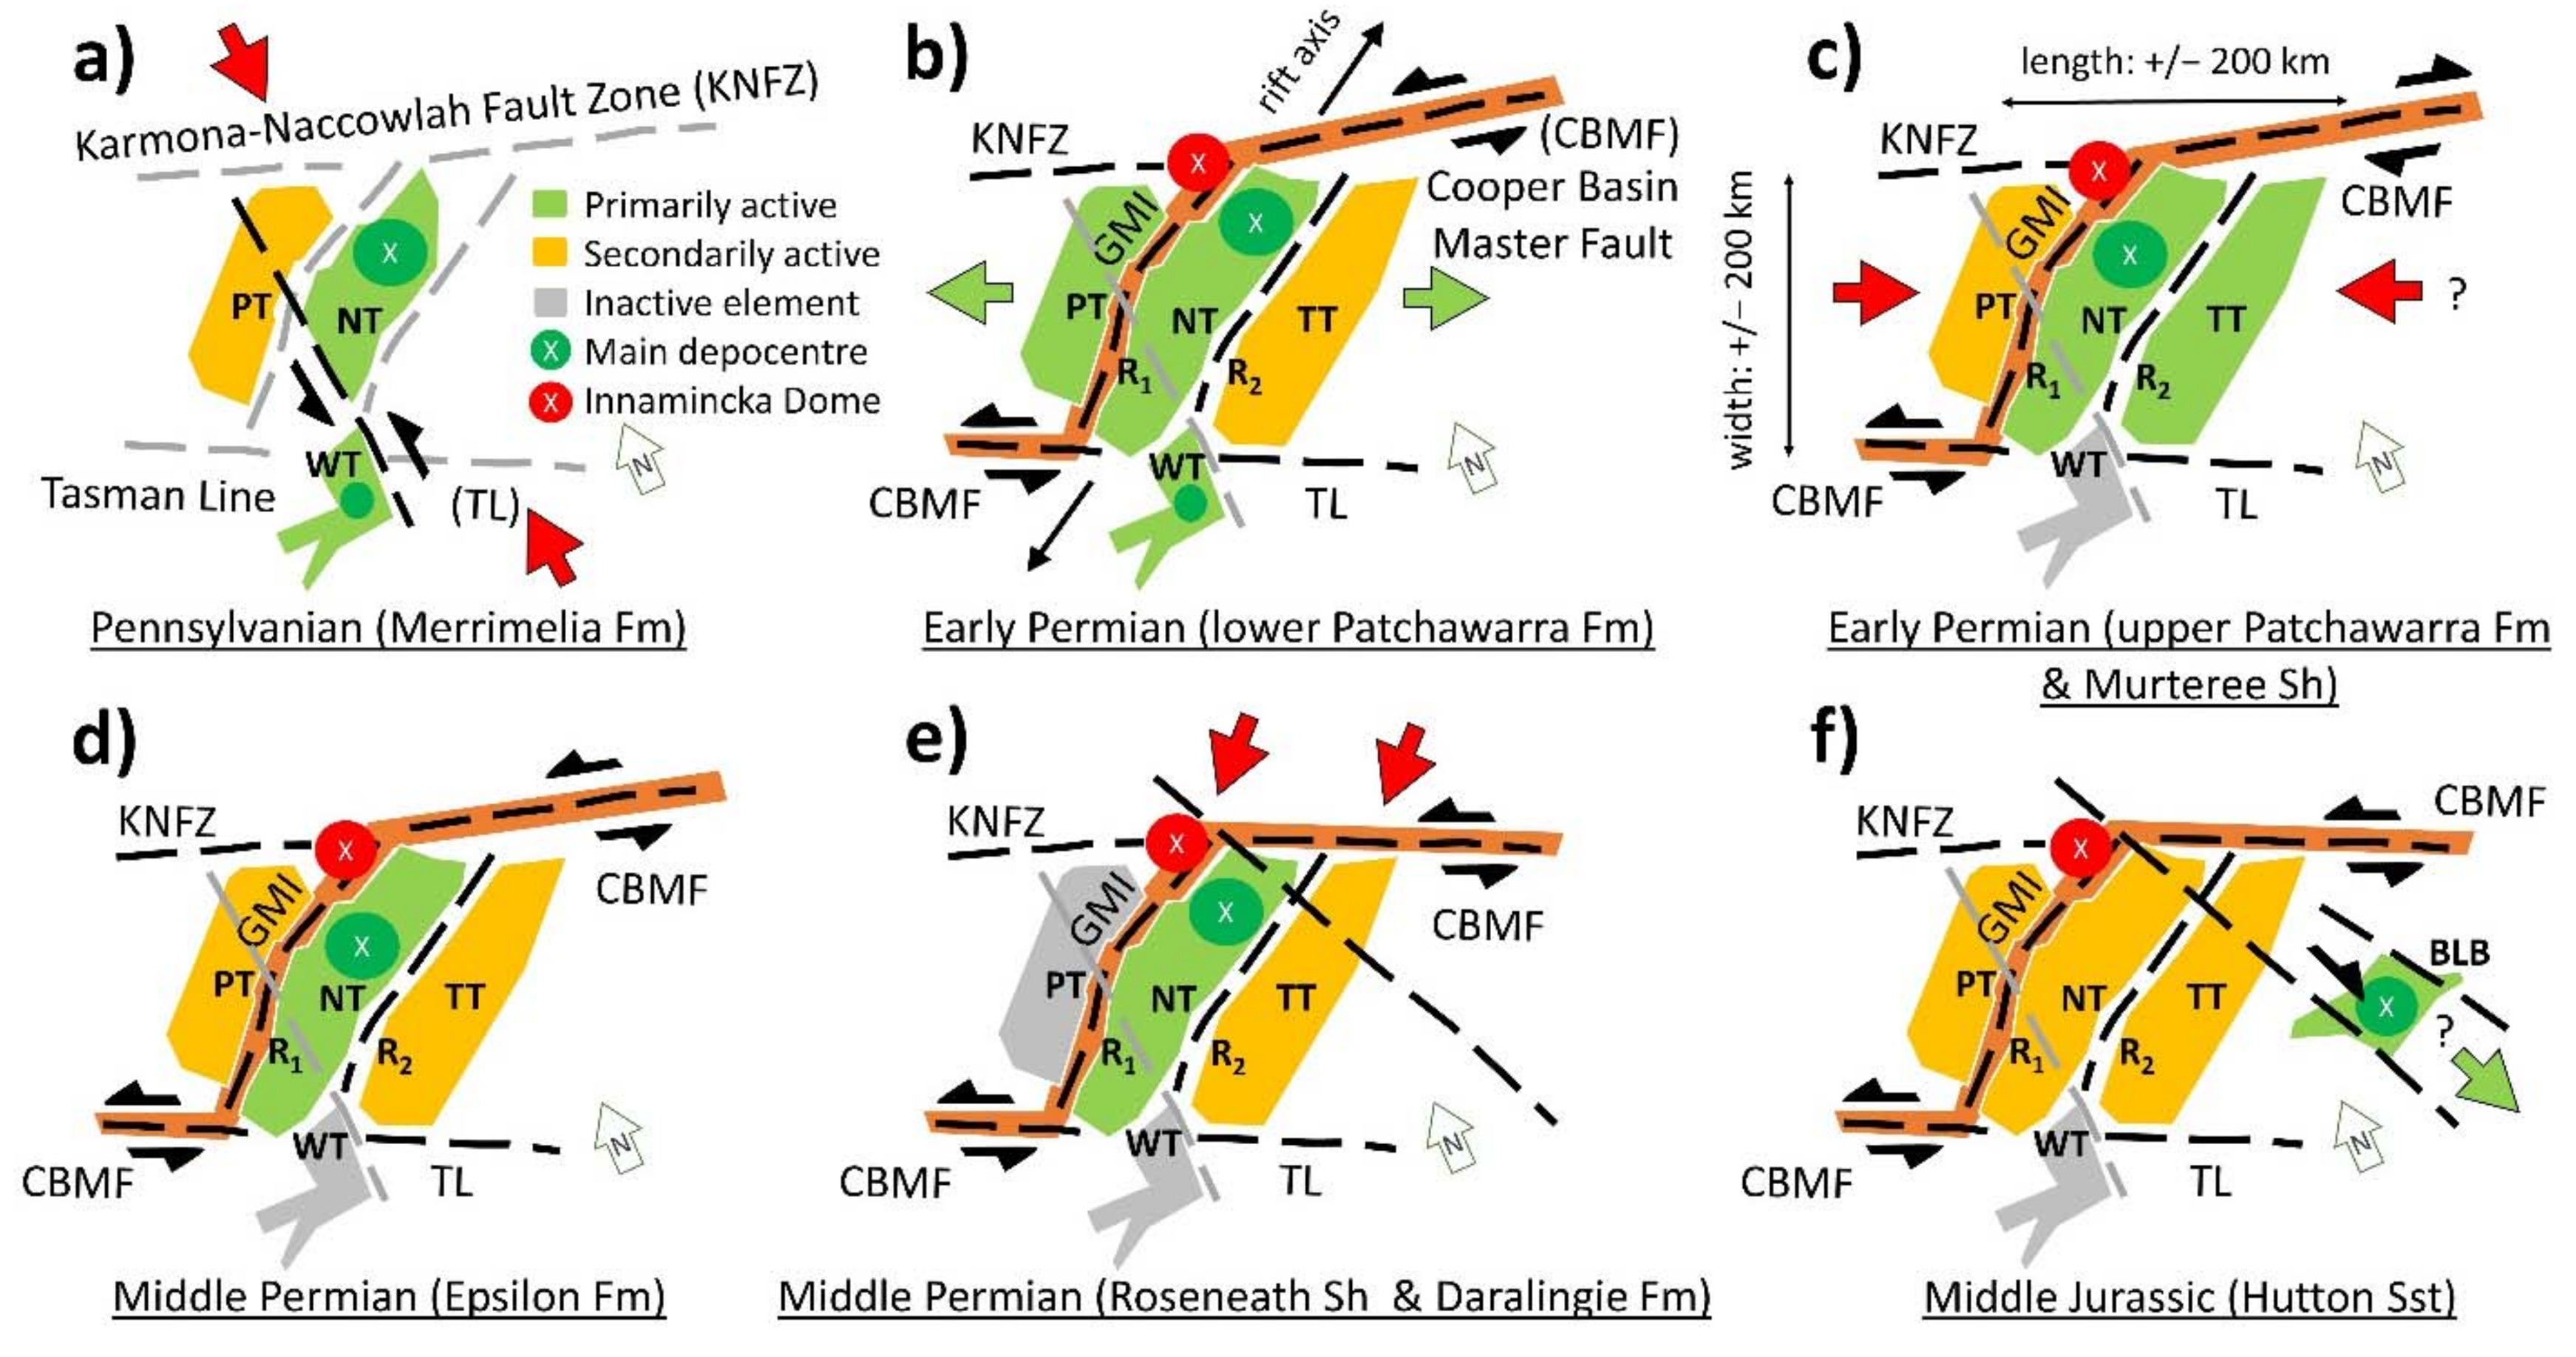
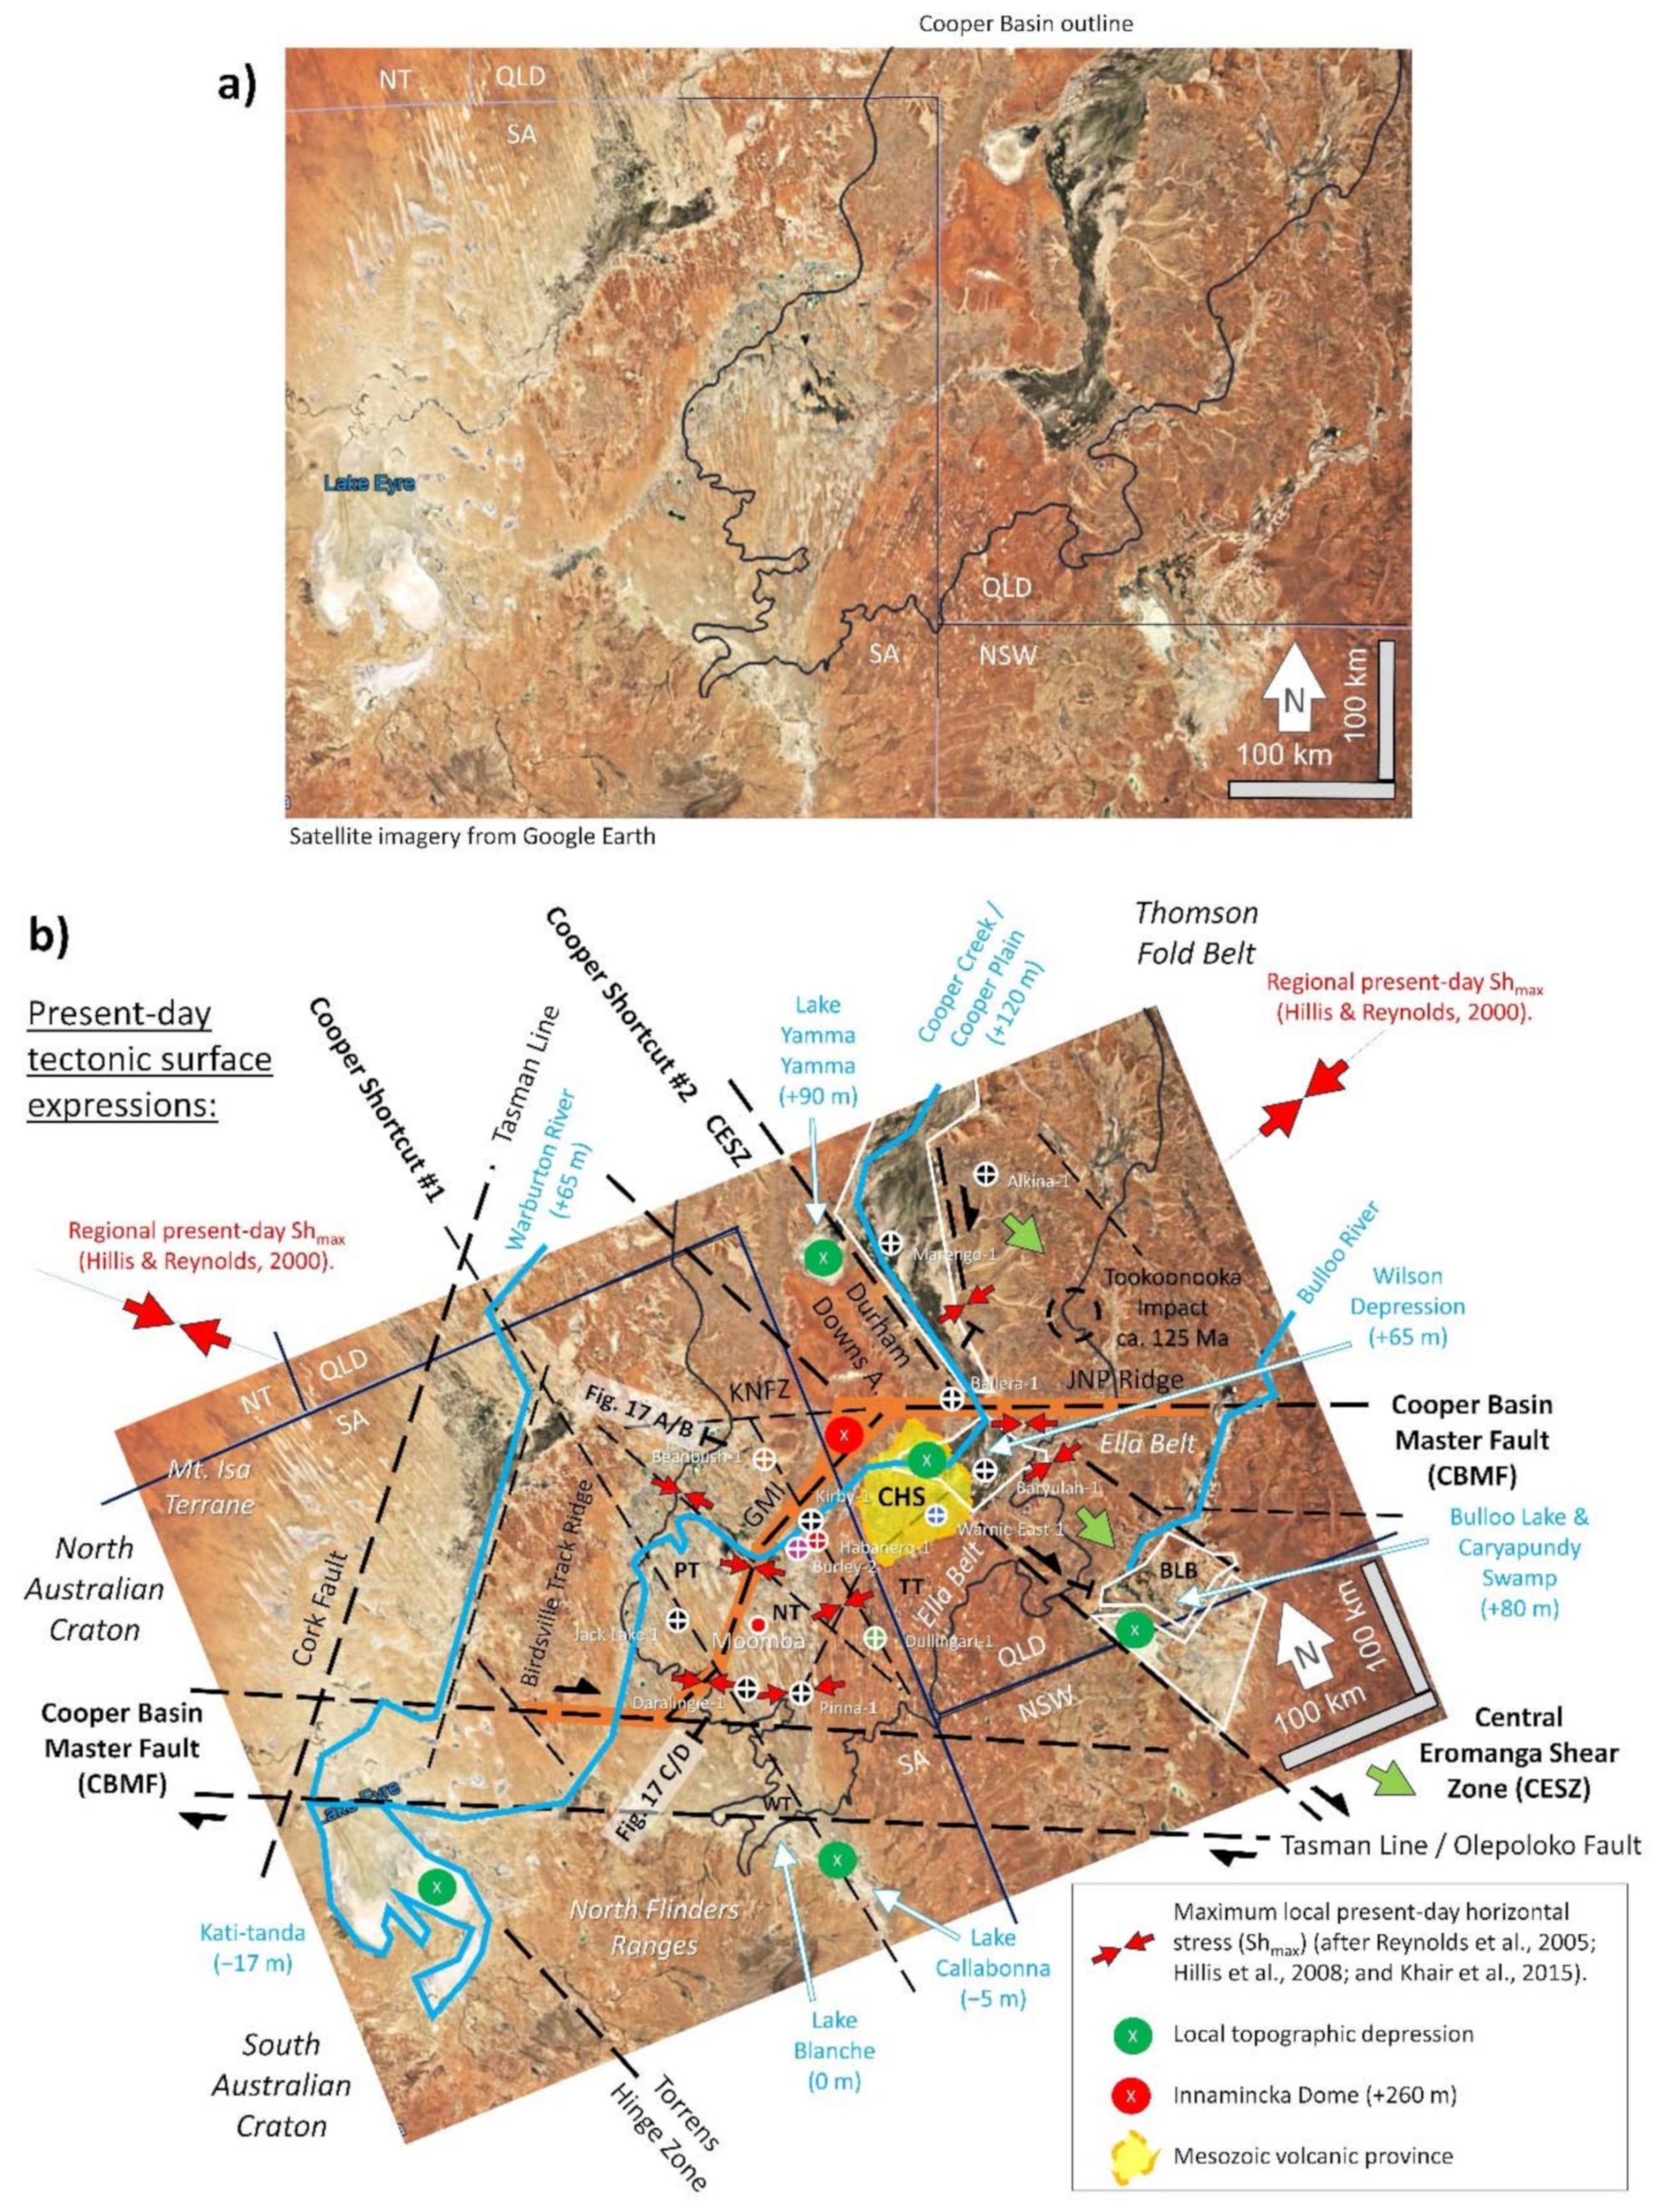
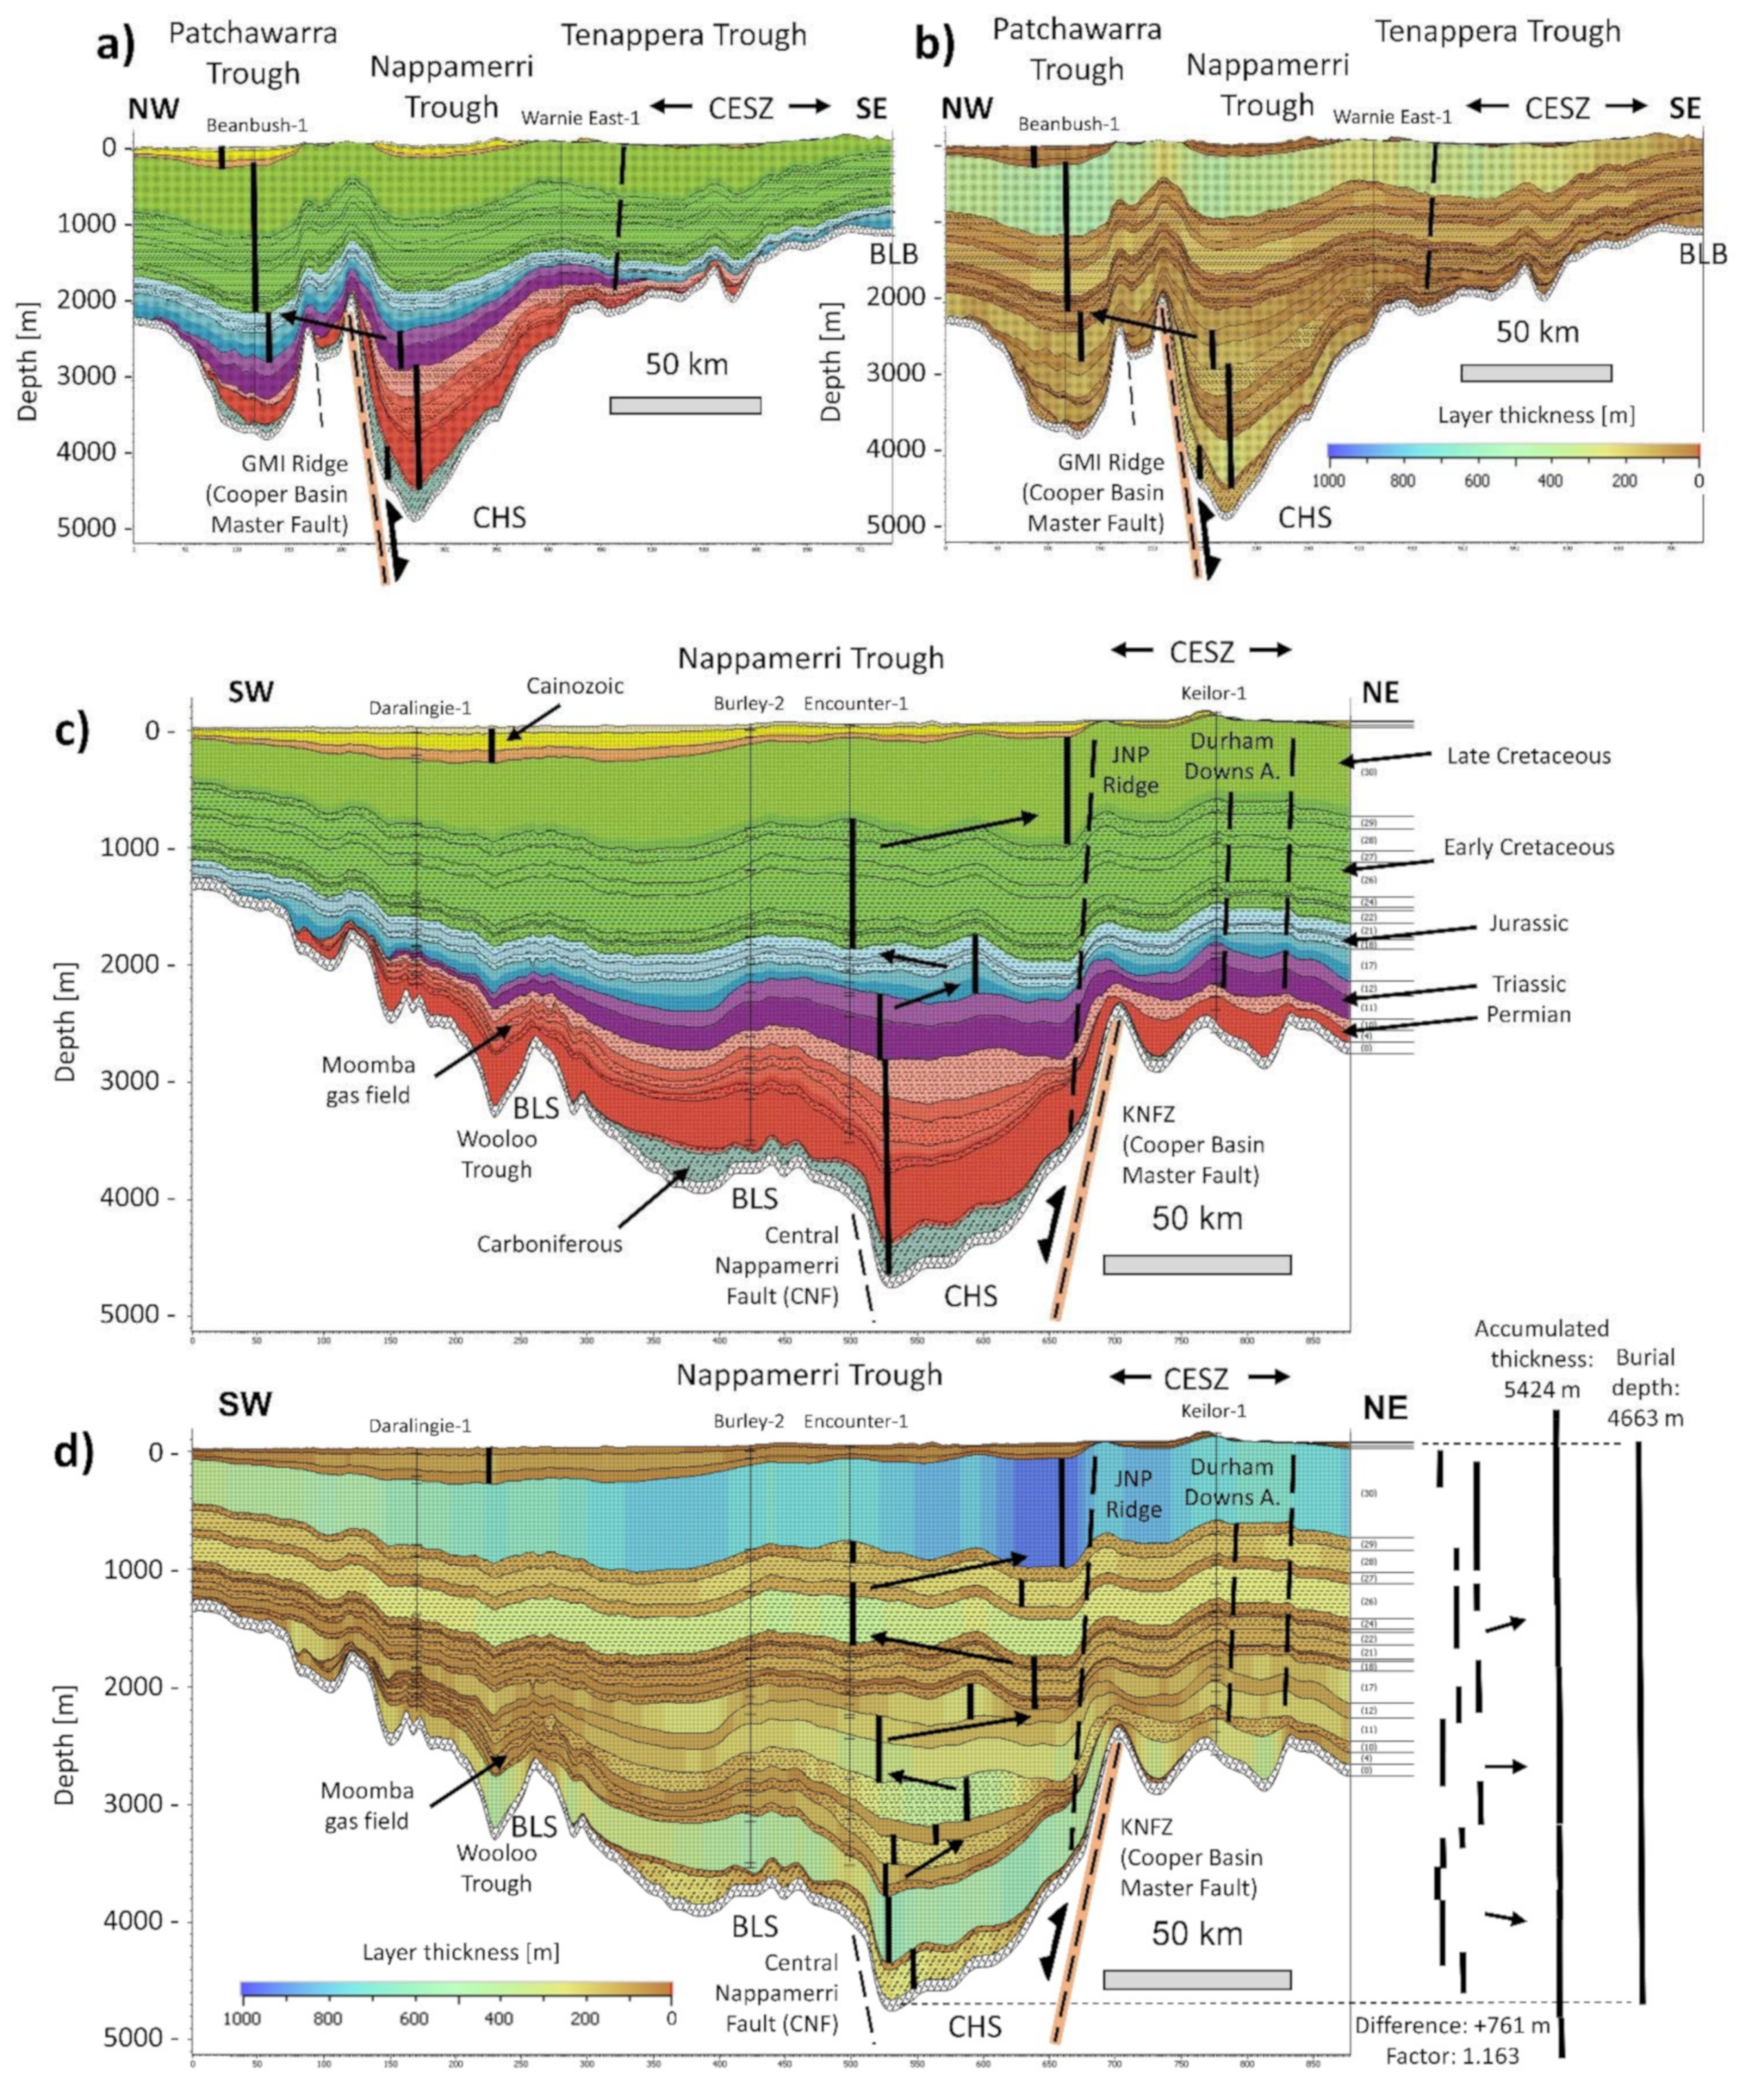
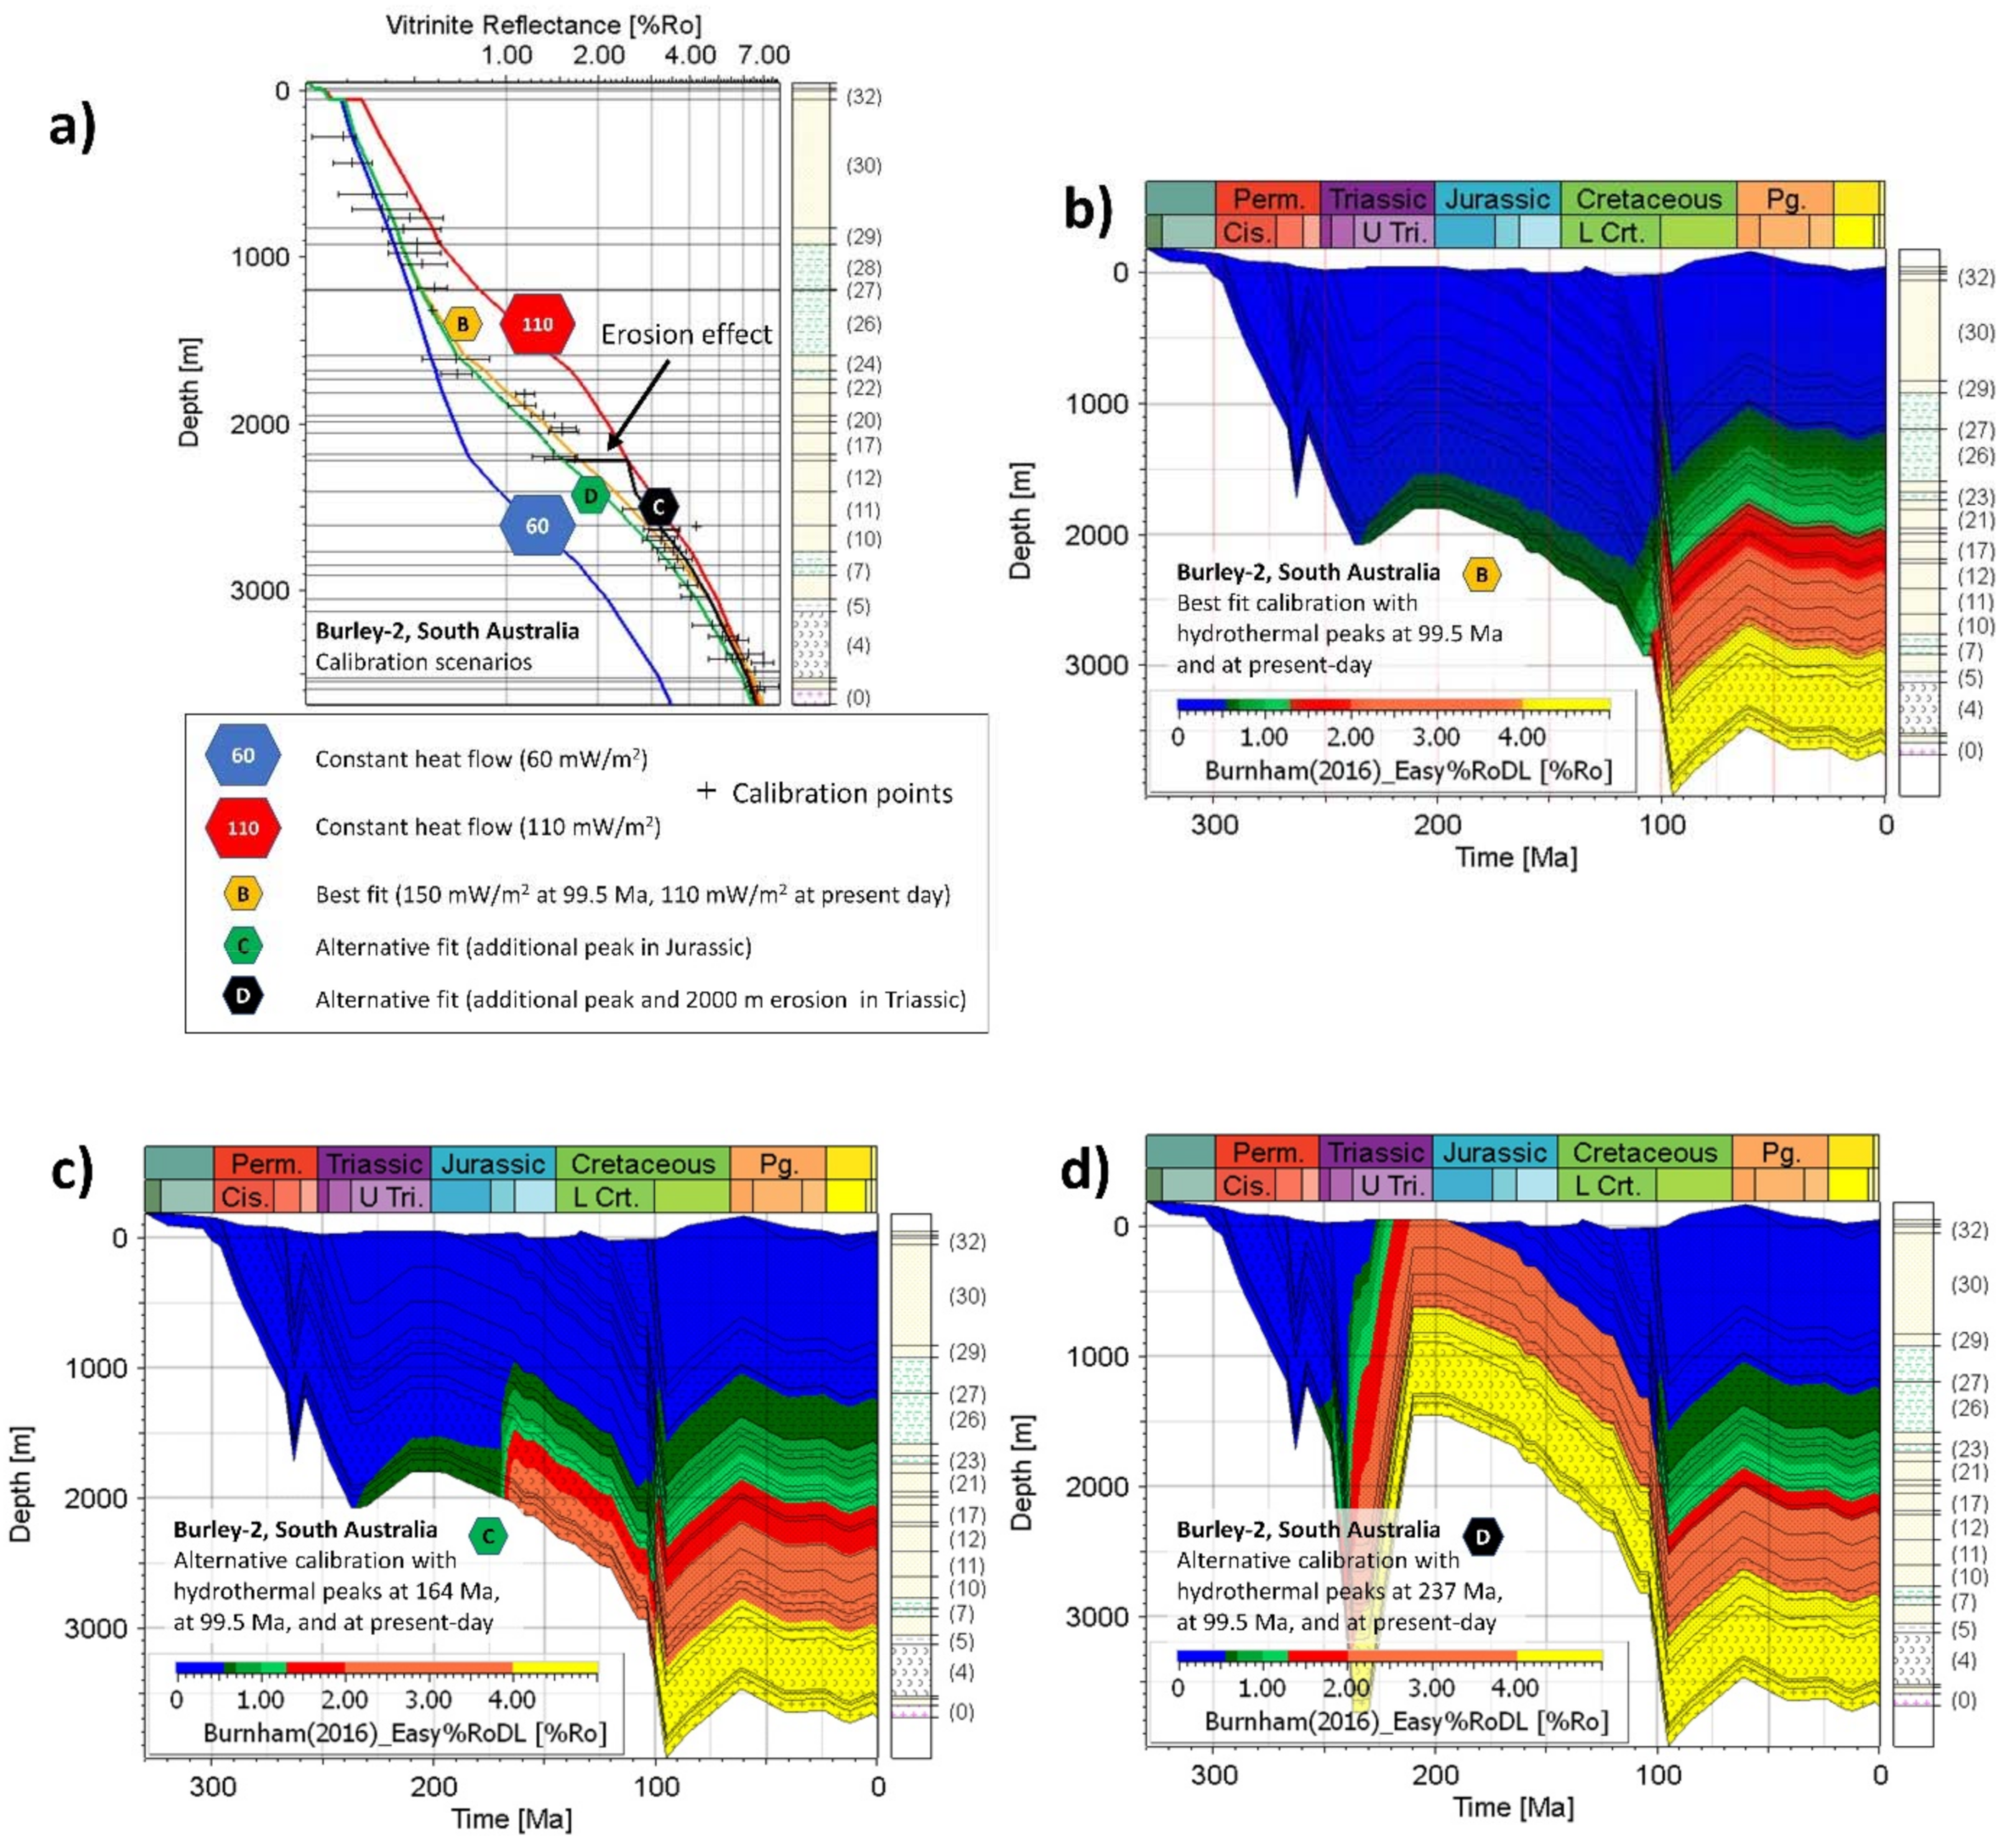
Table 1.
Overview of assigned layers and their ages used as input for the numerical models (modified after [8]). Unconformities are given in italic letters.
Table 1.
Overview of assigned layers and their ages used as input for the numerical models (modified after [8]). Unconformities are given in italic letters.
| Province | Short Name | Seismic Horizon | Top Age [Ma] | Horizon/Top Name | Average Preserved Thickness/Amount of Erosion [m] | Event Type | Key References |
|---|---|---|---|---|---|---|---|
| Lake Eyre Basin | (36) | DEM | 0 | Surface/Quaternary | ca. 35 | Deposition | Whiteway (2009) |
| (35) | 2 | Namba Unconformity | <50 | Erosion | Moussavi-Harami (unpublished results); Radke et al. (2012) | ||
| (34) | 12 | Namba Formation | ca. 90 | Deposition | Alley (1998), Moussavi-Harami (unpublished results); Radke et al. (2012) | ||
| (33) | 24 | Eyre Unconformity | <50 | Erosion | Moussavi-Harami (unpublished results); Radke et al. (2012) | ||
| (32) | 42 | Eyre Formation | ca. 60 | Deposition | Alley (1998), Moussavi-Harami (unpublished results); Radke et al. (2012) | ||
| Eromanga Basin | (31) | 62 | Winton Unconformity | 100–1200 | Erosion | Moussavi-Harami (unpublished results); Mavromatidis and Hillis (2005) | |
| (30) | A | 95 | Winton Formation | ca. 530 | Deposition | DMITRE (2001) | |
| (29) | 101 | Mackunda Formation | ca. 135 | Deposition | Gray et al. (2002); Radke et al. (2012) | ||
| (28) | 102 | Allaru Mudstone | ca. 240 | Deposition | Gray et al. (2002); Alexander et al. (2006); Radke et al. (2012) | ||
| (27) | 104 | Toolebuc Formation or Oodnadatta Format | ca. 80 | Deposition | Gray et al. (2002); Radke et al. (2012) | ||
| (26) | 108 | Wallumbilla Formation/Bulldog Shale | ca. 235 | Deposition | Hall et al. (2019) | ||
| (25) | 120 | Cadna-owie Unconformity | n.d. | Hiatus | Burger & Senior (2007); Bron et al. (2012); Gostin & Therriault (1997); Turtle et al. (2003) | ||
| (24) | C | 125 | Cadna-owie Formation, including Wyandra Sst | ca. 70 | Deposition | NGMA (2001); Gray et al. (2002); DMITRE (2009); Radke et al. (2012); Lavering (1991) | |
| (23) | 134 | Murta Formation, Hooray Sst, or Algebuckina Sst | ca. 20 | Deposition | Gray et al. (2002); Radke et al. (2012) | ||
| (22) | 136 | Namur Sst, incl. McKinlay mbr | ca. 75 | Deposition | Hall et al. (2019) | ||
| (21) | 144 | Westbourne Formation | ca. 85 | Deposition | Gray et al. (2002); Radke et al. (2012) | ||
| (20) | 152 | Adori Sandstone | ca. 75 | Deposition | Gray et al. (2002); Alexander et al. (2006) | ||
| (19) | 155 | Birkhead Unconformity | n.d. | Hiatus | Wainman et al. (2018), Turner et al. (2009), Radke et al. (2012) | ||
| (18) | 160 | Birkhead Formation | ca. 80 | Deposition | Gray et al. (2002); Radke et al. (2012) | ||
| (17) | H | 164 | Hutton Sst | ca. 375 | Deposition | DMITRE (2001); Gray et al. (2002); Radke et al. (2012) | |
| (16) | 185 | Poolowanna Fm | n.d. | Deposition | Hall et al. (2019) | ||
| (15) | 194 | Cuddapan Unconformity | n.d. | Hiatus | Moussavi-Harami (unpublished results) | ||
| (14) | 203 | Cuddapan Formation | n.d. | Deposition | Hall et al. (2015, 2019) | ||
| Cooper Basin | (13) | 210 | Nappamerri Unconformity | <180 | Erosion | Moussavi-Harami (unpublished results); McKellar (2013); Hall et al. (2015) | |
| (12) | N | 237 | Tinchoo Fm | ca. 125 | Deposition | DMITRE (2001); Hall et al. (2015) | |
| (11) | 247 | Arrabury Fm | ca. 190 | Deposition | DMITRE (2001); Hall et al. (2015) | ||
| (10) | P | 252 | Toolachee Formation/Top Permian | ca. 190 | Deposition | NGMA (2001); DMITRE (2009); Hall et al. (2015,2016b) | |
| (9) | 258 | Daralingie Unconformity | 75–350 | Erosion | Moussavi-Harami (unpublished results); Hall et al. (2015) | ||
| (8) | 263 | Daralingie Formation | ca. 80 | Deposition | DMITRE (2001); Hall et al. (2015, 2016b) | ||
| (7) | 267 | Roseneath Shale | ca. 120 | Deposition | Hall et al. (2015, 2016b) | ||
| (6) | 269 | Epsilon Formation | ca. 130 | Deposition | Hall et al. (2015, 2016b) | ||
| (5) | 274 | Murteree Shale | ca. 80 | Deposition | Hall et al. (2015, 2016b) | ||
| (4) | 277 | Patchawarra Formation | ca. 420 | Deposition | DMITRE (2001); Hall et al. (2015, 2016b) | ||
| (3) | 296 | Tirrawarra Sst | ca. 75 | Deposition | DMITRE (2001); Hall et al. (2015, 2016b) | ||
| (2) | 300 | Merrimelia Formation | ca. 300 | Deposition | DMITRE (2001); Hall et al. (2015, 2016b) | ||
| Warburton/Adavale basins | (1) | 304 | Warburton Unconformity | n.d. | Hiatus | ||
| (0) | Z | 320 | Top pre-Permian “basement”, equivalent in age to the Devonian Adavale Basin and the Big Lake Suite granodiorites | n.d. | NGMA (2001); DMITRE (2009); Hall et al. (2015, 2016b) |
Table 2.
Overview of main lithologies, corresponding thermal conductivity values (taken from [65]), and assignment of petroleum system elements.
Table 2.
Overview of main lithologies, corresponding thermal conductivity values (taken from [65]), and assignment of petroleum system elements.
| Province | Short Name | Top Age [Ma] | Bottom Age [Ma] | Layer Name (Queensland Equivalents when Different to South Australia) | Dominant Rock Type | Thermal Conductivity at 20 °C [WmK] | Assigned PSE |
|---|---|---|---|---|---|---|---|
| Lake Eyre Basin | (35) | 0 | 2 | Quaternary | Sandstone | 3.95 (standard sandstone) | Overburden |
| (33) | 12 | 24 | Namba Fm | Sandstone | 2.64 ± 0.63 | Overburden | |
| (32) | 42 | 62 | Eyre Fm | Sandstone | 2.19 ± 0.65 | Overburden | |
| Eromanga Basin | (30) | 95 | 101 | Winton Fm | Sandstone | 2.01 ± 0.53 | Overburden |
| (29) | 101 | 102 | Mackunda Fm | Siltstone | 2.93 ± 0.56 | Seal rock | |
| (28) | 102 | 104 | Oodnadatta Fm (Allaru Mdst) | Shale | 1.95 ± 0.13 | Seal rock | |
| (27) | 104 | 108 | Coorikiana Sst (Toolebuc Fm) | Shale | 2.54 ± 0.52 (2.65 ± 0.66) | Seal rock | |
| (26) | 108 | 120 | Bulldog Shale (Wallumbilla Fm) | Shale | 2.10 ± 0.13 (2.72 ± 0.64) | Seal rock | |
| (24) | 125 | 134 | Cadna-owie Fm, incl. Wyandra Sst | Siltstone | 2.08 ± 0.18 | Reservoir rock | |
| (23) | 134 | 136 | Algebuckina Sst (Murta Fm, Hooray Sst) | Siltstone | 4.24 ± 0.02 | Source rock | |
| (22) | 136 | 144 | Namur Sst, incl. McKinlay Mbr | Sandstone | 3.94 ± 0.57 | Reservoir rock | |
| (21) | 144 | 152 | Westbourne Fm | Shale | 4.00 ± 0.60 | Seal rock | |
| (20) | 152 | 155 | Adori Sst | Sandstone | 4.12 ± 0.56 | Reservoir rock | |
| (18) | 160 | 164 | Birkhead Fm | Siltstone | 4.85 ± 1.06 | Source rock | |
| (17) | 164 | 185 | Hutton Sst | Sandstone | 5.00 ± 0.84 | Reservoir rock | |
| (16) | 185 | 194 | Poolowanna Fm (modelled only in 1D) | Sandstone | 2.99 ± 0.69 | Source rock | |
| (14) | 203 | 210 | Cuddapan Fm (modelled only in 1D) | Sandy shale | taken from Poolowanna Fm | Reservoir rock | |
| Cooper Basin | (12) | 237 | 247 | Tinchoo Fm | Sandy shale | 2.30 ± 0.24 | Reservoir rock |
| (11) | 247 | 252 | Arrabury Fm | Siltstone/fine sand | 2.30 ± 0.24 | Reservoir rock | |
| (10) | 252 | 258 | Toolachee Fm | Siltstone/shale | 1.29 ± 0.36 | Source rock | |
| (8) | 263 | 267 | Daralingie Fm | Fine sandstone | 1.64 ± 0.31 | Source rock | |
| (7) | 267 | 269 | Roseneath Shale | Siltstone/shale | 2.45 ± 0.15 | Source rock | |
| (6) | 269 | 274 | Epsilon Fm | Fine sandstone | 1.55 ± 0.29 | Source rock | |
| (5) | 274 | 277 | Murteree Shale | Siltstone/shale | 2.60 ± 0.13 | Source rock | |
| (4) | 277 | 296 | Patchawarra Fm | Sand & coal | 1.61 ± 0.31 | Source rock | |
| (3) | 296 | 300 | Tirrawarra Sst | Fine sandstone | 4.35 ± 0.59 | Reservoir rock | |
| (2) | 300 | 304 | Merrimelia Fm | Conglomerate | 4.01 ± 1.47 | Reservoir rock | |
| WB | (0) | 320 | n.d. | Paleozoic Basement | Gneiss | 2.70 (standard gneiss) | Underburden |
Table 3.
Overview of source rock properties and assignment of kinetic models.
| Province | Source Rock Formation | Kerogen Type | Assigned Kinetic Model | Reported Avg. TOC [%] | Assigned TOC [%] | Reported Avg. HI [mg HC/g Rock] | Assigned HI [mg HC/g Rock] |
|---|---|---|---|---|---|---|---|
| Eromanga Basin | Toolebuc Fm | - | not assigned in this study | - | - | - | - |
| Murta Fm | III | Pepper & Corvi (1995), TII(B) | 0.6–2.2 | 1.7 | 125–200 | 150 | |
| Westbourne Fm | - | not assigned in this study | - | - | - | - | |
| Birkhead Fm | II, II/III, III | Pepper & Corvi (1995), TII(B) | 2.5–3.7 | 3 | >300 | 300 | |
| Poolowanna Fm | II, II/III | Pepper & Corvi (1995), TII(B) | 0.6–17.9 | 15 | >250 | 250 | |
| Cooper Basin | Toolachee Fm | II/III, III | Pepper & Corvi (1995), TIIIH(DE) | 21 | 21 | 190 | 190 |
| Daralingie Fm | II/III, III | Pepper & Corvi (1995), TIIIH(DE) | 18.9 | 18.9 | 200 | 200 | |
| Roseneath Shale | III | Pepper & Corvi (1995), TIII-IV(F) | 6.4 | 6.4 | 130 | 130 | |
| Epsilon Fm | II/III, III | Pepper & Corvi (1995), TIIIH(DE) | 26 | 26 | 210 | 210 | |
| Murteree Shale | III | Pepper & Corvi (1995), TIII-IV(F) | 5.6 | 5.6 | 140 | 140 | |
| Patchawarra Fm | II/III, III | Pepper & Corvi (1995), TIIIH(DE) | 24.7 | 24.7 | 216 | 216 |
Table 4.
Overview of assigned basal heat flow trends for the eight selected calibration wells. Regional mid-Cretaceous peak (99.5 Ma) in bold letters.
Table 4.
Overview of assigned basal heat flow trends for the eight selected calibration wells. Regional mid-Cretaceous peak (99.5 Ma) in bold letters.
| Age [Ma] | Alkina-1 | Beanbush-1 | Burley-2 | Dullingari-1 | Marengo-1 | Paning-1 | Springfield-1 | Warnie East-1 |
|---|---|---|---|---|---|---|---|---|
| 0.0 | 82 | 62 | 110 | 75 | 87 | 66 | 78 | 85 |
| 2.0 | 60 | 60 | 60 | 75 | 65 | 60 | 70 | 60 |
| 80.0 | 60 | 60 | 60 | 75 | 65 | 60 | 70 | 60 |
| 85.0 | 62 | 61 | 61 | 78 | 68 | 62 | 72 | 62 |
| 90.0 | 64 | 63 | 62 | 81 | 72 | 65 | 76 | 64 |
| 91.0 | 67 | 64 | 63 | 82 | 74 | 68 | 78 | 66 |
| 93.0 | 71 | 66 | 70 | 83 | 79 | 71 | 79 | 68 |
| 97.0 | 80 | 70 | 78 | 85 | 90 | 78 | 81 | 72 |
| 98.0 | 85 | 75 | 95 | 86 | 98 | 80 | 82 | 75 |
| 98.5 | 90 | 80 | 120 | 87 | 105 | 82 | 83 | 80 |
| 99.0 | 95 | 85 | 145 | 88 | 115 | 85 | 84 | 85 |
| 99.5 | 105 | 90 | 150 | 90 | 120 | 90 | 85 | 90 |
| 100.5 | 95 | 85 | 95 | 85 | 85 | 80 | 80 | 85 |
| 125.0 | 65 | 65 | 65 | 77 | 70 | 60 | 72 | 65 |
| 135.0 | 60 | 60 | 60 | 75 | 65 | 60 | 70 | 60 |
| 200.0 | 60 | 60 | 60 | 75 | 65 | 60 | 70 | 60 |
| 237.0 | 60 | 60 | 60 | 75 | 65 | 60 | 70 | 60 |
| 240.0 | 60 | 60 | 60 | 75 | 65 | 60 | 70 | 60 |
| 290.0 | 60 | 60 | 60 | 75 | 65 | 60 | 70 | 60 |
| 310.0 | 60 | 60 | 60 | 75 | 65 | 60 | 70 | 60 |
| 330.0 | 60 | 60 | 60 | 75 | 65 | 60 | 70 | 60 |
Publisher’s Note: MDPI stays neutral with regard to jurisdictional claims in published maps and institutional affiliations. |
© 2022 by the authors. Licensee MDPI, Basel, Switzerland. This article is an open access article distributed under the terms and conditions of the Creative Commons Attribution (CC BY) license (https://creativecommons.org/licenses/by/4.0/).
Share and Cite
MDPI and ACS Style
Röth, J.; Littke, R. Down under and under Cover—The Tectonic and Thermal History of the Cooper and Central Eromanga Basins (Central Eastern Australia). Geosciences 2022, 12, 117. https://0-doi-org.brum.beds.ac.uk/10.3390/geosciences12030117
AMA Style
Röth J, Littke R. Down under and under Cover—The Tectonic and Thermal History of the Cooper and Central Eromanga Basins (Central Eastern Australia). Geosciences. 2022; 12(3):117. https://0-doi-org.brum.beds.ac.uk/10.3390/geosciences12030117
Chicago/Turabian StyleRöth, Joschka, and Ralf Littke. 2022. "Down under and under Cover—The Tectonic and Thermal History of the Cooper and Central Eromanga Basins (Central Eastern Australia)" Geosciences 12, no. 3: 117. https://0-doi-org.brum.beds.ac.uk/10.3390/geosciences12030117
Note that from the first issue of 2016, this journal uses article numbers instead of page numbers. See further details here.