Article

Fostering Geoethics in Flood Risk Reduction: Lessons Learned from the EU Project LIFE PRIMES

Department of Life and Environmental Sciences, Università Politecnica delle Marche, 60131 Ancona, Italy
*
Author to whom correspondence should be addressed.
Submission received: 29 December 2021 / Revised: 23 February 2022 / Accepted: 9 March 2022 / Published: 11 March 2022
(This article belongs to the Collection Ethics in Geosciences)

Abstract

:
Despite the concrete evidence of human responsibilities with the ongoing environmental crisis, tangible changes toward low disaster-risk development models are slow in coming and delayed in implementation. This paper discusses the principles of geoethics underpinning flood risk reduction by analyzing the results of the EU project LIFE PRIMES (Preventing flooding RIsks by Making resilient communitiES). Through the administration of a questionnaire, issues of flood literacy, effective communication and individual responsibility concerning flood hazard and exposure were investigated. Directly engaging local communities, the LIFE PRIMES project appears to have increased citizens attention toward environmental ethics, thus providing an encouraging perspective for appropriate human–environment interaction.

1. Introduction

Human survival on planet Earth has always depended on the quality and quantity of natural resources, yet the extent to which human beings rely on nature has increased over time [1]. The very name of the current unit of geologic time, “Anthropocene”, properly describes the magnitude of anthropic bearing; an epoch in which human activities have become a consistent force capable to influence changes on the Earth system [1]. Unfortunately, this expanded human capacity to impact the planet’s climate and ecosystems is adding a ‘systemic’ dimension to risk [2], increasing the threat on exposed human assets [3,4]. Risk reduction activities must go beyond mere economic considerations and contemplate human and political ecology dimensions, to foster Homo sapiens’ responsibility towards the Earth ecosystem [3]. Therefore, the challenge is to reconsider our relationship with Nature and to pursue disaster prevention and mitigation by making resilient communities (adapting to nature) rather than increasing our resistance to natural hazards (controlling nature) [5].
Geoethics can become a guiding beacon in such challenge [6,7,8,9], shaping cultural and operational changes [8] to grow personal and collective responsibility towards nature [7,9,10,11]. Originally, the concept of geoethics was minted by Earth scientists to indicate the necessity to bring geography, ethics, moral philosophy, and justice principles [7] into the human-geosphere discourse [6,9]. However, the concept of geoethics evolved towards a new concept of global ethics [8], promoting sustainable use of natural resources, reducing disaster risks, and fostering scientific dissemination [11,12,13]. As a matter of fact, the evolving concept of geoethics encloses a joint commitment to cultural change within the scientific community, government, and population at large [14]. Among the various geohazards, floods require particular attention considering the global distribution of the phenomena and the significant changes in cultural, social, and economic patterns needed to reduce the related risks [15]. To this end, geoethics principles can be advocated by: (i) exchanging knowledge of flood hazard; (ii) enhancing interaction between the political, scientific, and societal sphere; (iii) increasing awareness of personal responsibility in causing flood disasters and, consequently, increasing the willingness to change habits to reduce risk.
Indeed, the way risk is perceived changes over time [14] and space [16], and is strongly related to direct and indirect experience with disasters [17,18]. In geoethical terms, disaster prevention means developing an ethical way of defining possible solutions (both in terms of political and scientific principles [8,19]) to protect the populations from risk and destruction [10]. In other words, disaster risk reduction cannot be separated from a collaboration between science, politics, and citizens [7,16], and requires overcoming communicational barriers [20] while sharing the challenge among each component of the community. Public engagement and participatory processes are essential for promoting a shared strategy because unidirectional and top-down communications (e.g., journals or television) are not always effective to reduce risk [20,21,22]. Finally, particular attention should be devoted to the intergenerational discourses and promises about environmental sustainability; the way in which we interact with nature will have tangible social, economic, and environmental implications for the future human generations [8].
This study has been conducted within the European research project LIFE PRIMES “Preventing flooding Risks by Making resilient communitiES” (see http://www.lifeprimes.eu/, accessed on 23 December 2021). The focus of the project was to study strategies of climate change adaptation in ten Italian communities of Emilia-Romagna, Marche, and Abruzzo Regions highly vulnerable to flood hazard. This article aims to investigate how the LIFE PRIMES activities influenced ethics and responsibility toward the environment in the study areas. The discussed results intend to explore three main facets of geoethics: (1) citizens flood literacy, namely their understanding of flood hazard and the related risk, (2) effective communication and exchange of information between authorities and citizens, and (3) perceived personal responsibility in flood risk.

2. Materials and Methods

2.1. The Study Areas and the Flood Risk Reduction Activities

Figure 1 and Table 1 show the ten municipalities from Emilia-Romagna, Marche, and Abruzzo Regions (central Italy), participating in the LIFE PRIMES project. It must be clarified that for the municipalities of Ravenna (Emilia-Romagna Region), San Benedetto del Tronto (Marche Region), and Pineto (Abruzzo Region), the project’s field activities were not carried out across the entire municipal territory, but only on their small districts notoriously impacted by flooding events (Lido di Savio, Sentina, and Scerne di Pineto, respectively). The other municipalities from Emilia-Romagna in descending order of size and population were: Imola (205 km2 and 69,936 inhabitants), Lugo (117 km2 and 32,317 inhabitants), Poggio Renatico (80 km2 and 9791 inhabitants), Mordano (21 km2 and 4692 inhabitants), and Sant’Agata sul Santerno (9 km2 and 2918 inhabitants) [23]. In the Marche Region, the other municipality involved was Senigallia (118 km2 and 44,616 inhabitants) [24], and in the Abruzzo Region, Torino di Sangro (32 km2 and 3049 inhabitants) [25].
The project, conducted between October 2015 and December 2018, aimed at enhancing flood resilience in the selected communities through their engagement in various of flood risk reduction measures. All involved municipalities had suffered from flood impacts (Table 1). More in detail, the types of hazards experienced by these communities were: (i) river floods; (ii) coastal floods; and (iii) flash floods [26].
The flood risk reduction activities, organized by the project LIFE PRIMES between October 2017 and May 2018, comprised four kinds of actions: civic adaptation plans, workshops, alert simulations, and a theatrical play (Table 1).
The civic adaptation plans consisted of a collection of adaptation actions proposed by the citizens of the pilot municipalities and compiled through a web portal (http://www.lifeprimes.eu/index.php/piano-di-adattamento/?lang=en, accessed on 23 December 2021), which included tests, tutorials, and best practices concerning flood risk. The citizens were asked to discuss and propose actions according to three macro-areas: how to keep the population informed, what to propose to the local public administration, and what to do in their family, community, and workplace level. As of April 2018, a total of 520 local adaptation plans were collected, the majority of which came from Marche (224 in San Benedetto del Tronto and 60 in Senigallia), followed by those from Emilia-Romagna (63 in Lugo, 62 in Sant’Agata sul Santerno, 46 in Poggio Renatico, 26 in Imola, 16 in Ravenna, and 4 in Mordano) and from Abruzzo (11 in Pineto and 8 in Torino di Sangro).
Informational workshops for local citizens and administrators were carried out in each pilot area. The topics discussed in the workshops concerned flood risk, climate change, and their perception. The Emilia-Romagna Region hosted four workshops, two in Poggio Renatico (tallying 66 participants), one in Lugo and the Santerno area (tallying 27 participants), and one in Lido di Savio (tallying 5 participants). The Marche Region hosted two workshops, one in Senigallia (tallying 33 participants) and one in San Benedetto del Tronto (tallying 43 participants). The Abruzzo Region hosted two workshops, one in Pineto (tallying 14 participants) and one in Torino di Sangro (tallying 10 participants).
Civil protection exercises on flood simulations were also held in each region, with the aim of testing the capabilities of the civil protection system and providing a flood emergency training opportunity for participants. Two exercises were conducted simultaneously in Sant’Agata sul Santerno and Imola in Emilia-Romagna (tallying 118 participants); similarly, two simultaneous exercises were held in Senigallia and San Benedetto del Tronto in Marche (tallying 840 participants), and one in Pineto for Abruzzo (tallying 46 participants). Students from elementary and middle schools participated in the simulations held in Emilia-Romagna and Marche.
Finally, a theatrical representation titled: “La margherita di Adele 2.0” (Adele’s daisy 2.0) was proposed in San Benedetto del Tronto in the Marche Region. The idea was to promote climate change awareness, through the artistic language of theatrical representation, which starting from rational scientific bases tried to stir-up emotions. At the end of the show, a group of experts answered the questions and curiosities of the audience (estimated to be around 100 people).

2.2. Data Collection and Analysis

To investigate the influence of the activities carried out by the project LIFE PRIMES, a questionnaire was distributed to the residents of the studied areas. The survey did not aim at showing variations at the individual level, but rather at assessing community involvement with the project.
Data collection was twofold: a preliminary survey in the studied areas carried out prior to the project activities (ex-ante phase) and a follow-up survey performed after the activities of LIFE PRIMES (ex-post phase). The ex-ante phase was performed in the period from October 2016 to June 2017, and the ex-post phase was carried out in the period from December 2017 to July 2018 [27]. In the five areas involved in the simulation exercises (Imola, San’Agata sul Santerno, Senigallia, San Benedetto, and Pineto), the ex-post questionnaires were collected after each simulation.
The questionnaires were administered using a face-to-face methodology and the sample was established through a nonparametric per quota method. The reason for this choice is that nonparametric tests do not require preliminary assumptions about the nature of the studied population, and quota sampling allows stratified sampling in which the selection within strata is non-random [28]. In this study, the sample was stratified based on the residence of the interviewees in the pilot areas. Moreover, a cross-sectional approach has been adopted between the ex-ante and ex-post phases. This means that the people interviewed in the ex-post phase were not necessarily the same individuals of the ex-ante phase. To be included in the ex-post survey respondent ought to have participated in at least one of the project LIFE PRIMES activities. In this way it was possible to: (i) avoid a potential “memory effect” of the previous questionnaire, which could have altered the answers and (ii) meet the project LIFE PRIMES purpose of favoring spontaneous participation of citizens in the activities [27,28]. As noted above, the survey did not aim at analyzing individual variation of flood risk awareness or perception.
The questionnaire was structured in two segments, the first one, aimed at outlining the demographic profile of the respondents, and the second one, focusing on specific aspects related to flood risk and geoethics (Table 2). Four kinds of questions were included in the questionnaire: (a) single answer (respondents could select only one preset choice); (b) multiple choices (respondents could select more than one preset choice); (c) psychometric assessment (Likert scale); (d) open ended answer, with no preset choices (Table 2).
The 12 questions used for this study represent the segment with a geoethics scope of the larger questionnaire administered to the population involved to the project LIFE PRIMES. Specifically, the selected questions focused on: (i) flood literacy (the citizens’ knowledge of flood hazard and risk), (ii) effective communication (easiness for citizens to flood information sources), and (iii) personal responsibility (citizens’ sense of responsibility towards flood risk reduction) (Table 2). The answers to each question were classified depending on the related importance for achieving the objectives of flood literacy, effective communication, and personal responsibility. Successively, the difference (Δ) between the response percentages of the ex-ante and ex-post phases was calculated for all the study areas (See Appendix B). If such differences, whether negative or positive, tended to comply the objectives of the study, the responses were considered as community “improvement”; on the contrary, if the differences did not comply to such objectives, they were considered as community “deterioration”. For instance, an increased percentage of respondents who believe that deforestation can cause floods was considered an improvement, whereas an increased percentage of respondents who did not believe that flood events might become more frequent and destructive was considered a deterioration.

3. Results and Discussion

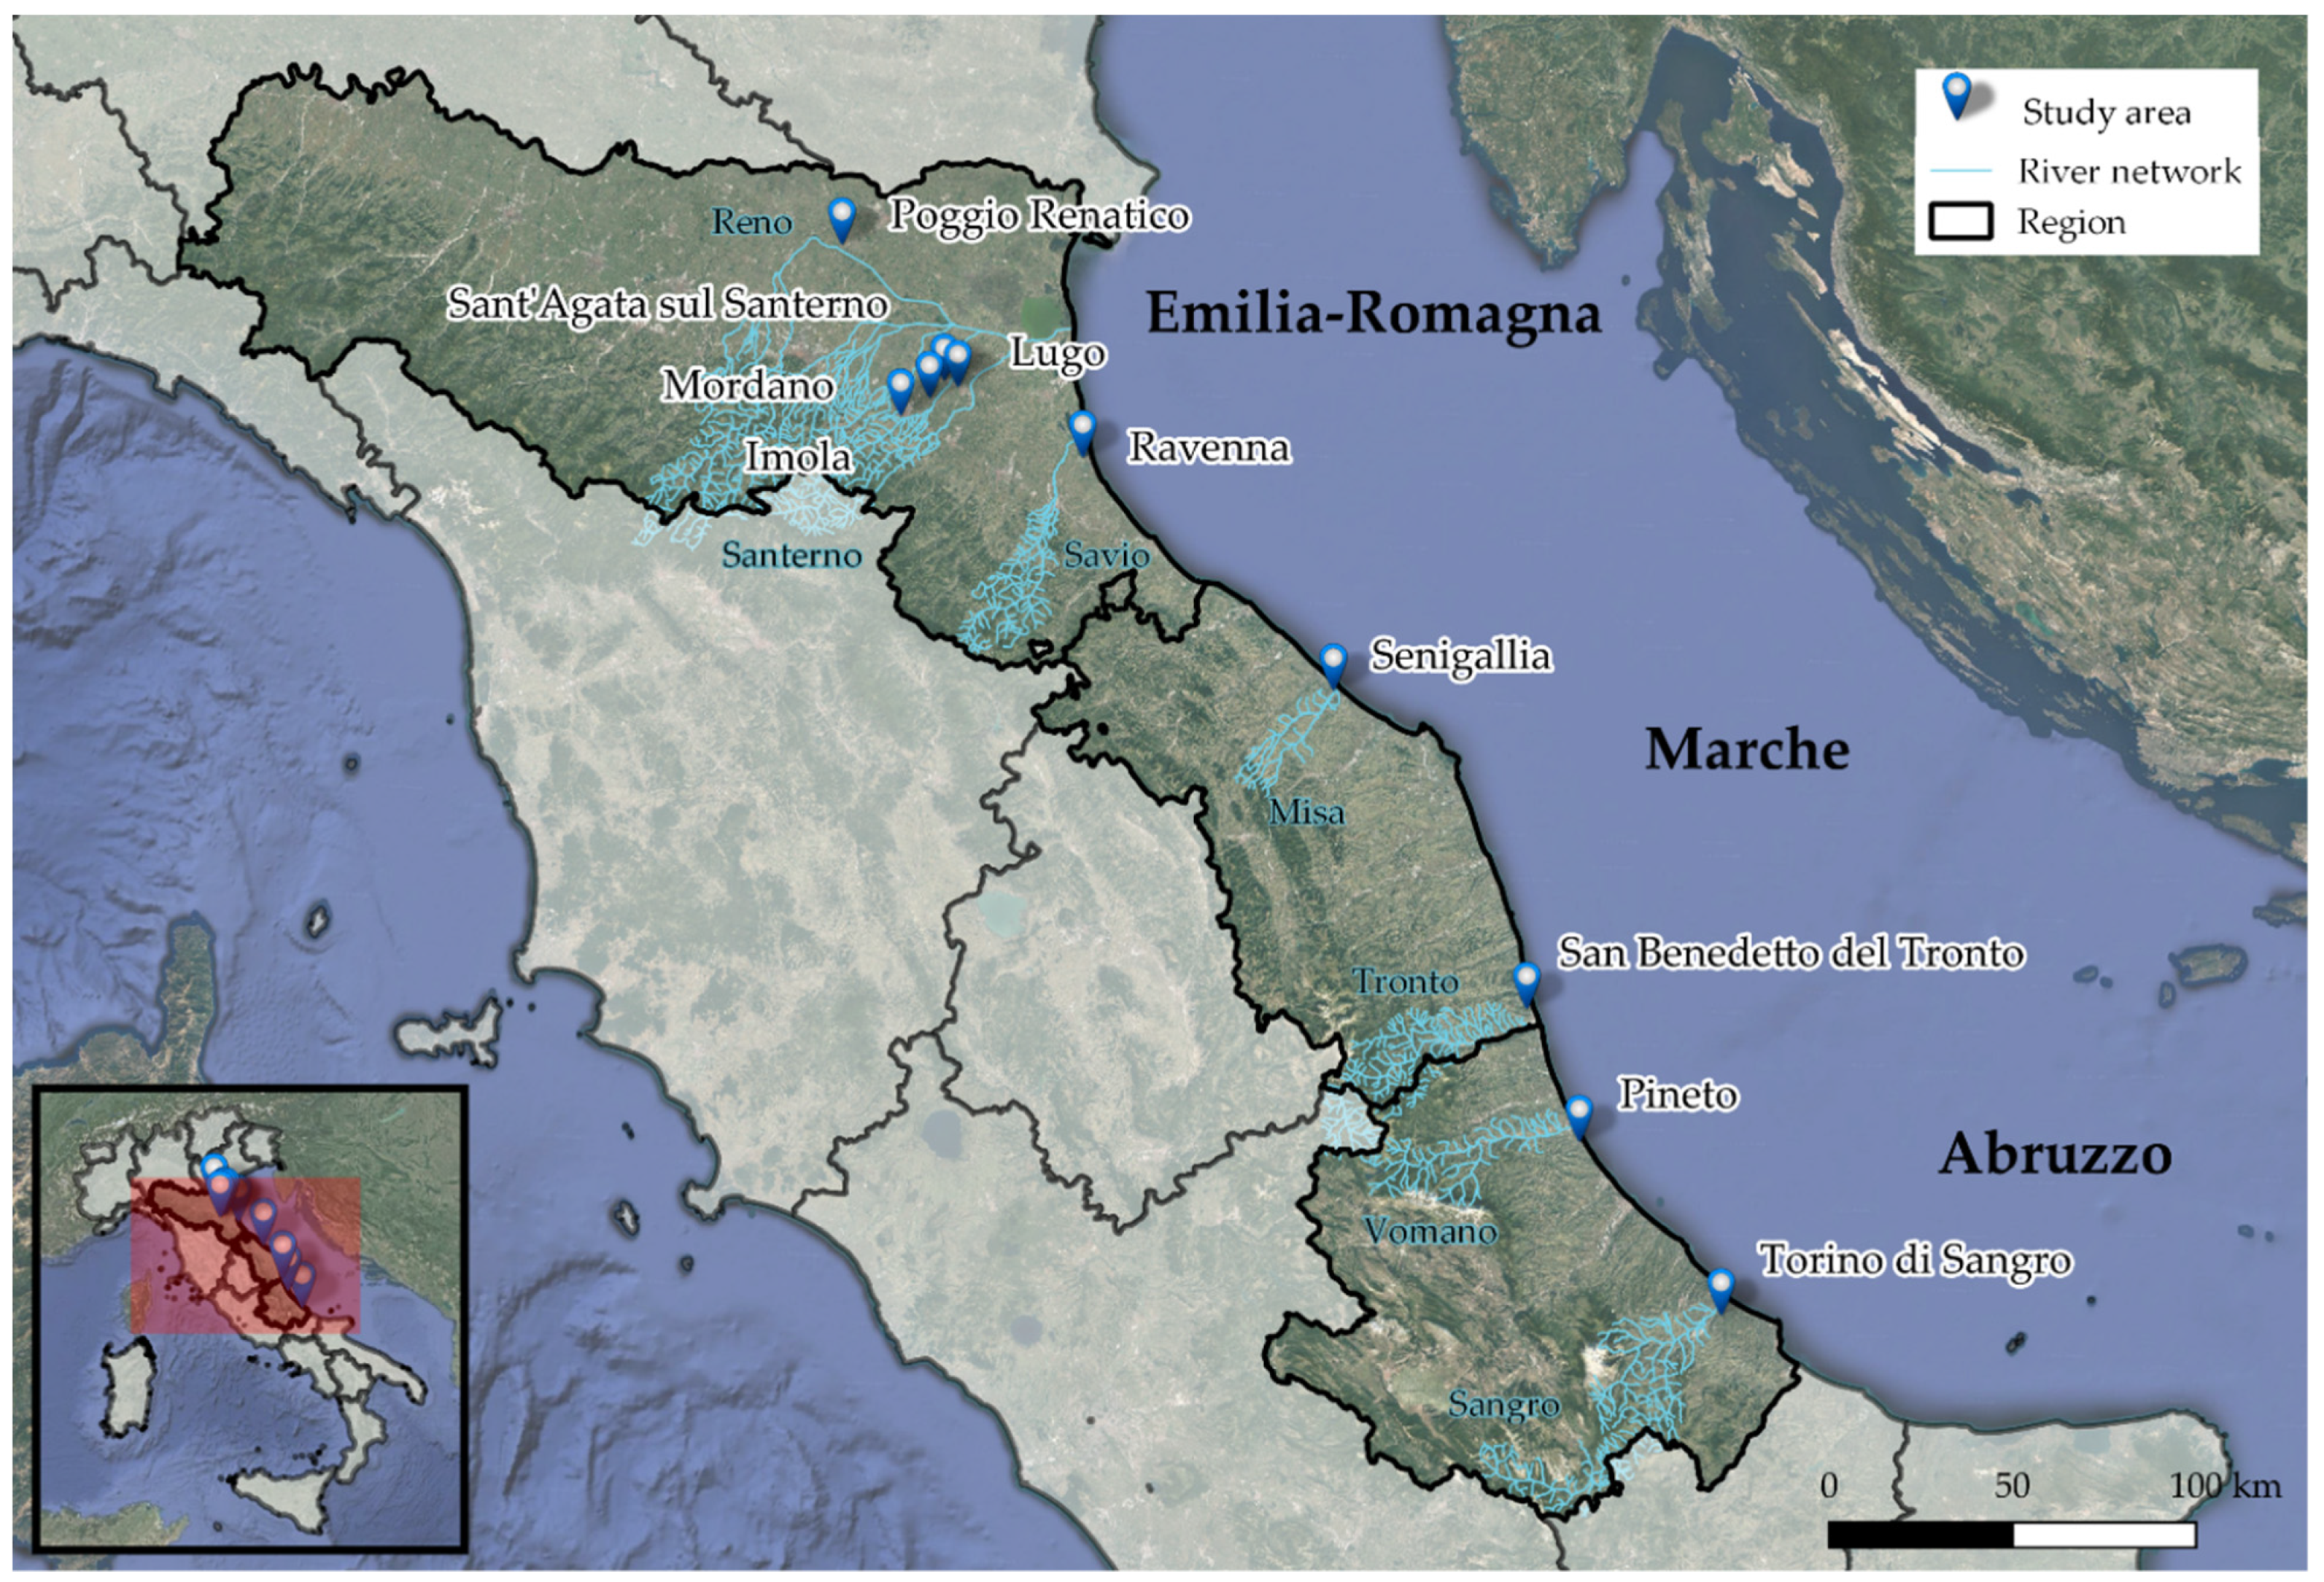
A total of 377 and 370 questionnaires were collected, respectively, during the ex-ante (EA) and the ex-post (EP) phases (Table 1). During the EA phase, 257 answers were collected from Emilia-Romagna (25 from Poggio Renatico, 101 from Imola, 80 from Lugo, 23 from Mordano, 12 from Sant’Agata sul Santerno, and 16 from the district of Lido di Savio in Ravenna). Proceeding towards the south, 85 answers were collected from Marche (67 from Senigallia and 18 from the district of Sentina in San Benedetto del Tronto) and 35 answers were collected from Abruzzo (22 from the small area of Scerne di Pineto in Pineto and 13 from Torino di Sangro). During the EP phase, 248 answers were collected from Emilia-Romagna (106 from Imola, 82 from Lugo, 23 from Mordano, 15 from Poggio Renatico, 11 from Sant’Agata sul Santerno, and 11 from the small area of Lido di Savio in Ravenna). Proceeding towards the south, 88 answers were collected from Marche (70 from Senigallia and 18 from the small area of Sentina in San Benedetto del Tronto) and 34 answers were collected from Abruzzo (22 from the small area of Scerne di Pineto in Pineto and 12 from Torino di Sangro). Because the LIFE PRIMES Project required a spontaneous participation of adult respondents, the profile of respondents varied among the pilot areas and differences emerged also between the EA and EP phases (Table A1, Appendix A). According to the Italian Institute of Statistics [29], the demographic characteristics of the selected sample compared rather well with those of the whole population in terms of “gender” in Poggio Renatico and Sant’Agata sul Santerno during the EA phase, and in Lugo and Sant’Agata sul Santerno during the EP phase. However, the sample did not compare well in terms of age; hence, the data collected did not allow meaningful comparisons for the variable “age”. As a consequence, results do not reflect the demographic characteristics of the resident population of this or that municipality, but might contribute to the debate about whether pro-environmental behaviors are influenced by gender, age, or education [30] and how this reflects into geoethics and disaster risk reduction [9].
In the following paragraphs, the effects of the activities of the LIFE PRIMES project are discussed, assembled into three main themes, namely flood literacy, effective communication, and personal responsibility, which follow the social values of geoethics, namely a responsible approach to the environment, the advancement of knowledge, and the increase of personal and collective resilience [31].

3.1. Geoethics and Flood Literacy

Effective decisions concerning floods have already been related to a sound knowledge about flood dynamics and the ability to understand risk information [32]. Hence, it appears significant to investigate the efficacy of the LIFE PRIMES project in increasing the knowledge base about floods in the perspective of strengthening the related awareness and responsiveness of the involved local populations. In geoethical terms, the intention is to verify whether the project was able to stimulate a social and ethical reflection on the basic aspects of flood risk. As mentioned, three questions (
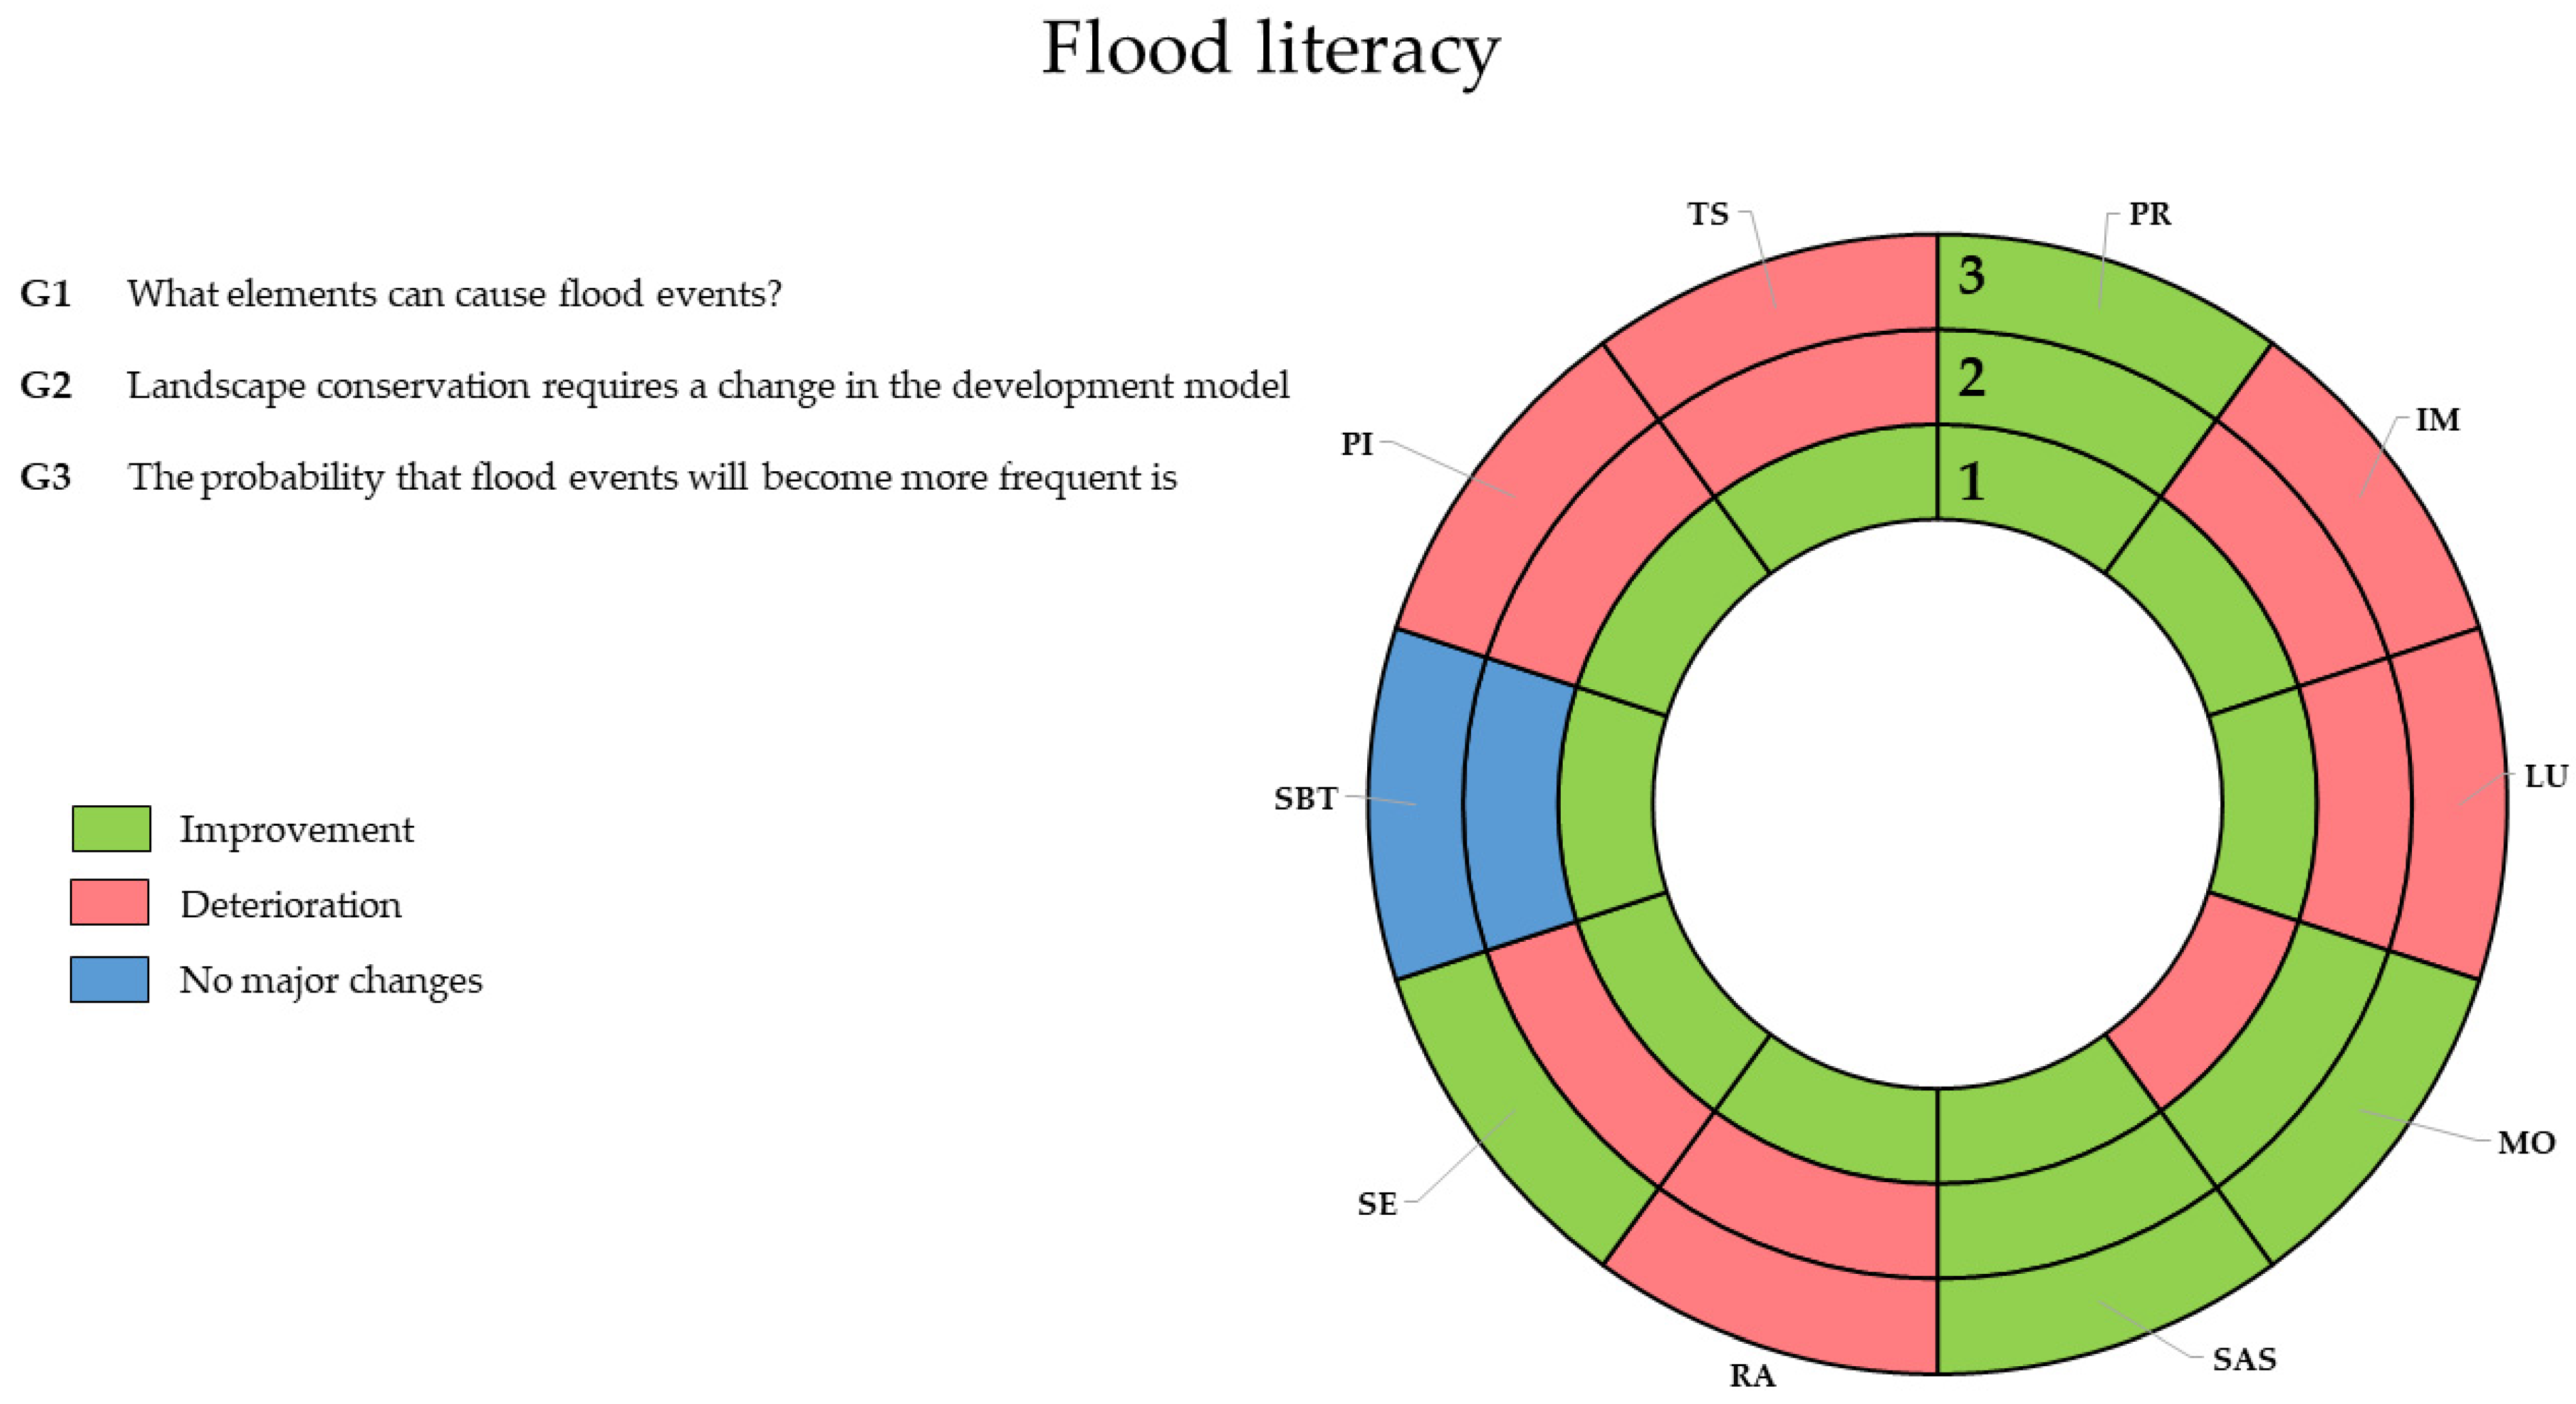
Table 2) explored this theme, ranging from the possible conditions that favor floods (G1 and G2) and the perceived future trends (G3). Figure 2 reports the major trends that were observed for each pilot area. Questions are respectively represented in circles from the center to the outer area, comparing ex-ante and ex-post results. Details of the responses are provided in Table A2, Table A3 and Table A4 (Appendix B). G1 proposed specific activities that relate humans to the environment, but not necessarily to floods. Consequently, the selection of ‘Agriculture’, ‘Urbanized areas’, ‘Deforestation’, or ‘Failure of urban infrastructure’ was interpreted as a progress toward a strengthened flood knowledge, and thus, an advancement in the development of geoethics at a local level. On the other hand, G2 focused on the role of the management of local environment. In this sense, the recognition of the need to rethink the current critical paradigm was considered a signal of the awakened contemplation of landscape planning and management ethics. Lastly, G3 concerned the probable trend in frequency of flood events, thus tracking and evidencing the eventual consolidation of a shared knowledge base between scientists and populations.
The results suggest that PRIMES activities raised awareness of the predisposing conditions to flood (G1). As a matter of fact, all pilot areas show a consolidation in understanding the potential root causes of such a hazard. In particular, the role of urban infrastructural failures gains the widest agreement, followed by the effects of deforestation. Conversely, respondents apparently fail to retain the relevance of agricultural activities and, partially, of urban settlements. Nevertheless, the only exception to the general positive trend is represented by the municipality of Mordano, where respondents were not directly involved in the proposed exercises.
Regarding the issue related to a novel approach for landscape planning (G2), the picture becomes more scattered, highlighting the significant discordance. More than half of the respondents from all pilot areas were not able to grasp the relevance of landscape management. Nonetheless, where the awareness increased, it did so considerably; for example, see the results for the municipalities of Mordano, Sant’Agata sul Santerno, and Poggio Renatico. These same pilot areas, with the addition of Senigallia (Marche), also reported positive responses in terms of expected flood future trends (G3). Unfortunately, failure to acknowledge the increasing threat of floods was analogously high in Imola, Lugo, Ravenna, Pineto, and Torino di Sangro. Responses appear to be positively associated to the implementation of PRIMES simulations, although such activities might have not been effective in all pilot areas (see the case of Pineto). The results of questions G2 and G3 suggest that, when effective, future-oriented activities might support the development of a long-term outlook on flood risks.
The flood-emergency simulation performed with LIFE PRIMES activities in the pilot areas of Imola, Sant’Agata sul Santerno, Senigallia, San Benedetto del Tronto, and Pineto, extended residents’ involvement. It is relevant to observe that these events increased knowledge and awareness of flood risks. Additionally, such instructive effects appear to have spread (in part) in the nearby municipalities, although this overspilling was registered only in larger municipalities (e.g., Imola and Ravenna). The robustness of social ties was inversely related to the dimension of the urban area, suggesting that larger settlements rarefy communication effectiveness [33], thus also hampering knowledge development. In Ravenna, for example, the “memory effect” may have followed a time decay pattern [27,33]. Nonetheless, in some cases (e.g., Pineto), the efficacy of the activities appears to be undermined by other external factors. Certainly, the literature reveals that numerous variables and pre-existing conditions might influence the dynamics of knowledge building. For example, the physical properties of the considered extreme event appear significant, especially depending on whether or not such properties urge a personal involvement [34]. Furthermore, numerous studies refer the fundamental role of past experiences in consolidating personal awareness and capacities related to risk management [35,36,37]. It is generally acknowledged that events that promote thorough involvement of local communities convey significant positive changes in the approach towards risk management, strengthening local resilience in terms of both adapting and coping capacities. In conclusion, the flood simulation activities promoted within the LIFE PRIMES project may well consolidate flood literacy (one of the major pillars of geoethics) by raising individual and collective consciousness as well as strengthening mutual exchanges between experts and local populations [38,39].

3.2. Geoethics and Effective Communication

The concept of geoethics is directly associated also with the challenge of risk communication [8]. Indeed, effective communication is the result of cooperation among scientists, politicians, and citizens to transfer knowledge that can be used to reduce flood risk [40]. For this reason, four questions (
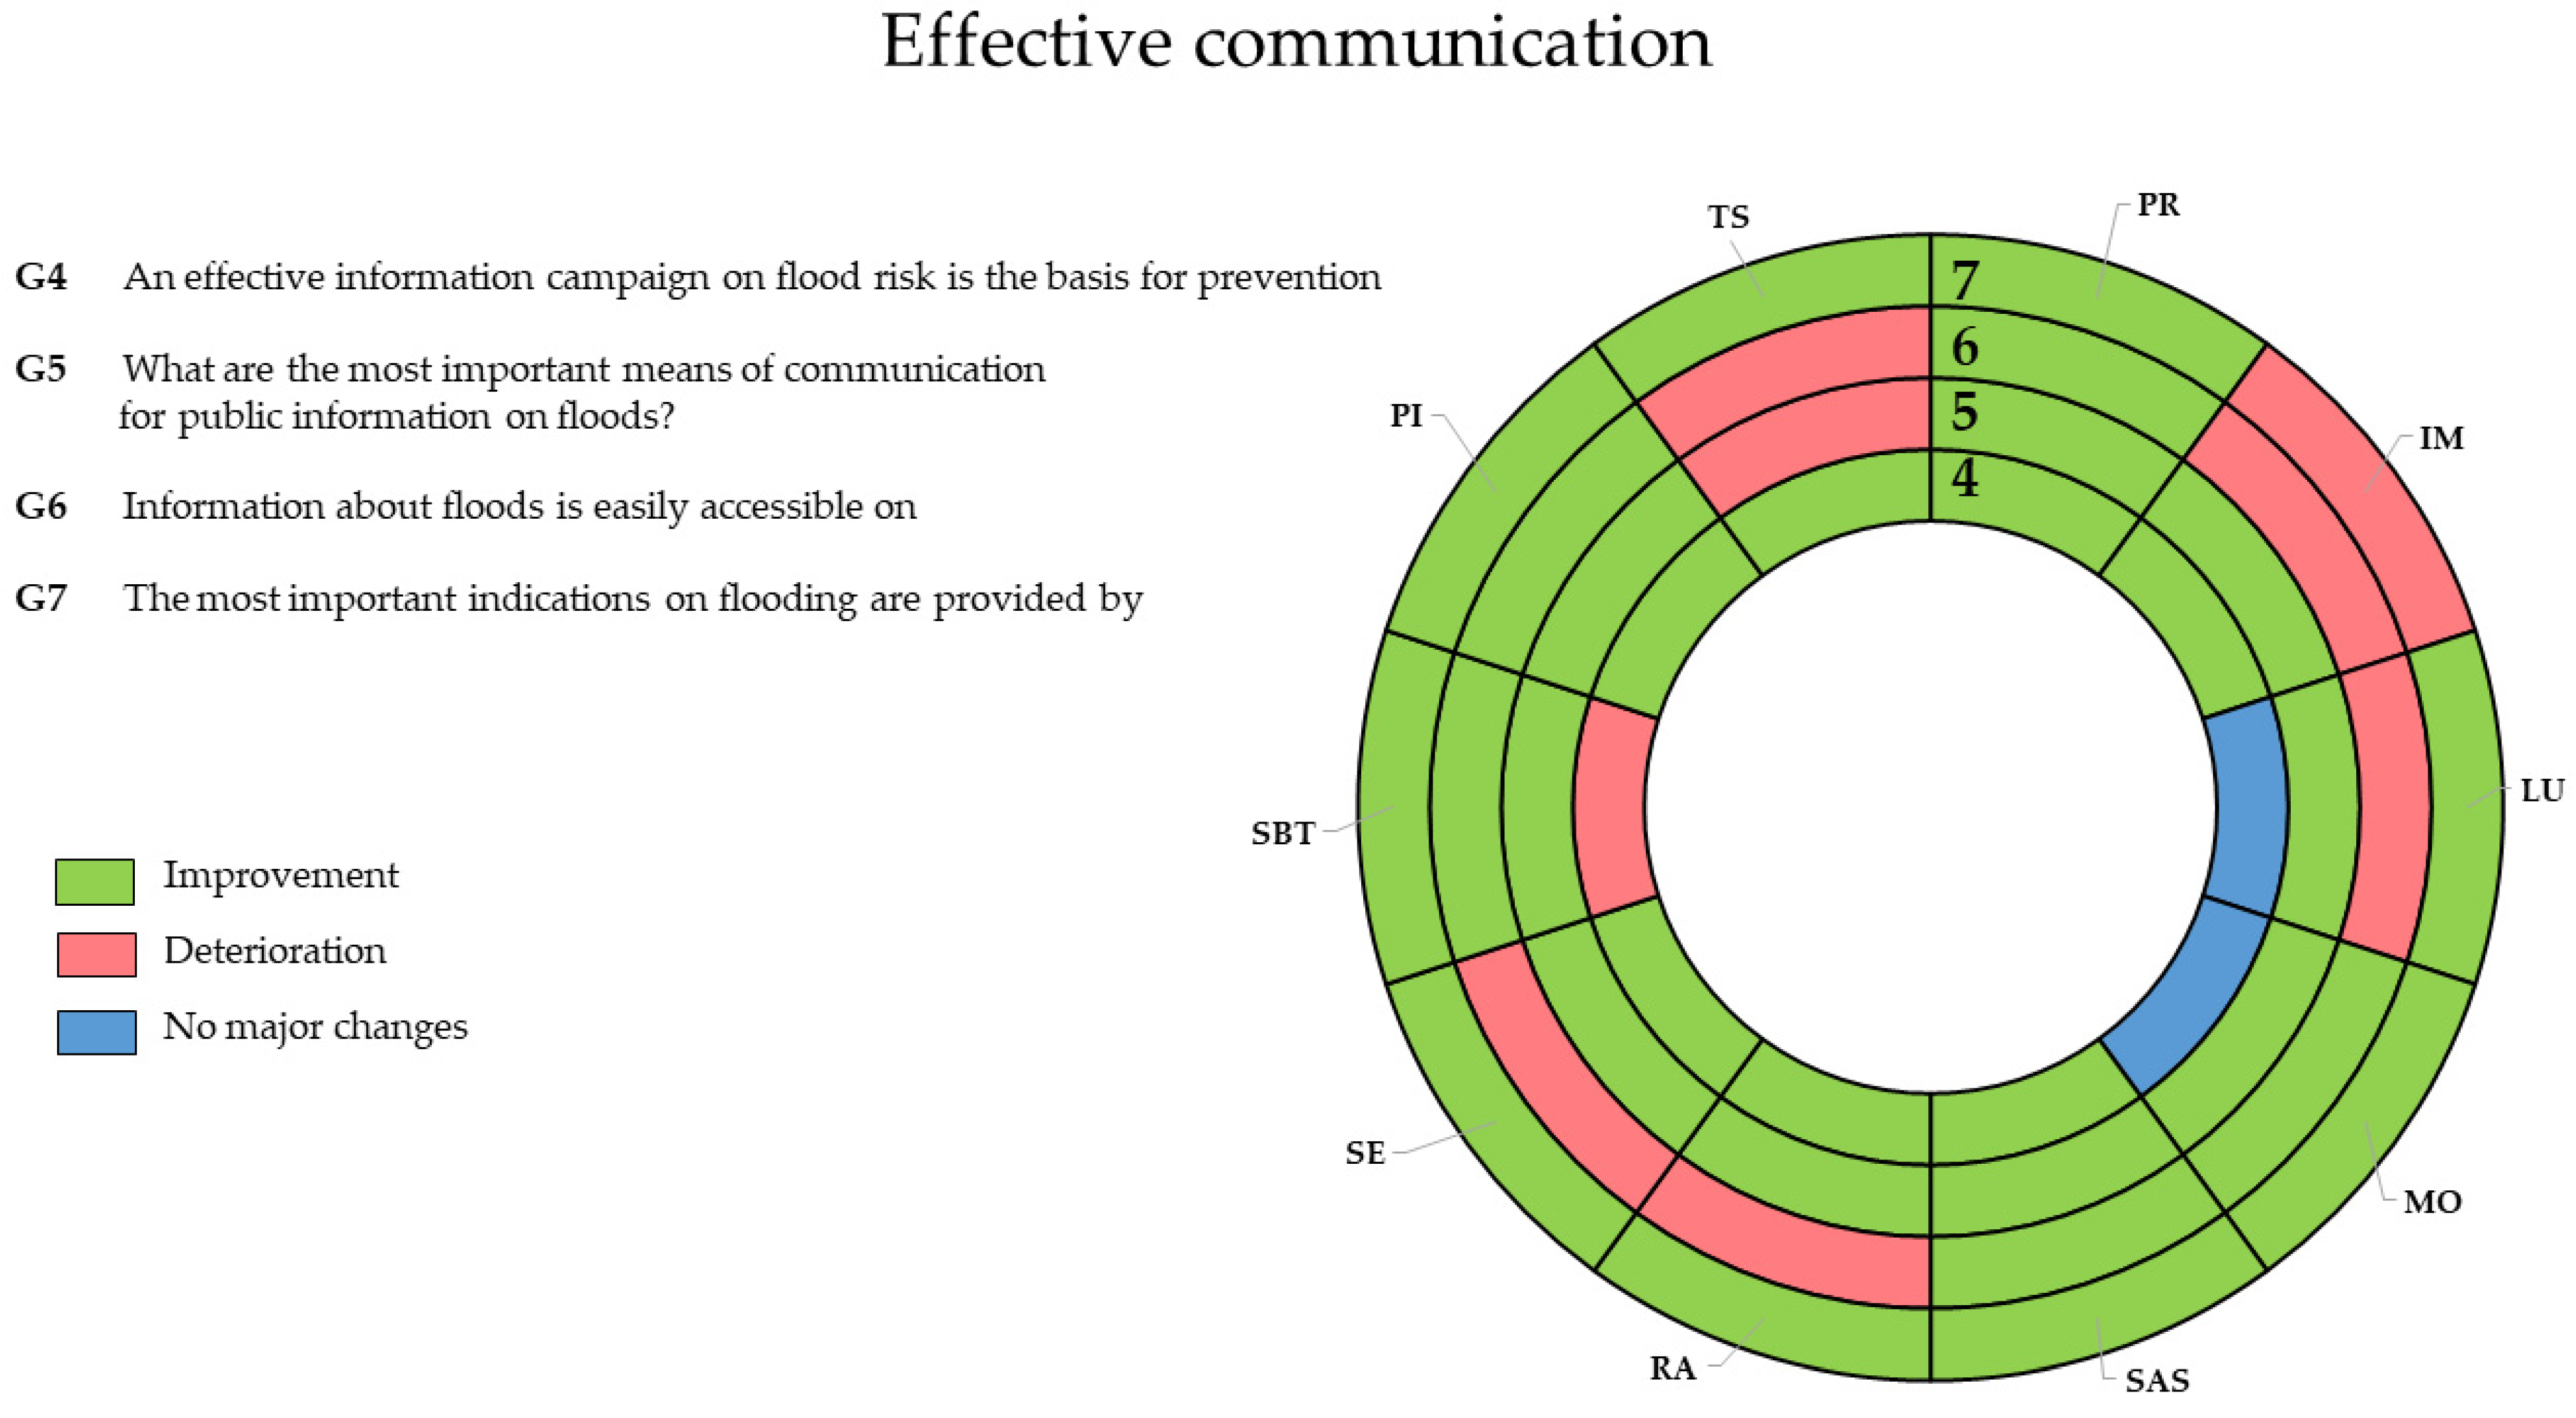
Table 2) were inserted in the questionnaire to understand if the survey participants feel the need to gather information about flood risk (G4), if they know where to find reliable information (G5), if they have access to it (G6), and if they trust the institutions responsible to provide such information (G7). The responses collected in the ex-ante and the ex-post phases were marked as improvement when the answers revealed increased interest in receiving information, increased acknowledgement and trust in information coming from scientific and government institutions, and a decreased reliance on information coming from unverified or generic sources. Figure 3 summarizes the outcomes observed for each pilot area, whereas Table A5, Table A6, Table A7 and Table A8 (Appendix B) provide the details of the responses.
Most of the respondents demonstrated an increased perception of the importance of flood risk information (G4). This situation is common across the majority of the surveyed municipalities, supporting the idea that sharing factual information could persuade the population to take self-protection measures and to deepen the understanding of flood risks [41]. Only the results from the municipality of San Benedetto del Tronto revealed some deterioration, yet the percentages of respondents that agree or strongly agree on the importance of risk information are still predominant. The differences found in the answers between the ex-post and the ex-ante phases in this municipality could be explained through intrinsic differences in the survey participants, which in the ex-ante survey incidentally shifted in towards middle aged and less educated individuals [30]. On the other hand, the essentially unchanged responses in Lugo and Mordano could be explained with the fewer activities of project PRIMES implemented here.
The answers to the question about the most important means of communication for flood information (G5) show that most of the respondents improved their interest towards institutional channels of communication. The ‘Civil Protection’ website and ‘Municipal websites’ increased their percentage of preferences in almost all studied areas. Fewer respondents opted for seeking information in ‘Search engine’ and even less preferences were given to ‘Social Networks’ and ‘Word of mouth’. Overall, it can be said that the activities of LIFE PRIMES increased the respondents’ interest in the channels of communication used by the institutions responsible of risk management. These results endorse the importance of participatory processes to put citizens and institution in contact and, consequently, increase mutual trust [41].
A not so clear improvement was obtained with the question concerning access to flood information (G6) (Figure 3). Exactly half of the municipalities, three in Emilia-Romagna (Imola, Lugo, Ravenna), one in Marche (Senigallia), and one in Abruzzo (Torino di Sangro), showed a prevalent deterioration between ex-ante and ex-post survey. In general terms, the project activities seem not to have increased citizens’ confidence in accessing scientific journals to find reliable information about flood risk; these journals often are too costly and difficult to understand. Conversely, responses to question G5 (important means of communications) and G7 (source of important information) showed that LIFE PRIMES activities appeared to have increased citizen’s trust toward civil protection institutions. This is important because to face complex and unknown situations, people tend to listen to those individual claiming past experience [42]. Yet, the indications coming from these “experienced” people are not always dependable, because they might be biased by the specific experience and personal beliefs. Here, too, the activities caried out by LIFE PRIMES contributed fostering another principle of geoethics, the one urging a renewed relationship between science, institution, and society [39], to increase effective and trustworthy exchange of knowledge between citizens and their instructions [38,41].

3.3. Geoethics and Personal Responsibility

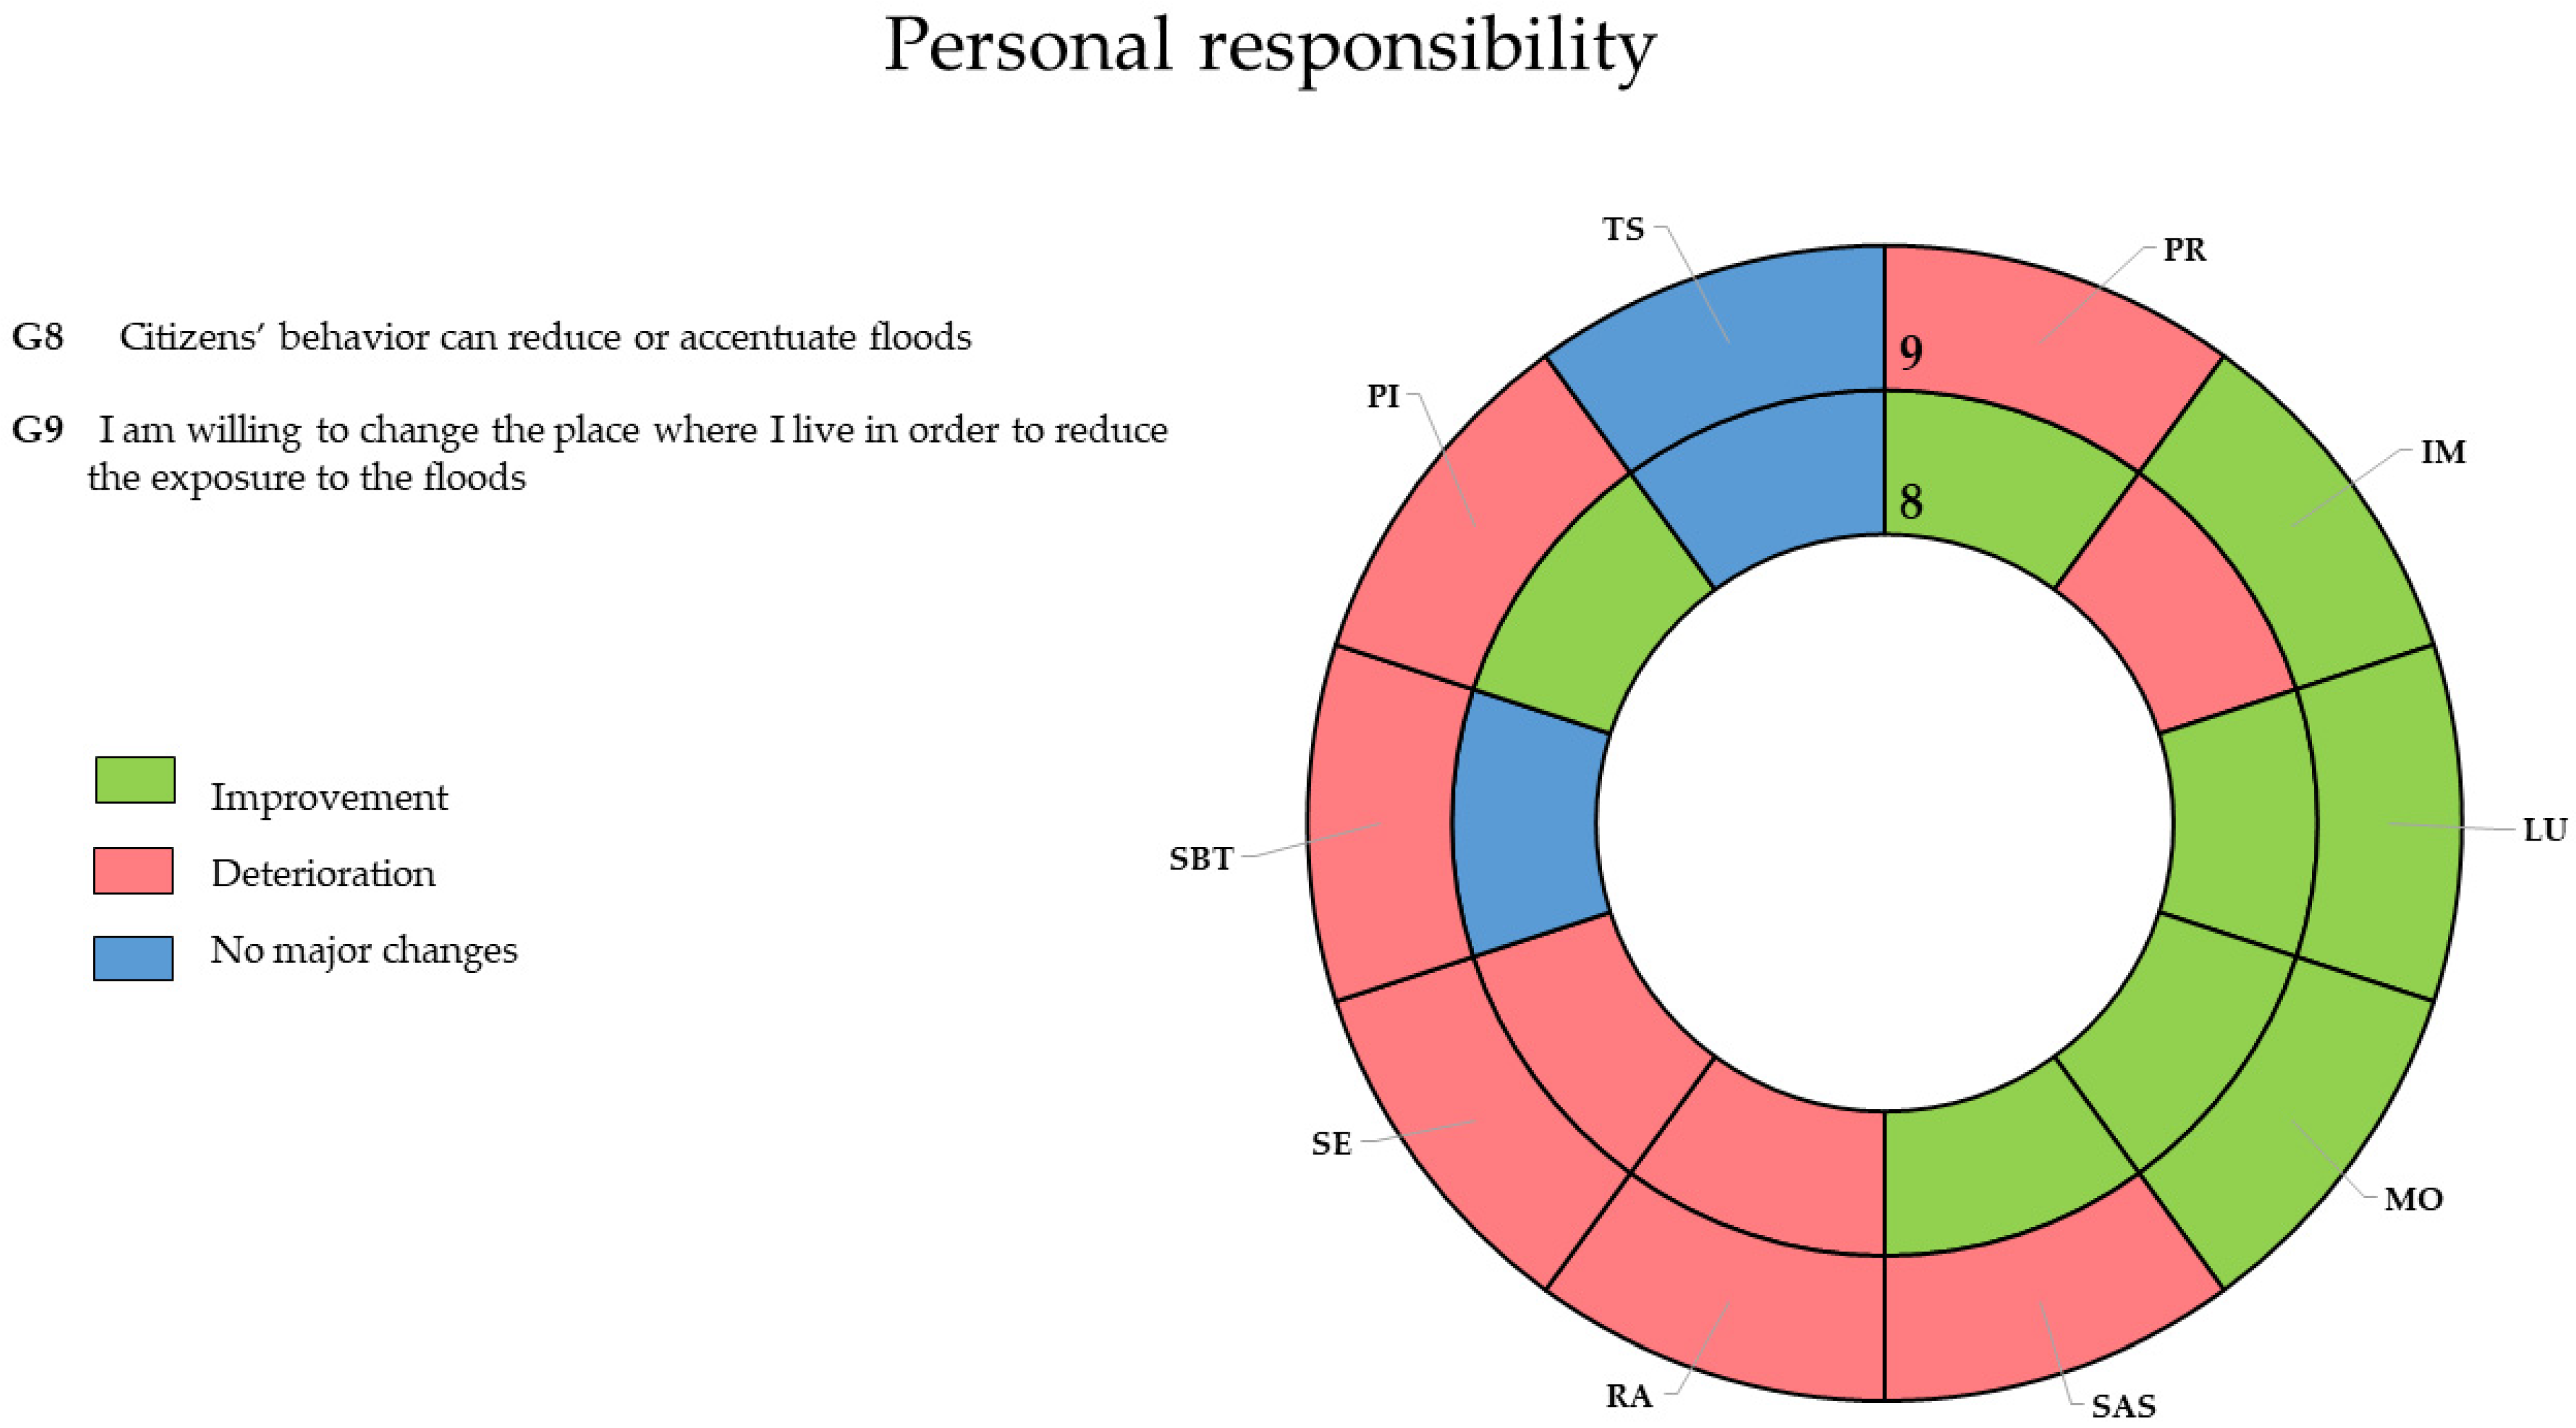
The last two questions analyzed for this study aim at understanding the role of citizens’ behavior in reducing or accentuating floods (Q8), and their willingness to move to reduce the exposure to floods (G9). These two questions portray the perception of “personal responsibility” in flood disasters. Question G8 required survey participants to express their agreement or disagreement with the claim that personal behavior can influence floods. In this case, the responses collected in the ex-ante and the ex-post phases were marked as improvement in case of increased acknowledgment that personal actions can increase floods, while deterioration meant not recognizing the link between human actions and floods. Question G9 required respondents to express their willingness of changing house to reduce risk. For this question, improvement meant that people were willing to change residency to reduce exposure. Figure 4 displays the outcomes observed for each pilot area, while Table A9 and Table A10 (Appendix B) provide the details of the responses.
The results in Poggio Renatico, Sant’Agata sul Santerno, and Pineto revealed that citizens’ behavior was perceived as influencing the incidence of floods, yet respondents were not willing to relocate to reduce the exposure. In San Benedetto del Tronto, a slight openness was registered toward the relocation option. Overall, in these pilot areas, citizens seem to understand that their relationship with nature can influence flood risk. This finding, coupled with the ones about increased understanding of the possible causes of floods (see question G1 and G2), suggests an overall openness toward novel solutions. Hence, propositions alternative to changing residency (which was not accepted), such as for example nature-based solutions [43,44], could possibly be accepted by these communities.
Conversely, respondents from Imola did not acknowledge the importance of personal behavior in flood incidence, though they would appear to be willing to move. This finding suggests a fatalistic approach, where the responsibility is placed outside oneself. Moreover, the willingness to relocate, thus acting in first person, might have been elicited by the direct experience of previous flood events.
The cases of Lugo and Mordano appear (positively) extreme, as respondents claim their willingness to personally enact risk mitigation measures. Here, the LIFE PRIMES project seemingly exerted the most significant results, although the considered activities were not always directed to the local area. It should be noted that these communities are directly exposed to significant flood hazard, which could contribute to explain such a positive outcome.
Results from Ravenna and Senigallia delivered an entirely opposite picture. Respondents did not recognize neither their role nor the need to proactively take action to reduce flood risk. Indeed, as mentioned, in Ravenna no exercises were proposed, thus possibly limiting the positive effects of the overall LIFE PRIMES activities. On the other hand, in Senigallia, the strengthened trust in official means of information (G5) might have led to a transfer of responsibility to other actors, e.g., local authorities.
Finally, in Torino di Sangro, no relevant changes were observed between the ex-ante and ex-post phases. This might suggest the need of further endeavors to engage local communities in flood risk reduction activities.
These results suggest encouraging positive effects of the LIFE PRIMES project in increasing awareness that personal choices have consequences on flood dynamics [8,19]. Unfortunately, an equally positive outcome did not emerge when confronting the respondents with the possibility to undertake a crucial change such as moving to a safer location. In this context, it appears reasonable to assume that other variables came into play, hampering the potential resonance of the project activities. In this sense, the role of place attachment might be very important and could help explain these results, despite the lack of a broad consensus on the effects of such factor on risk perception [45,46]. Some authors argue that a high attachment to the area where one live results in a lower perception of risk [47]. In contrast, others suggest a completely opposite relation, where a solid place attachment reinforces the awareness of the risk affecting the area [48]. The literature suggests that a strong place attachment might be associated with a reluctancy to engage in highly demanding adapting activities, such as, for example, preventive relocation [48]. Even though respondents would appear aware and willing to endorse flood risk reduction measures, place attachment might induce a protective attitude toward place identity, denying the threat posed by existing hazards [49,50]. Consequently, transformative actions might gain a stronger local advocacy if they maintained the peculiar identity of places, and related social bonding [51]. This might explain the responses collected in Poggio Renatico, Sant’Agata sul Santerno, and Pineto. These small communities have reasonably strong social ties [27], which might act as a resistive factor against changes of any kind. In conclusion, even if the LIFE PRIMES project seemingly attained promising results in terms of shaping personal responsibility towards nature, thus enhancing the geoethical value of collective resilience [31], it appears that some further efforts might be necessary in this specific aspect.

4. Conclusions

Using the framework of geoethics, this study highlighted the effects of the European LIFE PRIMES project in fostering a more sustainable human–environment interaction. The project, carried out in the three Italian Regions of Emilia-Romagna, Marche, and Abruzzo, between October 2017 and May 2018, aimed at increasing local communities’ awareness and adapting the capacity to floods. Four types of activities had been carried out: civic adaptation plans, workshops, flood emergency simulations, and a theatrical play. To assess the effects of the project activities related to the social values of geoethics, a face-to-face questionnaire was distributed to the population residing in the 10 studied areas, prior to (ex-ante phase) and after (ex-post phase) the project activities [31]. The results suggest a weak willingness of the respondents to rekindle their relationship with nature (e.g., sustainable landscape planning or conjectures about climate future trends and flood events), thus highlighting the need for activities able to stimulate a more intimate rethinking of human responsibility toward the Earth’s ecosystem [6,11]. The collected data appear to be positively associated to the implementation of simulation (hands-on exercises), which appear to trigger a long-term environmental perspective connected to flood risks. Moreover, participants to the study appear to have improved their appreciation of flood informational campaigns. Awareness of the available and reliable source of information about floods, and increased trust on those institutions charged with flood emergency communication, could lead to a conscious exchange of information among the various stakeholders. Effective communication is a pillar of community resilience [40,41,50,52]. Concerns emerged about the accessibility of scientific information about flood risk; respondents acknowledged the importance of scientific journals as source of such information, yet access to such sources and comprehension of the scientific discourse is not always available to the general public. As strongly advocated by geoethics, more work is needed to strengthen the relationship between science, politics, and citizens.
The study also highlighted the importance of personal choices in dealing with flood risk, thus supporting another dimension of geoethics: shaping risk awareness [14]. However, results suggest that a greater risk awareness did not increase the willingness to undertake crucial lifestyle changes, such as, for example, moving to a flood-safer location. In this context, it appears reasonable to assume that variables such as place attachment (geographical inertia) might play a strong role in determining individual behavior (in spite of the fact that such an influence is still debated in the literature [47,48]). Notably, among the studied communities, those of smaller dimensions seemed to accentuate geographical inertia [53]. Most likely, the strong social ties present in these small communities [27] resist substantial changes that could loosen up such a safety net. In this cases, a more integrated and comprehensive approach that goes beyond a simple informative campaign targeting individual citizens, but rather fosters participatory processes at the community level, might attain more significant results.
Overall, this study supports the hypothesis that the principles of geoethics underpinning flood risk reduction, such as, for example, those carried out with the EU project LIFE PRIMES, can sensibly improve the effectiveness of communication, increase the knowledge of flood phenomena, and, to a lesser extent, increase the sense of responsibility towards nature and its resources. In other words, LIFE PRIMES appeared to have pushed forward the cardinal principles of geoethics, showing that more effort is needed to engage local communities to the themes of environmental protection and sustainability. Investments are also needed to ease citizens’ access to reliable scientific information, and to support those activities capable to arouse emotions and nurture a sense of belonging toward nature (such as, for example, the theatrical play “La margherita di Adele 2.0”).

Author Contributions

Conceptualization, F.M., E.G. and C.C.; methodology, E.G. and F.M.; formal analysis, M.T.C. and F.M.; writing—original draft preparation, C.C., E.G., A.C. and N.M.; writing—review and editing, F.M. and M.T.C.; project administration, F.M.; funding acquisition, F.M. All authors have read and agreed to the published version of the manuscript.

Funding

This research was funded by the European Commission through the EU Project PRIMES LIFE14 CCA/IT/001280 (Preventing flooding RIsks by Making resilient communitiES).

Institutional Review Board Statement

Not applicable.

Informed Consent Statement

Informed consent was obtained from all subjects involved in the study.

Data Availability Statement

The authors confirm that the data used in this study are well referenced within the article and can be accessed to generate the results presented.

Acknowledgments

Funding for this work was provided by the European Commission through the EU Project PRIMES LIFE14 CCA/IT/001280 (Preventing flooding RIsks by Making resilient communitiES).

Conflicts of Interest

The authors declare no conflict of interest.

Appendix A

Table A1. Demographic information (age, gender, and education in percentages) about the participants in the ex-ante (EA) and ex-post (EP) phases with the difference between the two phases (Δ).
PILOT AREAAnalysis PhaseAge (Years)GenderEducation
<3535–55>55No AnswerTotalFemaleMaleNo AnswerTotalElementary SchoolsFirst Degree of Secondary SchoolsSecond Degree of Secondary SchoolsUniversityPost−UniversityNo answerTotal
PREA4.0056.0032.008.00100.0056.0044.000.00100.000.0012.0068.0020.000.000.00100.00
EP20.0033.3046.700.00100.0033.3066.700.00100.0033.3020.0033.3013.300.000.0099.90
Δ16.00−22.7014.70 −22.7022.70 33.308.00−34.70−6.700.00
IMEA5.9051.5039.603.00100.0062.4037.600.00100.001.0010.9050.5034.701.002.00100.10
EP26.4052.8014.206.60100.0046.2053.800.00100.001.9019.8060.4013.203.800.90100.00
Δ20.501.30−25.40 −16.2016.20 0.908.909.90−21.502.80
LUEA12.5046.3036.305.00100.1062.4037.600.00100.006.3016.3061.3015.000.001.30100.20
EP26.8045.1023.204.90100.0052.4047.600.00100.002.4022.0052.4018.303.701.20100.00
Δ14.30−1.20−13.10 −10.0010.00 −3.905.70−8.903.303.70
MOEA30.4026.1030.4013.0099.9030.4069.600.00100.004.3017.4060.9013.000.004.3099.90
EP21.7047.8030.400.0099.9056.5043.500.00100.0018.7034.8039.1017.400.000.00110.00
Δ−8.7021.700.00 26.10−26.10 14.4017.40−21.804.400.00
SASEA58.3025.0016.700.00100.0058.3041.700.00100.000.0016.7050.0033.300.000.00100.00
EP18.2045.5036.400.00100.1054.5045.500.00100.009.109.1045.5018.2018.200.00100.10
Δ−40.1020.5019.70 −3.803.80 9.10−7.60−4.50−15.1018.20
RAEA18.8043.8037.500.00100.1037.5062.500.00100.000.0018.8043.8037.500.000.00100.10
EP18.2027.3045.409.10100.0036.4054.409.20100.009.1045.5027.309.100.009.10100.10
Δ−0.60−16.507.90 −1.10−8.10 9.1026.70−16.50−28.400.00
SEEA14.7038.2038.208.90100.0039.7060.300.00100.002.9035.3045.6014.701.500.00100.00
EP12.9057.1014.3015.70100.0064.3032.902.90100.100.008.6044.3030.007.1010.00100.00
Δ−1.8018.90−23.90 24.60−27.40 −2.90−26.70−1.3015.305.60
SBTEA5.6033.3038.9022.20100.0066.7033.300.00100.000.0027.8044.4027.800.000.00100.00
EP11.1050.0038.900.00100.0066.7033.300.00100.0011.1027.8033.3022.205.600.00100.00
Δ5.5016.700.00 0.000.00 11.100.00−11.10−5.605.60
PIEA18.2050.0027.304.50100.0013.6081.804.5099.900.0022.7054.5013.609.100.0099.90
EP13.6050.0031.804.5099.9018.2081.800.00100.000.0027.3045.5022.704.500.00100.00
Δ−4.600.004.50 4.600.00 0.004.60−9.009.10−4.60
TSEA46.2023.1030.800.00100.1061.5038.500.00100.000.007.7053.8038.500.000.00100.00
EP33.3025.0041.700.00100.0025.0075.000.00100.000.0025.0041.7016.7016.700.00100.10
Δ−12.901.9010.90 −36.5036.50 0.0017.30−12.10−21.8016.70

Appendix B

Table A2. Answers to the question G1 in percentages per each pilot area, in the ex-ante (EA) and in the ex-post (EP) phases, and their variation (Δ).
Pilot AreaAnalysis PhaseG1: What Elements Can Cause Flood Events?
AgricultureIndustryUrbanized AreaDeforestationExcessive Resource ConsumptionExcessive Waste ProductionTransportsFailure of Urban InfrastructureOther
IMEA8.0011.1016.4017.8016.008.202.5016.603.50
EP3.403.408.9027.6014.306.902.0031.002.50
Δ−4.60−7.70−7.509.80−1.70−1.30−0.5014.40−1.00
LUEA7.407.4015.2018.8014.907.402.8022.703.20
EP1.205.0011.2029.2015.506.803.1026.101.90
Δ−6.20−2.40−4.0010.400.60−0.600.303.40−1.30
MOEA10.1013.8011.9016.5013.808.305.5018.301.80
EP0.002.2010.9030.408.704.300.0039.104.30
Δ−10.10−13.80−11.90−16.50−13.80−8.30−5.50−18.30−1.80
SASEA1.9011.1013.0018.5013.0011.107.4022.201.90
EP5.705.7014.3020.0017.105.702.9025.702.90
Δ3.80−5.401.301.504.10−5.40−4.503.501.00
RAEA6.207.7012.3023.1023.106.203.1018.500.00
EP4.804.809.5019.009.504.800.0047.600.00
Δ−1.40−2.90−2.80−4.10−13.60−1.40−3.1029.100.00
PREA3.8010.6016.3017.3017.308.703.8022.100.00
EP3.700.0014.8022.2011.103.700.0040.703.70
Δ−0.10−10.60−1.504.90−6.20−5.00−3.8018.603.70
SEEA9.306.0013.0016.7014.407.402.8025.505.10
EP4.504.5012.9022.006.803.801.5038.605.30
Δ−4.80−1.50−0.105.30−7.60−3.60−1.3013.100.20
SBTEA9.909.909.9019.7015.508.501.4022.502.80
EP0.005.3010.5015.8010.5010.500.0042.105.30
Δ−9.90−4.600.60−3.90−5.002.00−1.4019.602.50
PIEA14.309.5019.0011.109.503.201.6028.603.20
EP6.103.0015.2015.206.100.000.0048.506.10
Δ−8.20−6.50−3.804.10−3.40−3.20−1.6019.902.90
TSEA3.809.4013.2022.6015.1013.207.5015.100.00
EP0.009.1022.7022.700.004.500.0036.404.50
Δ−3.80−0.309.500.10−15.10−8.70−7.5021.304.50
Table A3. Answers to the question G2 in percentages per each pilot area, in the ex-ante (EA) and in the ex-post (EP) phases, and their variation (Δ).
Pilot AreaAnalysis PhaseG2: Landscape Conservation Requires a Change in the Development Model
Very LowLowMediumHighVery HighNo Answer
IMEA1.0010.1030.3038.4020.200.00
EP3.8020.8047.2024.502.800.90
Δ2.8010.7016.90−13.90−17.40
LUEA1.3013.8031.3032.5021.300.00
EP0.0029.3042.7022.006.100.00
Δ−1.3015.5011.40−10.50−15.20
MOEA8.7034.8039.1017.400.000.00
EP0.0026.1030.4039.104.300.00
Δ−8.70−8.70−8.7021.704.30
SASEA8.300.0041.7041.708.300.00
EP0.009.1018.2063.609.100.00
Δ−8.309.10−23.5021.900.80
RAEA0.006.306.3043.8043.800.00
EP9.1027.309.1045.509.100.00
Δ9.1021.002.801.70−34.70
PREA0.008.0044.0040.008.000.00
EP0.006.7026.7060.006.700.00
Δ0.00−1.30−17.3020.00−1.30
SEEA0.004.8027.0046.0022.200.00
EP7.102.9014.3052.9020.002.90
Δ7.10−1.90−12.706.90−2.20
SBTEA5.605.6016.7038.9033.300.00
EP0.0011.1022.2061.105.600.00
Δ−5.605.505.5022.20−27.70
PIEA0.000.009.1040.9045.504.50
EP0.0013.6018.2036.4027.304.50
Δ0.0013.609.10−4.50−18.20
TSEA0.007.700.0053.8038.500.00
EP8.308.3041.7041.700.000.00
Δ8.300.6041.70−12.10−38.50
Table A4. Answers to the question G3 in percentages per each pilot area, in the ex-ante (EA) and in the ex-post (EP) phases, and their variation (Δ).
Pilot AreaAnalysis PhaseG3: The Probability That Flood Events Will Become More Frequent Is
Very LowLowMediumHighVery HighNo Answer
IMEA1.0010.1030.3038.4020.200.00
EP3.8020.8047.2024.502.800.90
Δ2.8010.7016.90−13.90−17.40
LUEA1.3013.8031.3032.5021.300.00
EP0.0029.3042.7022.006.100.00
Δ−1.3015.5011.40−10.50−15.20
MOEA8.7034.8039.1017.400.000.00
EP0.0026.1030.4039.104.300.00
Δ−8.70−8.70−8.7021.704.30
SASEA8.300.0041.7041.708.300.00
EP0.009.1018.2063.609.100.00
Δ−8.309.10−23.5021.900.80
RAEA0.006.306.3043.8043.800.00
EP9.1027.309.1045.509.100.00
Δ9.1021.002.801.70−34.70
PREA0.008.0044.0040.008.000.00
EP0.006.7026.7060.006.700.00
Δ0.00−1.30−17.3020.00−1.30
SEEA0.004.8027.0046.0022.200.00
EP7.102.9014.3052.9020.002.90
Δ7.10−1.90−12.706.90−2.20
SBTEA5.605.6016.7038.9033.300.00
EP0.0011.1022.2061.105.600.00
Δ−5.605.505.5022.20−27.70
PIEA0.000.009.1040.9045.504.50
EP0.0013.6018.2036.4027.304.50
Δ0.0013.609.10−4.50−18.20
TSEA0.007.700.0053.8038.500.00
EP8.308.3041.7041.700.000.00
Δ8.300.6041.70−12.10−38.50
Table A5. Answers to the question G4 in percentages per each pilot area, in the ex-ante (EA) and in the ex-post (EP) phases, and their variation (Δ).
Pilot AreaAnalysis PhaseG4: An Effective Information Campaign on Flood Risk Is the Basis for Prevention
Strongly DisagreeDisagreeUncertainAgreeStrongly AgreeNo Answer
IMEA0.002.008.9040.6047.501.00
EP0.000.903.8052.8041.500.90
Δ0.00−1.10−5.1012.20−6.00
LUEA1.302.508.8048.8038.800.00
EP1.201.209.8040.2047.600.00
Δ−0.10−1.301.00−8.608.80
MOEA0.008.704.3060.9026.100.00
EP0.000.008.7039.1052.200.00
Δ0.00−8.704.40−21.8026.10
SASEA0.0016.700.0033.3050.000.00
EP0.009.100.0027.3063.600.00
Δ0.00−7.600.00−6.0013.60
RAEA0.000.000.0037.5056.306.30
EP0.000.000.000.0054.5045.50
Δ0.000.000.00−37.50−1.80
PREA32.0056.0012.000.000.000.00
EP0.000.0020.0046.7033.300.00
Δ−32.00−56.008.0046.7033.30
SEEA0.007.4017.6048.5026.500.00
EP0.004.3012.9038.6042.901.40
Δ0.00−3.10−4.70−9.9016.40
SBTEA0.005.600.0022.2072.200.00
EP0.0011.105.6033.3050.000.00
Δ0.005.505.6011.10−22.20
PIEA4.5013.609.1036.4031.804.50
EP0.000.004.5027.3068.200.00
Δ−4.50−13.60−4.60−9.1036.40
TSEA0.000.007.7030.8061.500.00
EP0.000.000.0050.0050.000.00
Δ0.000.00−7.7019.20−11.50
Table A6. Answers to the question G5 in percentages per each pilot area, in the ex-ante (EA) and in the ex-post (EP) phases, and their variation (Δ).
Pilot AreaAnalysis PhaseG5: What Are the Most Important Means of Communication for Public Information on Floods?
Municipal WebsiteRegional WebsiteCivil Protection WebsiteSearch EngineTV NewsTelevision ProgramsRadio NewsRadio ProgramsNewspapersScientific Journals or BooksExpertsTrusted PeopleSocial NetworksWord of MouthNothingOther
IMEA6.976.077.776.2310.546.238.045.699.378.416.603.999.104.260.270.48
EP12.605.4013.305.1020.107.108.203.706.501.003.400.308.203.400.001.70
Δ5.63−0.675.53−1.139.560.870.16−1.99−2.87−7.41−3.20−3.69−0.90−0.86−0.271.22
LUEA6.765.536.396.0111.716.875.753.359.107.667.565.538.947.450.480.37
EP11.403.6013.606.8024.508.208.202.705.900.902.300.908.201.800.500.50
Δ4.64−1.937.210.7912.791.332.45−0.65−3.20−6.76−5.26−4.63−0.74−5.650.020.13
MOEA7.184.798.145.7511.126.176.815.598.047.666.714.798.676.810.960.48
EP16.109.7012.904.8019.406.500.000.003.200.004.801.606.509.700.004.80
Δ8.924.914.76−0.958.280.33−6.81−5.59−4.84−7.66−1.91−3.19−2.172.89−0.964.32
SASEA5.486.126.816.128.997.347.345.759.8511.608.203.417.346.550.000.00
EP14.007.0014.004.7016.307.009.302.304.702.307.002.307.000.000.002.30
Δ8.520.887.19−1.427.31−0.341.96−3.45−5.15−9.30−1.20−1.11−0.34−6.550.002.30
RAEA7.617.038.207.039.426.874.312.557.728.205.275.8512.0310.320.000.00
EP12.802.6010.305.1020.507.707.700.002.600.005.100.0015.4010.300.000.00
Δ5.19−4.432.10−1.9311.080.833.39−2.55−5.12−8.20−0.17−5.853.37−0.020.000.00
PREA6.285.386.926.2811.027.504.043.467.5010.117.564.1010.439.260.320.00
EP18.206.8020.504.5013.609.104.500.004.500.002.300.002.3013.600.000.00
Δ11.921.4213.58−1.782.581.600.46−3.46−3.00−10.11−5.26−4.10−8.134.34−0.320.00
SEEA8.946.078.945.9110.807.726.447.185.916.076.444.909.265.910.320.00
EP24.904.6014.704.6010.704.605.102.502.002.006.600.0011.705.600.000.50
Δ15.96−1.475.76−1.31−0.10−3.12−1.34−4.68−3.91−4.070.16−4.902.44−0.31−0.320.50
SBTEA5.854.796.927.9810.647.825.694.957.8210.117.453.199.956.390.530.53
EP8.904.4015.600.0020.002.202.204.408.904.4011.100.006.7011.100.000.00
Δ3.05−0.398.68−7.989.36−5.62−3.49−0.551.08−5.713.65−3.19−3.254.71−0.53−0.53
PIEA8.365.116.397.7211.507.292.081.067.295.117.085.1113.5710.430.000.00
EP21.7011.7016.706.7010.006.705.001.701.700.000.001.7013.303.300.000.00
Δ13.346.5910.31−1.02−1.50−0.592.920.64−5.59−5.11−7.08−3.41−0.27−7.130.000.00
TSEA7.616.238.306.9211.0710.065.005.009.055.534.844.848.045.000.690.69
EP6.906.9010.3010.3020.703.406.900.000.003.400.006.9017.206.900.000.00
Δ−0.710.672.003.389.63−6.661.90−5.00−9.05−2.13−4.842.069.161.90−0.69−0.69
Table A7. Answers to the question G6 in percentages per each pilot area, in the ex-ante (EA) and in the ex-post (EP) phases, and their variation (Δ).
Pilot AreaAnalysis PhaseG6: Information about Floods Is Easily Accessible on:
Municipality WebsiteRegional WebsiteCivil Protection WebsiteSearch EngineTelevision ProgramsScientific JournalsBooksOtherNowhere
IMEA18.2015.5021.2015.8012.209.004.901.901.40
EP17.809.6031.9019.305.902.201.507.404.40
Δ−0.40−5.9010.703.50−6.30−6.80−3.405.503.00
LUEA15.7012.7018.8017.5016.209.606.103.100.40
EP17.2010.3025.0022.408.601.700.907.806.00
Δ1.50−2.406.204.90−7.60−7.90−5.204.705.60
MOEA12.1012.1020.7024.1017.205.201.701.705.20
EP19.5017.1029.3012.207.302.409.802.400.00
Δ7.405.008.60−11.90−9.90−2.808.100.70−5.20
SASEA6.6011.5018.0016.4013.1016.4016.401.600.00
EP29.6014.8025.9014.8011.100.003.700.000.00
Δ23.003.307.90−1.60−2.00−16.40−12.70−1.600.00
RAEA15.4013.5025.0023.105.807.709.600.000.00
EP28.607.1014.3028.6014.300.000.000.007.10
Δ13.20−6.40−10.705.508.50−7.70−9.600.007.10
PREA14.8014.8016.0013.6011.109.9012.307.40
EP27.309.1022.7013.609.104.504.500.009.10
Δ12.50−5.706.700.00−2.00−5.40−7.80−7.409.10
SEEA21.3018.8024.2012.6011.106.303.900.501.40
EP35.203.4025.0020.503.401.101.103.406.80
Δ13.90−15.400.807.90−7.70−5.20−2.802.905.40
SBTEA16.909.2020.0020.0015.4012.304.601.500.00
EP33.3018.5014.8014.803.703.700.003.707.40
Δ16.409.30−5.20−5.20−11.70−8.60−4.602.207.40
PIEA23.208.9017.9016.1017.907.105.403.600.00
EP20.6020.6032.4014.708.800.000.002.900.00
Δ−2.6011.7014.50−1.40−9.10−7.10−5.40−0.700.00
TSEA20.4012.2020.4018.4014.308.204.100.002.00
EP10.005.005.0040.0015.0010.005.005.005.00
Δ−10.40−7.20−15.4021.600.701.800.905.003.00
Table A8. Answers to the question G7 in percentages per each pilot area, in the ex-ante (EA) and in the ex-post (EP) phases, and their variation (Δ).
Pilot AreaAnalysis PhaseG7: The Most Important Indications on Flooding Are Provided by
MayorCivil Protection TechnicianFamilyPeople with Previous ExperiencePoliceFriends/RelativesScientific ExpertPublic FigureOtherNo Answer
IMEA18.4025.404.4011.9018.904.1014.202.100.500.00
EP13.4047.001.204.9013.400.0018.901.200.000.00
Δ−5.0021.60−3.20−7.00−5.50−4.104.70−0.90−0.50
LUEA12.7023.707.3014.3020.004.7015.001.700.700.00
EP12.7048.400.807.9015.100.8014.300.000.000.00
Δ0.0024.70−6.50−6.40−4.90−3.90−0.70−1.70−0.70
MOEA17.3024.703.7016.0016.007.4012.302.500.000.00
EP25.0040.900.004.5013.600.0013.600.002.300.00
Δ7.7016.20−3.70−11.50−2.40−7.401.30−2.502.30
SASEA15.1022.607.5013.2020.801.9018.900.000.000.00
EP39.1034.800.004.308.700.0013.000.000.000.00
Δ24.0012.20−7.50−8.90−12.10−1.90−5.900.000.00
RAEA18.9028.303.8015.1020.800.0013.200.000.000.00
EP27.8033.300.0011.100.005.6022.200.000.000.00
Δ8.905.00−3.80−4.00−20.805.609.000.000.00
PREA14.9023.807.9013.9015.805.0016.802.000.000.00
EP25.9037.000.0014.807.400.0014.800.000.000.00
Δ11.0013.20−7.900.90−8.40−5.00−2.00−2.000.00
SEEA21.4026.207.0014.4013.103.1012.702.200.000.00
EP24.2046.700.005.8012.500.8010.000.000.000.00
Δ2.8020.50−7.00−8.60−0.60−2.30−2.70−2.200.00
SBTEA15.9021.708.7011.6015.901.4021.701.401.400.30
EP15.2039.400.0015.2015.200.0015.200.000.000.00
Δ−0.7017.70−8.703.60−0.70−1.40−6.50−1.40−1.40
PIEA20.7022.408.6013.8015.503.4013.800.001.700.00
EP31.3046.900.009.406.303.103.100.000.000.00
Δ10.6024.50−8.60−4.40−9.20−0.30−10.700.00−1.70
TSEA24.4026.800.0019.5022.000.007.300.000.000.00
EP19.0038.100.004.8019.004.809.500.004.800.00
Δ−5.4011.300.00−14.70−3.004.802.200.004.80
Table A9. Answers to the question G8 in percentages per each pilot area, in the ex-ante (EA) and in the ex-post (EP) phases, and their variation (Δ).
Pilot AreaAnalysis PhaseG8: Citizens’ Behavior Can Reduce or Accentuate Floods
Strongly DisagreeDisagreeUncertainAgreeStrongly AgreeNo Answer
IMEA1.003.0016.8049.5029.700.00
EP1.906.6013.2049.1027.401.90
Δ0.903.60−3.60−0.40−2.30
LUEA3.807.5017.5040.0028.802.50
EP1.202.4014.6046.3034.101.20
Δ−2.60−5.10−2.906.305.30
MOEA4.304.3021.7052.2017.400.00
EP0.000.008.7043.5047.800.00
Δ−4.30−4.30−13.00−8.7030.40
SASEA0.000.0033.3050.0016.700.00
EP0.000.009.1045.5045.500.00
Δ0.000.00−24.20−4.5028.80
RAEA6.306.300.0062.5025.000.00
EP18.200.0018.2045.5018.200.00
Δ11.90−6.3018.20−17.00−6.80
PREA0.008.0036.0040.0016.000.00
EP0.006.700.0046.7046.700.00
Δ0.00−1.30−36.006.7030.70
SEEA5.901.5026.5042.6017.605.90
EP5.708.6020.0042.9020.002.90
Δ−0.207.10−6.500.302.40
SBTEA0.000.005.6022.2072.200.00
EP0.000.0011.1072.2011.105.60
Δ0.000.005.5050.00−61.10
PIEA9.109.1013.6022.7036.409.10
EP0.000.009.1040.9045.504.50
Δ−9.10−9.10−4.5018.209.10
TSEA0.000.007.7084.607.700.00
EP0.000.008.3066.7025.000.00
Δ0.000.000.60−17.9017.30
Table A10. Answers to the question G9 in percentages per each pilot area, in the ex-ante (EA) and in the ex-post (EP) phases, and their variation (Δ).
Pilot AreaAnalysis PhaseG9: I Am Willing to Change the Place Where I Live in ORDER to Reduce the Exposure to the Floods
Strongly DisagreeDisagreeUncertainAgreeStrongly AgreeNo Answer
IMEA16.8036.6022.8016.805.002.00
EP17.9027.4029.2018.901.904.70
Δ1.10−9.206.402.10−3.10
LUEA28.8040.0018.807.502.502.50
EP30.5024.4018.3013.4011.002.40
Δ1.70−15.60−0.505.908.50
MOEA21.7034.8030.408.700.004.30
EP26.1017.4026.1017.4013.000.00
Δ4.40−17.40−4.308.7013.00
SASEA16.7025.0025.0025.008.300.00
EP27.3027.3036.400.009.100.00
Δ10.602.3011.40−25.000.80
RAEA25.0025.0037.506.300.006.30
EP36.4027.3018.209.100.009.10
Δ11.402.30−19.302.800.00
PREA16.0040.0024.008.000.0012.00
EP33.3046.706.700.0013.300.00
Δ17.306.70−17.30−8.0013.30
SEEA11.8025.0022.1025.005.9010.30
EP18.6020.0028.6018.607.107.10
Δ6.80−5.006.50−6.401.20
SBTEA11.1016.7016.7016.7033.305.60
EP33.3027.8022.2011.105.600.00
Δ22.2011.105.50−5.60−27.70
PIEA13.6031.809.1018.2013.6013.60
EP13.6027.3031.8018.209.100.00
Δ0.00−4.5022.700.00−4.50
TSEA30.8015.4030.8015.407.700.00
EP8.3033.3041.7016.700.000.00
Δ−22.5017.9010.901.30−7.70

References

  1. Crutzen, P.J. The “Anthropocene”. In Earth System Science in the Anthropocene; Ehlers, E., Krafft, T., Eds.; Springer: Berlin/Heidelberg, Germany, 2006; pp. 13–18. ISBN 978-3-540-26590-0. [Google Scholar]
  2. Keys, P.W.; Galaz, V.; Dyer, M.; Matthews, N.; Folke, C.; Nyström, M.; Cornell, S.E. Anthropocene risk. Nat. Sustain. 2019, 2, 667–673. [Google Scholar] [CrossRef]
  3. Marone, E.; Carneiro, J.C.; Cintra, M.M.; Ribeiro, A.; Cardoso, D.; Stellfeld, C. Extreme Sea Level Events, Coastal Risks, and Climate Changes: Informing the Players. In Geoethics: Ethical Challenges and Case Studies in Earth Sciences; Elsevier Inc.: Amsterdam, The Netherlands, 2015; pp. 273–302. ISBN 9780127999357. [Google Scholar]
  4. Osberghaus, D.; Hinrichs, H. The Effectiveness of a Large-Scale Flood Risk Awareness Campaign: Evidence from Two Panel Data Sets. Risk Anal. 2021, 41, 944–957. [Google Scholar] [CrossRef] [PubMed]
  5. Etkin, D.; Stefanovic, I.L. Mitigating natural disasters: The role of eco-ethics. In Mitigation of Natural Hazards and Disasters: International Perspectives; Haque, C.E., Ed.; Springer: Dordrecht, The Netherlands, 2005; pp. 135–158. ISBN 1402031122. [Google Scholar]
  6. Peppoloni, S.; Di Capua, G. The Meaning of Geoethics. In Geoethics: Ethical Challenges and Case Studies in Earth Sciences; Elsevier: Amsterdam, The Netherlands, 2015; pp. 3–14. ISBN 9780127999357. [Google Scholar]
  7. Nwankwoala, H. Geoethics As an Emerging Discipline: Perspectives, Ethical Challenges and Prospects. Earth Sci. Malays. 2019, 3, 1–8. [Google Scholar] [CrossRef]
  8. Peppoloni, S.; Di Capua, G. Geoethics as global ethics to face grand challenges for humanity. Geol. Soc. Spec. Publ. 2021, 508, 13–29. [Google Scholar] [CrossRef]
  9. Nemec, V. Geoethics and Sustainability. In Proceedings of the 2nd World Sustainability Forum; MDPI: Basel, Switzerland, 2012. [Google Scholar] [CrossRef]
  10. Kelman, I. Ethics of Disaster Research. In Geoethics: Ethical Challenges and Case Studies in Earth Sciences; Elsevier: Amsterdam, The Netherlands, 2015; pp. 37–47. ISBN 9780127999357. [Google Scholar]
  11. Lugeri, F.R.; Farabollini, P.; Amadio, V.; Greco, R. Unconventional approach for prevention of environmental and related social risks: A geoethic mission. Geosciences 2018, 8, 54. [Google Scholar] [CrossRef] [Green Version]
  12. Höppner, C.; Whittle, R.; Bründl, M.; Buchecker, M. Linking social capacities and risk communication in Europe: A gap between theory and practice? Nat. Hazards 2012, 64, 1753–1778. [Google Scholar] [CrossRef] [Green Version]
  13. Bickford, M.E. The Impact of Geological Science on Society; Geological Society of America: Boulder, CO, USA, 2013; ISBN 9780813725017. [Google Scholar]
  14. De Pascale, F.; Bernardo, M.; Muto, F.; Dattilo, A.; Valeria, R. Geoethics, Neogeography and Risk Perception: Myth, Natural and Human Postmodern, Factors in Archaic and Society. In Earthquakes and Their Impact on Society; D’Amico, S., Ed.; Springer: Berlin/Heidelberg, Germany, 2016; pp. 665–692. ISBN 9783319217536. [Google Scholar]
  15. United Nations Office for Disaster Risk Reduction. UNISDR Terminology on Disaster Risk Reduction; United Nations International Strategy for Disaster Reduction (UNISDR): Geneva, Switzerland, 2009. [Google Scholar]
  16. Antronico, L.; Coscarelli, R.; De Pascale, F.; Muto, F. Geo-hydrological risk perception: A case study in Calabria (Southern Italy). Int. J. Disaster Risk Reduct. 2017, 25, 301–311. [Google Scholar] [CrossRef]
  17. Wachinger, G.; Renn, O.; Begg, C.; Kuhlicke, C. The risk perception paradox-implications for governance and communication of natural hazards. Risk Anal. 2013, 33, 1049–1065. [Google Scholar] [CrossRef]
  18. Figueiredo, E.; Valente, S.; Coelho, C.; Pinho, L. Coping with risk: Analysis on the importance of integrating social perceptions on flood risk into management mechanisms—The case of the municipality of Águeda, Portugal. J. Risk Res. 2009, 12, 581–602. [Google Scholar] [CrossRef]
  19. Martínez-Frías, J.; González, J.L.; Pérez, F.R. Geoethics and deontology: From fundamentals to applications in planetary protection. Episodes 2011, 34, 257–262. [Google Scholar] [CrossRef] [Green Version]
  20. Barr, S. Knowledge, expertise and engagement. Environ. Values 2017, 26, 125–130. [Google Scholar] [CrossRef]
  21. Alexander, M.; Viavattene, C.; Faulkner, H.; Priest, S. Translating the complexities of flood risk science using KEEPER-a knowledge exchange exploratory tool for professionals in emergency response. J. Flood Risk Manag. 2014, 7, 205–216. [Google Scholar] [CrossRef]
  22. Parker, D.J.; Priest, S.J.; Sue, M. Tapsell Understanding and enhancing the public’s behavioural response to flood warning information. Meteorol. Appl. A J. Forecast. Pract. Appl. Train. Tech. Model. 2009, 16, 103–114. [Google Scholar] [CrossRef]
  23. National Institute of Statistics—ISTAT. Mappa dei Rischi dei Comuni Italiani. Sant’Agata sul Santerno (RA); ISTAT: Rome, Italy, 2018.
  24. National Institute of Statistics—ISTAT. Mappa dei Rischi dei Comuni Italiani. Senigallia (AN); ISTAT: Rome, Italy, 2018.
  25. National Institute of Statistics—ISTAT. Mappa dei Rischi dei Comuni Italiani. Torino di Sangro (CH); ISTAT: Rome, Italy, 2018.
  26. EU Life PRIMES Report B1: Summary of Data and State of the Art about Hydraulic Risk Observed in the Three Regions. Available online: http://www.lifeprimes.eu/index.php/scenari-climatici-report/ (accessed on 23 December 2021).
  27. Carone, M.T.; Melchiorri, L.; Romagnoli, F.; Marincioni, F. Can a Simulated Flood Experience Improve Social Resilience to Disasters? Prof. Geogr. 2019, 71, 604–615. [Google Scholar] [CrossRef]
  28. Moser, C.A.; Stuart, A. An Experimental Study of Quota Sampling. J. R. Stat. Soc. Ser. A (Gen.) 1953, 116, 349–405. [Google Scholar] [CrossRef]
  29. Istituto Nazionale di Statistica Popolazione Residente al 1° Gennaio. Available online: http://dati.istat.it/Index.aspx?DataSetCode=DCIS_POPRES1 (accessed on 4 June 2021).
  30. Casaló, L.V.; Escario, J.J.; Rodriguez-Sanchez, C. Analyzing differences between different types of pro-environmental behaviors: Do attitude intensity and type of knowledge matter? Resour. Conserv. Recycl. 2019, 149, 56–64. [Google Scholar] [CrossRef] [Green Version]
  31. Peppoloni, S.; Di Capua, G. Geoethics: Ethical, social, and cultural values in geosciences research, practice, and education. Spec. Pap. Geol. Soc. Am. 2016, 520, 17–21. [Google Scholar] [CrossRef]
  32. Ramasubramanian, M.; Allan, J.N.; Retamero, R.G.; Jenkins-Smith, H.; Cokely, E.T. Flood Risk Literacy: Communication and Implications for Protective Action. Proc. Hum. Factors Ergon. Soc. Annu. Meet. 2019, 63, 1629–1633. [Google Scholar] [CrossRef]
  33. Netto, V.M.; Meirelles, J.; Ribeiro, F.L. Social interaction and the city: The effect of space on the reduction of entropy. Complexity 2017, 2017, 6182503. [Google Scholar] [CrossRef] [Green Version]
  34. Navarro, O.; Mambet, C.; Barbaras, C.; Chadenas, C.; Robin, M.; Chotard, M.; Desvergne, L.; Desse, M.; Chauveau, E.; Fleury-Bahi, G. Determinant factors of protective behaviors regarding erosion and coastal flooding risk. Int. J. Disaster Risk Reduct. 2021, 61, 102378. [Google Scholar] [CrossRef]
  35. Siegrist, M.; Gutscher, H. Natural hazards and motivation for mitigation behavior: People cannot predict the affect evoked by a severe flood. Risk Anal. 2008, 28, 771–778. [Google Scholar] [CrossRef] [PubMed]
  36. Ferri, M.; Wehn, U.; See, L.; Monego, M.; Fritz, S. The value of citizen science for flood risk reduction: Cost-benefit analysis of a citizen observatory in the Brenta-Bacchiglione catchment. Hydrol. Earth Syst. Sci. 2020, 24, 5781–5798. [Google Scholar] [CrossRef]
  37. Bremer, S.; Haque, M.M.; Aziz, S.B.; Kvamme, S. ‘My new routine’: Assessing the impact of citizen science on climate adaptation in Bangladesh. Environ. Sci. Policy 2019, 94, 245–257. [Google Scholar] [CrossRef]
  38. Peppoloni, S.; Di Capua, G. Geoethics: Ethical, social and cultural implications in geosciences. Ann. Geophys. 2017, 60, 1–8. [Google Scholar] [CrossRef] [Green Version]
  39. Peppoloni, S.; Di Capua, G. Geoethical considerations in disaster risk reduction. In XX Argentine Geological Congress; Asociacion Geologica Argentina: Buenos Aires, Argentina, 2017; pp. 12–15. [Google Scholar]
  40. Haworth, B.T.; Bruce, E.; Whittaker, J.; Read, R. The good, the bad, and the uncertain: Contributions of volunteered geographic information to community disaster resilience. Front. Earth Sci. 2018, 6, 183. [Google Scholar] [CrossRef] [Green Version]
  41. Stewart, I.S.; Ickert, J.; Lacassin, R. Communicating Seismic Risk: The Geoethical Challenges of a People-Centred, Participatory Approach. Ann. Geophys. 2018, 60, 1–17. [Google Scholar] [CrossRef] [Green Version]
  42. Longstaff, P.H. Security, Resilience, and Communication in Unpredictable Environments such as Terrorism, Natural Disasters, and Complex Technology; Harvard University: Cambridge, MA, USA, 2005; ISBN 187971695X. [Google Scholar]
  43. De Groot, M. Exploring the relationship between public environmental ethics and river flood policies in western Europe. J. Environ. Manag. 2012, 93, 1–9. [Google Scholar] [CrossRef]
  44. Connelly, N.A.; Knuth, B.A.; Kay, D.L. Public support for ecosystem restoration in the Hudson River Valley, USA. Environ. Manag. 2002, 29, 467–476. [Google Scholar] [CrossRef]
  45. Guillard, M.; Navarro, O.; Fleury-Bahi, G. Flooding experience and assessment of climate change: Implication of psychological distance, risk perception and place attachment/Experiencia de inundaciones y evaluación del cambio climático: Implicaciones de la distancia psicológica, la percepción de. Psyecology 2019, 10, 287–312. [Google Scholar] [CrossRef]
  46. De Dominicis, S.; Fornara, F.; Ganucci Cancellieri, U.; Twigger-Ross, C.; Bonaiuto, M. We are at risk, and so what? Place attachment, environmental risk perceptions and preventive coping behaviours. J. Environ. Psychol. 2015, 43, 66–78. [Google Scholar] [CrossRef]
  47. Billig, M. Is My Home My Castle? Place Attachment, Risk Perception, and Religious Faith. Environ. Behav. 2006, 38, 248–265. [Google Scholar] [CrossRef]
  48. Bonaiuto, M.; Alves, S.; De Dominicis, S.; Petruccelli, I. Place attachment and natural environmental risk: Research review and agenda. J. Environ. Psychol. 2016, 48, 33–53. [Google Scholar] [CrossRef]
  49. Clarke, D.; Murphy, C.; Lorenzoni, I. Place attachment, disruption and transformative adaptation. J. Environ. Psychol. 2018, 55, 81–89. [Google Scholar] [CrossRef] [Green Version]
  50. Taylor, M.; Wells, G.; Howell, G.; Raphael, B. The role of social media as psychological first aid as a support to community resilience building. A Facebook study from “Cyclone Yasi Update”. Aust. J. Emerg. Manag. 2012, 27, 20–26. [Google Scholar]
  51. Verbrugge, L.; van den Born, R. The role of place attachment in public perceptions of a re-landscaping intervention in the river Waal (The Netherlands). Landsc. Urban Plan. 2018, 177, 241–250. [Google Scholar] [CrossRef] [Green Version]
  52. Bodoque, J.M.; Amérigo, M.; Díez-Herrero, A.; García, J.A.; Cortés, B.; Ballesteros-Cánovas, J.A.; Olcina, J. Improvement of resilience of urban areas by integrating social perception in flash-flood risk management. J. Hydrol. 2016, 541, 665–676. [Google Scholar] [CrossRef] [Green Version]
  53. Alexander, D. Natural Disasters: A Framework for Research and Teaching. Disasters 1991, 15, 209–226. [Google Scholar] [CrossRef]
Figure 1. Location of the 10 study areas located in the Emilia-Romagna, Marche, and Abruzzo Regions (central Italy).
Geosciences 12 00131 g001
Figure 2. Representation of the effect of the LIFE PRIME project activities in shaping flood literacy in the ten pilot areas (PR = Poggio Renatico; IM = Imola; LU = Lugo; MO = Mordano; SAS= Sant’Agata sul Santerno; RA = Ravenna; SE = Senigallia; SBT = San Benedetto del Tronto; PI = Pineto; TS=Torino di Sangro). Each question is represented as a circle numbered from G1 to G3 and colors represent the increase (green), decrease (pink), or absence of a change (blue) in flood literacy between the ex-ante and ex-post phases.
Geosciences 12 00131 g002
Figure 3. Representation of the effect of the LIFE PRIME project activities in shaping the effectiveness of communications in the ten pilot areas (PR = Poggio Renatico; IM = Imola; LU = Lugo; MO = Mordano; SAS = Sant’Agata sul Santerno; RA = Ravenna; SE = Senigallia; SBT = San Benedetto del Tronto; PI = Pineto; TS = Torino di Sangro). Each question is represented as a circle numbered from G4 to G7 and colors represent increase (green), decrease (pink), or absence of a change (blue) between the ex-ante and ex-post phases.
Geosciences 12 00131 g003
Figure 4. Representation of the effect of the LIFE PRIME project activities in shaping personal responsibility towards nature in the ten pilot areas (PR = Poggio Renatico; IM = Imola; LU = Lugo; MO = Mordano; SAS=Sant’Agata sul Santerno; RA = Ravenna; SE = Senigallia; SBT=San Benedetto del Tronto; PI = Pineto; TS = Torino di Sangro). Each question is represented as a circle numbered from G8 to G9 and colors represent the increase (green), decrease (pink), and absence of a change (blue) in personal responsibility between the two phases.
Geosciences 12 00131 g004
Table 1. List of the study areas identified by region, municipality (district), and code. Each site has been linked to the most impacting type of floods, activities implemented by the project, and number of survey respondents. The types of floods are listed in order of importance. The implemented flood risk reduction activities are listed per type (i.e., civic adaptation plans, workshops, alert simulations, theatrical plays) and number of involved citizens. The number of spectators in the theatrical play are estimated. The number of questionnaire respondents are divided in the ex-ante (EA) and ex-post (EP) phases.
RegionMunicipality (District)CodeFlood HazardActivity ImplementedQuestionnaire Respondents
TypeParticipants (N°)EA (N°)EP (N°)
Emilia-RomagnaPoggio
Renatico
PRRiver floodCivic adaptation plans462515
Workshops28; 38
Simulations-
Theatrical play-
ImolaIMRiver flood, flash floodCivic adaptation plans26101106
Workshops-
Simulations18
Theatrical play-
LugoLURiver flood, flash floodCivic adaptation plans638082
Workshops27
Simulations-
Theatrical play-
MordanoMORiver flood, flash floodCivic adaptation plans42323
Workshops-
Simulations-
Theatrical play-
Sant’Agata sul
Santerno
SASRiver flood, flash floodCivic adaptation plans621211
Workshops-
Simulations100
Theatrical play-
Ravenna (Lido di Savio)RACoastal flood, river floodCivic adaptation plans161611
Workshops5
Simulations-
Theatrical play-
MarcheSenigalliaSERiver flood, coastal floodCivic adaptation plans606770
Workshops33
Simulations280
Theatrical play-
San Benedetto del Tronto (Sentina)SBTCoastal flood, river floodCivic adaptation plans2241818
Workshops43
Simulations560
Theatrical play100s
AbruzzoPineto (Scerne di Pineto)PIRiver flood, coastal floodCivic adaptation plans112222
Workshops14
Simulations46
Theatrical play-
Torino di SangroTSRiver flood, coastal floodCivic adaptation plans81312
Workshops10
Simulations-
Theatrical play-
Total 1800s377370
Table 2. Overview of the questions selected for the analysis with classification by thematic area and type of question.
TopicQuestion AnalyzedType of Question
DemographyD1: Age (years)Open
D2: GenderSingle answer
D3: EducationSingle answer
Flood LiteracyG1 What elements can cause flood events?Multiple choice
G2: Landscape conservation requires a change in the development modelLikert scale
G3: The probability that flood events will become more frequent isMultiple choice
Effective
communication
G4: An effective information campaign on flood risk is the basis for preventionLikert scale
G5: What are the most important means of communication for public information on floods?Multiple choice
G6: Information about floods is easily accessible on:Multiple choice
G7: The most important indications on flooding are provided byMultiple choice
Personal
responsibility
G8: Citizens’ behavior can reduce or accentuate floodsLikert scale
G9: I am willing to change the place where I live in order to reduce the exposure to the floodsLikert scale
Publisher’s Note: MDPI stays neutral with regard to jurisdictional claims in published maps and institutional affiliations.

