
Foredune and Beach Dynamics on the Southern Shores of Lake Michigan during Recent High Water Levels


1
Department of Geosciences, Indiana University Northwest, 3400 Broadway, Gary, IN 46408, USA
2
Department of Mathematics, Indiana University Northwest, 3400 Broadway, Gary, IN 46408, USA
*
Author to whom correspondence should be addressed.
Geosciences 2022, 12(4), 151; https://0-doi-org.brum.beds.ac.uk/10.3390/geosciences12040151
Submission received: 20 January 2022
/
Revised: 5 March 2022
/
Accepted: 11 March 2022
/
Published: 28 March 2022
(This article belongs to the Special Issue Advanced Research in Coastal Morphodynamics)
Abstract
:From 18 January 2013 (175.16 m a.s.l.) to 8 September 2020 (177.82 m a.s.l.), Lake Michigan experienced its fastest and highest rise (2.67 m) since 1860, when instrumental measurements began. Extensive foredunes developed since the last high lake levels began eroding in 1997 at fast rates. This study focuses on coastal morphodynamics along the 800 m coast within the central Indiana Dunes State Park on Lake Michigan’s southern shores during this time. Severe foredune erosion, in terms of total horizontal dune loss and total volume of eroded sand, occurred unevenly over the three-year period, both temporally, during a single storm, a season, a year, or three years, and spatially, in the eastern, central, and western study areas. Late autumn storms accounted for most foredune erosion in 2018 and 2019, when foredune scarps retreated up to 4 and 9 m, respectively. Erosion was highest in the updrift eastern study area, where about 8 m3/m of sand was removed in 2018 and about 19 m3/m of sand was removed in 2019. The lack of shelf ice along the shore, rising lake levels, and convective storms that triggered meteotsunamis changed the foredune erosion pattern in 2020. Erosion became most vigorous in the downdrift central (13 m scarp retreat) and western (11 m scarp retreat) study areas. The average volume of eroded sand (21.5 m3/m) was more than double that of 2019 (8 m3/m), and almost quadruple the 2018 volume (5.5 m3/m). After foredune erosion events, the beach rapidly recovered and maintained its width as the shoreline migrated landward. On many occasions following these severe erosion events the dry portion of the beach aggraded and absorbed significant sand amounts removed from the foredunes. The remaining sand was transferred to the surf zone, where it changed the sand bar morphology and led to their coalescence and flattening.
1. Introduction
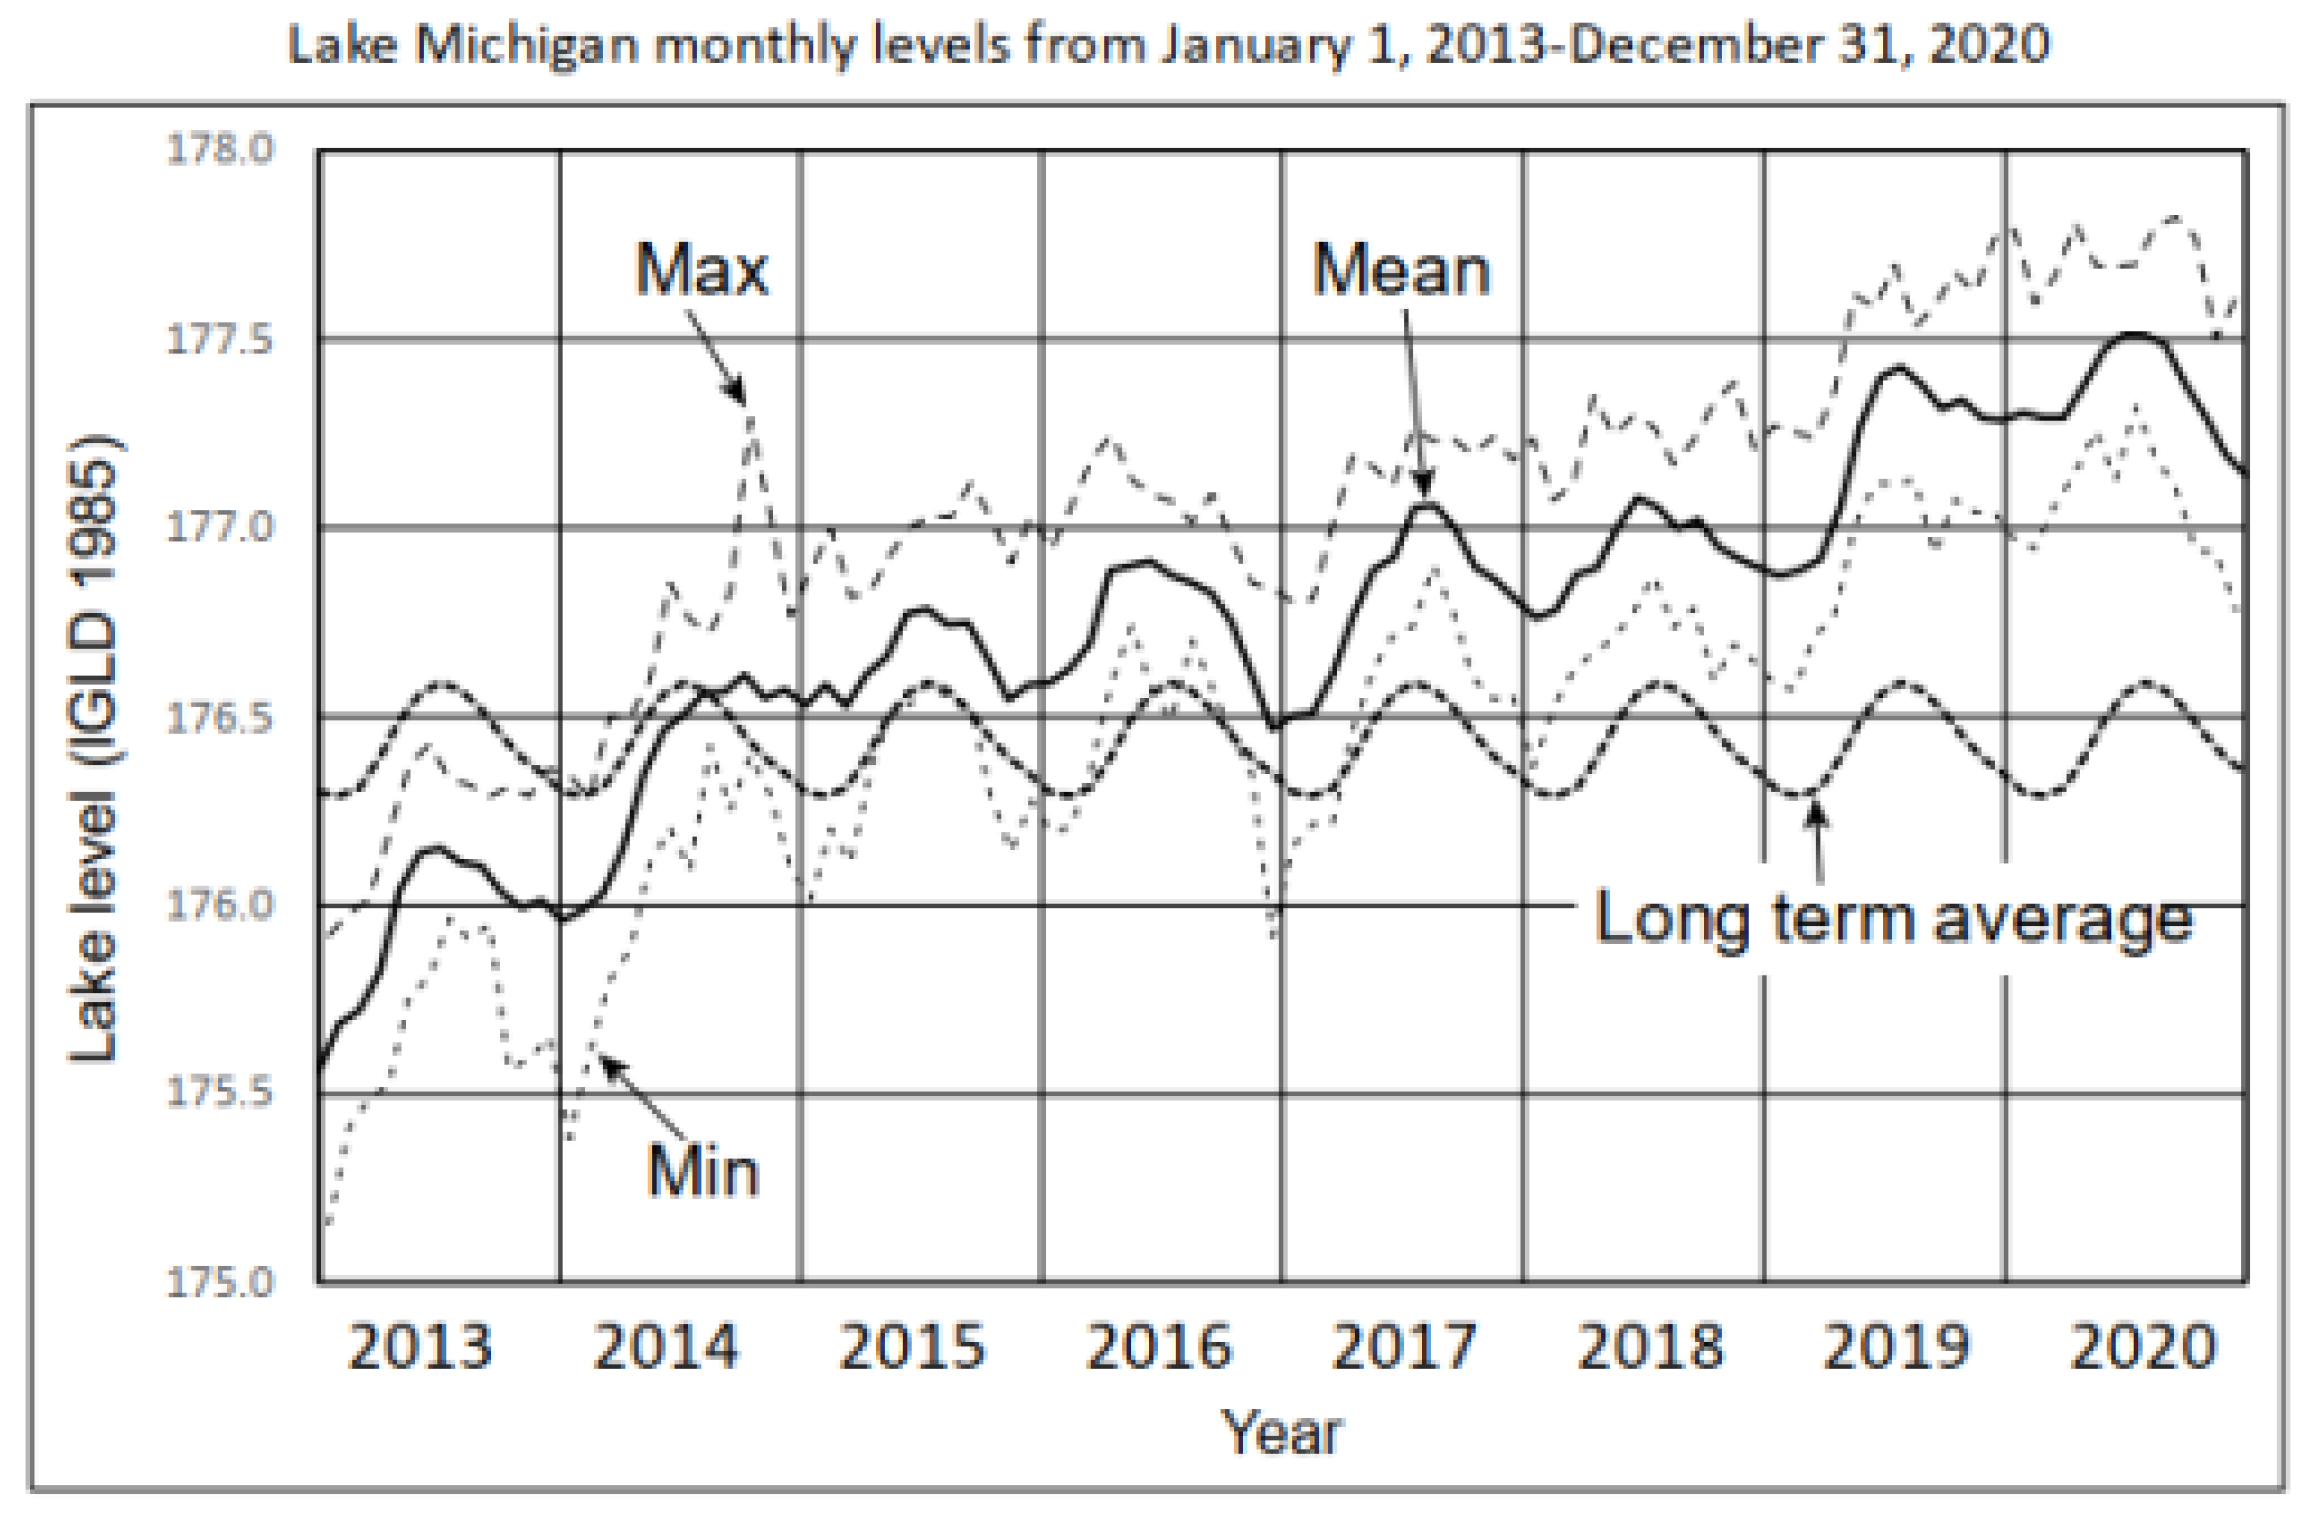
Lake Michigan-Huron’s levels fluctuate in short, intermediate, and long-term time intervals. Short-term fluctuations last from minutes to hours or days, and they are caused by storms that generate storm surges, waves, meteotsunamis, and seiches. These phenomena can temporarily rise the lake level more than 1 m. Intermediate fluctuations are annual variations between late winter lake level lows and late summer lake level highs, with amplitudes of 40–60 cm. Lake Michigan-Huron’s long-term level fluctuations are decadal-to-centuries patterns of highs and lows related to regional or global climate fluctuations associated with teleconnections of ocean atmosphere interactions (Figure 1). Within the historical lake level records, 8–20 years trends of 2–2.5 m fluctuations [1,2] are noted. Proxy data derived from the stratigraphy of strandplains and beach ridges suggest periodicities of 30 and 150 years, with lake level fluctuations of 0.5–1.5 m [2,3].
Lake Michigan levels were low through the early half of the twentieth century, rose in the early 1950s, fell to near-record lows in 1964, and then rose steadily into the 1980s, reaching a record high in the fall of 1986. Following a drop in the early 1990s, lake levels rose in the late 1990s and have remained low since then, culminating in an all-time low recorded in January 2013. Between January 2013 and December 2014 (Figure 2), water levels on Lake Michigan-Huron rose by 1 m, the highest rate ever recorded for a 2-year period, beginning in January and ending in December of the following year. This event coincided with below-average air temperatures and extensive winter ice cover across the Great Lakes. The rise in Lake Michigan levels in 2013 was due to the above-average spring runoff and persistent over-lake precipitation. In 2014, it was due to a rare combination of below-average evaporation, above-average runoff and precipitation, and very high inflow rates from Lake Superior through the St. Mary’s River [4]. From January 2013 until July 2020 (Figure 2), the average monthly levels of Lake Michigan rose from 175.57 to 177.46m, or 1.89 m, more than the previous continuous rise of 1.73 m from March 1964 to July 1974. The monthly, interannual, and decadal Lake Michigan water level variability is either greater than, or comparable to, the water level variability along other marine coasts.
Strong northerly winds over Lake Michigan can develop significant shear stress on the water surface and produce large waves, which, in turn, cause a storm surge and setup of water on the shoreline. The two primary categories of surge-causing storm events are: (1) cold-season non-convective wind events (NCWE) from extra-tropical cyclones, and (2) warm-season frontal systems producing thunderstorm-related wind events [5,6]. NCWEs are defined as either sustained winds of at least 64.4 km/h (40 mph) or 17.88 m/s for at least 1 hour or gusts of at least 93.34 km/h (58 mph) or 25.92 m/s [5]. The NCWEs are normally a result of winter storms (November–April) that emanate from the Rocky Mountains and pass through the Great Lakes region from the SW to the NE. Calumet Harbor, Port Inland, and Green Bay gauges have significantly higher maximum surge values (1–1.6 m) than the other Lake Michigan stations, reflecting their exposure to greater fetch lengths [5].
The contribution of wind to storm surge is often called wind setup. Wind is most effective in creating wind setup when it blows over shallow water. Wind setup is also a function of wind duration and fetch. Indiana’s coast on Lake Michigan exhibits a very large wind setup, because it has both shallow coastal waters and a long fetch distance. In fact, the 480-km north-northeast trending fetch is the longest on Lake Michigan. The same winds that cause a storm surge can also create large waves that impact the shoreline. Monthly averaged significant wave heights (SWH) in Southern Buoy # 45,007 are largest in November (1.2 m) and October (1.1 m). The maximum SWH in southern Lake Michigan are 6–8m high [7] and occur in the late autumn season.
Meteotsunamis are long waves with characteristics similar to seismically generated tsunamis. They form due to rapid changes in atmospheric pressure associated with convective weather systems. In the Great Lakes, meteotsunamis with heights above 0.3 m occur, on average, more than 100 times per year [8]. They are most common in southern Lake Michigan (April, May, and June) and Lake Erie (April and October). Meteotsunamis are defined as propagating waves with wave periods of less than 2 hours compared to seiches, which have standing waves with periods greater than 2 hours [9].
2. Foredunes
Foredunes are shore-parallel dune ridges that form on the top of the backshore by aeolian sand deposition in vegetation. They can form on any shore: open ocean beaches, semi-enclosed bays, estuaries, lagoons and lakes, and in almost any climate, from tropical to arctic. Foredune morphology depends on plant density, distribution, height and cover, wind direction and speed, rates of sand transport, storm surge, wave erosion and overwash [10]. Foredunes on the southern coast of Lake Michigan were studied by Cowles [11] and Cressey [12], who related the foredune types to the plant species growing on them and noted that active dunes and blowouts were shaped by northwesterly winds. Olson [1] correlated the cyclicity of foredune development and erosion with the fluctuating levels of Lake Michigan. Later studies were devoted to stratigraphy studies of foredunes and beach ridges associated with lake-level variations over time [1,2]. The most recent foredune studies in this and nearby areas [13,14,15,16,17,18] have contributed to understanding the seasonal nature of Lake Michigan dune processes as well as the importance of storms in foredune development. Foredune morphodynamics are controlled by wind direction and speed, sediment supply, beach width and profile, vegetation cover [19,20,21,22,23,24,25,26,27,28], as well as by teleconnections and climate variability, storm surges, waves, overwash, and the surf zone morphology [29,30,31,32,33,34,35,36,37]. Even though the study area is located in the Indiana Dunes State Park, which was protected from development since 1925, coastal structures built prior to 1925 and in more recent years as well as more recent beach nourishment in nearby areas along the southern Lake Michigan shoreline inevitably suggest an anthropogenic impact on foredune dynamics, as suggested by Nordstrom [38] and Robin et al. [39].
In this paper we will present our analysis of changes in the size and morphology of foredunes and the beach along the southern Lake Michigan coast in relation to high Lake Michigan water levels and storms over a three year period, from January 2018 to January 2021.
3. Study Area
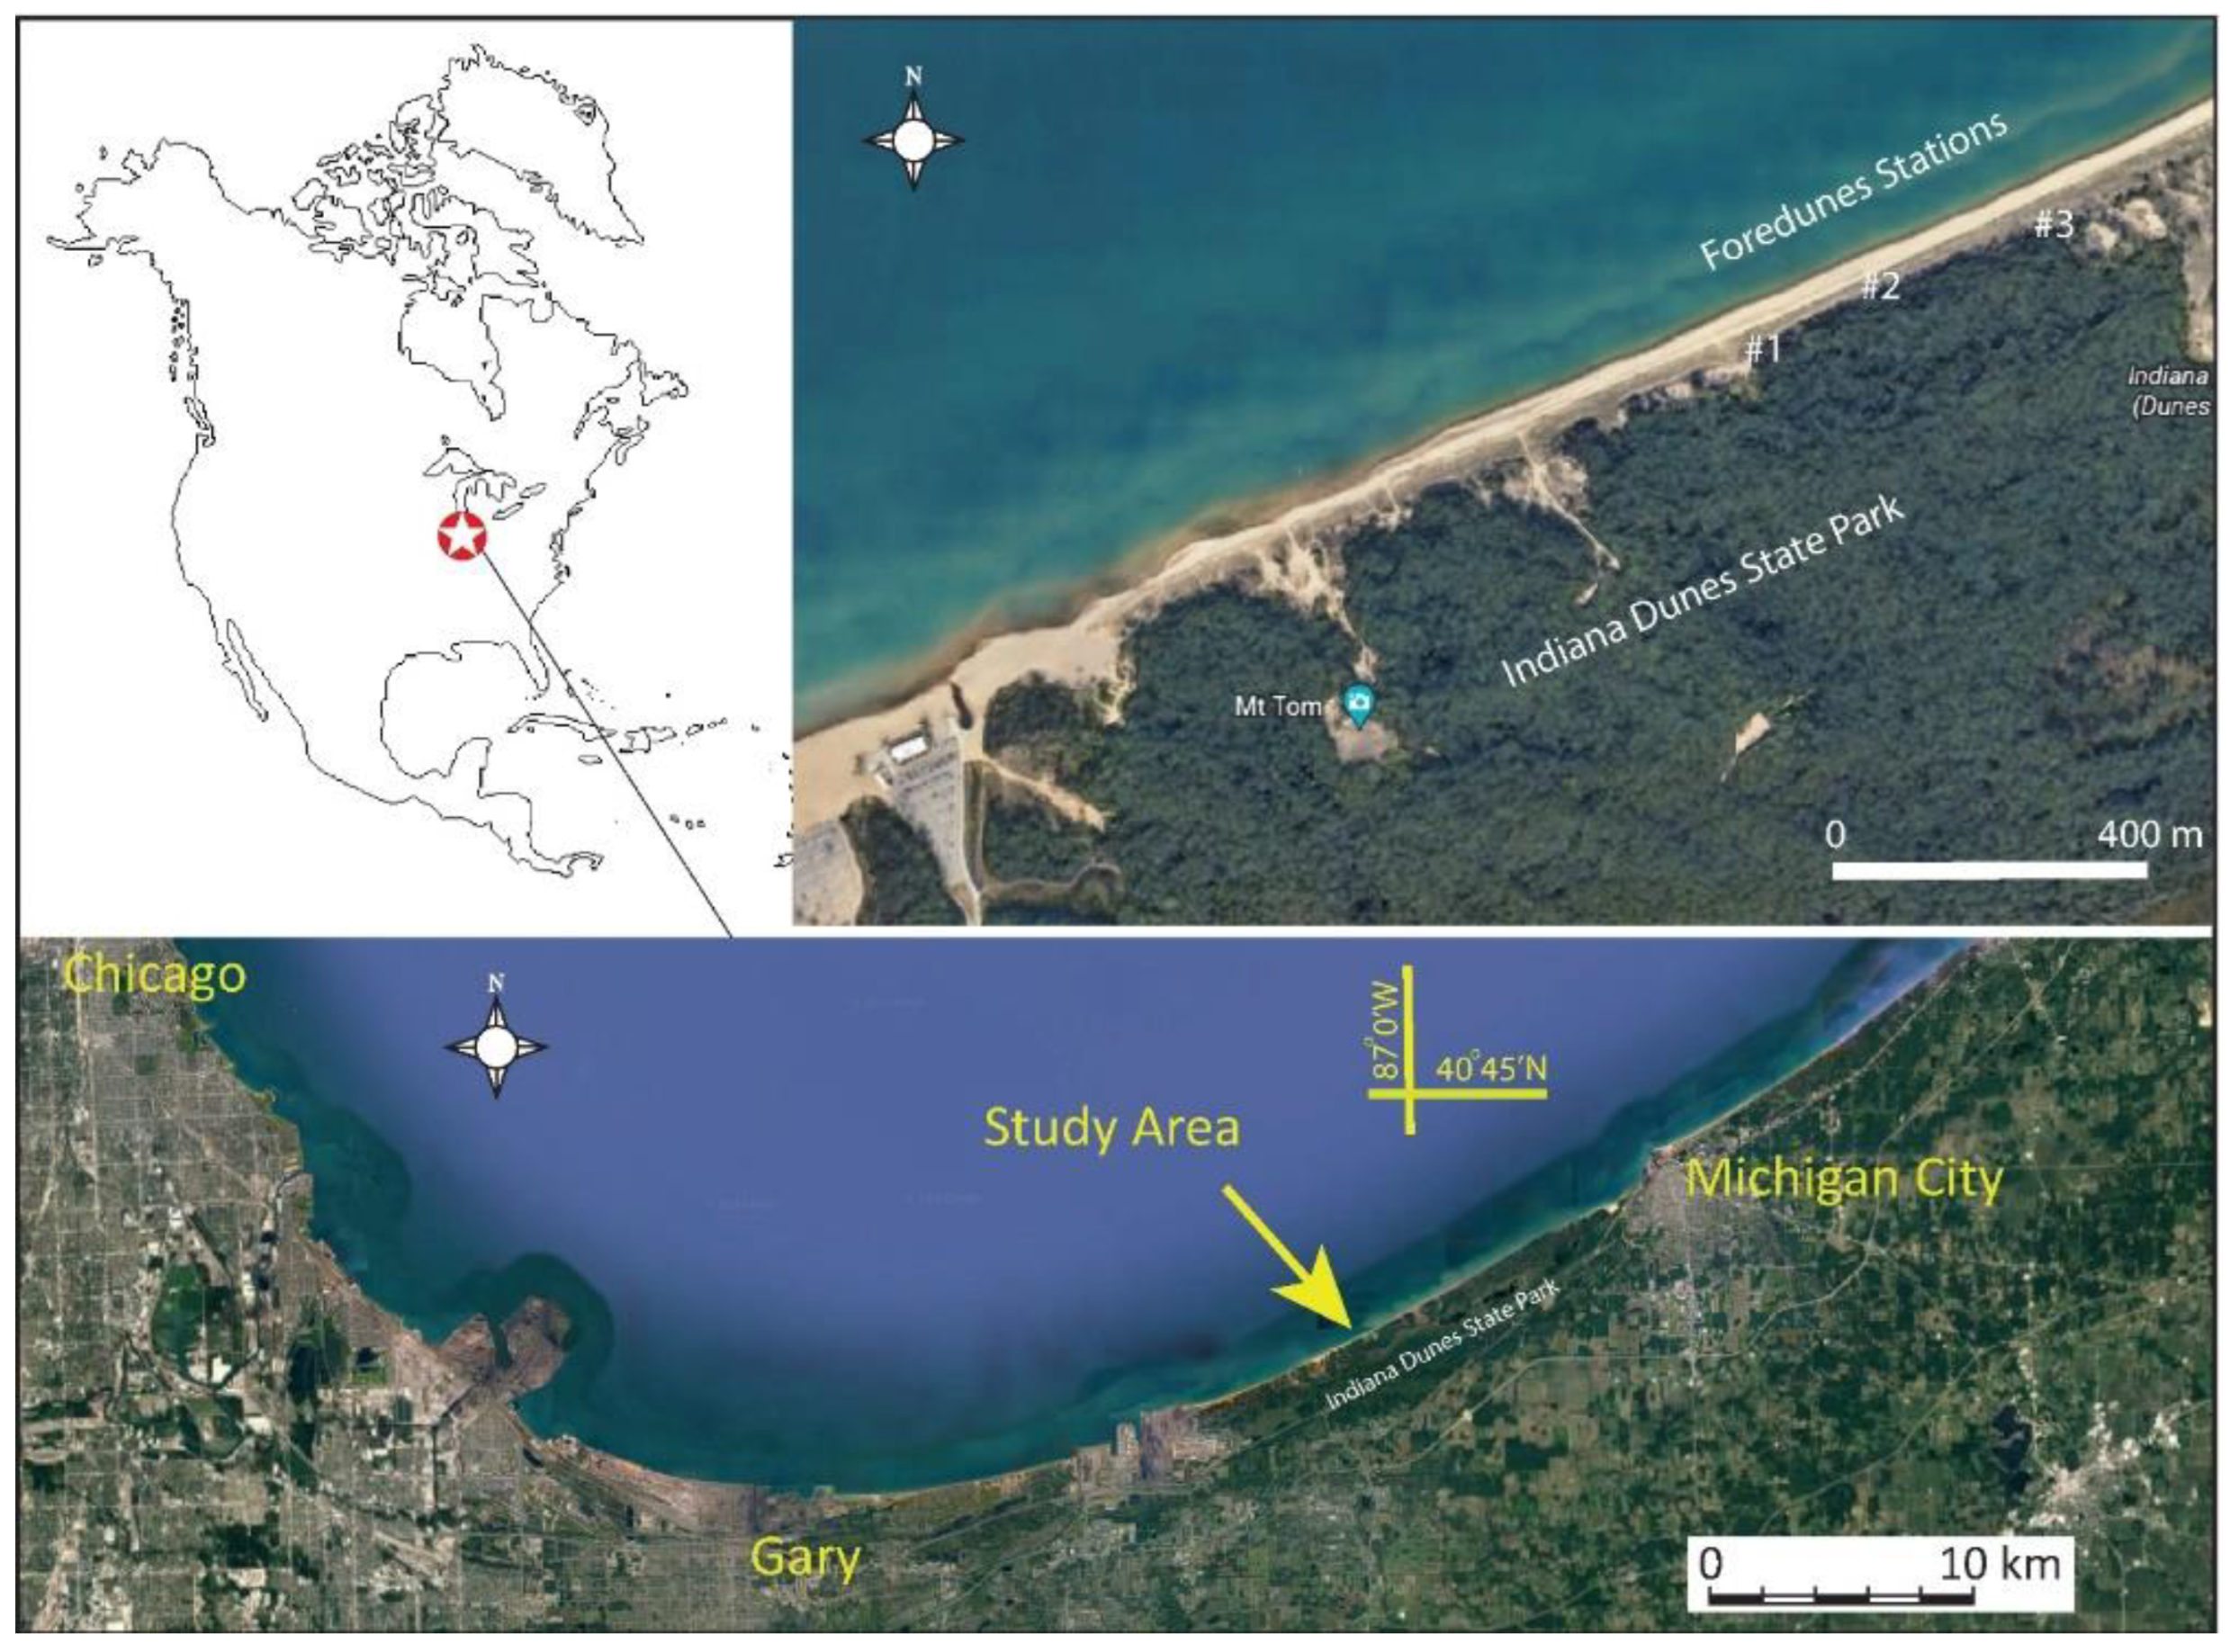
The study area, an 800-m stretch of coast along the southern Lake Michigan, is in the central part of the Indiana Dunes State Park (IDSP), between the Beach House Blowout to the east and the Ghost Forest Blowout to the west (Figure 1). This segment of the coast is within the Eastern Sector of Indiana’s Lake Michigan shoreline [40] previously described as Reach 1 and Reach 2 [41] or as IN-2A [42]. Coastal structures altered the continuous littoral drift and created several pocket beaches on the southern Lake Michigan coast. The attractiveness of the coasts worldwide, the population growth, and the continuous development of coastal structures on them increased the number of pocket beaches, so they now represent ~50% of the world’s coastline [43]. The Eastern Sector is the longest (20.7 km) pocket beach on Indiana’s Lake Michigan coast. It is bounded on the east by the Trail Creek pier in Michigan City and by the Burns Harbor breakwater on the west (Figure 1). The most pristine coast on southern Lake Michigan is preserved in this sector. The IDSP, established in 1925, covers an area of 8.8 km2, including 5.25 km of coast. The Indiana Dunes National Park (INDU) was authorized in 1966, and most of its area (61 km2) is in the Eastern Sector of Indiana’s Lake Michigan coast. The littoral drift here carries sediments along the shore from east to west. The coast is micro-tidal, barred the dissipative beach with multiple sand bars [44,45], characterized by fine sand, high wave energy, and short wave periods.
At the beginning of this study, incipient foredunes were already eroded. A scarping of the established foredunes produced 2–4-m-high cliffs at the backshore foredune interface (Figure 3). The terrace-type established foredunes [10], 2–4 m high, ~30 m wide, were covered with a dense vegetative cover of marram grass (Ammophila breviligulata), sand reed grass (Calamovilfa longifolia), little bluestem grass (Schizachyrium scoparium), sand cherry (Prunus pumila), and small cottonwoods (Populus deltoides) [15,19]. The established foredunes were backed by a narrow swale and prominent relict foredune ridges 6–10 m high. The foredunes are composed of moderately to well-sorted medium-grained quartz (~90%), feldspar (~6%), lithic fragments (~3%), and heavy minerals (~1%) sand. Plant roots and animal burrows have bioturbated the tops of the foredunes, but a low angle cross-lamination is evident in the rest of the scarped foredune profiles.
The water line separates the subaerially exposed backshore from the foreshore, a submerged part of the beach profile. The backshore consists of moderately to poorly sorted coarse to fine-grained quartz sand, with scattered platy mudstone gravel, and minor amounts of limestone, dolomite, and crystalline pebbles [40]. Horizontal and lakeward-dipping laminations are delineated by very fine-grained lags of dark, heavy minerals.
In the surf zone, coarse sand and gravel similar in size and composition to the backshore gravel occur in the swash zone, while medium to fine sand makes up the sand bars. On the southeastern shores of Lake Michigan, ~50 km from the study area during lower Lake Michigan-Huron levels, most coastal sand resides in the foredunes and wide backshore, and there are three sand bars in the surf zone. The ephemeral bar is ~25–60 m from the strandline, with a crest of 1 m or less below the water level, stands ~0.3 m high and is 12-18 m wide. The second bar is ~50–150 m from the strandline, in 1–2.5-m-deep water, and the third bar is 180–500 m from shore at water depths of 2.5–5 m [46]. Our analysis of a 2005 aerial photo, taken when Lake Michigan levels were below normal, indicates the presence of three bars in the surf zone. The inner bar (equivalent to the ephemeral bar of [46]) was ~30–40 m wide and separated by a 5–10-m-wide runnel from the beach. In some areas, however, it was welded to the shore. The second bar was ~80–100 m from the shore, continuous, but somewhat sinuous in shape, and ~10 m wide. The third bar was ~280–300 m from the shore, but discontinuous and 20–30 m wide. The sand thickness in the surf zone increases during higher Lake Michigan-Huron levels and decreases during lower lake levels. Between 1989 and 1992, as Lake-Michigan-Huron’s levels fell, the sand in the surf zone was 2–2.4 m thick along the 600 m transect perpendicular to the shore in the Indiana Dunes State Park [47].
4. Methods
We monitored and measured backshore and foredune erosion/accretion rates at three stations 16 times over the past three years. Field surveying was done at least once at the beginning of each season. On several occasions, we measured the profiles immediately after major storms. The three reference stations (Figure 3) are three trees growing at the landward edge of the established foredunes abutting the relict foredune ridges. A Garmin GPS 60 Navigator Handheld Receiver, a Keson fiberglass measuring tape, a Northwest NSL500 Level-Transit Theodolite mounted on a Johnson Level 40-6350 Universal Tripod, and a collapsible rod with increments of 1/8 inches (3.2 mm) were used in surveying. The total volume of eroded sand was approximated by assuming a foredune thickness of 2 m. The dry part of the beach, the backshore, was monitored and measured in two aspects. The width of the dry beach was measured between the water line and the base of the foredune scarp. The thickness of the backshore was determined from the elevation difference between the top of the backshore and the base of the stations on the foredunes. The aggradational backshore had a platform-like profile, a 0.2–1.7-m-high berm, a steep (20–30°) beach face, and a flat or slightly concave profile from the berm to the foredune scarp. Concave backshore profiles were best revealed after storms because they would contain a runnel with standing water for several days. The erosional backshore lacked berm, and had a ramp-like profile, sloping 2–5° from the base of the foredune scarp to the water line. Aerial photographs were analyzed to determine the size and position of the sand bars in the surf zone and the extent of the foredunes in the years prior to the 2014 rise in Lake Michigan’s levels. Textural and petrographic analyses of sediment samples were done at the Department of Geosciences, Indiana University Northwest in Gary. The weather summary data are from the Great Lakes Region’s Quarterly Climate Impacts and Outlook [48], and the wind speed and direction data are from NOAA’s GLERL Station MCYI3—Michigan City, IN, 13 km east of the study area. Wave height data were collected from NDBC Station 45,170—Michigan City Buoy, IN, and lake level data from NOOA/NOS/CO-OPS Station 9,087,044 Calumet Harbor, IL, 40 km west of the study area.
5. Results
The beginning of 2018 had near-to-record-breaking low air temperatures and ice cover above the long-term average on the lake. The end of February was notable for the excessive amounts of precipitation and widespread flooding that impacted most of the Great Lakes region. Spring 2018 lake levels were 35 cm higher than in 2017. But the summer level was the same as that of summer 2017. The autumn weather was colder than average, especially November, and lake levels were barely higher than in 2017.
The lowest amount of foredune erosion and change in the coastal sand budget occurred during 2018, the first year of study (Figure 4, Table 1). Maximum foredune erosion occurred in late November, when strong (>15 m/s) northeasterly winds (20–27 azimuth) generated very high waves and a storm surge of 0.6 m. Maximum foredune erosion of 3.1 m was measured at Station #3, while foredunes at Station #2 (1.1 m) and Station #1 (0.9 m) were less eroded. A combination of storm surge reaching the base of the foredunes and splashing waves eroded the foredunes. Dense vegetation, including grasses, shrubs, and scattered trees, allowed relatively stable, vertical scarps to form in the foredunes. Less than 5% of the total sand from the eroded foredune was blown onto the top of the receding foredune scarp (Figure 5A). After the passage of the storm and a calming of the lake’s waters, we measured only a minor (0.3–1 m) shortening of the backshore. However, the backshore accreted 0.3 m, indicating that most of the eroded foredune sand ended up in the backshore rather than in the surf zone.
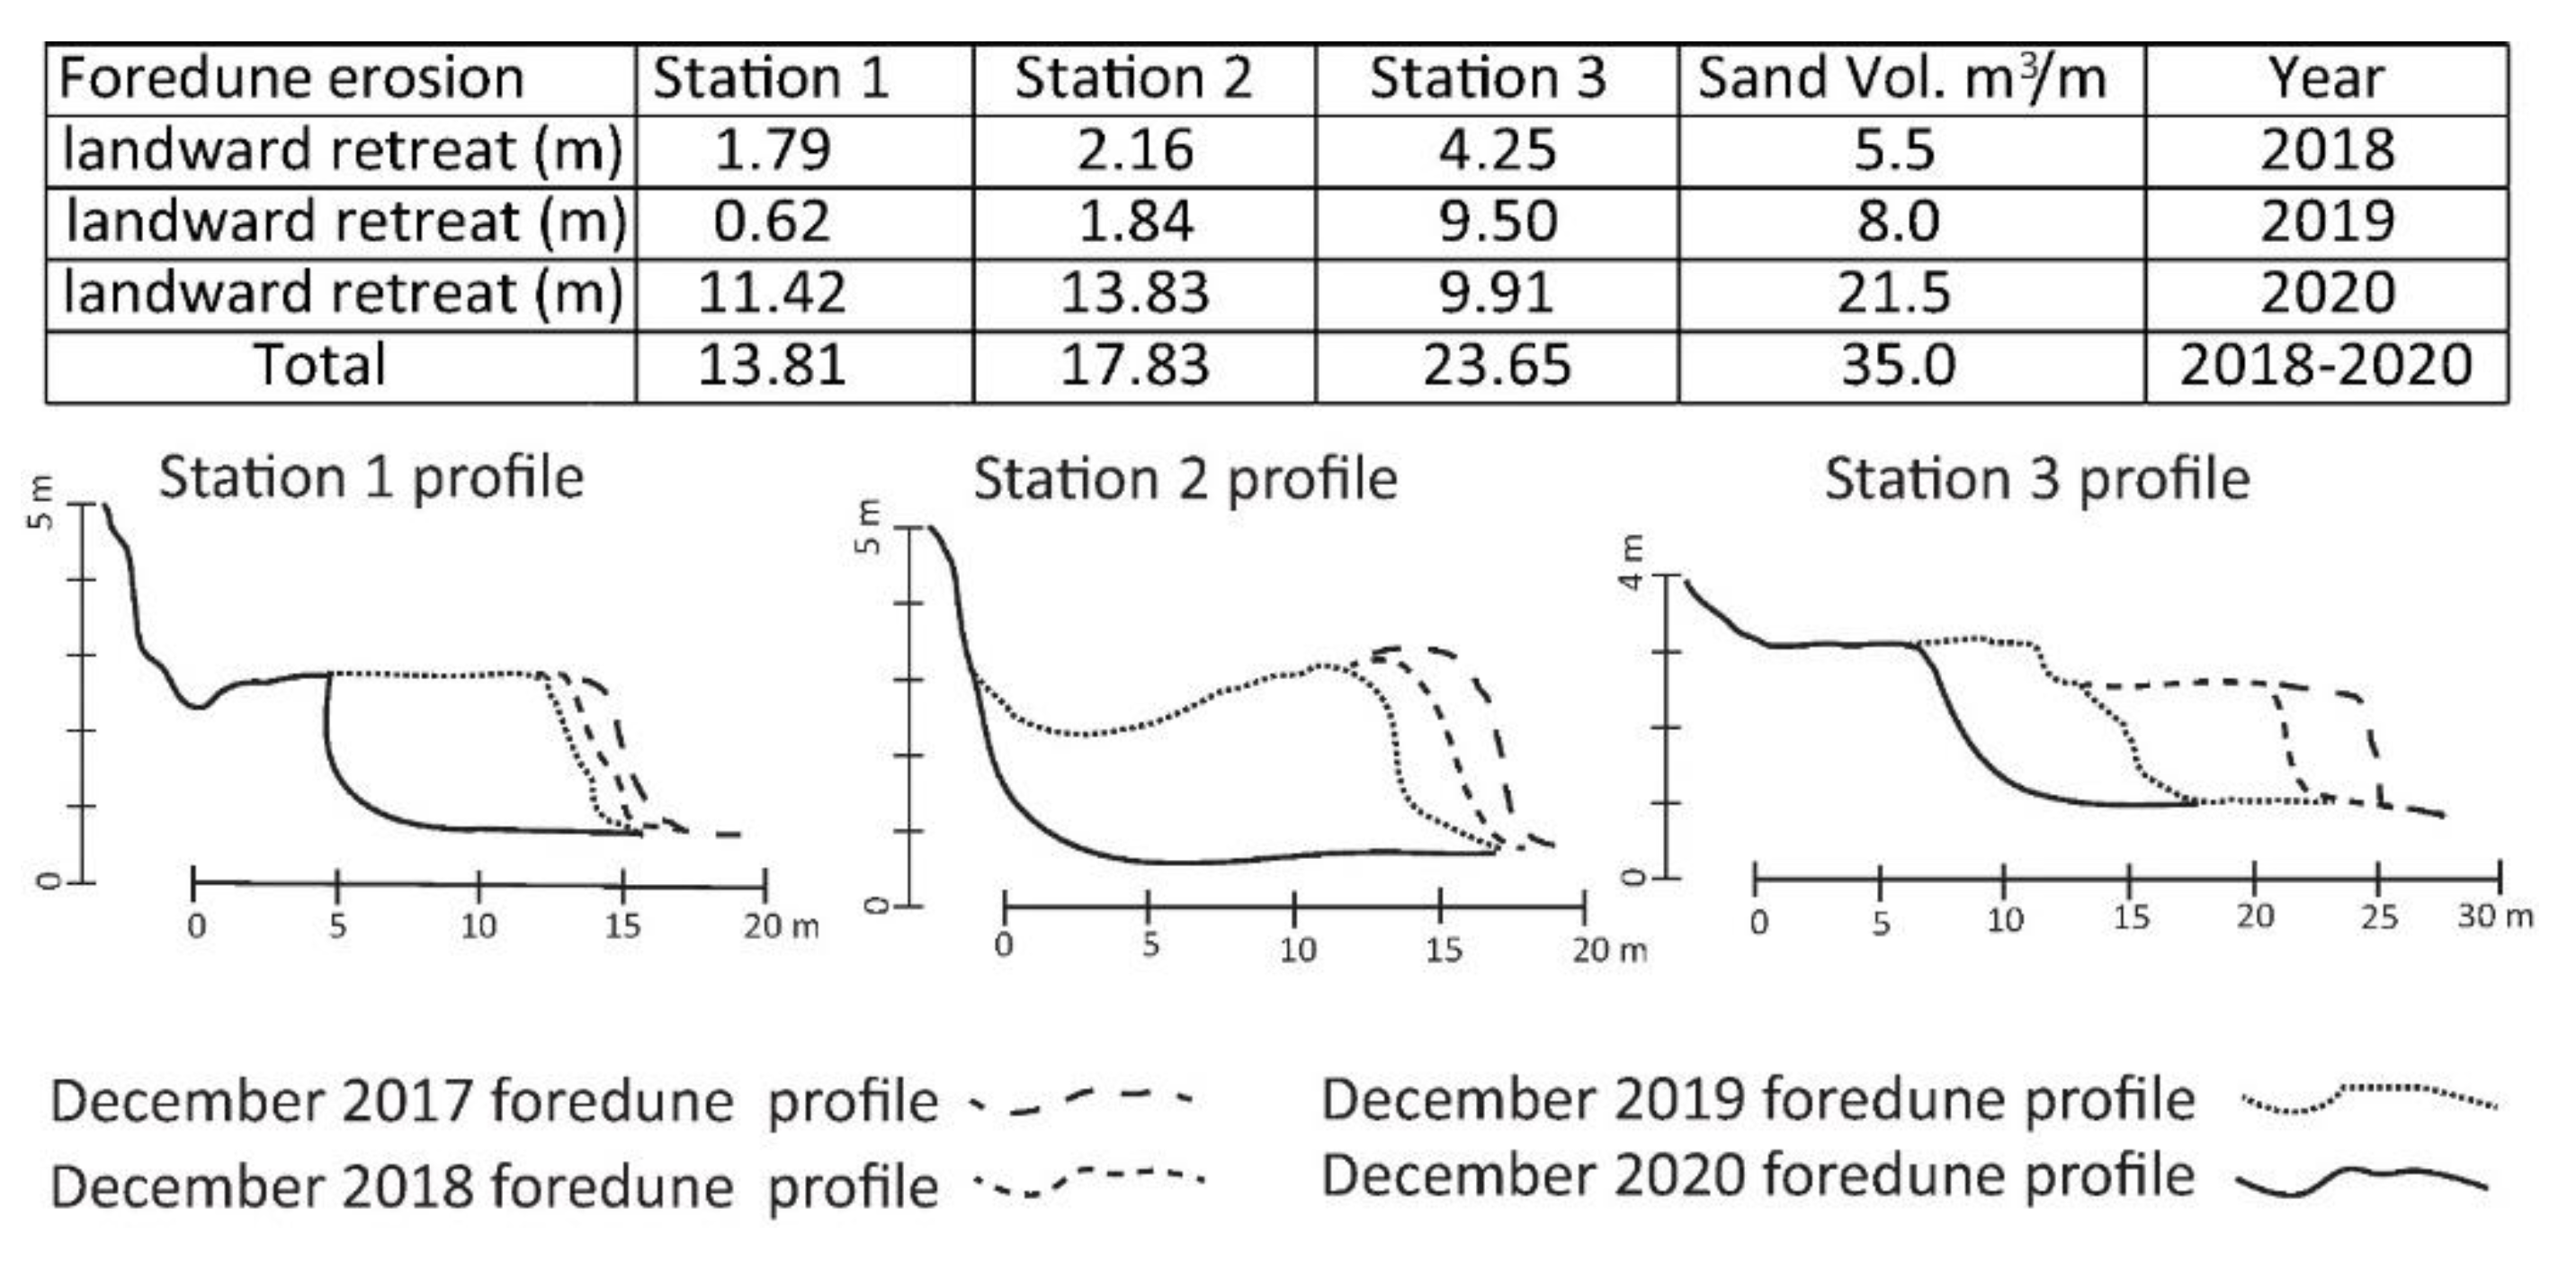
Throughout 2018, the easternmost foredunes, near Station #3, exhibited the most erosion, totaling 4.25 m of horizontal loss. The central foredunes near Station #2 lost 2.16 m, and the westernmost foredunes, near Station #1, lost only 1.79 m in width. Approximately 5.5 cubic meters of sand per 1 meter of coast was eroded from the foredunes and transferred to the backshore and the surf zone (Figure 4). Shoreline recession was uneven and amounted to 3.2 m and 4.2 m in eastern and western study areas, respectively, while the shoreline in the central study area prograded 4.3 m. From early January to late December 2018, the backshore width was reduced by 5 m in the east and by 2–2.5 m in the central and western study areas. Most of the sand was transferred to the surf zone in late spring, when an approximately 0.6-m-thick layer of sand was removed from the backshore (Figure 6).
Extreme cold occurred in early 2019, as the polar vortex descended on the Great Lakes Basin. The study area had above average snowfall. By the end of winter, most of the Lake Michigan basin was still covered by snow, and ice enveloped the coast, covering over 70% of Lake Michigan’s surface. In early 2019, lake levels were ~6 cm higher than in the same period of the previous year. Spring was colder than normal and extremely wet, especially in May. Chicago had its wettest May on record, with 21 cm (8.25 in) of rain. Lake Michigan’s level in early June was 75 cm above average and 29 cm higher than in early June 2018. Even though the summer was drier than normal, Lake Michigan’s levels remained high and were 30 cm higher than in the preceding year. The autumn season was cooler and wetter than normal. The Lake Michigan level was 90 cm above average, and 42 cm above the 2018 end of November level.
A larger volume of foredunes was eroded in 2019 than in 2018. Despite high winds (23.89 m/s, gusting to 26.6 m/s) in late February 2019, the foredunes and beach were not eroded due to the extensive growth of shelf ice on Lake Michigan. Two major episodes of foredune erosion occurred in mid- to late-autumn. The most severe storm occurred from the late afternoon on October 30 to the early afternoon on November 1, 2019. Winds up to 19.3 m/s and gusts of 22.6 m/s generated waves higher than 3 m for nine hours (up to 4.26 m high) and created a 0.6 m surge. This storm and a mid-October storm accounted for a 5.1 m foredune loss at Station #3, while foredunes at Station #2 (0.8 m) and Station #1 (0.2 m) were little affected. Several smaller storms, which occurred between November 9 and December 13, caused an additional 2.95 m of foredune loss at Station #3, and minor foredune loss (0.6 m) at Station #2. Foredunes at Station #1 were not affected. Therefore, the foredune erosion pattern in 2019 resembled the foredune erosion pattern in 2018, with mid- to late-autumn storms accounting for most of the erosion. However, the amount of foredune erosion in 2019 was significantly higher than in 2018. The easternmost foredunes, near Station #3, recorded a 9.5 m loss, the central foredunes, near Station #2, lost 1.84 m, and the westernmost foredunes, near Station #1, lost only 0.6 m in width. An average of 8 m3 of sand per one meter of coast was removed from the foredunes and transferred to the dry or submerged part of the beach.
The shoreline receded 3 m in the central study area and 12.8 m in the eastern study area, but prograded 5.5 m in the western study area. The backshore width fluctuated very little in the eastern study area and was ~1 m wider in late December than in early January 2018. However, in the central and the western parts of the study area, the backshore gained in width during 2019. By late August, the backshore in the central study area was widened by 11.4 m compared to its early January width. The backshore in the western study area, near Station #1, increased in width by 11.7 m in mid-November with respect to its January width. The increase in the backshore width in the central and western areas occurred due to the welding of the inner bar to the central area in mid-summer and its subsequent migration downdrift 250–300 m by late autumn. The small amount (0.2 m) of dry beach aggradation that occurred from early January through early November was removed by the late autumn storms.
In 2020 the Great Lakes had one of the warmest winters on record. The fourth lowest record for maximum ice cover on the lake was set in January and February. Lake Michigan’s level was 94 cm above average at the end of February, and 38 cm higher than at the end of February 2019, setting record high levels for both January and February. Wet weather and very high lake levels (19 cm higher than in 2019) continued through the spring, when in March, April, and May monthly mean water level records were set on Lake Michigan. Even though the summer was warmer than normal, a higher than normal precipitation maintained lake levels 19 cm higher than in 2019. Lake Michigan set new monthly mean record high water levels in June, July, and August. On 8 September 2020, Lake Michigan reached its highest level (177.823 m) in recorded history, and the second highest ever, after 26 August 1986 (177.837 m). However, warmer and drier weather in autumn caused Lake Michigan’s level to drop 10 cm below its 2019 level.
The pattern and amount of foredune erosion in 2020 changed in comparison to the previous two years. The big January 11 storm caused major flooding along the entire southern Lake Michigan shoreline. Extensive property damage occurred along the developed coast from Chicago, IL, to South Haven, MI. Even though northerly winds seldom exceeded speeds of 16 m/s and gusts of 20.3 m/s, their persistence over the very long fetch (480 km) generated a large surge (0.78 m) and high waves, causing property damage, foredune erosion, and backshore accretion. There are no official wave height data from the Michigan City Buoy, as it was out of the water for the season. But NOAA’s reports [49] cite 4.9–7-m (16–23-ft) waves during this storm. The foredunes in the central study area at Station #2 and the foredunes in the eastern study area at Station #3 were shortened to 5.5 m and 4.75 m, respectively. The foredunes in the western study area at Station #1 were not affected by this storm. After the storm’s passage the backshore at all three stations remained as wide as before the storm but aggraded from 0.1 m in the eastern to 0.3 m in the western study areas.
The cumulative effect of five storms, one in mid-January, three in February, and one in early March, was a significant foredune erosion (6.35 m) at the downdrift western study area near Station #1, high foredune erosion (2.9 m) at the central study area near Station #2, and negligible foredune erosion (0.5 m) in the eastern study area at Station #3. In addition to storm surge and the wave erosion of the foredunes, secondary mass wasting of the foredune scarps was observed following the colder nights, when freezing and thawing removed partially consolidated chunks of sand from the foredune scarp faces. In all these storms, winds were predominantly from the northwest. The backshore at Station #1 was 6.1 m shorter than in early January, and it decreased about 1 m in height. In the central study area near Station #2, the backshore maintained its width and aggraded 0.2 m. In the eastern study area, at Station #3, the backshore widened 5.1 m and aggraded 0.3 m.
Even though no storms occurred from mid-March through early May, we recorded 3.4 m of foredune shortening at Station #1, 2.55 m of foredune shortening at Station #2, and 1.1 m of shortening at Station #3. This was most likely due to record high lake levels and low-amplitude (0.5 m or less) meteotsunamis. Through this same period, the backshore at Station #3 was slightly (0.3 m) shortened. The backshore widened by 1.6 m in the west near Station #1, and it significantly widened (9.4 m) at Station #2 in the central study area. From May to the end of the year, there was little foredune erosion, except at Station #2, which lost an additional 2.1 m. This foredune was completely removed by a late December storm.
The average volume of eroded foredune sand (21.5 m3/m) in 2020 was more than double that of 2019 and almost quadruple that of 2018. Along the 200 m of coast in the central study area, the foredunes were completely eroded, losing 13.8 m in width. The foredunes in the western study area suffered extensive (11.4 m) erosion and were reduced to a total width of 6.8 m. Significant (9.9 m) erosion in the eastern study area reduced the foredunes to 8.85 m in width. Significant shoreline recession occurred in 2020. From the eastern study area (7.1 m), shoreline recession increased to 15.2 m in the central study area and culminated in a 20.8-m recession in the western study area. The backshore was very narrow to nonexistent in the late summer but aggraded up to 1.3 m in the western study area. Less than a month later, the backshore was 16–19 m wide, but lost 0.5–1.7 m in height (Figure 6D).
6. Discussion
Three years of monitoring foredune and beach morphodynamics along the southern Lake Michigan coast revealed some patterns previously observed in both marine [23,28,29,30,32,33,34,35,40,41,42,43,44,45,46,47,48,49,50,51,52] and lacustrine [1,14,17,21,22,53,54,55] coastal systems during elevated water levels. Our choice of monitoring Stations #1 and #3 was intended to capture the complete removal of foredunes blocking the connection between the backshore and the blowouts, the subsequent rejuvenation of blowout growth, and the initiation of the next episode of coastal dunes growth in accordance with Loope and Arbogast’s [13] model. Severe beach erosion and blowout growth happened in the Central Beach area of Indiana’s Eastern Sector pocket beach, ~10 km east of the study area. However, foredune remnants 6.8 and 8.85 m wide in our study area survived erosion and blocked the throats of the blowouts. In the central study area, foredunes were completely removed along a 200-m length of coast, exposing and reactivating a 6–8 m high relict foredune ridge to wave and wind scarping. This relict foredune ridge, in the eastern Indiana Dunes State Park, is densely forested. Based on the density and size of white pines and black oaks, it likely represents Olson’s B4SP foredune, which developed ~140 years ago, following the 1876 high Lake Michigan level [1,56]. Severe beach erosion and complete removal of the foredunes in the eastern Indiana Dunes State Park also occurred during the high levels of Lake Michigan in 1943 and in 1952 [1].
Throughout the observation period, whether in relation to a single storm or the cumulative effects of multiple storms, foredune erosion along this relatively short length of the coast was uneven. The updrift area in the eastern study area near Station #3 was eroded the most, while the downdrift area, in the western study area near Station #1, experienced the least amount of erosion. During the first two years of study (2018–2019), while the foredunes were eroding at high rates in the updrift eastern study area, the welded bar (Figure 7) protected foredunes in the rest of the study area from severe erosion. A similar pattern of foredune protection from erosion has been observed in both lacustrine and marine coastal environments. In their studies along the north shores of Lake Erie, Stewart and Davidson-Arnott [53] and Saunders and Davidson-Arnott [57] noted the sand waves migration alongshore, and their role in foredune protection from erosion. The alongshore pattern in foredune morphology, shoreline erosion, and storm impact at Santa Rosa Island in northwest Florida is controlled by the transverse ridges on the inner-shelf and the island width, which is related to the backbarrier cuspate headlands along Santa Rosa Sound [50].
In a typical year, such as 2018 and 2019, shelf ice begins to form on Lake Michigan in early January [58] and protects the foredunes and backshore from erosion until early March, when it begins to melt. In 2018 and 2019, the foredunes experienced their maximum erosion due to late autumn storms, which in our case accounted for 60% and 75% of the annual erosion, respectively. In their study of Dune Acres Beach, which is about 3 km west of our study area, Troy et al. [54] calculated that late November storms contributed to 76% of the total annual sand loss. Similar foredune erosion patterns by autumn storms have been reported from the nearby southeastern Lake Michigan coast [14,16,17,18]. However, the extent of ice cover and the duration of the shelf ice is diminishing on all of the Great Lakes [59], which may provide less protection to the foredunes and lead to more intense erosion in the future.
A progressive increase in the amount and volume of foredune erosion through the three study years followed the continuing rise in Lake Michigan’s water levels (Figure 8). The least amount of erosion occurred in 2018 because the difference in the lake level between 2017 and 2018 was very small and the coastal sand budget between the foredune, backshore, and surf zone was in equilibrium. In a two-year study (2017–2018) of the Zion Beach-Ridge Plain along the western Lake Michigan coast, north of Chicago, minimal beach erosion was observed in 2018, since the base level had already reached that point in the previous summer [55]. The relative volume of eroded sand (5.5 m3/m) in 2018 was similar to the volume of eroded sand that Hands [60] reported for southern Lake Michigan during the 1967–1974 period of high lake levels.
An increase in landward retreat of foredunes (up to 9.5 m in the eastern study area), and an increase in the average volume of eroded sand (8m3/m) in 2019 was mostly due to continuously higher monthly lake levels (6–40 cm) than in the previous year. Troy et al. Troy et al. [54] report similar rates of foredune retreat (7 m) and volume of eroded sand (8.5 m3/m) at Dune Acres Beach, which is about 3 km west of our study area. At the same time, in P.J. Hoffmaster State Park, on the east coast of Lake Michigan, van Dijk [18] reports significantly higher rates of foredune retreat (19 m) and a corresponding loss of sand volume (38 m3/m).
The combination of unusually warm winter weather, steady and significant rising lake levels in comparison to previous years, and meteotsunamis occurrences contributed to the most severe foredune erosion and beach morphology changes occurring in 2020. The mean monthly Lake Michigan levels in spring and summer 2020 were 19 cm higher than in 2019, similar to the 7–17 cm above normal water level anomalies measured across the west coast of the United States during the El Niño winter of 2015–2016 [61]. These anomalies, in combination with higher wave energy, posed increased threats to coastal landforms and property along the coastlines. The anticipated global mean sea-level increases expected within the next few decades are within this range. Hence, these examples may provide an indication of coastal water-level conditions and the associated dune erosion and beach hazards that will become more common in future years. In their study of dunes along the Washington coast, Cohn et al. [52] conclude that the highest potential for dune erosion occurs in cases with anomalously high still water levels and not necessarily the largest wave energy, suggesting that dune erosion will be further compounded by an increase in the mean sea water level.
The rates of foredune retreat (7.8–13.2 m) and volume of eroded sand (21.5 m3/m) in 2020 were much higher in our study area than the rates of foredune retreat (5 m) and volume of eroded sand (1 m3/m) in P.J. Hoffmaster State Park on the east coast of Lake Michigan [18].
Despite the steady rise in Lake Michigan’s level, from 176.73–177.14 m for January 2018–December 2020, respectively, and the shoreline recession of 13.9–22.6 m, the dry beach width varied throughout the seasons, and did not get progressively narrower. At the end of the three-year study, there was a slight (0.3 m) increase in beach width in the eastern and the central study areas, but an 8.2 m loss in the westernmost study area. Similarly, the backshore in the eastern and central study areas aggraded 0.3 m in the same period, and the extreme westernmost backshore eroded 1 m. The erosional nature of the westernmost backshore is a temporary consequence of the migrating gap in the surf zone inner bar, which was affecting the easternmost backshore in early September 2020. Variations in backshore erosion and accretion are associated with variations in the nearshore bar morphology [21,50,53,54].
Vousdoukas et al. [62] state that shoreline retreat depends on the amplitude of sea level rise and the transfer of sediment from the subaerial to the submerged part of the active beach profile. They conclude that trends in shoreline dynamics, combined with coastal recession driven by sea level rise, could result in the near extinction of almost half of the world’s sandy beaches by the end of the century. However, Cooper et al. [63] argue that although offshore sediment transport might happen in cases of very steep topography, in most cases, sediment transport is onshore during sea level rise [29]. Despite the landward retreat of the shoreline during marine or lacustrine transgression, the recycling of sediments scarped from the foredunes back into the beach will maintain the subaerial portion of the system (Ciarletta et al., 2021). In some instances, this can cause dunes to accrete in contrast to conventional frameworks relating water levels above the dune toe solely to foredune erosion [51]. Where well-developed dune systems are present, the sediment supply from the eroding dunes may significantly temper the sea-level-rise-induced coastal retreat. The biggest threat to the continued existence of beaches, however, is the existence of coastal defense structures that limit their ability to migrate [63].
7. Conclusions
Three years (2018–2020) of monitoring coastal morphodynamics along the 800-m stretch of Indiana Dunes State Park on Lake Michigan’s southern shores occurred during a steady and continuous water level rise that culminated in record-setting lake levels during the first eight months of 2020. Severe foredune erosion, in terms of total horizontal dune loss and total volume of eroded sand, occurred over this three-year period, albeit unevenly—both temporally, during a single storm, a season, or a year, and spatially, in the eastern, central, and western study areas. During the first year of monitoring, 2018, shelf ice protected the foredunes from erosion in winter. The maximum foredune erosion occurred in the late autumn season due to several strong storms and their accompanying high winds, waves, and surges. The largest shortening of foredunes (4.25 m) and the maximum volume of eroded foredune sand (8.5 m3/m) was in the updrift eastern study area, while the rest of the study area was little affected. The 2019 seasonal foredune erosion pattern was very similar to 2018, with most erosion occurring during the late autumn. The eastern study area again experienced more foredune shortening (9.5 m) and a larger volume of eroded sand (19 m3/m) than the central (1.84 m; 3.7 m3/m) and western (0.6 m; 1.2 m3/m) foredune areas. However, the horizontal loss of foredunes in the eastern study area more than doubled, as lake levels were much higher (30–40 cm) than in the respective months of the previous year. Welding of an inner bar protected the foredunes in the central and western study areas from extensive erosion in 2019.
Lake Michigan’s water level rise culminated in 2020, after the first eight months of the year recorded the highest monthly mean values since instrumental records of lake levels began in 1860. In addition to record-setting lake levels, unusually warm winter weather prevented the formation of shelf ice. Several winter and early spring storms severely eroded the foredunes, mostly in the central and western study area, a spatially different pattern of foredune erosion than in the first two years of study. Several convective storms in spring and early summer 2020 triggered smaller meteotsunamies, which in combination with higher lake levels contributed to significant foredune erosion in both the central study area (13.2 m), where the foredunes were completely removed, and in the western study area (11.2 m), where only a short foredune remnant remained. The average volume of eroded sand (21.5 m3/m) was more than double that of 2019 (8 m3/m), and almost quadruple the 2018 volume (5.5 m3/m). After Lake Michigan’s levels fell below their respective autumn and early winter 2019 levels, foredune erosion diminished to a minimum.
Whether the total removal of established foredunes in the central study area allows storms with high winds and waves to carve out new blowouts or to remove short remnants of established foredunes, blocking the connection between the backshore and active blowouts on this stretch of the southern Lake Michigan coast, depends on Lake Michigan’s levels in the next several years. It may take several years to decades for a new set of foredunes to develop in this area if lake levels begin to fall. On the other hand, despite the severe erosion of the foredunes, the beach rapidly recovered after events that eroded the foredunes and maintained their width as the shoreline migrated landward. On many occasions, following storms that severely eroded the foredunes, the dry portion of the beach, the backshore, accreted and accumulated significant sand volumes removed from the foredunes. The remaining sand from the eroded foredunes was transferred in the submerged portion of the beach, the surf zone, where it changed the morphology of the sand bars, leading to their coalescence and flattening. It is important to note that, even though the southern coast of Lake Michigan has been altered by the development of coastal structures and beach nourishment, the role of anthropogenic factors was minor when compared to natural forces that dictated foredune dynamics discussed in this study. Our future studies of beach and foredune morphology changes in this area will rely on using LiDAR-equipped unmanned aerial vehicle (UAV) surveys in the spring and late autumn seasons.
Author Contributions
Conceptualization, Z.K. and V.K.; methodology, Z.K.; software, V.K.; validation, Z.K. and V.K.; formal analysis, V.K; investigation, Z.K and V.K.; resources, V.K.; data curation, V.K.; writing—original draft preparation, Z.K. and V.K.; writing—review and editing, Z.K. and V.K.; visualization, Z.K..; supervision, Z.K.; project administration, V.K.; funding acquisition, V.K. All authors have read and agreed to the published version of the manuscript.
Funding
This research received no external funding.
Institutional Review Board Statement
Not applicable.
Informed Consent Statement
Not applicable.
Data Availability Statement
All data are kept by authors of this article.
Acknowledgments
We acknowledge the Office of the Vice President for International Affairs, Indiana University, for providing support for the Workshop “Coastal Dunes and their dynamics during rising sea levels”, held at Indiana University Northwest on 27 April 2018. We thank Suzanne DeVries Zimmermann, whose suggestions and corrections improved this manuscript. Indiana’s Department of Natural Resources gave us permission to conduct the research within the Indiana Dunes State Park.
Conflicts of Interest
The authors declare no conflict of interest.
References
- Olson, J.S. Lake Michigan dune development. 3. Lake-level, beach and dune oscillations. J. Geol. 1958, 66, 473–483. [Google Scholar] [CrossRef]
- Larsen, C. A Stratigraphic Study of Beach Features on the Southwestern Shore of Lake Michigan: New Evidence of Holocene Lake Level Fluctuations; Environmental Geology Notes, No. 112; Illinois State Geological Survey: Champaign, IL, USA, 1985; 31p. [Google Scholar]
- Thompson, T.A.; Baedke, S.J. Strandplain evidence for late Holocene lake-level variations in Lake Michigan. Geol. Soc. Am. Bull. 1997, 109, 666–682. [Google Scholar] [CrossRef]
- Gronewold, A.D.; Bruxer, J.; Durnford, D.; Smith, J.P.; Clites, A.H.; Seglenieks, F.; Qian, S.S.; Hunter, T.S.; Fortin, V. Hydrological drivers of record-setting water level rise on Earth’s largest lake system. Water Resour. Res. 2016, 52, 4026–4042. [Google Scholar] [CrossRef] [Green Version]
- Lacke, M.C.; Knox, J.A.; Frye, J.D.; Stewart, A.E.; Durkee, J.D.; Fuhrmann, C.M.; Dillingham, S.M. A Climatology of Cold-Season Nonconvective Wind Events in the Great Lakes Region. J. Clim. 2007, 20, 6012–6022. [Google Scholar] [CrossRef] [Green Version]
- Melby, J.A.; Nadal-Caraballo, N.C.; Pagán-Albelo, Y.; Ebersole, B. Wave Height and Water Level Variability on Lakes Michigan and St Clair; FEMA Great Lakes Coastal Flood Study, ERDC/CHL TR-12-23; Engineer Research and Development Center Vicksburg Ms Coastal and Hydraulics Lab: Vicksburg, MS, USA, 2012; 183p. [Google Scholar]
- Mao, M.; van der Westhuysen, A.J.; Xia, M.; Schwab, D.J.; Chawla, A. Modeling wind waves from deep to shallow waters in Lake Michigan using unstructured SWAN. J. Geophys. Res. Oceans 2016, 121, 3836–3865. [Google Scholar] [CrossRef]
- Bechle, A.J.; Wu, C.H.; Kristovich, D.; Anderson, E.J.; Schwab, D.A.; Rabinovich, A.B. Meteotsunamis in the Laurentian Great Lakes. Sci. Rep. 2016, 6, 37832. [Google Scholar] [CrossRef] [Green Version]
- Angove, M.; Kozlosky, L.; Chu, P.; Dusek, G.; Mann, G.; Anderson, E.; Gridley, J.; Arcas, D.; Titov, V.; Eble, M.; et al. Addressing the meteotsunami risk in the United States. Nat. Hazards 2021, 106, 1467–1487. [Google Scholar] [CrossRef]
- Hesp, P.A. Foredunes and blowouts: Initiation, geomorphology and dynamics. Geomorphology 2002, 48, 245–268. [Google Scholar] [CrossRef]
- Cowles, H.C. The ecological relationships of the vegetation on the sand dunes of Lake Michigan: Part I—Geographical relations of the dune floras. Chic. Ill. Bot. Gaz. 1899, 27, 95–117. [Google Scholar] [CrossRef] [Green Version]
- Cressey, G. The Indiana Sand Dunes and Shorelines of Lake Michigan; University of Chicago Press: Chicago, IL, USA, 1928; 80p. [Google Scholar]
- Loope, W.L.; Arbogast, A.F. Dominance of an ~150-year cycle of sand-supply change in late Holocene dune-building along the eastern shore of Lake Michigan. Quat. Res. 2000, 54, 414–422. [Google Scholar] [CrossRef]
- van Dijk, D. Contemporary geomorphic processes and change on Lake Michigan coastal dunes: An example from Hoffmaster State Park, Michigan. Mich. Acad. 2004, 35, 425–453. [Google Scholar]
- Kilibarda, Z.; Venturelli, R.; Goble, R. Late Holocene dune development and shift in dune-building winds along southern Lake Michigan. In Coastline and Dune Evolution along the Great Lakes; Special Paper 508; Fisher, T.G., Hansen, E.C., Eds.; Geological Society of America: Boulder, CO, USA, 2014; pp. 47–64. [Google Scholar]
- van Dijk, D. Short- and long-term perspectives on the evolution of a Lake Michigan foredune. In Coastline and Dune Evolution along the Great Lakes; Special Paper 508; Fisher, T.G., Hansen, E.C., Eds.; Geological Society of America: Boulder, CO, USA, 2014; pp. 195–216. [Google Scholar]
- Yurk, B.P.; Hansen, E.C.; DeVries-Zimmerman, S.; Kilibarda, Z.; van Dijk, D.; Bodenbender, B.; Krehel, A.; Pennings, T. The role of extratropical cyclones in shaping dunes along southern and southeastern Lake Michigan. In Coastline and Dune Evolution along the Great Lakes; Special Paper 508; Fisher, T.G., Hansen, E.C., Eds.; Geological Society of America: Boulder, CO, USA, 2014; pp. 167–194. [Google Scholar]
- van Dijk, D. Foredune dynamics at a Lake Michigan site during rising and high lake levels. J. Great Lakes Res. 2021, 47, 1581–1593. [Google Scholar] [CrossRef]
- Olson, J.S. Lake Michigan dune development. 2. Plants as agents and tools in geomorphology. J. Geol. 1958, 66, 345–351. [Google Scholar] [CrossRef]
- Hesp, P.A. Surfzone, beach and foredune interactions on the Australian southeast coast. J. Coast. Res. 1988, 3, 15–25. [Google Scholar]
- Davidson-Arnott, R.G.D.; Law, M.N. Seasonal patterns and controls on sediment supply to coastal foredunes, Long Point, Lake Erie. In Coastal Dunes: Form and Process; Nordstrom, K.F., Psuty, N.P., Carter, R.W.G., Eds.; Wiley & Sons: Chichester, UK, 1990; pp. 177–200. [Google Scholar]
- Davidson-Arnott, R.G.D.; Law, M.L. Measurement and prediction of long-term sediment supply to coastal foredunes. J. Coast. Res. 1996, 12, 654–663. [Google Scholar]
- Anthony, E.J.; Vanhee, S.; Ruz, M.-H. Short-term beach-dune sand budgets on the North Sea coast of France: Sand supply from shoreface to dunes, and the role of wind and fetch. Geomorphology 2006, 81, 316–329. [Google Scholar] [CrossRef]
- Lynch, K.; Jackson, D.W.T.; Cooper, J.A.G. Aeolian fetch distance and secondary airflow effects: The influence of micro-scale variables on meso-scale foredune development. Earth Surf. Process. Landf. 2008, 33, 991–1005. [Google Scholar] [CrossRef]
- Delgado-Fernandez, I.; Davidson-Arnott, R. Meso-scale aeolian sediment input to coastal dunes: The nature of aeolian transport events. Geomorphology 2011, 126, 217–232. [Google Scholar] [CrossRef] [Green Version]
- Davidson-Arnott, R.G.D.; Bauer, B.O.; Walker, I.J.; Hesp, P.A.; Ollerhead, J.; Chapman, C. High-frequency sediment transport responses on a vegetated foredune. Earth Surf. Process. Landf. 2012, 37, 1227–1241. [Google Scholar] [CrossRef]
- Davidson-Arnott, R.D.G.; Hesp, P.A.; Ollerhead, J.; Walker, I.; Bauer, B.; Delgado-Fernandez, I.; Smyth, T. Sediment budget controls on foredune height: Comparing simulation model results with field data. Earth Surf. Process. Landf. 2018, 43, 1798–1810. [Google Scholar] [CrossRef]
- Ollerhead, J.; Davidson-Arnott, R.; Walker, I.J.; Mathew, S. Annual to decadal morphodynamics of the foredune system at Greenwich Dunes, Prince Edward Island, Canada. Earth Surf. Process. Landf. 2013, 38, 284–298. [Google Scholar] [CrossRef]
- Aagaard, T.; Davidson-Arnott, R.; Greenwood, B.; Nielsen, J. Sediment supply from shoreface to dunes: Linking sediment transport measurements and long-term morphological evolution. Geomorphology 2004, 60, 205–224. [Google Scholar] [CrossRef]
- Pye, K.; Blott, S.J. Decadal-scale variation in dune erosion and accretion rates: An investigation of the significance of changing storm tide frequency and magnitude on the Sefton coast, UK. Geomorphology 2008, 102, 652–666. [Google Scholar] [CrossRef]
- Mathew, S.; Davidson-Arnott, R.G.D.; Ollerhead, J. Evolution of a beach-dune system following a catastrophic storm overwash event: Greenwich Dunes, Prince Edward Island, 1936–2005. Can. J. Earth Sci. 2010, 47, 273–290. [Google Scholar] [CrossRef]
- Heathfield, D.K.; Walker, I.J.; Atkinson, D.E. Erosive water level regime and climatic variability forcing of beach-dune systems on south-western Vancouver Island, British Columbia, Canada. Earth Surf. Process. Landf. 2013, 38, 751–762. [Google Scholar] [CrossRef]
- Houser, C. Alongshore variation in the morphology of coastal dunes: Implications for storm response. Geomorphology 2013, 199, 48–61. [Google Scholar] [CrossRef]
- Hesp, P.A.; Smyth, T.A.G. Surfzone-beach-dune interactions: Review and the role of the intertidal beach. J. Coast. Res. 2016, 75, 8–12. [Google Scholar] [CrossRef] [Green Version]
- Castelle, B.; Bujana, S.; Ferreiraa, S.; Dodet, G. Foredune morphological changes and beach recovery from the extreme 2013/2014 winter at a high-energy sandy coast. Mar. Geol. 2017, 385, 41–55. [Google Scholar] [CrossRef]
- Walker, I.J.; Davidson-Arnott, R.G.D.; Bauer, B.O.; Hesp, P.A.; Delgado-Fernandez, I.; Ollerhead, J.; Smyth, T.A.J. Scale dependent perspectives on the geomorphology and evolution of beach-dune systems. Earth Sci. Rev. 2017, 171, 220–253. [Google Scholar] [CrossRef]
- Davidson, S.G.; Hesp, P.A.; Miot da Silva, G. Controls on dune scarping. Prog. Phys. Geogr. 2020, 44, 923–947. [Google Scholar] [CrossRef]
- Nordstrom, K.F. Beaches and dunes of human-altered coasts. Prog. Phys. Geogr. 1994, 18, 497–516. [Google Scholar] [CrossRef]
- Robin, N.; Billy, J.; Castelle, B.; Hesp, P.; Lerma, A.N.; Laporte-Fauret, Q.; Marieu, V.; Rosebery, D.; Bujan, S.; Destribats, B.; et al. 150 years of foredune initiation and evolution driven by human and natural processes. Geomorphology 2021, 374, 107516. [Google Scholar] [CrossRef]
- Kilibarda, Z.; Graves, N.; Dorton, M.; Dorton, R. Changes in beach gravel lithology caused by anthropogenic activities along the southern coast of Lake Michigan, USA. Environ. Earth Sci. 2014, 71, 1249–1266. [Google Scholar] [CrossRef]
- Davidson-Arnott, R.G.D. Introduction to Coastal Process and Geomorphology; Cambridge University Press: New York, NY, USA, 2010; 442p. [Google Scholar]
- Davis, R.A.J.R.; Fox, W.T. Coastal processes and nearshore bars. J. Sed. Petrol. 1972, 42, 401–412. [Google Scholar]
- Wood, W.L.; Hoover, J.A.; Stockberger, M.T.; Zhang, Y. Coastal Situation Report for the State of Indiana; GLCRL; Purdue University: West Lafayette, IN, USA, 1988. [Google Scholar]
- Chrzastowski, M.J.; Thompson, T.A.; Trask, C.B. Coastal geomorphology and littoral cell divisions along the Illinois–Indiana Coast of Lake Michigan. J. Great Lakes Res. 1994, 20, 27–43. [Google Scholar] [CrossRef]
- Turki, I.; Medina, R.; Gonzalez, M.; Coco, G. Natural variability of shoreline position: Observations at three pocket beaches. Mar. Geol. 2013, 338, 76–89. [Google Scholar] [CrossRef]
- Short, A. The role of wave height, period, slope, tide range and embaymentisation in beach classifications: A review. Rev. Chil. Hist. Nat. 1996, 69, 589–604. [Google Scholar]
- Shabica, C.; Pranschke, F. Survey of littoral drift sand deposits along the Illinois and Indiana Shores of Lake Michigan. J. Great Lakes Res. 1994, 20, 61–72. [Google Scholar] [CrossRef]
- Great Lakes Region’s Quarterly Climate Impacts and Outlook. Available online: https://www.drought.gov/drought/resources/reports (accessed on 12 April 2021).
- National Oceanic and Atmospheric Administration (NOAA). National Weather Service. Available online: https://www.weather.gov/lot/1011Jan2020 (accessed on 16 February 2021).
- Houser, C.; Hapke, C.; Hamilton, S. Controls on coastal dune morphology, shoreline erosion and barrier island response to extreme storms. Geomorphology 2008, 100, 223–240. [Google Scholar] [CrossRef]
- Cohn, N.; Ruggiero, P.; de Vries, S.; Kaminsky, G.M. New insights on coastal foredune growth: The relative contributions of marine and aeolian processes. Geophys. Res. Lett. 2018, 45, 4965–4973. [Google Scholar] [CrossRef]
- Cohn, N.; Ruggiero, P.; García-Medina, G.; Anderson, D.; Serafin, K.A.; Biel, R. Environmental and morphologic controls on wave-induced dune response. Geomorphology 2019, 329, 108–128. [Google Scholar] [CrossRef] [Green Version]
- Stewart, C.J.; Davidson-Arnott, R.G.D. Morphology, formation and migration of longshore sandwaves; Long Point, Lake Erie, Canada. Mar. Geol. 1998, 81, 63–77. [Google Scholar] [CrossRef]
- Troy, C.D.; Cheng, Y.T.; Lin, Y.C.; Habib, A. Rapid lake Michigan shoreline changes revealed by UAV LiDAR surveys. Coast. Eng. 2021, 170, 104008. [Google Scholar] [CrossRef]
- Theuerkauf, E.J.; Braun, K.N.; Nelson, D.M.; Kaplan, M.; Salvatore Vivirito, S.; Williams, J.D. Coastal geomorphic response to seasonal water-level rise in the Laurentian Great Lakes: An example from Illinois Beach State Park, USA. J. Great Lakes Res. 2019, 45, 1055–1068. [Google Scholar] [CrossRef]
- Olson, J.S. Rates of succession and soil changes on southern Lake Michigan sand dunes. Bot. Gaz. 1958, 119, 125–170. [Google Scholar] [CrossRef]
- Saunders, K.E.; Davidson-Arnott, R.G. Coastal dune response to natural disturbances. In Proceedings of the Canadian Symposium on Coastal Sand Dunes, Guelph, ON, Canada, September 12–14 1990; pp. 321–345. [Google Scholar]
- Assel, R.A.; Norton, D.C.; Cronk, K.C. A Great Lakes Ice Cover Digital Data Set for Winters 1973–2000; NOAA Technical Memorandum GLERL-121; National Oceanic and Atmospheric Administration: Washington, DC, USA, 2002. [Google Scholar]
- National Oceanic and Atmospheric Administration (NOAA) Climate. Available online: https://www.climate.gov/news-features/featured-images/great-lakes-ice-cover-decreasing-over-last-40-years (accessed on 12 April 2021).
- Hands, E. Prediction of Shore Retreat and Nearshore Profile Adjustments to Rising Water Levels on the Great Lakes; Coastal Engineering Research Center: Vicksburg, MS, USA, 1980. [Google Scholar]
- Barnard, P.L.; Hoover, D.; Hubbard, D.M.; Snyder, A.; Ludka, B.C.; Allan, J.; Kaminsky, G.M.; Ruggiero, P.; Gallien, T.W.; Gabel, L.; et al. Extreme oceanographic forcing and coastal response due to the 2015-2016 El Niño. Nat. Commun. 2017, 8, 14365. [Google Scholar] [CrossRef] [Green Version]
- Vousdoukas, M.I.; Ranasinghe, R.; Mentaschi, L.; Plomaritis, T.A.; Athanasiou, P.; Luijendijk, A.; Feyen, L. Sandy coastlines under threat of erosion. Nat. Clim. Chang. 2020, 10, 260–263. [Google Scholar] [CrossRef]
- Cooper, J.A.G.; Masselink, G.; Coco, G.; Short, A.D.; Castelle, B.; Rogers, K.; Anthony, E.; Green, A.N.; Kelley, J.T.; Pilkey, O.H.; et al. Sandy beaches can survive sea-level rise. Nat. Clim. Chang. 2020, 10, 993–995. [Google Scholar] [CrossRef]
Figure 1.
Location of study area.

Figure 2.
Lake Michigan’s monthly levels 2013–2021.

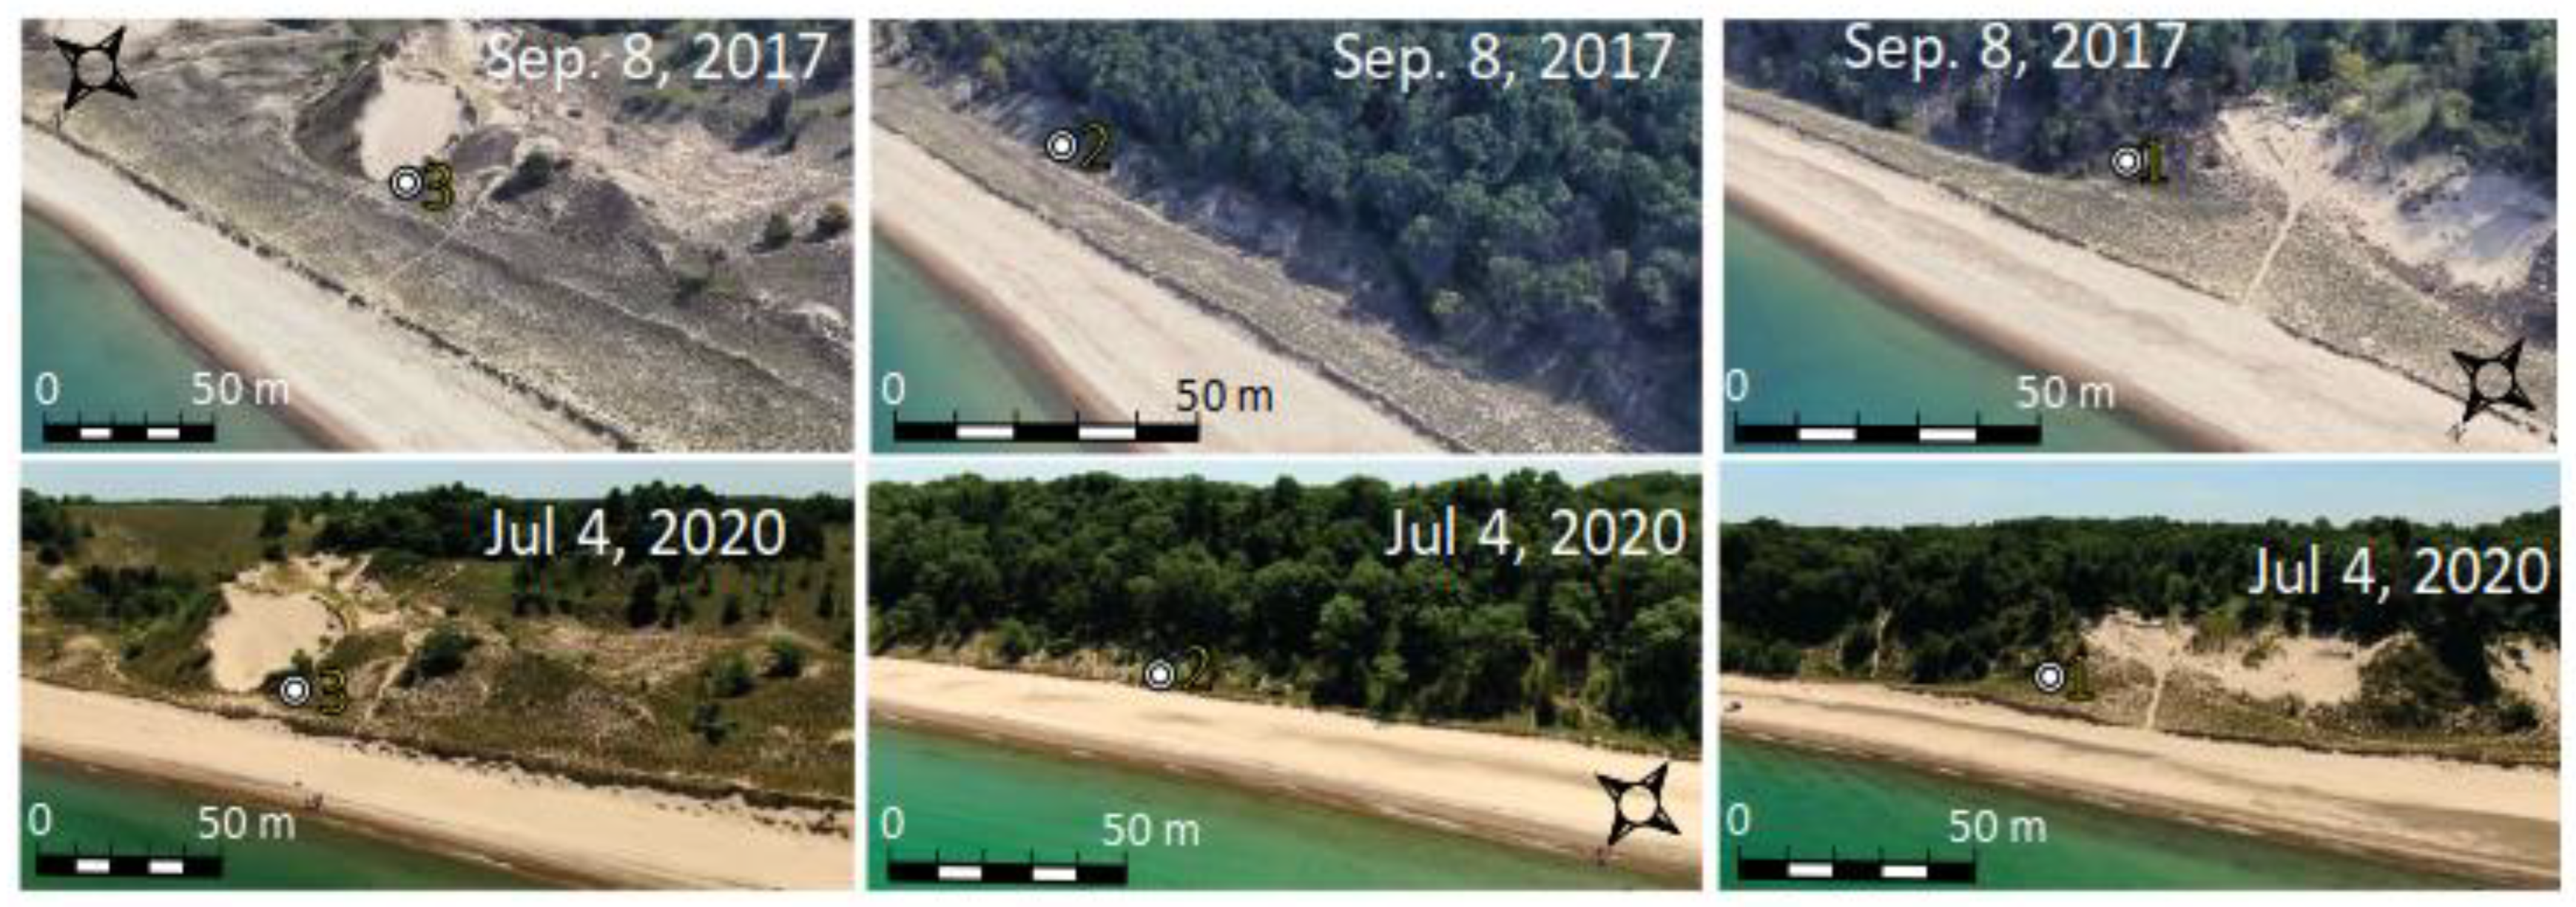
Figure 3.
Google Earth 3D views of three stations 4 months before the study began (top row). Same stations viewed by drone camera 5 months before the study’s end (bottom row).
Figure 3.
Google Earth 3D views of three stations 4 months before the study began (top row). Same stations viewed by drone camera 5 months before the study’s end (bottom row).

Figure 4.
Foredune erosion rates from January 2018 to January 2021. Foredune profiles from the beginning to the end of the study. Note that foredune at Station #2 is completely eroded.
Figure 4.
Foredune erosion rates from January 2018 to January 2021. Foredune profiles from the beginning to the end of the study. Note that foredune at Station #2 is completely eroded.

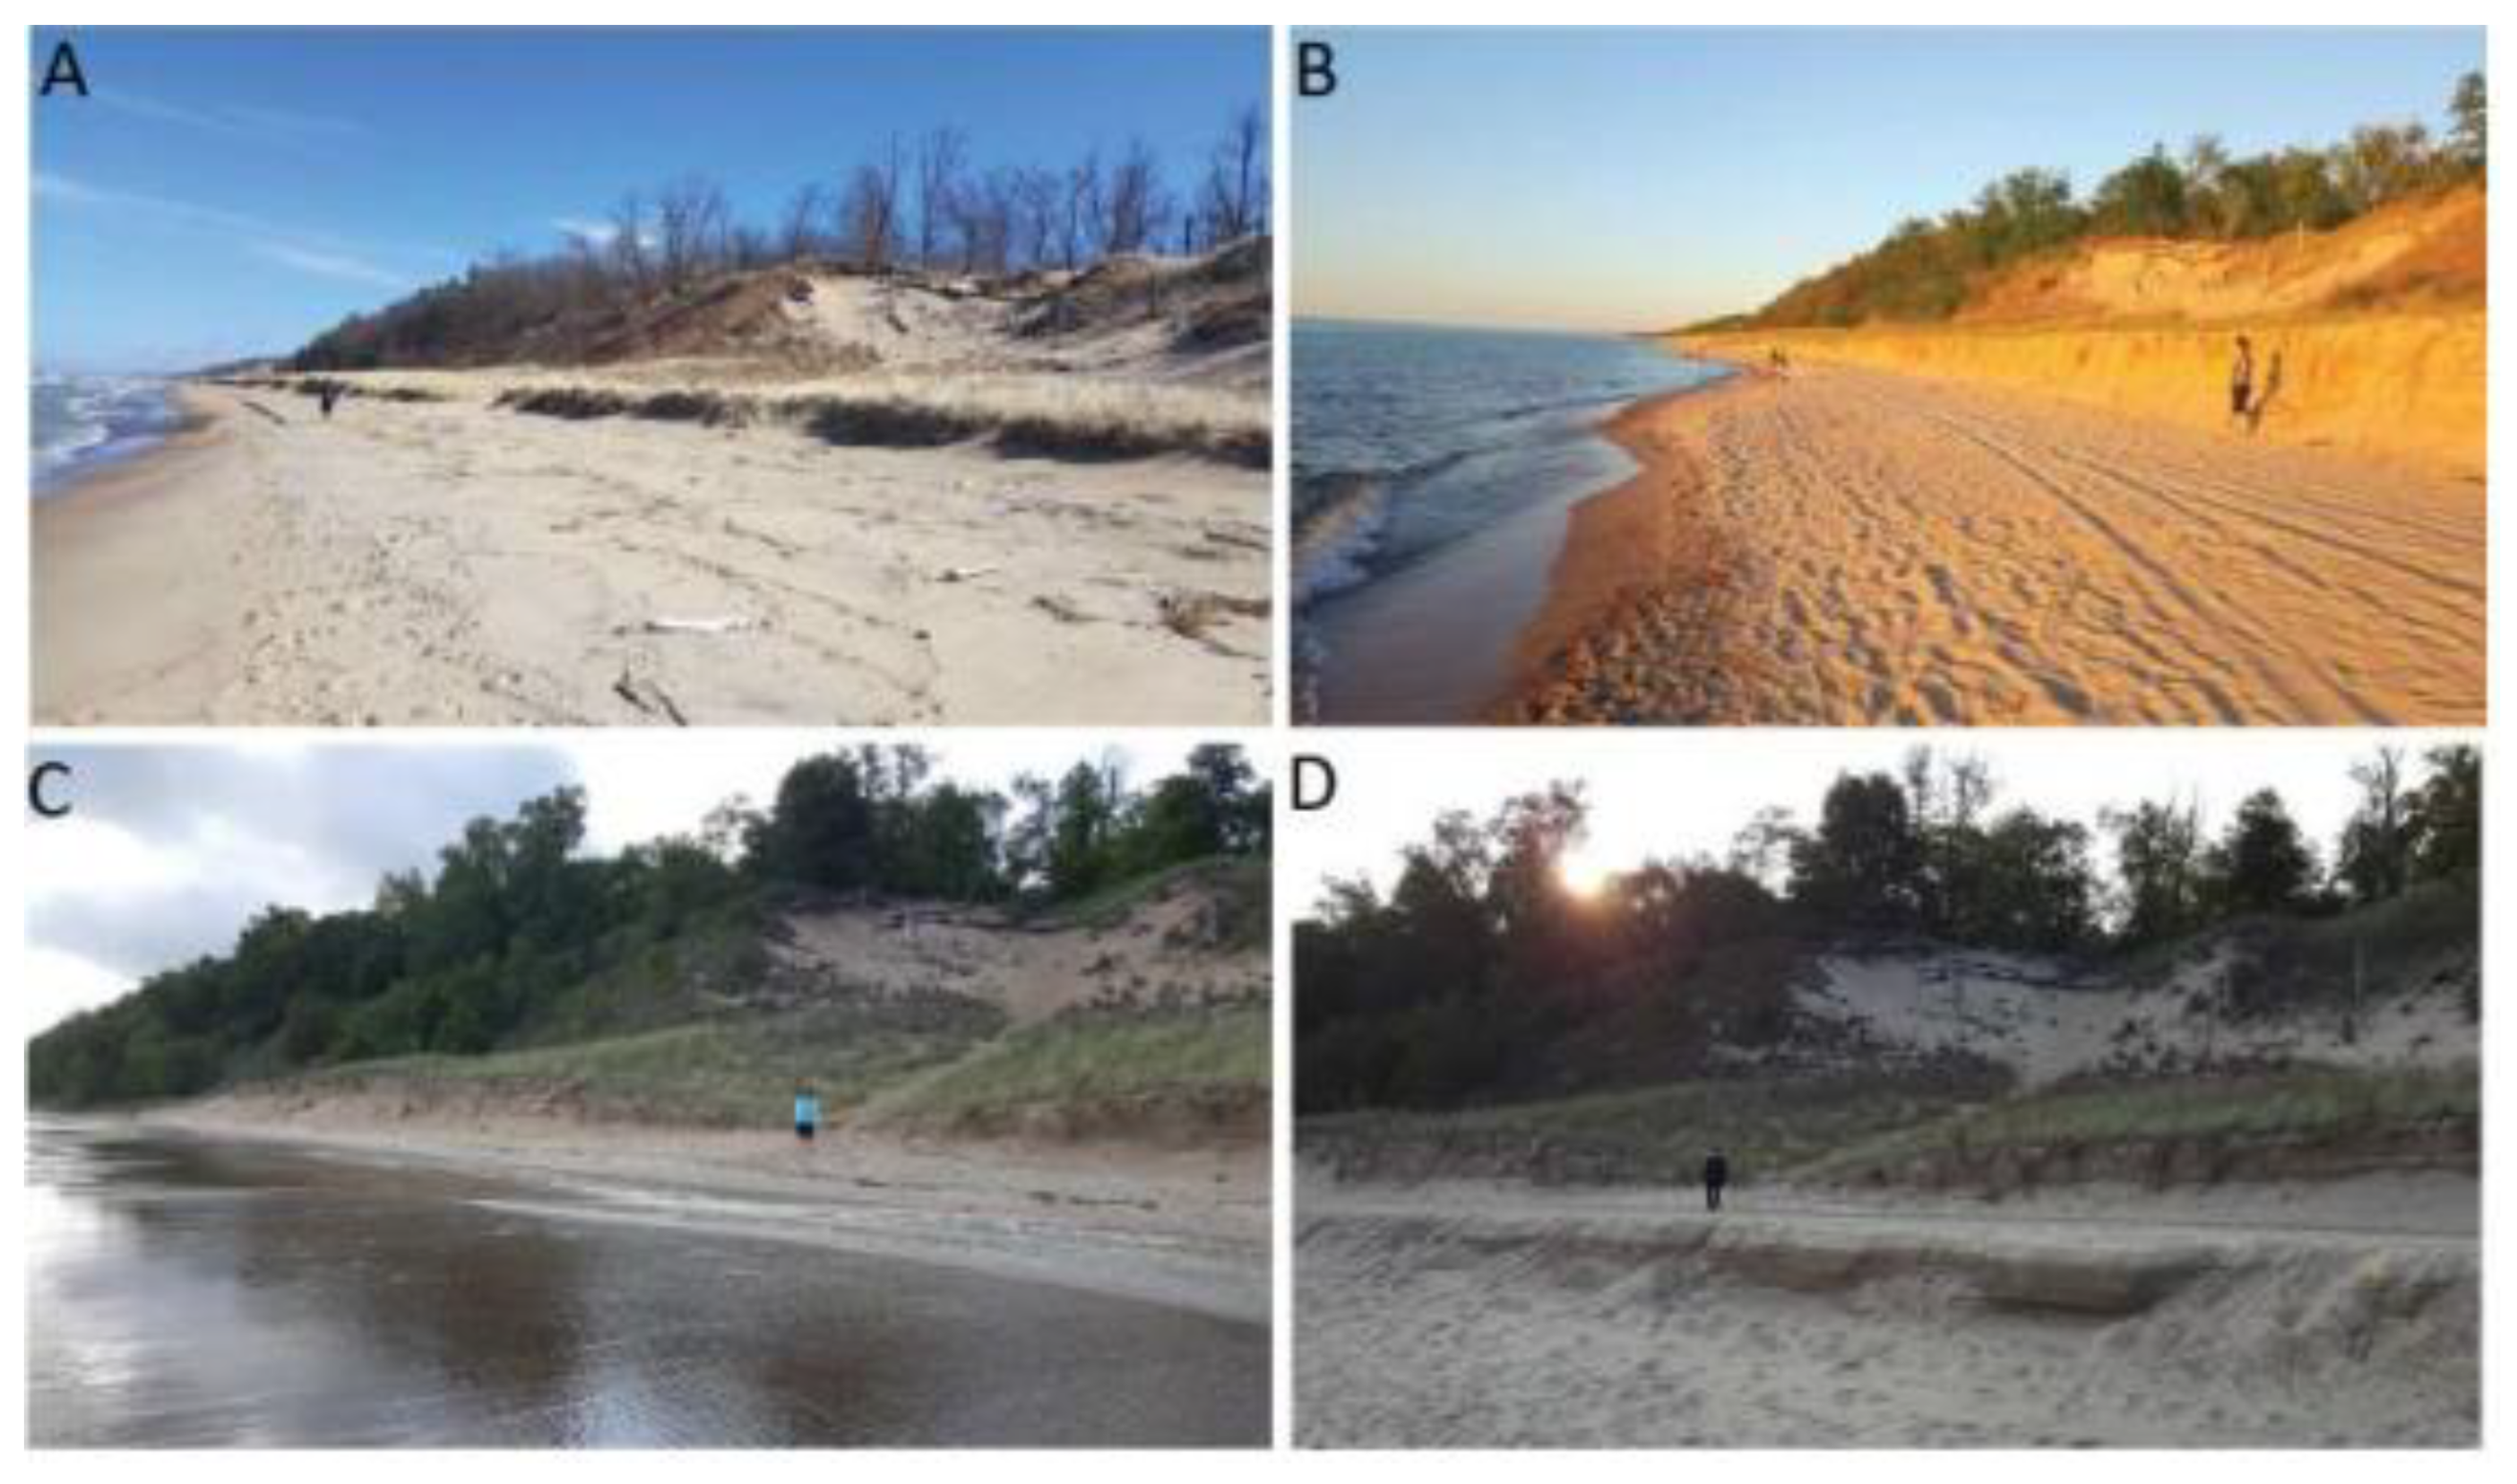
Figure 5.
Station #3 (top row) and Station #2 (bottom row) through time. (A) 30 April 2018. Note windblown sand on top of receding foredune scarp in foreground. (B) By 31 August 2019, a total of 7.1 m of foredune has been eroded. (C) By 12 February 2020, a total of 20 m of foredune has been eroded. (D) Station #2 on 13 December 2019. Since January 1, 2018, 4.15 m of foredune has been eroded. (E) By 2 June 2020, a total of 15 m of foredune has been eroded. (F) By 22 December 2020, this foredune has been totally eroded, losing 17.35 m since the start of the study.

Figure 6.
Beach fronting Ghost Forest Blowout near Station #1. (A) On 2 March 2018, the beach was wide and accretional. The foredune scarp near the path through the blowout was 0.6 m high. (B) On 26 May 2018, the beach was narrow, having lost 1.2 m in height near this path. (C) On 3 August 2020, the beach was almost nonexistent, but aggraded ~1.3 m. (D) On 21 September 2020, the beach was very wide, but lost 1.7 m in height in a single storm.

Figure 7.
Surf zone sand bars in the study area. (A) Google Earth aerial photo from March 2005, when Lake Michigan’s level was low (176.15 m a.s.l.), 17 cm below the March mean lake level. The back-shore (a) was very wide (60-80 m), full of sand, allowing the wind to build incipient and established foredunes. Three distinct sand bars were in the surf zone. The inner bar (b) was ~30–40 m wide and separated by a 5–10-m-wide runnel from the beach. In some places, however, it was welded to the shore. The second bar (c) was ~80-100 m from the shore, continuous, but somewhat sinuous in shape, and ~10 m wide. The third bar (d) was ~280–300 m from the shore, but discontinuous and 20–30-m-wide. (B) Google Earth aerial photo taken in March 2019, when Lake Michigan’s level was high (176.92 m a.s.l.), 60 cm above the March mean level, or 77 cm higher than in March 2005. The backshore (e) was very narrow (6–10 m), with little sand, completely eroded incipient foredunes, and severely eroded established foredunes, in some places with only ~15–20 m width fronting the relict transverse ridge. The surf zone bars merged into a single, very broad (500–700 m) inner bar (f) that, in some places, became welded to the shore in the calmer waters following storms.

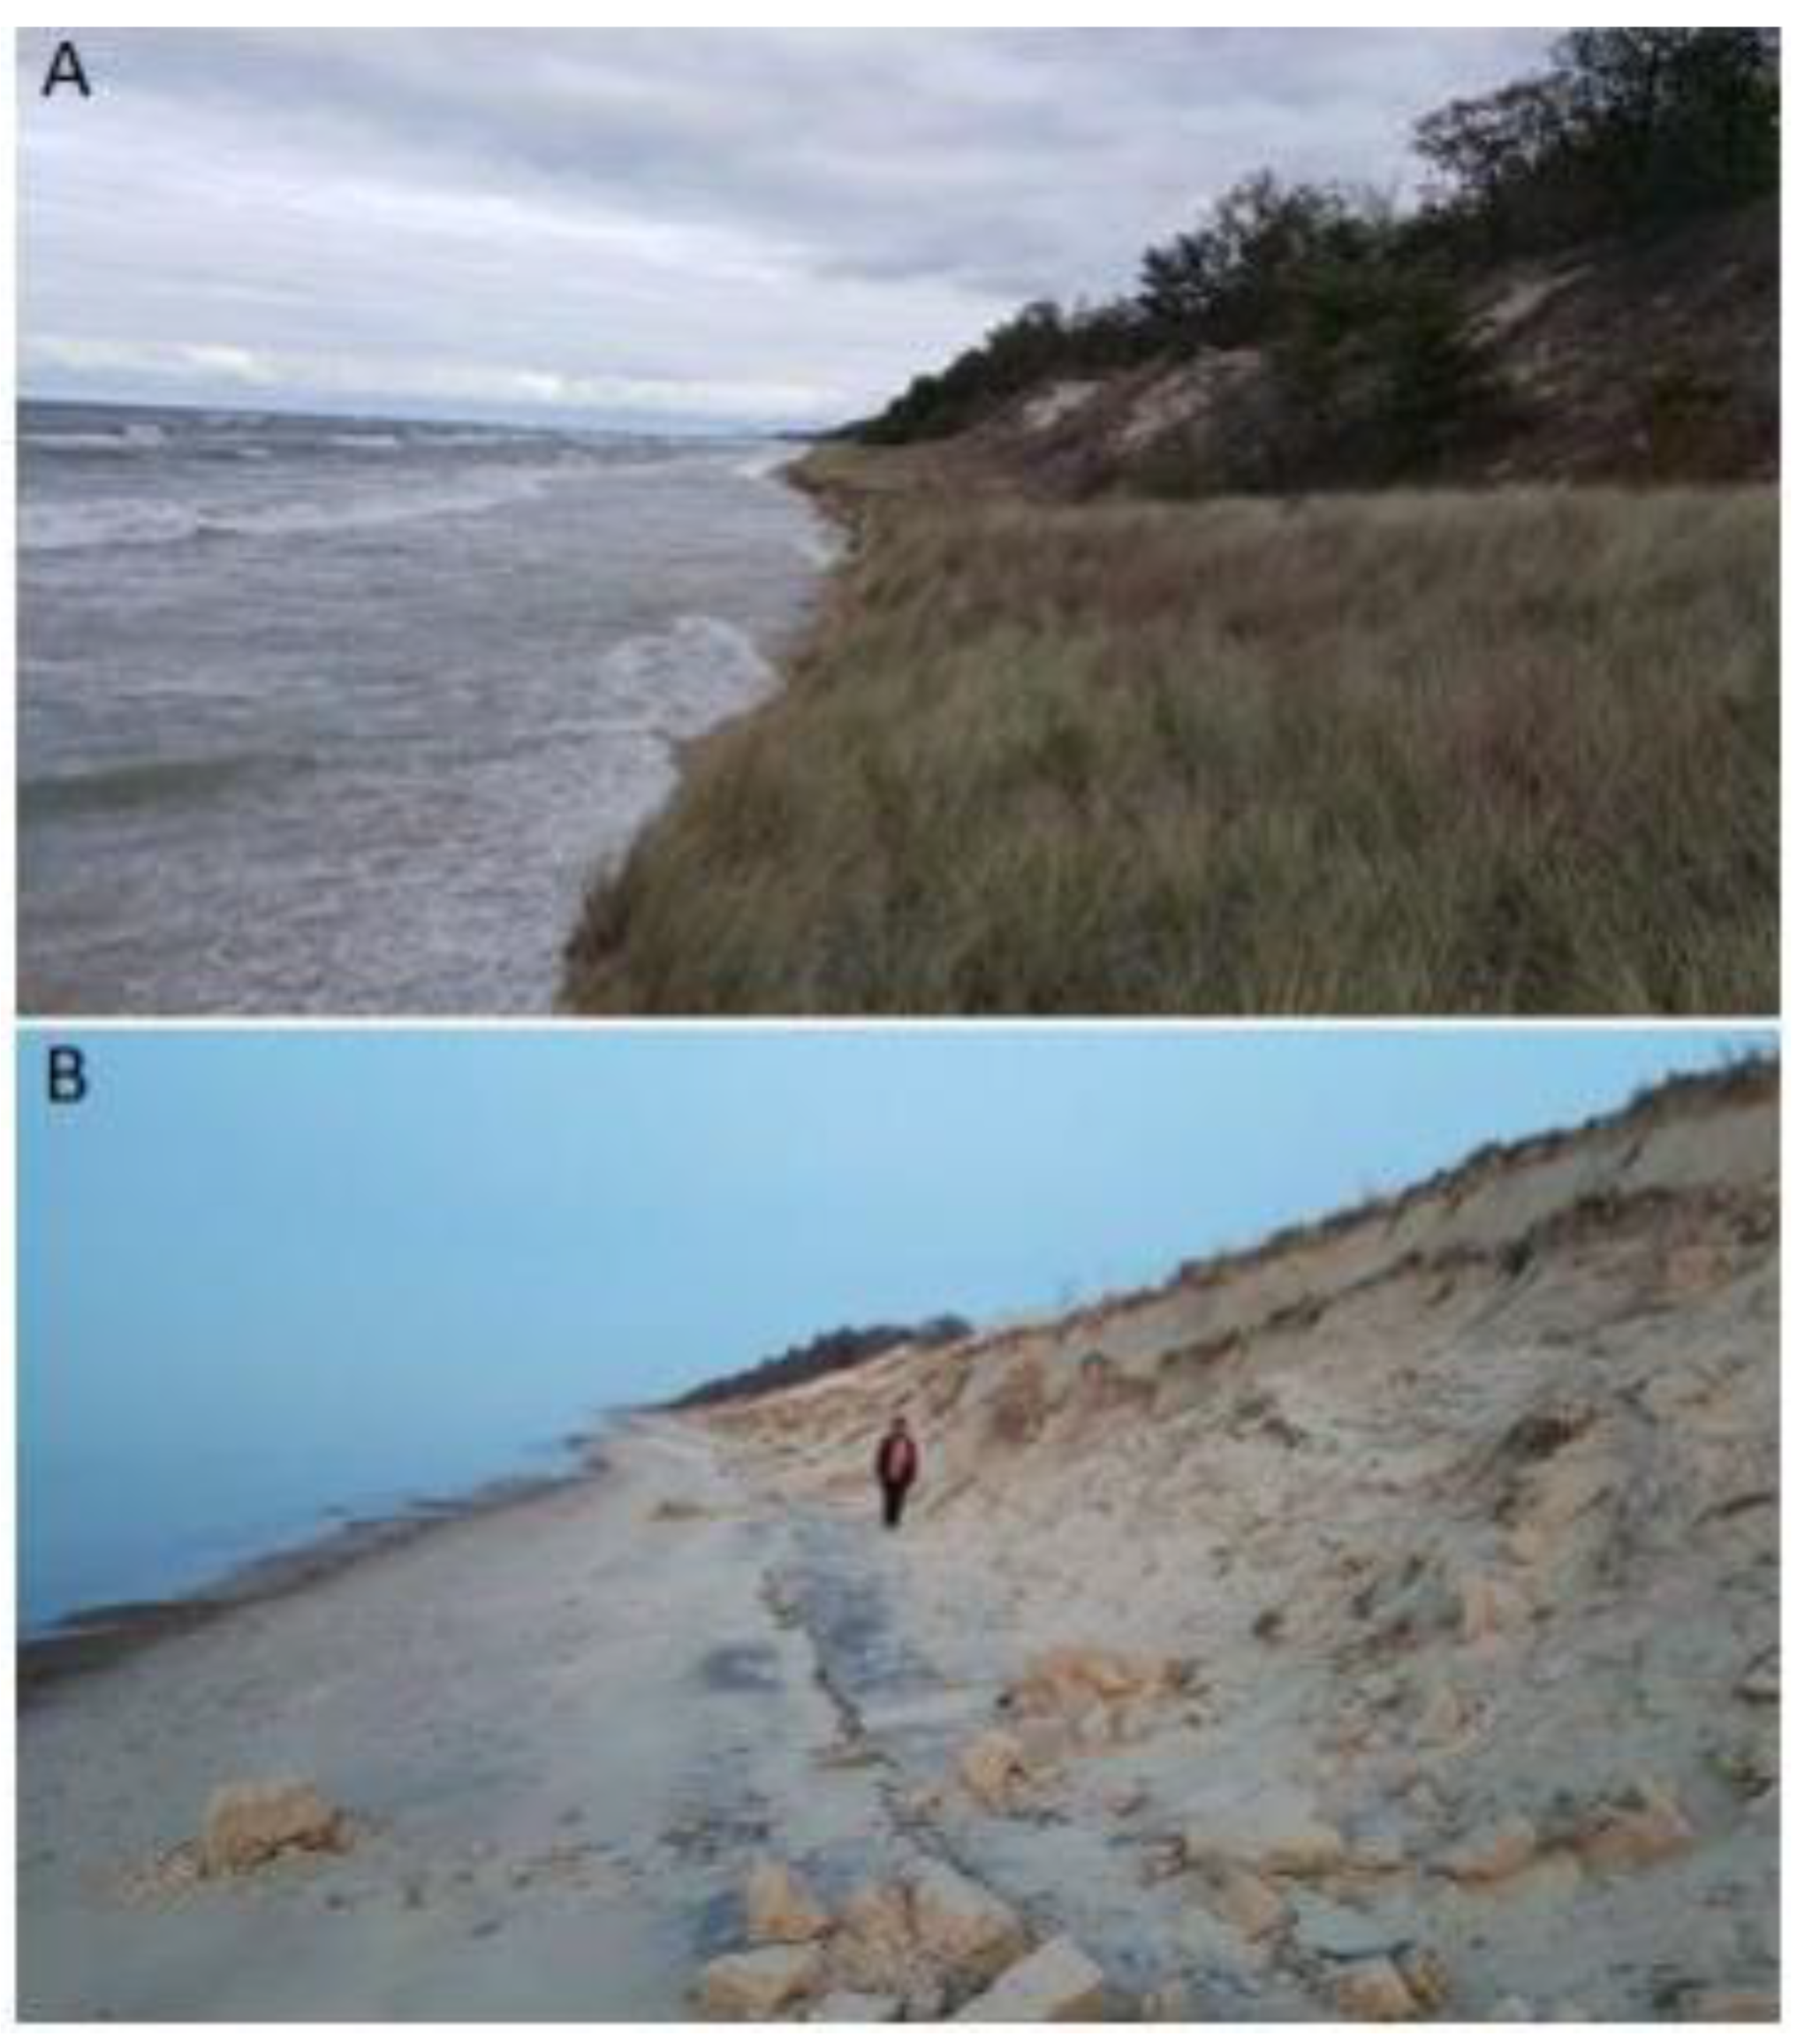
Figure 8.
(A) Primary foredune erosion by Lake Michigan’s surge and waves in the western study area near Station 1. (B) Secondary foredune erosion by mass wasting in cold months in the eastern study area near Station 3.
Figure 8.
(A) Primary foredune erosion by Lake Michigan’s surge and waves in the western study area near Station 1. (B) Secondary foredune erosion by mass wasting in cold months in the eastern study area near Station 3.


Table 1.
Measurements of foredunes width (FW) from January 2018 to December 2020.
| Date | Lake Level (m) | Satation 1 FW | Station 2 FW | Station 3 FW | Weather Conditions |
|---|---|---|---|---|---|
| 27 January 2018 | 176.78 | 20.62 | 17.83 | 32.50 | |
| 30 April 2018 | 176.90 | 20.41 | 17.35 | 31.70 | cold winter, frozen lake |
| 22 July 2018 | 177.21 | 20.35 | 17.21 | 31.62 | backshore very narrow 0–5 m |
| 27 October 2018 | 177.02 | 19.73 | 16.77 | 31.35 | |
| 5 December 2018 | 176.90 | 18.83 | 15.67 | 28.25 | Major storm on November 26 |
| 13 April 2019 | 176.89 | 18.67 | 15.32 | 27.87 | Cold winter, frozen lake |
| 30 June 2019 | 177.42 | 18.44 | 15.25 | 26.71 | Very wet spring |
| 31 August 2019 | 177.32 | 18.43 | 15.23 | 26.75 | |
| 9 November 2019 | 177.23 | 18.23 | 14.42 | 21.65 | Major storm on October 30–November 1 |
| 13 December 2019 | 177.34 | 18.23 | 13.83 | 18.75 | Several minor storms |
| 12 February 2020 | 177.34 | 17.95 | 7.72 | 11.82 | Mild winter, no lake ice, major storm |
| 17 March 2020 | 177.24 | 11.62 | 4.83 | 11.34 | Several minor storms |
| 30 May 2020 | 177.43 | 8.21 | 2.25 | 10.27 | Record lake levels, meteotsunamis |
| 11 September 2020 | 177.51 | 7.42 | 2.24 | 9.62 | |
| 28 November 2020 | 177.18 | 7.23 | 2.15 | 9.02 | Lake level lower than in 2019 |
| 22 December 2020 | 177.10 | 6.81 | 0 | 8.85 |
Publisher’s Note: MDPI stays neutral with regard to jurisdictional claims in published maps and institutional affiliations. |
© 2022 by the authors. Licensee MDPI, Basel, Switzerland. This article is an open access article distributed under the terms and conditions of the Creative Commons Attribution (CC BY) license (https://creativecommons.org/licenses/by/4.0/).
Share and Cite
MDPI and ACS Style
Kilibarda, Z.; Kilibarda, V. Foredune and Beach Dynamics on the Southern Shores of Lake Michigan during Recent High Water Levels. Geosciences 2022, 12, 151. https://0-doi-org.brum.beds.ac.uk/10.3390/geosciences12040151
AMA Style
Kilibarda Z, Kilibarda V. Foredune and Beach Dynamics on the Southern Shores of Lake Michigan during Recent High Water Levels. Geosciences. 2022; 12(4):151. https://0-doi-org.brum.beds.ac.uk/10.3390/geosciences12040151
Chicago/Turabian StyleKilibarda, Zoran, and Vesna Kilibarda. 2022. "Foredune and Beach Dynamics on the Southern Shores of Lake Michigan during Recent High Water Levels" Geosciences 12, no. 4: 151. https://0-doi-org.brum.beds.ac.uk/10.3390/geosciences12040151
Note that from the first issue of 2016, this journal uses article numbers instead of page numbers. See further details here.