
Viewpoint on the Integration of Geochemical Processes into Tracer Transport Models for the Marine Environment


Departamento de Física Aplicada I, ETSIA, Universidad de Sevilla, 41013 Sevilla, Spain
Geosciences 2022, 12(4), 152; https://0-doi-org.brum.beds.ac.uk/10.3390/geosciences12040152
Submission received: 25 February 2022
/
Revised: 14 March 2022
/
Accepted: 24 March 2022
/
Published: 28 March 2022
Abstract
:Two types of models are used to describe the interactions of tracers dissolved in the ocean with marine sediments: equilibrium and dynamic models. A brief description of these models is given in this opinion paper, and some examples are presented to show that preference should be given to the dynamic descriptions in modern pollutant transport models to be used in emergencies as well as in the case of chronic tracer releases to the sea.
1. Introduction
Models which describe the dispersion of tracers in the marine environment have been developed during the last years; for instance, to describe transport processes during the chronic releases of heavy metals [1], potential accidental radionuclide releases to the sea [2], or to assess the effects of the planned releases of stored (and contaminated) water from the Fukushima nuclear power plant [3,4,5].
In addition to physical transport processes (advection due to water currents and mixing due to turbulence), models should include the interactions of tracers with marine sediments, especially if the release occurs in a shallow region. Some tracers, such as heavy metals and some radionuclides, present a high affinity to being fixed to sediments. Hence, their fate is affected by these interactions with sediments. While the tracers which essentially remain dissolved present a high mobility in the sea, those which strongly interact with sediments remain close to the release area. Moreover, these sediments buffer pollutants and behave as long-term, delayed, contaminant sources in the water column. This effect has been clearly observed in the Irish Sea after the reduction of radionuclide releases from the Sellafield nuclear fuel reprocessing plant in the UK [6].
Two types of models are used to describe the adsorption/desorption of tracers between water and sediments: equilibrium and dynamic models. The purpose of this short note is to provide a brief description of these models, the form in which they can be easily integrated into a marine transport model, and to provide arguments as to why preference should be given to dynamic models. The models are described in Section 2, and results are subsequently given in Section 3.
2. Materials and Methods
The distribution (or partition) coefficient concept is used in the case of equilibrium models. It is defined as the ratio between the amount of tracer in the solid phase (suspended matter or bed sediment) and the amount in water (dissolved phase):
where and are respectively the tracer amounts in the solid and dissolved phases. Such tracer amounts have to be measured at equilibrium, i.e., after the partition of the tracer between phases has reached equilibrium. The , defined in this way, is a dimensionless parameter. This is the simplest method to estimate the concentration of a tracer in the solid phase from the known concentration in the water. This concept has been used in a number of transport models (for instance, see [7,8,9]) for the assessment of radionuclide releases in the marine environment.
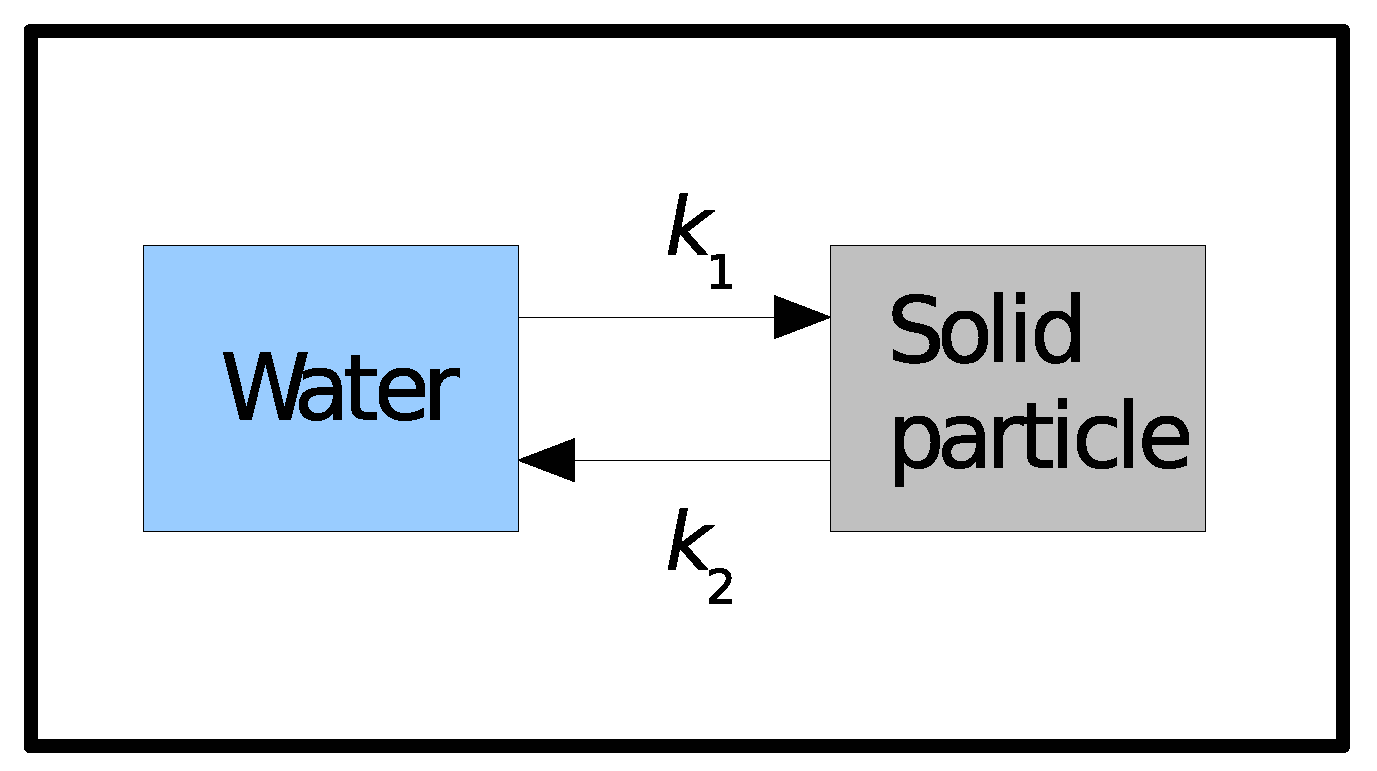
Another option is to use a dynamic model, formulated in terms of kinetic rates, to describe the interactions of tracers between the dissolved and solid phases. If adsorption/release is described by a single reversible reaction (Figure 1), with the rates and for adsorption and release, respectively, the differential equations that give the time evolution of the amount of tracer in the water and sediment, and , will be as follows:
It is assumed that kinetic rates and operationally include all possible reaction mechanisms, for instance, electrostatic attraction, ion exchange, etc. At equilibrium, the time derivatives are zero, and the ratio between and , which is the dimensionless , is calculated as follows:
3. Results
The differences in solving tracer geochemical processes by means of Equations (1) or (2) are described in this section.
In the case of an acute pollutant release, the use of a model, which assumes instantaneous equilibrium in the tracer partition between phases, implies that concentration in the sediment will be overestimated in the early stage of the accident. Later, when tracers in the water column are washed out by marine currents, the equilibrium approach will underestimate radionuclide concentration in the sediment. This is obvious given the definition.
Let us consider a closed system consisting of a volume of water that contains sediments, to which a tracer is added in dissolved form at . If we take the parameters for this case (selected just as an example but of the typical order of magnitude [10]) as s and s, then from Equation (3), .
The solution (equilibrium in the partition) using the model gives the following numbers for the fraction of dissolved tracers and those in the sediment:
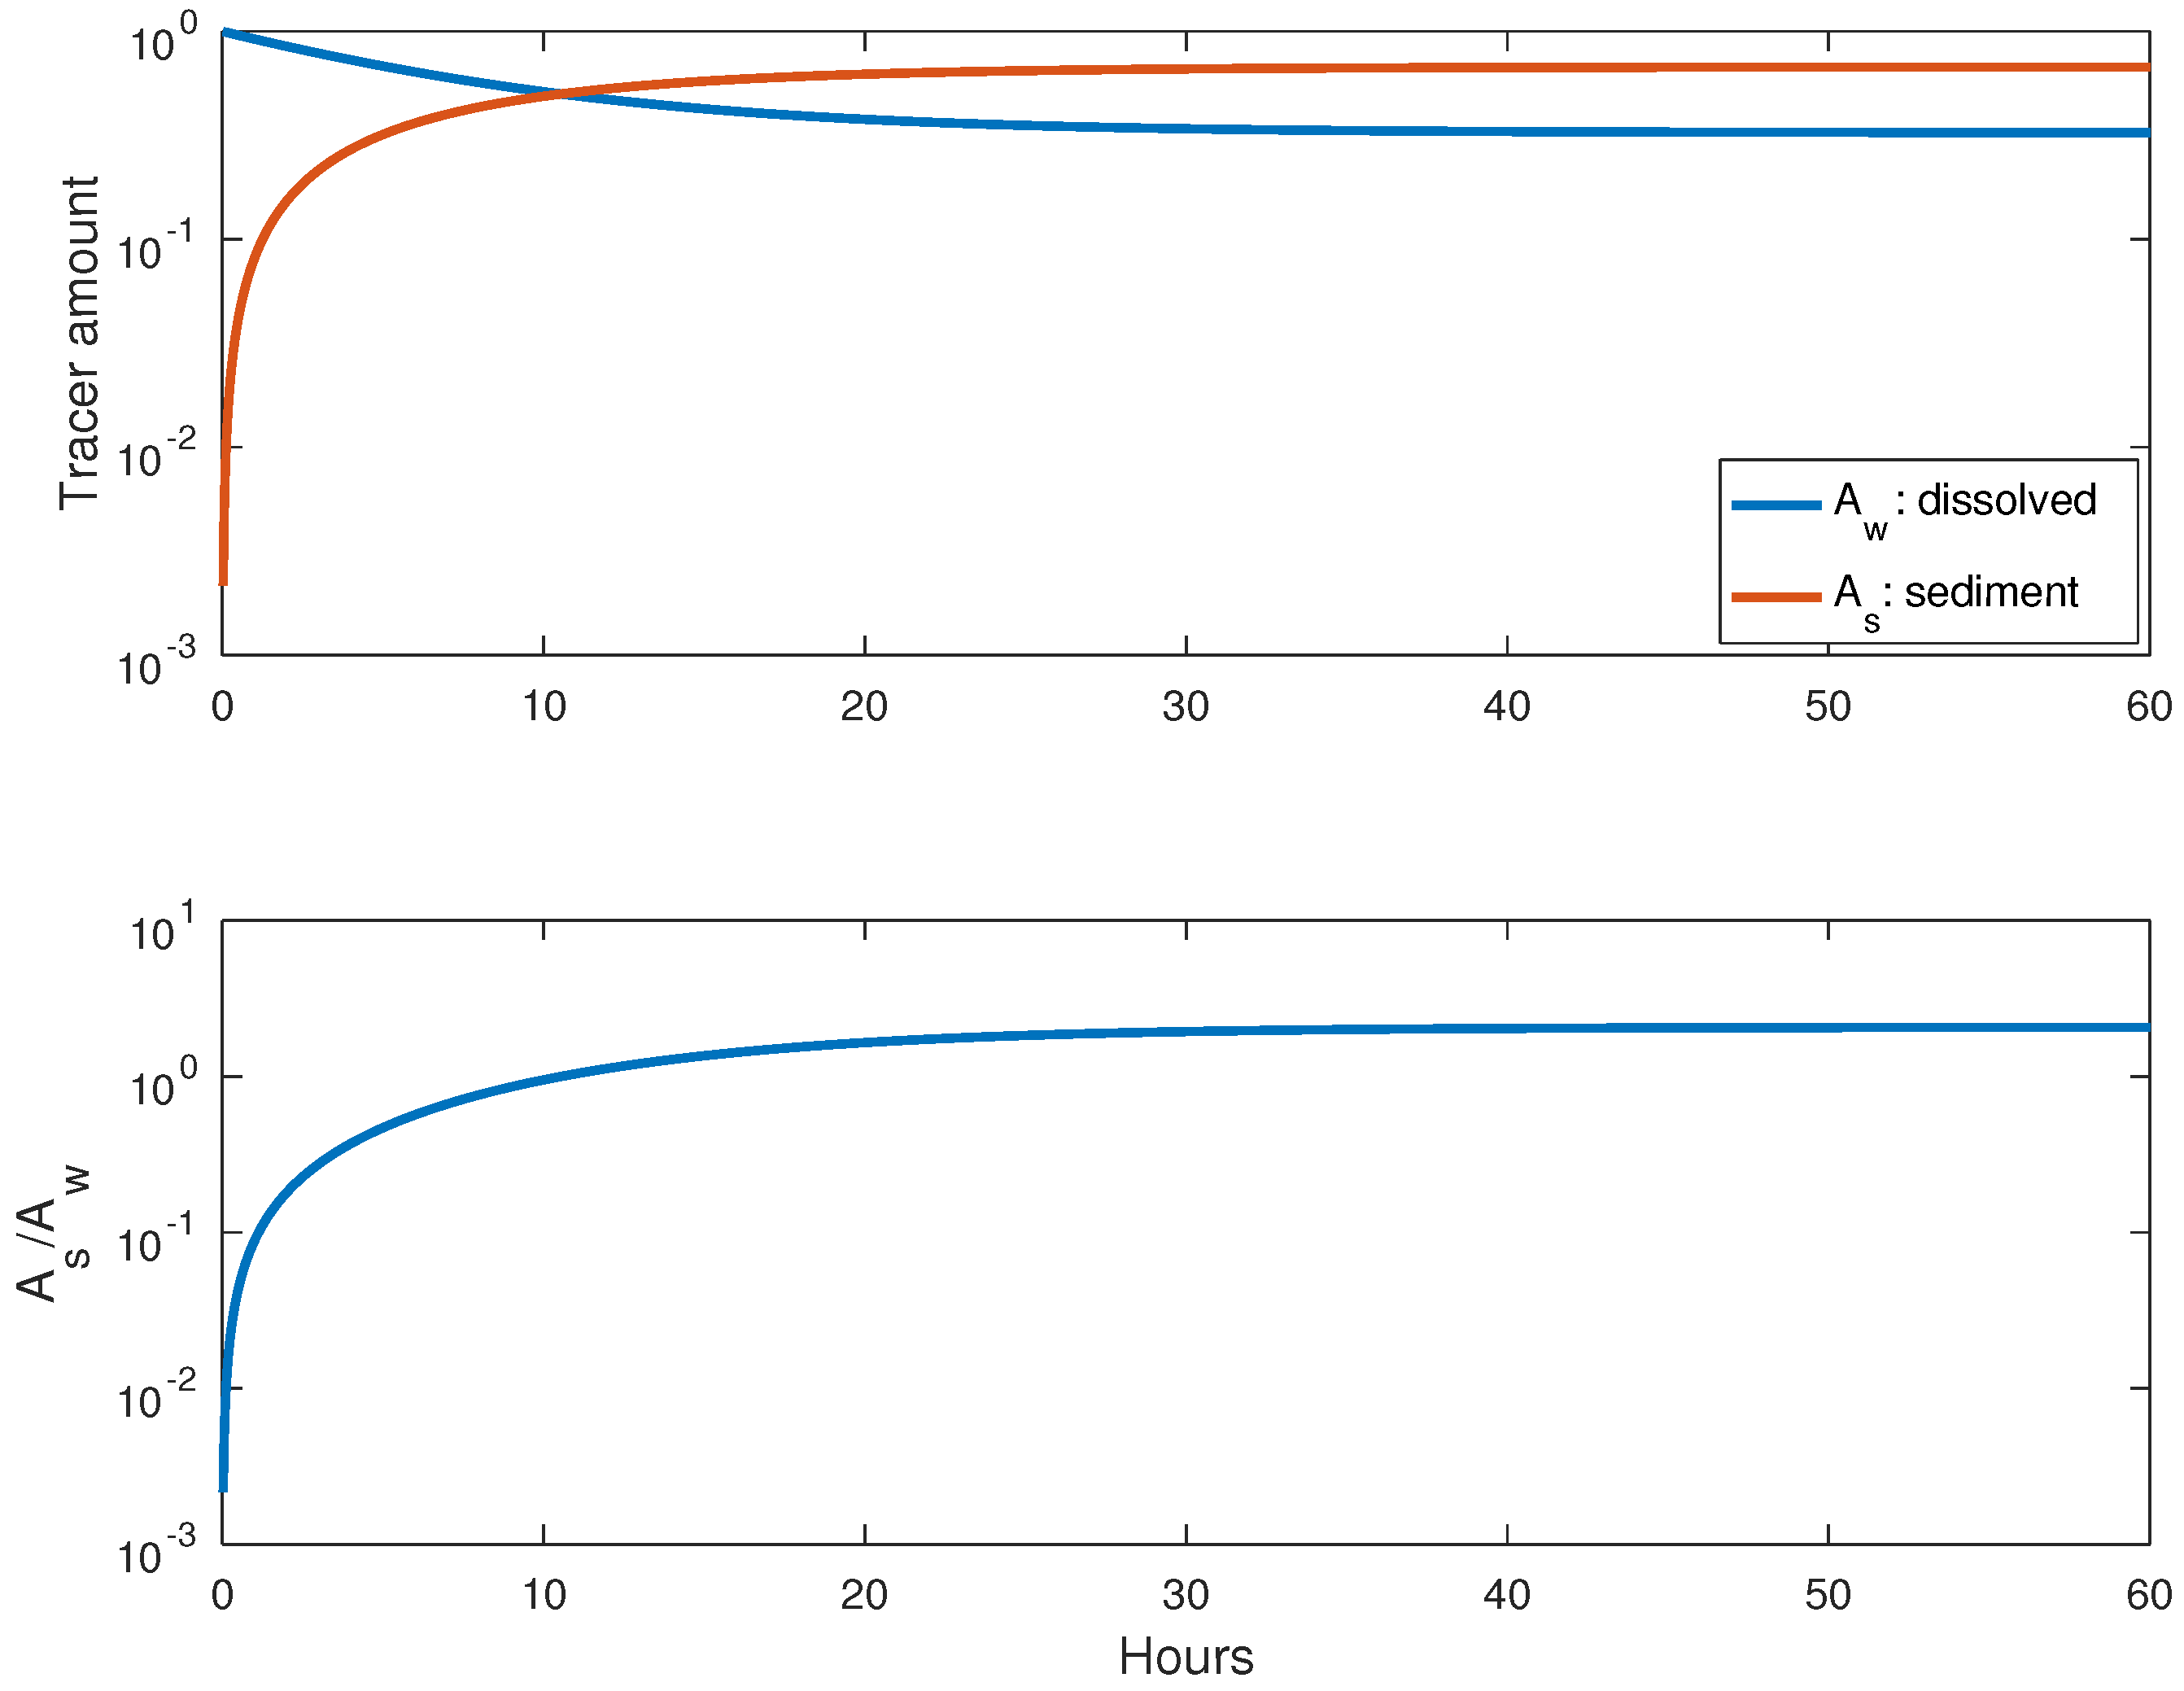
With the indicated above, we obtain and . However, the difference in behavior between the equilibrium and dynamic models is clear: in the model, the sediments instantaneously adsorb all the tracers they are able to; in contrast, adsorption is delayed in the dynamic model. The solution of Equation (2) (dynamic model) for this case is presented in Figure 2. It is certain that the tracer amount in sediment increases in time, and equilibrium is reached after some tens of hours (with the present values of and ). Once equilibrium is reached, the ratio between the amount of tracers in sediment and water is numerically equal to the , as given by Equation (3). This may be seen in the bottom panel of Figure 2. In addition, tracer fractions in water and sediments are equal to those predicted by Equation (4) of the model (top panel).
Clearly, at the early stages after an accidental tracer release into the sea, a model cannot be applied since it will overestimate the concentration in the sediment and underestimate the concentration in water.
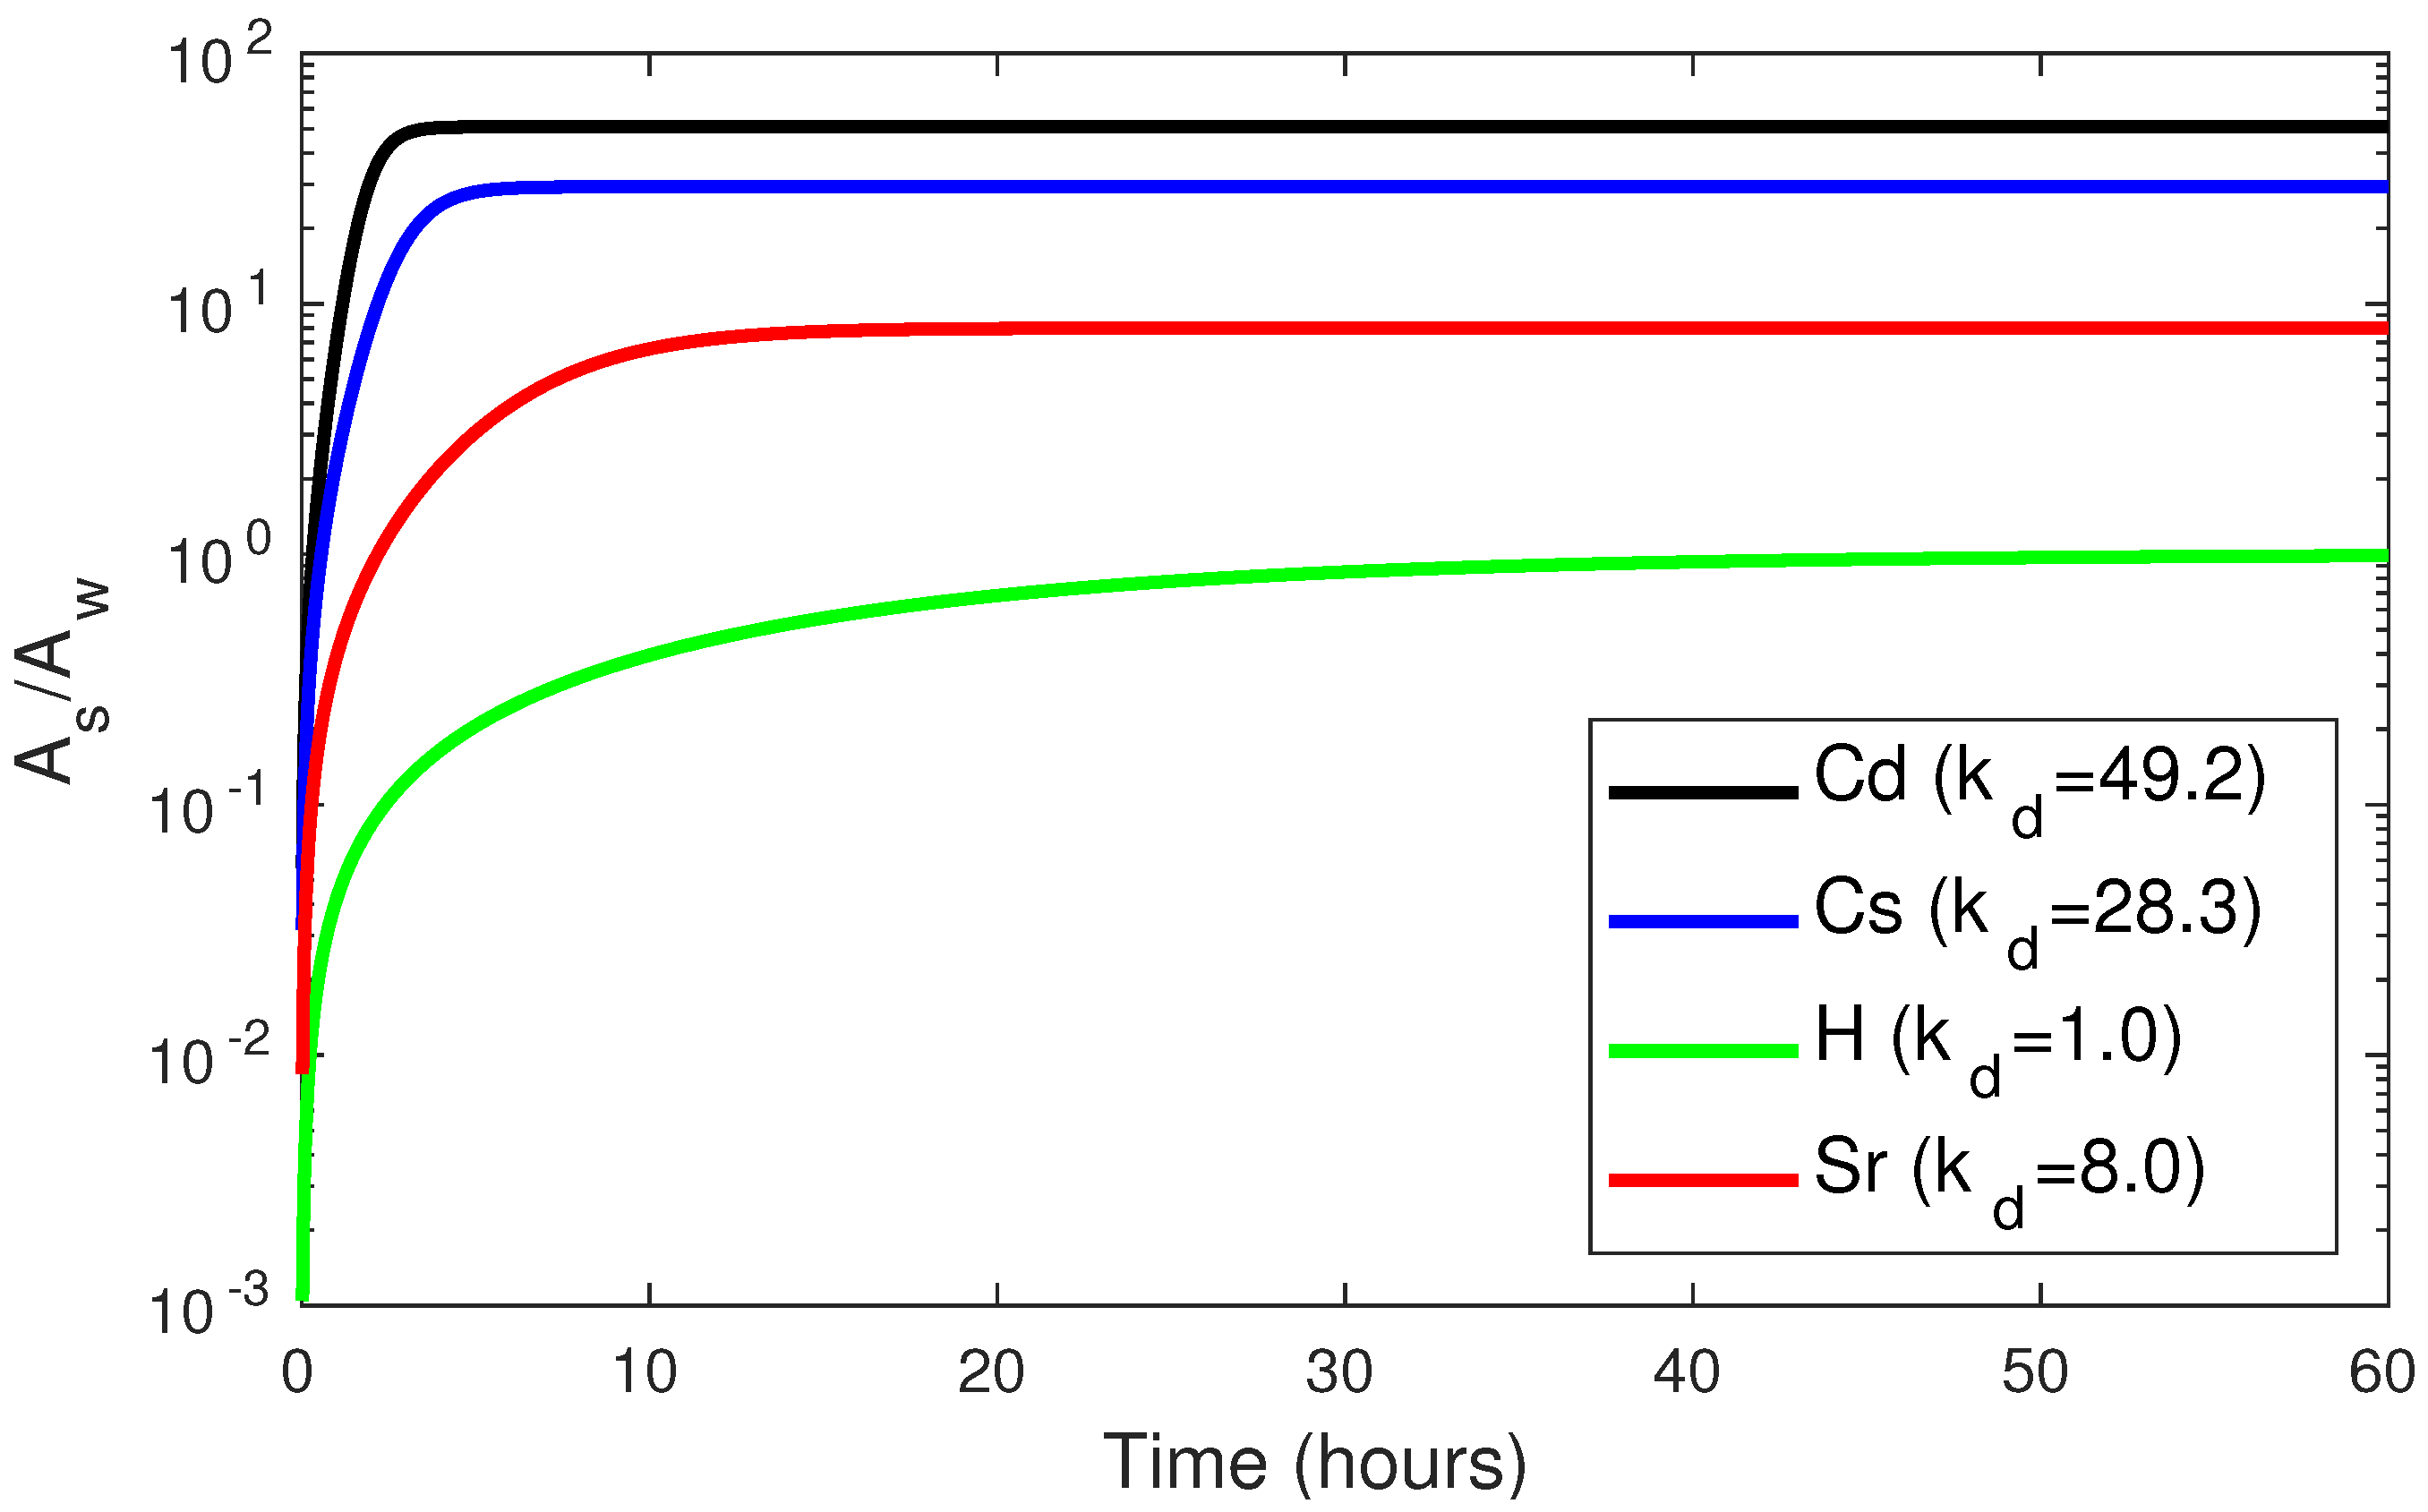
The time required to reach equilibrium in this kind of closed system experiments depends on each particular tracer. The ratio between tracer amounts in sediment and water for several elements may be seen in Figure 3. The for each element is given in the legend [10,11]. Equilibrium is reached faster as the affinity of the element to be fixed to the solid phase (the ) increases. However, as discussed below, the marine environment is not a closed system, and equilibrium may not be reached at any time.
It was clearly shown in [12] that the marine environment is an open system affected by external perturbations (currents change in time, for instance). A steady-state (constant tracer concentrations in water and sediments; even in the simple and hypothetical case wherein currents do not change in time and the tracer source is also constant) does not necessarily mean equilibrium for the partition of tracers between the liquid and solid phases. The model is no longer valid in the area near where tracer releases occur, although it may be valid at further distances. Full details are given in [12] and not repeated here.
As a consequence, when values are measured in the sea (by measuring tracer concentrations in sediment and water and dividing them), the samples should be taken as far as possible from the tracer release points. We then designate an “apparent” to the ratio between the tracer concentrations in sediment and water. Only if equilibrium in the partition really exists will this ratio become a distribution coefficient . In other words, the apparent will turn out to be a true . Immediately after an accident, the apparent is very low due to the faster contamination of water than of sediments. Then, the apparent increases, as the sediment is contaminated, until it reaches a maximum value. This maximum value for the apparent is larger than the true since there is a moment when the tracer concentration in water quickly decreases (due to flushing by currents) while the sediment is still heavily contaminated. Afterwards, there is a slow decrease in the apparent as tracers are slowly redissolved from the sediment. Finally, equilibrium in the partition is reached and the apparent becomes a true . This behavior was predicted by the calculations carried out with a dynamic model described in [13] and supported by radionuclide measurements in Fukushima waters and sediments [14,15].
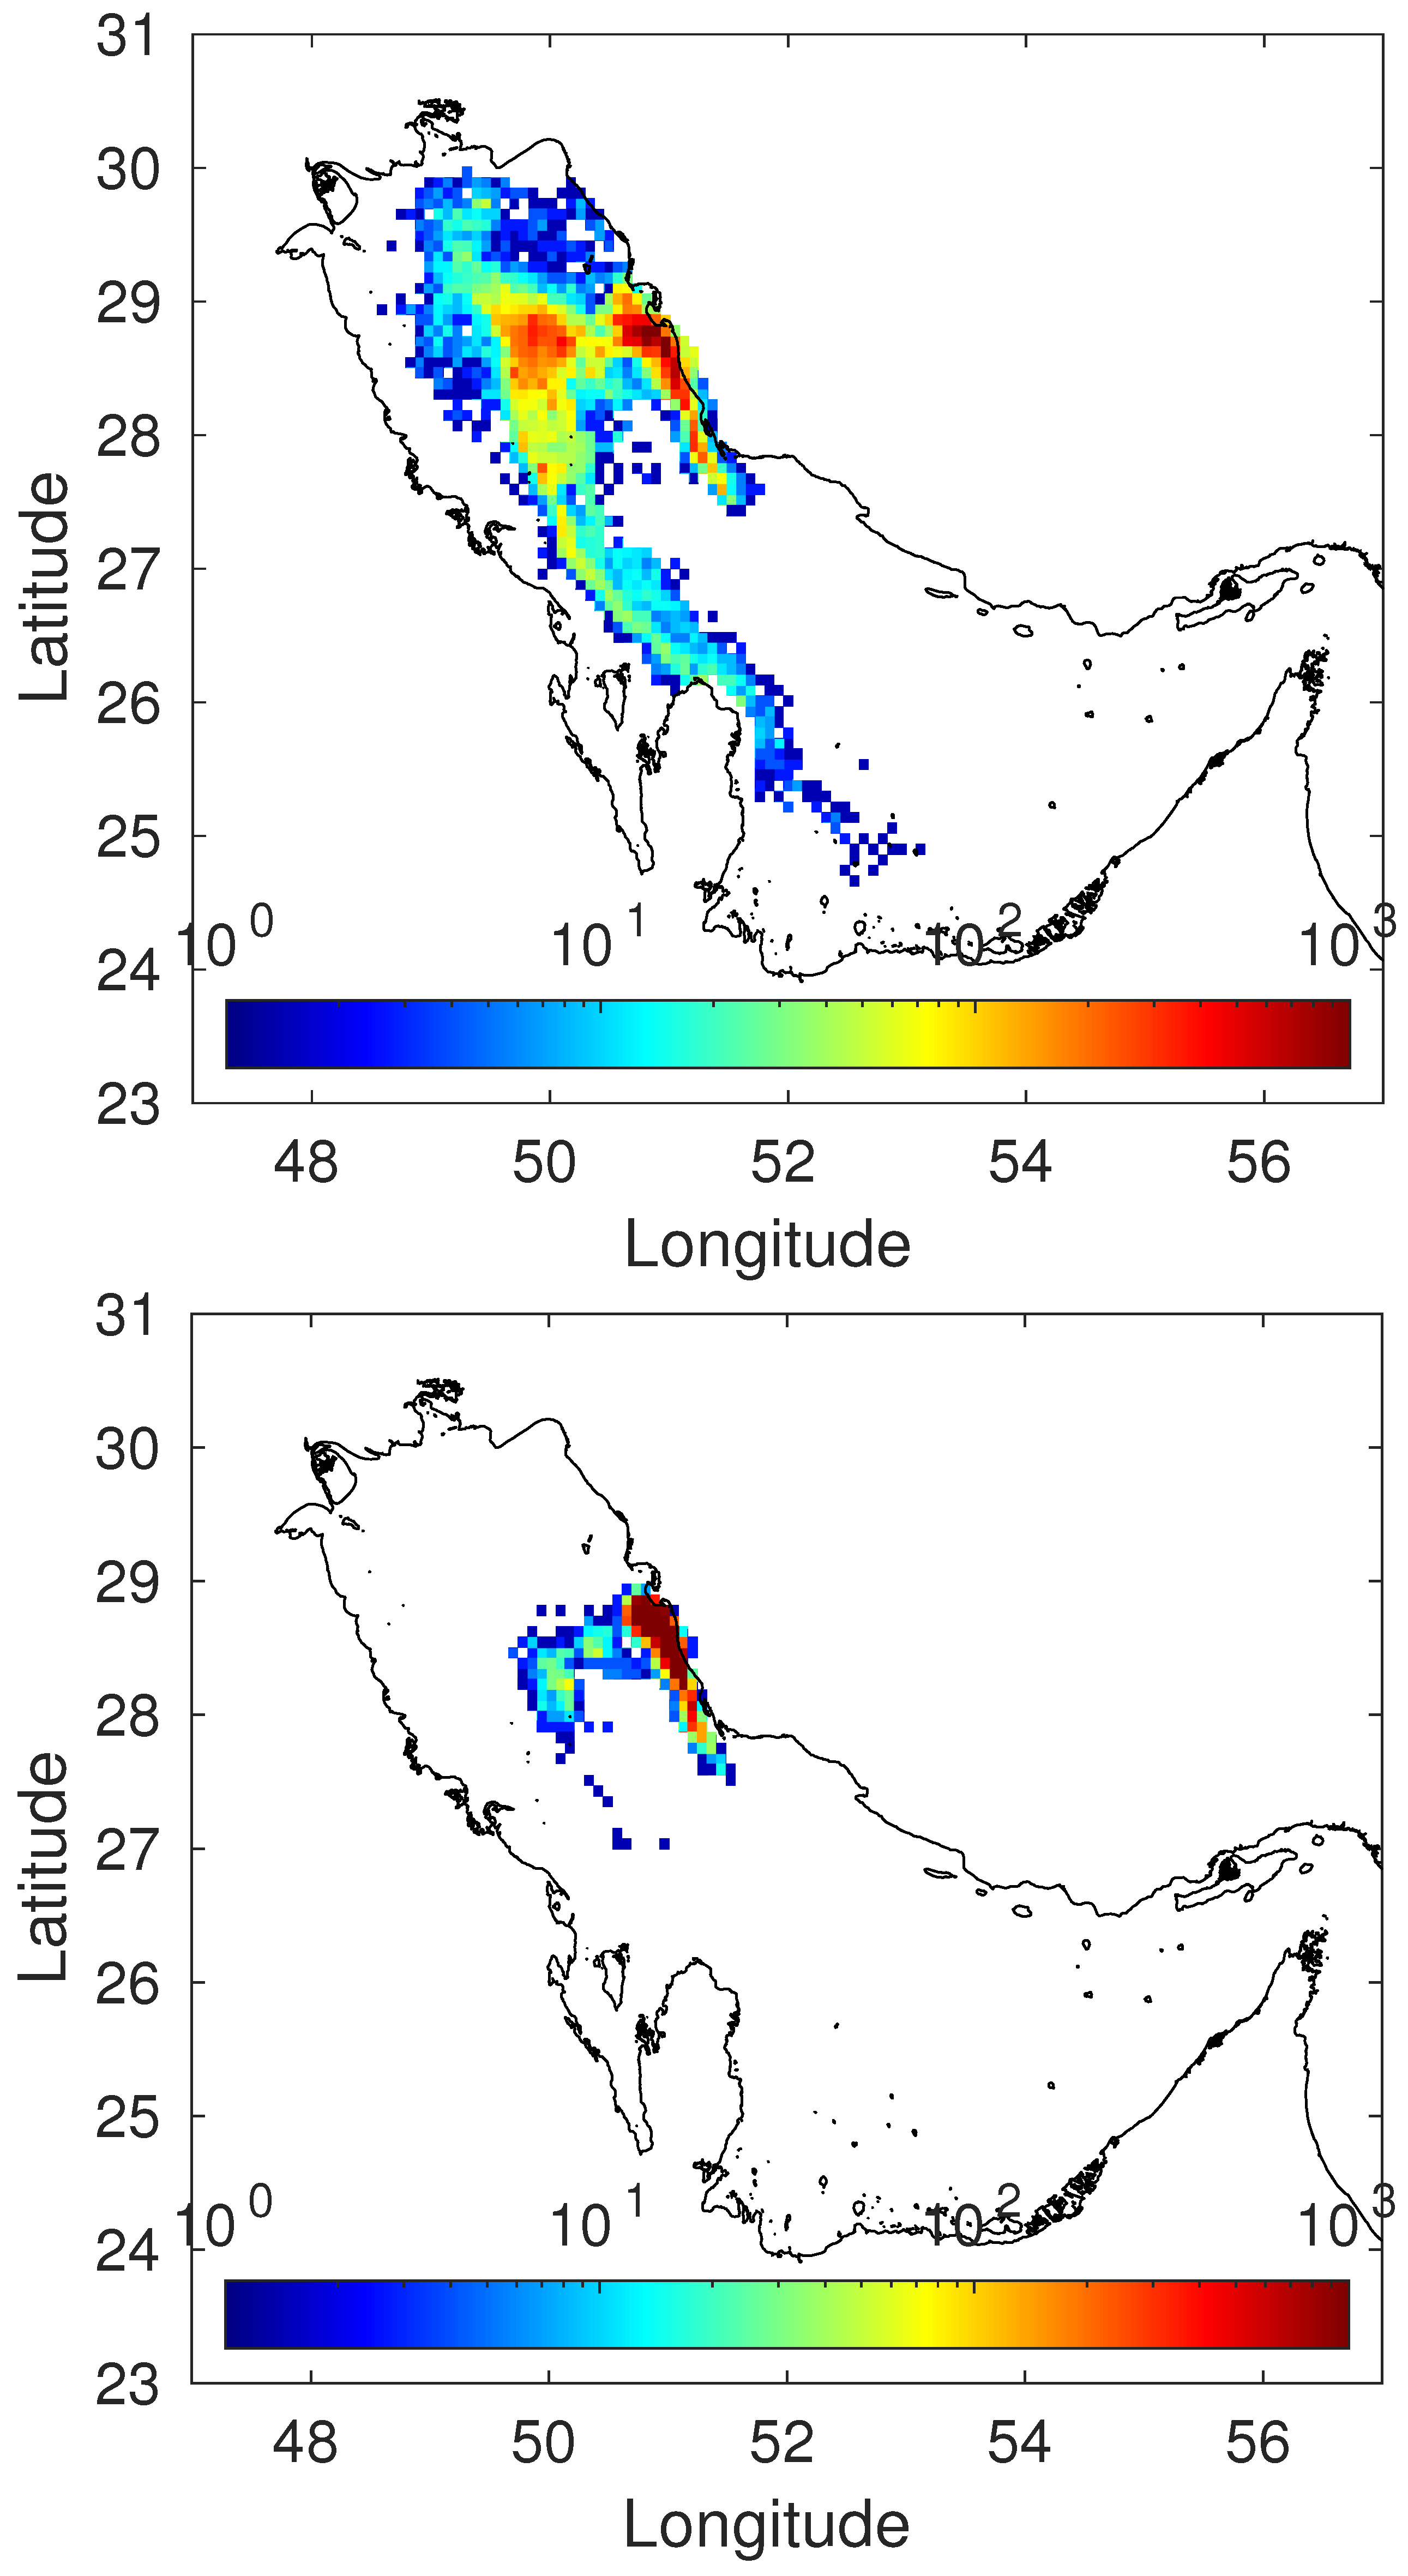
Another aspect to consider is the tracer mobility if a model is used. The question is: what difference can we observe if the release of a tracer is simulated using a or a dynamic model? With the model, the tracer moves exactly as water does, quickly spreading and moving away from the release area with the currents. However, tracers which strongly interact with sediments present a very low mobility in the marine environment: they essentially remain close to the release area. This is due to the fact that the adsorption/desorption of tracers between water and sediment is a dynamic process which occurs simultaneously in both directions. A clear example of this effect may be seen in Figure 4, where a comparison of results (concentrations in sediments) for a tracer release is presented when simulated with a and a dynamic model: while the -simulated patch extends to over 600 km after 90 days, in the case of the dynamic model, the extension of the patch is only about 100 km. This particular example corresponds to a hypothetical release in the Persian Gulf, but the physico-chemical processes are of course the same in any sea. The calculations were performed with the model described in [2].
In addition to the points considered above, it is also known that sediments accumulate tracers, which means that they remain contaminated for a long time, even after discharges have been stopped. These tracers are slowly released back into the water column; thus, the contaminated sediments behave as a delayed, long-term source of previously released contaminants. In fact, some calculations for the Fukushima coastal waters that had been carried out with a dynamic model indicated that even for a relatively conservative tracer such as the radionuclide Cs, decades would be required after the termination of contaminant releases to the sea for the concentration in the sediment to be reduced to their levels before the accident in 2011 [13]. This process has also been clearly observed in the Irish Sea, as mentioned before (for instance, see [6], among many others) after the reduction of radionuclide releases to the sea from the Sellafield nuclear fuel reprocessing plant in the UK. The authors of [6] found that about Bq of Cs were redissolved from the immediate tidal area around Sellafield from 1989 to 2009. Contaminated sediments indeed act as a delayed pollutant source. This process certainly cannot be simulated with a model, which assumes an instantaneous equilibrium in the partition of tracers between water and sediments.
More complex dynamic models can be used, such as those involving several consecutive or parallel reactions as well as layered sediments [16]. Nevertheless, at least the most basic version of the dynamic description of water/sediment interactions involving a single reversible reaction should be used to integrate water/sediment interactions into modern tracer transport models for the marine environment. A different aspect is the interaction of tracers in sediment pore water with the sediment. Pore water is a much closed system than the water above the sediment. Therefore, equilibrium conditions may be achieved relatively fast, as found in the case of Cs in the pore water of sediments around Fukushima [17].
Similar approaches exist to describe the intake of tracers by biota: equilibrium models, based on the concentration ratio concept, and dynamic models [18]. These authors carried out an exercise comparing both approaches and found that equilibrium models cannot reproduce the delay in peak concentrations in biota with respect to peak concentrations in water, which is similar to what occurs in sediment adsorption.
4. Conclusions
The marine environment is an open system affected by external perturbations. As a consequence, a steady state (in tracer concentrations) does not necessarily mean equilibrium in the partition of tracers between the liquid and solid phases. A model can seldom be used to describe the interactions of tracers between water and sediments because its basic assumption, i.e., equilibrium, is generally not satisfied.
The use of an equilibrium model to simulate emergency or chronic releases would have the following consequences:
- Concentrations in the sediments of the release area are overestimated in the short term and underestimated in the long term.
- The mobility of tracers released to the marine environment is overestimated.
- Point 2 implies that concentrations in the sediments at long distances from the release area are also overestimated in the short term.
- The well-known behavior of sediments as a long-term, delayed source of pollutants in the water column cannot be described.
Therefore, numerical models aimed at describing the fate of pollutants that interact with the solid phases in the marine environment should be based on a dynamic description of such interactions. Indeed, more parameters are needed when a dynamic model is applied. These parameters are usually site-specific and not easy to determine. In addition, dynamic models are computationally more expensive.
Funding
This research was partially funded by the Spanish Ministerio de Ciencia, Innovación y Universidades project PGC2018-094546-B-I00 and Junta de Andalucía (Consejería de Economía y Conocimiento) project US-1263369.
Institutional Review Board Statement
Not applicable.
Informed Consent Statement
Not applicable.
Conflicts of Interest
The authors declare no conflict of interest.
References
- Periáñez, R. Environmental modelling in the Gulf of Cadiz: Heavy metal distributions in water and sediments. Sci. Total Environ. 2009, 407, 3392–3406. [Google Scholar] [PubMed]
- Periáñez, R. APERTRACK: A particle-tracking model to simulate radionuclide transport in the Arabian/Persian Gulf. Prog. Nucl. Energy 2021, 142, 103998. [Google Scholar] [CrossRef]
- Zhao, C.; Wang, G.; Zhang, M.; Wang, G.; de With, G.; Bezhenar, R.; Maderich, V.; Xia, C.; Zhao, B.; Jung, K.T.; et al. Transport and dispersion scenarios of tritium from the radioactive water of the Fukushima Dai-ichi nuclear plant. Mar. Pollut. Bull. 2021, 169, 112515. [Google Scholar] [CrossRef] [PubMed]
- Periáñez, R.; Qiao, F.; Zhao, C.; de With, G.; Jung, K.; Sangmanee, C.; Wang, G.; Xia, C.; Zhang, M. Opening Fukushima floodgates: Modelling 137Cs impact in marine biota. Mar. Pollut. Bull. 2021, 170, 112645. [Google Scholar] [CrossRef] [PubMed]
- Bezhenar, R.; Takata, H.; de With, G.; Maderich, V. Planned release of contaminated water from the Fukushima storage tanks into the ocean: Simulation scenarios of radiological impact for aquatic biota and human from seafood consumption. Mar. Pollut. Bull. 2021, 173, 112969. [Google Scholar] [CrossRef] [PubMed]
- Hunt, J.; Leonard, K.; Hughes, L. Artificial radionuclides in the Irish Sea from Sellafield: Remobilisation revisited. J. Radiol. Prot. 2013, 33, 261–279. [Google Scholar] [CrossRef] [PubMed]
- Lepicard, S.; Heling, R.; Maderich, V. POSEIDON/RODOS model for radiological assessment of marine environment after accidental releases: Application to coastal areas of the Baltic, Black and North seas. J. Environ. Radioact. 2004, 72, 153–161. [Google Scholar] [CrossRef]
- Iosjpe, M.; Karcher, M.; Gwynn, J.; Harms, I.; Gerdes, R.; Kauker, F. Improvement of the dose assessment tools on the basis of dispersion of the 99Tc in the Nordic Seas and the Arctic Ocean. Radioprotection 2009, 44, 531–536. [Google Scholar] [CrossRef] [Green Version]
- Maderich, V.; Bezhenar, R.; Heling, R.; de With, G.; Jung, K.T.; Myoung, J.G.; Cho, Y.K.; Qiao, F.; Robertson, L. Regional long-term model of radioactivity dispersion and fate in the northwestern Pacific and adjacent seas: Application to the Fukushima Dai-ichi accident. J. Environ. Radioact. 2014, 131, 4–18. [Google Scholar] [CrossRef] [PubMed]
- Periáñez, R.; Bezhenar, R.; Brovchenko, I.; Duffa, C.; Iosjpe, M.; Jung, K.T.; Kim, K.O.; Kobayashi, T.; Liptak, L.; Maderich, V.; et al. Marine radionuclide dispersion modelling: Recent developments, problems and challenges. Environ. Model. Softw. 2019, 122, 104523. [Google Scholar] [CrossRef]
- IAEA. Sediment Distribution Coefficients and Concentration Factors for Biota in the Marine Environment; Technical Reports Series; IAEA: Vienna, Austria, 2004; Volume 422. [Google Scholar]
- Periáñez, R. Redissolution and long-term transport of radionuclides released from a contaminated sediment: A numerical modelling study. Estuar. Coast. Shelf Sci. 2003, 56, 5–14. [Google Scholar] [CrossRef]
- Periáñez, R.; Brovchenko, I.; Jung, K.T.; Kim, K.O.; Maderich, V. The marine kd and water/sediment interaction problem. J. Environ. Radioact. 2018, 192, 635–647. [Google Scholar] [CrossRef] [PubMed]
- Yamamoto, K.; Tagami, K.; Uchida, S.; Ishii, N. Model estimation of 137-Cs concentration change with time in seawater and sediment around the Fukushima Daiichi Nuclear Power Plant site considering fast and slow reactions in the seawater-sediment systems. J. Radioanal. Nucl. Chem. 2015, 304, 867–881. [Google Scholar] [CrossRef]
- Kusakabe, M.; Takata, H. Temporal trends of 137-Cs concentration in seawaters and bottom sediments in coastal waters around Japan: Implications for the Kd concept in the dynamic marine environment. J. Radioanal. Nucl. Chem. 2020, 323, 567–580. [Google Scholar] [CrossRef] [Green Version]
- Maderich, V.; Jung, K.T.; Brovchenko, I.; Kim, K.O. Migration of radioactivity in multi-fraction sediments. Environ. Fluid Mech. 2017, 17, 1207–1231. [Google Scholar] [CrossRef] [Green Version]
- Otosaka, S.; Kambayashi, S.; Fukuda, M.; Tsuruta, T.; Misonou, T.; Suzuki, T.; Aono, T. Behavior of radiocesium in sediments in Fukushima coastal waters: Verification of desorption potential through pore water. Environ. Sci. Technol. 2020, 54, 13778–13785. [Google Scholar] [CrossRef]
- Vives i Batlle, J.; Beresford, N.; Beaugelin-Seiller, K.; Bezhenar, R.; Brown, J.; Cheng, J.J.; Cujic, M.; Dragovic, S.S.; Duffa, C.; Fievet, B.; et al. Inter-comparison of dynamic models for radionuclide transfer to marine biota in a Fukushima accident scenario. J. Environ. Radioact. 2016, 153, 31–50. [Google Scholar] [CrossRef]
Figure 1.
Dynamic model describing water/sediment interactions with a single reversible reaction. and are forward and backward kinetic rates.
Figure 1.
Dynamic model describing water/sediment interactions with a single reversible reaction. and are forward and backward kinetic rates.

Figure 2.
Fractions of tracers in dissolved and sediment form (top) and the ratio between them (bottom).
Figure 2.
Fractions of tracers in dissolved and sediment form (top) and the ratio between them (bottom).

Figure 3.
Ratio between tracer fractions in sediment and water for several elements.

Figure 4.
Modeled distributions in seabed sediments (units/kg) of a hypothetical tracer released in the Persian Gulf if simulated with a model (top) and a dynamic model (bottom). The release was considered constant in time and lasting 90 days. Results after these 90 days are presented.
Figure 4.
Modeled distributions in seabed sediments (units/kg) of a hypothetical tracer released in the Persian Gulf if simulated with a model (top) and a dynamic model (bottom). The release was considered constant in time and lasting 90 days. Results after these 90 days are presented.

Publisher’s Note: MDPI stays neutral with regard to jurisdictional claims in published maps and institutional affiliations. |
© 2022 by the author. Licensee MDPI, Basel, Switzerland. This article is an open access article distributed under the terms and conditions of the Creative Commons Attribution (CC BY) license (https://creativecommons.org/licenses/by/4.0/).
Share and Cite
MDPI and ACS Style
Periáñez, R. Viewpoint on the Integration of Geochemical Processes into Tracer Transport Models for the Marine Environment. Geosciences 2022, 12, 152. https://0-doi-org.brum.beds.ac.uk/10.3390/geosciences12040152
AMA Style
Periáñez R. Viewpoint on the Integration of Geochemical Processes into Tracer Transport Models for the Marine Environment. Geosciences. 2022; 12(4):152. https://0-doi-org.brum.beds.ac.uk/10.3390/geosciences12040152
Chicago/Turabian StylePeriáñez, Raúl. 2022. "Viewpoint on the Integration of Geochemical Processes into Tracer Transport Models for the Marine Environment" Geosciences 12, no. 4: 152. https://0-doi-org.brum.beds.ac.uk/10.3390/geosciences12040152
Note that from the first issue of 2016, this journal uses article numbers instead of page numbers. See further details here.