Article

Multidecadal Land-Use Changes and Implications on Soil Protection in the Calore River Basin Landscape (Southern Italy)

Department of Sciences and Technologies, University of Sannio, 82100 Benevento, Italy
*
Author to whom correspondence should be addressed.
Submission received: 27 February 2022 / Revised: 24 March 2022 / Accepted: 28 March 2022 / Published: 1 April 2022

Abstract

:
In Southern Italy, studies dealing with the analysis of multidecadal land-use changes at the basin scale are scarce. This is an important gap, considering the deep interrelationships between land-use changes, soil erosion, and river dynamics, and hazards at the basin scale and the proneness of Southern Italy to desertification. This study provides a contribution in filling this gap by analyzing the land-use changes occurring in an inner area of Southern Italy, i.e., the Calore River basin, between 1960 and 2018. Working to this aim, we conducted a GIS-aided comparison and analysis of three land-use maps of the study area from 1960, 1990, and 2018, respectively. We analyzed land-use changes at the basin, physiographic unit, and land-use class scale. We also interpreted the results in terms of variations in soil protection against erosion. Most of the detected land-use changes occurred between 1960 and 1990 and mainly consisted of the afforestation of agricultural lands. The latter was mainly concentrated in the alluvial plains and, to a lesser extent, on mountainous reliefs. In contrast, between 1990 and 2018, the land-use remained unchanged in more than 90% of the studied landscape. Artificial surfaces increased by about six times over a period of ~60 years; notwithstanding, they currently occupy about 4% of the basin area. The detected changes led to an overall increase in soil protection against erosion at the basin scale.

1. Introduction

Significant land-use and land-cover (hereinafter LULC) changes affected the Mediterranean region for thousands of years, making this area one of the most significantly altered hotspots in the world [1,2]. Before the 20th century, LULC changes generally occurred slowly in response to demographic growth, while in recent decades they were more extensive and rapid [3]. The expansion of the international markets and, at least in the European sector of the Mediterranean area, the European Common Agricultural Policy (CAP), are generally recognized as the main driving forces of the LULC changes that occurred from the second half of the 20th century onwards [4].
As well as the entire Mediterranean area, Southern Italy is a desertification-prone territory [5]. An effective contrast to desertification requires, among others, a detailed knowledge of soil erosion processes and related driving factors. Among the latter, LULC changes are of utmost importance [3,4,5,6]. Several studies demonstrated that plant cover and land uses are the most important factors among those explaining the intensity of soil erosion, exceeding the influence of rainfall intensity and slope gradient [7,8,9]. Other studies highlighted a clear reduction of the badland areas due to intense land-use changes and, in particular, reforestation [10,11,12]. Research aimed at contrasting desertification and soil erosion is fundamental, especially in those territories whose economy is based on agriculture, as Southern Italy’s unquestionably is [13,14,15].
At the basin scale, the intensity of soil erosion also controls the sediment supply to the rivers. In turn, the latter determines the solid discharge of rivers, which is a key driving variable in their short-term channel adjustments [16,17,18,19]. The knowledge of the latter is a fundamental starting point in correctly assessing flood hazard and risk [20,21,22]. Thus, even if a large number of studies dealing with LULC changes were conducted at morphoclimatic regions [23,24,25,26,27,28], and on continental [29], national [1,30,31,32,33], and regional scales [34,35,36,37], it is unquestionably at the basin scale that the relationships between LULC changes, soil erosion processes, and river dynamics are clearer [38,39,40].
In this framework, the integration of remotely sensed data and GIS-analysis represents a powerful tool in the LULC changes assessment at the basin scale, as they allow for producing reliable data over relatively large areas, reducing the time and the costs of the analysis [41,42,43,44,45,46,47]. Furthermore, the produced data can be handled and analyzed at different scales, e.g., at the basin, physiographic unit, and LULC class scale. The analysis at the physiographic unit scale allows for a better understanding of the LULC changes pattern, i.e., the types, amounts, and distribution of the LULC changes in plains, hilly, and mountainous areas [1]. On the other hand, the analysis at the LULC class scale, i.e., based on the comparison of a given LULC class extension at different dates, provides further insights on the effective amounts of the detected LULC changes [48].
Notwithstanding the above-discussed importance of the LULC changes analysis at the basin scale in a desertification-prone and agricultural territory such as Southern Italy, this kind of study is currently almost entirely missing in this area. In this framework, a very recent paper by Magliulo et al. [49] represents the only example of multidecadal land-use changes analysis in a relatively wide river basin of Southern Italy, i.e., the Sele River basin. Other papers mainly focused on small- [50,51] and medium-sized [22,52] basins, often considering relatively short time spans (e.g., 20–30 years) and with a main focus on land-use changes implications on floods and river sediment load. Thus, almost all the largest river basins of Southern Italy remain uninvestigated from the viewpoint of the multidecadal LULC changes.
This study attempts to contribute to filling this gap by analyzing the LULC changes that occurred in an inner landscape of Southern Italy, i.e., the Calore River basin (Figure 1), between 1960 and 2018. The investigated period was split into two sub-periods, approximately 30-years long (i.e., 1960–1990 and 1990–2018), and a GIS-aided LULC changes analysis was conducted at the basin, physiographic unit, and LULC class scale. In comparison to previous studies, we then interpreted LULC changes data in terms of variations of soil protection against erosion, with the aim to reconstruct a first approximation scenario of LULC-induced variations in soil erosion in the investigated period. We discussed the reliability of such a scenario by comparing it with the pre-existing literature about short-term river channel adjustments in the study area.

2. Materials and Methods
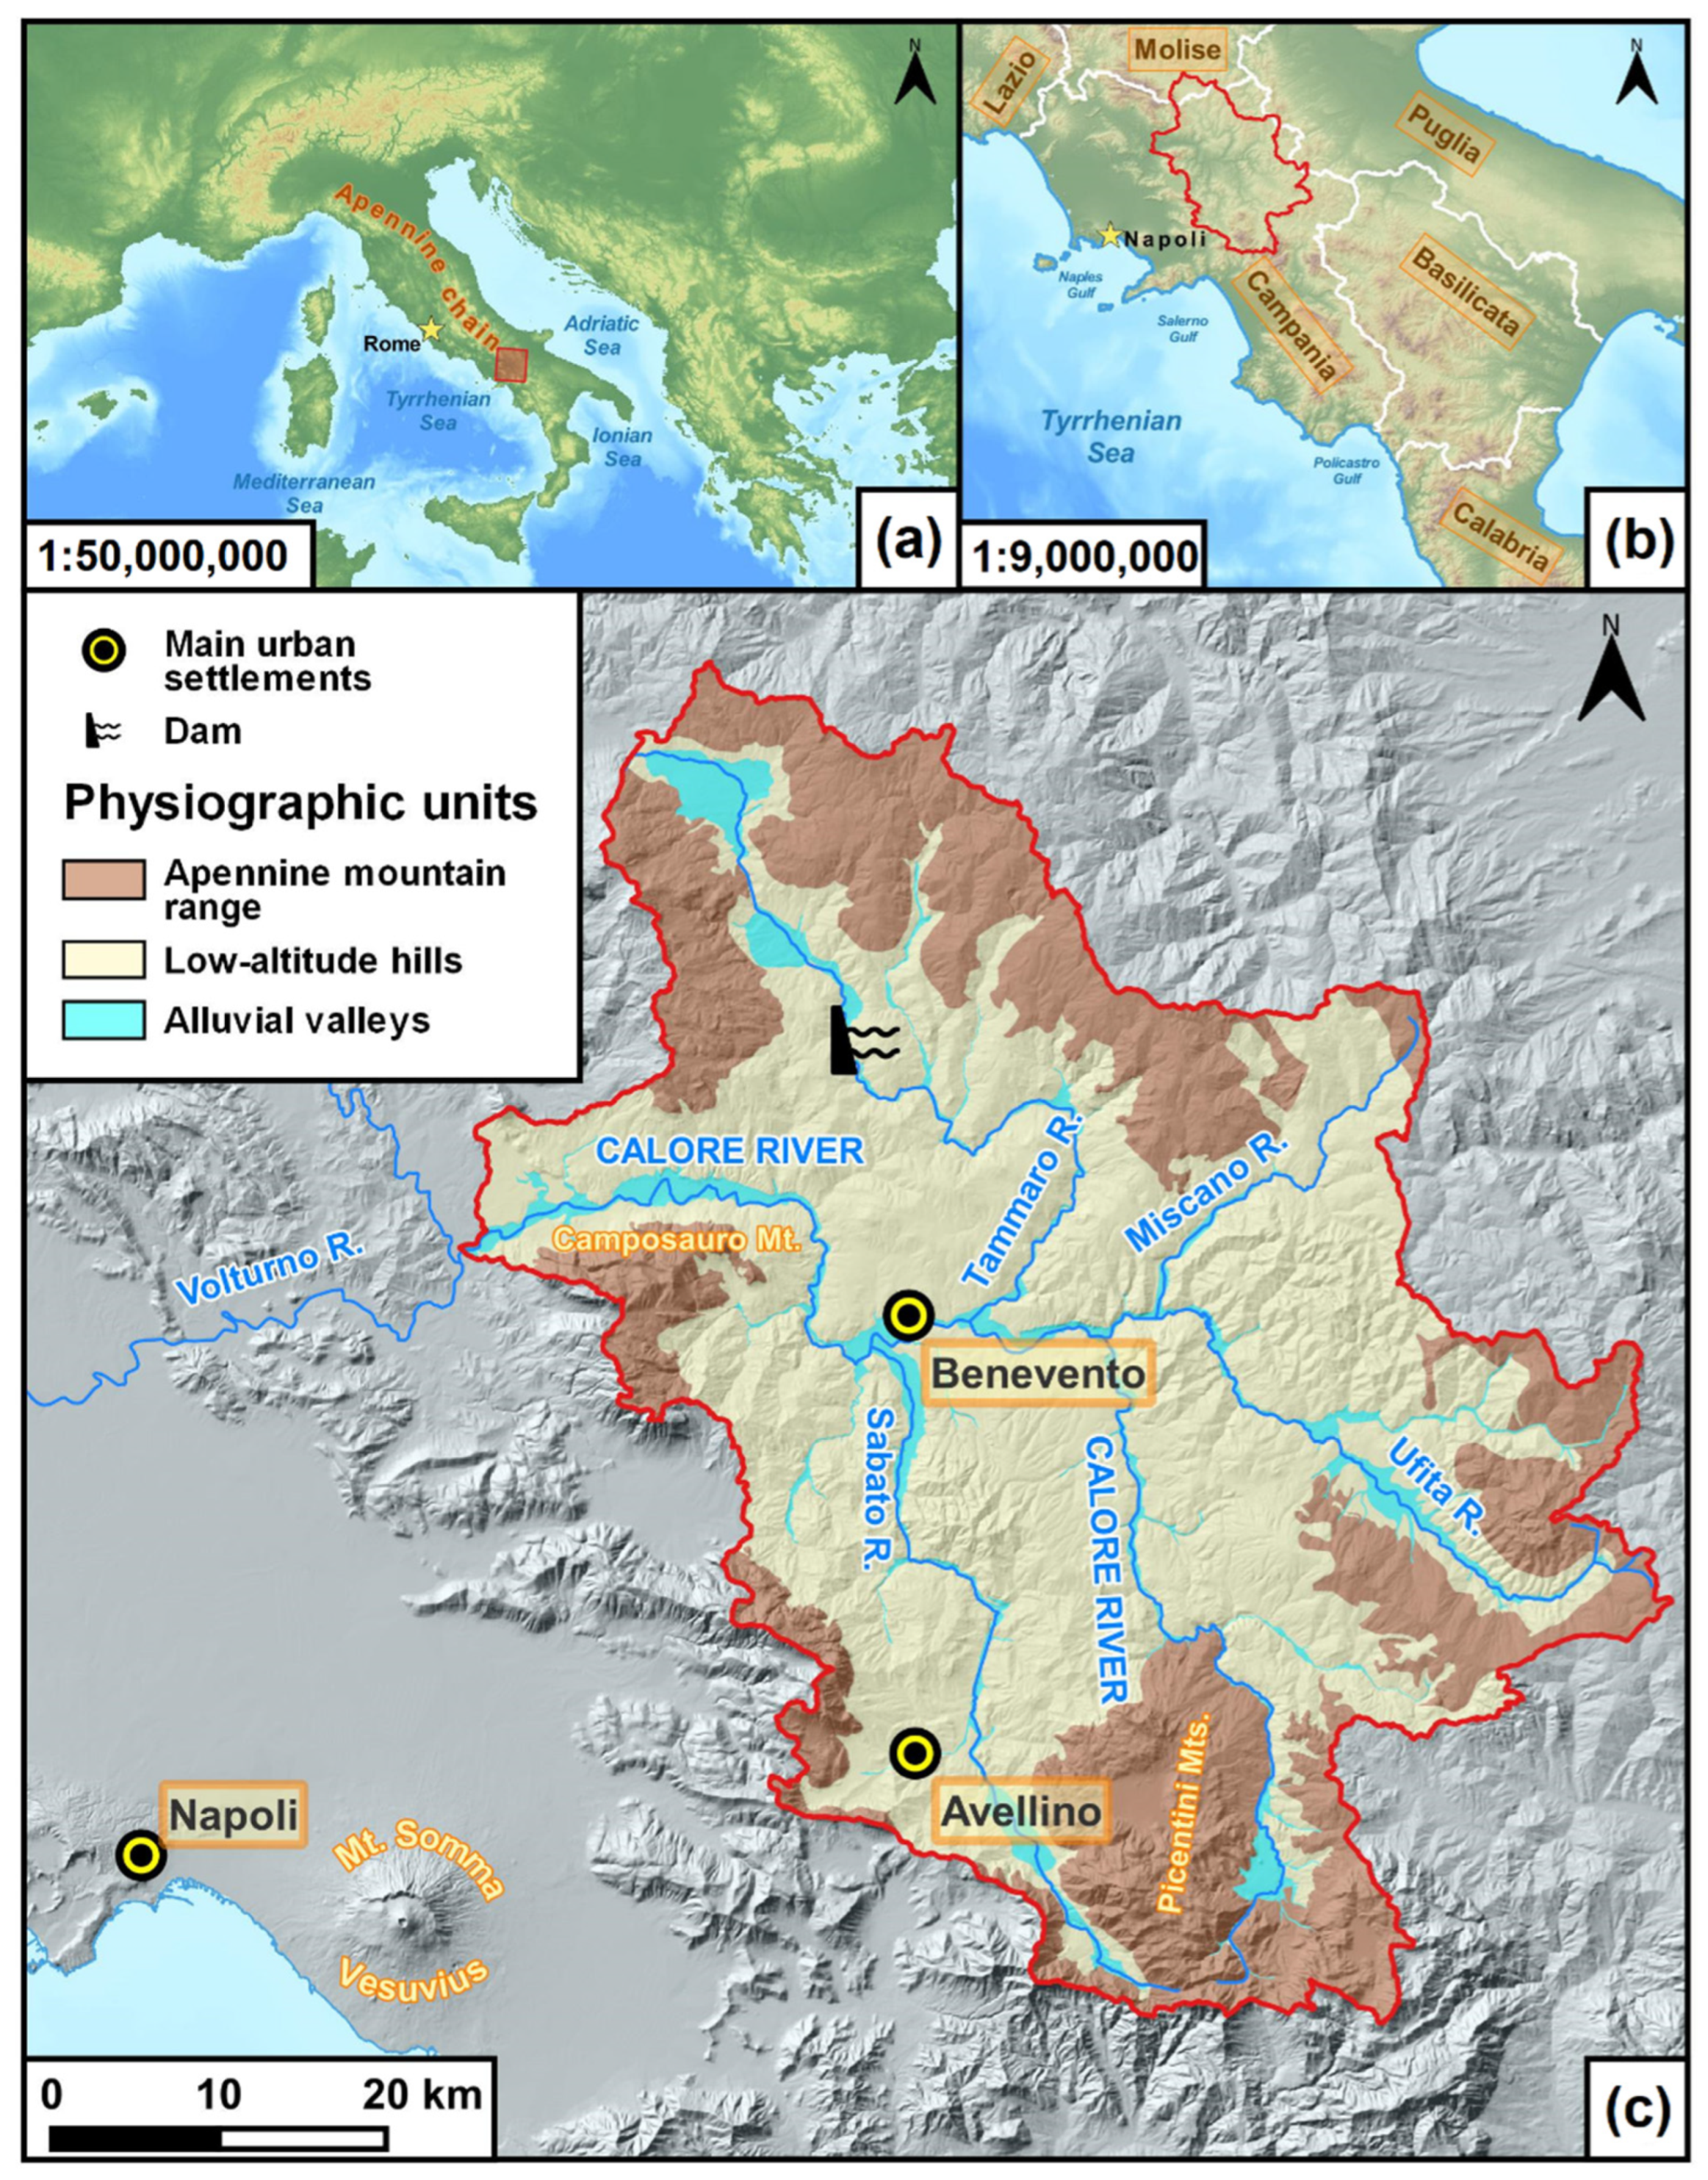
2.1. Study Area

The Calore River basin is located in the inner part of Southern Italy, in the axial sector of the Apennines Mountains chain (Figure 1). It is situated between 41°30′ N and 40°46′ N latitude and 14°27′ E and 15°20′ E longitude. The surface area is 3037 km2. Altitude ranges between 55 m a.s.l. and 1810 m a.s.l. [53].
The climate of the study area [54] is of a Mediterranean type, with prolonged warm and dry summers and wet and mild winters. Mean annual precipitation ranges from 650 to 2000 mm, with an average of 1289 mm. Rainfall erosivity ranges from 900 to 4119 MJ mm ha−1 h−1 year−1.
According to the method proposed by Rinaldi et al. [55], the Calore River basin can be subdivided into three main physiographic units, i.e., (i) the Apennine Mountain range (hereinafter, AMR), (ii) the low-altitude hills (LAH), and (iii) the alluvial valleys (AV) (Figure 1).
From a geological standpoint, the AMR physiographic unit is mainly shaped into limestone and dolomitic limestone, Jurassic- to Cretaceous-aged [56]. In contrast, LAH physiographic unit has a terrigenous bedrock, consisting of claystone, marl, sandstone, conglomerate, and detrital limestone, mainly Miocene to Pliocene in age [57]. Finally, the AV physiographic unit includes a series of morphostructural depressions in which the main rivers flow (i.e., Calore, Sabato, Tammaro, and Ufita Rivers). These valleys are infilled with alluvial, volcanic, and slope deposits [58,59,60].
Steep slopes of tectonic origin dominate the geomorphology of the AMR physio-graphic unit. Tributary streams deeply dissect these slopes, often shaping triangular or pentagonal facets. At the top of the slopes, karstified and gently sloping remnants of ancient erosional landscapes are present [61]. In contrast, the slopes of the reliefs of the LAH physiographic unit are generally gently sloping and gently rolling, except where more cemented lithotypes crop out, and are affected by severe water erosion and mass movements [58,59]. Rill networks, gullies, and landslide scars are the most widespread soil erosion landforms, while badlands are very rare and occur only on the northeastern side of the upper Ufita River valley (see Figure 1 for location). The morphological connection between the reliefs and the AV physiographic unit consists of alluvial and slope deposits, often arranged into coalescent or telescopically arranged alluvial fans, or both, or which form scree talus [62]. Different orders of Quaternary-aged alluvial terraces characterize the main alluvial valleys. Locally, structural terraces shaped into pyroclastic deposits (i.e., Campanian Ignimbrite) and travertines are present [58].
The soils occurring in the basin generally show deep morphological, chemical, and physical similarities with the underlying parent materials [63]. Over clayey deposits, Vertisols (sensu [64]) are the dominant pedotypes; over sandstones, Entisols and Inceptisols predominate; over carbonates, Mollisols and Inceptisols occur; over pyroclastic deposits, soils with andic soil properties generally develop; finally, over floodplain alluvial deposits, Fluvents and soils of Fluventic subgroups are present.
The Calore River is the main watercourse flowing through the basin. The total length is ~110 km. The mean annual flow discharge, measured at the confluence into the Volturno River, is ~30 m3/s. Between the 1950s and 1990s, an intense in-channel sediment extraction activity affected the Calore River. In-channel sediment extraction was probably one of the main driving factors of the intense narrowing and incision experienced by the river during that period [65]. Another important human disturbance on the hydrographic network of the Calore River basin was the closure, in 2006, of the Campolattaro Dam on the Tammaro River (Figure 1), whose construction started in 1980 [18].
Little is known about the LULC changes experienced by the Calore River basin before the 1960s. However, several studies reported that a diffuse deforestation affected the entire Southern Italy between the middle decades of the nineteenth century and the 1930s [37]. Peaks in such deforestation occurred between the 1870s and 1890s and between the 1900s and the 1930s. Paradoxically, deforestation occurred during a period characterized by a strong emigration that drastically decreased the population density and led to diffuse land abandonment. From the 1930s onwards, Southern Italy experienced both natural and anthropogenic forest expansion, while the use of agricultural machinery became increasingly more frequent [66].

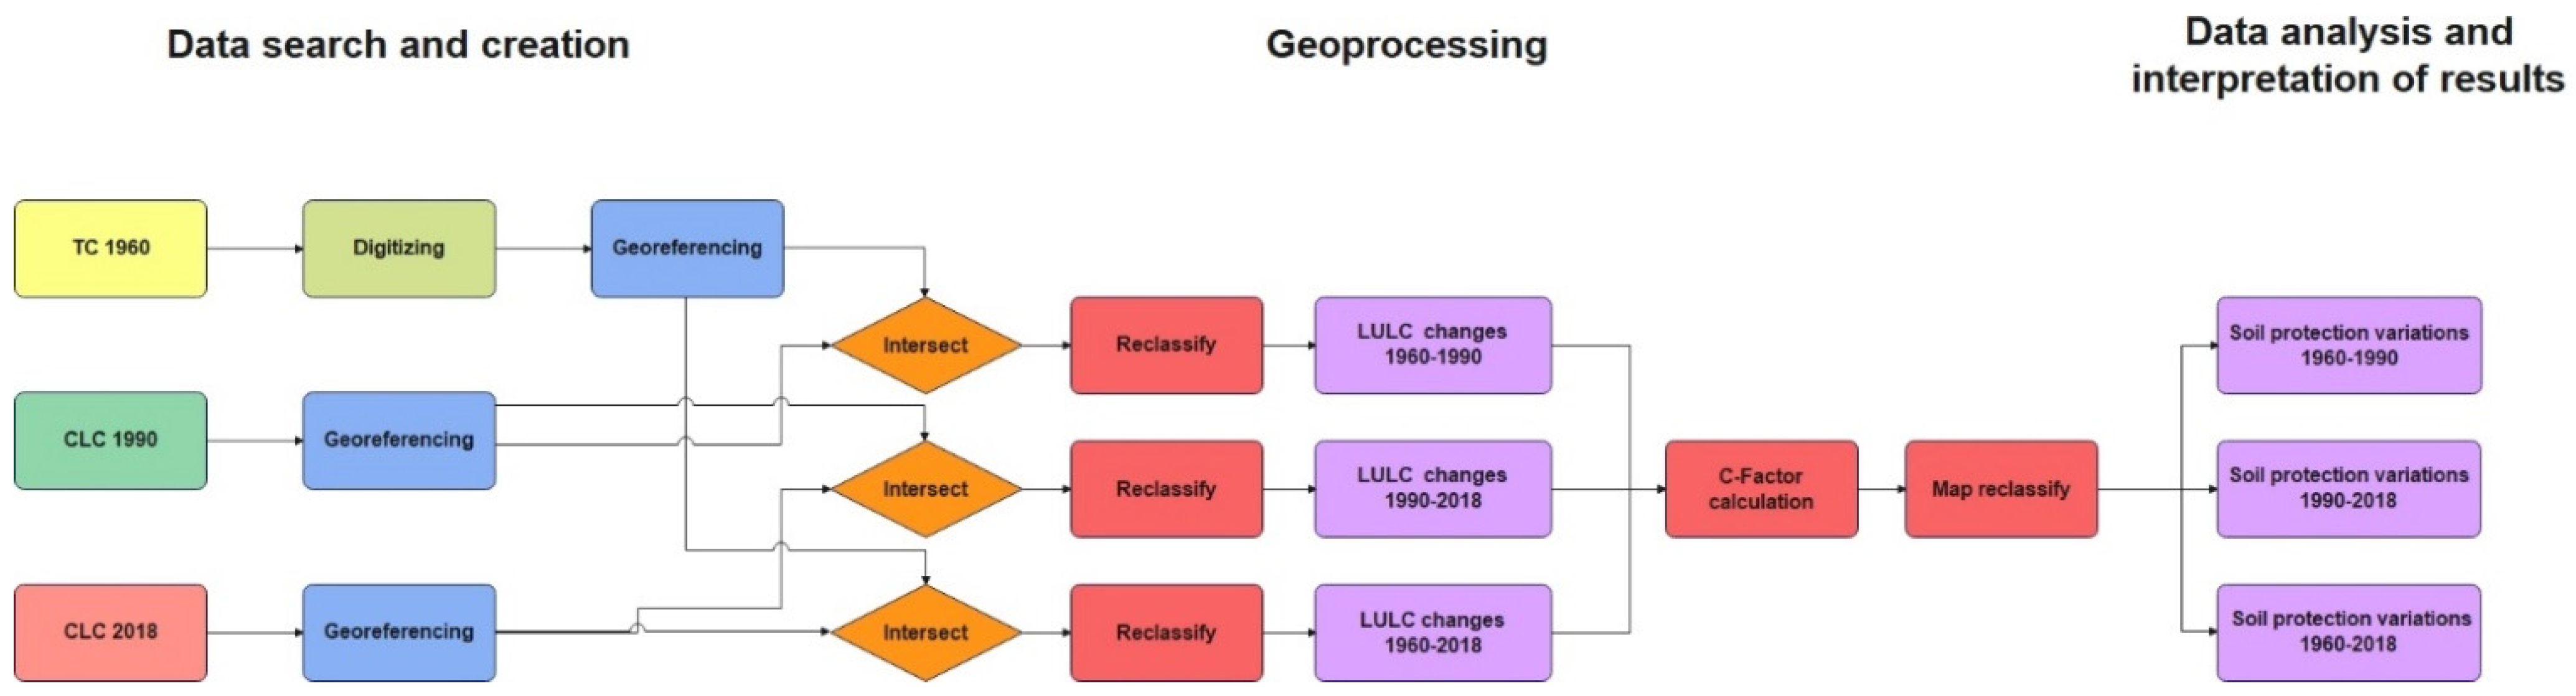
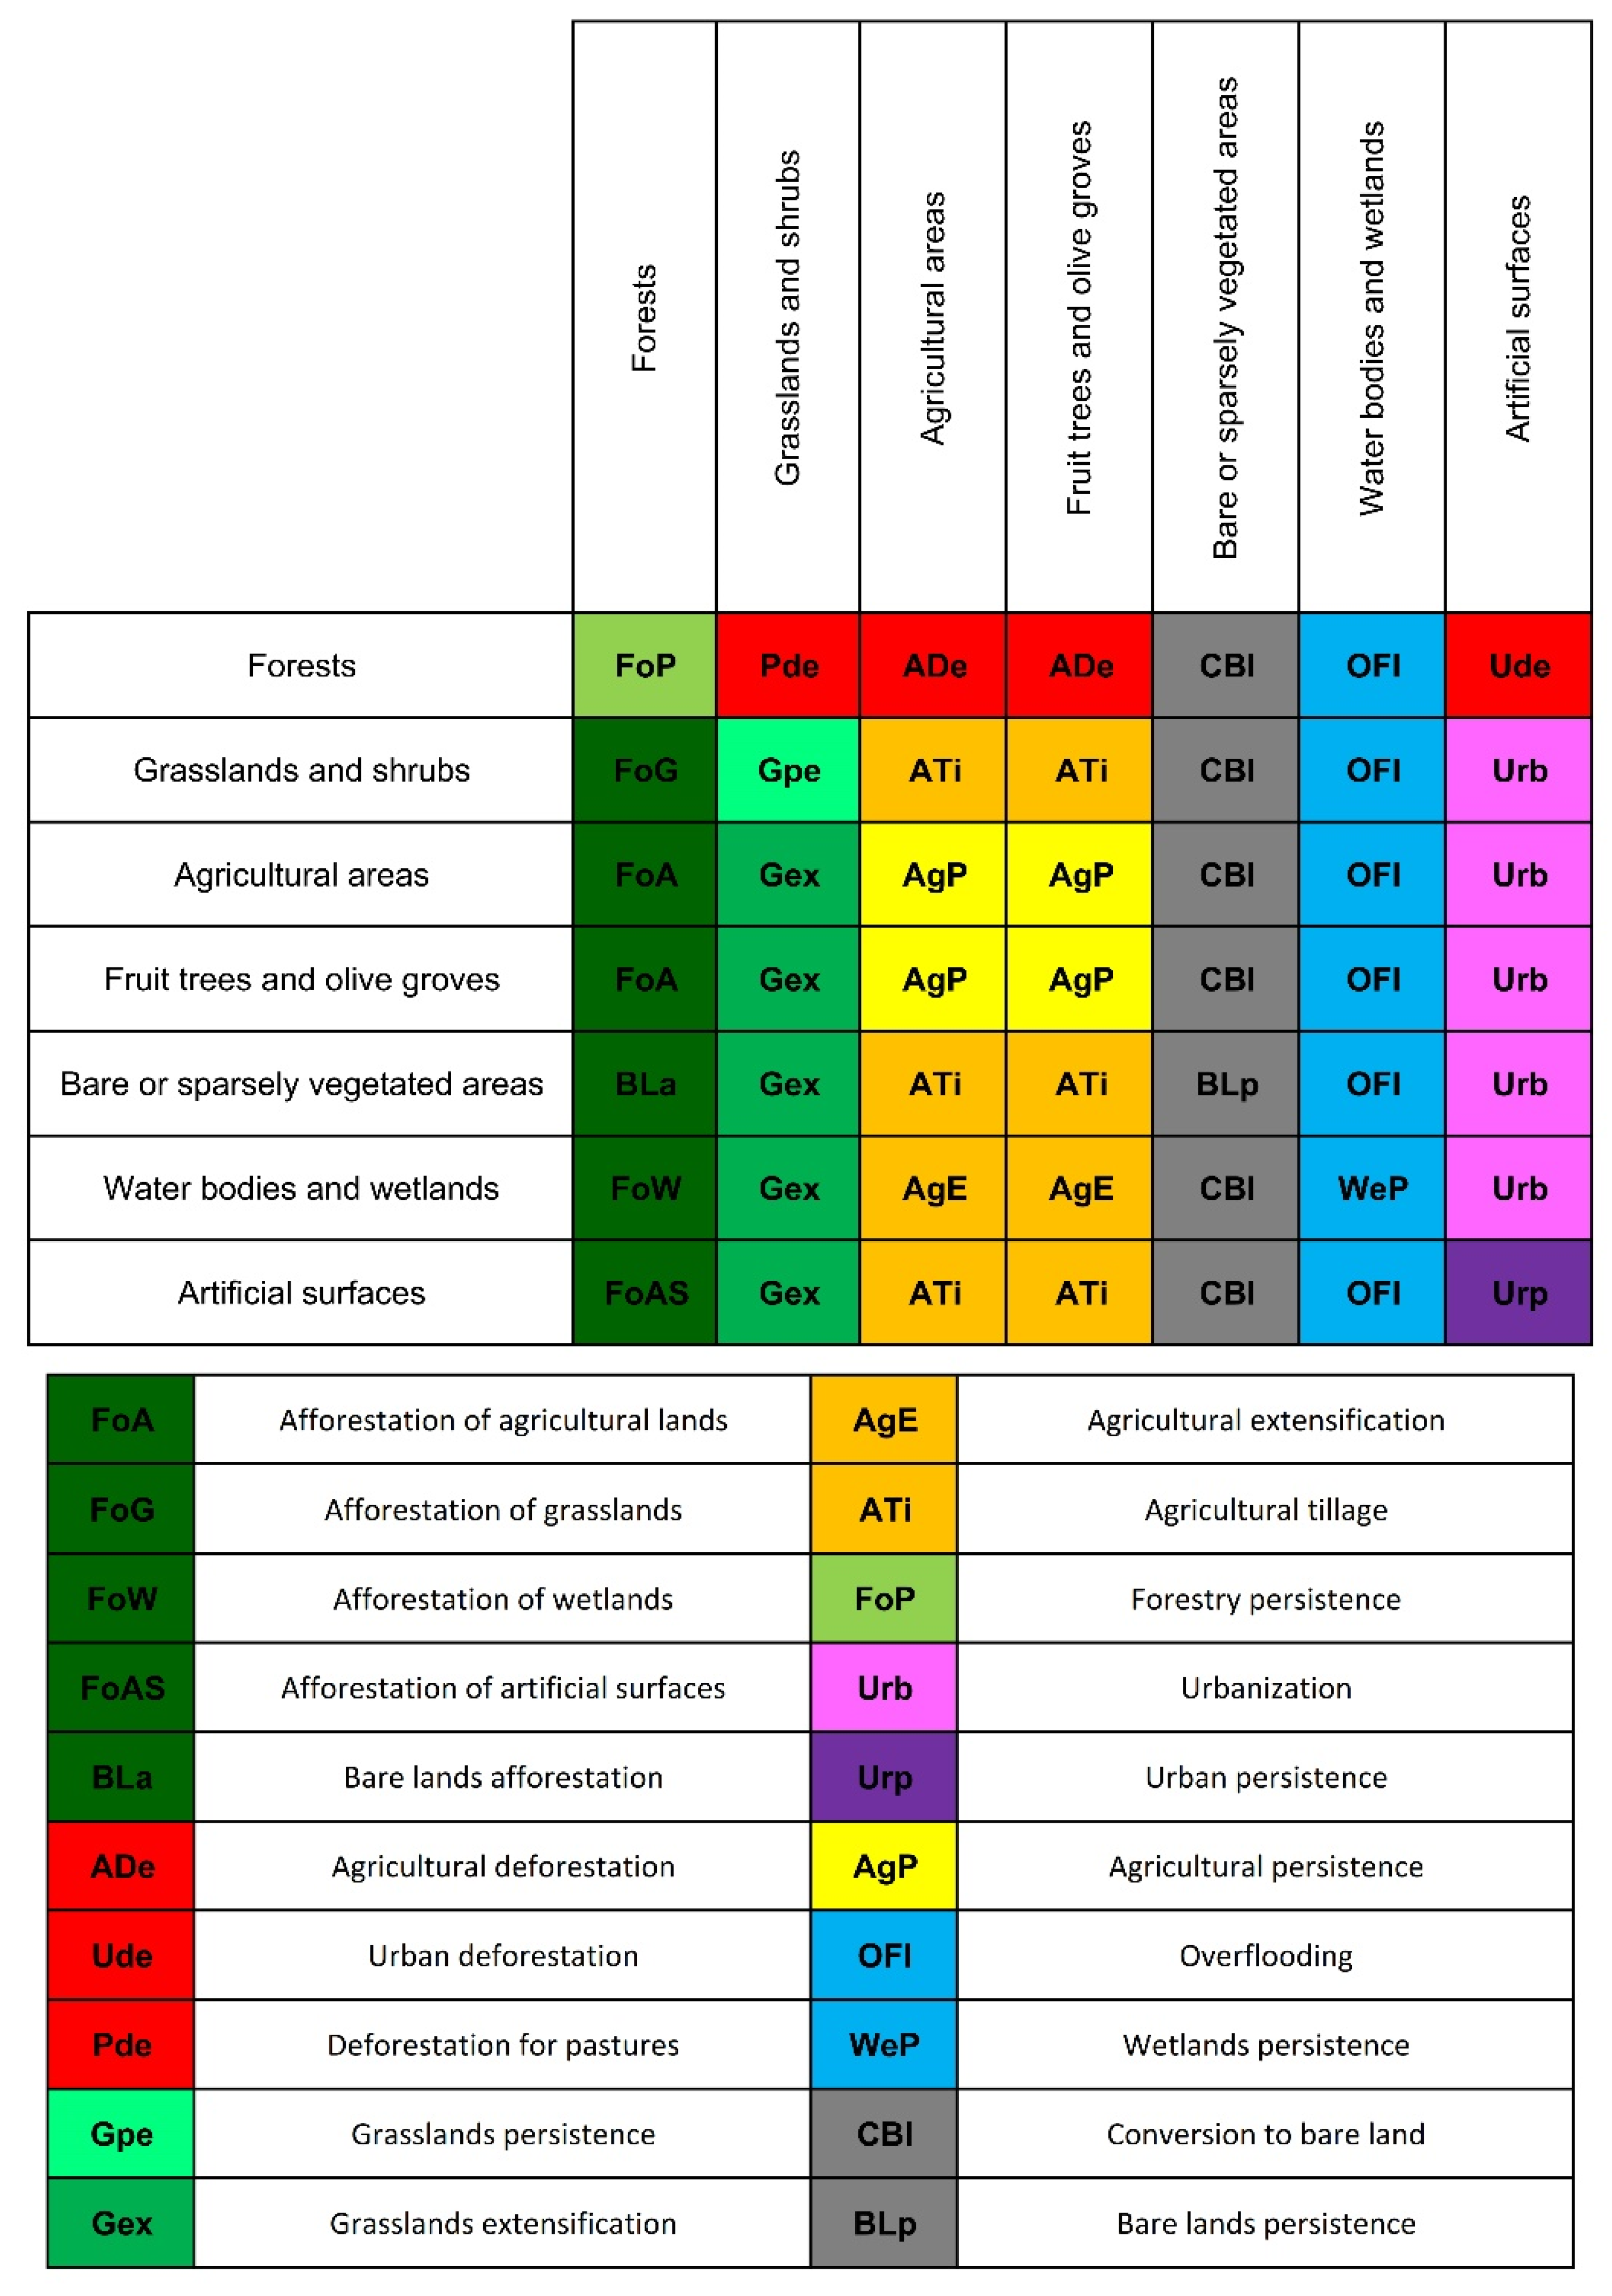
2.2. Data Source and Methodology

With the aim to analyze the LULC changes experienced by the Calore River basin in a period of ~60 years, we selected and compared, in a GIS-environment, three LULC maps.
The first was the Map of Land Cover [67]. The latter graphically summarizes, at a scale of 1:200,000, the land-cover in 1960, as derived from both cadastral data analysis and interpretation of more detailed aerial photos (generally at 1:33,000 scale). The Map of Land Cover was produced by the National Research Council (CNR) and published by the Touring Club (TC). Thus, it will be hereinafter referred to as CNR-TC. In this study, we first scanned the map at 1200 dpi. Then, we conducted a georeferentiation in the UTM-WGS84 coordinate system using the “Georeferencing” functions of the ESRI® (Redlands, CA, USA) ArcGIS 10.4.1 software (Figure 2). Because the map covers the entire Italian territory, we manually digitized the area of the Calore River basin only. We previously digitized the perimeter of the basin in a GIS environment on a base of 1:25,000 topographic maps in raster format, produced by the Italian Geographical Military Institute (IGMI). Finally, we calculated the extension of each polygon we digitized, corresponding to portions of land surfaces with different land uses, by using the “Calculate Geometry” ArcGIS tool.
The second map reported the LULC data for the basin in 1990 and was obtained from Corine Land Cover shapefiles (hereinafter, CLC). We freely downloaded the shapefiles from the website https://land.copernicus.eu/pan-european/corine-land-cover/clc-1990 (accessed on 25 February 2022) [68]. The shapefiles were georeferenced in UTM-WGS84, zone 32N, so we used the “Georeferencing” functions of ArcGIS software to re-project the shapefile in the UTM-WGS84 coordinate system, zone 33N (Figure 2). The nominal scale was 1:100,000, thus comparable with the scale of the CNR-TC Map of Land Cover [67]. As well as the previous map, this second map was also clipped based on the previously digitized perimeter of the Calore River basin.
The third map synthesized the CLC data for the Calore River basin in 2018. As well as the map from 1990, we freely downloaded the shapefiles from https://land.copernicus.eu/pan-european/corine-land-cover/clc2018 (accessed on 25 February 2022) website [69]. The nominal scale of the map was 1:100,000. We performed the same georeferentiation, clipping, and digitation procedures in the GIS environment, described for the 1990 map (Figure 2).
Due to some differences in LULC classes between the Map of Land Cover [67] and the two maps derived from CLC data [68,69], we conducted a harmonization of such classes, based on their description in the respective legends. As additional criterion, we used the different response of the LULC classes to soil erosion processes [49], widely accepted in the scientific literature ([3,70], and references therein). Due to the different scopes, years, and methods of production between CNR-TC and CLC maps, harmonization was mainly possible at the third level of the Corine Land Cover. Following the suggestions by Falcucci et al. [1], we reduced the former number of classes and defined a few new classes that represented markedly distinct land-use types, with the aim to reduce uncertainties in the LULC changes assessment. In this framework, we defined seven broad LULC classes: agricultural areas, forests, wetlands and water bodies, artificial surfaces, fruit trees and olive groves, grasslands and pastures, and bare or sparsely vegetated areas. Table 1 reports, in detail, the harmonization between the LULC classes of the two “systems”, i.e., CNR-TC and CLC.
We then conducted two-by-two GIS-aided intersections between the above-described land-use maps (Figure 2). The intersection produced polygons representing areas that experienced LULC changes or persistence. We labelled each polygon, i.e., each LULC change or persistence, according to Di Gennaro et al. [48] and Magliulo et al. [49] (see Section 3.1). Finally, we calculated the extension of each polygon by means of the “Calculate Geometry” ArcGIS® tool.
Because of the deep influence of LULC changes on soil protection against erosion ([3,70]; and references therein), we interpreted the detected LULC changes in terms of increase and decrease in soil protection. In particular, it is known that the land-cover types C-factors of the USLE equation [71] quantitatively express the soil loss due to diffuse water erosion from a standard plot with a given land-cover by the soil loss from a bare standard plot.
In other words, it expresses the different degree of soil protection against diffuse water erosion of the different land-cover types. The higher the C-factor, the lower the soil protection [66]. In the paper by Panagos et al. [29], the C-factors for each CLC land-use class were estimated in the entire European Union (EU), using pan-European datasets. According to the harmonization reported in Table 1, we assigned a C-factor to each LULC class used in this study. Such a C-factor was the average of the C-factors estimated by Panagos et al. [29] for the CLC land-use classes comprised in each broader class used in this study (Table 1). Accordingly, we ordered the LULC classes used in this study in terms of decreasing “degree of protection” of soil against water erosion, i.e., in terms of increasing C-factor.
Finally, we classified each type of LULC change (e.g., afforestation, deforestation, agricultural extensification, and so on) in terms of increase or decrease in soil protection (Figure 2). For example, we assigned to the class of highest increase in soil protection (i.e., “very high increase” class) the LULC change from the “less protective” LULC class (i.e., bare or sparsely vegetated areas, with the highest C-factor) to the “most protective” class (i.e., forests, with the lowest C-factor).

3. Results

Figure 3 shows the spatial distribution of the LULC classes in the Calore River basin in the considered years. Figure 4 compares the percentages of the total surface of both the entire study area and the physiographic units occupied by the different LULC classes in the considered years. Finally, Table 2 shows the extension of each LULC class in the considered years and the areal variations in the different periods.
Both Figure 3 and Figure 4 clearly show the strong agricultural vocation of the studied area. The latter was particularly well expressed in 1960, when more than 80% of the total surface was used for agriculture (i.e., “agricultural areas” and “fruit trees and olive groves” land-use classes). This percentage decreased to ~68% in both 1990 and 2018. In all the considered years, agriculture was mainly concentrated along the alluvial valleys (AV) and on low-altitude hills (LAH) (Figure 4b,c). In contrast, in the Apennine Mountain range (AMR), areas used for agriculture accounted for about 50% of the physiographic unit extension and were coupled with significant percentages of forests (ranging from 23.2% in 1960 to 39.2% in 1990; Figure 4d) and, to a lesser extent, grasslands and shrubs (ranging from 9.7% in 2018 to 13.1% in 1960).
The geoprocessing in the GIS environment of the LULC maps shown in Figure 3 highlighted a series of LULC changes summarized in Figure 5, the latter modified from Di Gennaro et al. [48] and Magliulo et al. [49]. Figure 6 shows the spatial distribution of these changes in the study area, while Figure 7 reports their amount in terms of percentage of the total surface and associated variations. Such LULC changes at the basin, physiographic unit, and LULC classes scale will be described below.

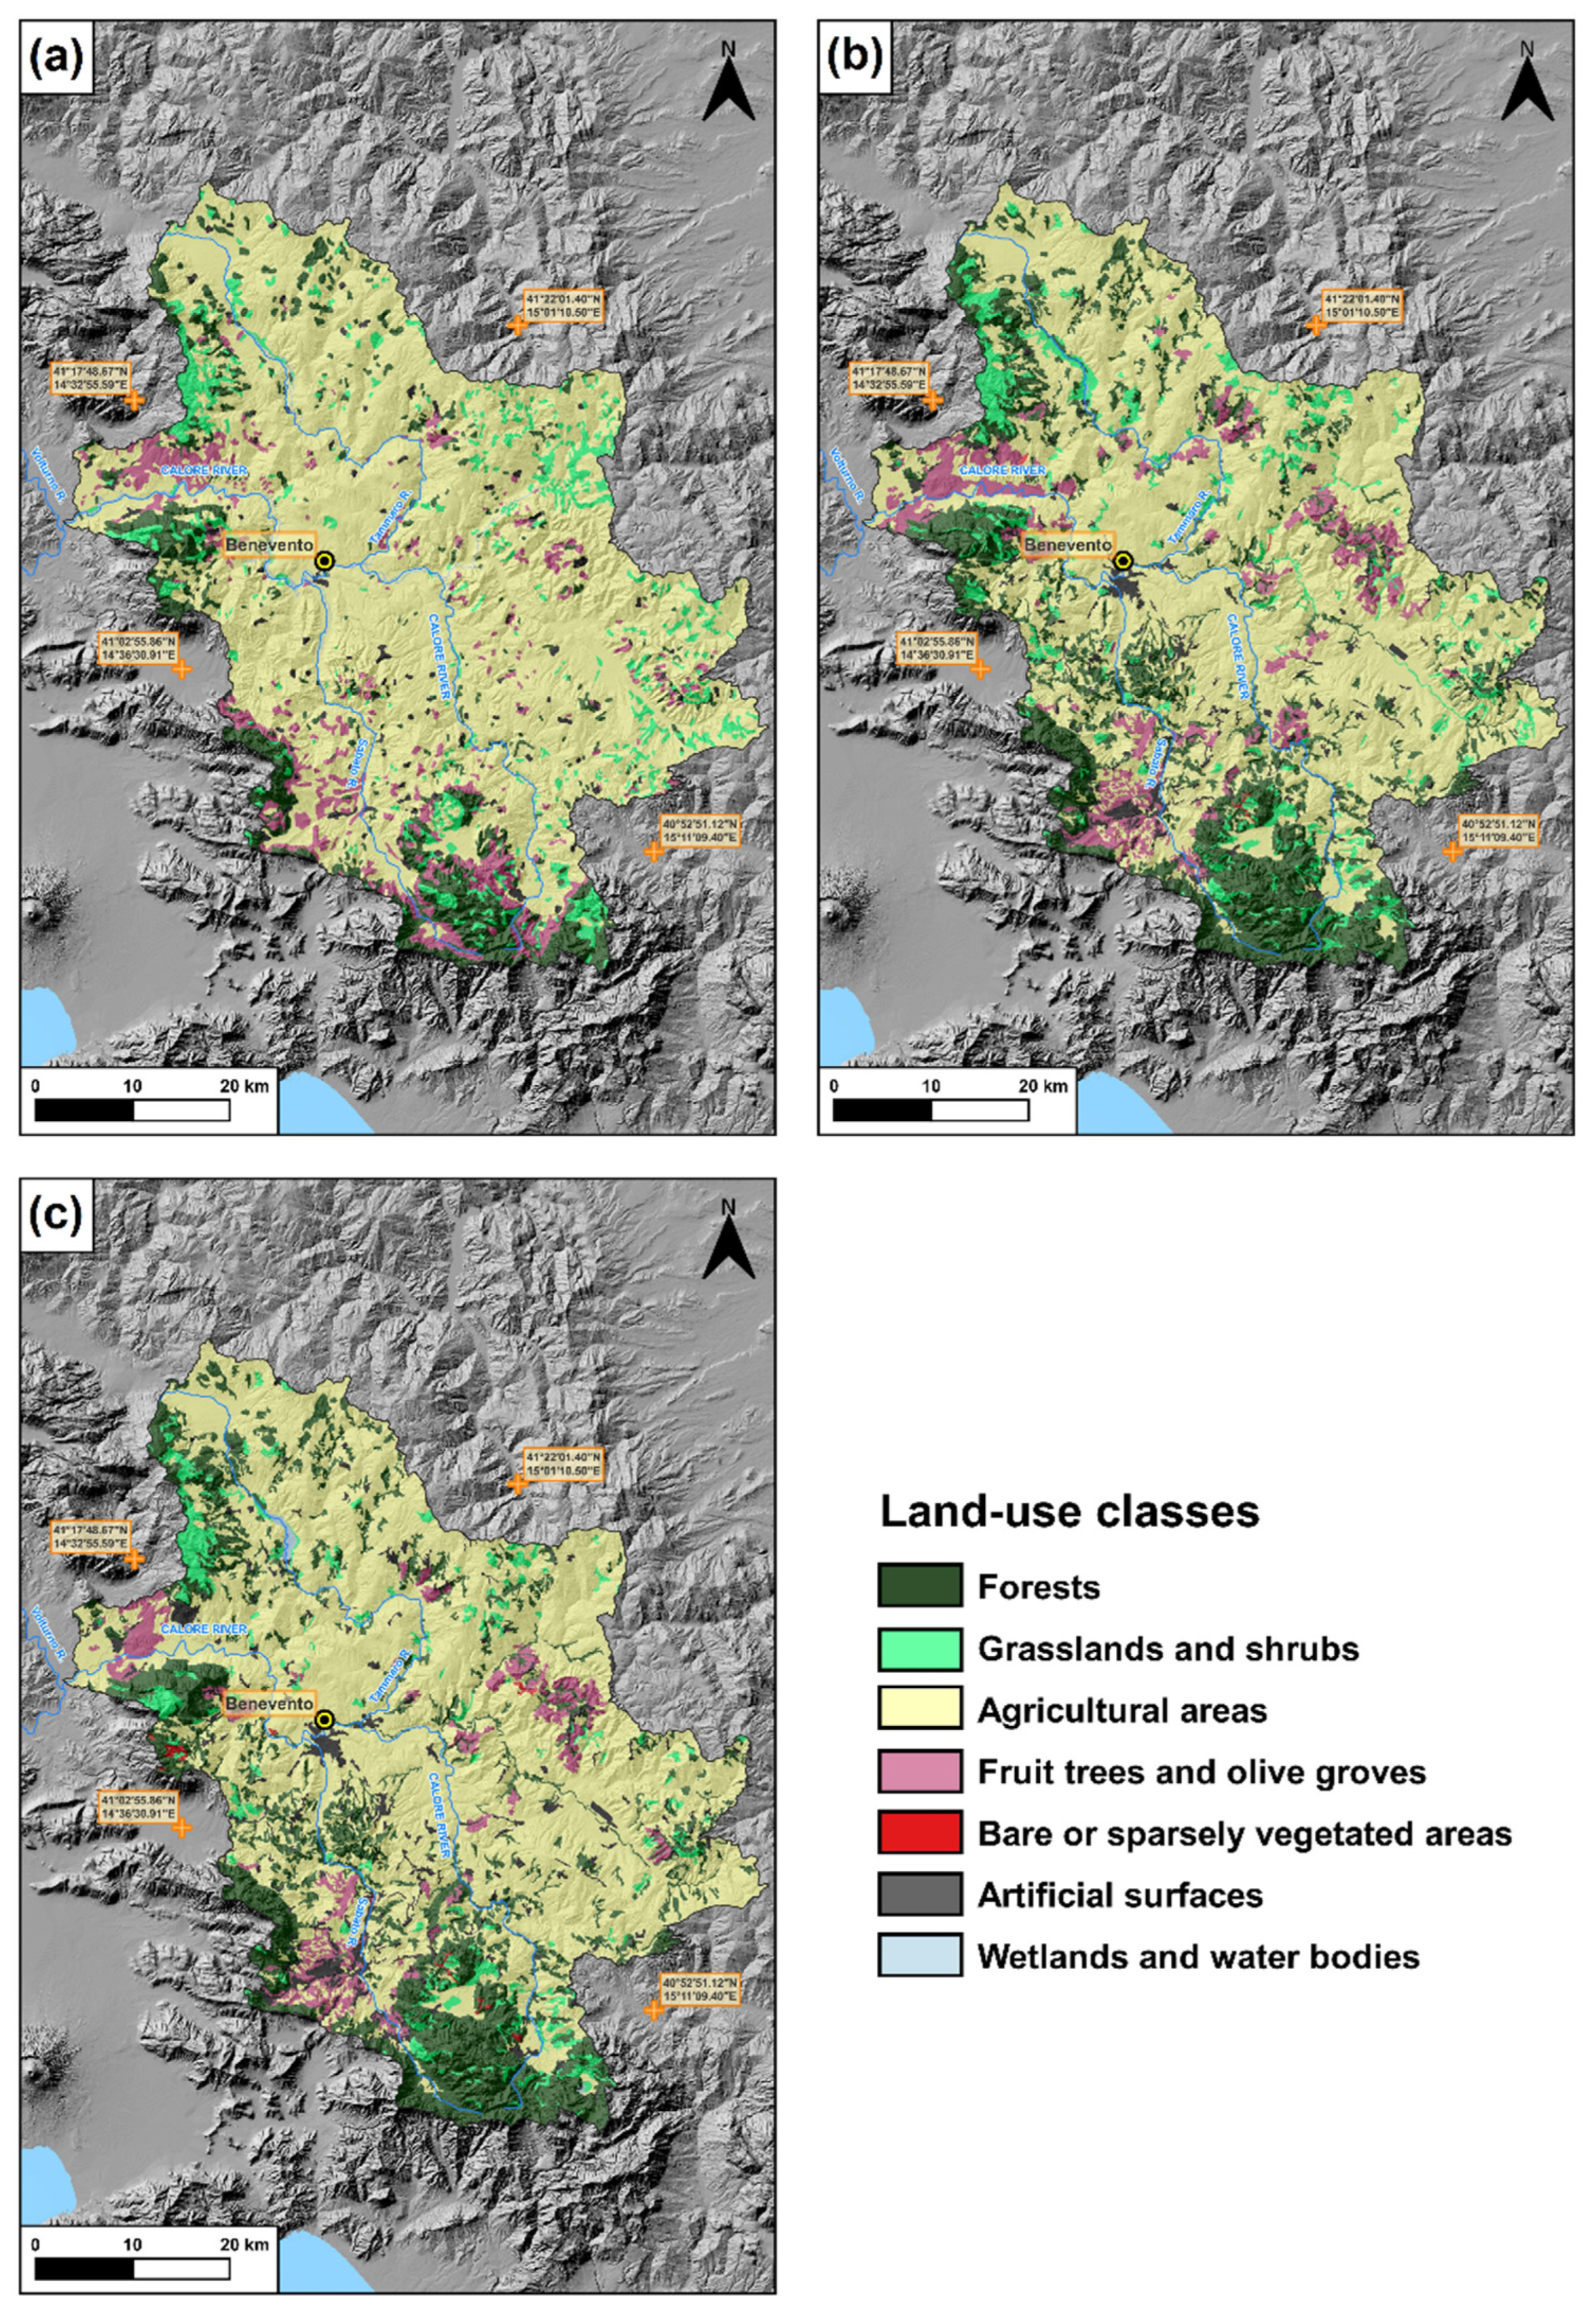
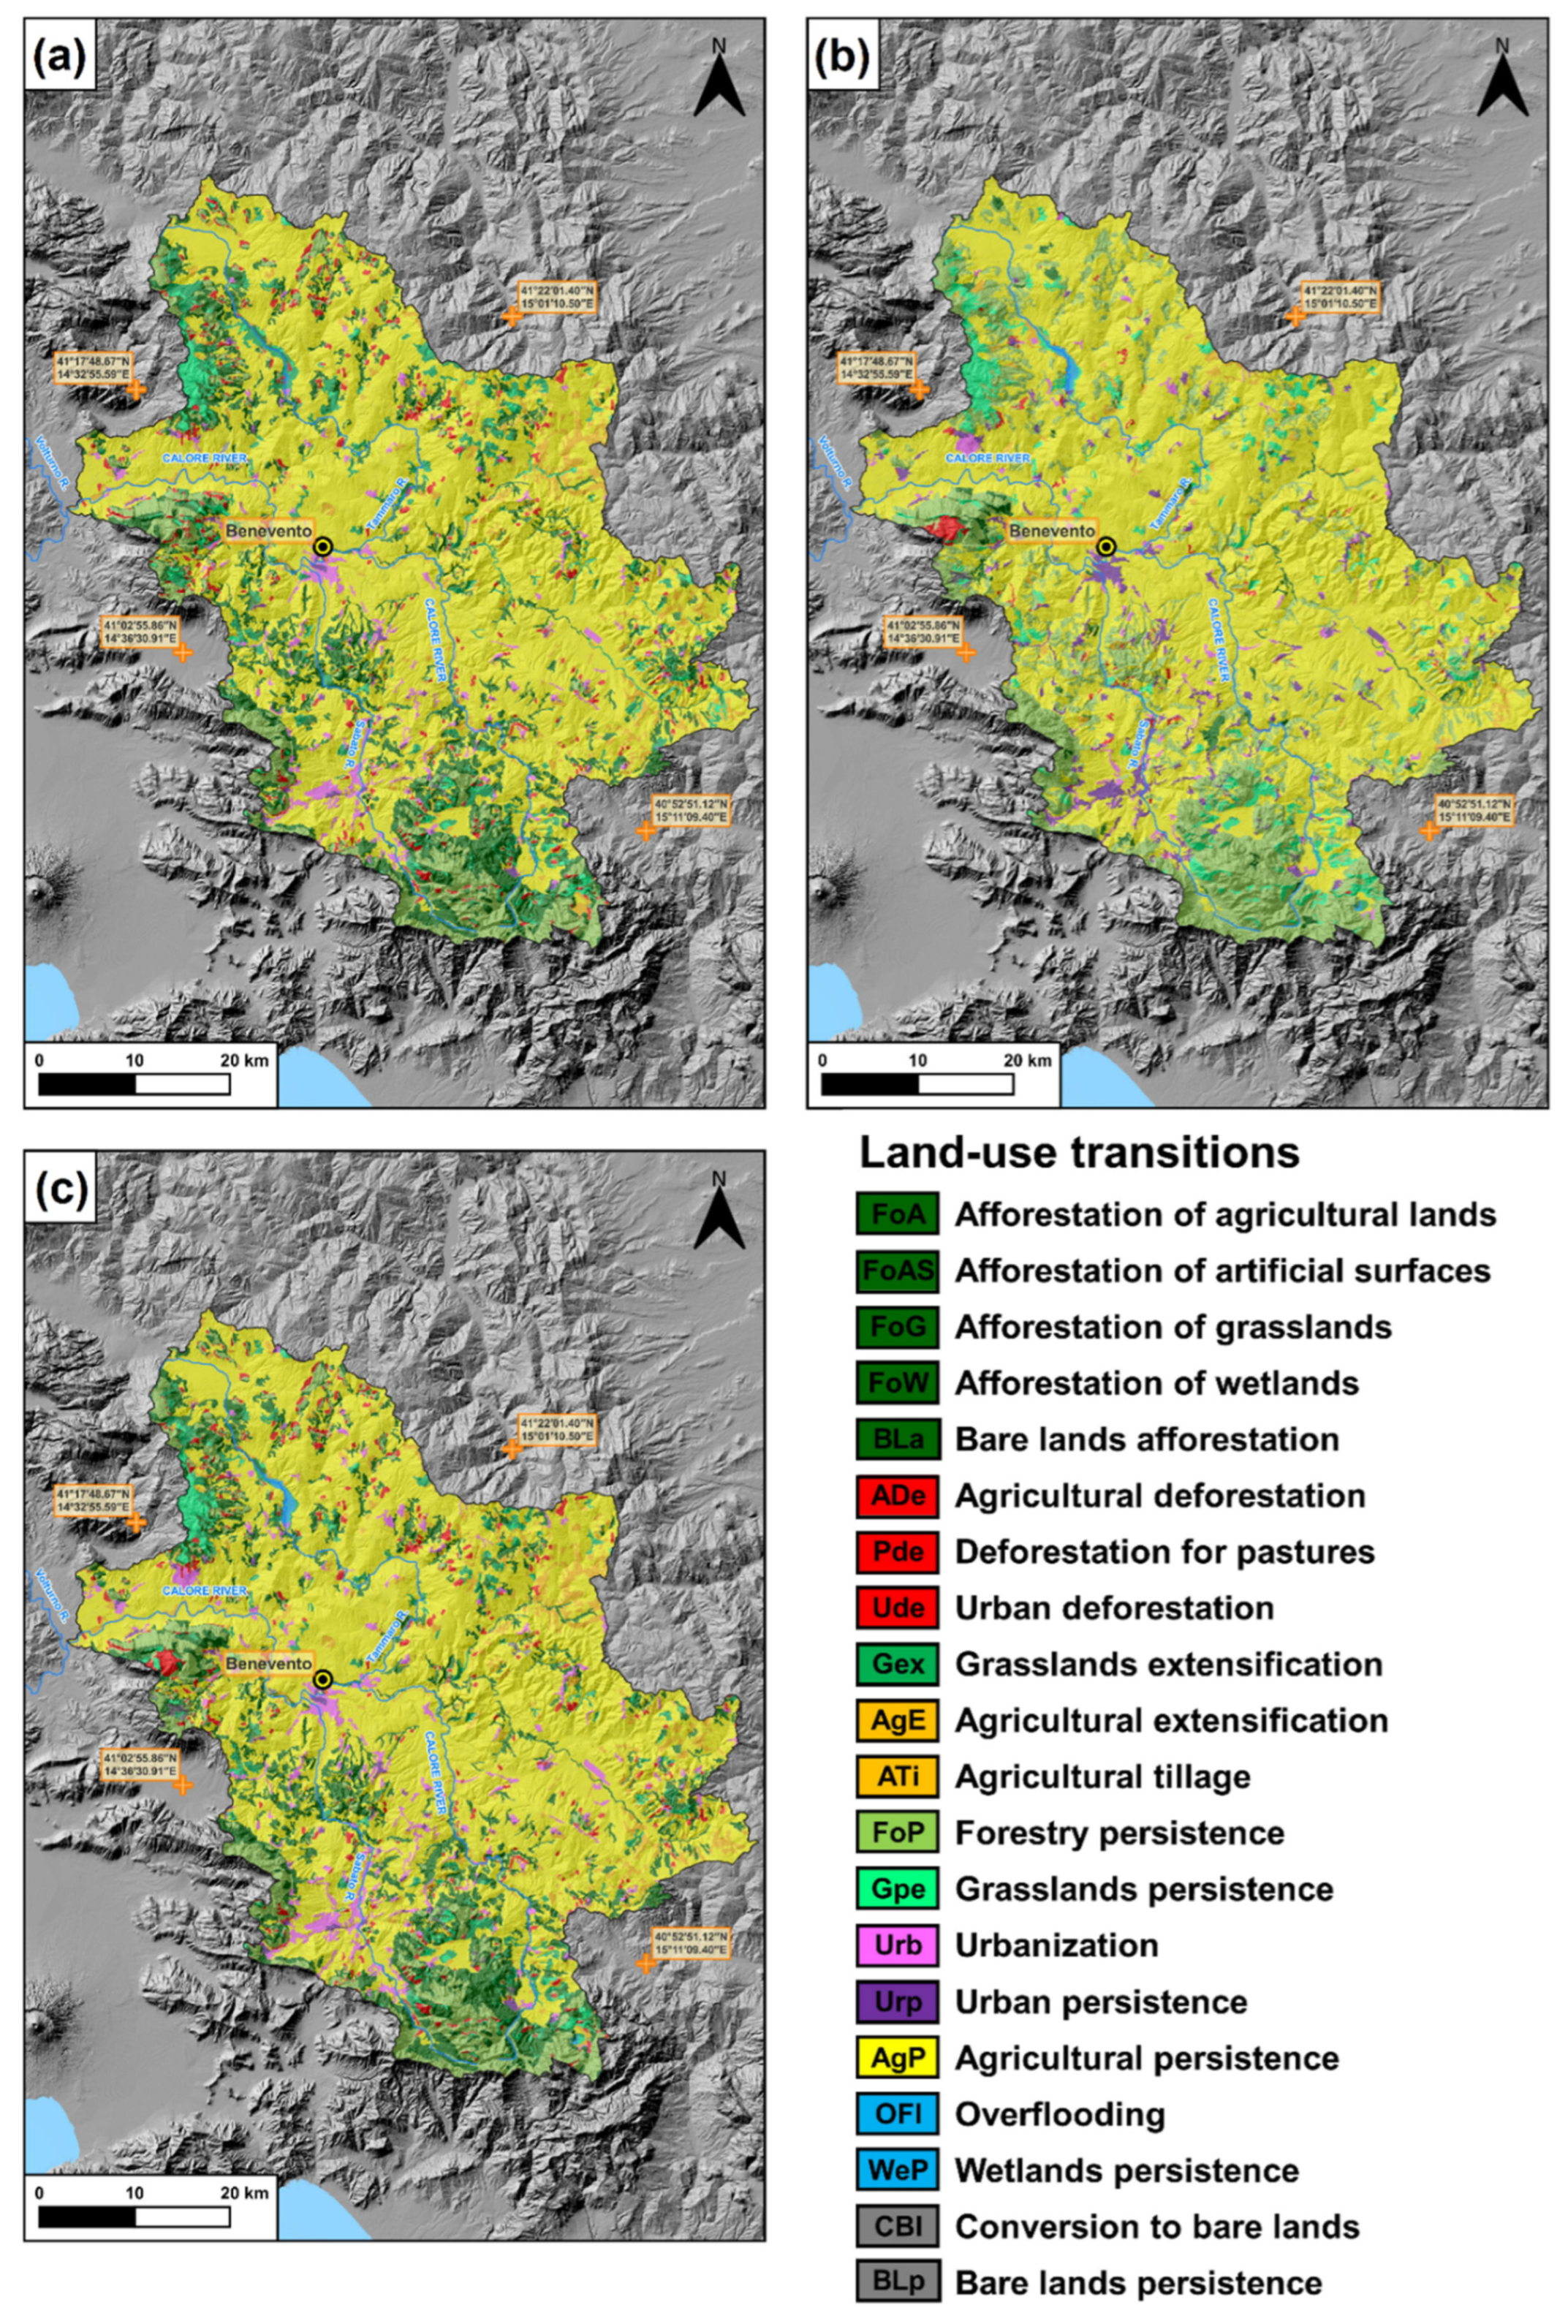
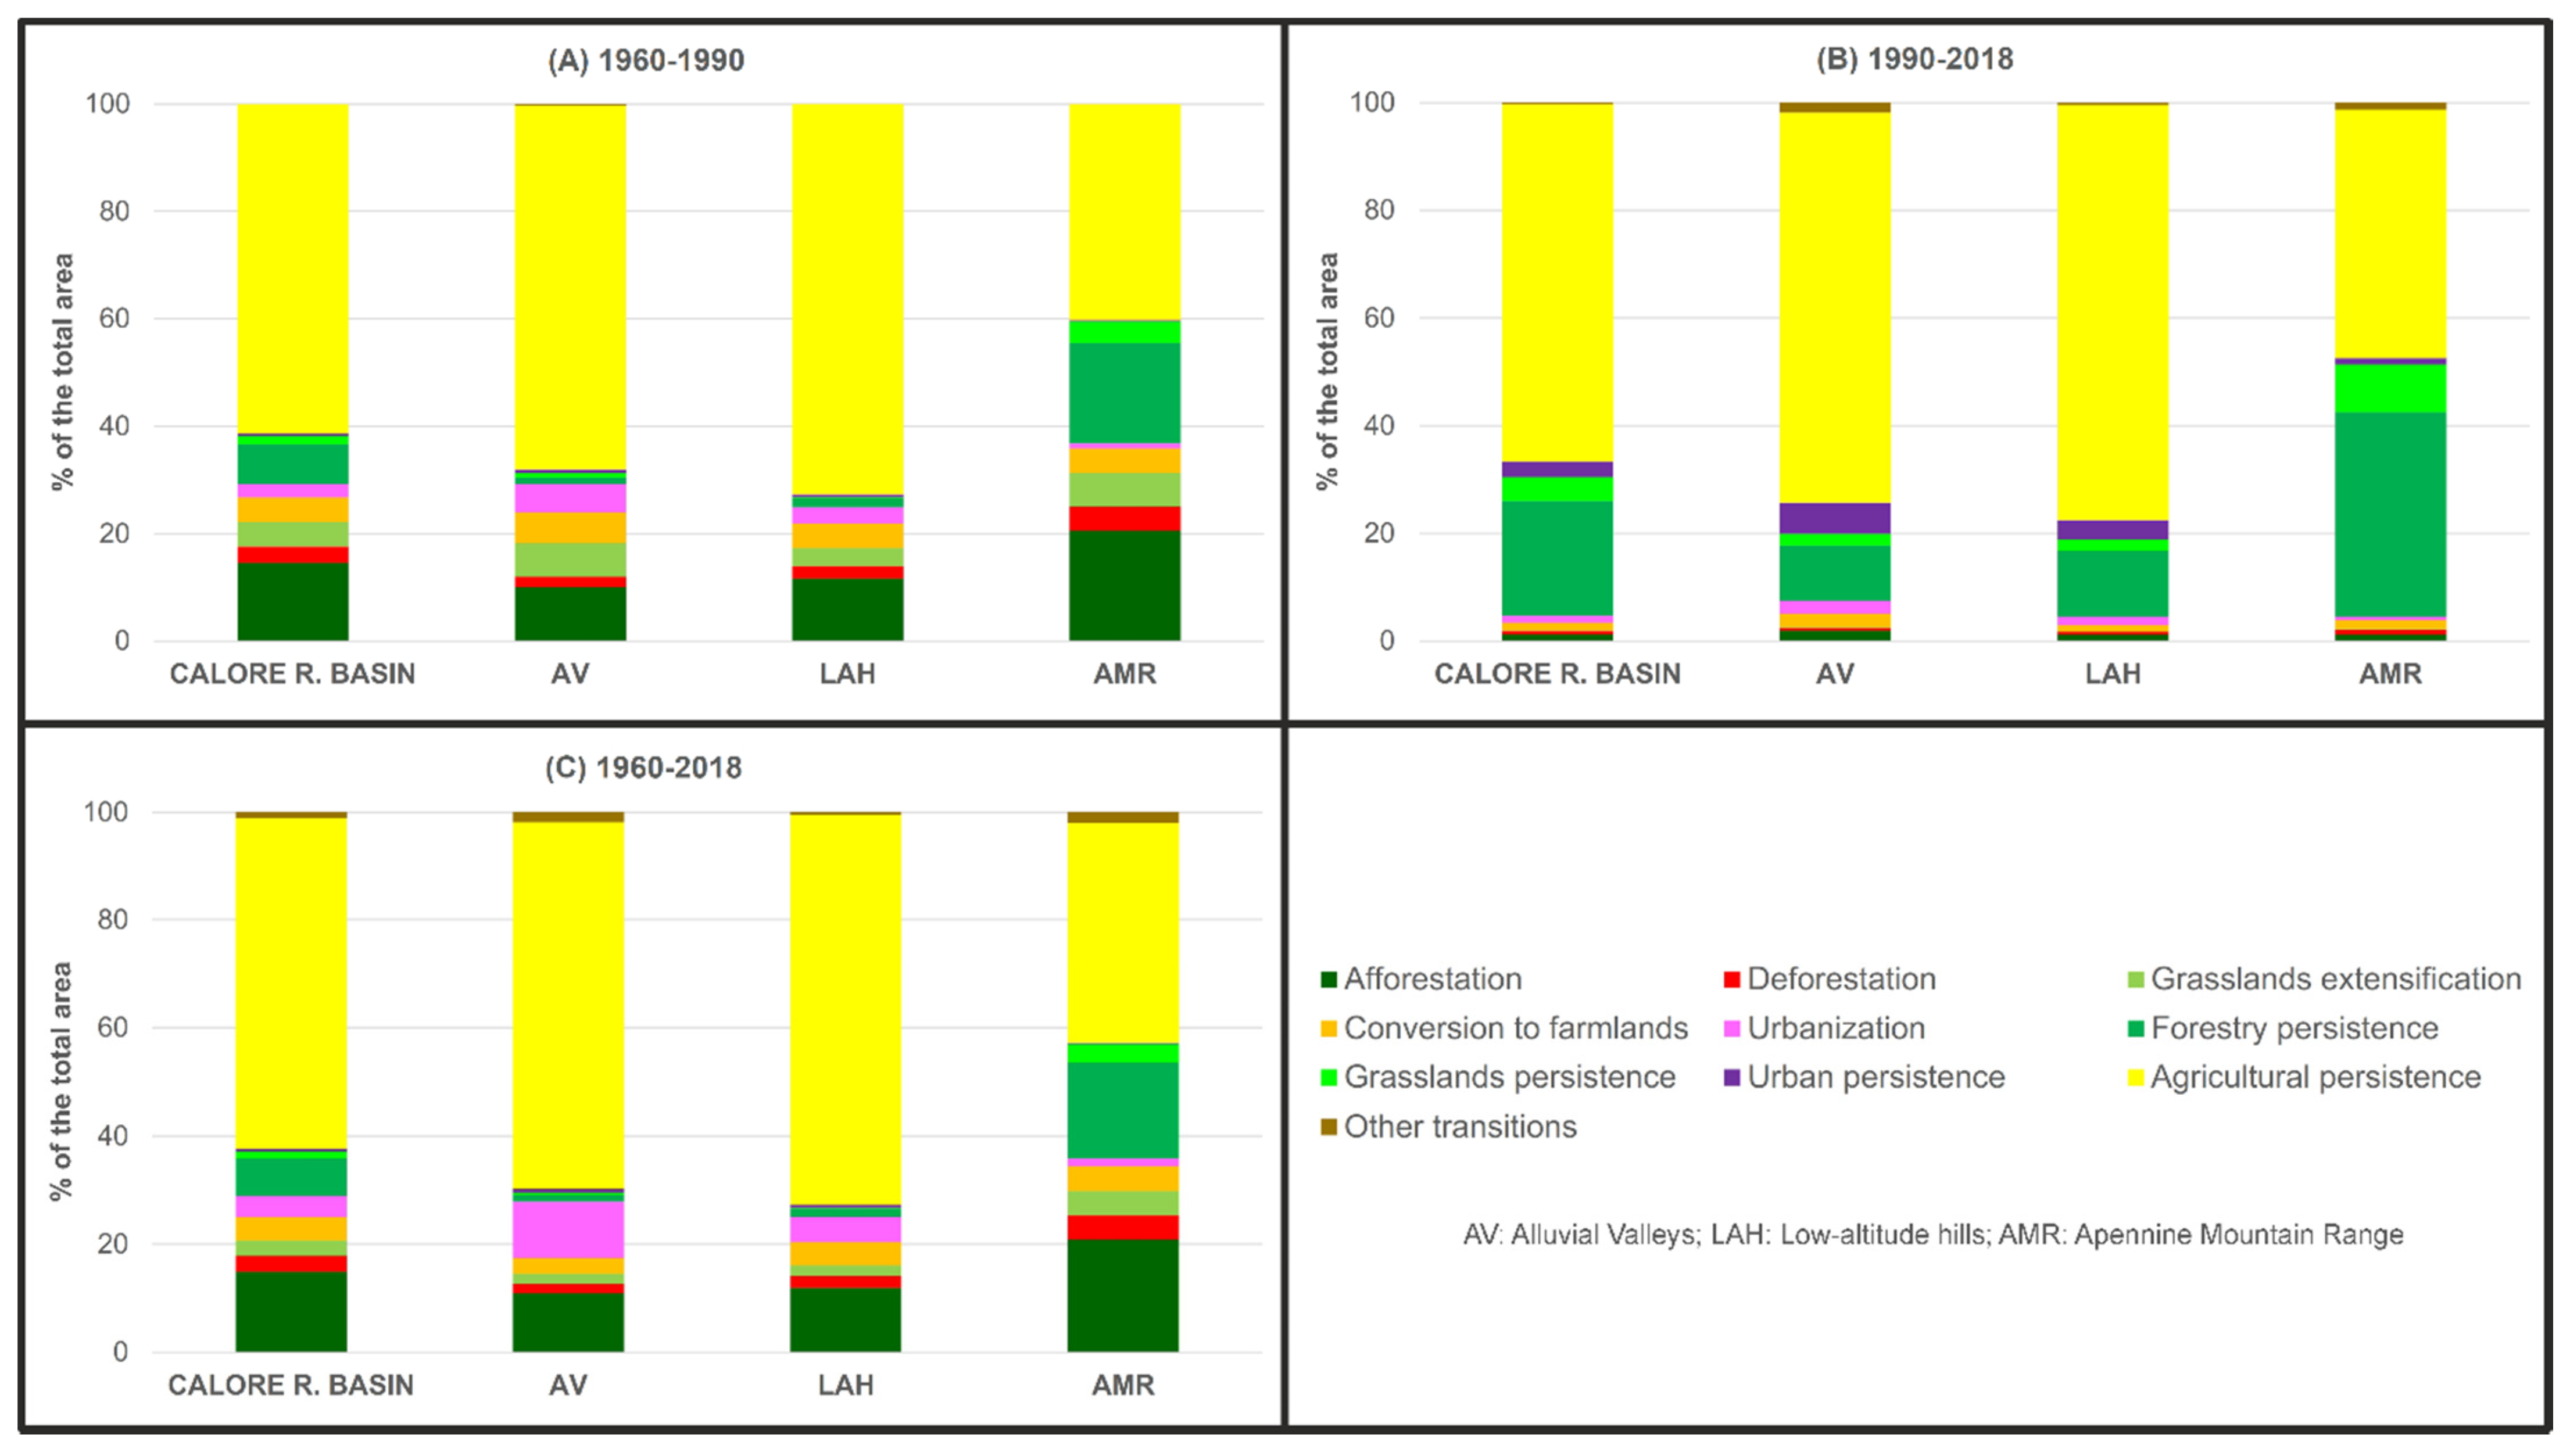
3.1. Land-Use Changes in the Period 1960–1990

In the period 1960–1990 (Figure 6), the LULC changes at the basin scale affected about 29% of the total area (Figure 7A, Table 3). At the physiographic unit scale, the changes mainly affected the AMR, in which LULC changed in about 37% of the total surface. In contrast, LULC underwent minor changes in the AV and LAH physio-graphic unit, which experienced changes in 29% and 25% of the total surface, respectively.
The changes mentioned above mainly consisted in afforestation, which affected about 15% of the basin area (Figure 7A, Table 3). Afforestation was relatively more intense in the Apennine Mountain range physiographic unit, as it affected about 21% of the total area, while it was less intense in the alluvial valleys, where forests progressively covered only 11% of the total area (Figure 7A, Table 3). However, Table 2, which summarizes the results of the LULC changes analysis at the LULC class scale, provides a deeper insight into the effective amount of the afforestation processes that occurred during this period. In fact, Table 2 shows that the forested area underwent substantial increases in all the physiographic units between 1960 and 2018, due to the relatively low diffusion of the forests in 1960. In particular, in this period, forest extension increased by more than 3.4 times in both the AV and LAH physiographic units.
Table 3 shows that afforestation mainly occurred at the expense of agricultural areas at both the basin and physiographic unit scale. This was particularly true in the AMR physiographic unit, where 15.2% of the unit area underwent afforestation of agricultural lands.
Table 2 also shows the intense urbanization that affected the alluvial valleys. In this physiographic unit, the extension of the urban areas increased by about five times in thirty years. At the physiographic unit and basin scale, the process was less evident, as urbanization resulted in affecting only 5.3% of the physiographic unit area and 2.5% of the entire basin area (Figure 7A, Table 3).

3.2. Land-Use Changes in the Period 1990–2018

In comparison to the previous period, a marked stability in terms of LULC changes at the basin scale characterized the period 1990–2018, as land-use remained unchanged in ~94% of the study area (Figure 6b and Figure 7B). Such stability was also clear at the physiographic unit scale, as the percentage of the total surface that experienced LULC changes ranged from 5% on the LAH to 9.5% in the AV. The latter resulted in the relatively more dynamic physiographic unit in the framework of this period of relative stability from the standpoint of LULC changes (Figure 7B; Table 3).
Afforestation, urbanization, and conversion to farmlands (i.e., the transition to both “agricultural areas” and “fruit trees and olive groves” land-use classes) were the LULC changes that, with similar percentages (1.2%, 1.3%, and 1.4% of the basin area, respectively), affected the Calore River basin (Table 3).
Afforestation was relatively more intense in the alluvial valleys (Table 3), mainly along the banks of the main rivers, as it affected 1.9% of the total area of this physiographic unit. Compared with 1990, the forested area in the alluvial plains increased by 9.1% (Table 2).
As with afforestation, urbanization was also more intense in the alluvial valleys (Table 3), affecting 2.4% of the physiographic unit area. The analysis at the LULC classes scale (Table 2) showed similar increases of the urbanized area in all the physiographic units (35.8%, 39.7%, and 46.3%) and in the entire basin (40.2%).
Finally, the conversion to farmlands also mainly affected the alluvial valleys, as 2.4% of this physiographic unit underwent such LULC change, which was less diffusive than on the other units (i.e., 1.6% on Apennine Mountain range and 1.1% on low-altitude hills; Table 3). This was mainly due to the expansion of the “agricultural areas” LULC class in all the physiographic units, as, in contrast, fruit trees and olive groves experienced an aerial reduction throughout the entire basin (Table 2).

3.3. Land-Use Changes in the Period 1960–2018

The LULC changes experienced by the Calore River basin in the entire period (i.e., 1960–2018) at both the basin and physiographic unit scale were obviously affected by those that occurred between 1960 and 1990, which were the most intense (Figure 6c and Figure 7C; Table 3). However, some more interesting results emerge from the analysis at the LULC classes scale (Table 2). The most striking result is probably the notable increase in the artificial surfaces in the alluvial valleys. In the AV physiographic unit, Table 2 shows that such surfaces increased by more than six times over a period of about sixty years. Such increase was significant, even if more moderate, on both hills, where artificial surfaces increased by about three times, and on mountains, where they almost doubled. However, the percentage of the entire basin area occupied by artificial surfaces at the end of the considered period remained relatively low (i.e., 4.2%; Figure 4a).
Table 2 also shows that the forested area in 2018 had more than tripled compared to 1960 in both alluvial plains and low-altitude hills physiographic units, while a more moderate increase affected the mountainous areas. It was also confirmed that afforestation occurred mainly at the expense of agricultural lands in all the physiographic units (Table 3).

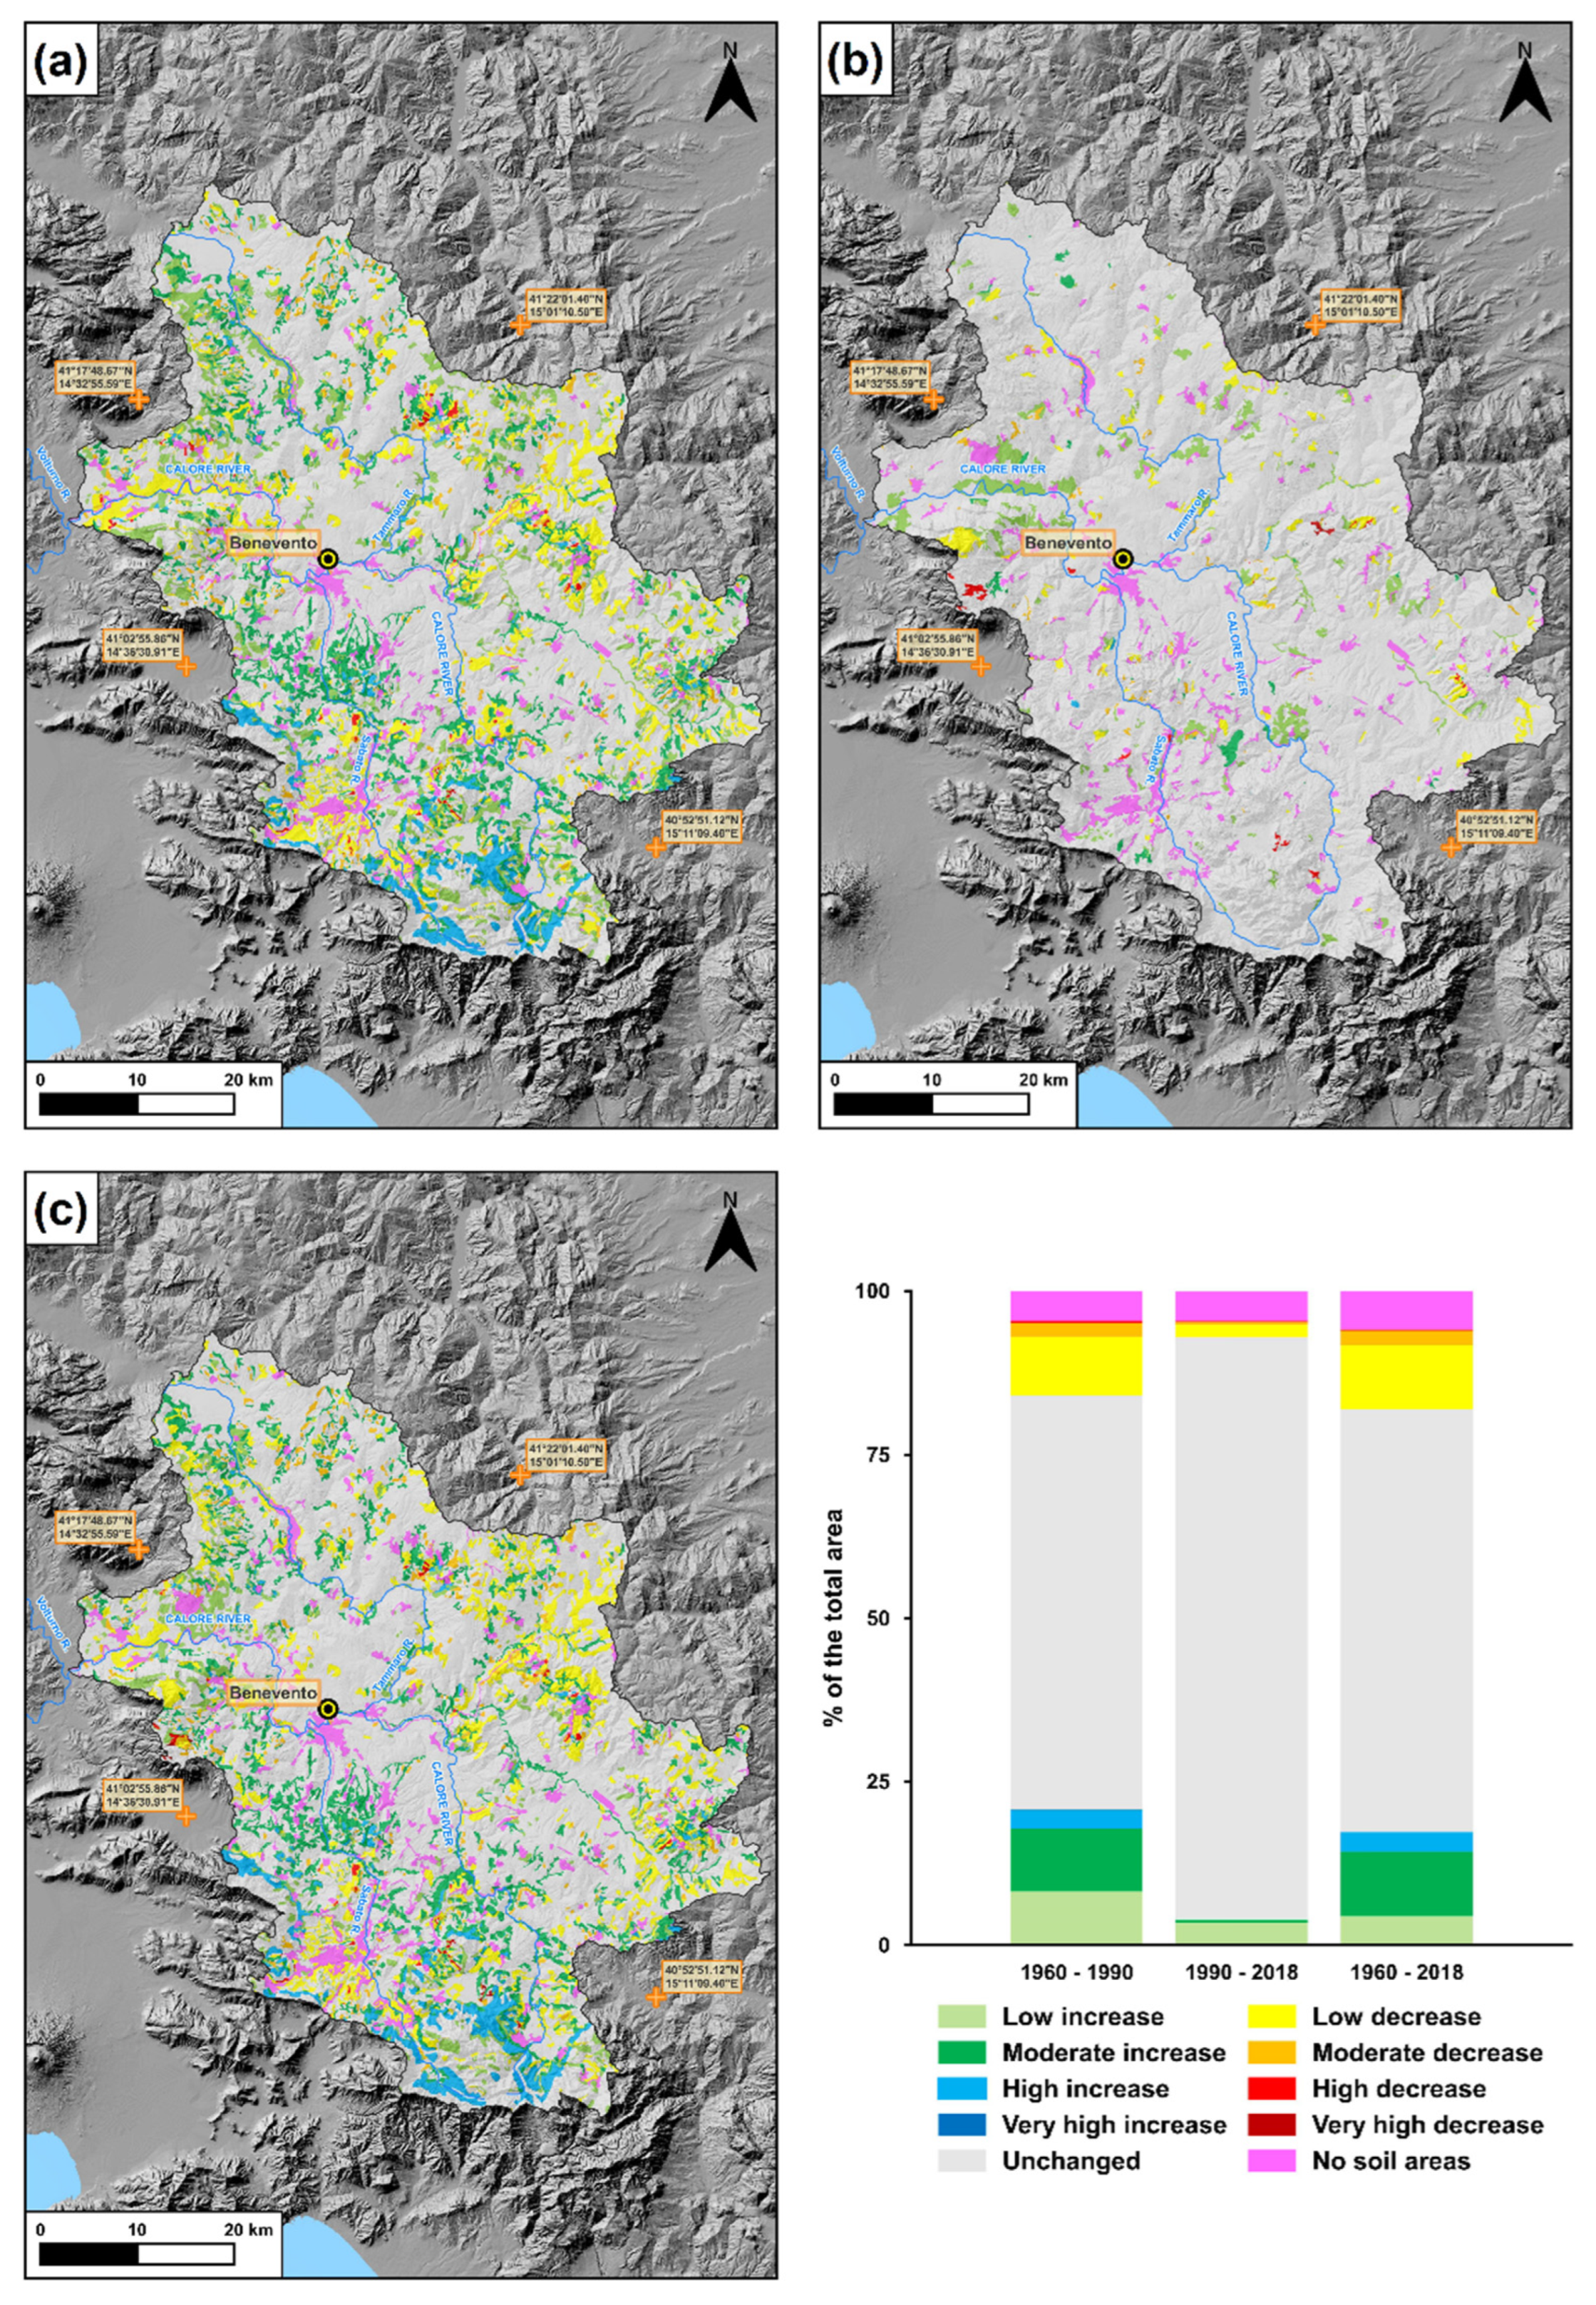
3.4. Variations in Soil Protection

As previously stated, the detected LULC changes were interpreted in terms of variations of C factor. The latter expresses the different degree of soil protection against diffuse water erosion of the different land-cover types [67]. The C-factor values of LULC classes used in this study are reported in Table 1. Based on these values, we created the matrix reported in Figure 8, following the procedure explained in the Materials and Methods section. The spatial distribution of the classes of soil protection variation is shown in Figure 9, which also shows the percentage of the basin area occupied by the different classes.
In accordance with the results previously described, the most intense variations in soil protection occurred in the period 1960–1990 (Figure 9a), when the basin experienced the most intense LULC changes (Figure 7A). Figure 9a shows that, in that period, the degree of soil protection induced by LULC changes remained unchanged in more than 63% of the basin area, while it increased in 21% and decreased in 11%. The increase in soil protection was mainly moderate (in 9.6% of the basin area) and low (in 8.2%). In contrast, the decrease was almost exclusively low (8.9%) and moderate (2.1%).
In the period 1990–2018, during which the LULC changes were negligible, the variation of soil protection was also negligible (Figure 9b). The latter remained unchanged in 89% of the basin area, while it increased in 4% (mainly, a low increase occurred) and decreased in 2.5% (also in this case, a low decrease prevailed).
Finally, considering the entire period (i.e., from 1960 to 2018; Figure 9c), a prevalence of areas which experienced an increase in soil protection (17% of the basin) against those in which soil protection decreased (12%) can be noted. The soil protection remained unchanged in more than 65% of the basin.

4. Discussion

The analysis of the LULC changes experienced by the Calore River basin in a period of 58 years (1960–2018) showed great differences between the sub-periods 1960–1990 and 1990–2018 (Figure 3 and Figure 4).
The first was a period of relatively intense LULC changes (Figure 6a and Figure 7A; Table 3), while the second was a period of great stability, in which more than 94% of the LULC at the basin scale remained unchanged (Figure 6b and Figure 7B; Table 3). In the latter period, only the alluvial valleys showed a slightly higher dynamism, as about 10% of this physiographic unit area experienced LULC changes (Table 3). Unfortunately, we did not find in the literature any recent paper containing an analysis at a national or regional scale of LULC changes in the 2000s. Thus, it is not possible to assess if LULC stability detected in the Calore River basin between 1990 and 2018 was local or part of a wider trend.
In contrast, the LULC changes that occurred during the first and more dynamic sub-period (i.e., between 1960 and 1990) affected about one third of the study area (Figure 6b) and were mainly concentrated in the mountainous areas (Figure 7B; Table 3). Such changes mainly consisted in afforestation, which affected ~15% of the Calore River basin. At the physiographic unit scale, one fifth of the mountainous areas underwent afforestation, which affected relatively lower percentages of hills and valleys (Table 2). Afforestation was also the main LULC change in the inner area of both the entirety of Italy [1] and the Campania region [48] in the same time-span. The percentage of the afforested area of the Calore River basin (i.e., 14.5%; Table 3) was consistent with both those of the entire Italian territory (12%) and the inner areas of Italy (16%) in the same period [1]. At the physiographic unit scale, the percent of the afforested areas of the AMR physiographic unit of the Calore River basin (i.e., 20.5%) was lower than that calculated by Di Gennaro et al. [48] for the mountainous areas of the Campania region (38.5%).
In the period 1960–1990, afforestation affected mainly the agricultural lands and, to a lesser extent, grasslands and shrubs (Table 3). The same was also observed at national [1] and regional [48] scales. In particular, Falcucci et al. [1] found significant statistical correlations between the afforestation of agricultural lands in the inner areas of Italy (in which the Calore River basin is comprised) and the decrease in population in these areas, which led to diffuse land abandonment. At the regional scale, the afforestation of agricultural lands and grasslands observed in the Calore River basin was much lower than that observed in the entire Campania region [48]. At the basin scale, Magliulo et al. [49] observed that, in contrast with what was observed in this study for the Calore River basin, afforestation in the adjacent Sele River basin was more intense (afforested areas covered 34% of the Sele River basin and 14.5% of the Calore River basin). Furthermore, it occurred much more frequently at the expense of grasslands than at the expense of agricultural lands. This was probably connected, at least partly, with the aesthetic, recreational, and perceptive value of the afforested mountainous landscape [72], considering that, in comparison to the Calore River basin, most of the afforested slopes of the Sele River basin are included in the “Cilento, Vallo di Diano and Alburni” UNESCO Geopark. Regardless, Di Gennaro [48] found that, in the Campania region, afforestation of grasslands was much more frequent than that of agricultural lands. Thus, in this sense, the Calore River basin represents an exception compared with the regional trend.
Between 1960 and 1990, forestry persistence characterized a lower percentage of the Calore River basin (i.e., 7.4%) compared with the afforested area (14.5%; Table 3). This means that mature forest formations in 1990 were less widespread than recolonization pioneer formations [72]. The opposite occurred in the period 1990–2018, when only 1.2% of the study area was afforested, while 21.3% was characterized by forestry persistence (Figure 7B). In other words, only a negligible percentage of the forests that were present in the Calore R. basin in 2018 were younger than 28 years.
Urbanization of the alluvial valleys was another LULC change of notable importance in the studied area. It was particularly intense in the period 1960–1990, when the extension of the urbanized areas in the alluvial valleys increased by five times in thirty years (Table 2), notwithstanding the percentage of both the basin and the physiographic units areas occupied by artificial surfaces, which remained relatively low (Figure 7B). Moreover, in this case, the detected trend was consistent with that at both a national and regional scale [1,48], but the percentage was even higher than that calculated at a regional scale.
The LULC changes detected in the study area determined variations in soil protection against erosion, as proved by a vast literature [3,8,28,29,71]. In the period 1960–1990, an increase in soil protection induced by LULC changes affected more than 20% of the basin area (Figure 9). In the same period, several studies [53,73,74,75] reported a high decrease in rainfall in the entire Calore River basin. The simultaneous increase in soil protection and decrease in rainfall strongly suggest an overall decrease in soil erosion rates from slopes and associated sediment supply to the rivers. The literature data support this hypothesis. In fact, the same trend was observed also in other parts of Italy and was connected to soil erosion dynamics, e.g., in badlands areas [10,11,12]. Furthermore, several papers dealing with short-term river channel adjustments [18,53,65] report a marked channel narrowing (ranging from 65% to 81%) of the main rivers flowing in the study area (i.e., Calore, Tammaro, and Sabato Rivers) and, in some cases, channel pattern changes that are perfectly coherent with a reduction in sediment supply to the rivers [19,76].
In the following period (i.e., 1990–2018), the soil protection against erosion remained unchanged in ~90% of the basin (Figure 9) and no variations in rainfall were reported in the literature [53]. The absence of significant variations in both soil protection and rainfall is coherent with an absence of significant variations in soil erosion and associated solid supply to the rivers. This hypothesis is consistent with the literature data in this case too. In fact, in this time-span, the main rivers of the Calore River basin show a certain stability in channel width and channel morphology, especially when compared with the previous phase. In particular, the relatively smaller rivers (i.e., Tammaro and Sabato Rivers) experienced a negligible narrowing of ~10%, while the main river (i.e., the Calore River) experienced a widening of ~18% [18,53].
As final remarks, this study allowed for assessing the LULC changes in one of the largest river basins of Southern Italy, i.e., the Calore River basin. It provided a contribution in investigating multidecadal land-use changes at the basin scale, where the relationships between land-use changes, soil erosion, and fluvial dynamics are clearer, in a desertification-prone and agricultural area. GIS-analysis proved, once again, to be a very effective tool in these kinds of studies. The study also highlights the importance of conducting an analysis of the LULC changes at different scales (i.e., basin, physiographic unit, and land-use class scale) to obtain a comprehensive scenario of the occurred changes.

5. Conclusions

The LULC changes we detected in the Calore River basin (Southern Italy) in the period 1960–2018 were fully consistent with the trends highlighted by previous studies at national and regional scales. In particular, this study confirmed the trend of the inner areas of Italy moving towards more pristine conditions, with an increase in forests at the expense of agricultural areas. However, most of the detected changes occurred between 1960s and 1990s, followed by a period of substantial stability.
The interpretation of the detected LULC changes in terms of soil protection, integrated with the literature data, suggests a scenario of decreased soil erosion and sediment supply to the rivers between 1960 and 1990. Such a scenario is fully coherent with the results of recent papers dealing with short-term channel adjustments, which consisted of severe narrowing and incision.
The analysis of the pre-existing literature also confirmed that, similarly to LULC at the basin scale, the main rivers of the Calore River basin also experienced a following phase of marked stability from 1990s onwards. Thus, it further demonstrated the deep relationships between LULC changes at the basin scale and river dynamics.

Author Contributions

Conceptualization, P.M.; methodology, P.M.; software, A.C.; validation, P.M. and F.R.; formal analysis, P.M., A.C., S.S. and M.B.; investigation, P.M. and A.C.; resources, P.M. and F.R.; data curation, P.M., A.C., S.S. and M.B.; writing—original draft preparation, P.M.; writing—review and editing, P.M. and F.R.; visualization, P.M. and A.C.; supervision, P.M. and F.R.; project administration, P.M. and F.R.; funding acquisition, P.M. All authors have read and agreed to the published version of the manuscript.

Funding

This research was funded by UNIVERSITÀ DEGLI STUDI DEL SANNIO, “Fondi per la Ricerca di Ateneo-FRA 2020”, Resp. Paolo Magliulo.

Data Availability Statement

Data is contained within the article.

Acknowledgments

Authors are grateful to the three anonymous reviewers, whose constructive comments greatly improved the readability and the scientific rigor of the paper. Authors also wish to thank the Editors for the useful editorial comments.

Conflicts of Interest

The authors declare no conflict of interest.

References

  1. Falcucci, A.; Maiorano, L.; Boitani, L. Changes in land-use/land-cover patterns in Italy and their implications for biodiversity conservation. Landsc. Ecol. 2007, 22, 617–631. [Google Scholar] [CrossRef]
  2. Myers, N.; Mittermeier, R.A.; Mittermeier, C.G.; da Fonseca, G.A.B.; Kent, J. Biodiversity hotspots for conservation priorities. Nature 2000, 403, 853–858. [Google Scholar] [CrossRef] [PubMed]
  3. García-Ruiz, J.M. The effects of land uses on soil erosion in Spain: A review. Catena 2010, 81, 1–11. [Google Scholar] [CrossRef]
  4. Oñate, J.J.; Peco, B. Policy impact on desertification: Stakeholders’ perceptions in southeast Spain. Land Use Policy 2005, 22, 103–114. [Google Scholar] [CrossRef]
  5. Forino, G.; Ciccarelli, S.; Bonamici, S.; Perini, L.; Salvati, L. Developmental policies, long-term land-use changes and the way towards soil degradation: Evidence from Southern Italy. Scott. Geogr. J. 2015, 131, 123–140. [Google Scholar] [CrossRef]
  6. Vacca, A.; Loddo, S.; Ollesch, G.; Puddu, R.; Serra, G.; Tomasi, D.; Aru, A. Measurement of runoff and soil erosion in three areas under different land use in Sardinia (Italy). Catena 2000, 40, 69–92. [Google Scholar] [CrossRef]
  7. Thornes, J.B. The interaction of erosional and vegetational dynamics in land degradation: Spatial outcomes. In Vegetation and Erosion: Processes and Environments; Thornes, J.B., Ed.; Wiley: Chichester, UK, 1990; pp. 41–53. [Google Scholar]
  8. Kosmas, C.; Danalatos, N.G.; López Bermúdez, F.; Romero Díaz, M.A. The effect of land use on soil erosion and land degradation under Mediterranean conditions. In Mediterranean Desertification: A Mosaic of Processes and Responses; Geeson, N.A., Brandt, C.J., Thornes, J.B., Eds.; Wiley: Chichester, UK, 2002; pp. 57–70. [Google Scholar]
  9. Wainwright, J.; Thornes, J.B. Environmental Issues in the Mediterranean: Processes and Perspectives from the Past and Present; Routledge: London, UK, 2004; p. 479. [Google Scholar]
  10. Castaldi, F.; Chiocchini, U. Effects of land use changes on badland erosion in clayey drainage basins, Radicofani, Central Italy. Geomorphology 2012, 169, 98–108. [Google Scholar] [CrossRef]
  11. Bosino, A.; Omran, A.; Maerker, M. Identification, characterisation and analysis of the Oltrepo’ Pavese calanchi in the Northern Apennines (Italy). Geomorphology 2019, 340, 53–66. [Google Scholar] [CrossRef]
  12. Coratza, P.; Parenti, C. Controlling factors of badland morphological changes in the Emilia Apennines (Northern Italy). Water 2021, 13, 539. [Google Scholar] [CrossRef]
  13. Zucca, C.; Canu, A.; Della Peruta, R. Effects of land use and landscape on spatial distribution and morphological features of gullies in an agropastoral area in Sardinia (Italy). Catena 2006, 68, 87–95. [Google Scholar] [CrossRef]
  14. Zucca, C.; Canu, A.; Previtali, F. Soil degradation by land use change in an agropastoral area in Sardinia (Italy). Catena 2010, 83, 46–54. [Google Scholar] [CrossRef]
  15. Magliulo, P.; Russo, F.; Lo Curzio, S. Detection of permanently eroded landsurfaces through multitemporal analysis of Landsat data: A case study from an agricultural area in southern Italy. Environ. Earth Sci. 2020, 79, 18. [Google Scholar] [CrossRef]
  16. Fortugno, D.; Boix-Fayos, C.; Bombino, G.; Denisi, P.; Quiñonero-Rubio, J.M.; Tamburino, V.; Zema, D.A. Adjustments in channel morphology due to land-use changes and check dam installation in mountain torrents of Calabria (southern Italy). Earth Surf. Process. Landf. 2017, 42, 2469–2483. [Google Scholar] [CrossRef]
  17. Cooper, S.D.; Lake, P.S.; Sabater, S.; Melack, J.M.; Sabo, J.L. The effects of land use changes on streams and rivers in Mediterranean climates. Hydrobiologia 2013, 719, 383–425. [Google Scholar] [CrossRef]
  18. Magliulo, P.; Bozzi, F.; Leone, G.; Fiorillo, F.; Leone, N.; Russo, F.; Valente, A. Channel adjustments over 140 years in response to extreme floods and land-use change, Tammaro River, southern Italy. Geomorphology 2021, 383, 18. [Google Scholar] [CrossRef]
  19. Scorpio, V.; Piégay, H. Is afforestation a driver of change in Italian rivers within the Anthropocene era? Catena 2021, 198, 105031. [Google Scholar] [CrossRef]
  20. Brath, A.; Montanari, A.; Moretti, G. Assessing the effect on flood frequency of land use change via hydrological simulation (with uncertainty). J. Hydrol. 2006, 324, 141–153. [Google Scholar] [CrossRef]
  21. Liu, J.; Wang, S.; Li, D. The analysis of the impact of land-use changes on flood exposure of Wuhan in Yangtze River Basin, China. Water Resour. Manag. 2014, 28, 2507–2522. [Google Scholar] [CrossRef]
  22. Apollonio, C.; Balacco, G.; Novelli, A.; Tarantino, E.; Piccinni, A.F. Land use change impact on flooding areas: The case study of Cervaro Basin (Italy). Sustainability 2016, 8, 961. [Google Scholar] [CrossRef] [Green Version]
  23. Tasser, E.; Tappeiner, U. Impact of land use changes on mountain vegetation. Appl. Veg. Sci. 2002, 5, 173–184. [Google Scholar] [CrossRef]
  24. Hamidov, A.; Helming, K.; Balla, D. Impact of agricultural land use in Central Asia: A review. Agron. Sustain. Dev. 2016, 36, 6. [Google Scholar] [CrossRef] [Green Version]
  25. Salazar, A.; Baldi, G.; Hirota, M.; Syktus, J.; McAlpine, C. Land use and land cover change impacts on the regional climate of non-Amazonian South America: A review. Glob. Planet. Chang. 2015, 128, 103–119. [Google Scholar] [CrossRef]
  26. Lambin, E.; Geist, H.J.; Lepers, E. Dynamics of land-use and land-cover change in tropical regions. Annu. Rev. Environ. Resour. 2003, 28, 205–241. [Google Scholar] [CrossRef] [Green Version]
  27. Ruiz, I.; Sanz-Sánchez, M.J. Effects of historical land-use change in the Mediterranean environment. Sci. Total Environ. 2020, 732, 8. [Google Scholar] [CrossRef] [PubMed]
  28. Kosmas, C.; Danalatos, N.; Cammeraat, L.H.; Chabart, M.; Diamantopoulos, J.; Farand, R.; Gutierrez, L.; Jacob, A.; Marques, H.; Martinez-Fernandez, J.; et al. The effect of land use on runoff and soil erosion rates under Mediterranean conditions. Catena 1997, 29, 45–59. [Google Scholar] [CrossRef]
  29. Panagos, P.; Borrelli, P.; Meusburger, K.; Alewell, C.; Lugato, E.; Montanarella, L. Estimating the soil erosion cover-management factor at the European scale. Land Use Policy 2015, 48, 38–50. [Google Scholar] [CrossRef]
  30. Rounsevell, M.D.A.; Reay, D.S. Land use and climate change in the UK. Land Use Policy 2009, 26, S160–S169. [Google Scholar] [CrossRef]
  31. Deng, X.Z.; Li, Z.H. A review on historical trajectories and spatially explicit scenarios of land-use and land-cover changes in China. J. Land Use Sci. 2016, 11, 709–724. [Google Scholar] [CrossRef]
  32. Salvati, L.; Bajocco, S. Land sensitivity to desertification across Italy: Past, present, and future. Appl. Geogr. 2011, 31, 223–231. [Google Scholar] [CrossRef]
  33. Santini, M.; Valentini, R. Predicting hot-spots of land use changes in Italy by ensemble forecasting. Reg. Environ. Chang. 2011, 11, 483–502. [Google Scholar] [CrossRef]
  34. Piccarreta, M.; Capolongo, D.; Boenzi, F.; Bentivenga, M. Implications of decadal changes in precipitation and land use policy to soil erosion in Basilicata, Italy. Catena 2006, 65, 138–151. [Google Scholar] [CrossRef]
  35. Łowicki, D. Land use changes in Poland during transformation: Case study of Wielkopolska region. Landsc. Urban Plan. 2008, 87, 279–288. [Google Scholar] [CrossRef]
  36. Gallardo, M.; Martínez-Vega, J. Three decades of land-use changes in the region of Madrid and how they relate to territorial planning. Eur. Plan. Stud. 2016, 24, 1016–1033. [Google Scholar] [CrossRef] [Green Version]
  37. Ellis, E.C.; Goldewijk, K.K.; Siebert, S.; Lightman, D.; Ramankutty, N. Anthropogenic transformation of the biomes, 1700 to 2000. Glob. Ecol. Biogeogr. 2010, 19, 589–606. [Google Scholar] [CrossRef]
  38. Mendoza, M.E.; López Granados, E.; Geneletti, D.; Pérez-Salicrup, D.R.; Salinas, V. Analysing land cover and land use change processes at watershed level: A multitemporal study in the Lake Cuitzeo Watershed, Mexico (1975–2003). Appl. Geogr. 2011, 31, 237–250. [Google Scholar] [CrossRef]
  39. Bhattacharya, R.K.; Das Chatterjee, N.; Das, K. Land use and land cover change and its resultant erosion susceptible level: An appraisal using RUSLE and Logistic Regression in a tropical plateau basin of West Bengal, India. Environ. Dev. Sustain. 2021, 23, 1411–1446. [Google Scholar] [CrossRef]
  40. Lewis, S.E.; Bartley, R.; Wilkinson, S.N.; Bainbridge, Z.T.; Henderson, A.E.; James, C.S.; Irvine, S.A.; Brodie, J.E. Land use change in the river basins of the Great Barrier Reef, 1860 to 2019: A foundation for understanding environmental history across the catchment to reef continuum. Mar. Pollut. Bull. 2021, 166, 112193. [Google Scholar] [CrossRef]
  41. Tadese, M.; Kumar, L.; Koech, R.; Kogo, B.K. Mapping of land-use/land-cover changes and its dynamics in Awash River Basin using remote sensing and GIS. Remote Sens. Appl. Soc. Environ. 2020, 19, 100352. [Google Scholar] [CrossRef]
  42. D’Angelo, M.; Enne, G.; Madrau, S.; Percich, L.; Previtali, F.; Pulina, G.; Zucca, C. Mitigating land degradation in Mediterranean agro-silvo-pastoral systems: A GIS-based approach. Catena 2000, 40, 37–49. [Google Scholar] [CrossRef]
  43. Pignatti, S.; Cavalli, R.M.; Cuomo, V.; Fusilli, L.; Pascucci, S.; Poscolieri, M.; Santini, F. Evaluating Hyperion capability for land cover mapping in a fragmented ecosystem: Pollino National Park, Italy. Remote Sens. Environ. 2009, 113, 622–634. [Google Scholar] [CrossRef]
  44. Alqurashi, A.; Kumar, L. Investigating the use of Remote Sensing and GIS techniques to detect land use and land cover change: A review. Adv. Remote Sens. 2013, 2, 193–204. [Google Scholar] [CrossRef] [Green Version]
  45. Amol, D.V.; Bharti, W.G. Analysis and modeling of agricultural land use using Remote Sensing and Geographic Information System: A Review. IJERA 2013, 3, 81–91. [Google Scholar]
  46. Attri, P.; Chaudhry, S.; Sharma, S. Remote Sensing & GIS based Approaches for LULC Change Detection—A Review. Int. J. Curr. Eng. Technol. 2015, 5, 3126–3137. [Google Scholar]
  47. MohanRajan, S.N.; Loganathan, A.; Manoharan, P. Survey on Land Use/Land Cover (LU/LC) change analysis in remote sensing and GIS environment: Techniques and challenges. Environ. Sci. Pollut. Res. 2020, 27, 29900–29926. [Google Scholar] [CrossRef]
  48. Di Gennaro, A.; Innamorato, F.; Capone, S. La grande trasformazione: Land cover e land use in Campania. In Estimo e Territorio–Valutare e Gestire L’ambiente; Edagricole: Bologna, Italy, 2005; Volume 3 (LXVII), pp. 25–39. [Google Scholar]
  49. Magliulo, P.; Cusano, A.; Russo, F. Land-Use Changes in the Sele River Basin Landscape (Southern Italy) between 1960 and 2012: Comparisons and Implications for Soil Erosion Assessment. Geographies 2021, 1, 315–332. [Google Scholar] [CrossRef]
  50. D’Ippolito, A.; Ferrari, E.; Iovino, F.; Nicolaci, A.; Veltri, A. Reforestation and land use change in a drainage basin of southern Italy. iForest 2013, 6, 175–182. [Google Scholar] [CrossRef] [Green Version]
  51. Ricca, N.; Guagliardi, I. Multi-temporal dynamics of land use patterns in a site of community importance in Southern Italy. Appl. Ecol. Environ. Sci. 2015, 13, 677–691. [Google Scholar] [CrossRef]
  52. Romano, G.; Abdelwahab, O.M.M.; Gentile, F. Modeling land use changes and their impact on sediment load in a Mediterranean watershed. Catena 2018, 163, 342–353. [Google Scholar] [CrossRef]
  53. Magliulo, P.; Cusano, A.; Giannini, A.; Sessa, S.; Russo, F. Channel width variation phases of the major rivers of the Campania Region (Southern Italy) over 150 years: Preliminary results. Earth 2021, 2, 374–386. [Google Scholar] [CrossRef]
  54. Diodato, N. Modelling net erosion responses to enviroclimatic changes recorded upon multisecular timescales. Geomorphology 2006, 80, 164–177. [Google Scholar] [CrossRef]
  55. Rinaldi, M.; Surian, N.; Comiti, F.; Bussettini, M. Guidebook for the Evaluation of Stream Morphological Conditions by the Morphological Quality Index (MQI); Istituto Superiore per la Protezione e la Ricerca Ambientale: Rome, Italy, 2012; p. 90. [Google Scholar]
  56. Mostardini, F.; Merlini, S. Appennino centro meridionale. Sezioni geologiche e proposta di modello strutturale. Mem. Soc. Geol. Ital. 1986, 35, 177–202. [Google Scholar]
  57. Vitale, S.; Ciarcia, S. Tectono-stratigraphic setting of the Campania region (southern Italy). J. Maps 2018, 14, 9–21. [Google Scholar] [CrossRef]
  58. Magliulo, P. Quaternary deposits and geomorphological evolution of the Telesina Valley (Southern Apennines). Geogr. Fis. Din. Quat. 2005, 28, 125–146. [Google Scholar]
  59. Cartojan, E.; Magliulo, P.; Massa, B.; Valente, A. Morphotectonic features of the Tammaro River basin, Southern Apennines, Italy. Rend. Lincei 2014, 25 (Suppl. 2), 217–229. [Google Scholar] [CrossRef]
  60. Ciarcia, S.; Magliulo, P.; Russo, F.; Valente, A. Osservazioni geologiche e geomorfologiche preliminari sul bacino pleistocenico intermontano di Benevento (Appennino Campano). In Evoluzione Geomorfologica di Lungo Termine del Paesaggio nell’Italia Meridionale: Il Contributo Delle Università Locali; Rosskopf, C.M., Aucelli, P.P.C., Eds.; Università degli Studi del Molise, Associazione Italiana di Geografia Fisica e Geomorfologia (AIGeo) edition; Arti Grafiche la Regione: Ripalimosani, Italy, 2014; pp. 125–141. [Google Scholar]
  61. Brancaccio, L.; Cinque, A. L’evoluzione geomorfologica dell’Appennino campano-lucano. Mem. Soc. Geol. Ital. 1988, 41, 83–86. [Google Scholar]
  62. Magliulo, P.; Russo, F.; Valente, A. Tectonic significance of geomorphological features in the Telesina Valley (Campanian Apennines). Boll. Soc. Geol. Ital. 2007, 126, 397–409. [Google Scholar]
  63. Leone, A.P.; Tedeschi, P.; Wright, G.G.; Fragnito, F. Landsat satellite data for soil investigations in an Apennines region of southern Italy. Geogr. Fis. Din. Quat. 1996, 19, 371–380. [Google Scholar]
  64. Soil Survey Staff. Keys to Soil Taxonomy. United States Department of Agriculture, Natural Resources Conservation Service. Twelfth Edition, 2014. Available online: https://www.nrcs.usda.gov/wps/PA_NRCSConsumption (accessed on 21 March 2022).
  65. Magliulo, P.; Valente, A.; Cartojan, E. Recent morphological changes of the middle and lower Calore River (Campania, Southern Italy). Environ. Earth Sci. 2013, 70, 2785–2805. [Google Scholar] [CrossRef]
  66. Ferrandino, V. L’agricoltura sannita tra arretratezza e ammodernamento. Credito agrario e innovazione nel Novecento. In Mezzogiorno-Agricoltura. Processi Storici e Prospettive di Sviluppo Nello Spazio EuroMediterraneo; Bencardino, F., Ferrandino, V., Marotta, G., Eds.; Franco Angeli: Milano, Italy, 2011; 696p. [Google Scholar]
  67. National Research Council (CNR)—Direzione Generale del Catasto. Carta Dell’utilizzazione del Suolo in Italia Alla Scala 1:200,000; Touring Club: Milano, Italy, 1960. [Google Scholar]
  68. Copernicus—Land Monitoring Service. 1990. Available online: https://land.copernicus.eu/pan-european/corine-land-cover/clc-1990 (accessed on 25 February 2022).
  69. Copernicus—Land Monitoring Service. 2018. Available online: https://land.copernicus.eu/pan-european/corine-land-cover/clc2018 (accessed on 25 February 2022).
  70. Chen, J.; Zhongwu, L.; Haibing, X.; Ke, N.; Chongjun, T. Effects of land use and land cover on soil erosion control in southern China: Implications from a systematic quantitative review. J. Environ. Manag. 2021, 282, 111924. [Google Scholar] [CrossRef]
  71. Wischmeier, W.H.; Smith, D.D. Predicting Rainfall Erosion Losses: A Guide to Conservation Planning; USDA, Science and Education Administration: Hyattsville, MD, USA, 1978. [Google Scholar]
  72. Parish, R. Mountains Environment; Routledge: London, UK, 2002; p. 368. [Google Scholar]
  73. De Vita, P.; Allocca, V.; Manna, F.; Fabbrocino, S. Coupled decadal variability of the North Atlantic Oscillation, regional rainfall and karst spring discharges in the Campania region (Southern Italy). Hydrol. Earth Syst. Sci. 2012, 16, 1389–1399. [Google Scholar] [CrossRef] [Green Version]
  74. Diodato, N. Climatic fluctuations in Southern Italy since the 17th century: Reconstruction with precipitation records at Benevento. Clim. Chang. 2007, 80, 411–431. [Google Scholar] [CrossRef]
  75. Longobardi, A.; Villani, P. Trend analysis of annual and seasonal rainfall time series in the Mediterranean area. Int. J. Climatol. 2010, 30, 1538–1546. [Google Scholar] [CrossRef]
  76. Rinaldi, M. Recent channel adjustments in alluvial rivers of Tuscany, Central Italy. Earth Surf. Process. Landf. 2003, 28, 587–608. [Google Scholar] [CrossRef]
Figure 1. Location map of the study area (Calore River basin) in the framework of the Italian peninsula (a) and Southern Italy (b). The red line in (b,c) indicates the basin boundary. In (a), the location of the Apennines mountain chain is also shown. In (c), the physiographic units, the main urban settlements, and the location of the Campolattaro Dam are also reported.
Geosciences 12 00156 g001
Figure 2. Flow–chart illustrating the different steps of this study. TC 1960: Map of Land Cover, CNR–TC, 1960. CLC: Corine Land Cover.
Geosciences 12 00156 g002
Figure 3. LULC maps of the Calore River basin in (a) 1960, (b) 1990, and (c) 2018.
Geosciences 12 00156 g003
Figure 4. Variations of the extension of the LULC classes in the study area, expressed as percentage of the total surface of the Calore River basin. Bars with diagonals refer to 1960, dotted bars to 1990, empty bars to 2018. (a) Calore River basin; (b) Alluvial Valleys—AV; (c) Low-altitude hills (LAH); (d) Apennine Mountain range (AMR).
Geosciences 12 00156 g004
Figure 5. Matrix used to classify the different types of LULC changes that occurred in the study area (modified from Di Gennaro et al. [48] and Magliulo et al. [49]).
Geosciences 12 00156 g005
Figure 6. Map of the LULC changes (“transitions”) of the Calore River basin. Same colors as Figure 5. (a) 1960–1990; (b) 1990–2018; (c) 1960–2018.
Geosciences 12 00156 g006
Figure 7. Percentages of the total surface of Calore River basin and physiographic units affected by the detected LULC changes in the periods 1960–1990 (A), 1990–2018 (B), and 1960–2018 (C).
Geosciences 12 00156 g007
Figure 8. Matrix aimed at reclassifying the detected LULC transitions in terms of expected variations in soil erosion protection.
Geosciences 12 00156 g008
Figure 9. Map of the spatial distribution of soil protection variations induced by the LULC changes and graph expressing the percentage of the total surface of the basin occupied by the different classes. (a) 1960–1990; (b) 1990–2018; (c) 1960–2018. Same colors as Figure 8.
Geosciences 12 00156 g009
Table 1. Conversion scheme used for the comparison of the LULC maps. CNR-TC: Consiglio Nazionale delle Ricerche (National Research Council)-Touring Club. CLC: Corine Land Cover.
CNR-TC
(1960)
CLC
(1990, 2018)
This
Study
C-Factor (Panagos et al., 2015)Class
C-Factor
Mixed forestsMixed forestForests0.00110.0012
Tall trees forestsConiferous forest0.0011
Broad-leaved forest0.0013
Coppice woodlands--
Pastures and natural grasslandsPasturesGrasslands
and shrubs
0.09030.0520
Natural grasslands0.0435
Wooded grasslands (dry)Transitional woodland and shrub0.0219
-Sclerophyllous vegetation0.0623
Moors and heathland0.0420
Dry arable landsAnnual crops associated with
permanent crops
Agricultural
areas
0.23230.1869
Irrigated arable landsComplex cultivation patterns0.1384
Wooded arable lands (dry)Land principally used for agriculture, with significant areas of natural
vegetation
0.1232
Wooded arable lands (irrigated)Agro-forestry areas0.0881
VineyardsVineyards0.3527
Hazelnut grovesFruit trees and berry plantationsFruit trees and olive groves0.21880.2231
Chestnuts
Fruit trees plantations
Olive grovesOlive groves0.2273
Olive trees and vines
associations
Barren areasSparsely vegetated areasBare or sparsely vegetated areas0.26520.2652
Beaches, dunes, sands-
Water bodiesWater bodiesWetlands and water bodies-N.D.
Water courses-
Settlements and other utilization formsContinuous urban fabricArtificial
surfaces
-N.D.
Discontinuous urban fabric-
Industrial or commercial units-
Road and rail networks and
associated land
-
Mineral extraction sites-
Dump sites-
Construction sites-
Green urban areas-
Table 2. Extension of each LULC class in the considered years and the areal variations in the different periods.
LULC ClassCalore River Basin
Area (ha)Variation (%)
1960199020181960–19901990–20181960–2018
Artificial surfaces4682.39210.912,910.696.740.2175.7
Wetlands and water bodies1379.225.9546.9−98.12009.2−60.3
Forests31,739.266,915.668,756.3110.82.8116.6
Fruit trees and olive groves21,045.820,483.513,414.4−2.7−34.5−36.3
Bare or sparsely vegetated areas-219.5638.1-190.7-
Grasslands and shrubs22,167.620,829.414,538.6−6.0−30.2−34.4
Agricultural areas224,065.9187,397.8194,277.5−16.43.7−13.3
Alluvial Valleys (AV)
Artificial surfaces232.31158.31573.1398.535.8577.0
Wetlands and water bodies829.225.8345.1−96.91235.3−58.4
Forests602.72137.12335.4254.69.1287.0
Fruit trees and olive groves843.81787.8770.7111.9−56.9−8.7
Bare or sparsely vegetated areas-31.212.7-−49.9-
Grasslands and shrubs714.71439.3446.4101.4−69.0−37.5
Agricultural areas15,927.412,570.913,667.0−21.18.7−14.2
Low-Altitude Hills (LAH)
Artificial surfaces3296.26710.39373.2103.639.7184.4
Wetlands and water bodies540.70.0149.6−100.0-−72.3
Forests6986.723,969.024,866.6243.13.7255.9
Fruit trees and olive groves12,541.017,697.912,221.741.1−30.9−2.5
Bare or sparsely vegetated areas-89.3137.3-53.8-
Grasslands and shrubs7810.46886.63986.9−11.8−42.1−49.0
Agricultural areas150,778.7126,602.1131,220.0−16.03.6−13.0
Apennine Mountain Range (AMR)
Artificial surfaces1153.81342.31964.316.346.370.3
Wetlands and water bodies9.2-52.3--466.8
Forests24,149.740,809.441,554.369.01.872.1
Fruit trees and olive groves7661.0997.7422.0−87.0−57.7−94.5
Bare or sparsely vegetated areas-99.1488.1-392.7-
Grasslands and shrubs13,642.512,503.610,105.3−8.3−19.2−25.9
Agricultural areas57,359.348,224.849,390.5−15.92.4−13.9
Table 3. Extension of the detected LULC changes at the basin and physiographic unit scale in the considered periods.
LULC Change1960–1990 (%)1990–2018 (%)1960–2018 (%)
Calore R. BasinAVLAHAMRCalore R. BasinAVLAHAMRCalore R. BasinAVLAHAMR
Afforestation of agricultural lands12.18.610.715.20.50.20.60.412.69.511.015.9
Afforestation of artificial surfaces0.30.10.20.30.00.00.00.00.30.10.30.3
Afforestation of grasslands2.10.70.75.00.91.70.51.32.30.80.75.2
Afforestation of wetlands-0.60.00.0----0.10.60.00.0
Afforestation of bare lands----0.00.0-0.0----
Agricultural deforestation2.21.52.12.60.40.50.60.22.21.62.02.6
Deforestation for pastures0.70.40.11.80.20.00.00.70.60.10.11.8
Urban deforestation0.10.10.10.10.00.00.00.00.10.10.10.1
Grasslands extensification4.66.33.46.30.10.20.10.22.81.92.04.5
Agricultural extensification0.33.20.20.0----0.33.20.20.0
Agricultural tillage4.32.54.34.51.42.41.11.64.32.74.34.6
Urbanization2.55.33.11.01.32.41.60.63.67.44.41.5
Forestry persistence7.41.21.618.721.210.312.538.37.41.31.618.6
Grasslands persistence1.60.80.34.04.42.22.18.81.30.40.23.4
Urban persistence0.40.70.50.22.95.83.61.20.50.70.60.3
Agricultural persistence61.367.872.740.266.372.477.146.161.267.972.340.7
Bare lands persistence----0.0--0.1----
Overflooding0.00.10.0-0.21.70.10.10.21.50.10.0
Wetlands persistence0.00.0 -0.00.10.0-0.00.30.00.0
Conversion to bare land0.10.20.00.10.20.10.10.40.20.10.10.5
Publisher’s Note: MDPI stays neutral with regard to jurisdictional claims in published maps and institutional affiliations.

