
Uses of Sentinel-1 and -2 Images in Heritage Management: A Case Study from Lednica Landscape Park (Poland)


1
Faculty of Archaeology, Adam Mickiewicz University, ul. Uniwersytetu Poznańskiego 7, 61-614 Poznań, Poland
2
Environmental Remote Sensing and Soil Science Research Unit, Institute of Physical Geography and Enviromental Planning, Faculty of Geographical and Geological Sciences, Adam Mickiewicz University, ul. Krygowskiego 10, 61-680 Poznań, Poland
*
Author to whom correspondence should be addressed.
Geosciences 2022, 12(4), 159; https://0-doi-org.brum.beds.ac.uk/10.3390/geosciences12040159
Submission received: 7 February 2022
/
Revised: 25 March 2022
/
Accepted: 28 March 2022
/
Published: 1 April 2022
(This article belongs to the Special Issue Remote Sensing, Geophysics and Geosciences for Cultural Heritage and Geoarchaeology)
Abstract
:This article aims to demonstrate the use of Sentinel images to develop strategies for heritage protection and management in rural landscapes that are currently undergoing dynamic transformations. Construction works are causing rapid and extensive land use changes that threaten archaeological structures. Moreover, the modernisation of farming practices may also negatively affect the efficiency of archaeological prospection. The rapidity of those processes requires the application of relevant tools to monitor changes and highlight negative tendencies in areas surrounding archaeological sites. High frequency of Sentinel-1 and -2’s acquisition may offer an immediate insight into current tendencies. Radar and optical data obtained from those satellites between 2016 and 2020 were analysed to identify trends in building development and land use/cover changes in Lednica Landscape Park. Preliminary results indicate a considerable potential of spectral analysis based on Sentinel-2 to monitor changes related to building development, as well as for the precise planning of a field survey. Sentinel-1 proved more problematic due to a range of factors related to data characteristics and processing. Using those results, we will discuss the potential and limitations of the proposed methodology and data.
1. Introduction
In the three decades since the system transformation in 1989, Poland has been experiencing rapid changes due to intensive economic development. Those changes significantly speeded up after Poland joined the European Union in 2004 [1,2,3]. Extensive landscape transformations can be now observed not only in the vicinity of urban centres (urban sprawl), but also in rural areas. Their effect on archaeological structures has been observed for some time in Lednica Landscape Park, an area surrounding one of the most significant archaeological sites in Poland. The early medieval stronghold on Ostrów [island] Lednicki is connected with the first royal dynasty of Piasts, and is considered the cradle of the Polish statehood. Within the stronghold were a chapel and palatium, which are thought to be one of the principal seats for the first rulers in the dynasty. It is also one contender for the historical site of the personal baptism of Mieszko I, his entire court or subordinated tribal elites [4]. Thus, Ostrów Lednicki has been a subject of archaeological research since the 19th century, and a test area for innovative approaches. However, research works were mainly focused on the island and its immediate surroundings. Wider surveys, extending beyond shoreline sites and other earthwork structures, were conducted only once within the framework of a national programme, the Polish Archaeological Record, which aimed to record archaeological sites by field walking survey [5]. It should also be noted that not all archaeological heritage recorded in Lednica Landscape Park has been assigned the same level of heritage protection. While Ostrów Lednicki has the highest status recognised in Polish legislation that protects it against negative transformations [6], its surroundings have been going through a series of modernisation changes. Two processes in particular affect archaeological heritage in the study area: construction works (mainly infrastructure and housing estates); and the modernisation of farming practices (industrial farming, deep ploughing). The rapidity of these changes requires a ‘problem-oriented’ heritage policy that is focused on threatened zones and is based on up-to-date archaeological records, as well as knowledge about land use changes and their effect on archaeological structures and survey practices. Poland has a well-developed spatial planning policy and systems of obtaining, processing and releasing spatial data by national bodies, which can be also used to support heritage strategies [7,8]. In some cases, however, that information may be outdated or not obtained at sufficient frequency to observe changes on regular basis. This was the case during the implementation of the “Anthropogenic impact on archeological heritage: Lednica Landscape Park case study” project (3449/19/FPK/NID), which aimed to obtain additional information about archaeological structures and also combine a range of spatial data to estimate land use changes and their effect on the preservation and identification of archaeological structures. A gap in spatial data for the crucial observation period between 2019–2020 encouraged us to explore the potential of satellite data.
Satellite remote sensing has been long recognised as a powerful tool in heritage protection and management. For two decades, since the declassification of CORONA images and the rapid development of commercial providers, research was mainly focused on exploring the potential of very high resolution imagery (VHR) to identify archaeological features, and also estimate their state of preservation [9,10,11,12,13,14,15,16]. These studies greatly contributed to recognition of archaeological heritage, especially in areas that had been hitherto insufficiently surveyed. Moreover, heritage monitoring in conflict zones, which involves the major application of VHR images, raised wider awareness about the potential of satellite remote sensing. As noted elsewhere, however, a particular focus on war destruction and looting may give less prominence to other equally destructive processes that are related to human-induced, large-scale landscape transformations [17]. This problem has been recently addressed by a number of works that also explore the potential of medium and low-resolution satellite imagery provided by a range of Earth Observation Programmes [18,19]. Studies of urban development and agricultural transformations are particularly informative in this context. For example, the urban sprawl around archaeological sites near Limassol (Cyprus) was assessed using radar and optical images provided by the Sentinel-1 and Sentinel-2 missions [20]. Elsewhere, in Egypt, a combined analysis of archival Landsat images and VHR data was applied to estimate rapidity of urbanisation processes and land conversion to agricultural production near archaeological sites [21,22].
The examination of different forms of landscape transformation requires the development of suitable methodologies and selection of appropriate datasets. The general characteristics of Lednica Landscape Park required good spatial resolution to identify the growth of housing in rural areas, while the effects of agricultural practices on the archaeological survey could be only observed through images of high temporal resolution. These two basic requirements were met by the Sentinel-1 and Sentinel-2 missions, which aimed to provide timely and quality information for a range of services, including climate changes, sustainable development, environmental policies, spatial planning, risk management and the agricultural policy [23,24,25]. The temporal resolution acquired by the Sentinel constellation satellites seems particularly adequate for our purposes. Since their launch on 3 April 2014 and 23 June 2015 (Sentinel-1A and Sentinel-2A, respectively), these satellites provide data at a frequency unprecedented by any other datasets. Given a range of factors, Sentinel-2′s theoretical repeatability of image overlapping is, at best, 2–3 days, while Sentinel-1 can go up to every 1–2 days. An additional advantage of Sentinel-1 is its radar sensor, which registers the Earth’s surface regardless of cloud cover, and provides an all-weather day-and-night supply of imagery [24]. Considerable potential is also offered by Sentinel-2’s Multispectral Instrument (MSI), which records each scene in 13 spectral bands [25]. We will propose and discuss a methodology, based on those optical and radar data, to analyse landscape changes in rural areas and their effect on archaeological structures and survey practices. We will also present preliminary results to identify specific areas undergoing transformations that pose threats to our archaeological heritage and estimate effects of current land use on archaeological prospection. One aim is also to show the value and uses of medium resolution, but frequently captured, images, which may have application in other parts of the world.
2. Study Area: Lednica Landscape Park
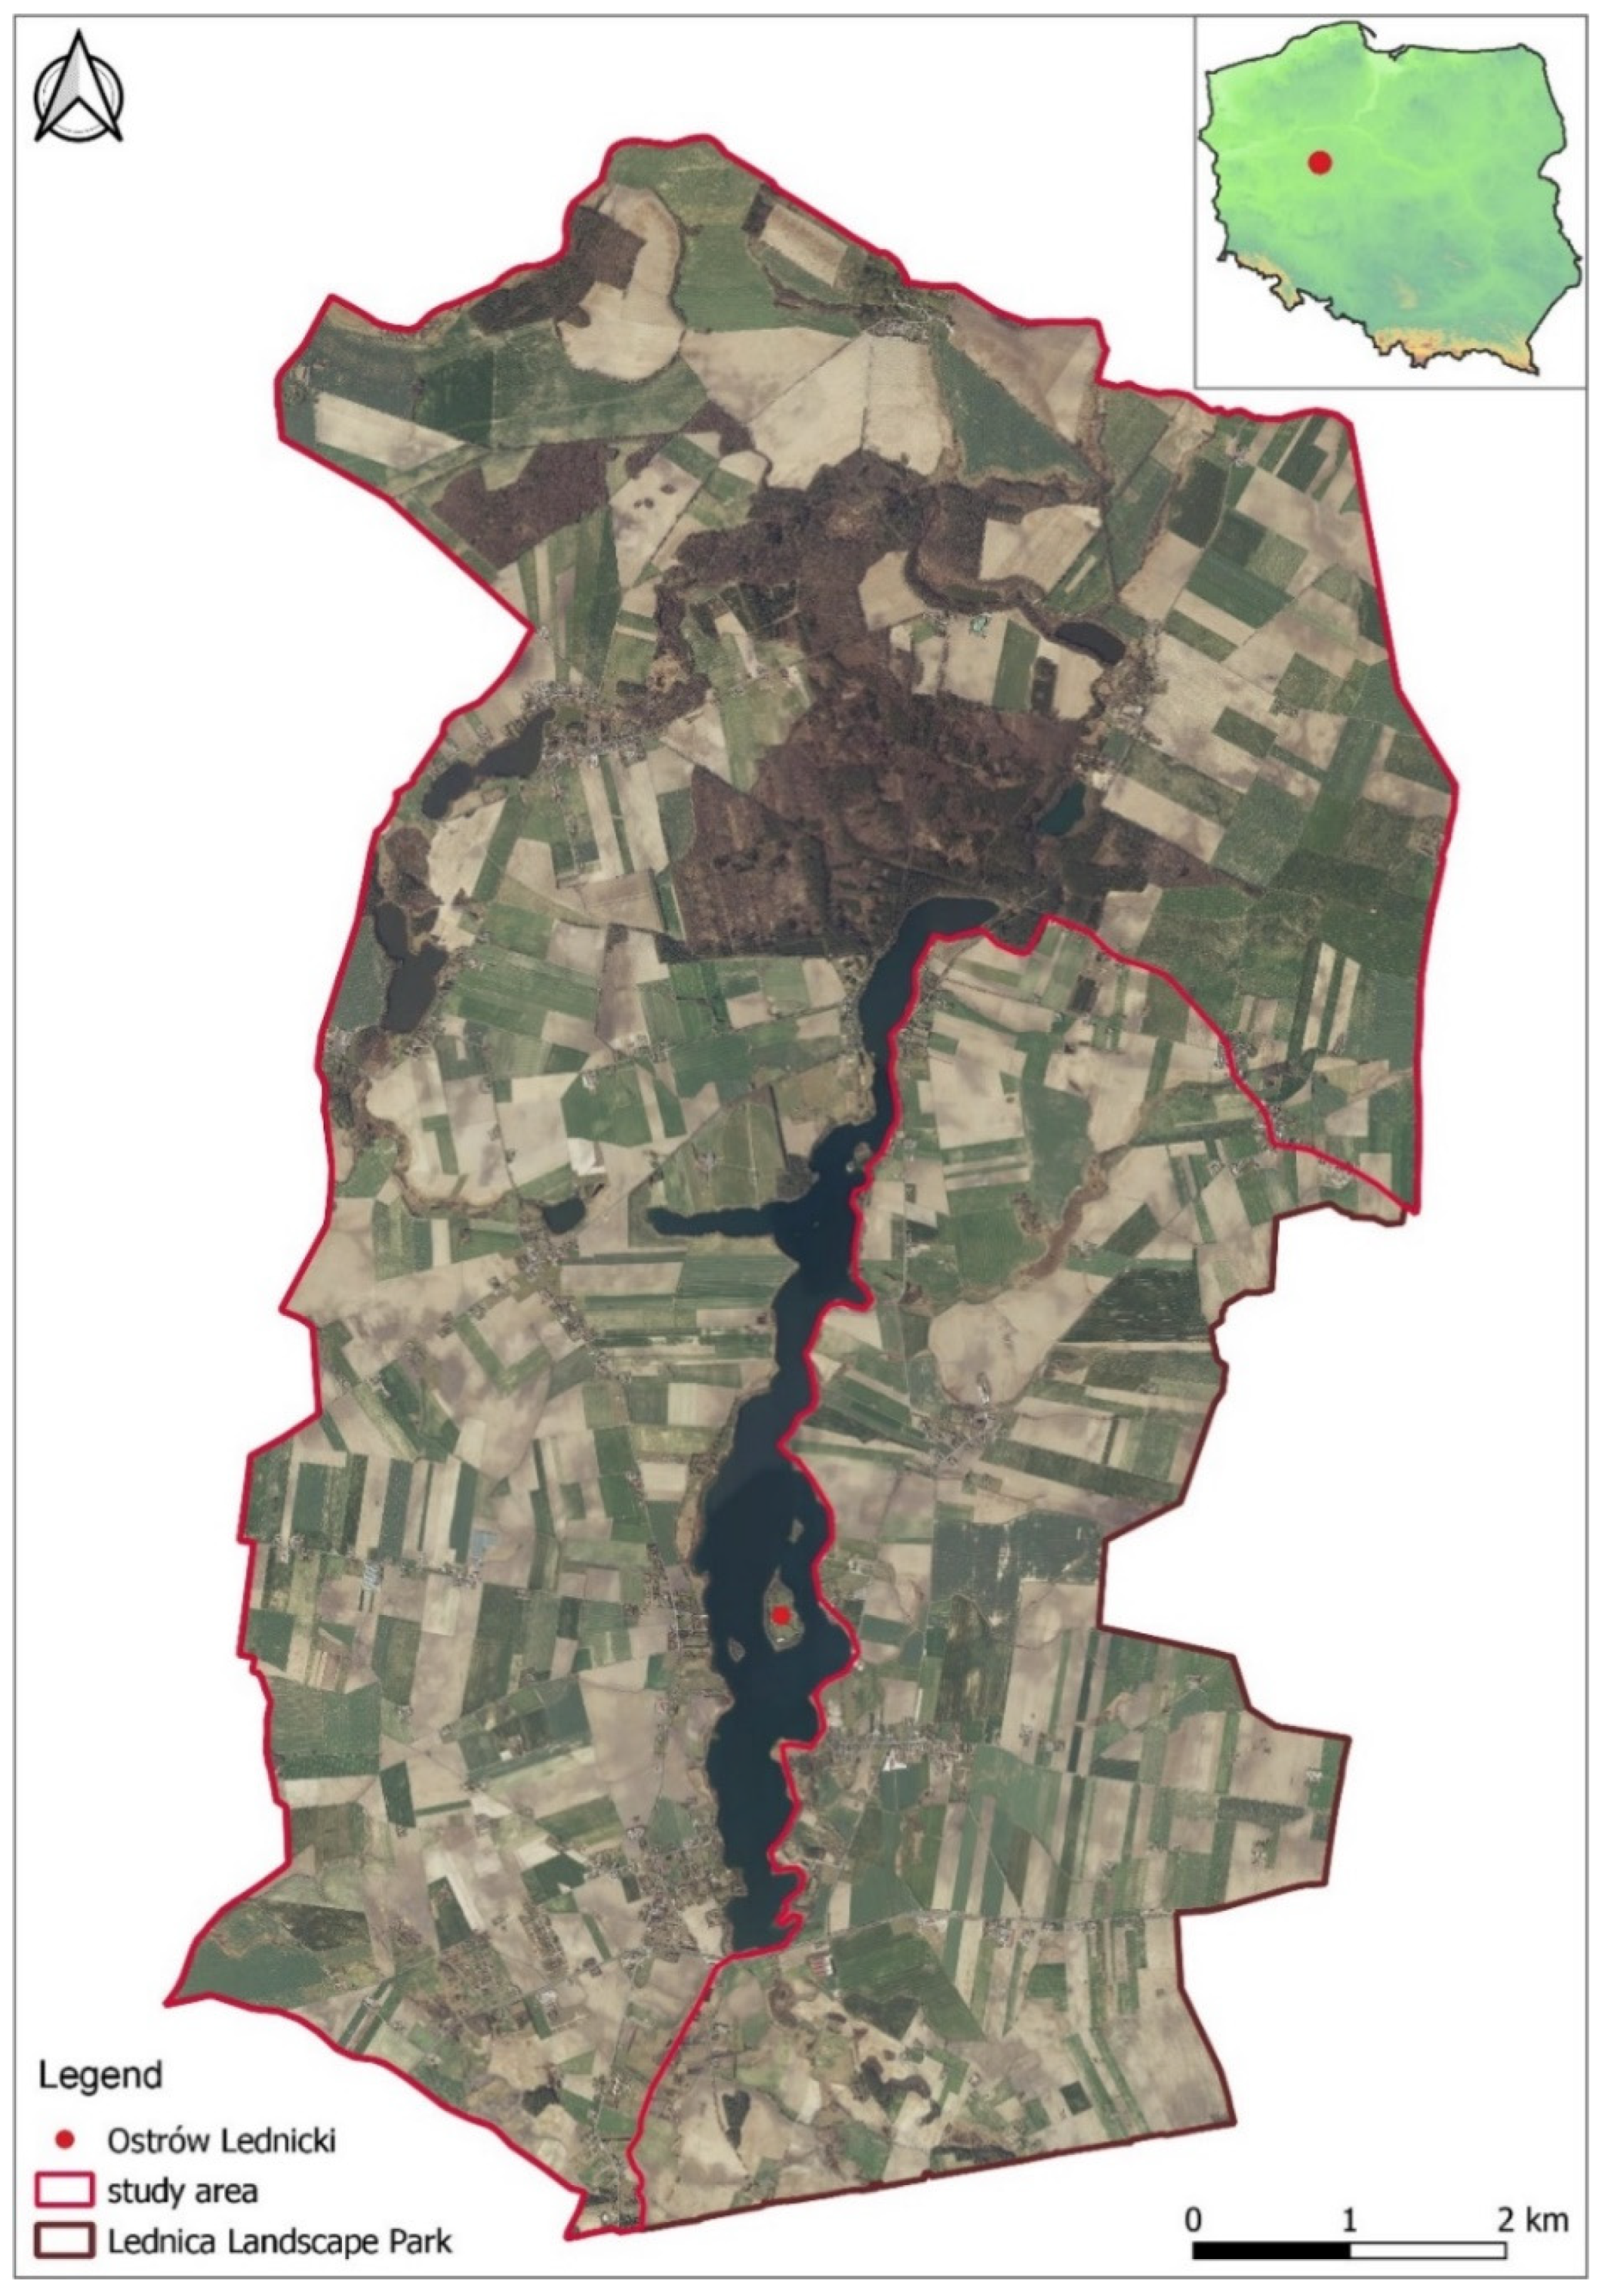
Lednica Landscape Park was created in 1988 to protect the landscape of Lake Lednica. This included cultural and historical heritage with particular emphasis on the medieval stronghold Ostrów Lednicki and associated sites [26] (Figure 1).
However, its mainland surrounding is currently undergoing considerable changes. A noticeable increase of housing estates on the western side of Lake Lednica is undoubtedly helped by recent infrastructure development, which links this area to neighbouring towns (Poznań and Gniezno). Spatial development plans indicate that we can expect the further development of residential areas. Documents issued for the Łubowo commune in 2019 show plans for the extensive conversion of current arable land into building parcels in the southern part of the study area [27]. As it happens, this is also the area where the greatest density of archaeological sites were recorded during a fieldwalking survey in the 1980s (Figure 2).
Polish heritage regulations require that rescue excavation is carried out prior to construction works, but this only applies to previously known sites [28]. Therefore, a major limitation of current heritage policy is imposed by using incomplete archaeological records. To address this problem, spatial data were obtained from the Head Office of Geodesy and Cartography to identify most threatened areas that may require update of records in the first place; this included Topographic Objects Database (BDOT10k), Land and Building Register (EGiB) and vertical photographs [29,30]. However, some issues were identified within existing datasets. For example, the Topographic Objects Database (BDOT10k) was outdated by four years, while vertical coverage for 2019 and 2020 became available in the final phase of the project’s completion.
An attempt was also made to assess the effect of deep ploughing on archaeological structures. An integrated survey programme was implemented, which included a field survey (field walking and geophysical survey), combined with in-situ observations of geomorphological processes. Three areas were selected for detailed field survey. However, field works (in particular the field walking survey) were considerably affected by agricultural practices in selected fields. An unlucky combination of winter crops (rapeseeds and wheat) and maize cultivation, with short periods between agricultural cycles and late harvesting, often enforced field works in less favourable conditions. Whether this was indeed an unfortunate coincidence or the effect of general changes in farming practices remains to be determined. Thus, an 55 km2 area of Lednica Landscape Park was selected for detailed analysis, using Sentinel data obtained between 2016–2020.
3. Materials and Methods
Based on the spatial, temporal and spectral resolution of the Sentinel missions, we initially assumed that Sentinel-2 would be sufficient to provide information about land use and land cover changes in Lednica Landscape Park. Two main aims were defined with regards to Sentinel-2 data:
(1) to assess its usefulness for identification of land use changes caused by construction works and, obtain information about building developments that post-date the Topographic Objects Database BDOT10k.
We aimed to achieve this goal by combining spatial geodetic data with spectral analysis of Sentinel-2 to identify changing image properties that may indicate building progress within individual parcels. Final results were additionally checked against very high resolution orthophotomaps. Time frames were set up between 2017–2020.
(2) to obtain information about annual land cover changes and assess field accessibility in arable areas for two years (2019–2020) of the project’s implementation.
Using NDVI index thresholds set between 0–0.25, we attempted to separate vegetation from exposed bright soils/non-vegetative areas, and identify conditions most suitable for field walking surveys in different seasons.
Despite high temporal resolution, a considerable limitation was imposed on the use of Sentinel-2 by cloud coverage (see below). This encouraged us to assess the potential of Sentinel-1, in particular its higher temporal resolution and penetration of a radar signal through clouds [24]. Research work on Sentinel-1 also demonstrated that buildings are characterised by a medium or even strong signal return, which could facilitate their detection [31]. As a result, we decided to test Sentinel-1 images for identification of individual buildings in rural areas characterised by relatively dispersed housing (in comparison with urban zones).
3.1. Image Acquisition and Pre-Processing
3.1.1. Optical Data
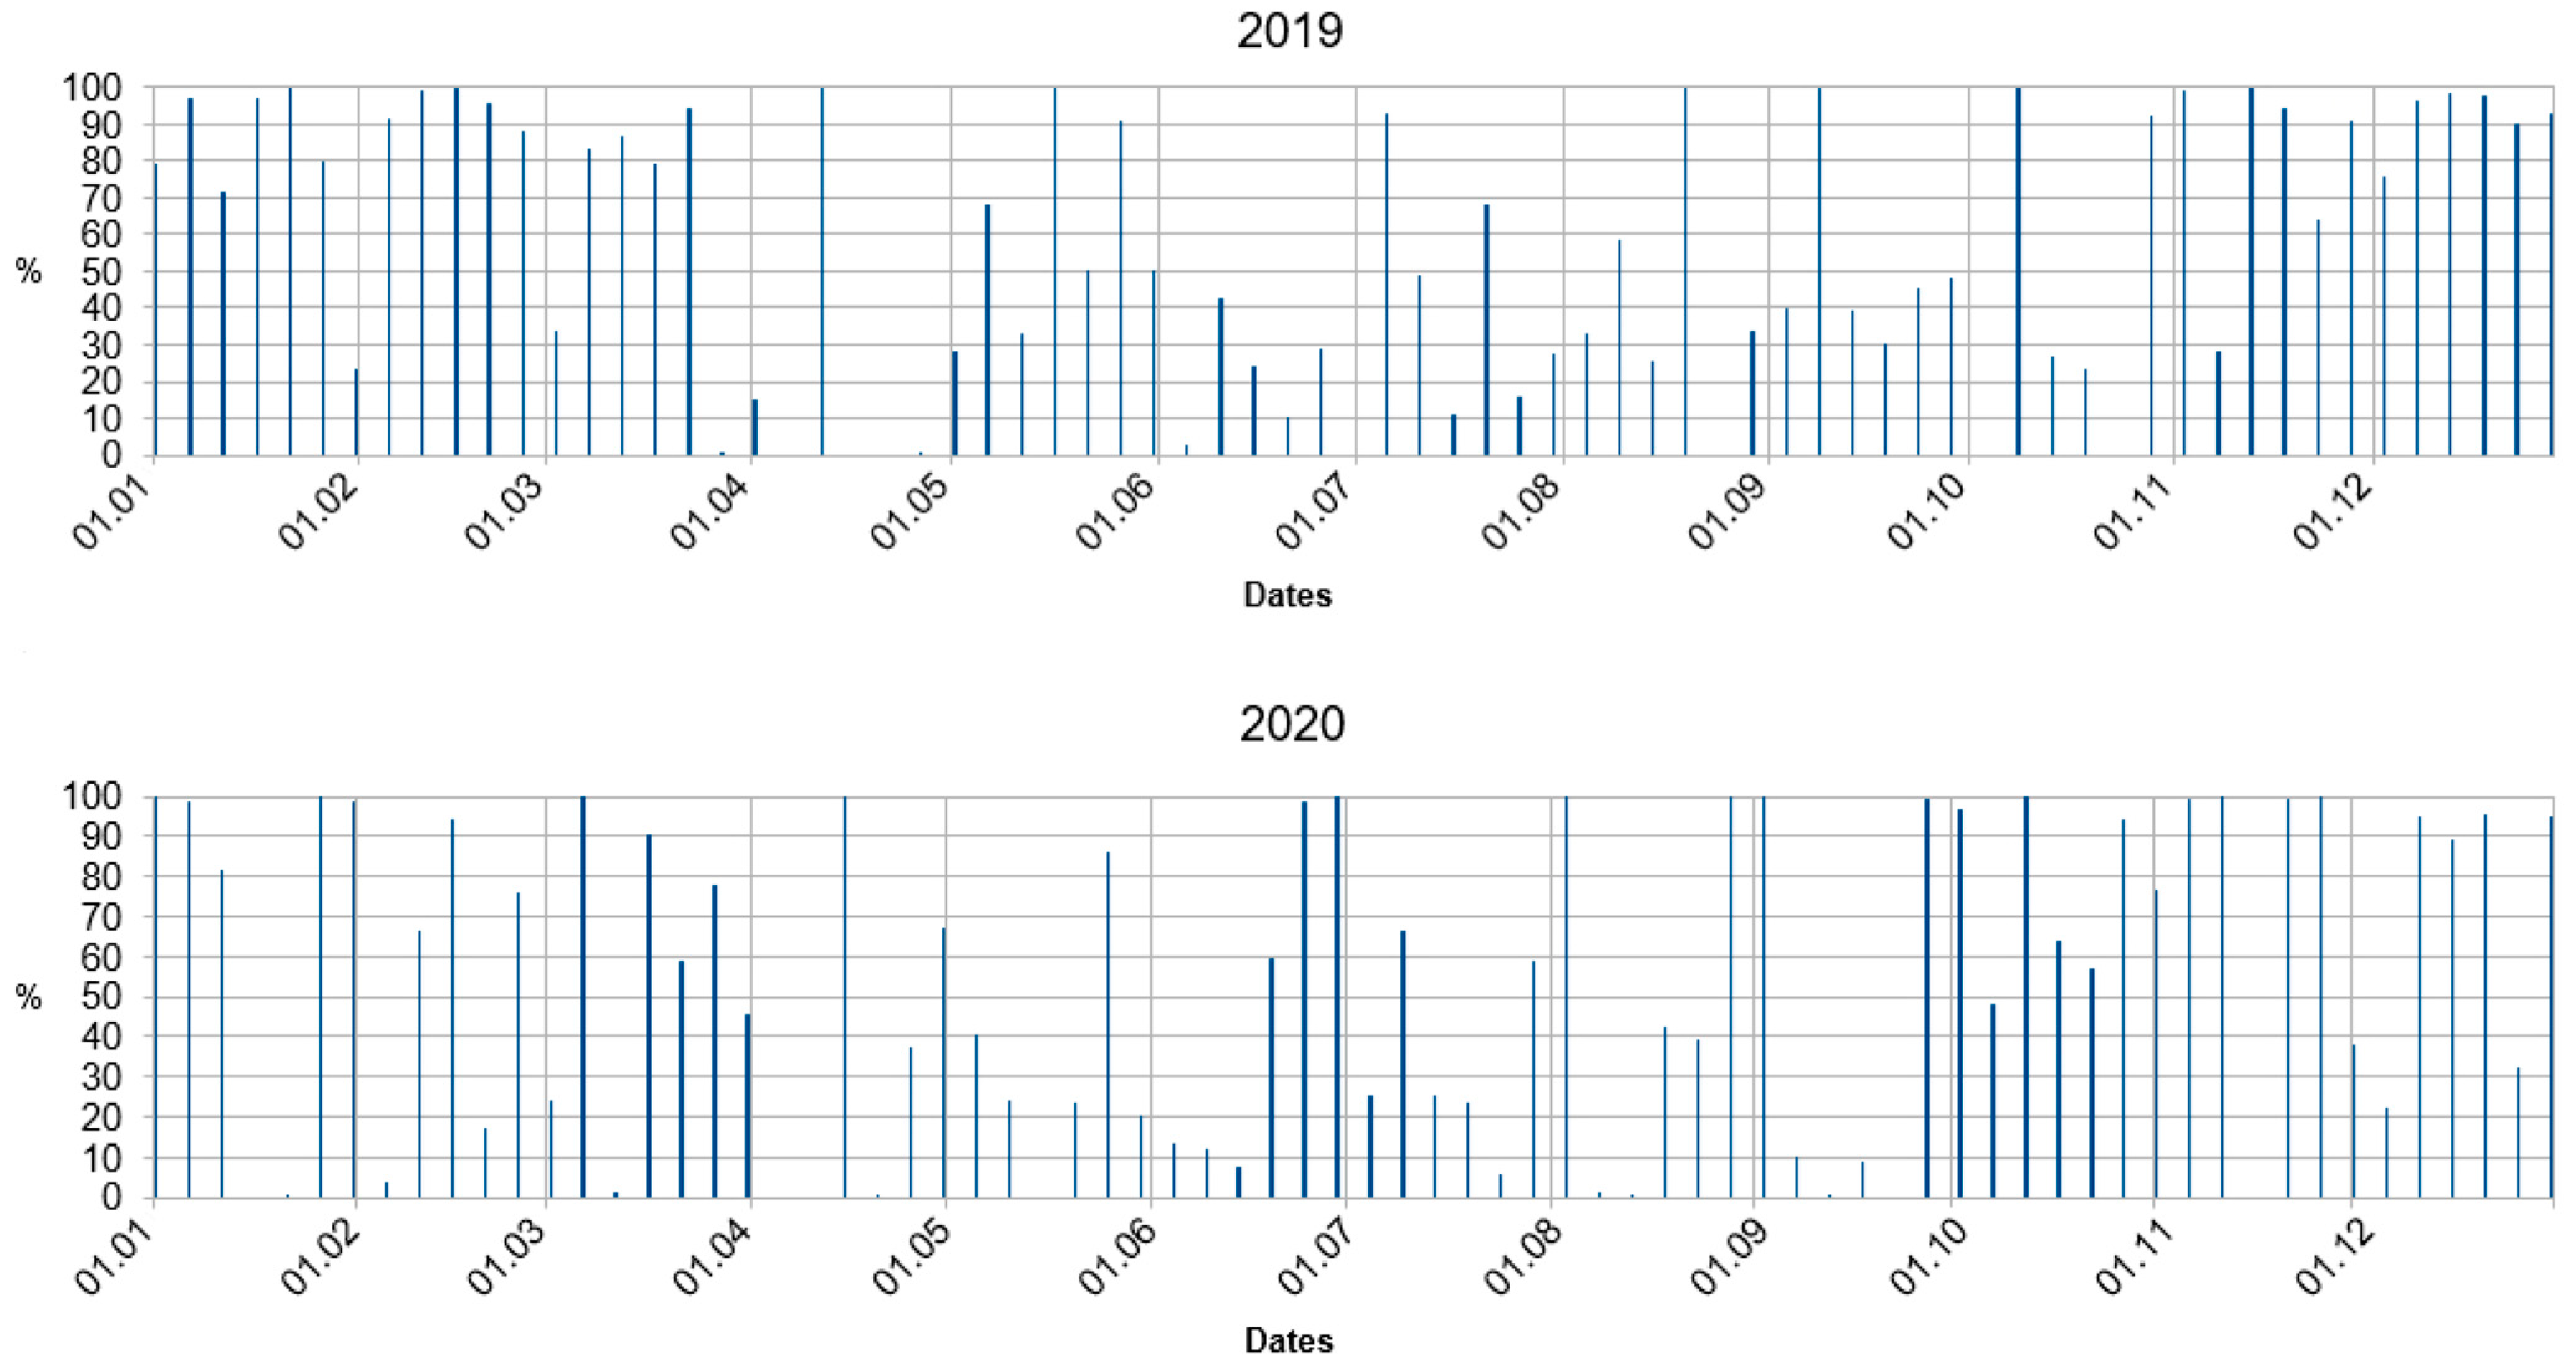
Sentinel-2 images were searched in the collection COPERNICUS/S2_SR, and cropped to a regular shape using Google Earth Engine (GEE) code editor. GEE was assessed as the most effective method of data acquisition and pre-processing. Its ‘cloud’ environment gives access to data that are copied from the ESA public hub, as well as its ability to process it through a programming environment, using the JavaScript or Python language [32]. In this case, an additional script in Java was written to execute the first step of data preparation. Image acquisition was also simplified by location of the study area within one tile, designated T33UXU (UTM). The basic selection criterion was cloud cover. Its value was established for less than or equal to 70% (Figure 3). High value of the cloudiness parameter was assumed, as the study area covers only 0.006% of the section area (LLP covers 76.18 km2 while the single Sentinel-2 tile covers 12,100 km2). Image searching ranged between 1 January 2019 and 31 December 2020.
Image pre-processing also included computing NDVI layer, its export to TIFF multiband format and downloading to local environment for further works. Calculation of the commonly used NDVI was executed according to the formula adapted to Sentinel-2
where:
NDVI = (S2B8 − S2B4)/(S2B8 + S2B4)
- S2B4 = Sentinel-2 spectral band, red range with bandwidth of 31 nm and central wavelength at 665 nm,
- S2B8 = Sentinel-2 spectral band, near-infrared range with bandwidth of 106 nm and central wavelength at 833 nm,
NDVI results were saved in TIFF format with 32-bit floating-point coding and the index theoretically variability ranging from −1 to 1.
3.1.2. Radar Data
Sentinel-1 data were also acquired through the Google Earth Engine. It offers calibrated and pre-processed data that greatly reduces time required for preliminary data processing [33]. The collection COPERNICUS/S1_GRD offers Sentinel-1 Ground Range Detected High (GRDH) scenes, processed by Google staff using Sentinel-1 Toolbox, to generate a calibrated, ortho-corrected product. Data is acquired by a sensor set to an Interferometric Wide Swath mode with two polarisation, VV and VH, and two orbits: descending and ascending. Pre-processing steps by Google include the application of the orbit file, border noise removal, thermal noise correction, radiometric calibration and ortho-rectification with global DEM. It is worth emphasising that speckle filtering and multi-looking filters are not used. This helps preserve image quality, as the application of those filters reduces spatial resolution—an occurrence generally noted by the research community [34,35]. Final products that are shared with the user community is a backscatter coefficient (σ°) in decibels (dB). The backscatter coefficient represents target backscattering area (radar cross-section) per unit ground area. It can vary by several orders of magnitude, and therefore it is converted to dB as 10 × log10σ° [36]. The resulting spatial resolution of the S1_GRD product layers is 10 m × 10 m (pixel spacing).
To ensure identification of relatively small features such as buildings, image legibility was increased through long-term averaging [34]. The averaging period corresponded essentially to months, and thus 30-day averaging periods were used in calculations. Pixel values were calculated from all available images, which were divided according to the type of orbit and signal polarisation. An additional element of the calculations is noise removal at the edge of the image. In total, 878 images were registered over Lednica Landscape Park within 4 years (2016–2019). By performing averaging calculations, 192 images were finally obtained (48 months × two types of satellite movement paths × 2 types of polarisation). The Java script was also used in the GEE code editor to search, crop and prepare averaged images. At the final stage, data were exported to the TIFF format and downloaded to the local environment for further processing.
3.1.3. Local Geospatial Data
A range of geospatial data was obtained from the central database maintained by the Head Office of Geodesy and Cartography (GUGiK) and local offices (District Centre of Geodesy and Cartography in Poznań and Gniezno). This included:
- (1)
- very high-resolution orthophotomaps used as a reference dataset to additionally check new buildings that were identified in spectral analysis;
- (2)
- water bodies layer from Topographic Objects Database (BDOT10k) to clear NDVI thresholding results within lakes;
- (3)
- administrative boundaries layer from Topographic Objects Database (BDOT10k) to crop satellite images;
- (4)
- building layer from Topographic Objects Database (BDOT10k),
- (5)
- property parcels layer from Land and Building Register (EGiB).
3.2. Geospatial and Geostatistacal Analysis
3.2.1. Spectral Analysis of Changes within Building Parcels
Relatively dispersed new housing required efficient identification of building works at a considerable area. Therefore, analysis were carried out within building parcels that were obtained from Land and Building Register (EGiB). Parcels that were intended for buildings were extracted using two selection criteria: parcel size and elongation. The second criterion aimed to exclude elongated parcels, such as roads. Shape elongation factor (lower than 1.5) was applied, based on the formula of polygon circumference ratio to circle circumference within the same area. The maximum size of the parcel was set to 4500 m2. As a result, 1204 potential building parcels were selected that did not exceed this size.
Changing land cover is associated with changing values in visible and infrared channels. For example, the appearance of vegetation causes a decrease in visible reflection and an increase in infrared reflection. Assuming that construction works will cause a considerable change in brightness (due to contrast between top layer and bedrock), we attempted to identify those changes by calculating average spectral brightness within individual parcels. Four spectral bands with the highest spatial resolution were selected: S2B2, S2B3, S2B4 and S2B8. Analysis were conducted for two dates: 13 August 2019 and 20 April 2020, corresponding with vertical photographs’ acquisition (31 August 2019 and 8 April 2020, respectively) that were later used as reference data to verify results of statistical analysis of satellite data. Statistical analysis of spectral properties within parcel boundaries were based on the calculation of the mean and variance for individual parcels. While the mean as a statistical parameter expresses the average brightness computed from all pixels, it is not related to the differences, and even blurs them. The variance relates to the brightness contrast between pixels, and as such can better describe the changes that have occurred in the parcel area over time (e.g., construction works). Finally, the difference of statistical parameters for individual parcels between two dates were calculated.
3.2.2. Identification of Dispersed Buildings Using Averaged Radar Images
In case of Sentinel-1, 30-day averaged radar images that resulted from calculations in the GEE cloud environment were used for comparative interpretation with the building layer that was obtained from the Topographic Objects Database (BDOT10k). A layer containing buildings’ outlines was used as a reference point to assess the potential of radar images. Each averaged radar image was visually compared with the building layer to identify the threshold value for buildings. This helped establish whether the resolution and legibility of Sentinel-1 images was sufficient to identify individual buildings.
3.2.3. Assessment of Arable Land Availability for Field Survey
The following local processing was carried out:
- Execution of thresholding in the range of 0–0.25, which resulted in a binary image, where 1 = ground devoid of vegetation and 0 = remaining areas.
- Creation of a mask for water using water bodies layer from topographic database to clear NDVI layer thresholds results within lakes. At certain times of year, NDVI values of lakes exceed value “0” (due to biological life-floating plants in the water or when the surface of the water freezes). For this reason, when analysis is conducted without masking, thresholds may also include surfaces of water bodies.
- Conversion of result from raster to vector format and cleaning vector data (artefacts after the vectorisation process). This included removal of contours smaller than 0.25 ha and the removal of water-related surfaces by subtracting a water mask.
- Calculation of the vegetation-free area for whole research site.
- Construction of yearly cycle of vegetation-free area patterning.
4. Results
4.1. Land Use Changes (Building Parcels)
Based on the analysis of the normalised values of the differences in statistical parameters of selected parcels, the greatest differentiation of the spectral features in the blue range was found for the variance. On the basis of obtained values, two threshold values were set up on the assumption that they may indicate changes within building parcels:
- -
- positive values: 15,000 (and more)
- -
- negative values: −15,000 (and less).
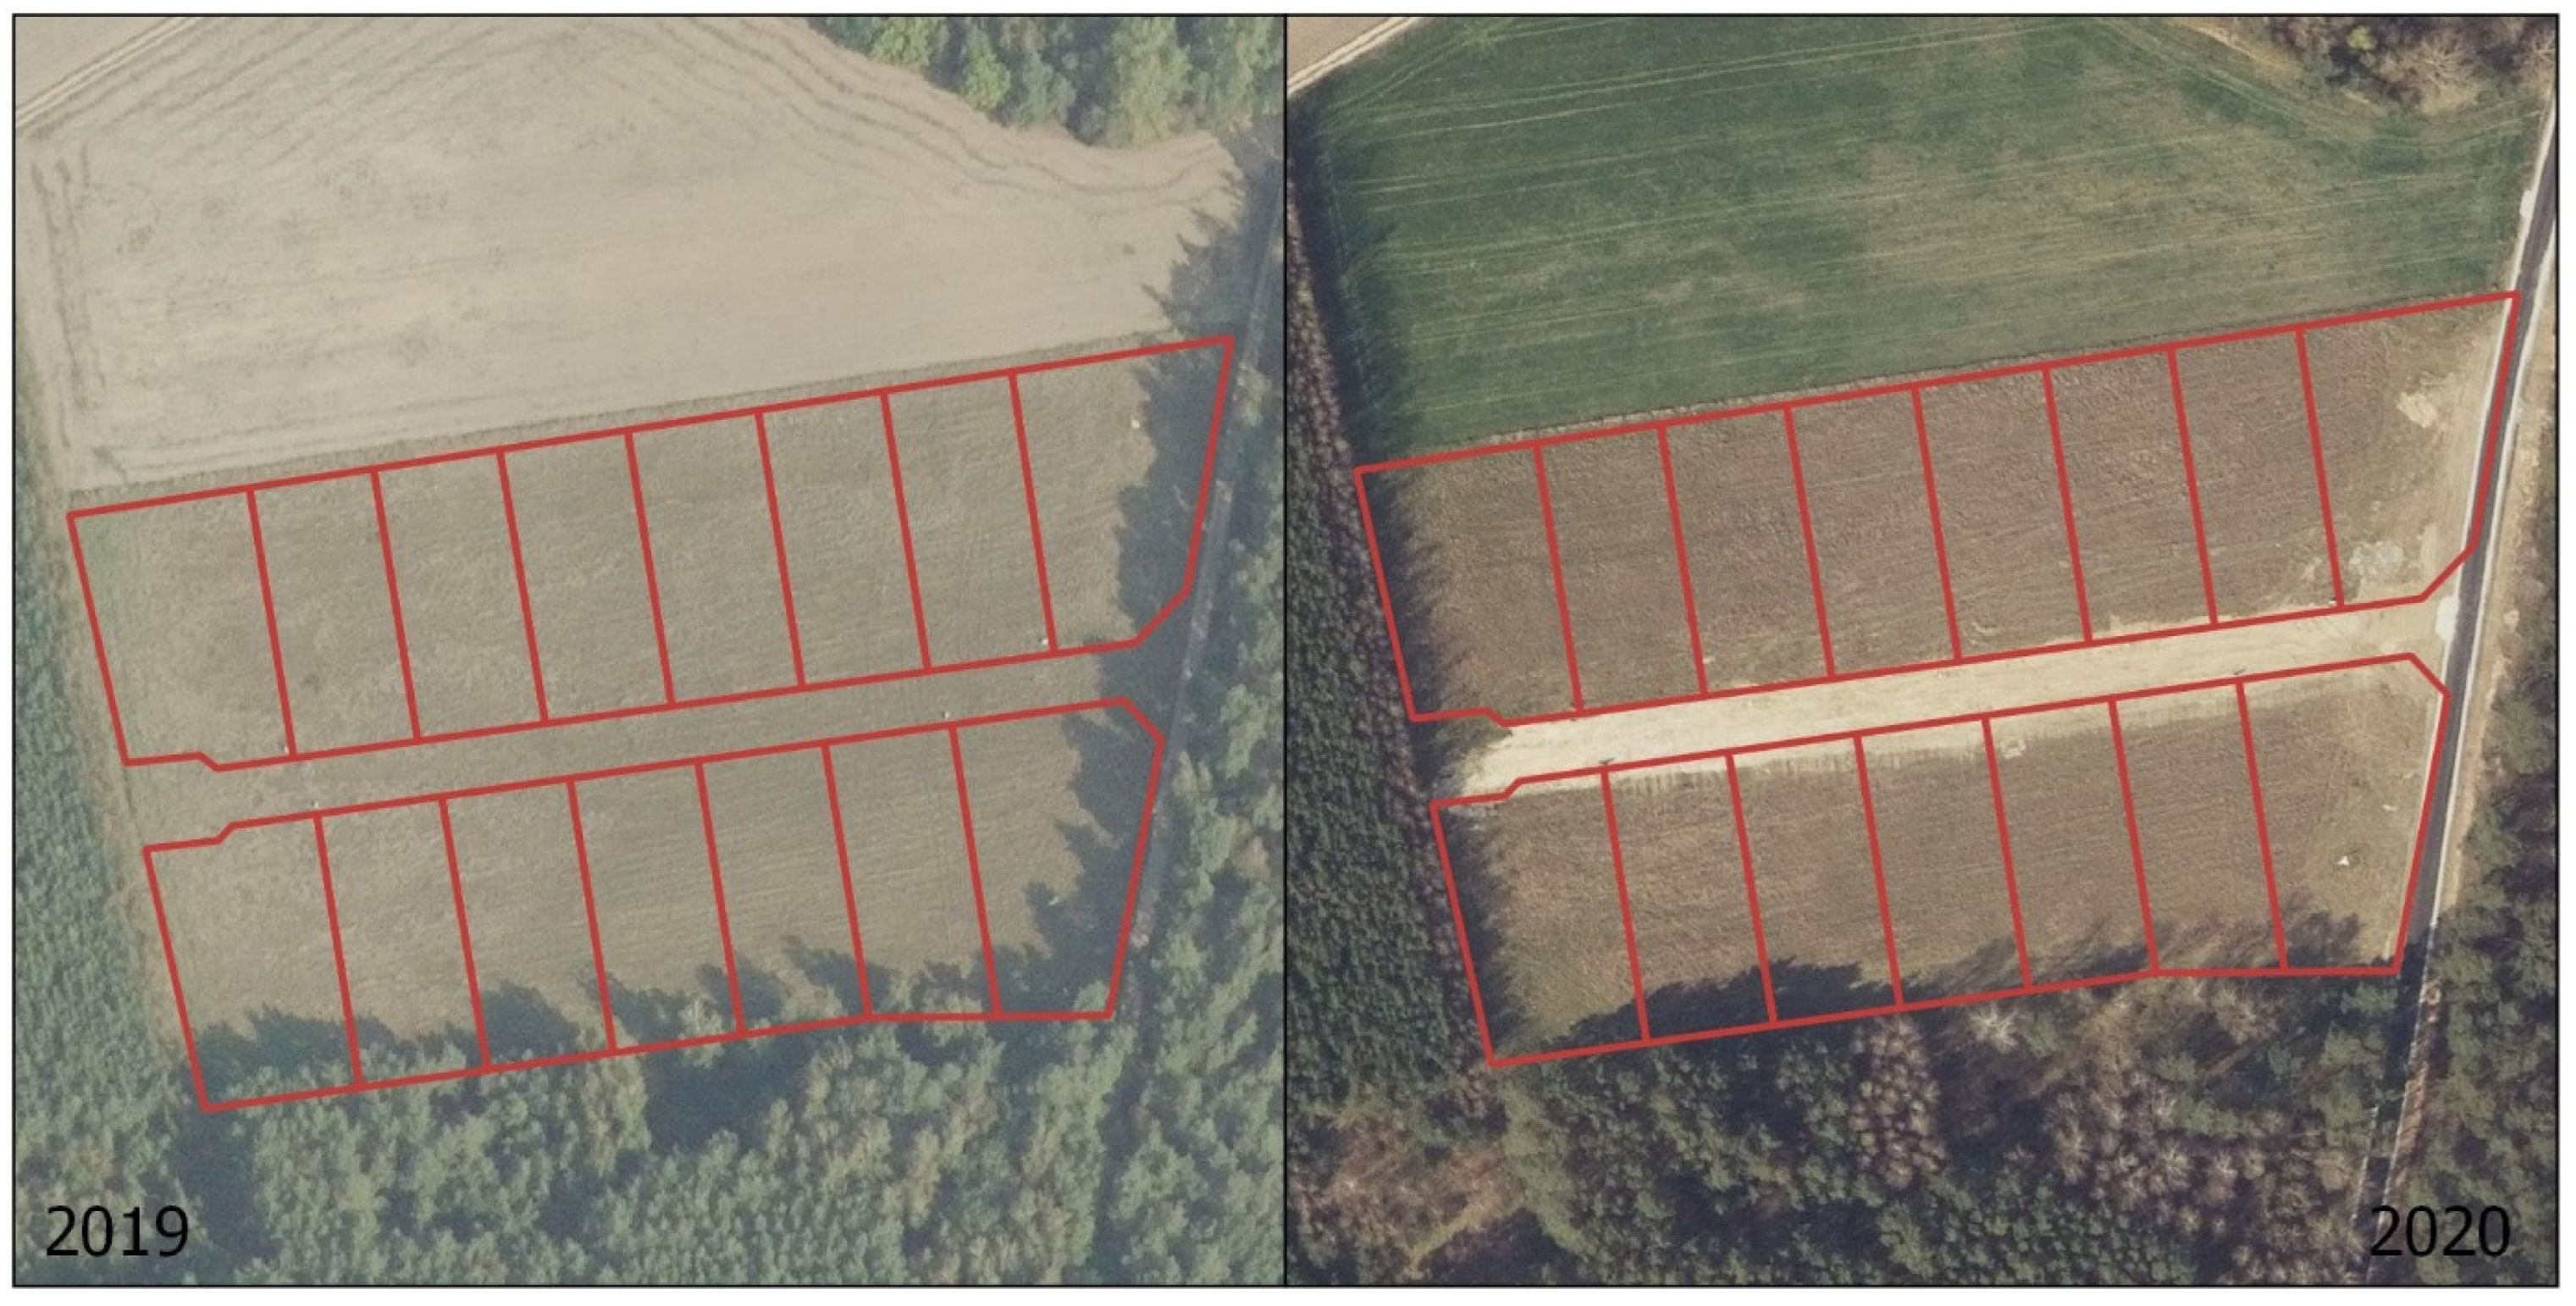
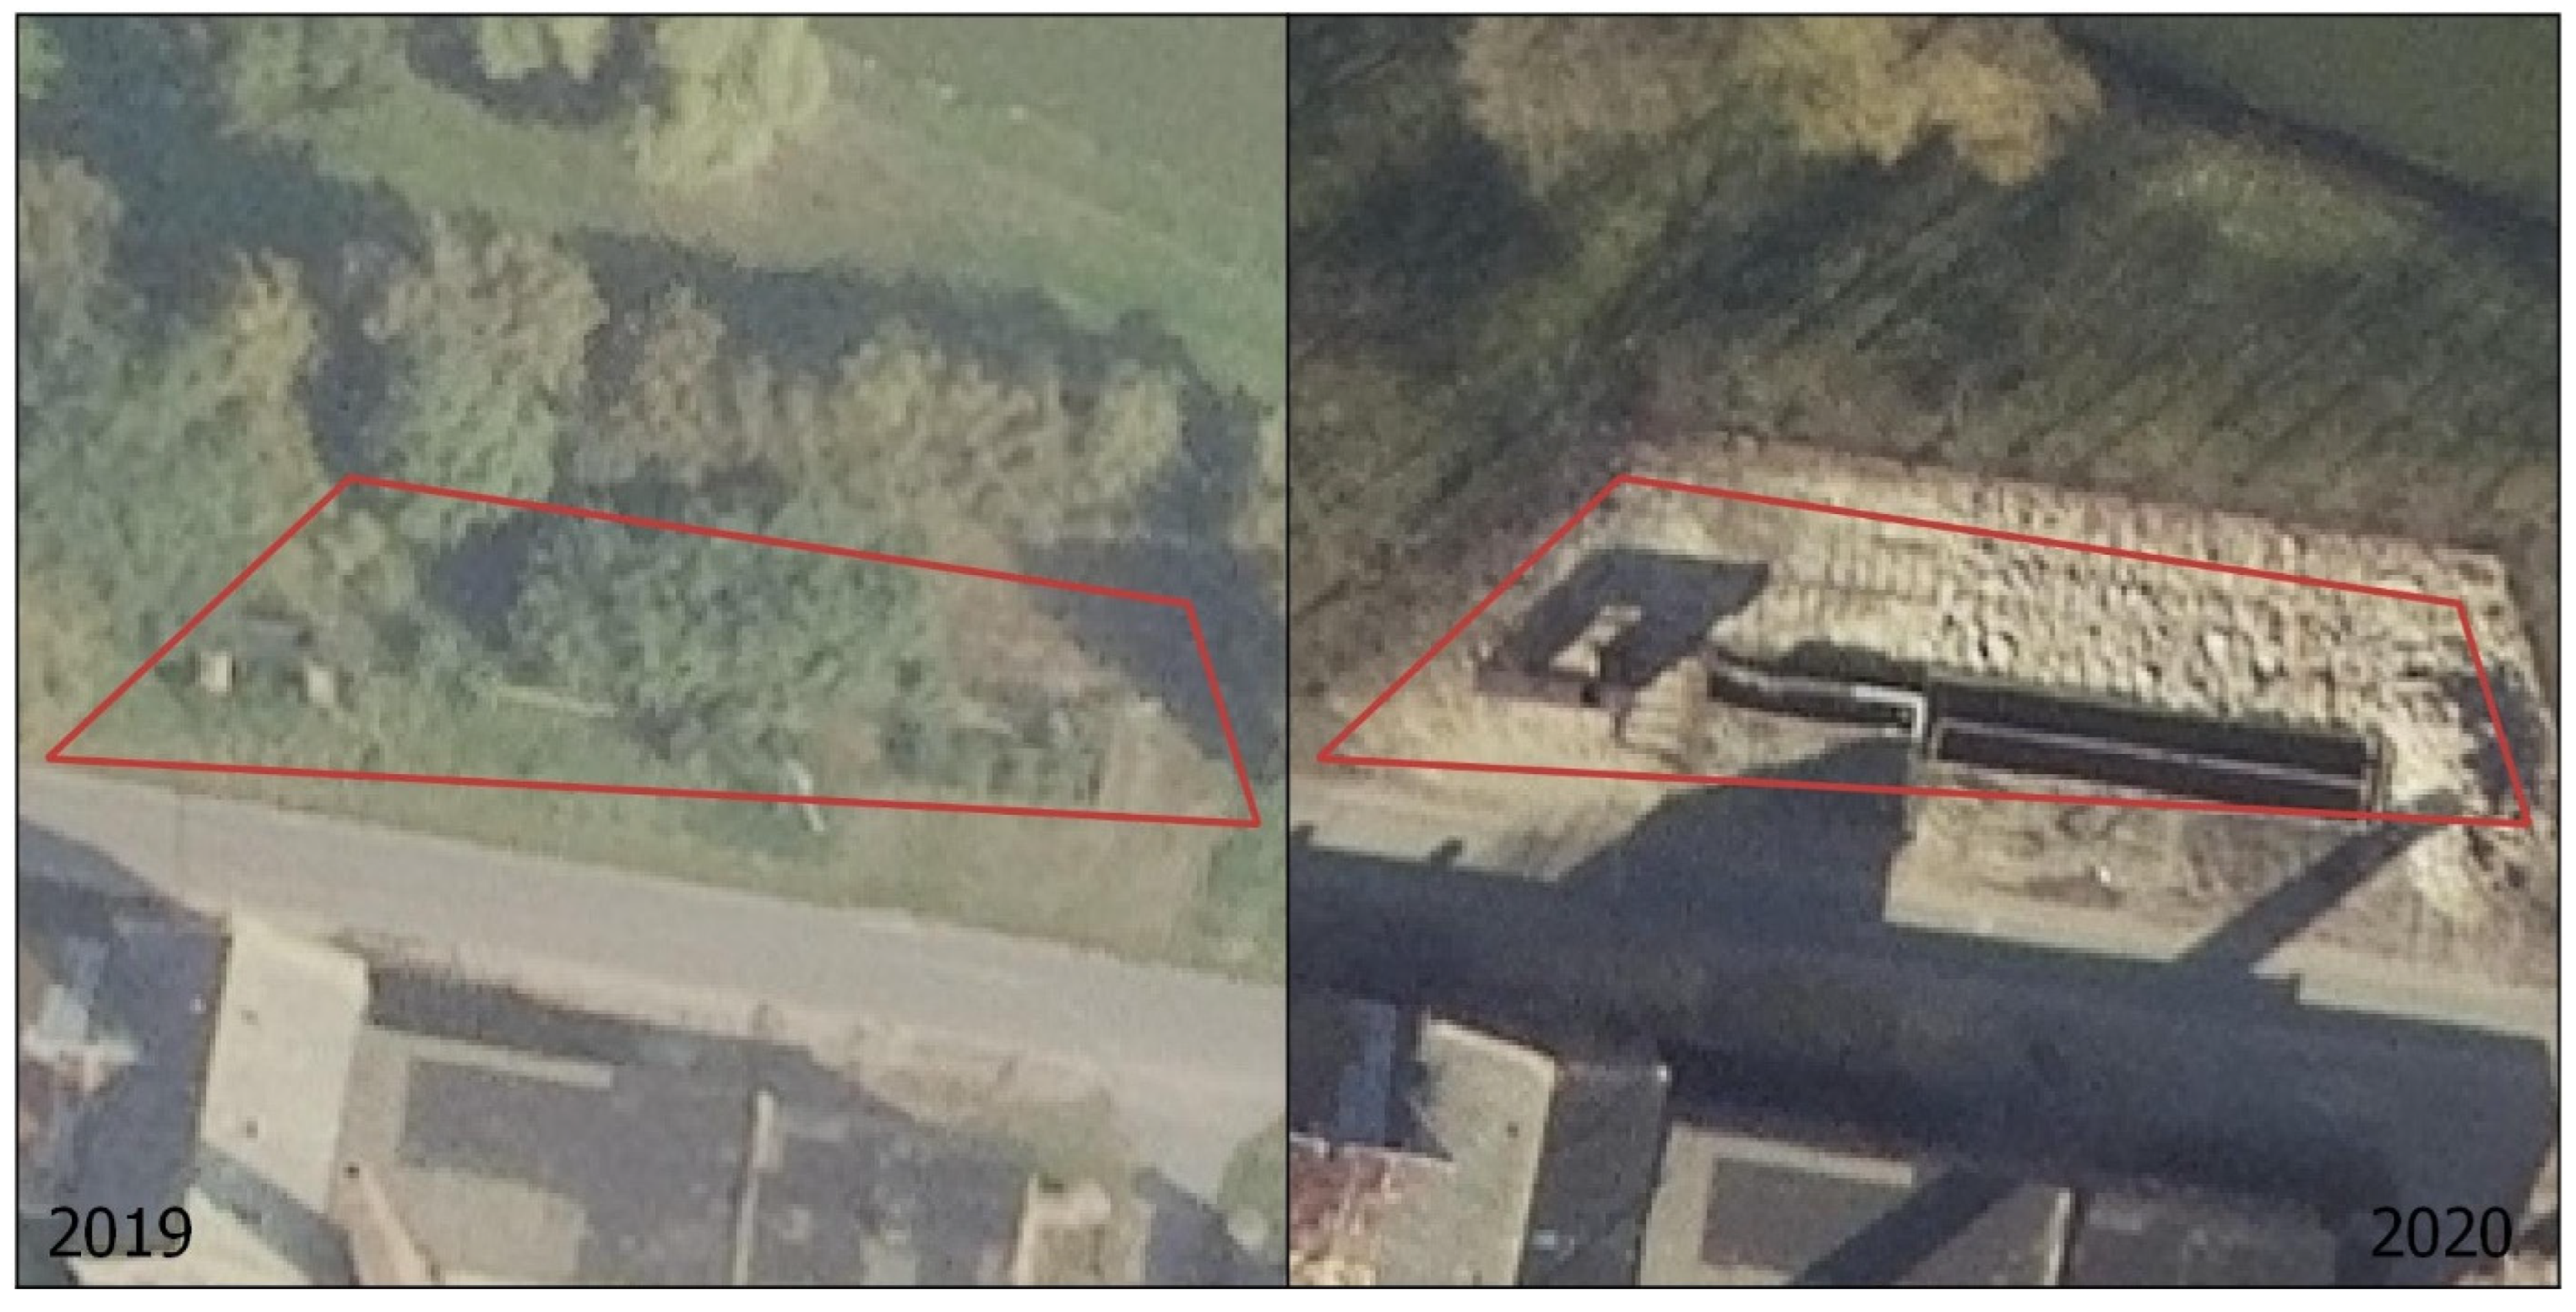
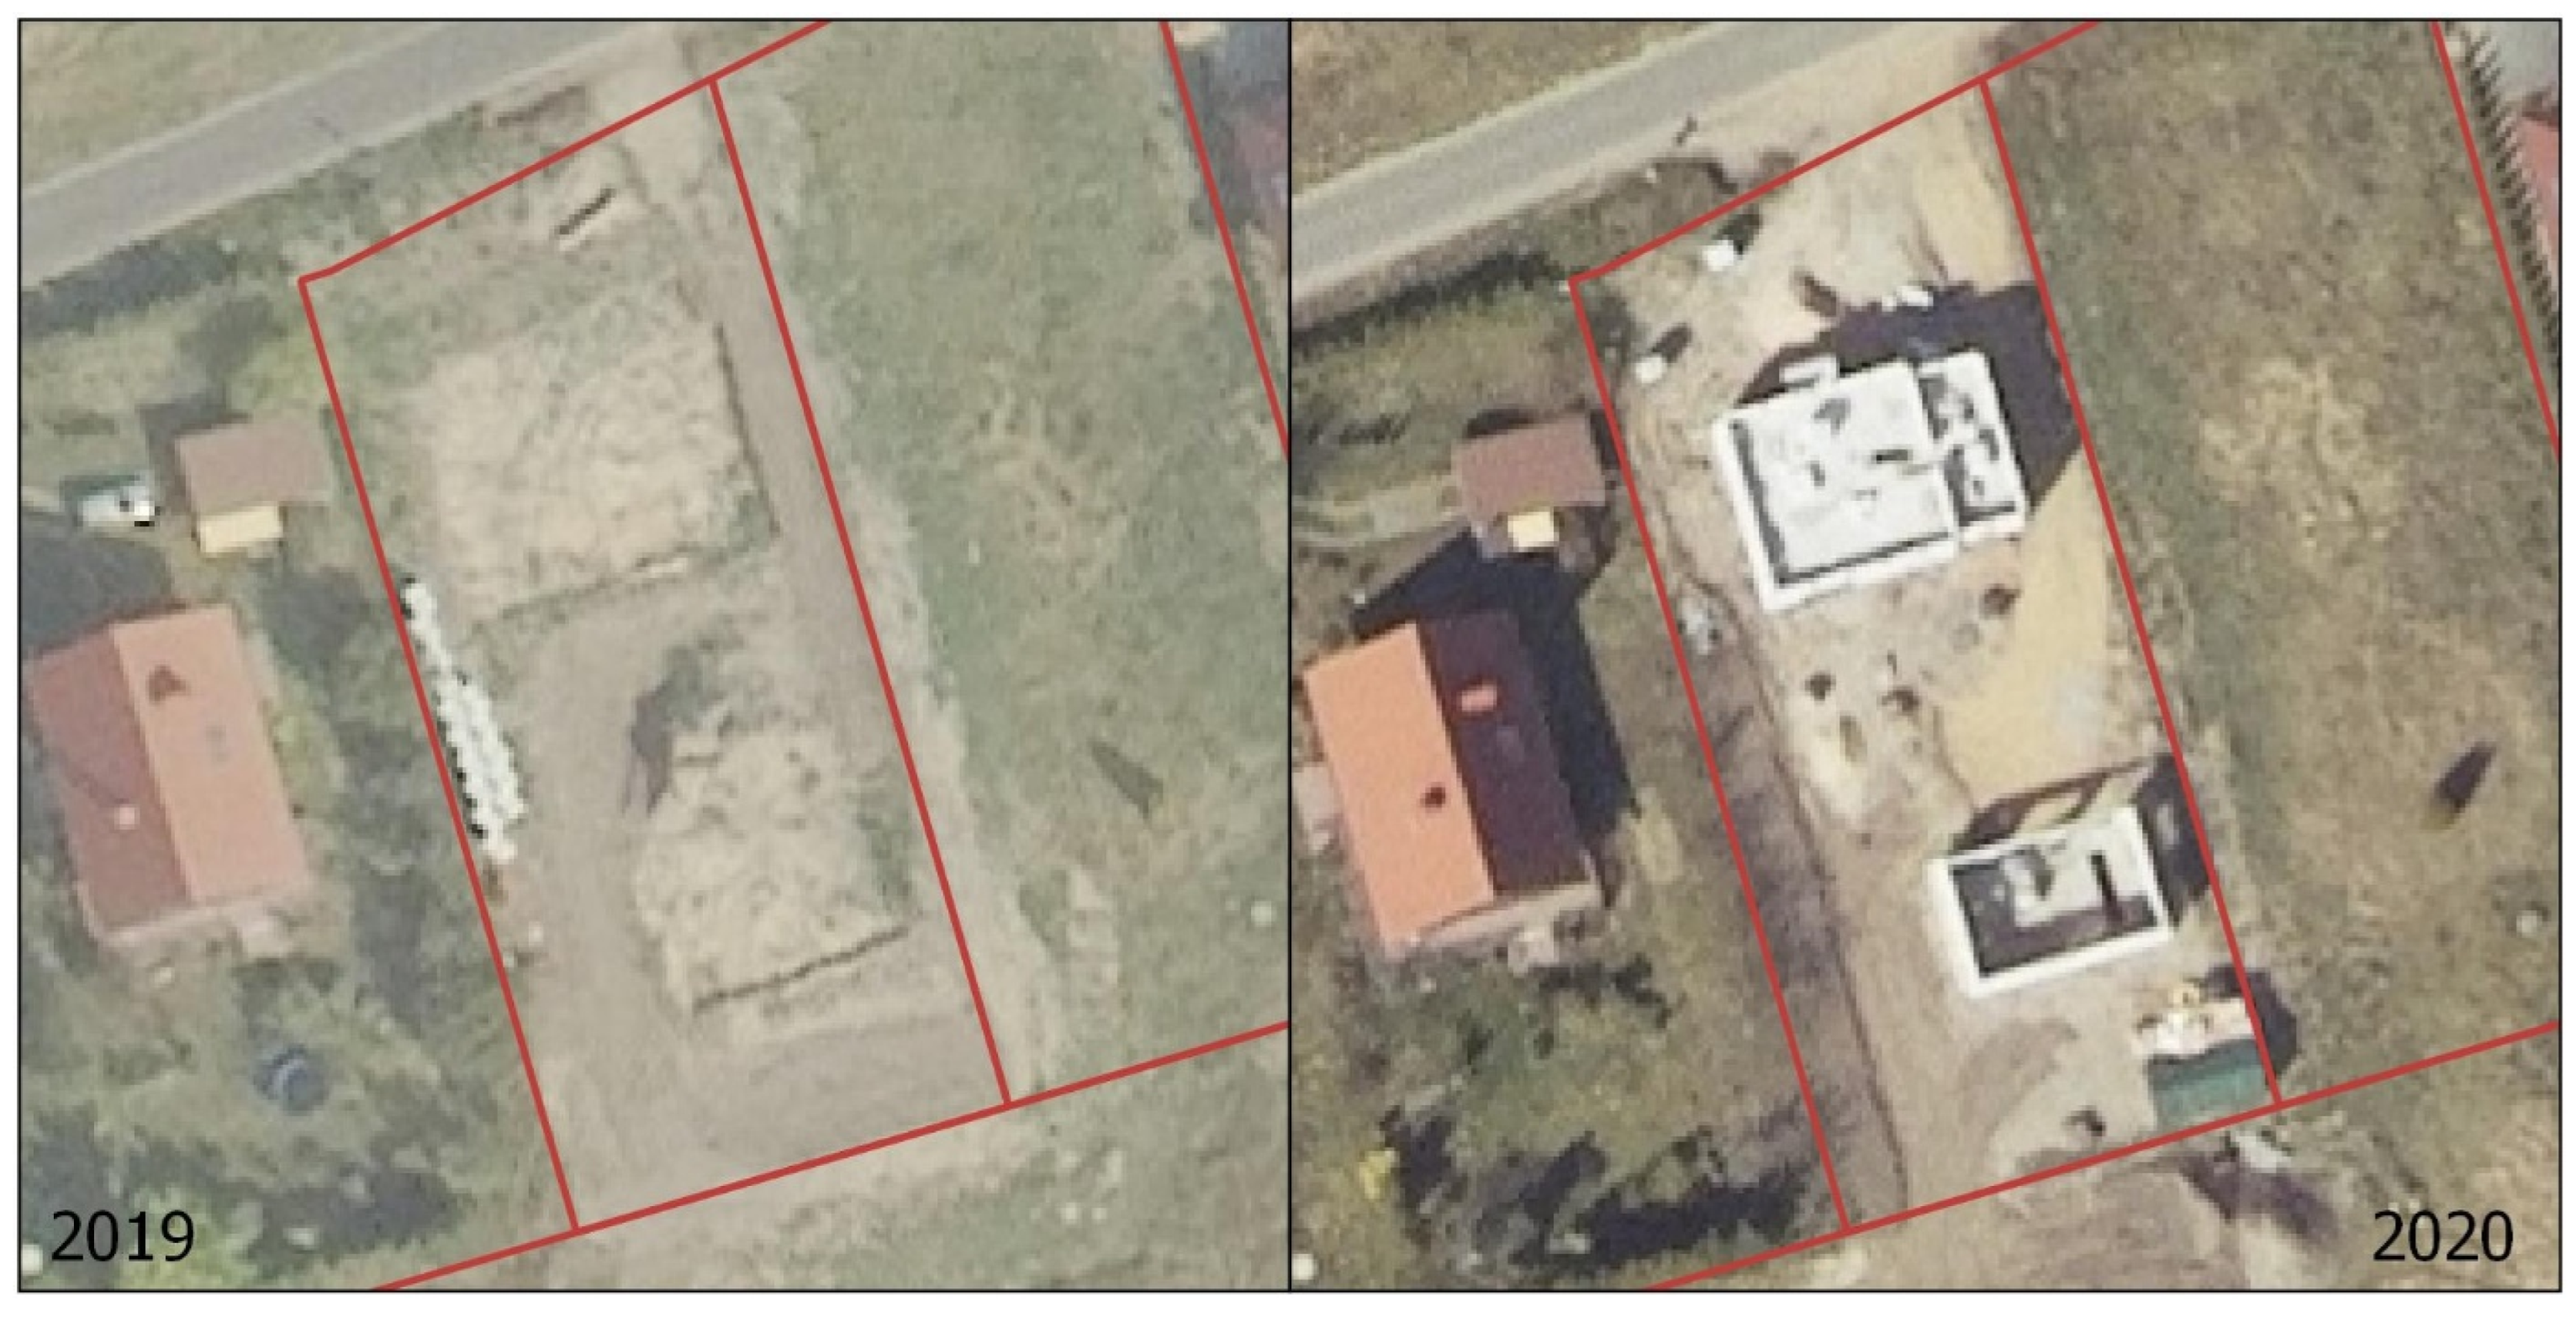
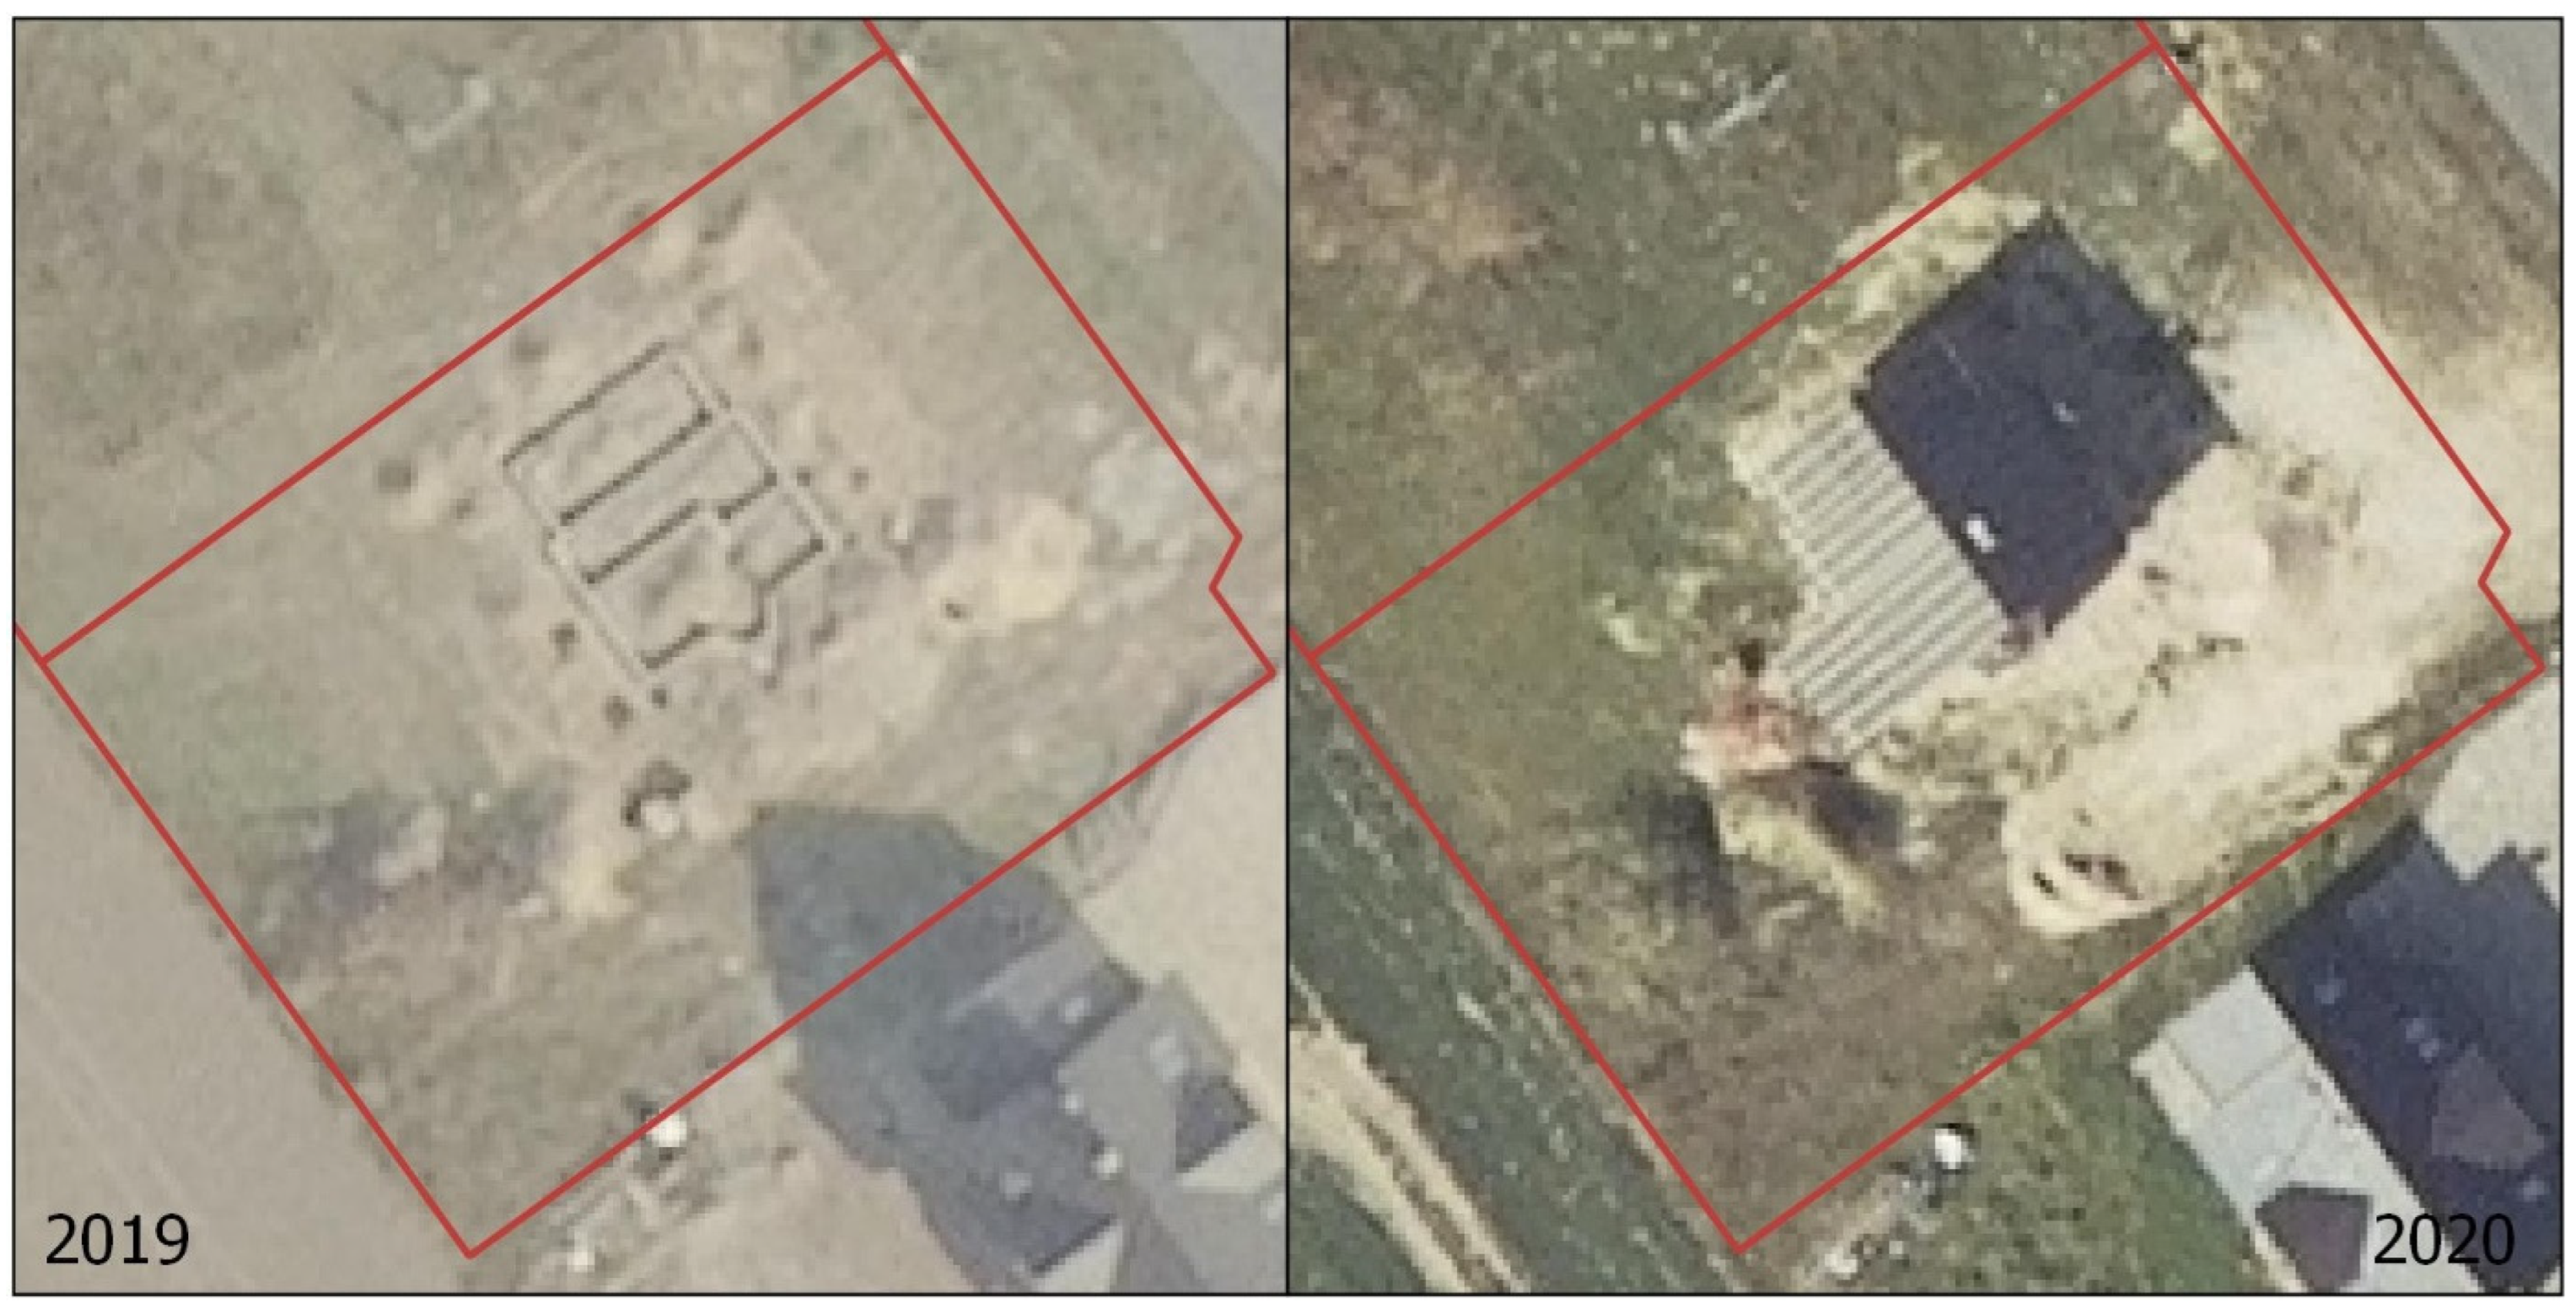
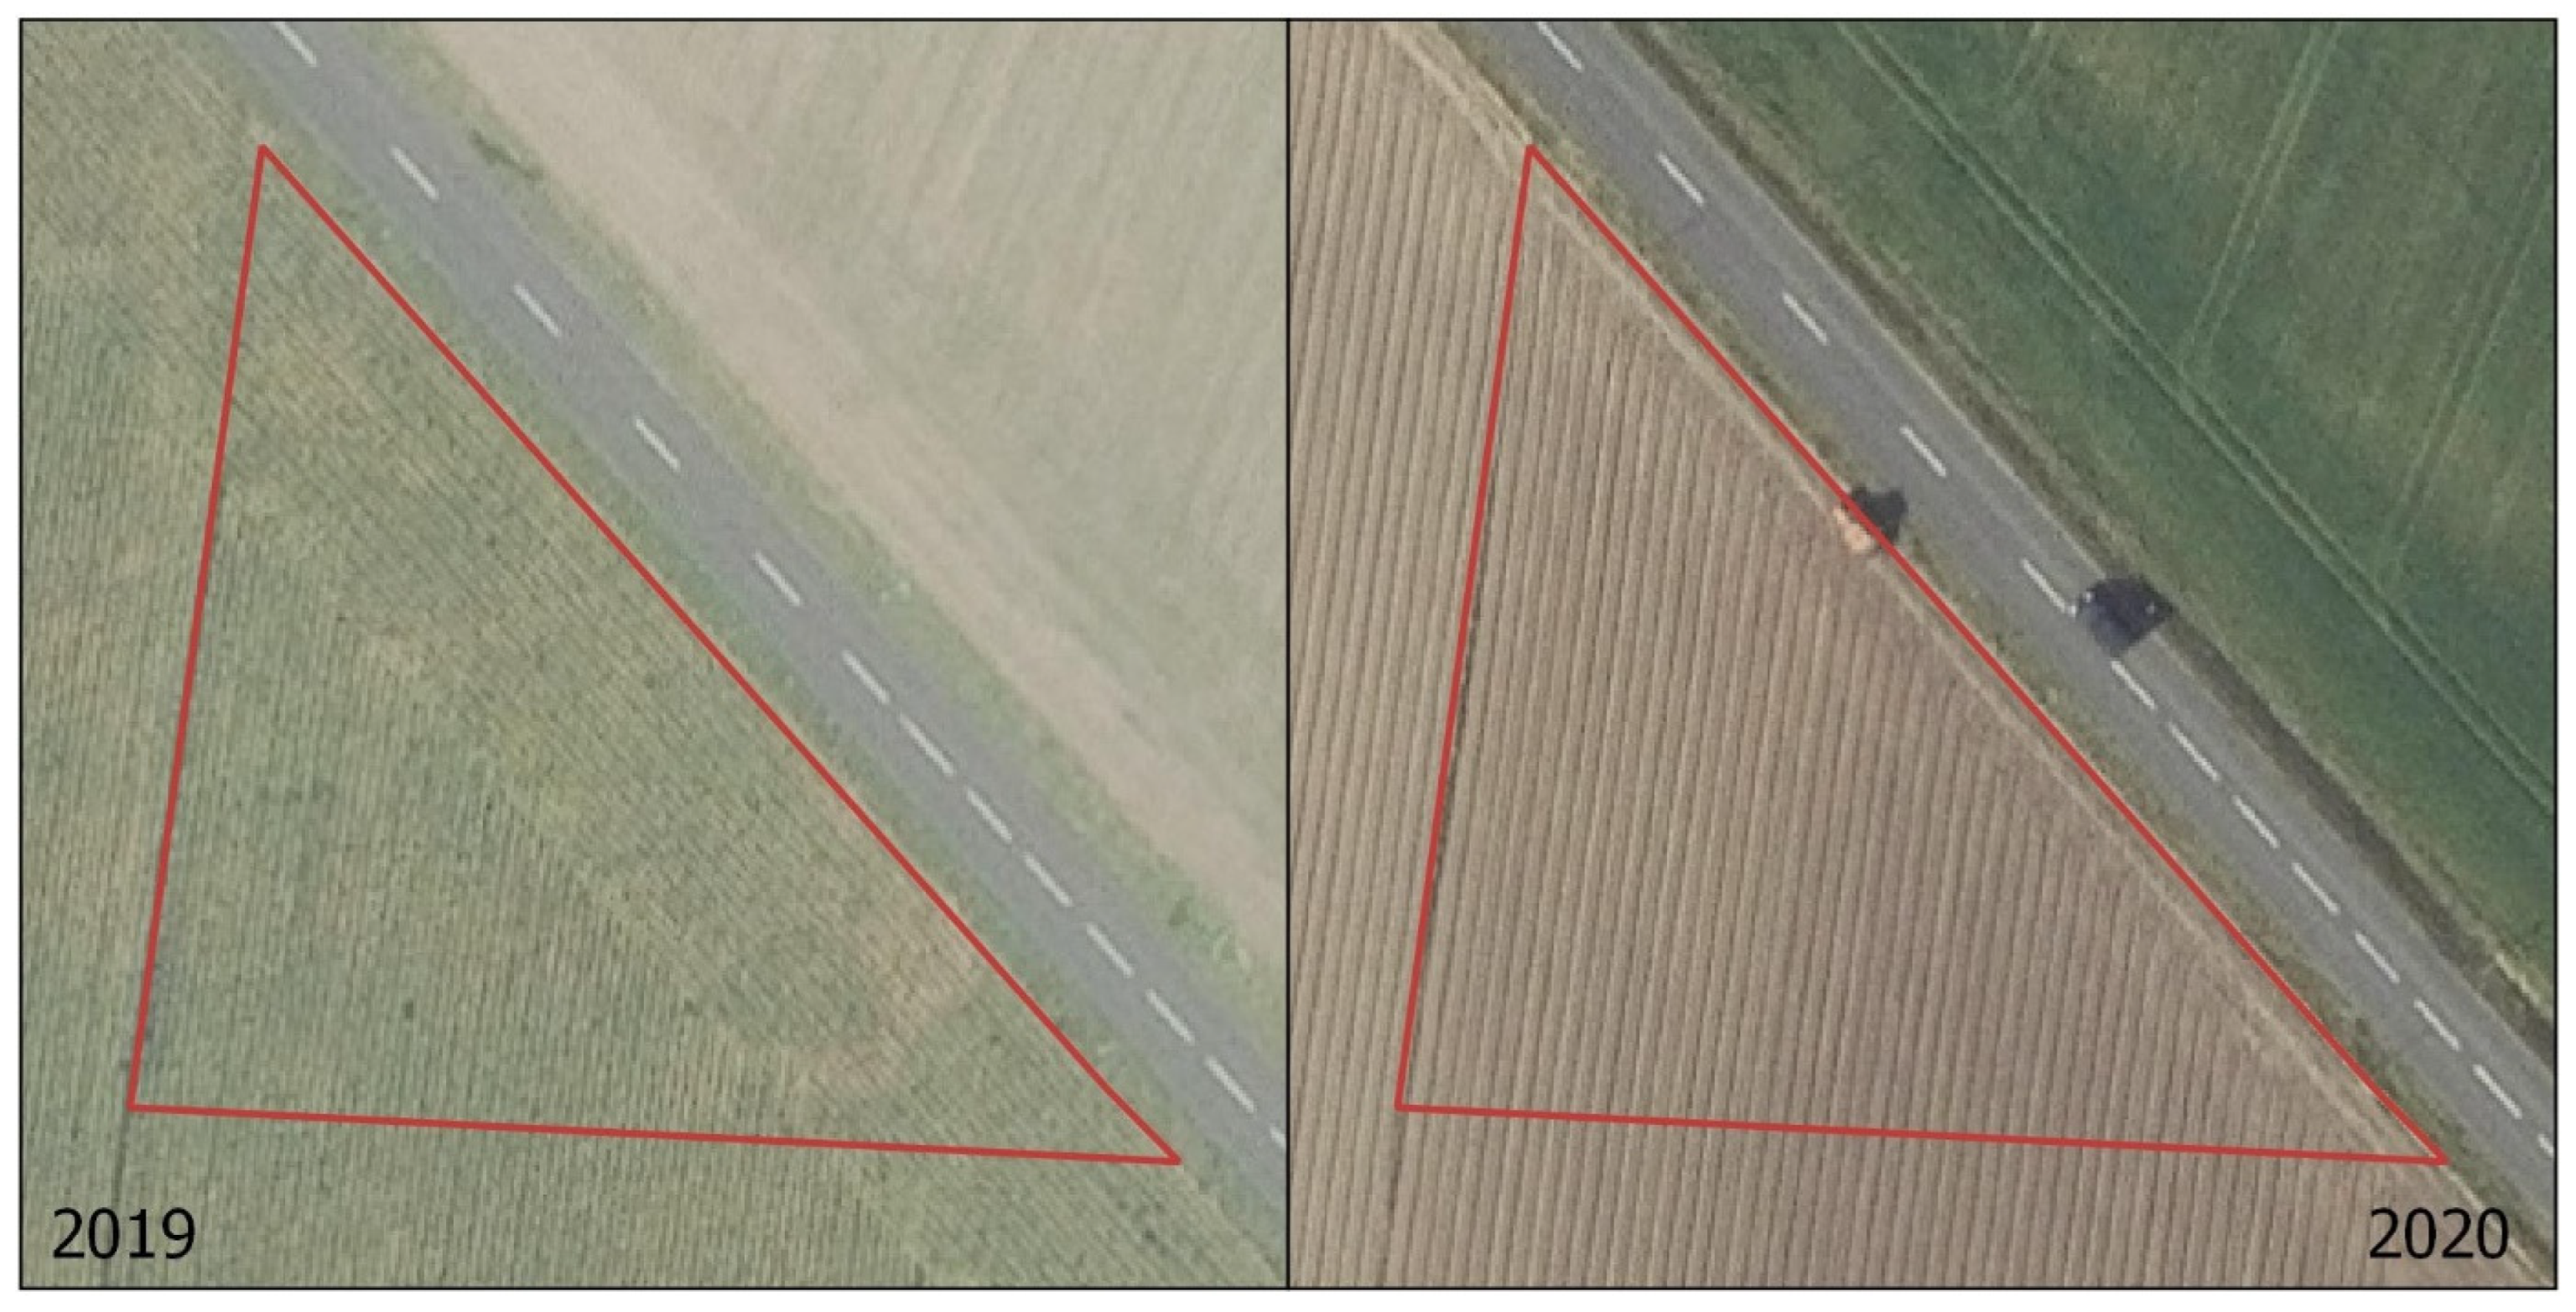
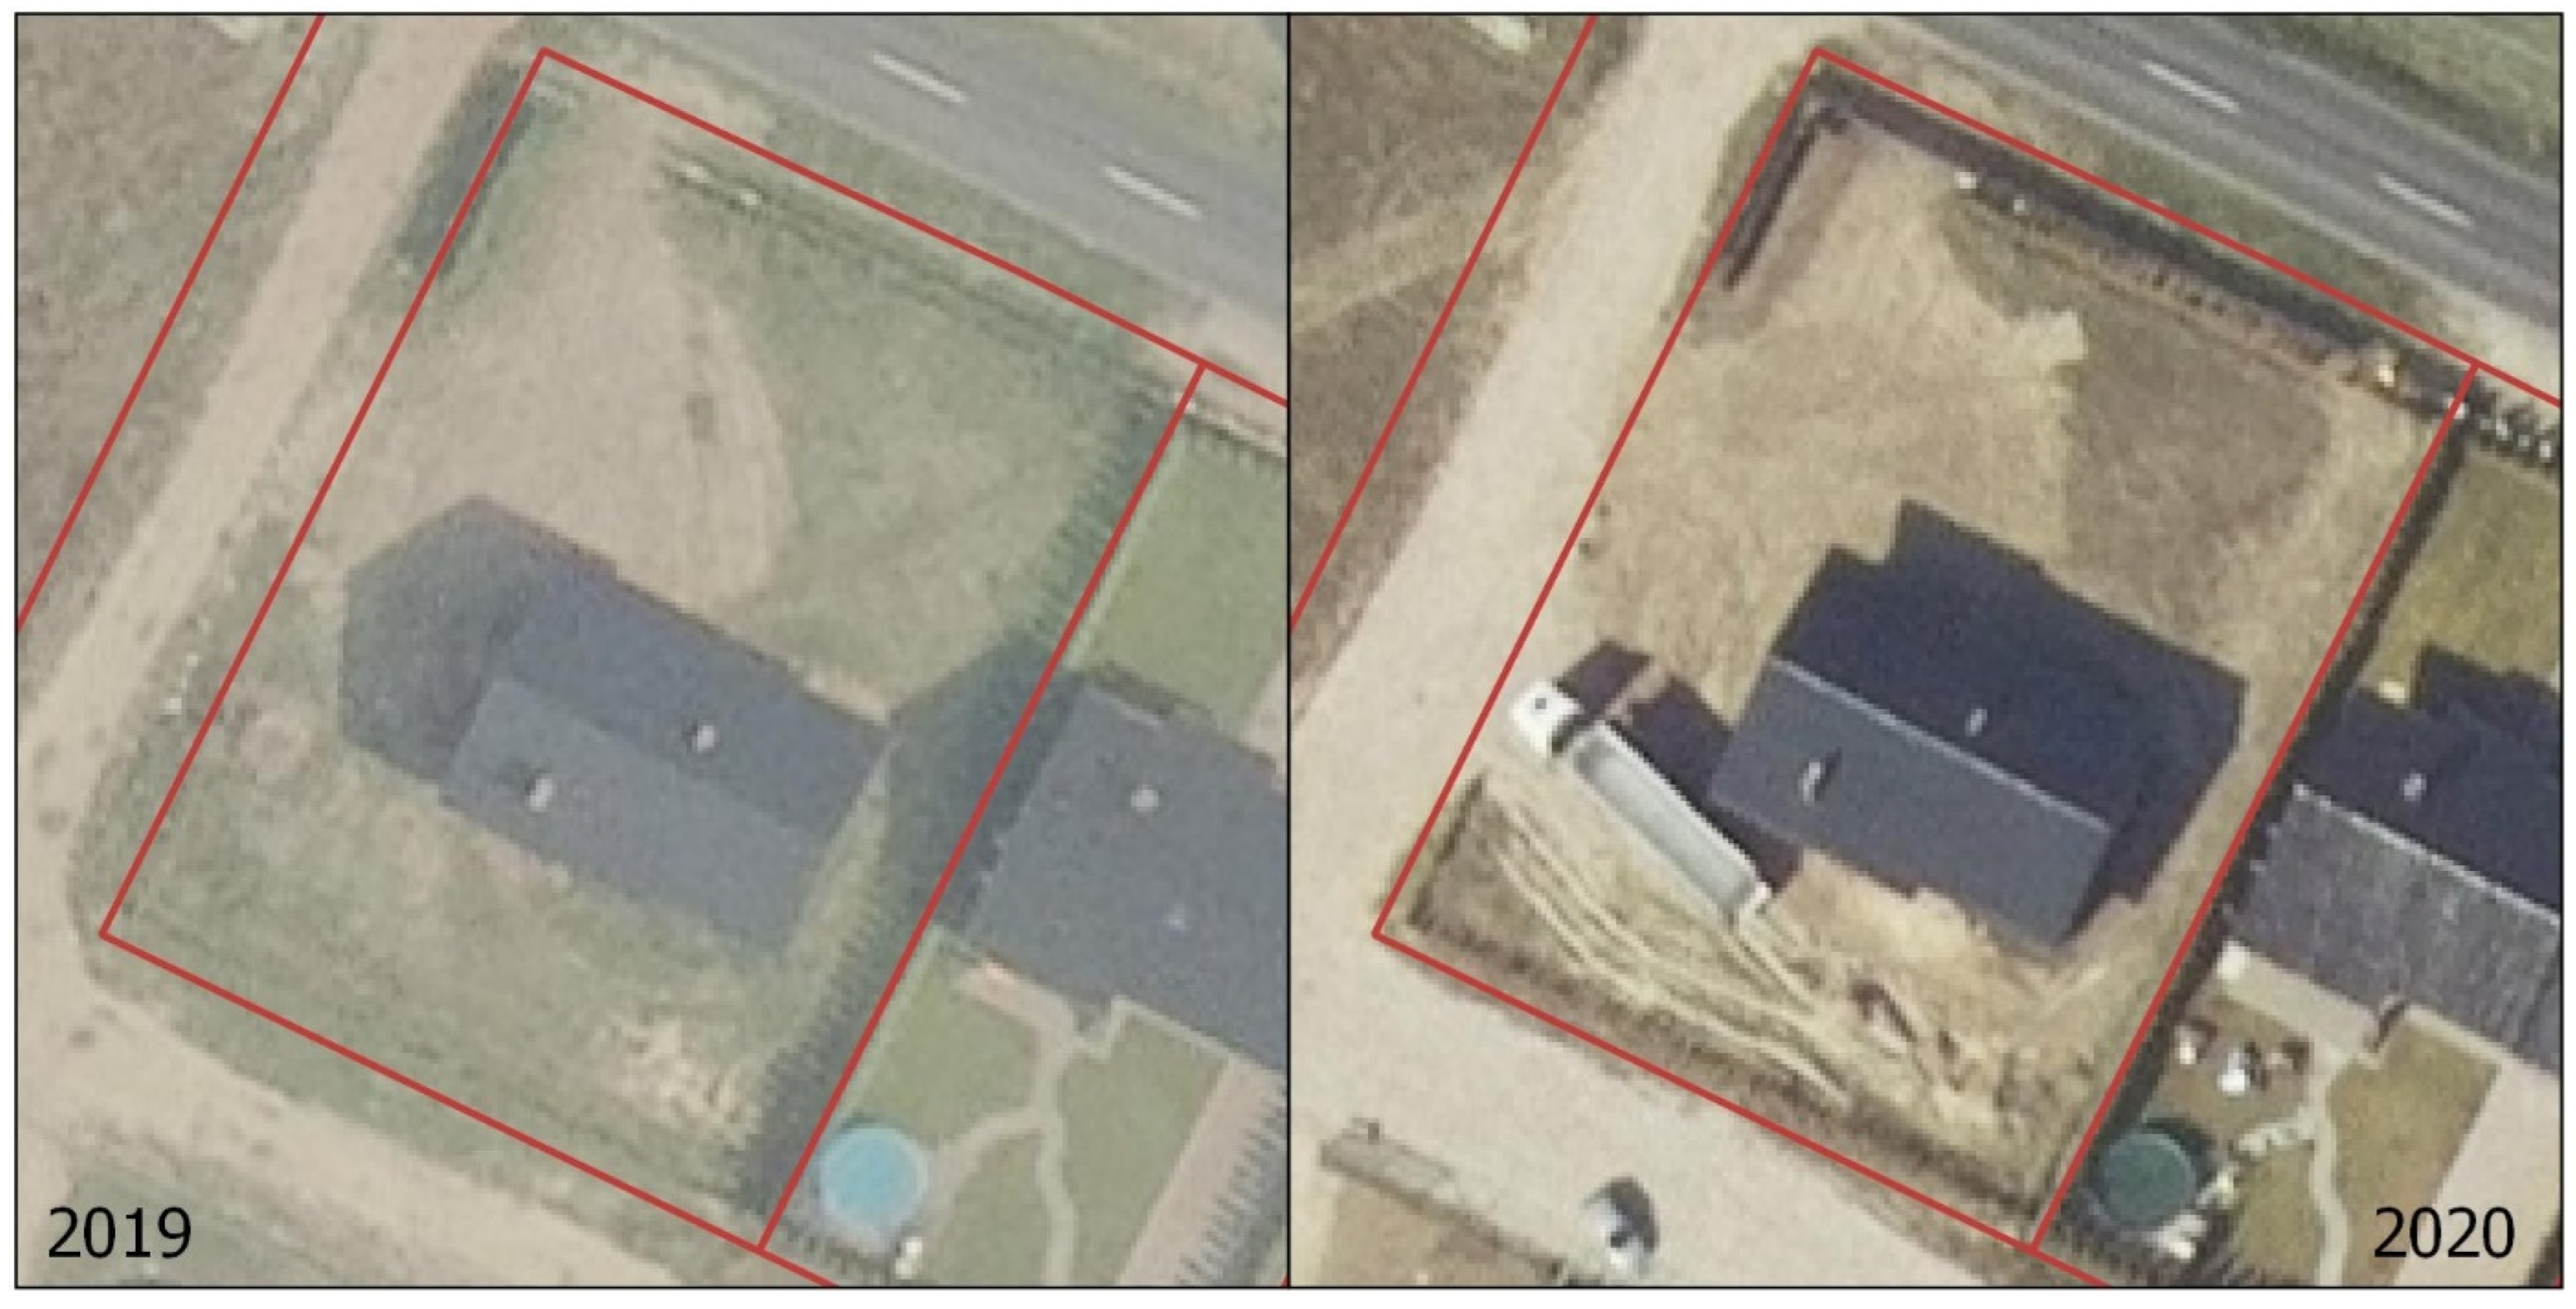
Parcels with the highest and lowest values were selected and compared with orthophotomaps that were obtained in 2019 and 2020. Land use changes at different stages were identified for negative values between −117,900 and −40,600. Higher values (up to −15,000, at which threshold values were set up) were not identified within study area, and therefore the correctness of the initial thresholding could not be completely verified. Noted changes ranged from topsoil removal before building construction to completed buildings, as demonstrated below (Figure 4, Figure 5, Figure 6 and Figure 7).
Negative results (no observed changes) were noted for positive values (15,000 and above) (Figure 8).
Incidental false positive results were probably caused by high contrasts by factors unrelated to construction works. However, errors were marginal (Figure 9).
Undoubtedly, the above analysis demonstrated that the commencement of construction works result in spectral changes similar to the disappearance of vegetation (whether natural or man-made, e.g., hay making). After topsoil removal, there is a noticeable increase in spectral brightness. This resemblance between vegetation removal and beginning of construction works can be noted in Figure 7 and Figure 9, and suggests that careful evaluation of results needs to be taken. Nevertheless, this method was efficient for the quick identification of changing parcels over a large area.
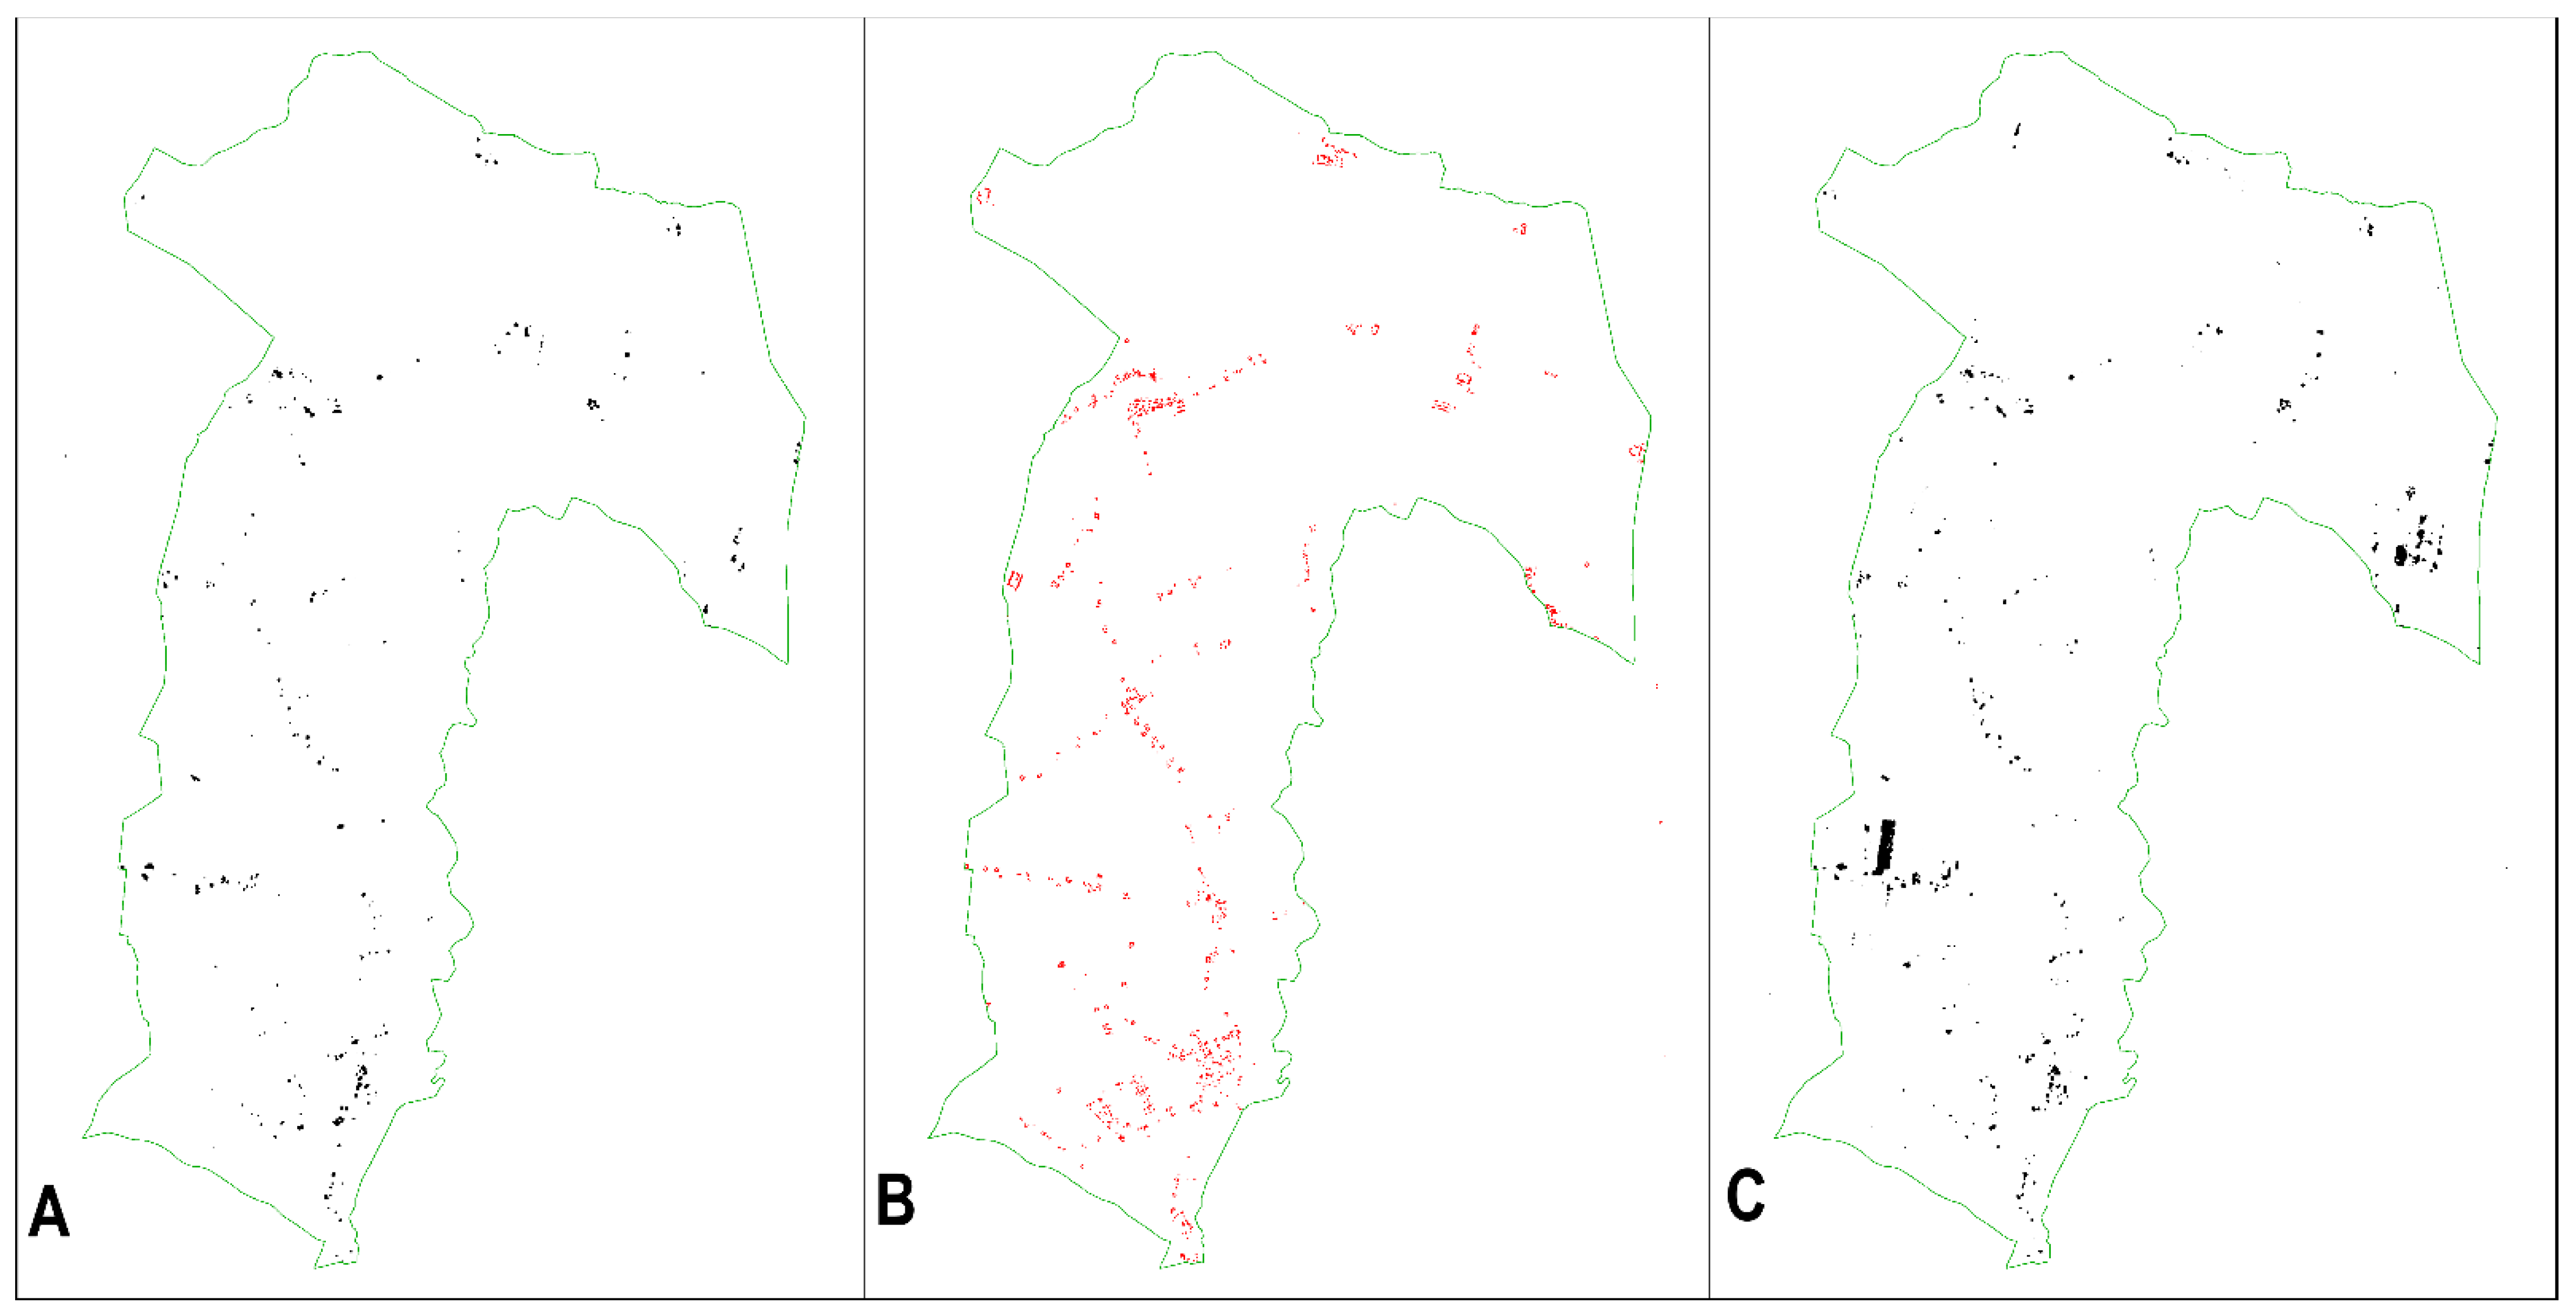
Sentinel-1 results were rather modest and problematic. Overall analysis provided information about general trends in building density in the study area (Figure 10).
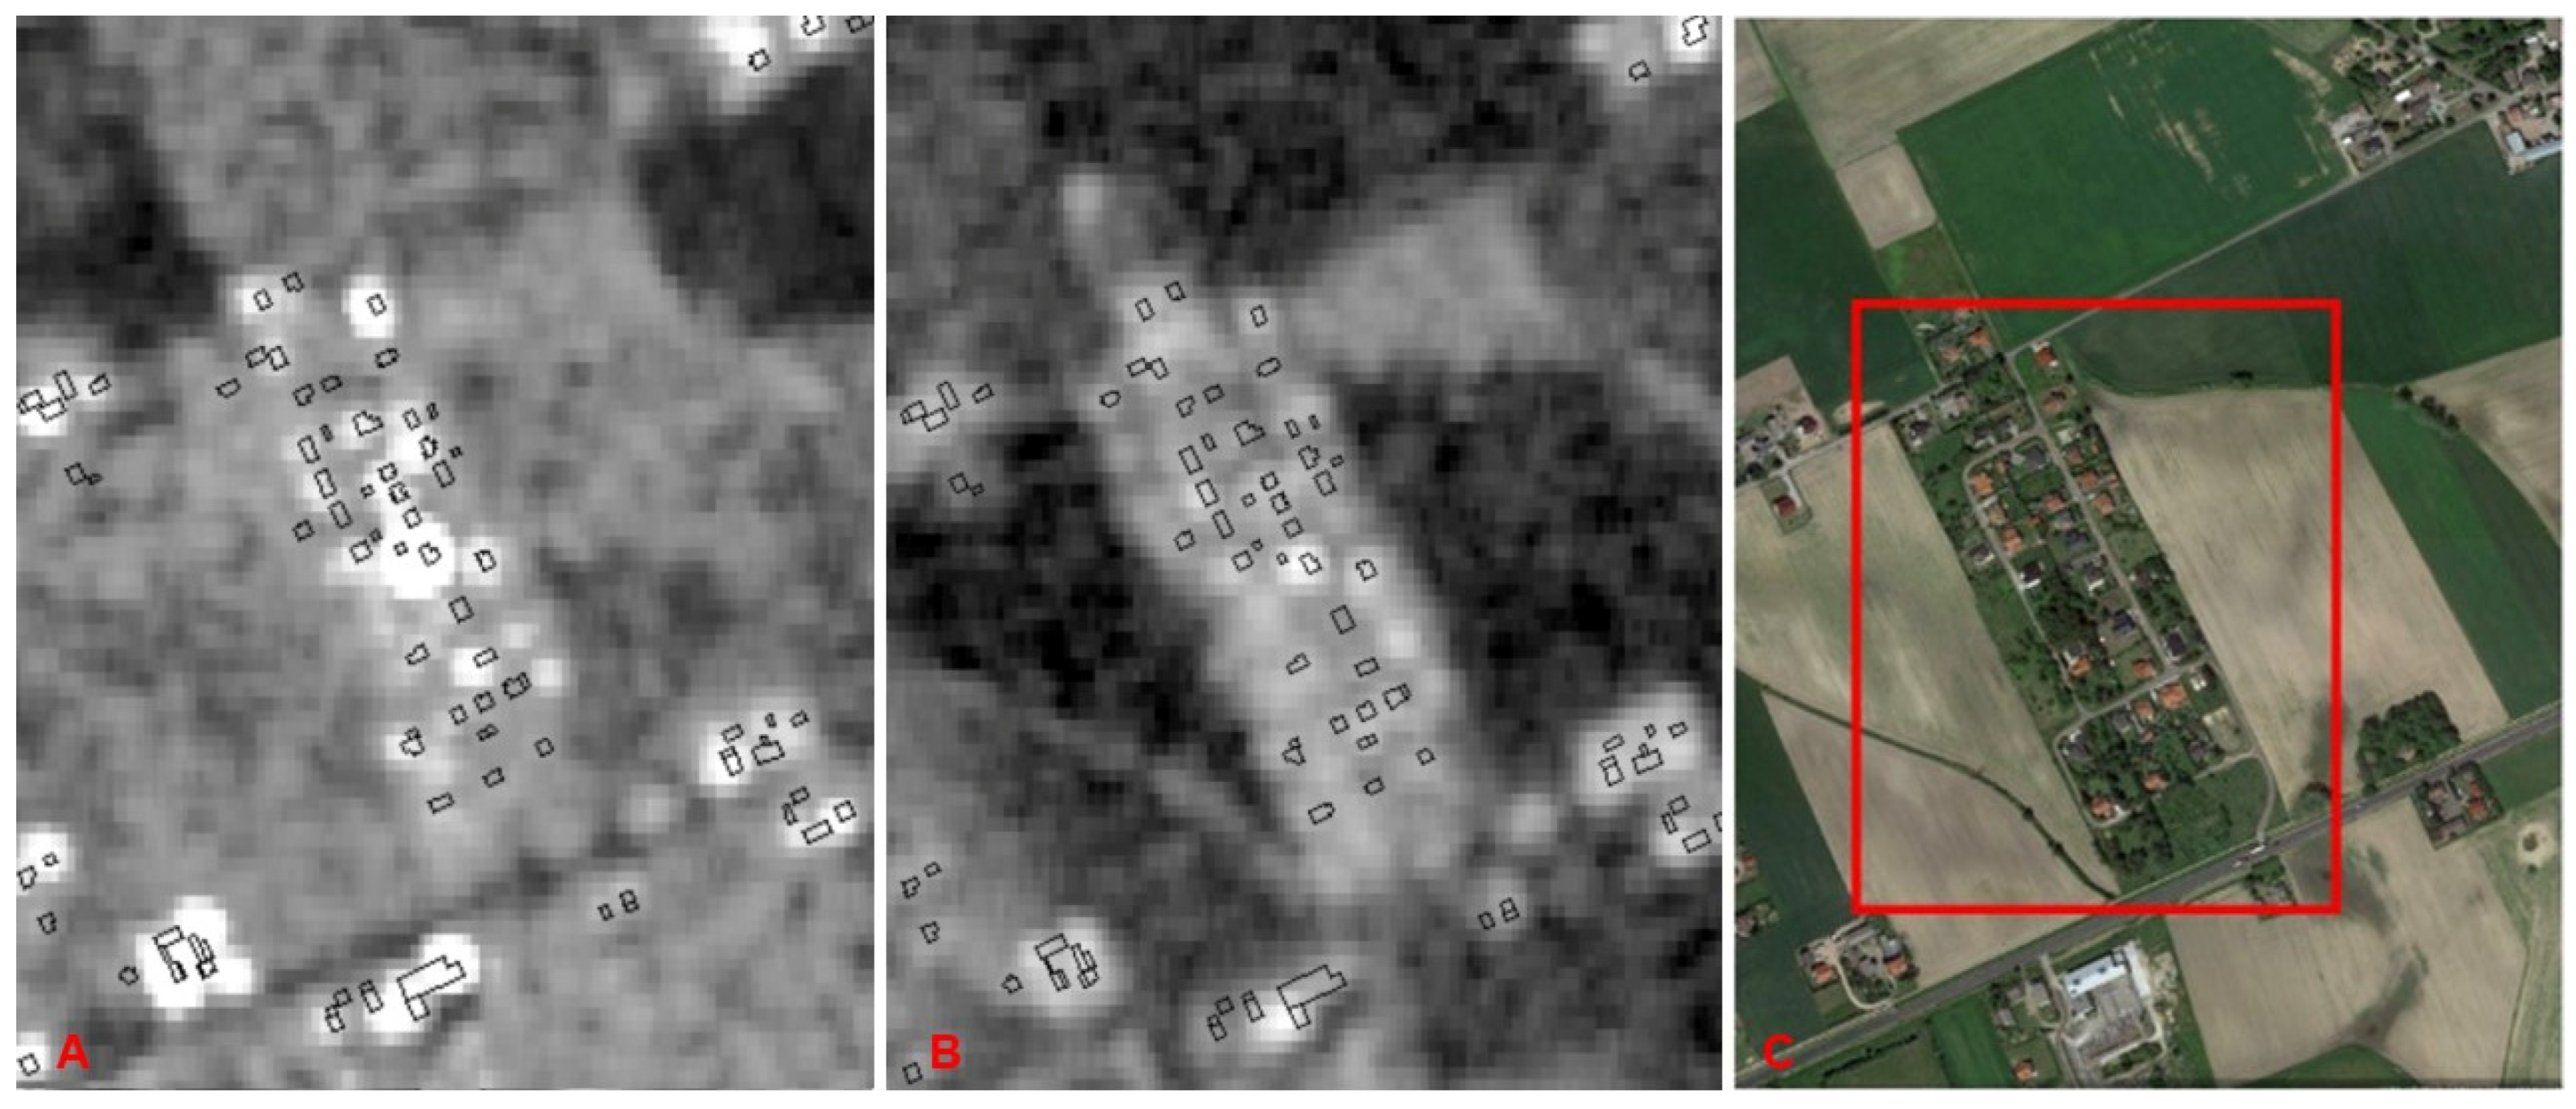
However, information about individual changes was considerably affected by a range of factors. Detection of buildings depends on numerous factors regarding building itself (its orientation, roof shape, sloping), direction of scanning, complexity of radar signal reflection and spatial resolution in relation to building’s dimension (approx. one pixel per building). This resulted in some buildings being more clearly visible than others. In the case of a large housing estate in Lednogóra, only one building gave a very strong signal. Identification of individual buildings which were clustered in close proximity to each other also proved difficult—sometimes a single signal was covering a group of buildings (Figure 11). Additionally, buildings surrounded by trees were often undetectable.
4.2. Land Cover Changes
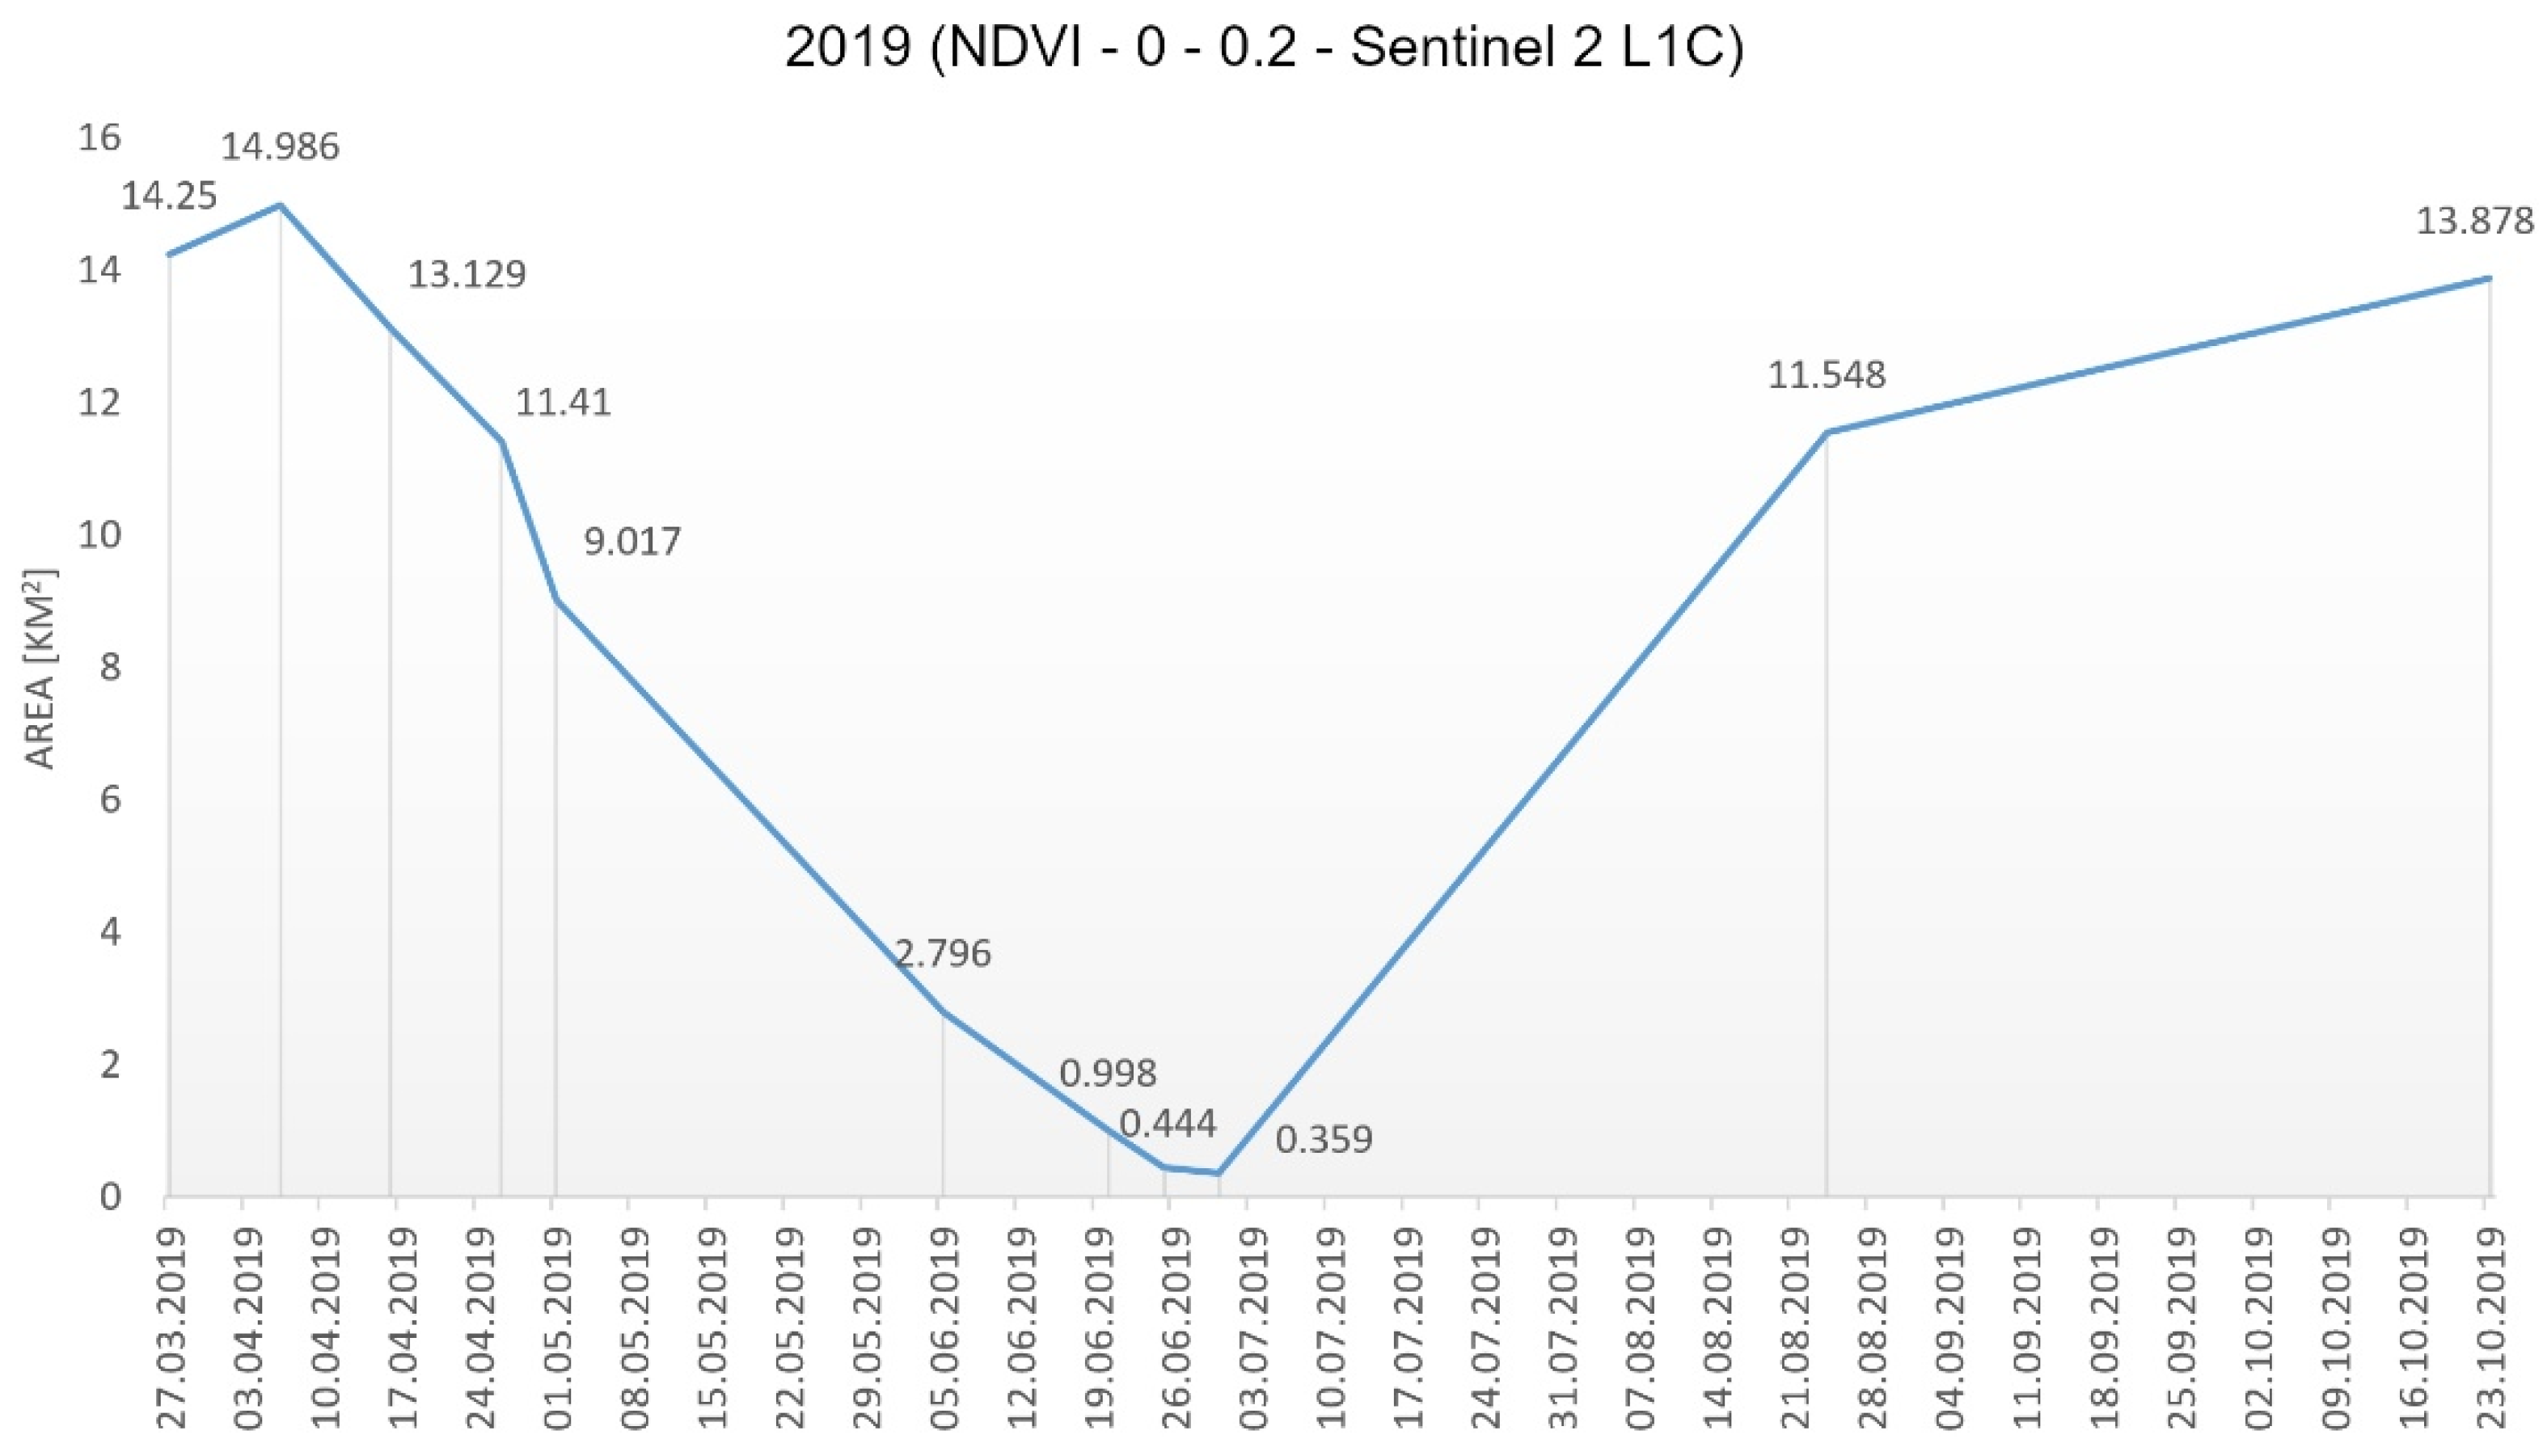
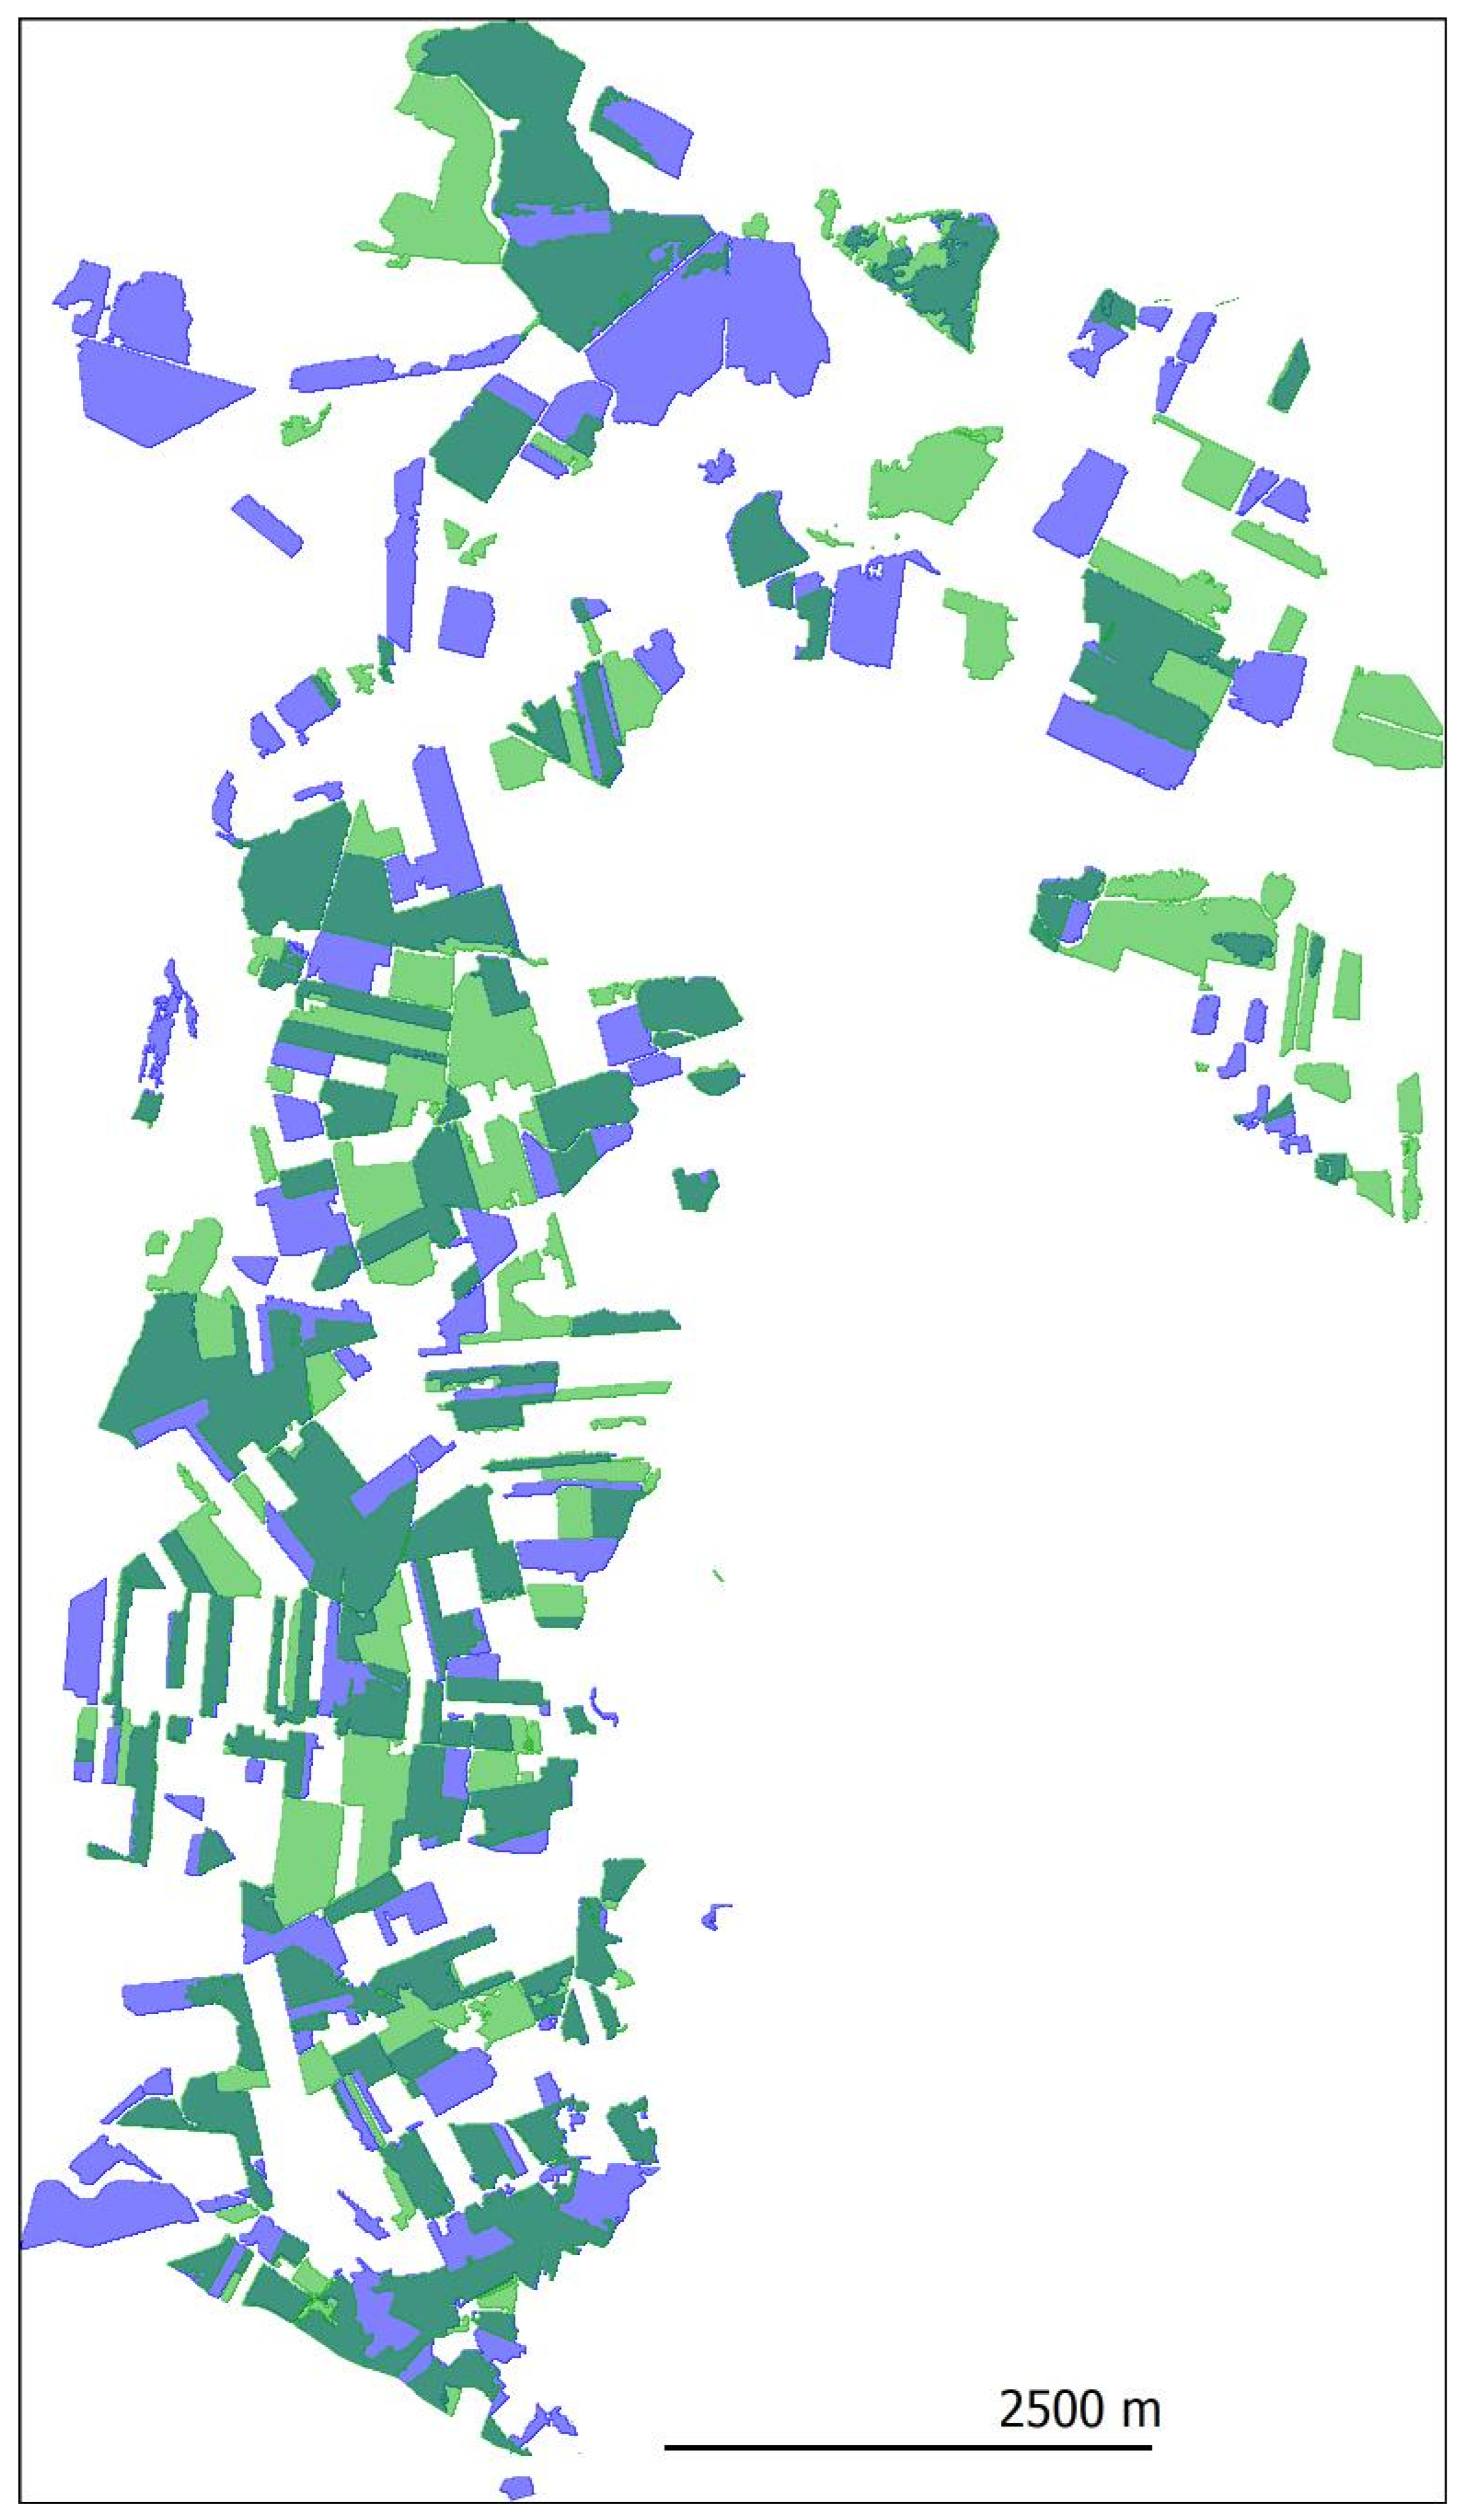
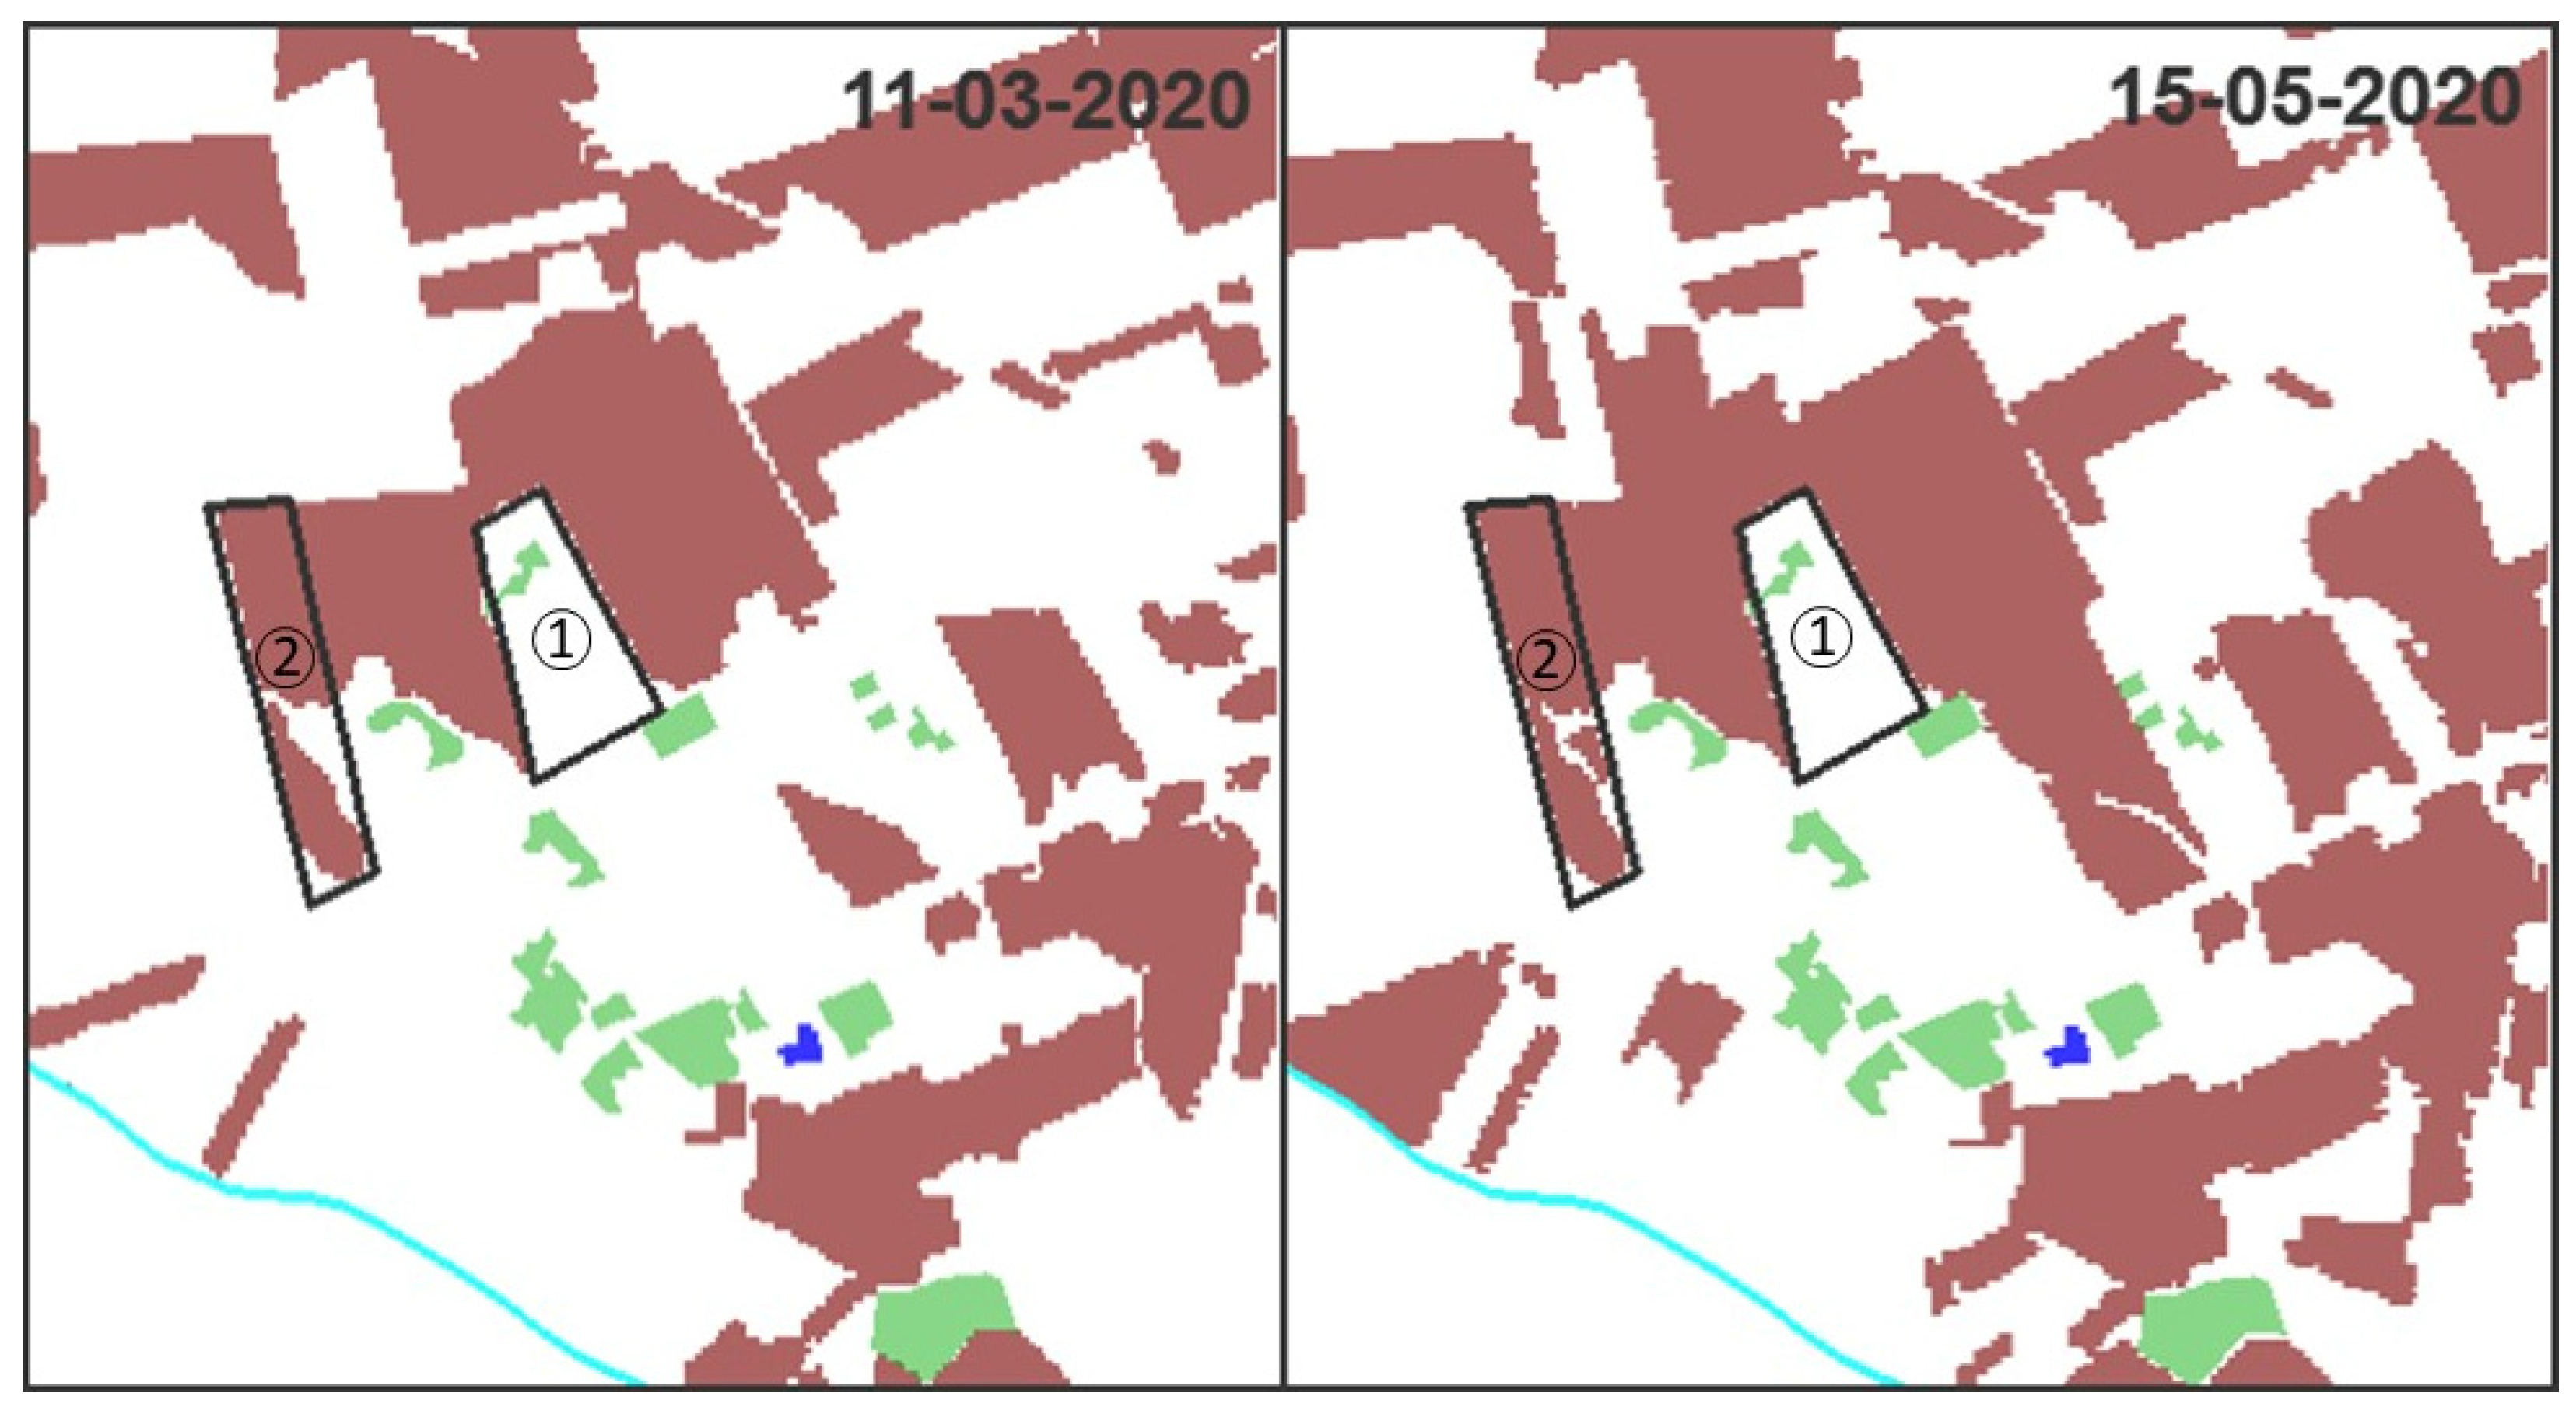
NDVI analysis provided information about crop coverage on a monthly basis, which can be used to estimate the effect of changing crop profile (preferences for winter crops and growing acreage of rapeseed and maize) and cultivation patterns on survey planning. In spring 2019, winter crops (wheat and rapeseed) were so advanced that 50% of cultivated fields would be accessible for a field walking survey. Approximately 45% of arable land was inaccessible in autumn, which was probably due to the combined effect of winter crop sowing, sugar beet and maize, although this requires further studies supported by more precise crop identification. Approx. 27% of the arable area was not available for field walking survey in both terms (Figure 12 and Figure 13).
Results were analysed in detail for three individual fields that were surveyed in 2019 and 2020. As demonstrated below (Figure 14), NDVI was confirmed by field observations.
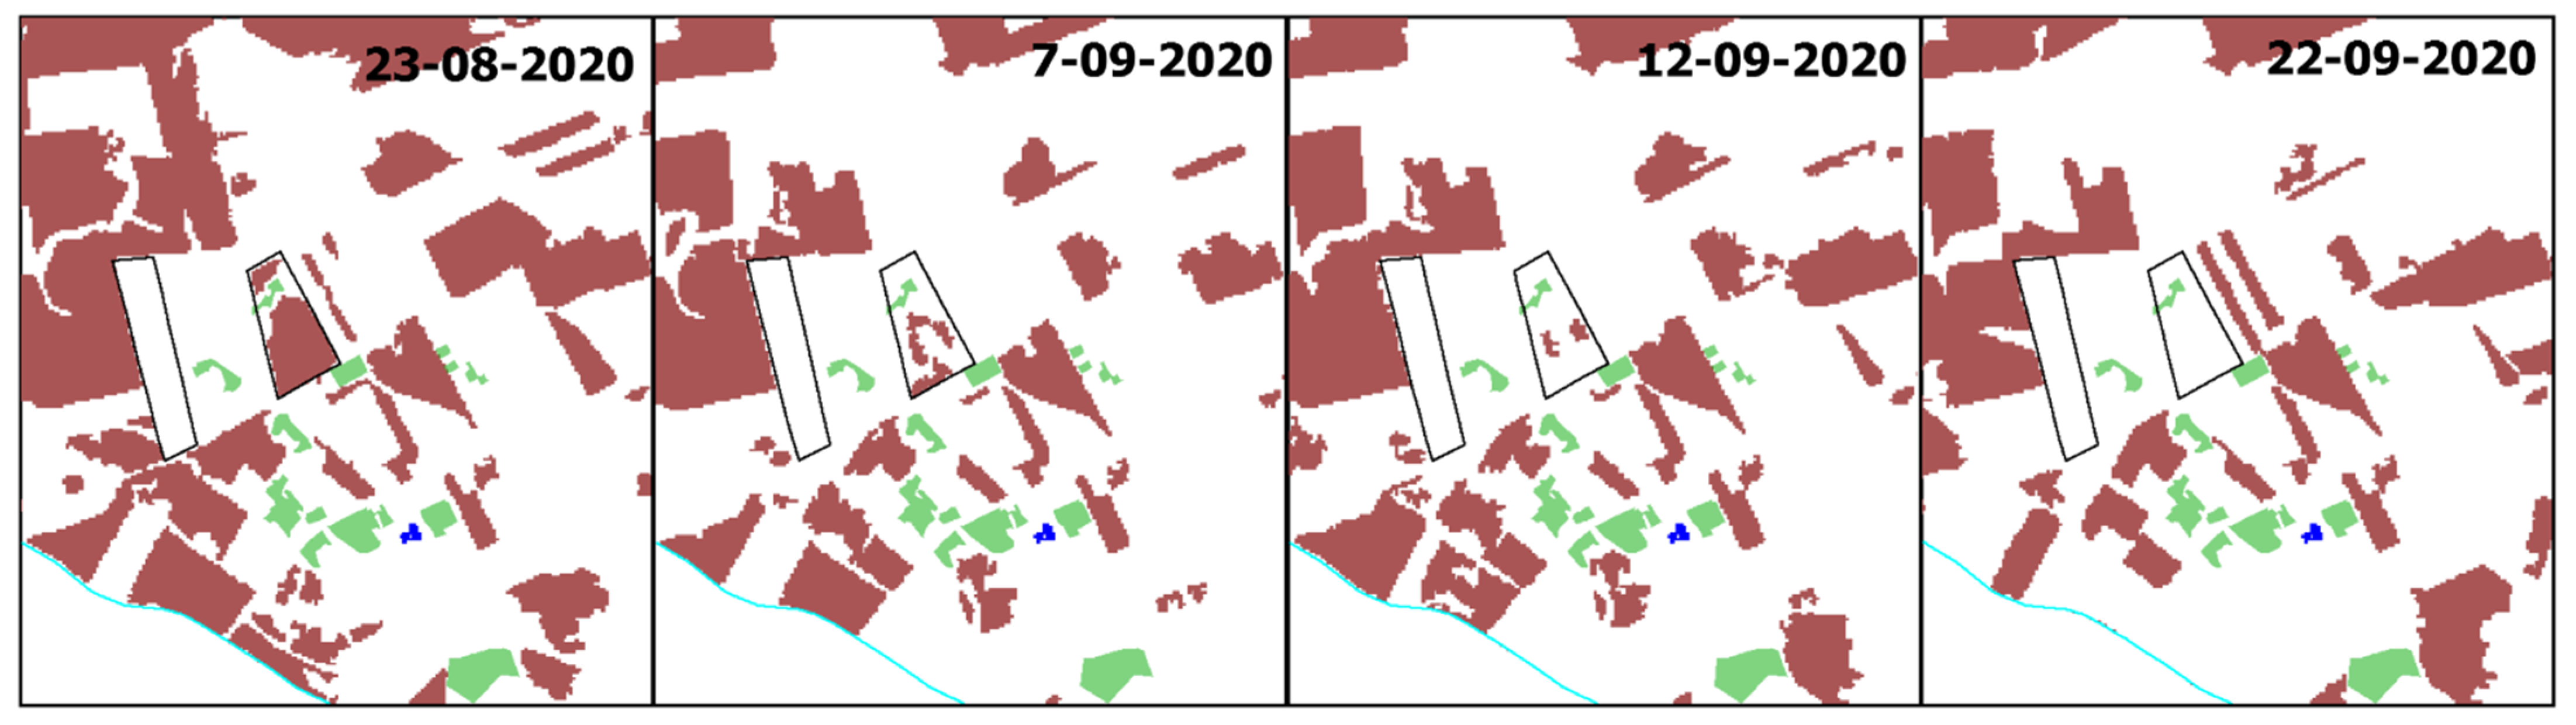
Detailed analysis also demonstrated the potential of Sentinel-2 for precise planning of field survey. Rapeseed in particular proved problematic for field walking. Winter crops were sown soon after harvesting (end of August). Despite considerable drought, young plants started to cover fields within two weeks. Their rapid development can quickly exclude fields for survey until harvesting next year. Therefore, this leaves a narrow window of opportunity to carry out field works. An attempt to identify this short period in NDVI showed different stages of field availability within four weeks between crop sowing and germination (Figure 15).
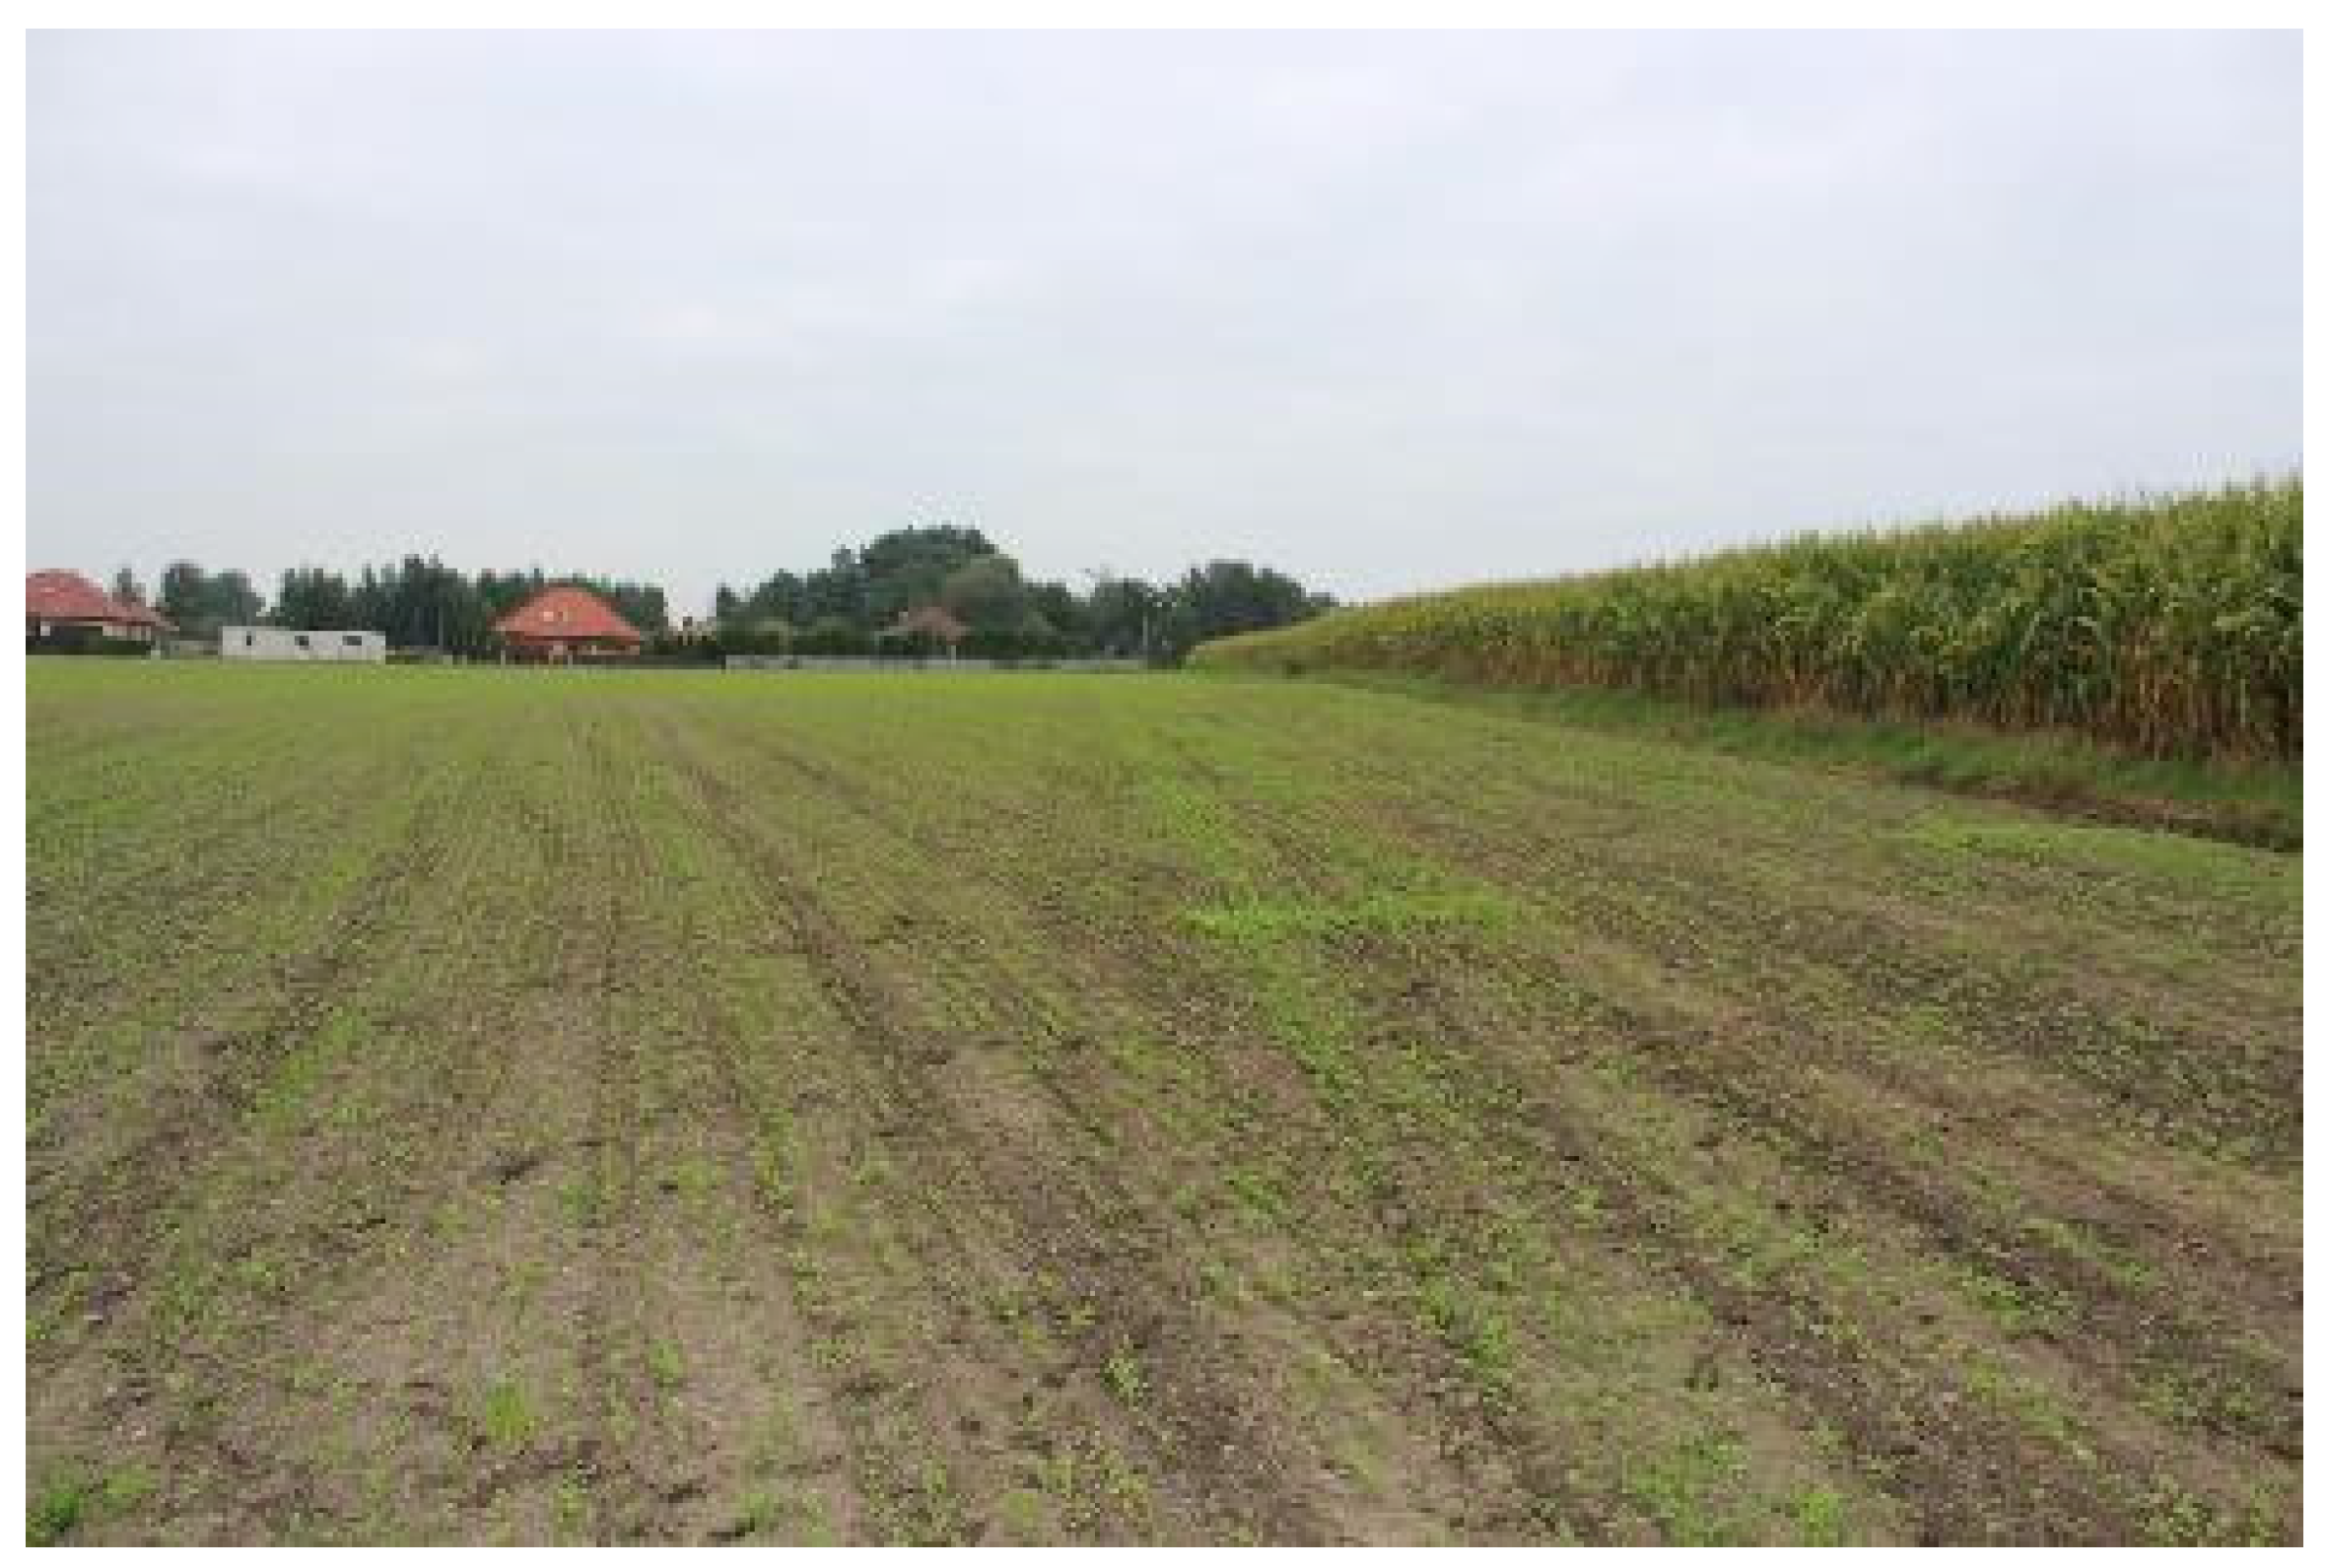
The above analysis also demonstrates why less favourite periods were chosen for field survey. Winter wheat that was sown in autumn 2019 had grown too much to enable field walking in spring 2020. Similarly, winter rapeseed that was sown in August 2020 forced field surveys to be done in late summer (late August/early September), when field conditions were least favourable. Dry soil offered a poor contrast to pottery sherds, which may account for modest results (Figure 16).
5. Discussion
Three major trends were noted when land use changes were compared with existing archaeological records.
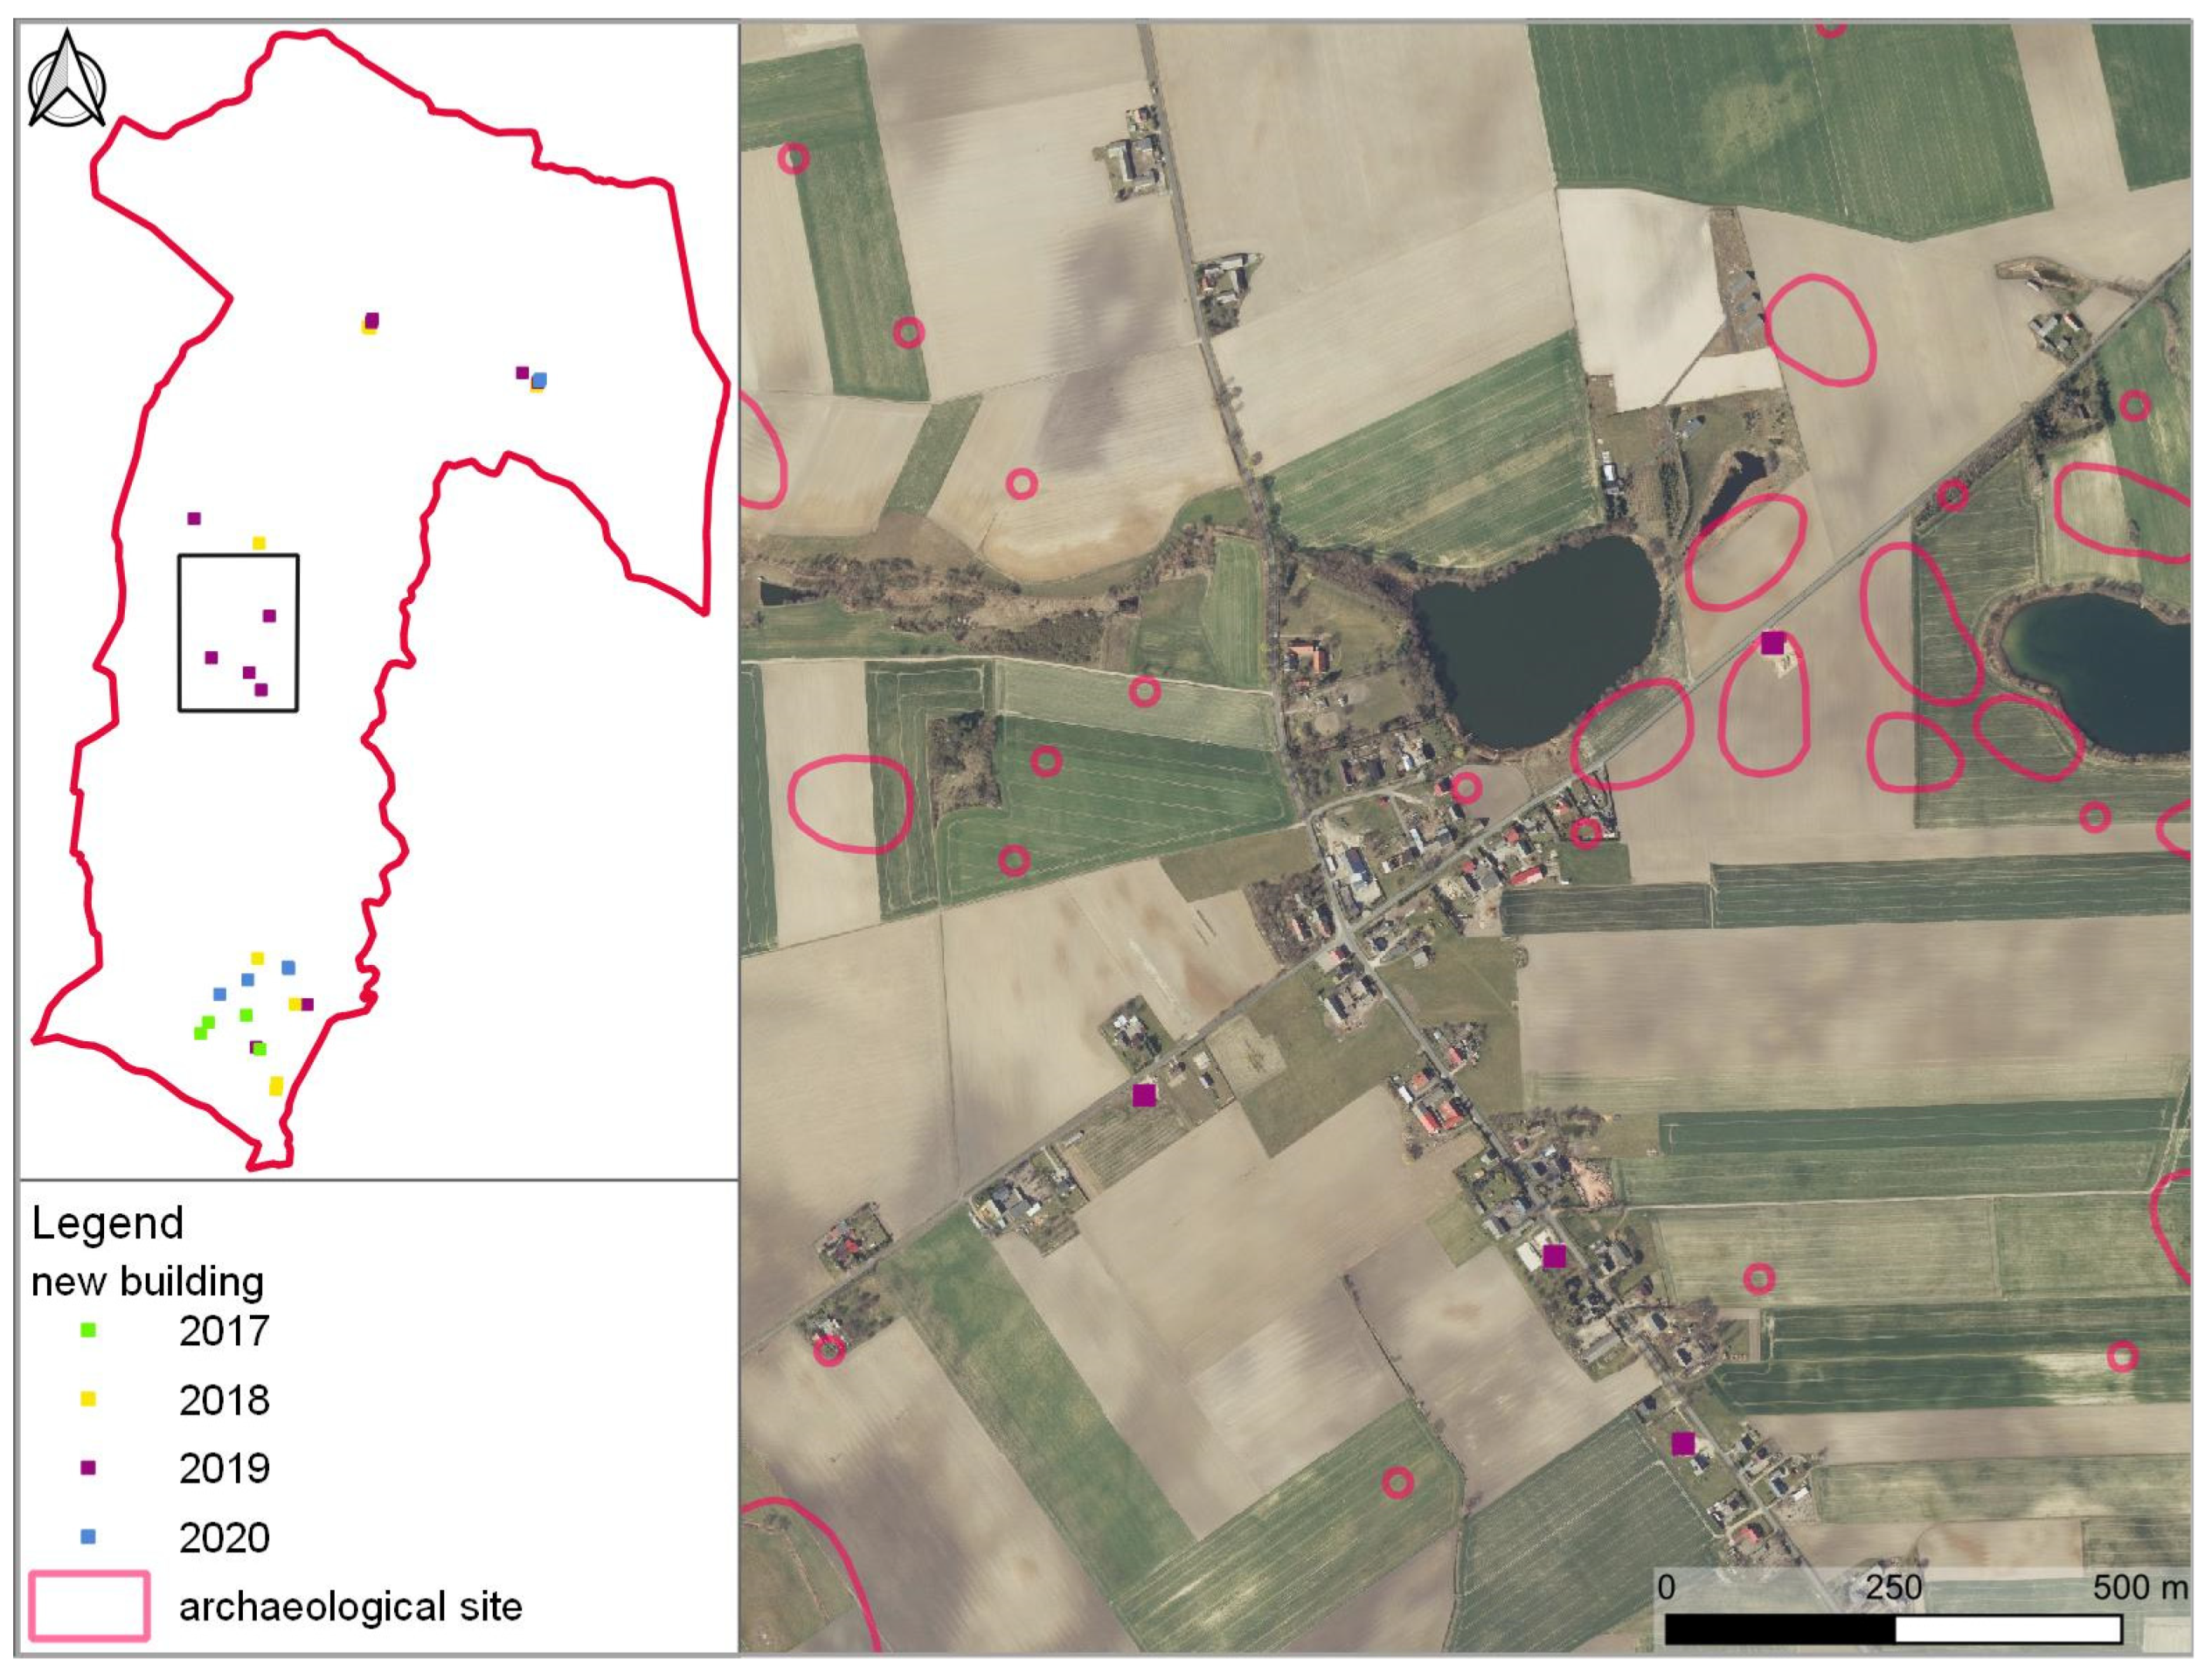
a/further destruction of archaeological sites by the development of existing residential areas in the southern part of the study area (Figure 17).
b/a limited number of new dispersed households caused damage to archaeological sites that had hitherto been left intact (Figure 18).
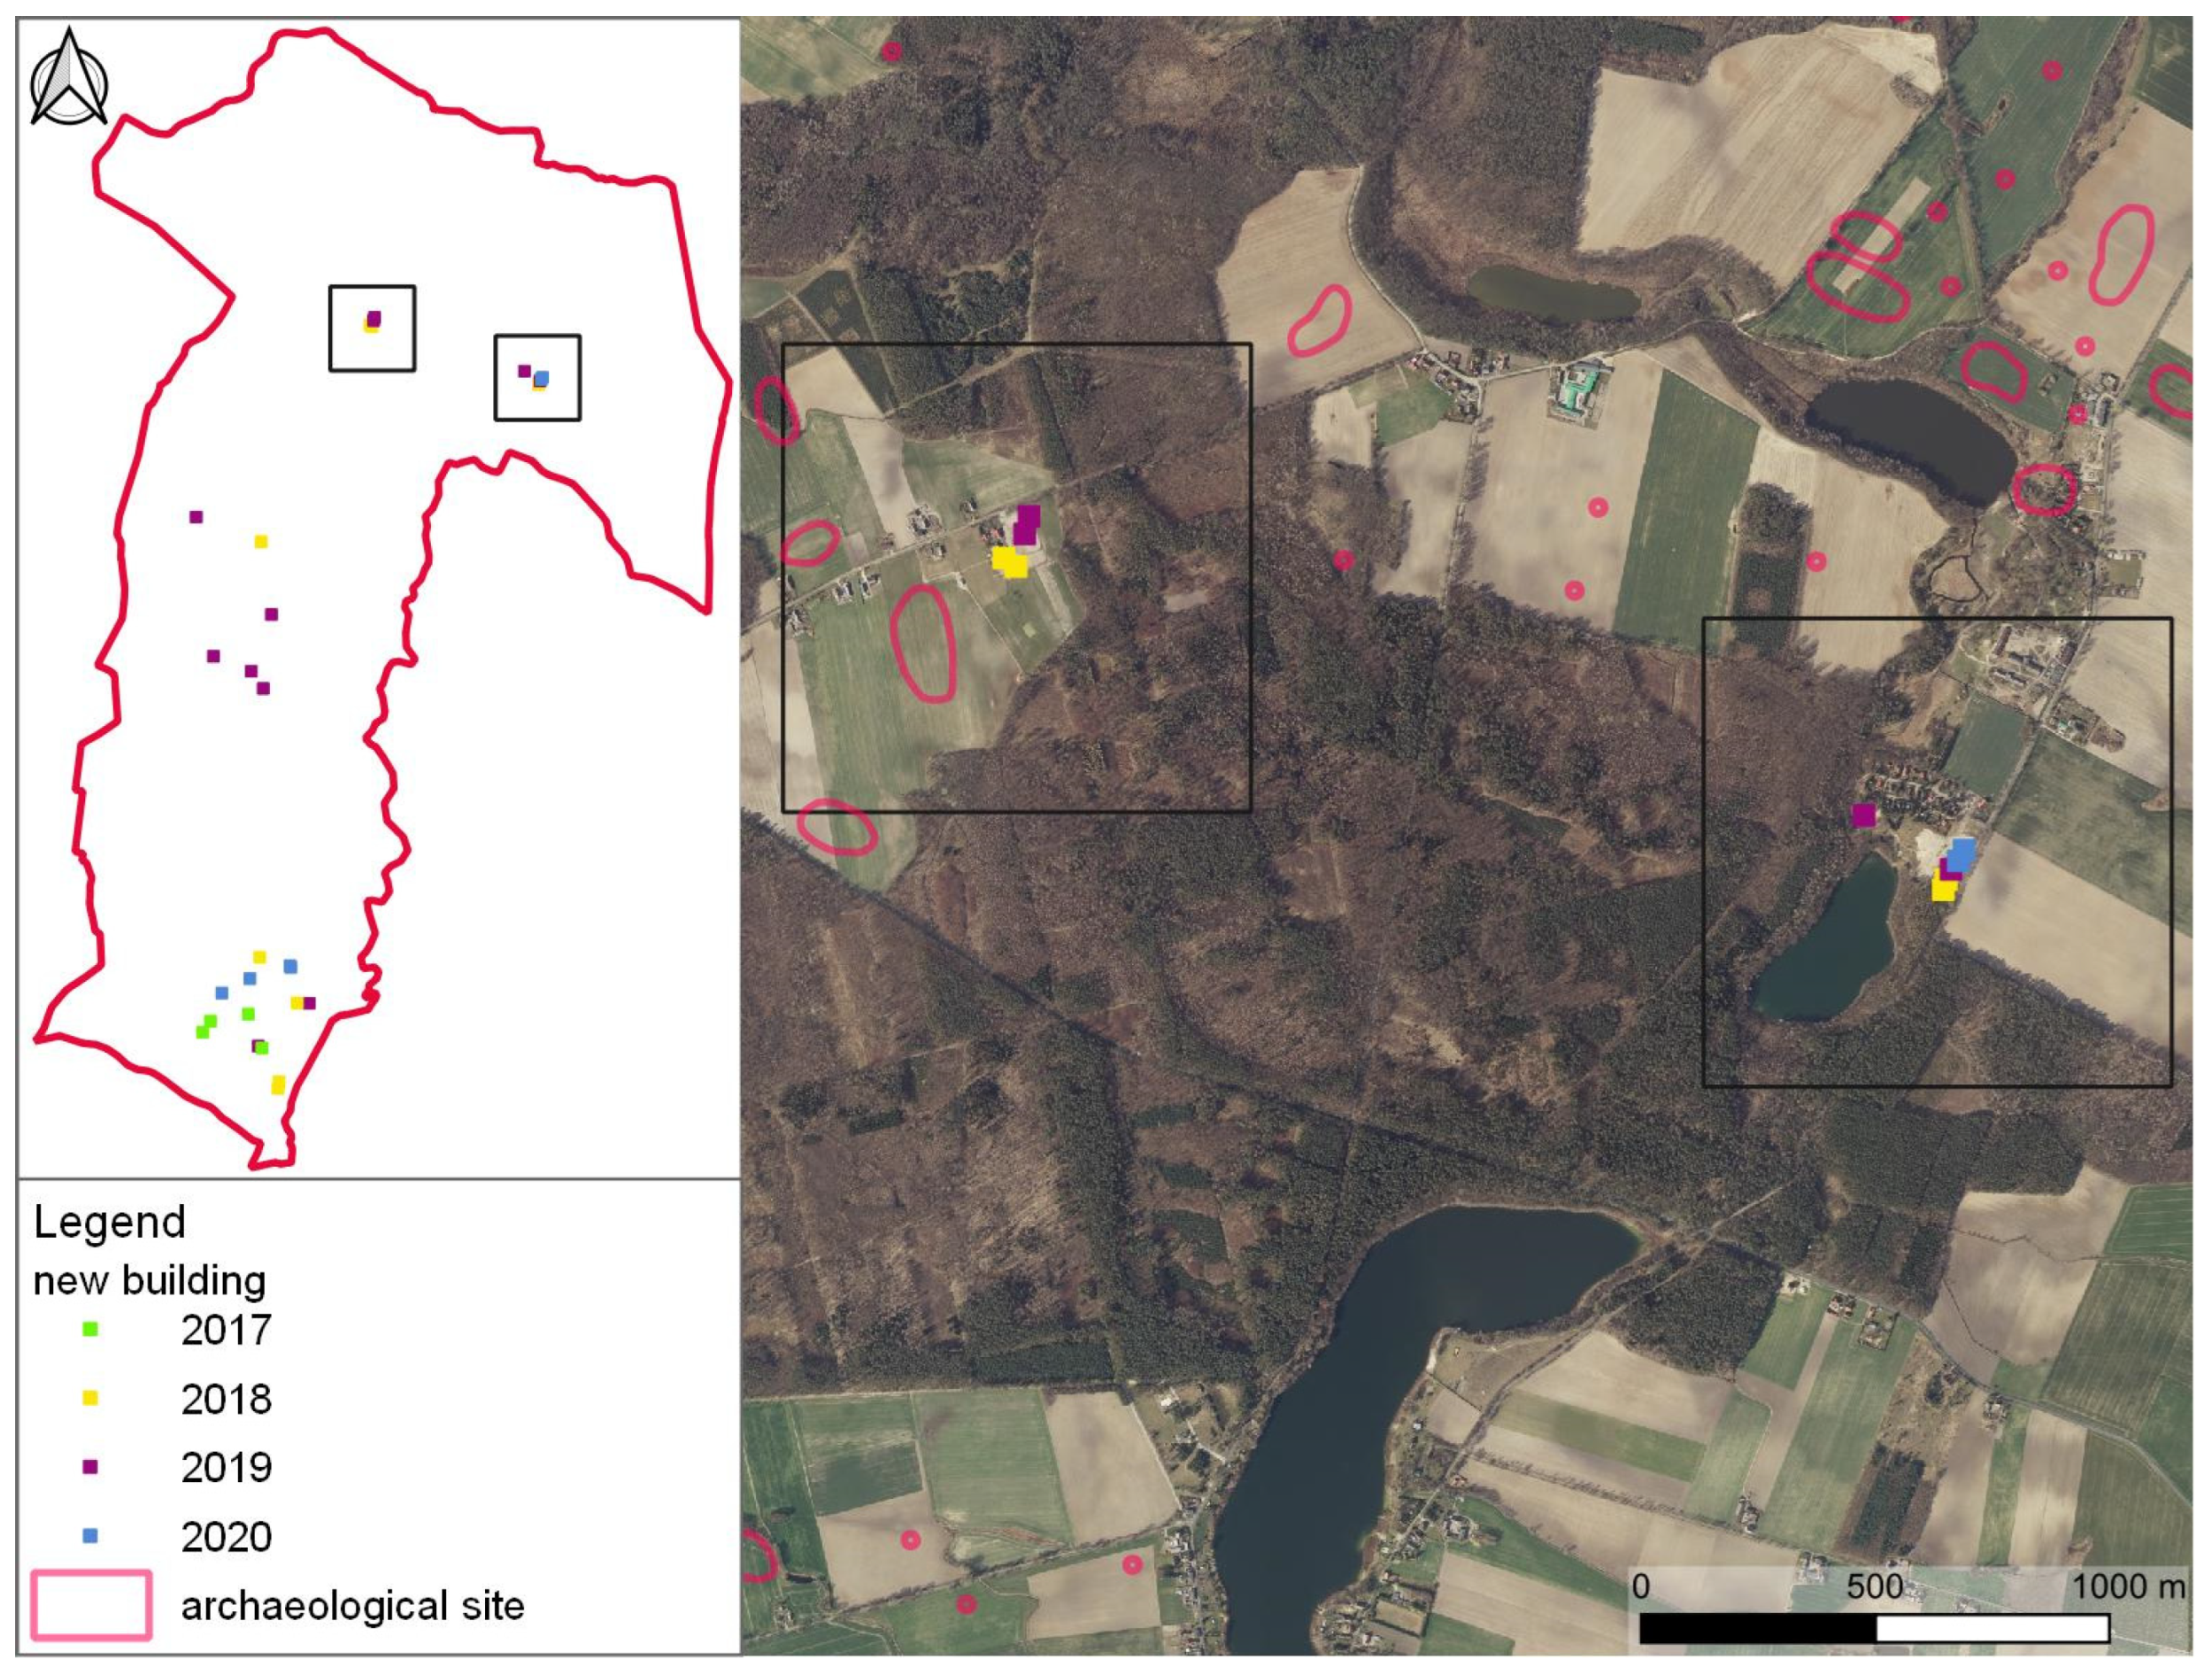
c/two new residential areas seem to be forming in northern part of Lednica Landscape Park. No destruction to known archaeological sites was noted, but this observation is based on incomplete records (Figure 19).
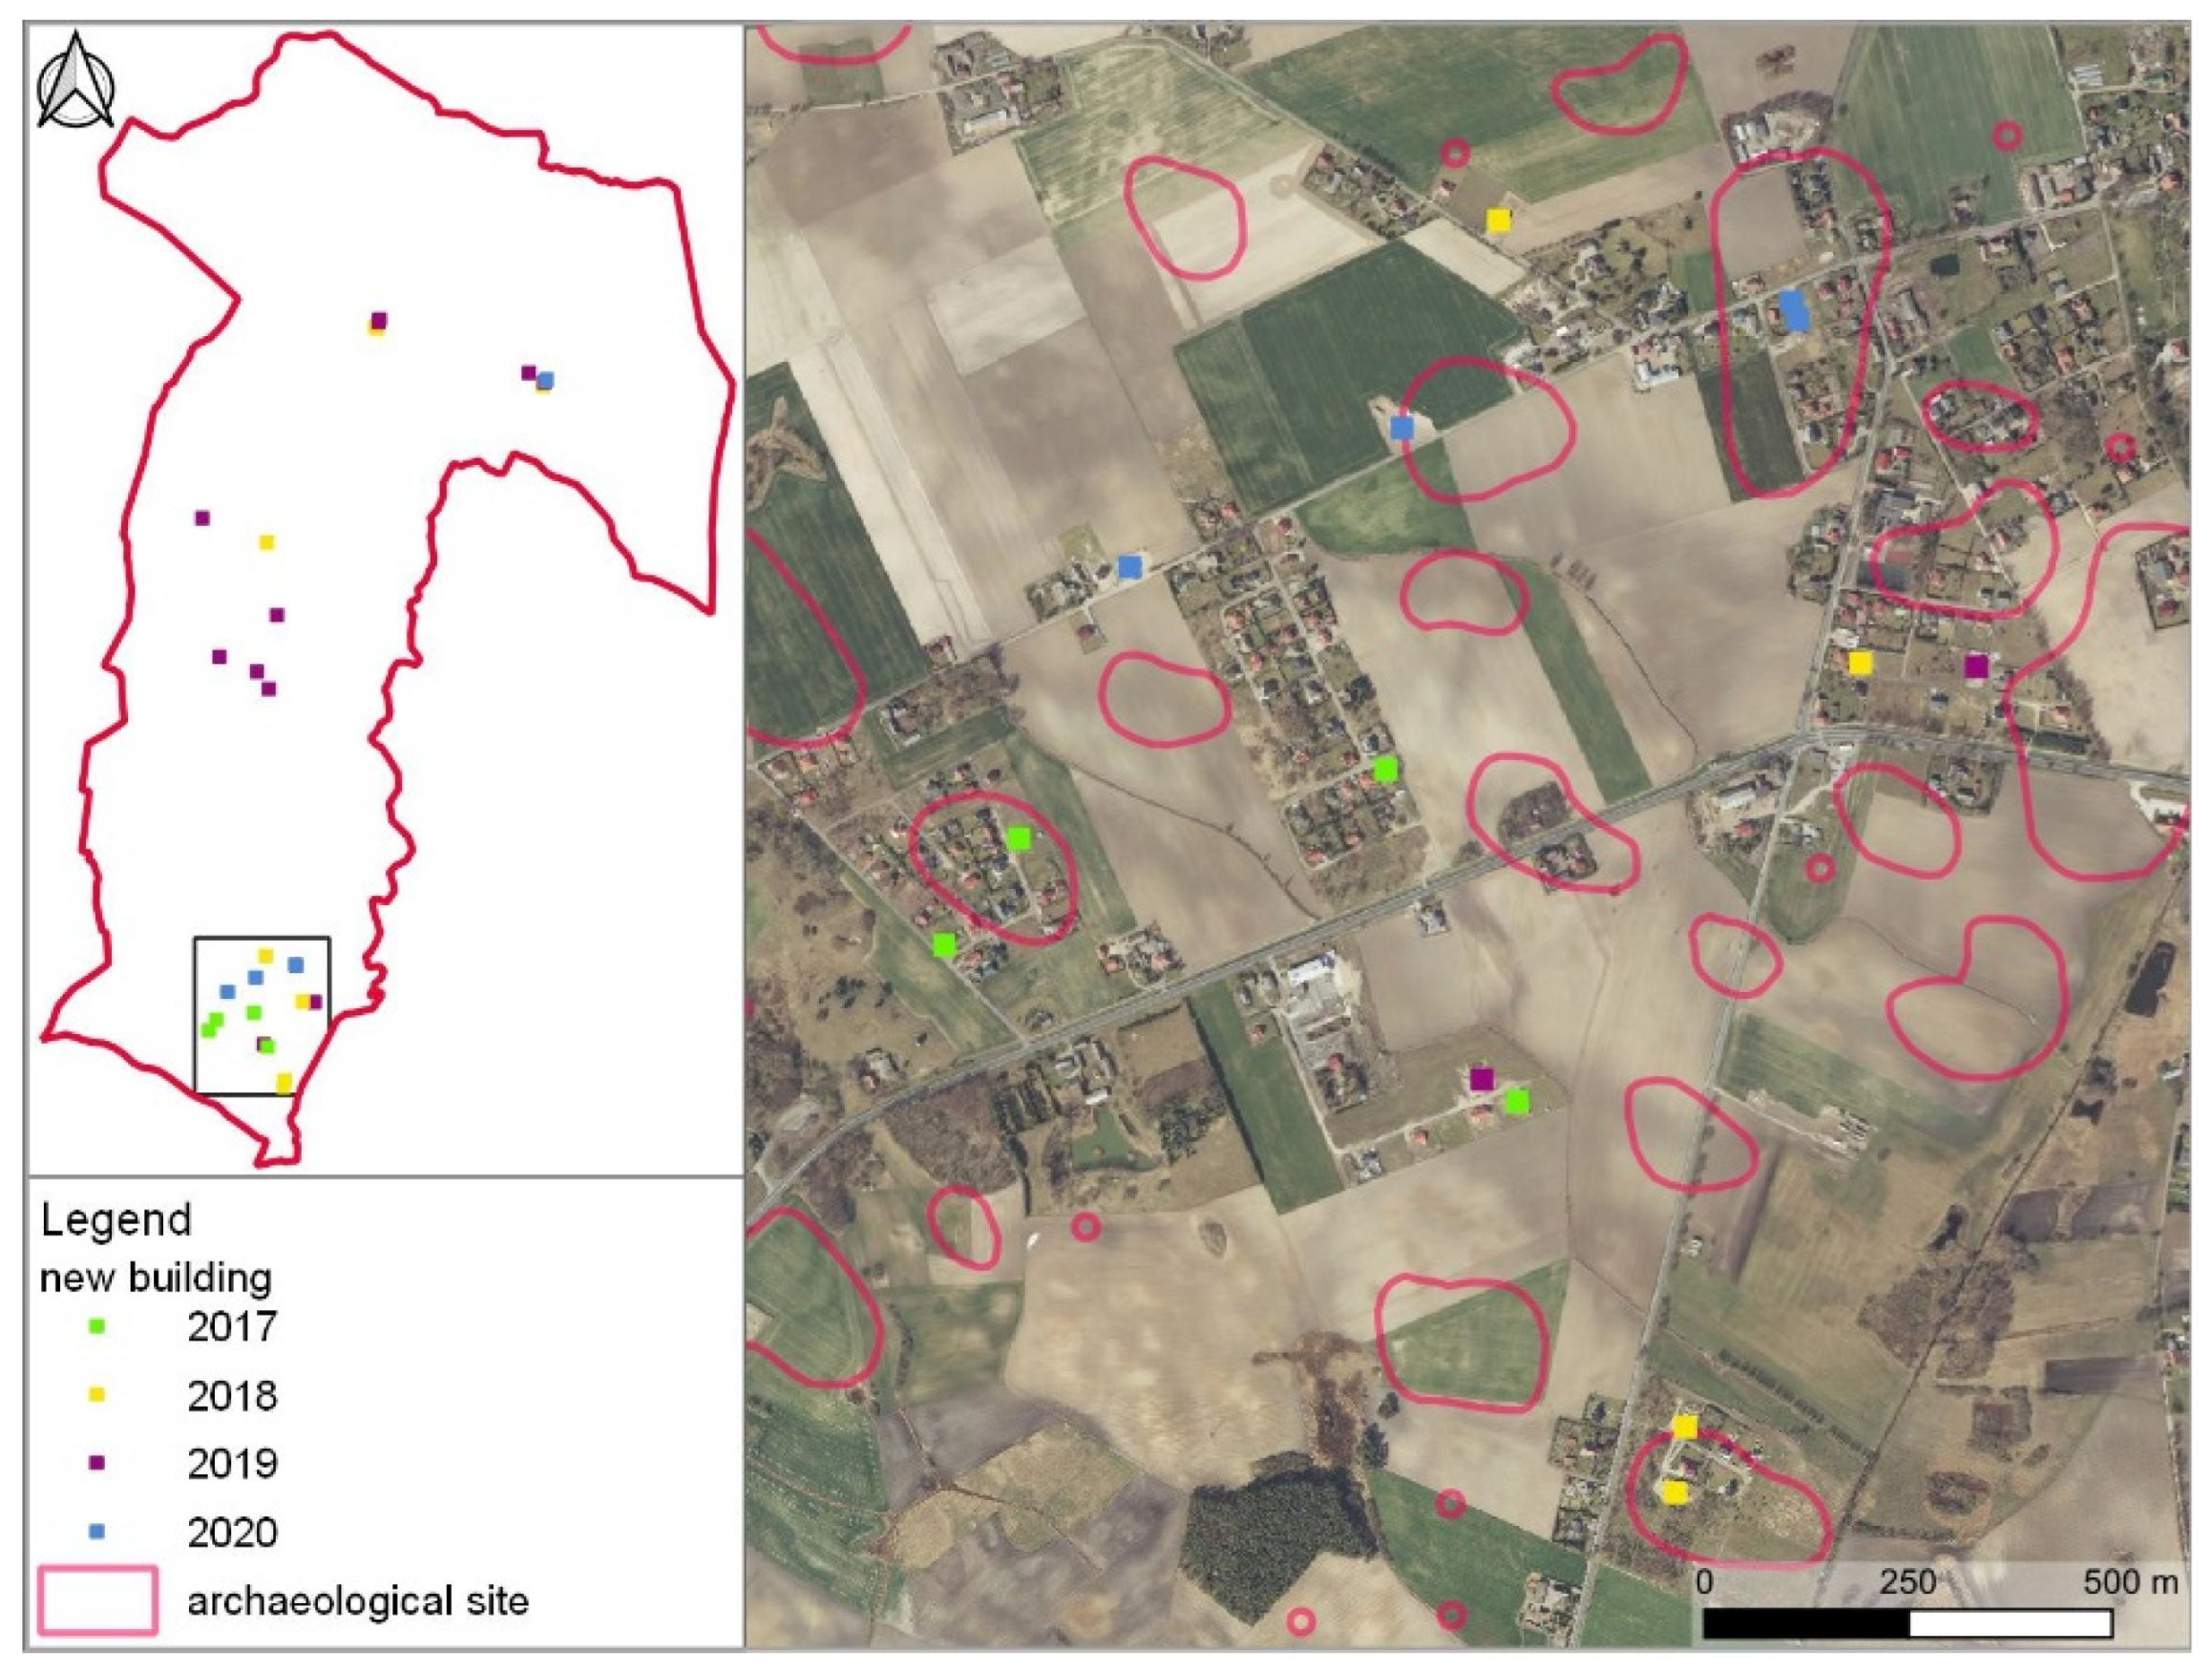
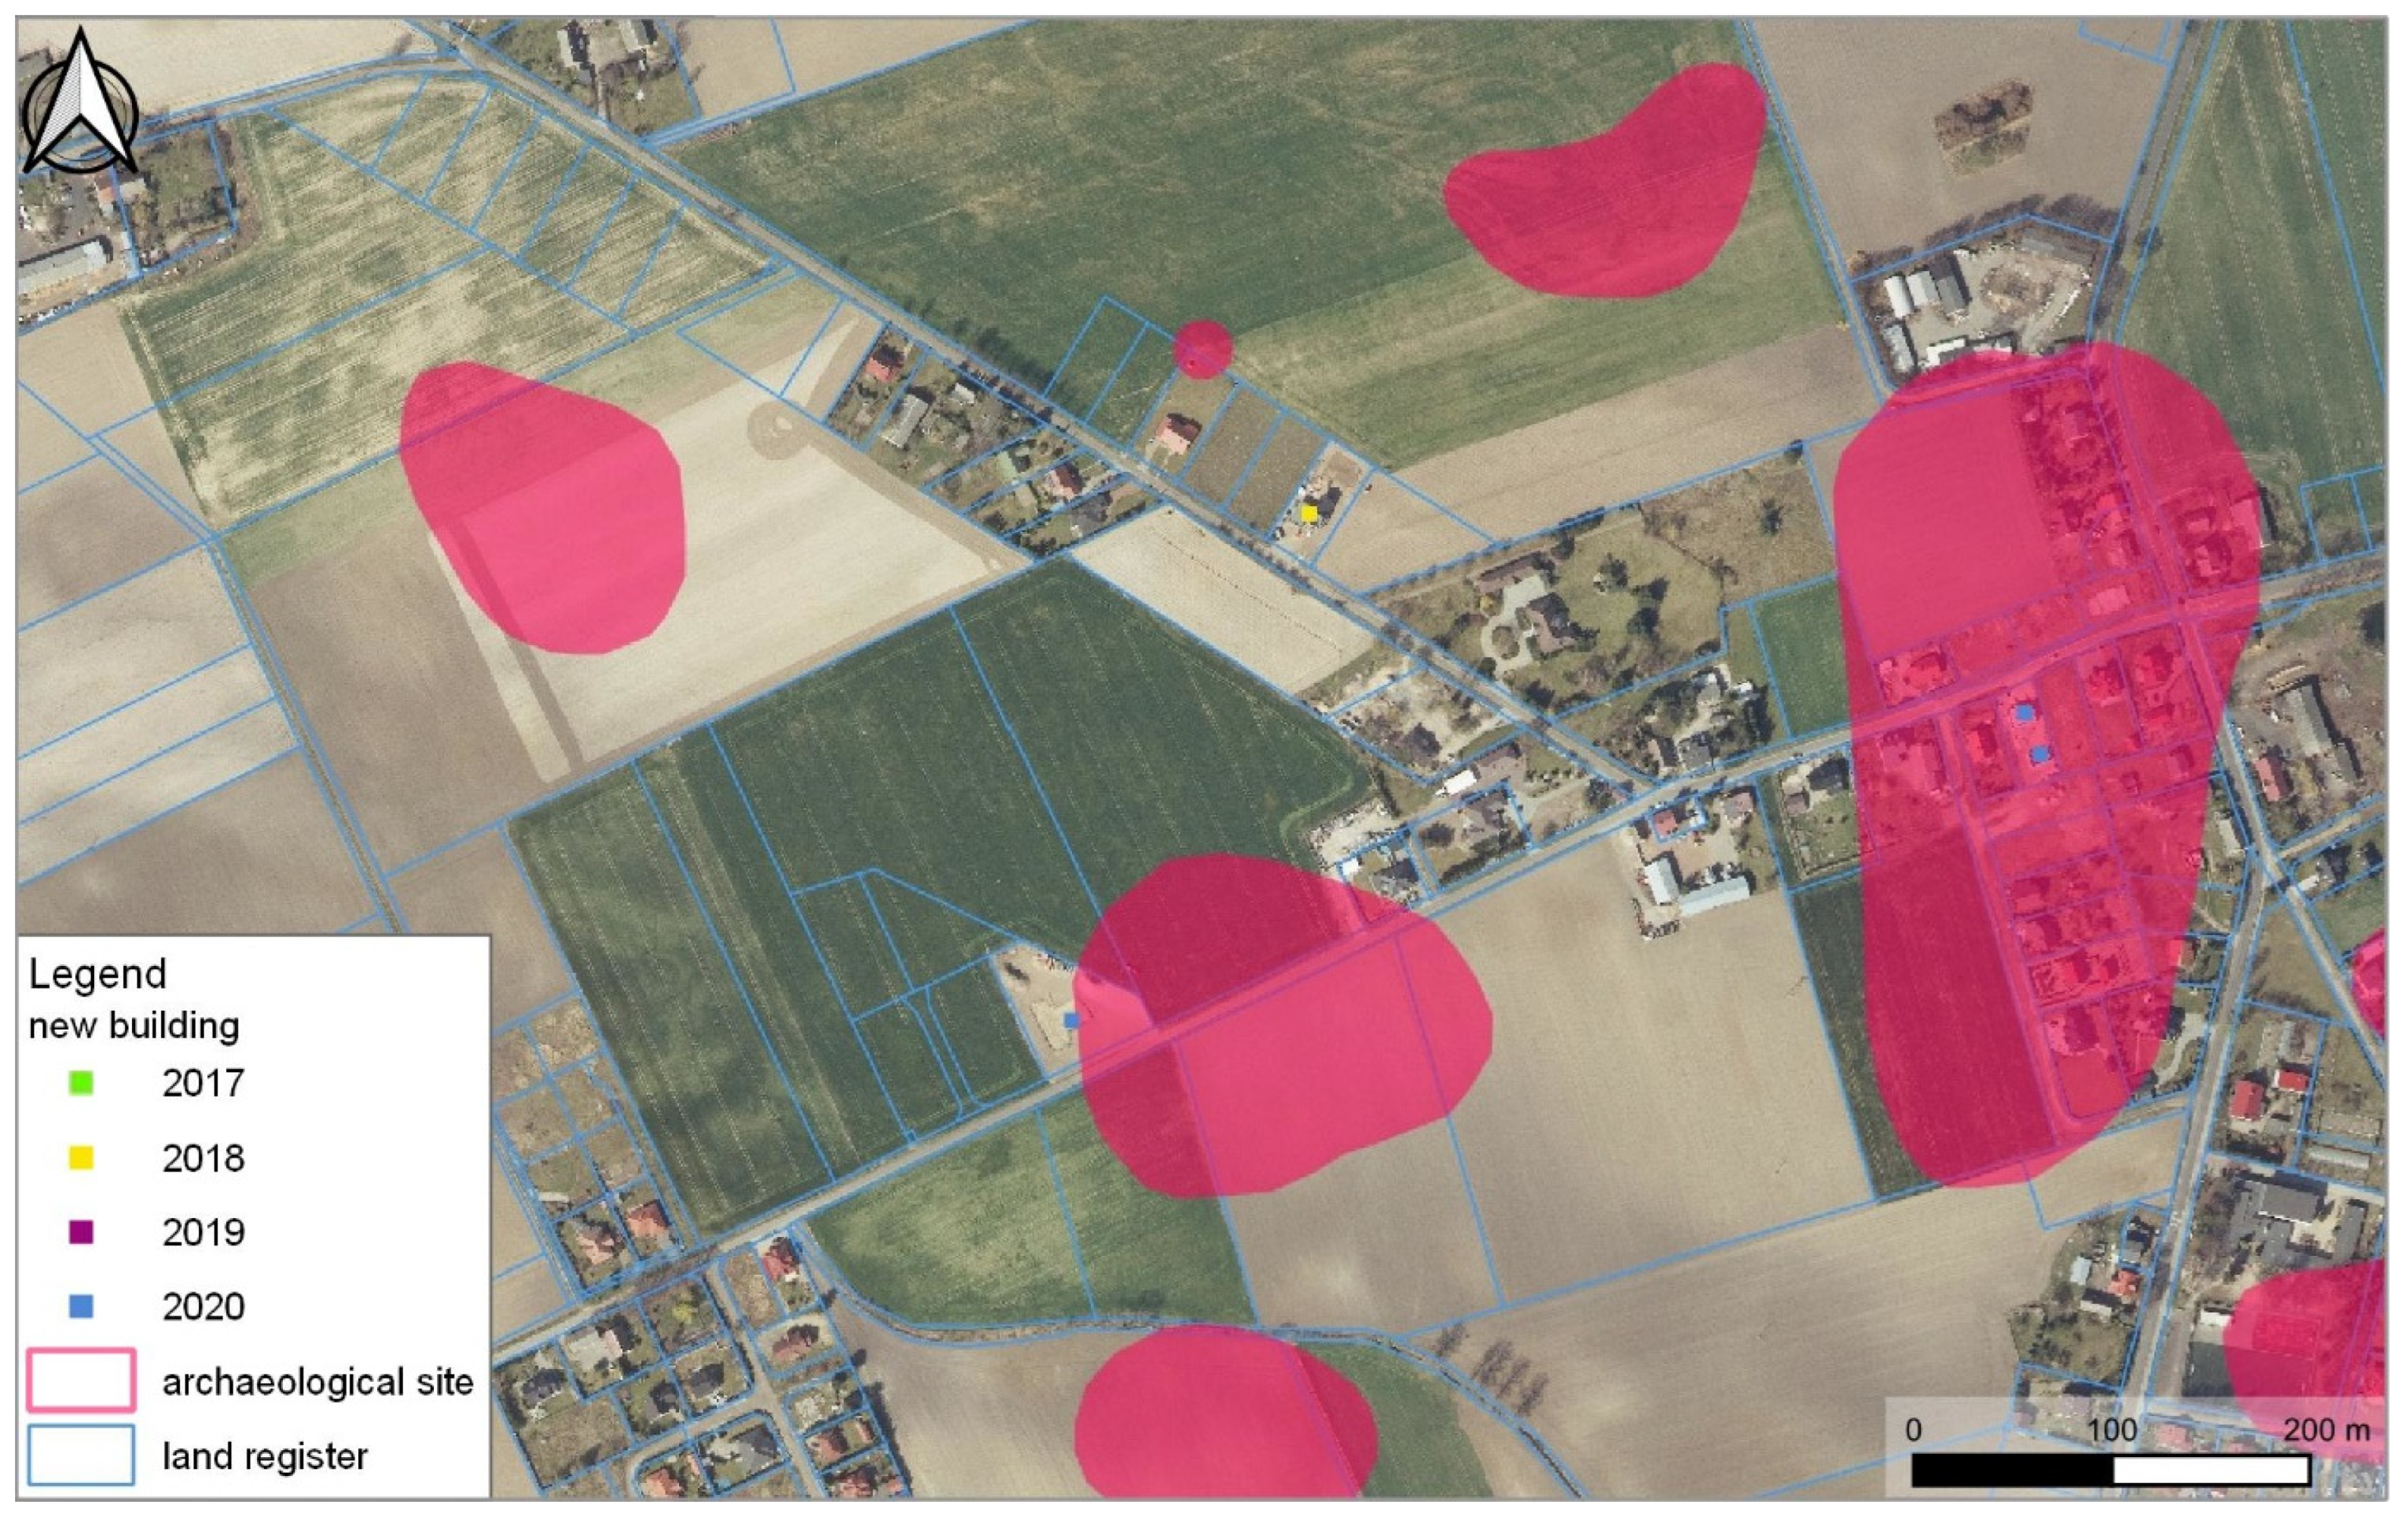
Using those results, an additional survey can be proposed in endangered areas to update archaeological records, and include them in heritage decisions about rescue excavations in future. In particular, the area near Lednogóra in the southern part of Lednica Landscape Park requires further examination, as indicated by integrated analysis of spatial development plans, land and building register and actual construction works (Figure 20, see also Figure 2). This still-predominantly arable area offers opportunities to conduct field walking surveys and aerial reconnaissance to record archaeological sites.
NDVI analysis can be used to support field survey planning without the necessity of direct field observation. This may be particularly beneficial when works are planned in more remote areas. Despite encouraging results, however, we cannot overlook problems that were caused to the sequence of S2 images by cloud coverage. While long-term NDVI offers enough opportunities to select one sufficiently cloudless scene per month (apart, perhaps, from winter months), precise field survey planning may be considerably hampered by cloud coverage. Even in summer months, only three (out of five) images were usable for the detailed analysis of rapeseed development, although all demonstrated various degrees of cloudiness. Autumn and winter seasons proved much more difficult. The random availability of sufficiently cloudless patches over a study area may prevent regular observations of winter crop development and field accessibility after maize harvesting, which is required for precise planning. There is also considerable room for development of the proposed methods, especially to understand the effect of threshold values on identification of different stages of crop development. The early stage of vegetation gives sufficient visibility for fieldwalking, but may be identified in NDVI as an inaccessible area (see Figure 15 and Figure 16). Future work may require more precise discrimination between bare soil and vegetation areas, based on the application of additional analysis, e.g. spectral characteristic (spectral curves rules) or orthogonal transformations of spectral feature space like Gram-Schmidt or Tasseled Cap [37,38].
6. Conclusions
Land use and land cover changes that are observed within Lednica Landscape Park have a two-fold effect on archaeological structures: direct (destruction by construction works) and indirect (influencing the efficiency of some prospection methods). Analysis of land use changes allowed the identification of further destruction and areas into which construction works may expand, and threaten sites that had hitherto been undisturbed. In particular, statistical analysis of spectral brightness seems to offer considerable potential to monitor changes within building parcels; this included the detection of topsoil removal prior to construction works and identification of new buildings. Despite positive results, Sentinel-2 can be regarded as a supporting dataset for national spatial databases. The identification of new buildings from Sentinel data is a way of keeping track of these developments before current datasets provided by national institutions are updated. However, other possibilities for detecting threats to archaeological sites may be considered. As spectral brightness can indicate slight disturbances in topsoil, it can be used to monitor changes that are less regulated than housing development, e.g., illegal sand extraction.
A different role of Sentinel can be considered in understanding the effect of land cover changes on archaeological surveys. Temporal resolution of Sentinel images allows us to observe these changes at an unprecedented frequency. Therefore, it helps understand the potential of a given area for conducting an archaeological survey. NDVI analysis demonstrated the possibilities to estimate field accessibility in a given season, as well as for precise planning of field surveys in narrow periods between agricultural cycles. It can also help understand/illustrate negative survey results if field walking was enforced by field accessibility in unsuitable conditions. Better understanding of the limitations imposed by current farming practices may encourage the better planning of field surveys, and/or application of other survey methods that are not so sensitive to field conditions. Therefore, the further development of these methods should be considered. However, their potential may be considerably limited by cloud coverage, which reduces advantages of Sentinel-2’s temporal resolution. Thus, despite the limited success of Sentinel-1 analysis, it may encourage further attempts to explore directions that can help overcome limitations imposed by clouds.
Author Contributions
Conceptualization: L.Ż. and S.K.; Formal analysis: S.K.; Methodology: S.K.; Visualization: L.Ż.; Writing—original draft: L.Ż.; Writing—review & editing, S.K. All authors have read and agreed to the published version of the manuscript.
Funding
This research was funded by the Ministry of Culture and National Heritage (Poland) within the framework of the “Anthropogenic impact on archeological heritage: Lednica Landscape Park case study” project (3449/19/FPK/NID).
Acknowledgments
The project was carried out by the Museum of the First Piasts in Lednica, in cooperation with the Faculty of Archaeology, Adam Mickiewicz University in Poznań. We would like to thank the museum (in particular Andrzej Wyrwa and Andrzej Kowalczyk) for cooperation and permission to use materials and results of the project in this publication.
Conflicts of Interest
The authors declare no conflict of interest.
References
- Heffner, K. Zmiany Przestrzenne na Obszarach Wiejskich w Polsce w Okresie Transformacji i Podejściu do Unii Europejskiej. In Obszary Wiejskie—Wiejska Przestrzeń I Ludność, Aktywność Społeczna I Przedsiębiorczość; Heffner, K., Klemens, B., Eds.; Polska Akademia Nauk Komitet Przestrzennego Zagospodarowania Kraju: Warszawa, Poland, 2016; pp. 12–27. [Google Scholar]
- Gorzelak, E. Polskie rolnictwo W XX W. Produkcja I ludność; Szkoła Główna Handlowa W Warszawie: Warszawa, Poland, 2010. [Google Scholar]
- Stankiewicz, D. Wpływ akcesji do UE na modernizację polskiego rolnictwa. Studia BAS 2010, 4, 217–246. [Google Scholar]
- Kurnatowska, Z.; Wyrwa, A.M. (Eds.) Ostrów Lednicki. Rezydencjonalno-Stołeczny Ośrodek Pierwszych Piastów; Instytut Archeologii I Etnologii Polskiej Akademii Nauk: Warszawa, Poland, 2016. [Google Scholar]
- Prinke, A. Polish National Record of Archaeological Sites: A Computerization. In Sites & Monuments. National Archaeological Records; Larsen, C.U., Ed.; The National Museum of Denmark: Copenhagen, Denmark, 1992; pp. 89–93. [Google Scholar]
- Narodowy Instytut Dziedzictwa: NID. Pomniki Historii. Available online: https://zabytek.pl/pl/obiekty/rybitwy-wyspa-ostrow-lednicki (accessed on 20 January 2022).
- Ustawa Z Dnia 27 Marca 2003 R. O Planowaniu I Zagospodarowaniu Przestrzennym. Available online: https://isap.sejm.gov.pl/isap.nsf/download.xsp/WDU20030800717/U/D20030717Lj.pdf (accessed on 20 January 2022).
- Head Office of Geodesy and Cartography: Data. Available online: https://www.geoportal.gov.pl/dane (accessed on 20 January 2022).
- Fowler, M.J.F. Declassified Intelligence Satellite Photographs. AARGNews 2013, 13, 30–35. [Google Scholar]
- Beck, A.; Philip, G.; Abdulkarim, M.; Donoghue, D. Evaluation of Corona and Ikonos high resolution satellite imagery for archaeological prospection in western Syria. Antiquity 2007, 81, 161–175. [Google Scholar] [CrossRef] [Green Version]
- Lasaponara, R.; Masini, N. (Eds.) Advances on Remote Sensing for Archaeology and Cultural Heritage Management; Aracne: Rome, Italy, 2008. [Google Scholar]
- Parcak, S.H. Satellite Remote Sensing for Archaeology; Routledge: Abingdon, UK, 2009. [Google Scholar]
- Cowley, D. (Ed.) Remote Sensing for Archaeological Heritage Management; EAC: Brussels, Belgium, 2011. [Google Scholar]
- Rayne, L.; Bradbury, J.; Mattingly, D.; Philip, G.; Bewley, R.; Wilson, A. From above and on the ground: Geospatial methods for recording endangered archaeology in the Middle East and North Africa. Geosciences 2017, 7, 100. [Google Scholar] [CrossRef] [Green Version]
- Gade, M.; Kohlus, J.; Kost, C. SAR imaging of archaeological sites on intertidal flats in the German Wadden Sea. Geosciences 2017, 7, 105. [Google Scholar] [CrossRef] [Green Version]
- Tapete, D. Remote Sensing and Geosciences for Archaeology. In Remote Sensing and Geosciences for Archaeology; Tapete, D., Ed.; MDPI: Basel, Switzerland, 2018; pp. 1–10. [Google Scholar]
- Zaina, F. A Risk Assessment for Cultural Heritage in Southern Iraq: Framing Drivers, Threats and Actions Affecting Archaeological Sites. Conserv. Manag. Archaeol. Sites 2019, 21, 184–206. [Google Scholar] [CrossRef]
- Tapete, D.; Cigna, F. Appraisal of Opportunities and Perspectives for the Systematic Condition Assessment of Heritage Sites with Copernicus Sentinel-2 High-Resolution Multispectral Imagery. Remote Sens. 2018, 10, 561. [Google Scholar] [CrossRef] [Green Version]
- Tapete, D. (Ed.) Remote Sensing and Geosciences for Archaeology; MDPI: Basel, Switzerland, 2018. [Google Scholar]
- Agapiou, A. Multi-Temporal Change Detection Analysis of Vertical Sprawl over Limassol City Centre and Amathus Archaeological Site in Cyprus during 2015–2020 Using the Sentinel-1 Sensor and the Google Earth Engine Platform. Sensors 2021, 21, 1884. [Google Scholar] [CrossRef] [PubMed]
- Chyla, J.M. How Can Remote Sensing Help in Detecting the Threats to Archaeological Sites in Upper Egypt? Geosciences 2017, 7, 97. [Google Scholar] [CrossRef] [Green Version]
- Parcak, S.; Mumford, G.; Childs, C. Using Open Access Satellite Data Alongside Ground Based Remote Sensing: An Assessment, with Case Studies from Egypt’s Delta. Geosciences 2017, 7, 94. [Google Scholar] [CrossRef] [Green Version]
- European Comission. Regulation (EU) No 377/2014 of the European Parliament and of the Council of 3 April 2014 Establishing the Copernicus Programme and Repealing Regulation (EU) No 911/2010. Available online: https://publications.europa.eu/en/publication-detail/-/publication/976616e8-cb7c-11e3-b74e-01aa75ed71a1 (accessed on 20 January 2022).
- European Space Agency. Sentinel-1: ESA’s Radar Observatory Mission for GMES Operational Services. ESA SP-1322/1. 2012. Available online: https://sentinel.esa.int/documents/247904/349449/S1_SP-1322_1.pdf (accessed on 20 January 2022).
- European Space Agency. ESA’s Optical High-Resolution Mission for GMES Operational Services. ESA SP-1322/2. 2012. Available online: https://sentinel.esa.int/documents/247904/349490/S2_SP-1322_2.pdf (accessed on 20 January 2022).
- Wojewódzka Rada Narodowa. Uchwała Nr XXVI/205/88 Wojewódzkiej Rady Narodowej W Poznaniu Z Dnia 26 Maja 1988 R. W Sprawie Utworzenia Parku Krajobrazowego Wokół Jeziora Lednickiego P.N. Lednicki Park Krajobrazowy. Dziennik Urzędowy Woj. Poznańskiego 1989, 6, 58. [Google Scholar]
- Urząd Gminy Łubowo. System Informacji Przestrzennej. Available online: https://lubowo.e-mapa.net/ (accessed on 20 January 2022).
- Minister Kultury I Dziedzictwa Narodowego. Rozporządzenie Ministra Kultury I Dziedzictwa Narodowego Z Dnia 2 Sierpnia 2018 R. W Sprawie Prowadzenia Prac Konserwatorskich, Prac Restauratorskich I Badań Konserwatorskich Przy Zabytku Wpisanym Do Rejestru Zabytków Albo Na Listę Skarbów Dziedzictwa Oraz Robót Budowlanych, Badań Architektonicznych I Innych Działań Przy Zabytku Wpisanym Do Rejestru Zabytków, a Także Badań Archeologicznych I Poszukiwań Zabytków. 2018. Available online: http://isap.sejm.gov.pl/isap.nsf/download.xsp/WDU20180001609/O/D20181609.pdf (accessed on 20 January 2022).
- Minister Rozwoju, Pracy I Technologii. RozporząDzenie Ministra Rozwoju, Pracy I Technologii Z Dnia 27 Lipca 2021 R. W Sprawie Bazy Danych Obiektów Topograficznych Oraz Bazy Danych Obiektów Ogólnogeograficznych, a TakżE Standardowych Opracowań Kartograficznych. 2018. Available online: https://isap.sejm.gov.pl/isap.nsf/download.xsp/WDU20210001412/O/D20211412.pdf (accessed on 20 January 2022).
- Minister Rozwoju Regionalnego I Budownictwa RozporząDzenie Ministra Rozwoju Regionalnego I Budownictwa Z Dnia 29 Marca 2001 R. W Sprawie Ewidencji Gruntów I Budynków. 2001. Available online: http://isap.sejm.gov.pl/isap.nsf/download.xsp/WDU20010380454/O/D20010454.pdf (accessed on 20 January 2022).
- Shahzad, M.; Maurer, M.; Fraundorfer, F.; Wang, Y.; Zhu, X.X. Buildings Detection in VHR SAR Images Using Fully Convolution Neural Networks in IEEE. Trans. Geosci. Remote Sens. 2019, 57, 1100–1116. [Google Scholar] [CrossRef] [Green Version]
- Mutanga, O.; Kumar, L. Google Earth Engine applications. Remote Sens. 2019, 11, 591. [Google Scholar] [CrossRef] [Green Version]
- Earth Engine Data Catalog. Available online: https://developers.google.com/earth-engine/datasets/catalog/COPERNICUS_S1_GRD (accessed on 20 January 2022).
- European Space Agency, RADAR COURSE, Part 42. Available online: https://earth.esa.int/web/guest/missions/esa-operational-eo-missions/ers/instruments/sar/applications/radar-courses/content-3/-/asset_publisher/mQ9R7ZVkKg5P/content/radar-course-3-temporal-averaging (accessed on 20 January 2022).
- Ma, X.; Wu, P. Multitemporal SAR Image Despeckling Based on a Scattering Covariance Matrix of Image Patch. Sensors 2019, 19, 3057. [Google Scholar] [CrossRef] [PubMed] [Green Version]
- Sentinel-1 Preprocessing. Available online: https://developers.google.com/earth-engine/guides/sentinel1 (accessed on 20 January 2022).
- Cierniewski, J.; Królewicz, S.; Kaźmierowski, C. Annual dynamics of shortwave radiation as consequence of smoothing of previously plowed and harrowed soils in Poland. J. Appl. Meteorol. Climatol. 2017, 56, 735–743. [Google Scholar] [CrossRef]
- Avola, G.; Di Gennaro, S.F.; Cantini, C.; Riggi, E.; Muratore, F.; Tornambè, C.; Matese, A. Remotely sensed vegetation indices to discriminate field-grown olive cultivars. Remote Sens. 2019, 11, 1242. [Google Scholar] [CrossRef] [Green Version]
Figure 1.
Location of the study area within Lednica Landscape Park. Background: orthophotomap (2020), source: geoportal.gov.pl (accessed on 20 January 2022).
Figure 1.
Location of the study area within Lednica Landscape Park. Background: orthophotomap (2020), source: geoportal.gov.pl (accessed on 20 January 2022).

Figure 2.
Location of archaeological sites in southern part of the study area against spatial development plans for the Łubowo commune. Brown areas are designated for housing development. Source: https://lubowo.e-mapa.net/ (accessed on 20 January 2022).
Figure 2.
Location of archaeological sites in southern part of the study area against spatial development plans for the Łubowo commune. Brown areas are designated for housing development. Source: https://lubowo.e-mapa.net/ (accessed on 20 January 2022).

Figure 3.
Percentage of cloudiness in 2019 and 2020 based on Sentinel-2 metadata for the tile N33UXU (UTM) that covers the study area.
Figure 3.
Percentage of cloudiness in 2019 and 2020 based on Sentinel-2 metadata for the tile N33UXU (UTM) that covers the study area.

Figure 4.
Wasteland in 2019 shows the first stages of construction works in 2020 with topsoil removal for a road; approx. value: −111,000. Background: orthophotomap, source: geoportal.gov.pl (accessed on 20 January 2022).
Figure 4.
Wasteland in 2019 shows the first stages of construction works in 2020 with topsoil removal for a road; approx. value: −111,000. Background: orthophotomap, source: geoportal.gov.pl (accessed on 20 January 2022).

Figure 5.
Wooded area in 2019 shows construction works in 2020; approx. value: −42,800. Background: orthophotomap, source: geoportal.gov.pl (accessed on 20 January 2022).
Figure 5.
Wooded area in 2019 shows construction works in 2020; approx. value: −42,800. Background: orthophotomap, source: geoportal.gov.pl (accessed on 20 January 2022).

Figure 6.
Topsoil removal in 2019 shows the location of two buildings that can be seen under construction in 2020; approx. value: −118,000. Background: orthophotomap, source: geoportal.gov.pl (accessed on 20 January 2022).
Figure 6.
Topsoil removal in 2019 shows the location of two buildings that can be seen under construction in 2020; approx. value: −118,000. Background: orthophotomap, source: geoportal.gov.pl (accessed on 20 January 2022).

Figure 7.
Foundations in 2019 and the completed building in 2020; approx. value: −73,800. Background: orthophotomap, source: geoportal.gov.pl (accessed on 20 January 2022).
Figure 7.
Foundations in 2019 and the completed building in 2020; approx. value: −73,800. Background: orthophotomap, source: geoportal.gov.pl (accessed on 20 January 2022).

Figure 8.
Land under similar use shows positive values in 2019 and 2020. This indicates that no destructive change was observed; approx. value: 111,400. Background: orthophotomap, source: geoportal.gov.pl (accessed on 20 January 2022).
Figure 8.
Land under similar use shows positive values in 2019 and 2020. This indicates that no destructive change was observed; approx. value: 111,400. Background: orthophotomap, source: geoportal.gov.pl (accessed on 20 January 2022).

Figure 9.
False positive indicated by high negative values but probably caused by poor lawn condition or minor change of use; value: −50,800. Background: orthophotomap, source: geoportal.gov.pl (accessed on 20 January 2022).
Figure 9.
False positive indicated by high negative values but probably caused by poor lawn condition or minor change of use; value: −50,800. Background: orthophotomap, source: geoportal.gov.pl (accessed on 20 January 2022).

Figure 10.
Results of radar image tresholding (VV polarisation) for Lednica Landscape Park. (A) average radar image for April 2019. (B) buildings (red) obtained from Topographic Objects Database (BDOT10k). (C) average radar image for November 2019 (potential buildings: black). A large rectangle represents a field after ploughing—its reflectance is similar to that of buildings.

Figure 11.
Residential area in Lednogóra. (A) a very high signal in the middle of the image (white) was obtained from a single building whose reflectance area (as indicated in radar image) is considerably larger than in reality. This results from radar’s signal reflection. Averaged radar images were obtained from data between 1 and 30 April 2019 in two polarisations: ascVV (A) i ascVH (B). Black polygons: buildings obtained from Topographic Database Objects BDOT10k. (C) satellite image was used for comparative purposes to show current spatial arrangements of buildings (source: Google Earth).

Figure 12.
Total area of bare fields (available for field walking survey) in Lednica Landscape through 2019.
Figure 12.
Total area of bare fields (available for field walking survey) in Lednica Landscape through 2019.

Figure 13.
An estimated field accessibility on 6 April (blue) and 23 October 2019 (light green). Mixed colours (dark green) indicate areas that were accessible for field walking survey in both terms.
Figure 13.
An estimated field accessibility on 6 April (blue) and 23 October 2019 (light green). Mixed colours (dark green) indicate areas that were accessible for field walking survey in both terms.

Figure 14.
11 March 2020: Lednogóra (1) was already inaccessible due to the advanced development of winter wheat. Field walking was postponed until after harvesting. Moraczewo (2) was accessible in early spring (bare soil), but late maize sowing gave more time for survey planning. Field walking was carried out on 5 May, when agricultural treatments also improved survey conditions. On 15 May 2020, this field was still accessible. Brown: bare fields, white: crop coverage, blue: water, green: grassland.

Figure 15.
Lednogóra and Moraczewo between 23 August and 12 September 2020 r. shows changing field accessibility due to quick rapeseed development and characteristic of plants that cover ground at early stage of growth. Brown: bare fields, white: crop coverage, blue: water, green: grassland. Field walking: 9 September 2020.

Figure 16.
The field cover of early rapeseed gives sufficient visibility for fieldwalking, but the soil at this time of year (late summer) is too dry, and offers poor contrast for pottery (9 September 2020, photo: A. Kowalczyk).
Figure 16.
The field cover of early rapeseed gives sufficient visibility for fieldwalking, but the soil at this time of year (late summer) is too dry, and offers poor contrast for pottery (9 September 2020, photo: A. Kowalczyk).

Figure 17.
Gradual destruction of sites in Lednogóra by the further development of existing residential areas. Background: orthophotomap, source: geoportal.gov.pl (accessed on 20 January 2022).
Figure 17.
Gradual destruction of sites in Lednogóra by the further development of existing residential areas. Background: orthophotomap, source: geoportal.gov.pl (accessed on 20 January 2022).

Figure 18.
Partial site destruction by an isolated new building in Skrzetuszewo. Background: orthophotomap, source: geoportal.gov.pl (accessed on 20 January 2022).
Figure 18.
Partial site destruction by an isolated new building in Skrzetuszewo. Background: orthophotomap, source: geoportal.gov.pl (accessed on 20 January 2022).

Figure 19.
New residential areas near Sławno and Dziećmiarki. Background: orthophotomap, source: geoportal.gov.pl (accessed on 20 January 2022).
Figure 19.
New residential areas near Sławno and Dziećmiarki. Background: orthophotomap, source: geoportal.gov.pl (accessed on 20 January 2022).

Figure 20.
Transformation of arable land into building parcels combined with information about current building works indicate priority areas for further archaeological survey in Lednogóra. Background: orthophotomap, source: geoportal.gov.pl (accessed on 20 January 2022).
Figure 20.
Transformation of arable land into building parcels combined with information about current building works indicate priority areas for further archaeological survey in Lednogóra. Background: orthophotomap, source: geoportal.gov.pl (accessed on 20 January 2022).

Publisher’s Note: MDPI stays neutral with regard to jurisdictional claims in published maps and institutional affiliations. |
© 2022 by the authors. Licensee MDPI, Basel, Switzerland. This article is an open access article distributed under the terms and conditions of the Creative Commons Attribution (CC BY) license (https://creativecommons.org/licenses/by/4.0/).
Share and Cite
MDPI and ACS Style
Żuk, L.; Królewicz, S. Uses of Sentinel-1 and -2 Images in Heritage Management: A Case Study from Lednica Landscape Park (Poland). Geosciences 2022, 12, 159. https://0-doi-org.brum.beds.ac.uk/10.3390/geosciences12040159
AMA Style
Żuk L, Królewicz S. Uses of Sentinel-1 and -2 Images in Heritage Management: A Case Study from Lednica Landscape Park (Poland). Geosciences. 2022; 12(4):159. https://0-doi-org.brum.beds.ac.uk/10.3390/geosciences12040159
Chicago/Turabian StyleŻuk, Lidia, and Sławomir Królewicz. 2022. "Uses of Sentinel-1 and -2 Images in Heritage Management: A Case Study from Lednica Landscape Park (Poland)" Geosciences 12, no. 4: 159. https://0-doi-org.brum.beds.ac.uk/10.3390/geosciences12040159
Note that from the first issue of 2016, this journal uses article numbers instead of page numbers. See further details here.