1. Introduction
Sexual dimorphism represents a common feature of many mammals, and it affects the body size and morphometry of several species [
1,
2,
3,
4]. The family Rhinocerotidae displays a certain degree of sexual dimorphism in extant and fossil species. Among the extant rhinoceroses, Groves [
5] detected dimorphic characters in the width of the nasal bones, the height of the occiput, and the width of the mastoids on the crania of the Indian rhinoceros (
Rhinoceros unicornis). Guérin [
6] and Groves [
5] documented a larger size of female individuals in respect to males in
Rhinoceros sondaicus. The scant available samples analysed by the above-mentioned authors suggested that males and females of
R. sondaicus display a large overlap in nasal width, but with males having a well-developed horn [
5,
7]. According to Pocock [
7] and Groves [
5], nasal width differs in males and females of
Dicerorhinus sumatrensis, at least in the mainland and Sumatran forms but not in the Bornean subspecies (cf. [
5]). Furthermore, wild Sumatran rhinoceros males are proportionally larger than females [
5]. Owen-Smith [
8] pointed out that
Ceratotherium simum (the white rhino) is sexually dimorphic in body size and horn size whereas
Diceros bicornis (the black rhino) is monomorphic. According to Rachlow and Berger [
9], adult male white rhinos have larger horn bases than adult females.
Sexual dimorphism has been documented in cranial remains of some Neogene Rhinocerotidae lineages [
10,
11,
12,
13,
14,
15,
16,
17,
18,
19,
20]. The early Miocene
Menoceras arikarense shows horn bosses with a degree of dimorphism comparable to modern ruminants [
17,
19]. Individuals of the North American genera
Teleoceras and
Aphelops can be easily distinguished in male and female groups based on tusk size [
12,
14,
15,
16,
18]. In Eurasia, Cerdeño and Sánchez [
20] detected sexual dimorphism in the development of i2, as tusks, in
Alicornops simorrensis and
Aceratherium incisivum. Deng [
10] and Chen et al. [
21] observed that male individuals of
Chiloterium wimani had bigger tusks, more robust mandibles, and wider skulls than females. In the elasmotherine
Iranotherium morgani, Deng [
11] discovered one qualitatively dimorphic character (males have a hemispherical hypertrophy on zygomatic arches while female individuals have no such structure) and several quantitative sexually dimorphic characters in the development of the nasal horn boss, in the width of the zygomatic arches, and in the width of the anterior part of the nasals. Lu et al. [
13] noted that in
Plesiaceratherium gracile both lower tusks and upper incisors are sexually dimorphic. Lastly, Borsuk-Bialynicka [
22] discovered that several cranial dimensions of
Coelodonta antiquitatis were bimodal (such as the width of occiput, the maximum length, the orbit–nuchal crest, the orbit–nares lengths, and the width of the zygomatic arches). Studies on dimorphic characters in postcranial remains, which are often the most abundant element in the Rhinocerotidae fossil record, are currently limited to a few North American taxa [
15,
16,
17,
23], and no studies have been previously conducted on this topic within Quaternary species.
Although some research on cranial material has been carried out [
24,
25,
26], sexual dimorphism has been poorly evaluated or investigated in Pleistocene Eurasian
Stephanorhinus species, leaving a gap in our knowledge about their morphometric variability. Among the representatives of this genus,
S. etruscus represents the most abundant species, with numerous remains collected from Western European localities. The aim of this contribution is therefore to detect possible sexual dimorphic characters in the measurements of postcranial material referred to the extinct
S. etruscus.
2. Materials and Methods
We considered measurements taken on 45 postcranial variables of main weightbearing limb elements including radius, third metacarpal (MCIII), tibia, astragalus, calcaneum, and third metatarsal (MTIII). The humerus and femur of
S. etruscus were not included in this study; despite being good indicators of dimorphism, these two bones are often damaged and/or deformed. Linear measurements and bone circumferences were collected by direct study of material housed in various European institutions and from published material (
Supplementary Materials S1 and S2). All the considered limb bones belong to adult individuals with completely fused epiphyses. Because of the disarticulated nature of
S. etruscus remains, it was impossible to determine the sex of the material a priori in any postcranial element. Therefore, it was necessary to apply different methods. Mihlbachler [
16,
17] found that sex-combined summary statistics were capable of pinpointing strong sexual dimorphism, identifying patterns of bimodality in the sex-combined assemblage of bones against the null expectation of a unimodal normal distribution. Three different statistical metrics were used to identify patterns of bimodality in the data: (1) in mammals, sexually dimorphic variables, such as tusks in
Teleoceras [
15,
17], tend to yield coefficients of variation that exceed a value of 10 [
27]; (2) a Shapiro–Wilk test of normality (W) was used to test for deviation from a unimodal normal distribution. Significant results indicate deviation from normality. Sall & Lehman [
28] recommended an alpha level (p) for this test < 0.1; (3) an additional mean to verify the presence of dimorphism is the coefficient of bimodality (b). A value of b greater than 0.55 usually indicates a bimodal or polymodal distribution [
29,
30]. The Shapiro–Wilk test of normality was developed in R Environment version 3.6.1 [
30] with the package
stats(), version 3.6.1. The bimodality coefficient b was developed in R Environment version 3.6.1 [
31] with the package
mouse trap() version 3.1.5 [
32]. All graphs were obtained in R Environment version 3.6.1 (2019) [
31] with the package
ggplot2() version 3.3.3 [
33]. Mathematical equations used to calculate statistical metrics can be found in
Supplementary Materials S3.
Measurement abbreviations: APDb, calcaneum anterior–posterior diameter of the beak; APDm, astragalus anterior–posterior diameter of the medial face; APDS, anterior-posterior diameter of the shaft; APDs, calcaneum anterior–posterior diameter of the tuber calcanei; DAPD, anterior–posterior diameter of the distal epiphysis; DAPDa, anterior– posterior diameter of the distal articular surface; DTD, transverse diameter of the distal epiphysis; DTDa, transverse diameter of the distal articular surface; Hm, height of the medial face of astragalus; Hmax, maximum height; Hl, height of the lateral face of astragalus; Htm, height of the medial lip of the trochlea; Htl, height of the lateral lip of the trochlea; Lmax, maximal length; PAPD, anterior–posterior diameter of the proximal epiphysis; PTD, transverse diameter of the proximal epiphysis; TDl, transverse diameter between the lips of the trochlea; TDmax, astragalus maximum transverse diameter; TDmp, calcaneum minimum posterior transverse diameter; TDS, transverse diameter of the shaft; TDs, calcaneum transverse diameter of the tuber calcanei; TDst, transverse diameter of the sustentaculum talii.
Other abbreviations: CV, coefficient of variation; max, maximum; min, minimum; N, number of observations; Pr. < W, p value for Shapiro–Wilk test of normality; SD, standard deviation.
3. Results
Specimens from Upper Valdarno are well-represented within the considered dataset; accordingly, a statistical analysis and a graphical representation of this sample have been attempted (
Supplementary Materials S2). Bivariate plots of selected measurements, such as the Lmax, DTD and DTP, show the presence of two possible clusters in the radius, tibia, MCIII, and MTIII (
Supplementary Material S3: Figures S1–S6). However, statistical metrics were not able to identify a clear bimodal distribution due to the low number of values (
Supplementary Materials S3: Tables S1–S6).
Considering the dataset as a whole, four measurements on 45 (9%) show a bimodality coefficient (b) greater than or equal to 0.55, and six others are very close to this value. Eight measurements (18%) have a high coefficient of variation (CV > 10) and 16 (35%) deviate from the normal trend of the distribution curve (p-value < 0.1), suggesting that some postcranial characters of S. etruscus are bimodal.
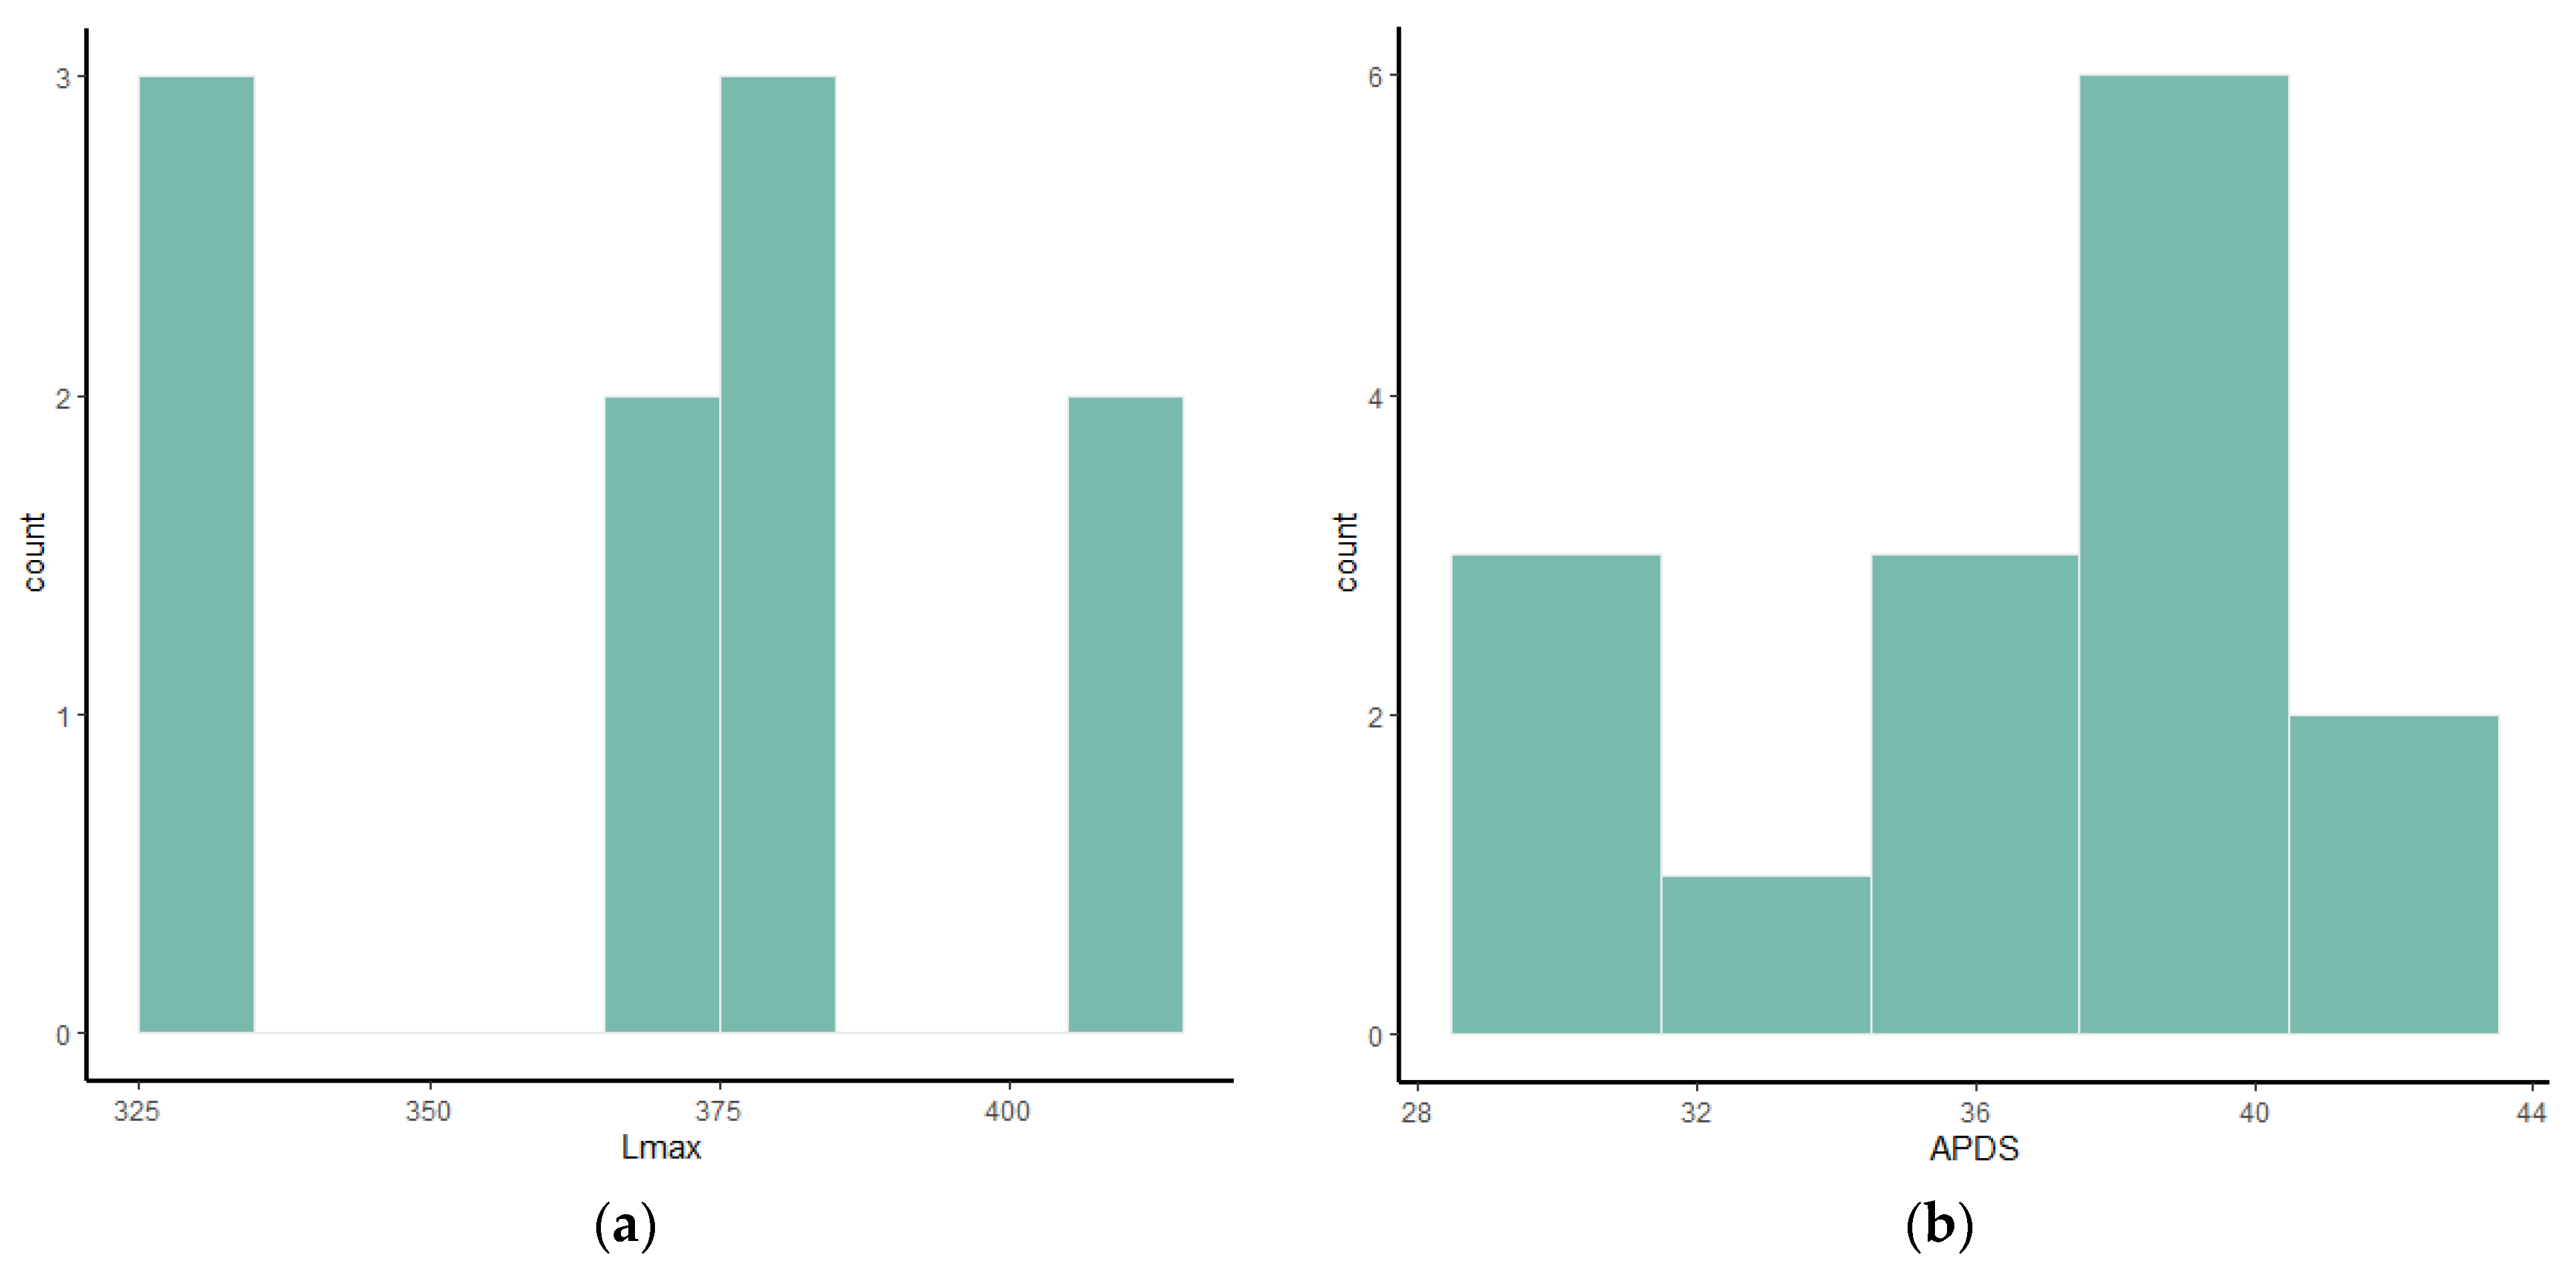
A closer look at the postcranial data reveals which postcranial variables have a higher probability to be sexually dimorphic. Only the APDS of the radius (
Table 1) yields a coefficient of bimodality higher than 0.55. The same variable shows a relatively high coefficient of variation.
The DAPD has a relatively high coefficient of variation and deviates significantly from normality, similarly to PTD. Concerning the results obtained for the tibia (
Table 2), it is possible to observe that only the PTD passes all three tests and shows a low
p-value for the Shapiro–Wilk test of normality, indicating a strong deviation from normality.
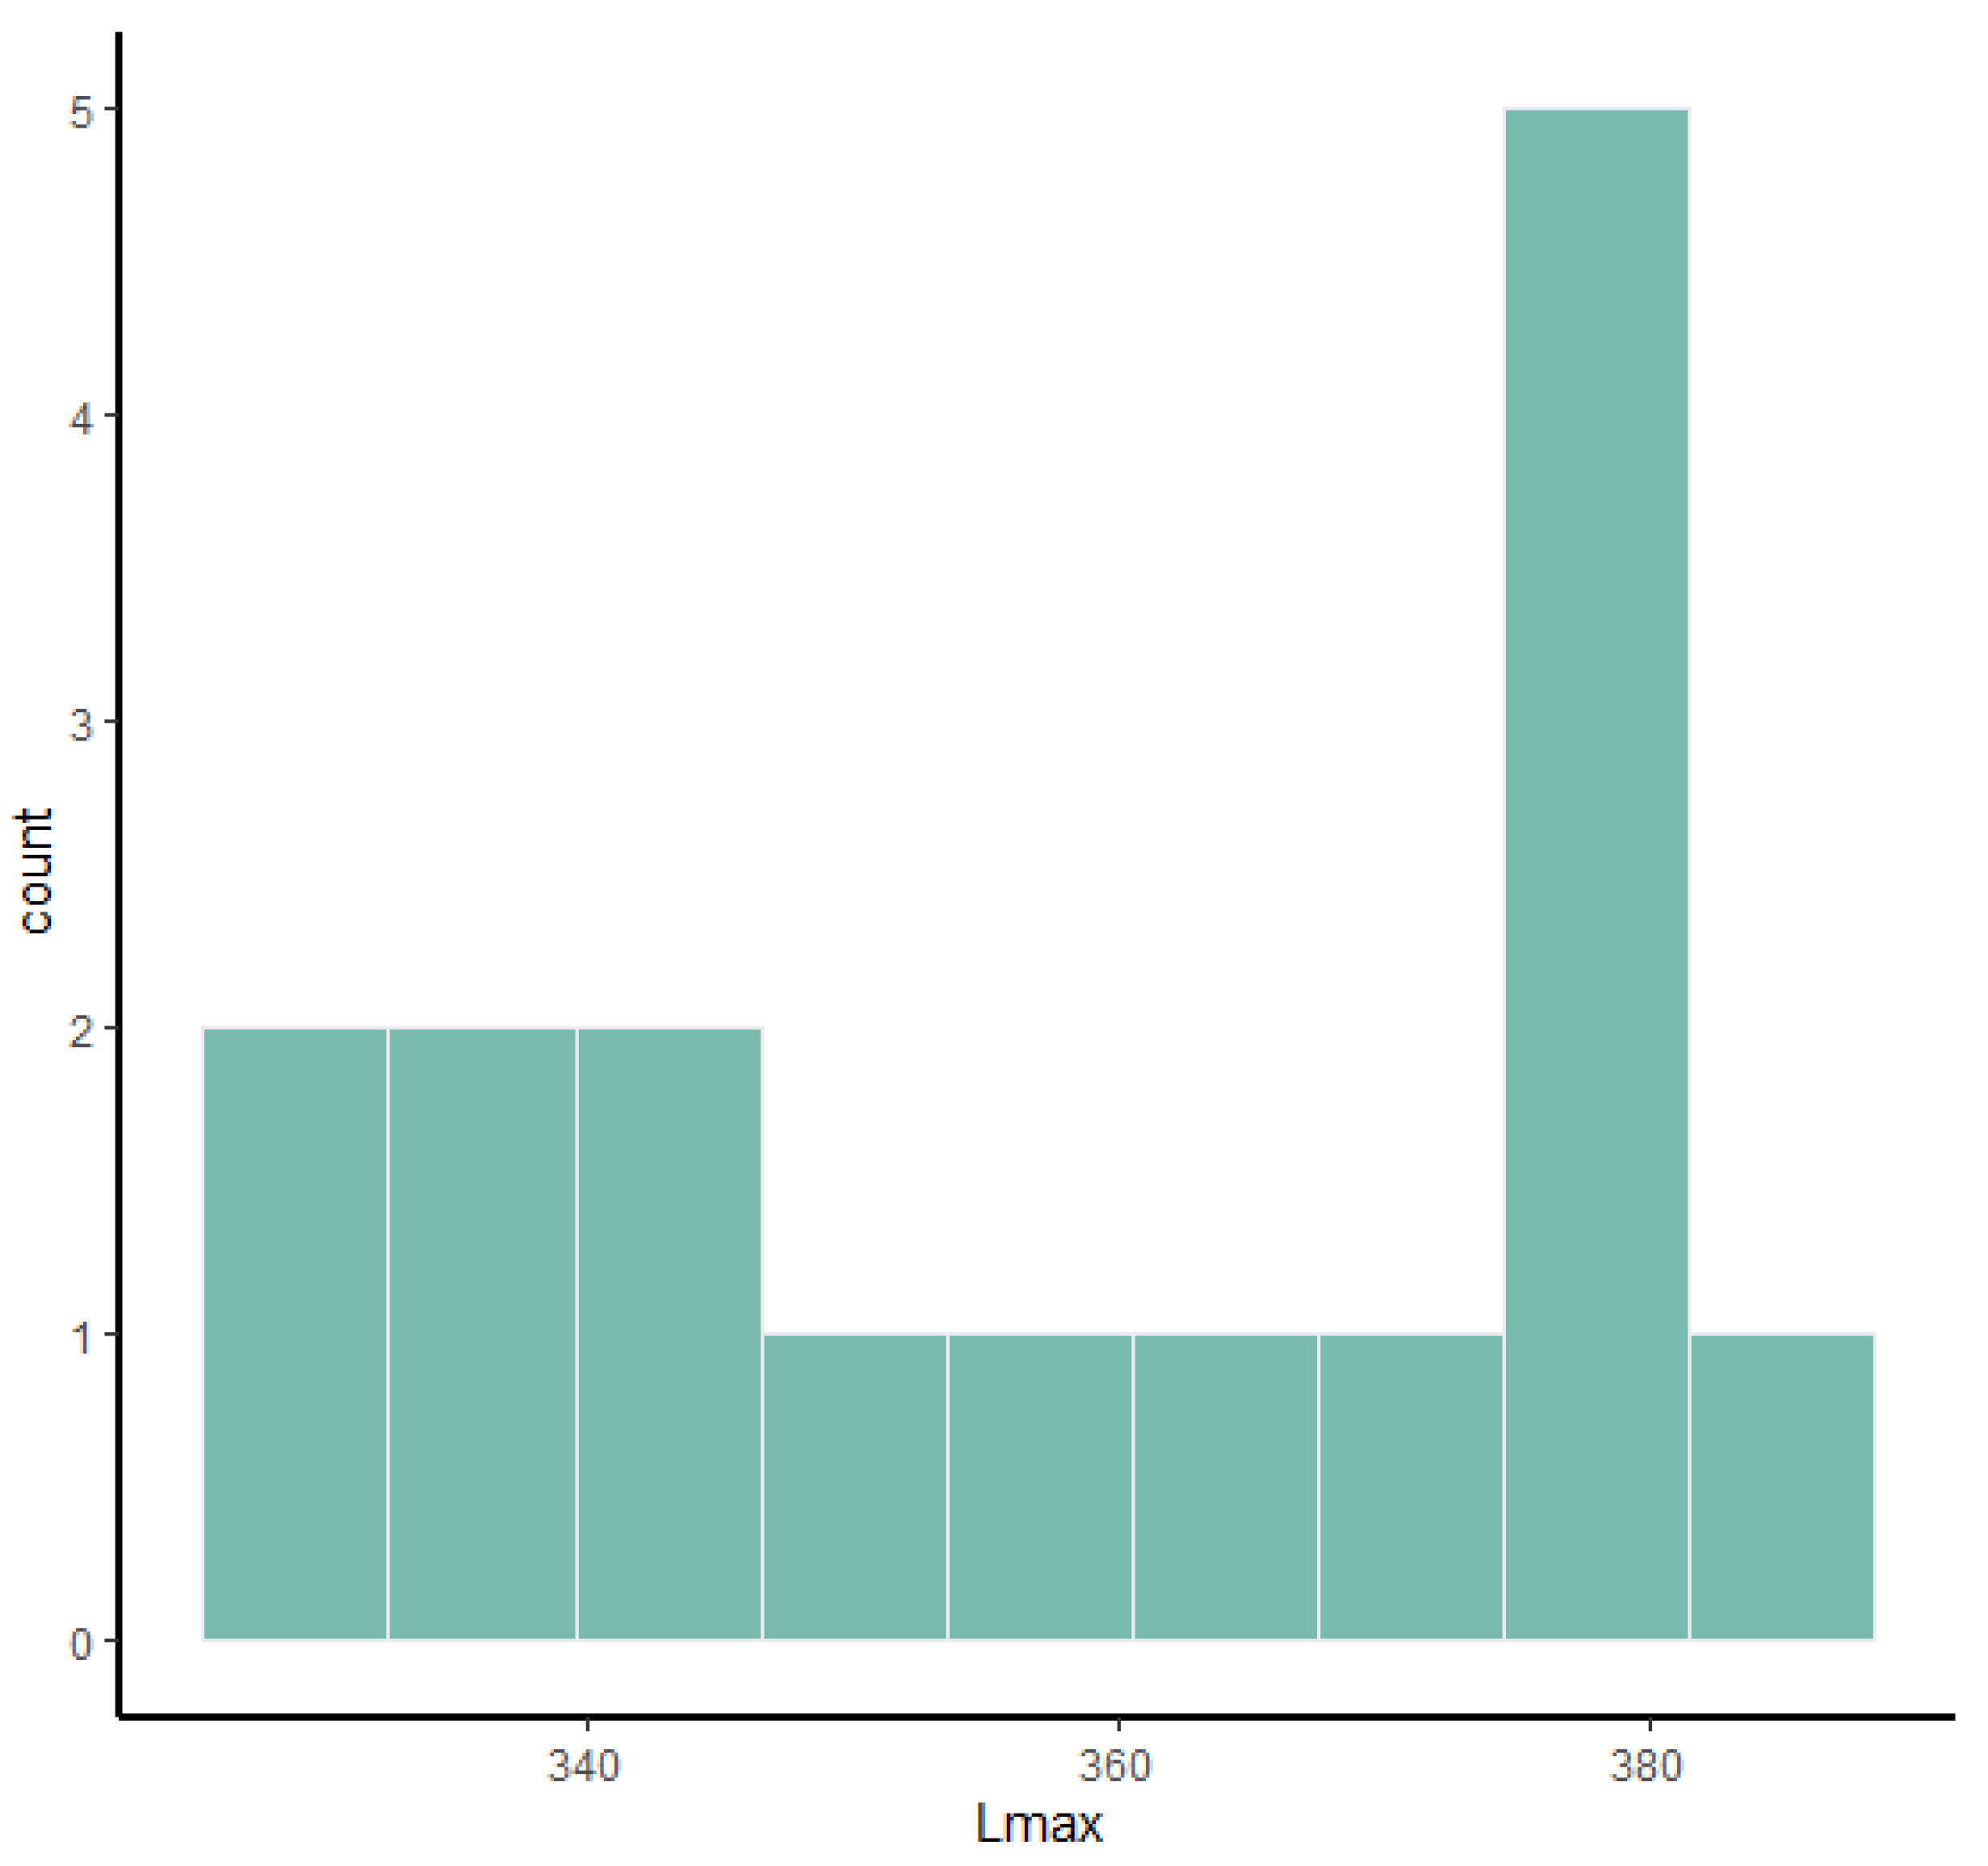
Moreover, the APDS also yields a high coefficient of variance, while the Lmax and TDS deviate significantly from normality and have relatively high (≈0.5) coefficients of bimodality. For the astragalus (
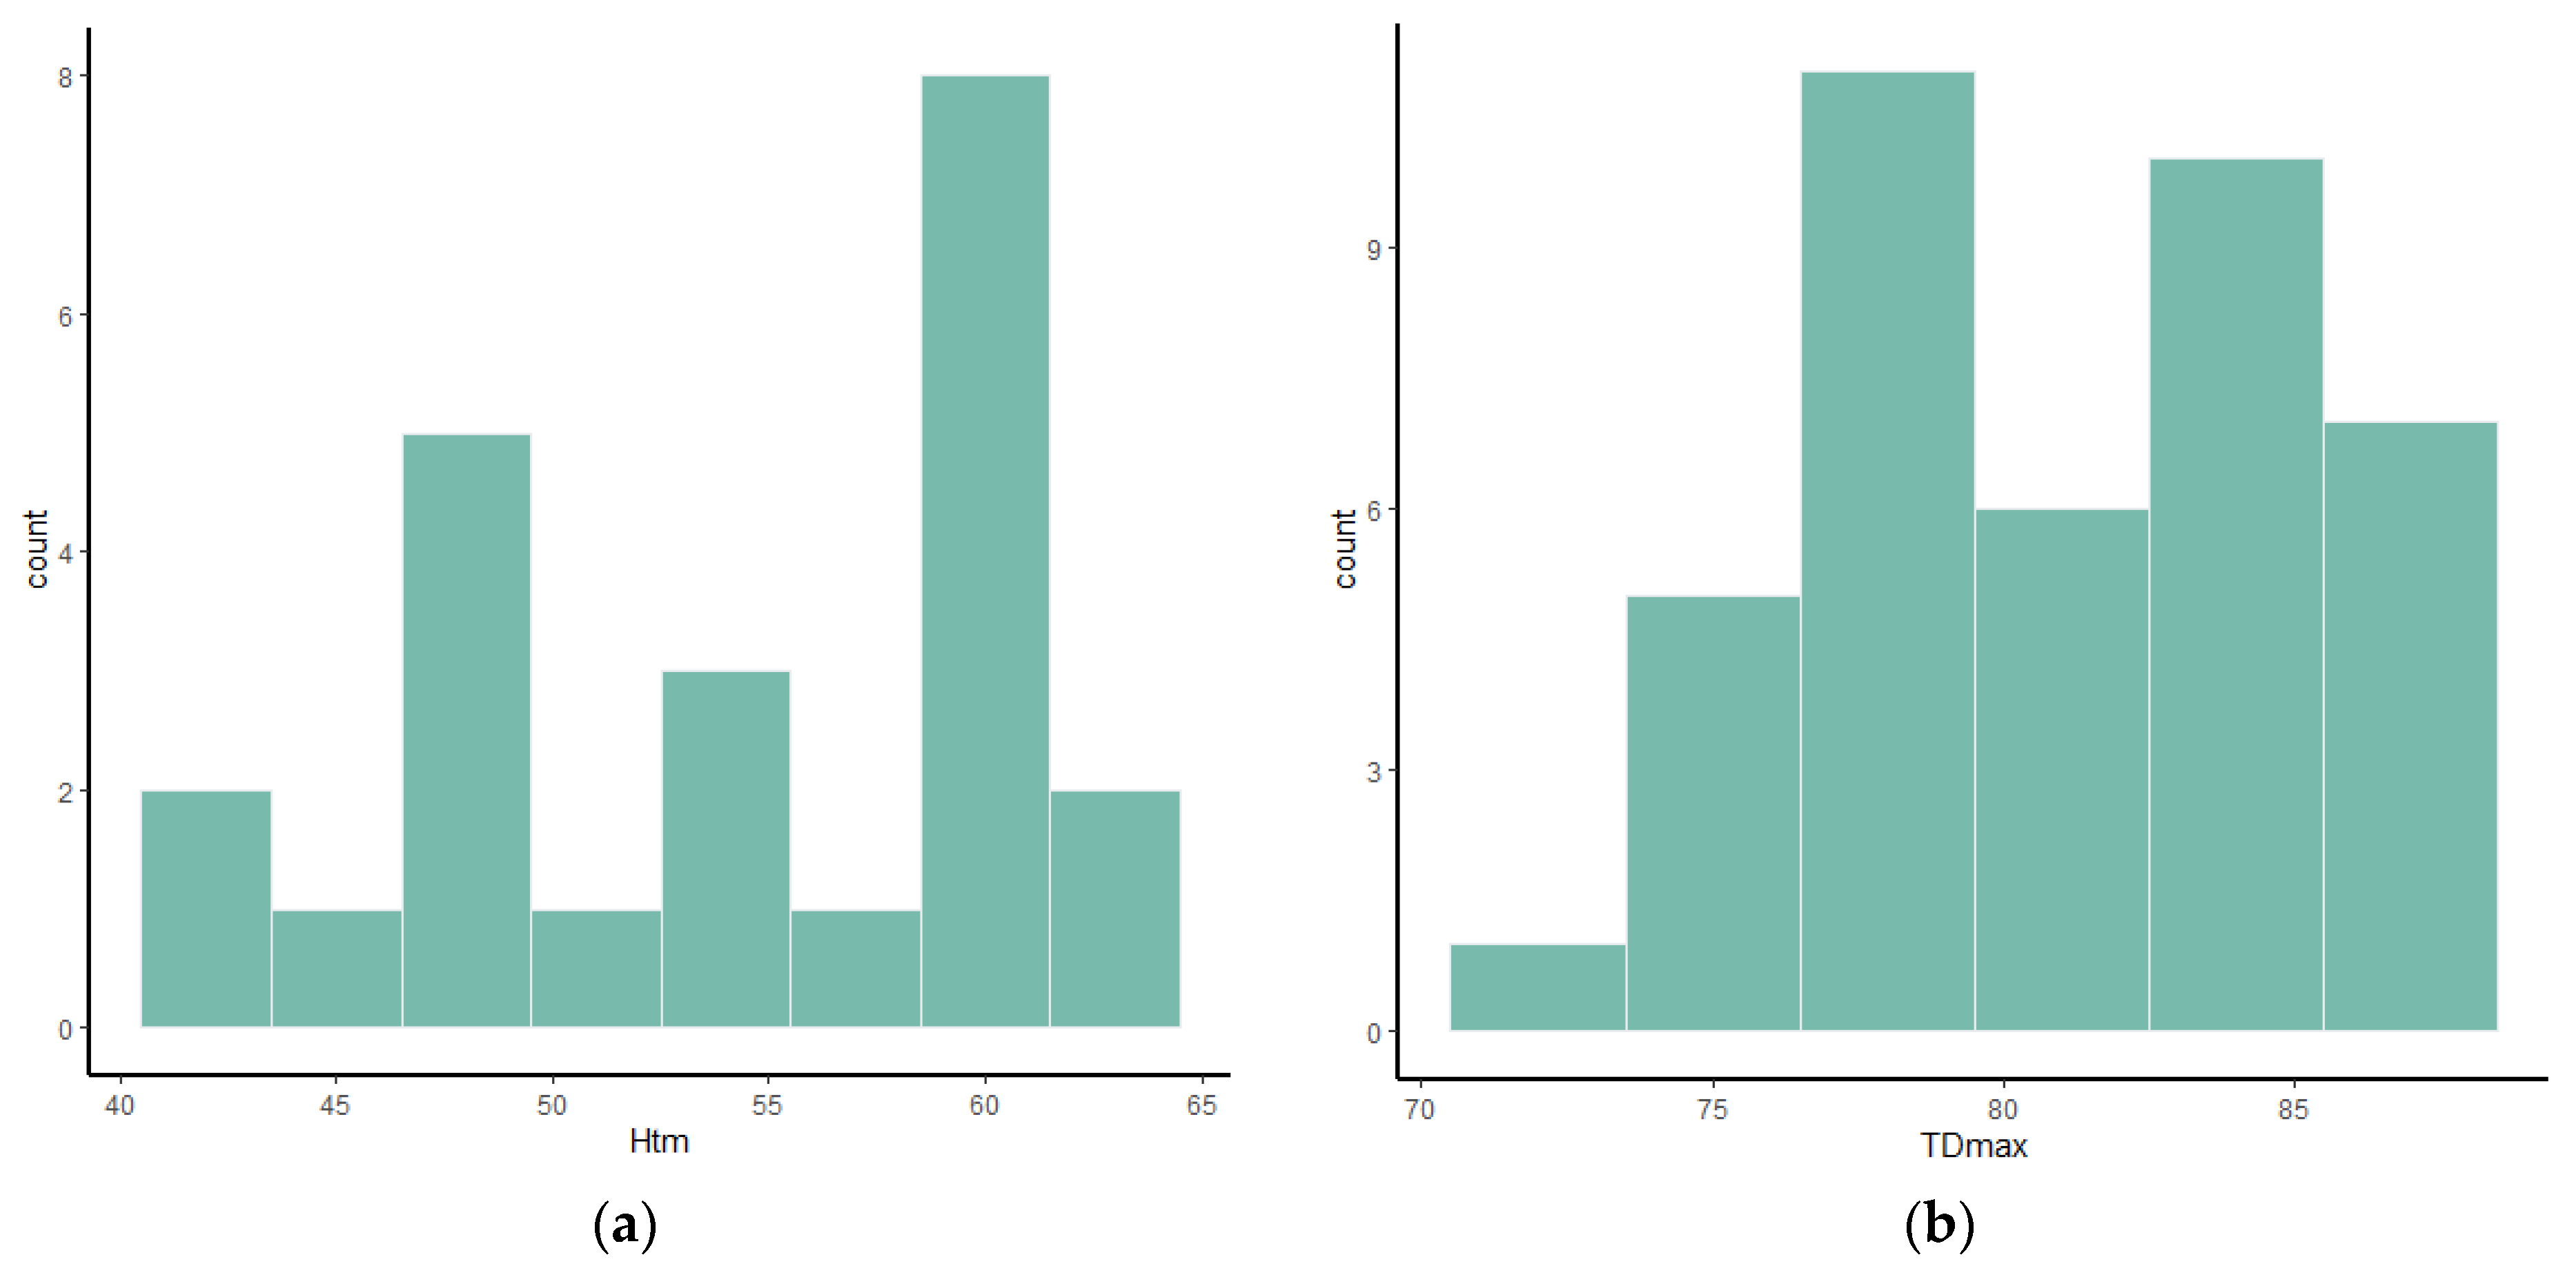
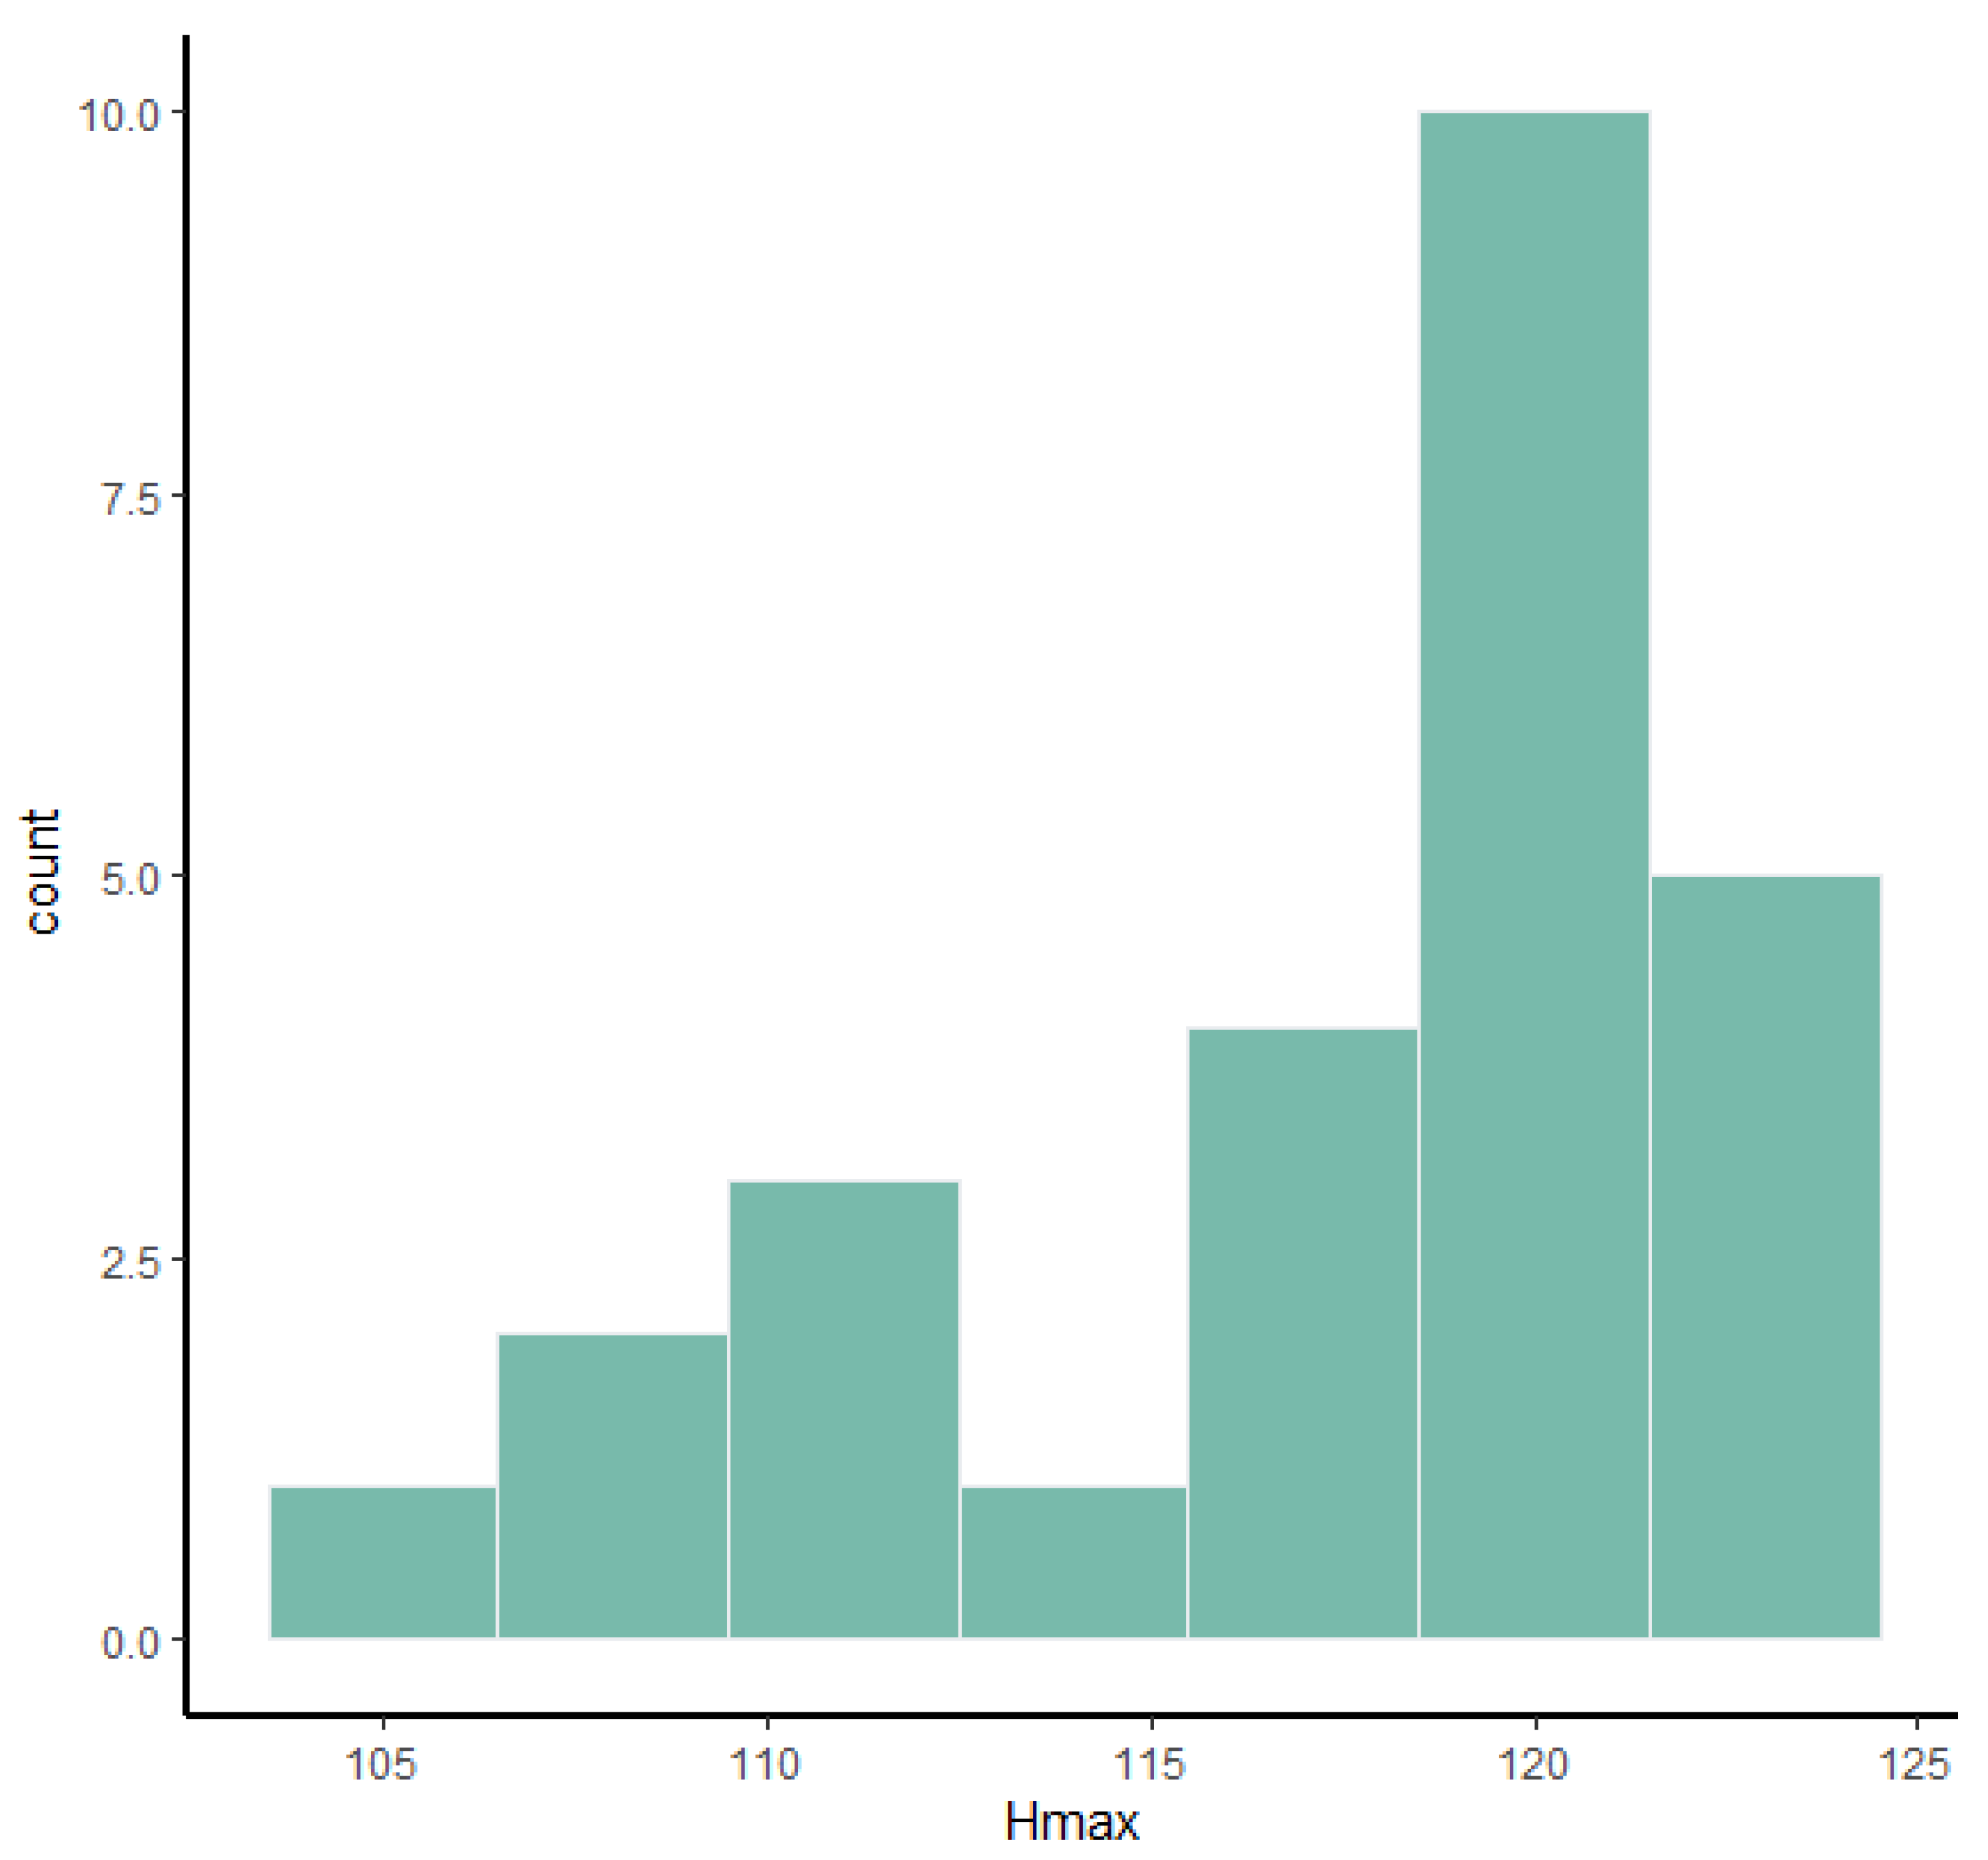
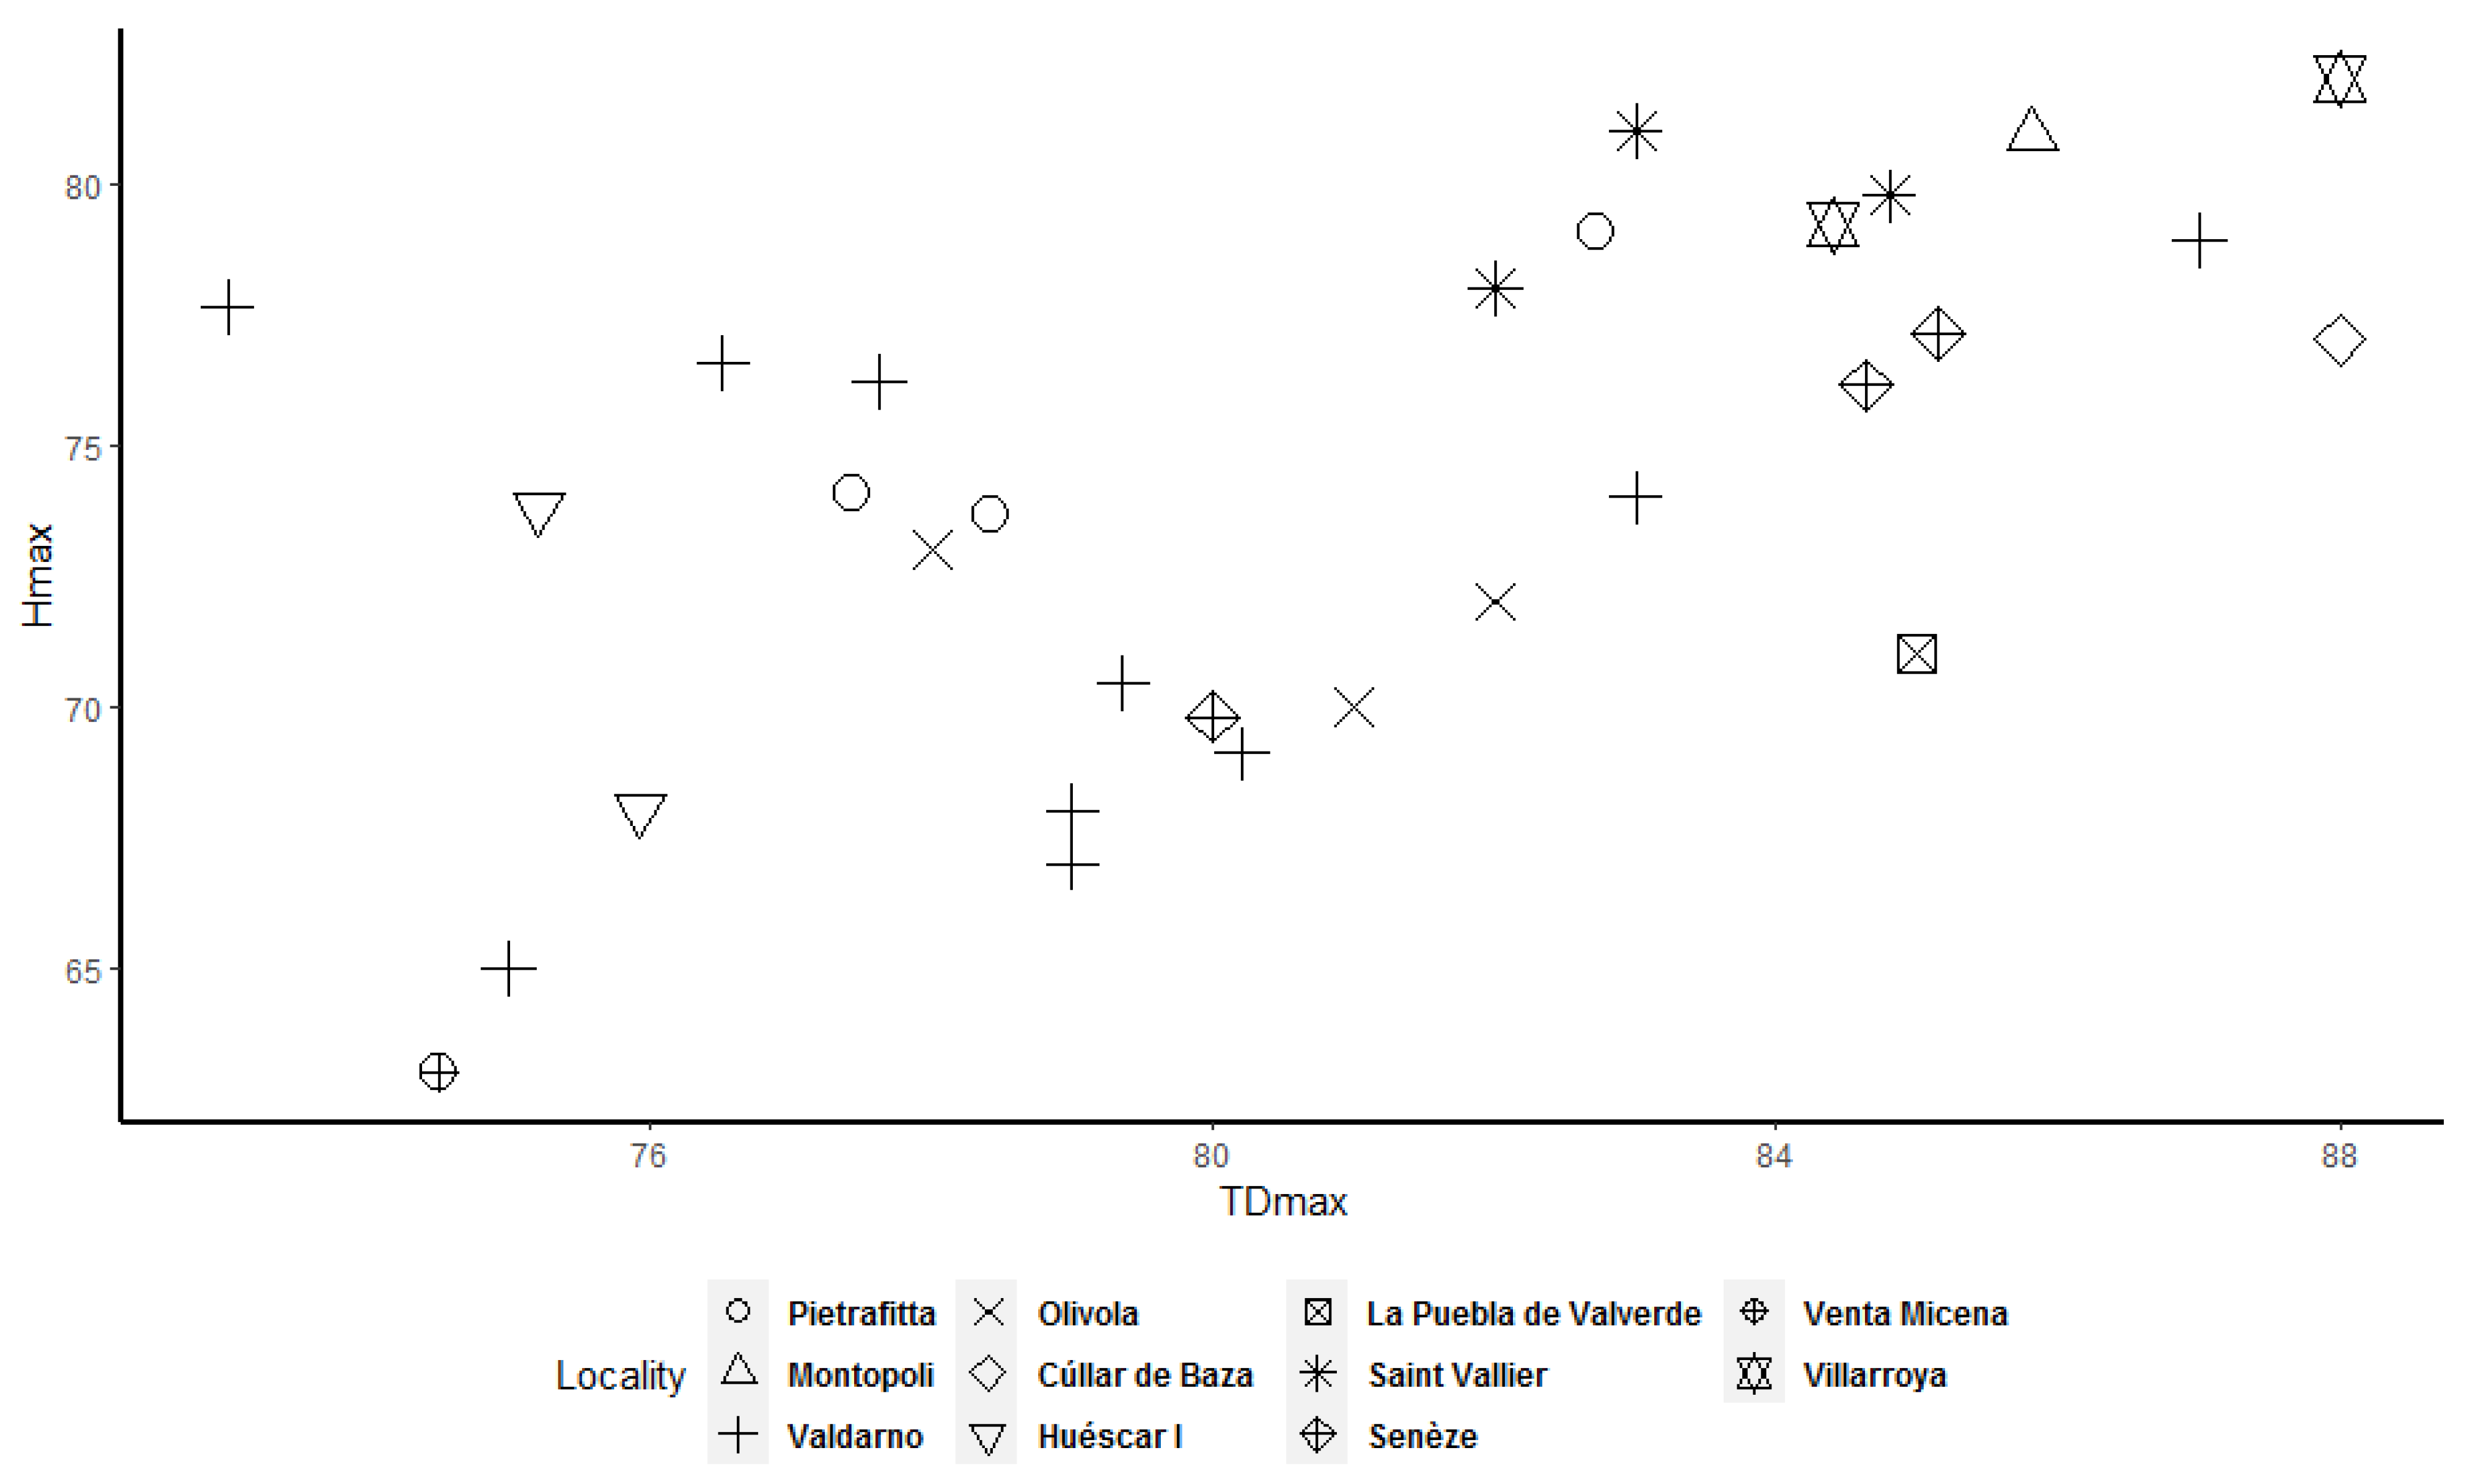
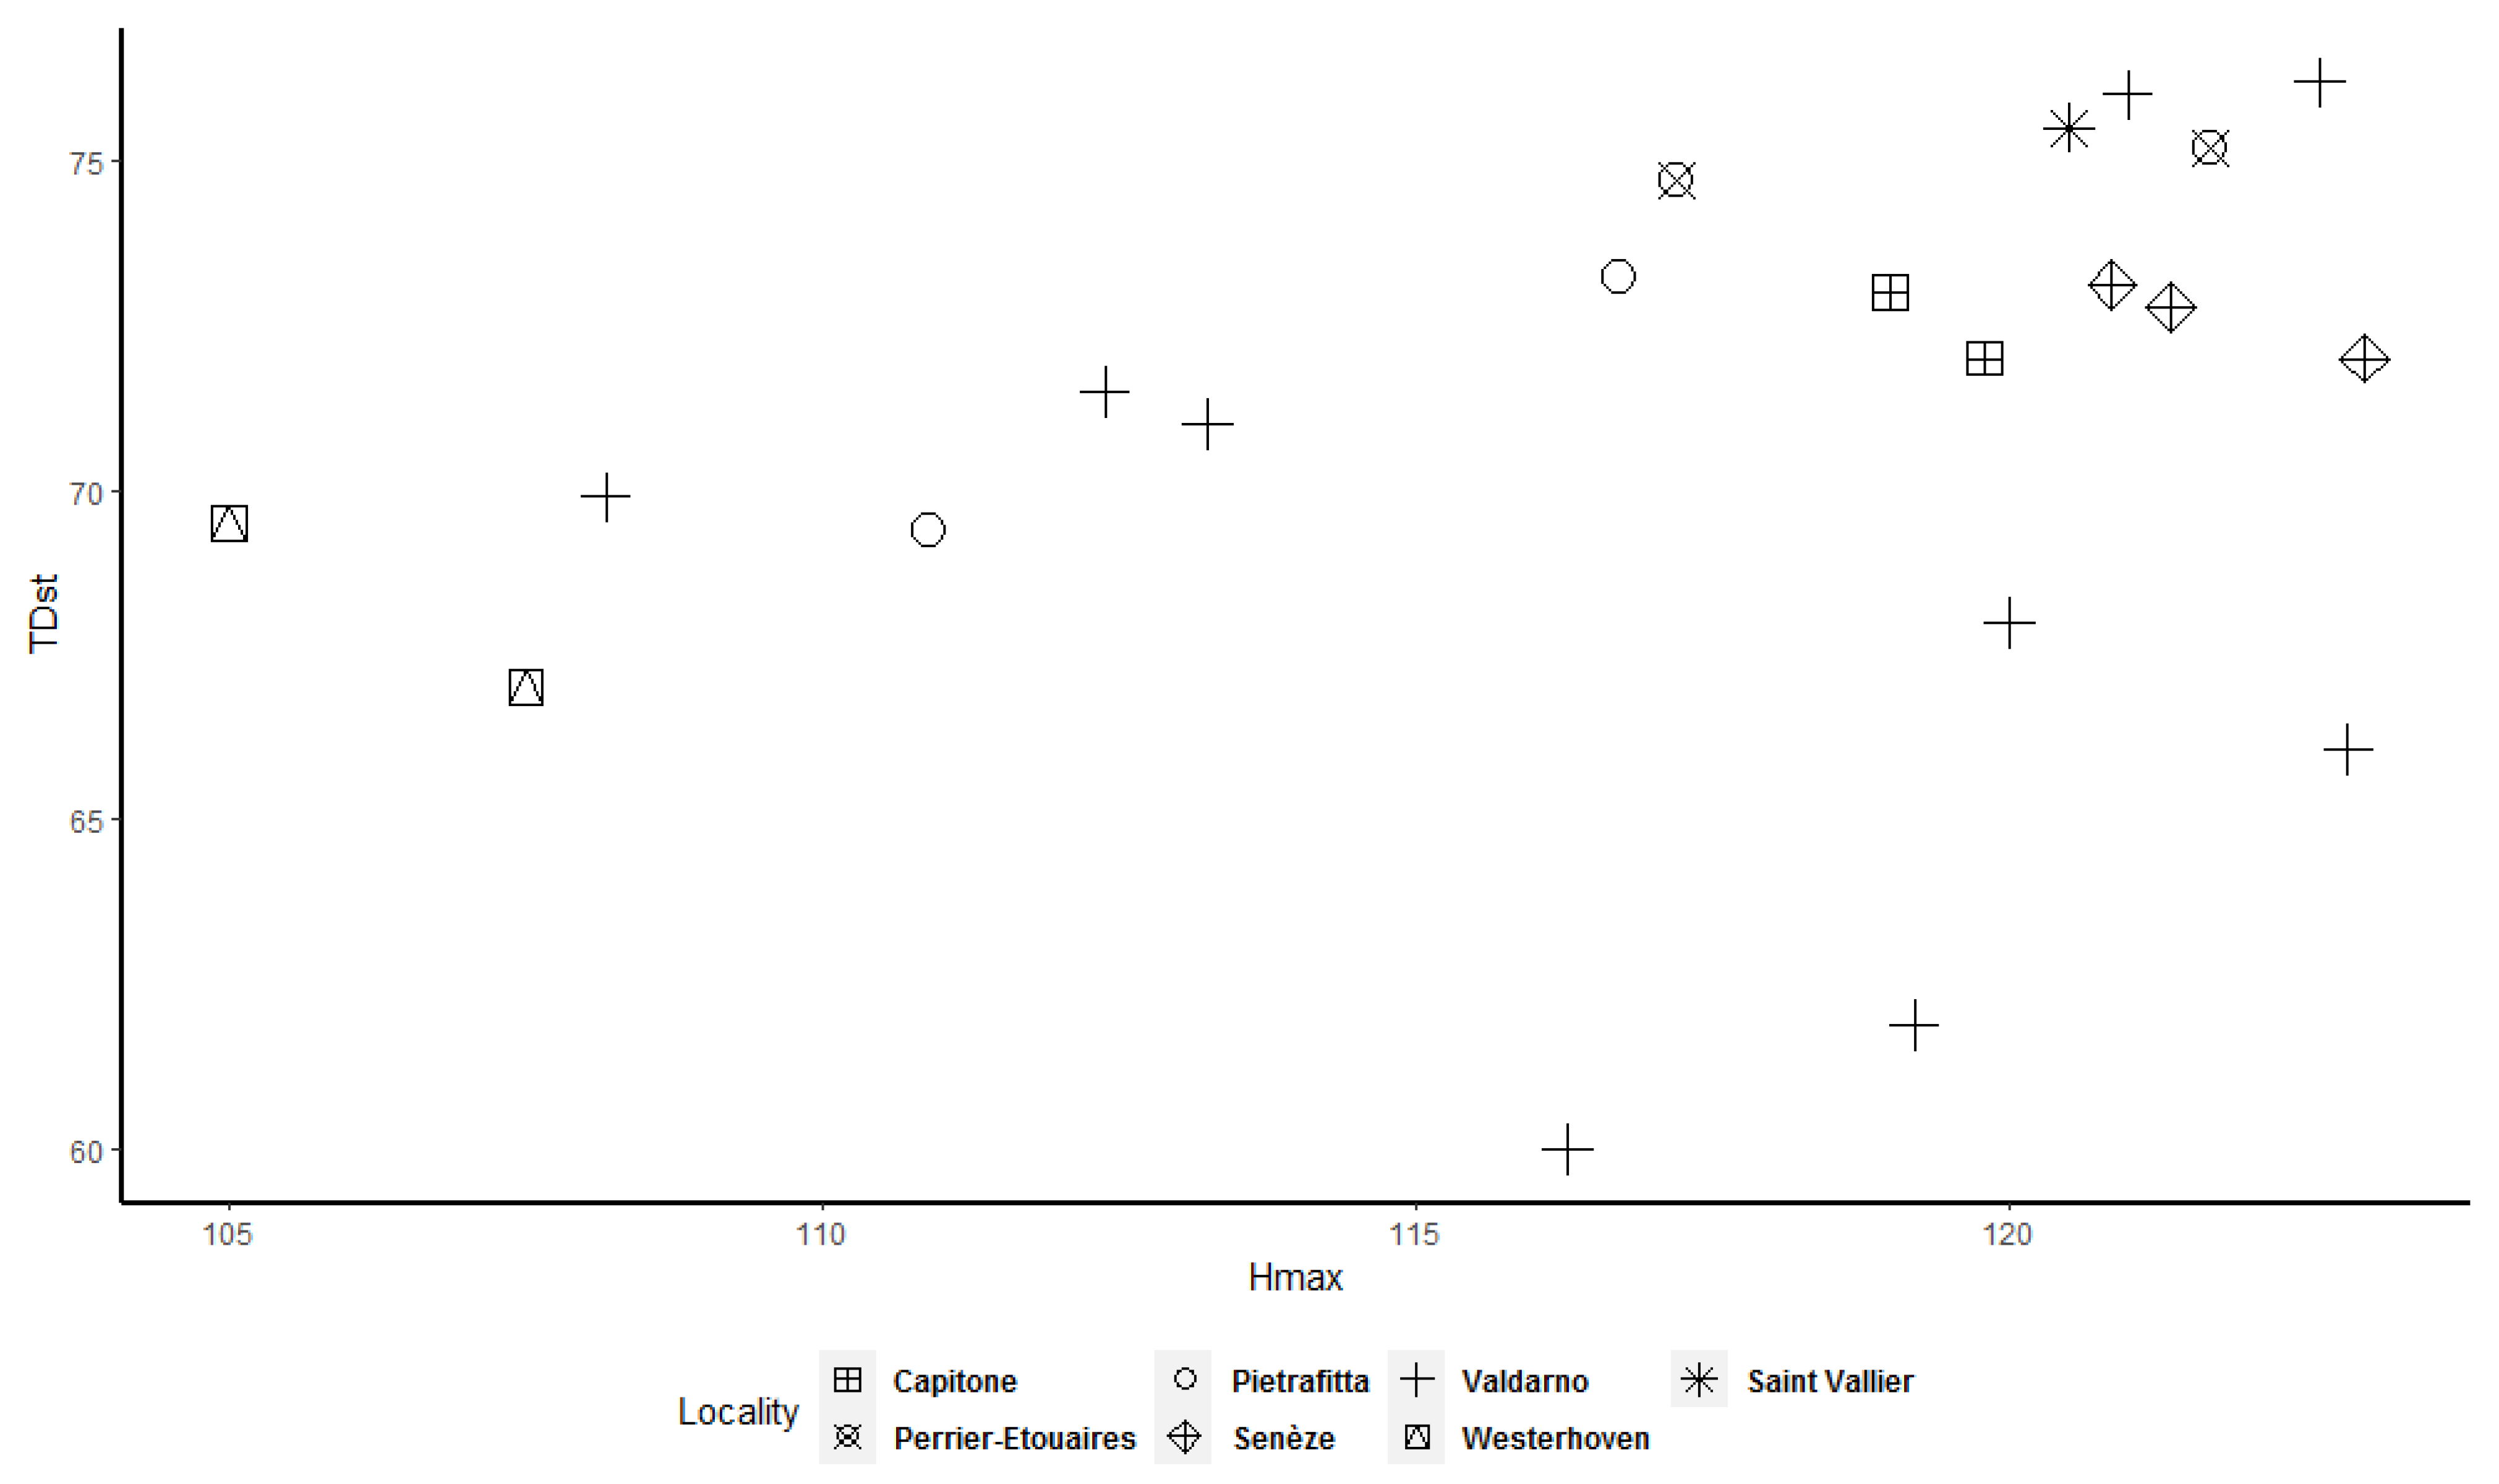
Table 3) and calcaneum (
Table 4), despite the high number of measurements, coefficients of variation are rather low and only one measurement, Hmax, yields a high coefficient of bimodality.
However, eight measurements in the astragalus and calcaneum deviate considerably from a normal distribution. This could be due to the presence of a weak signal of dimorphism, supported also by a relatively high (≈0.5) coefficient of bimodality, or to the presence of some outliers in the dataset. In the third metatarsals (
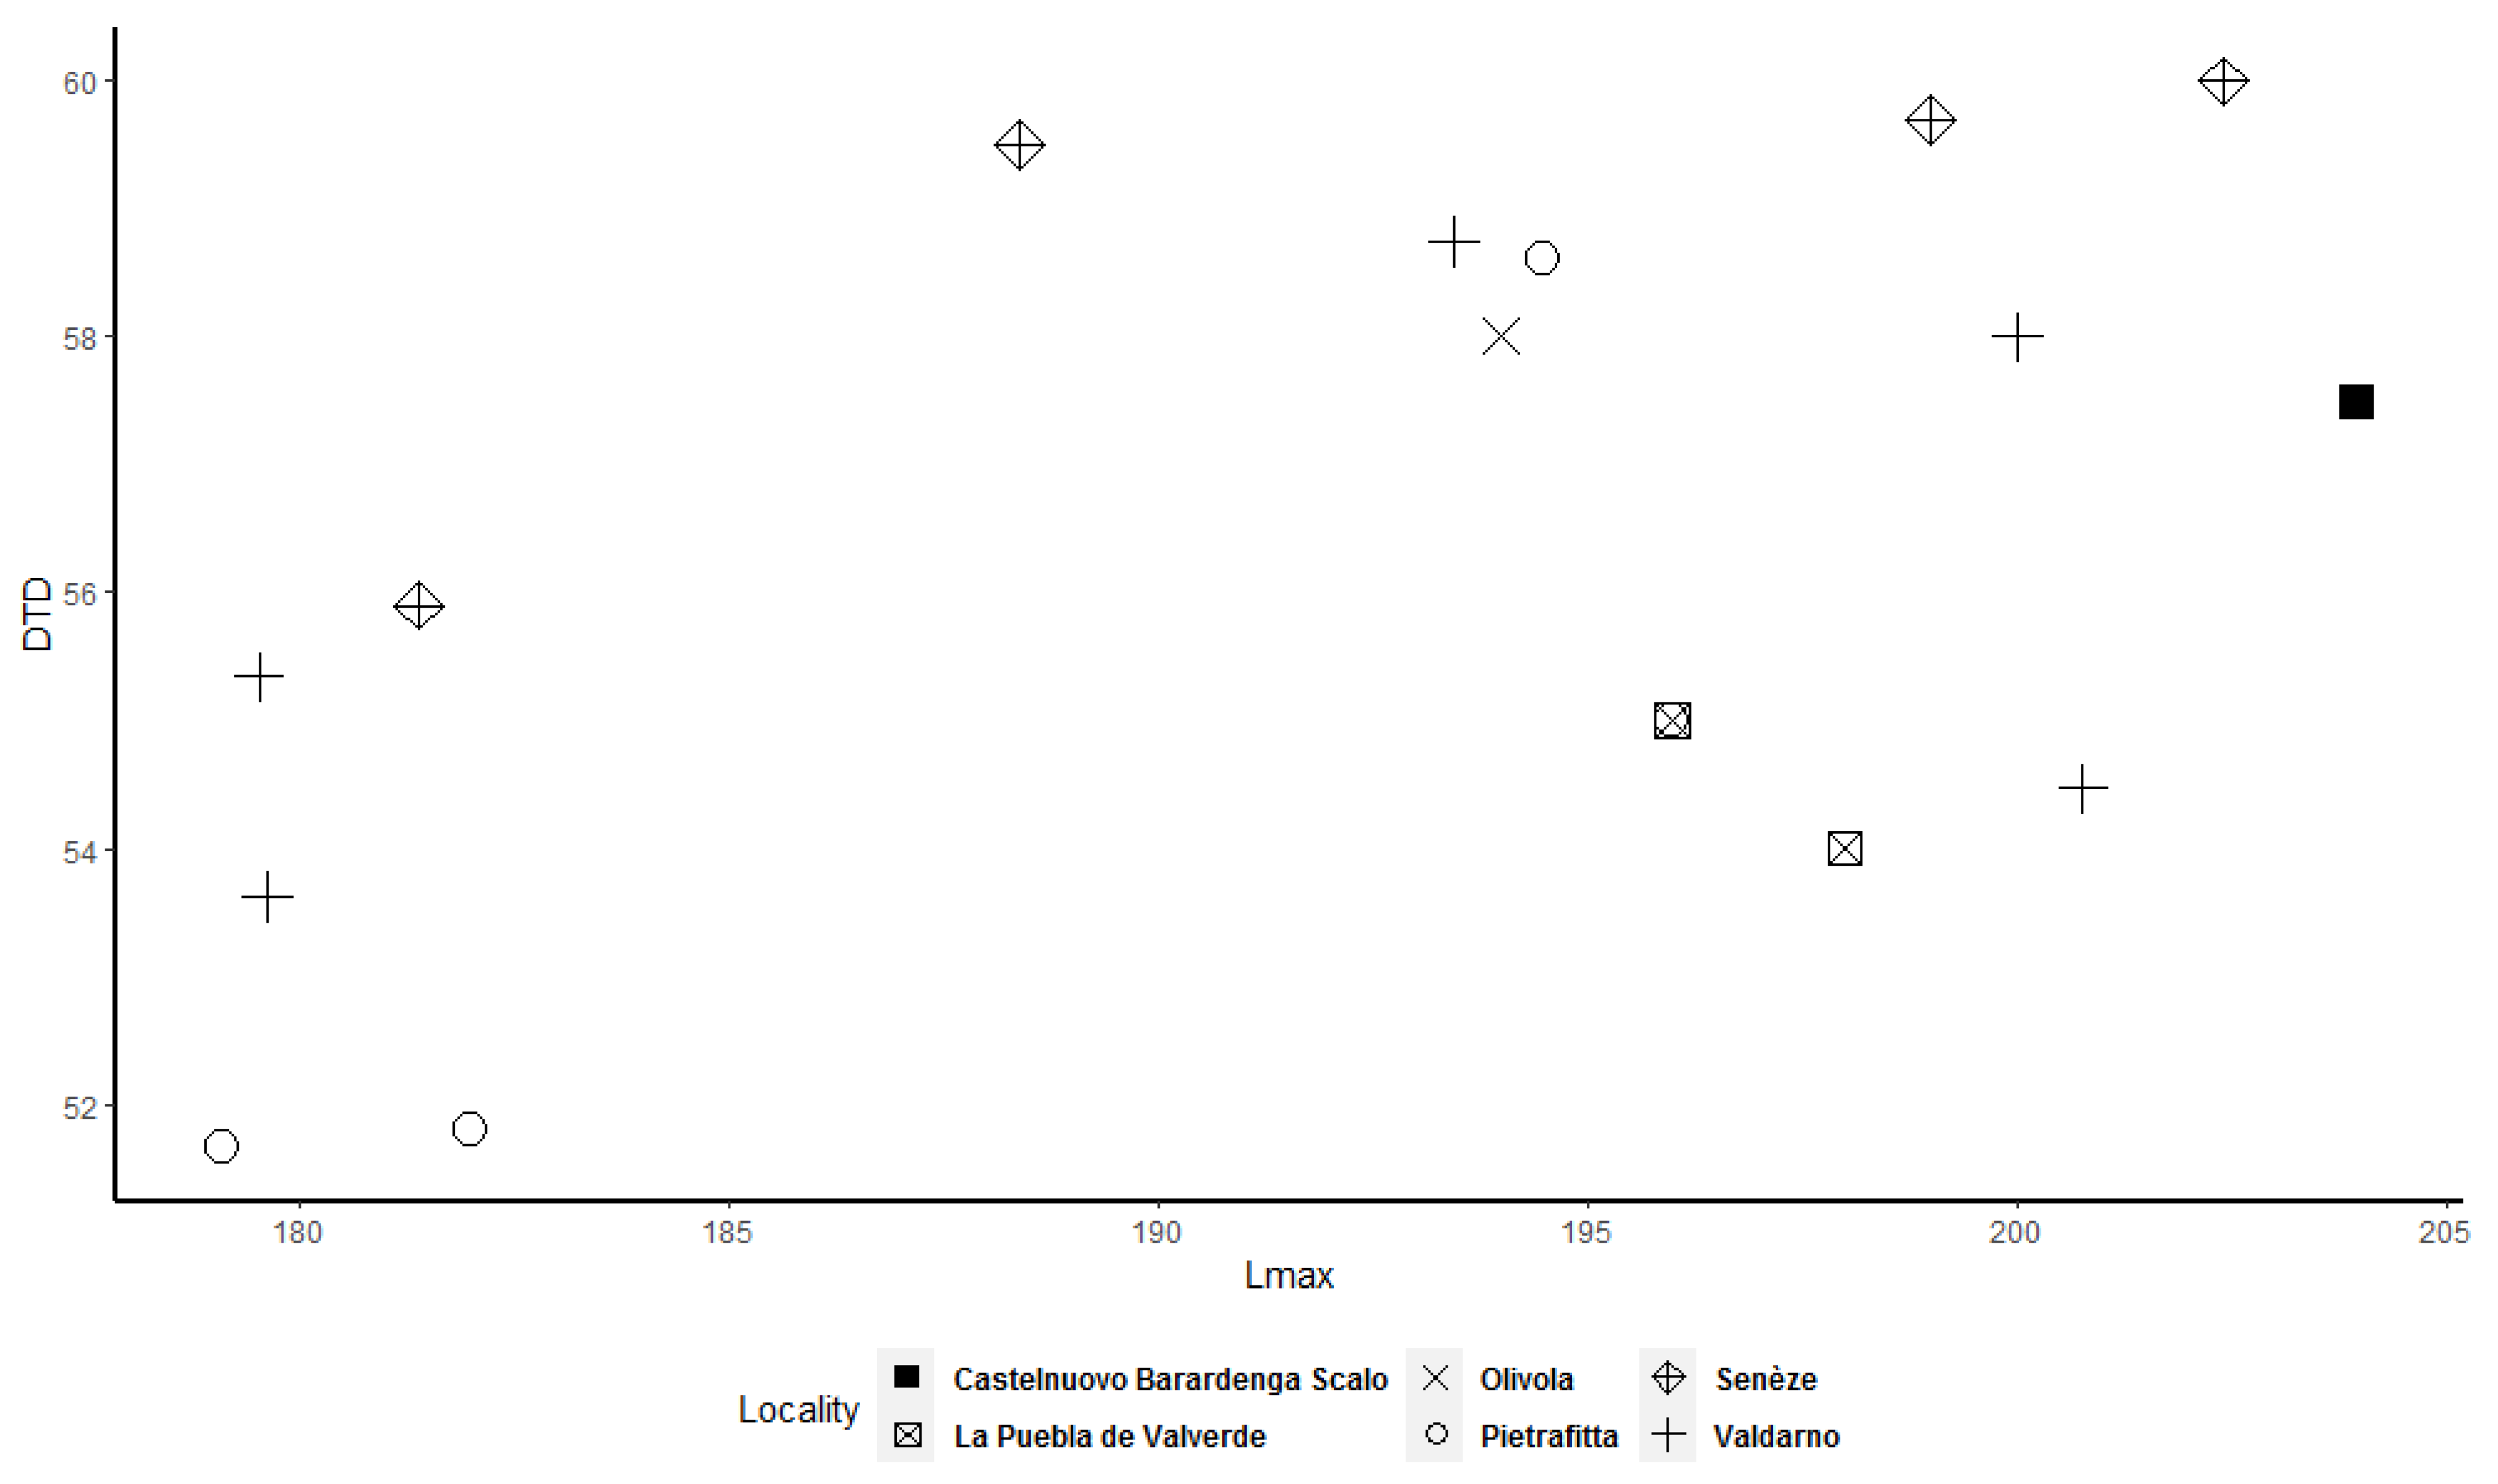
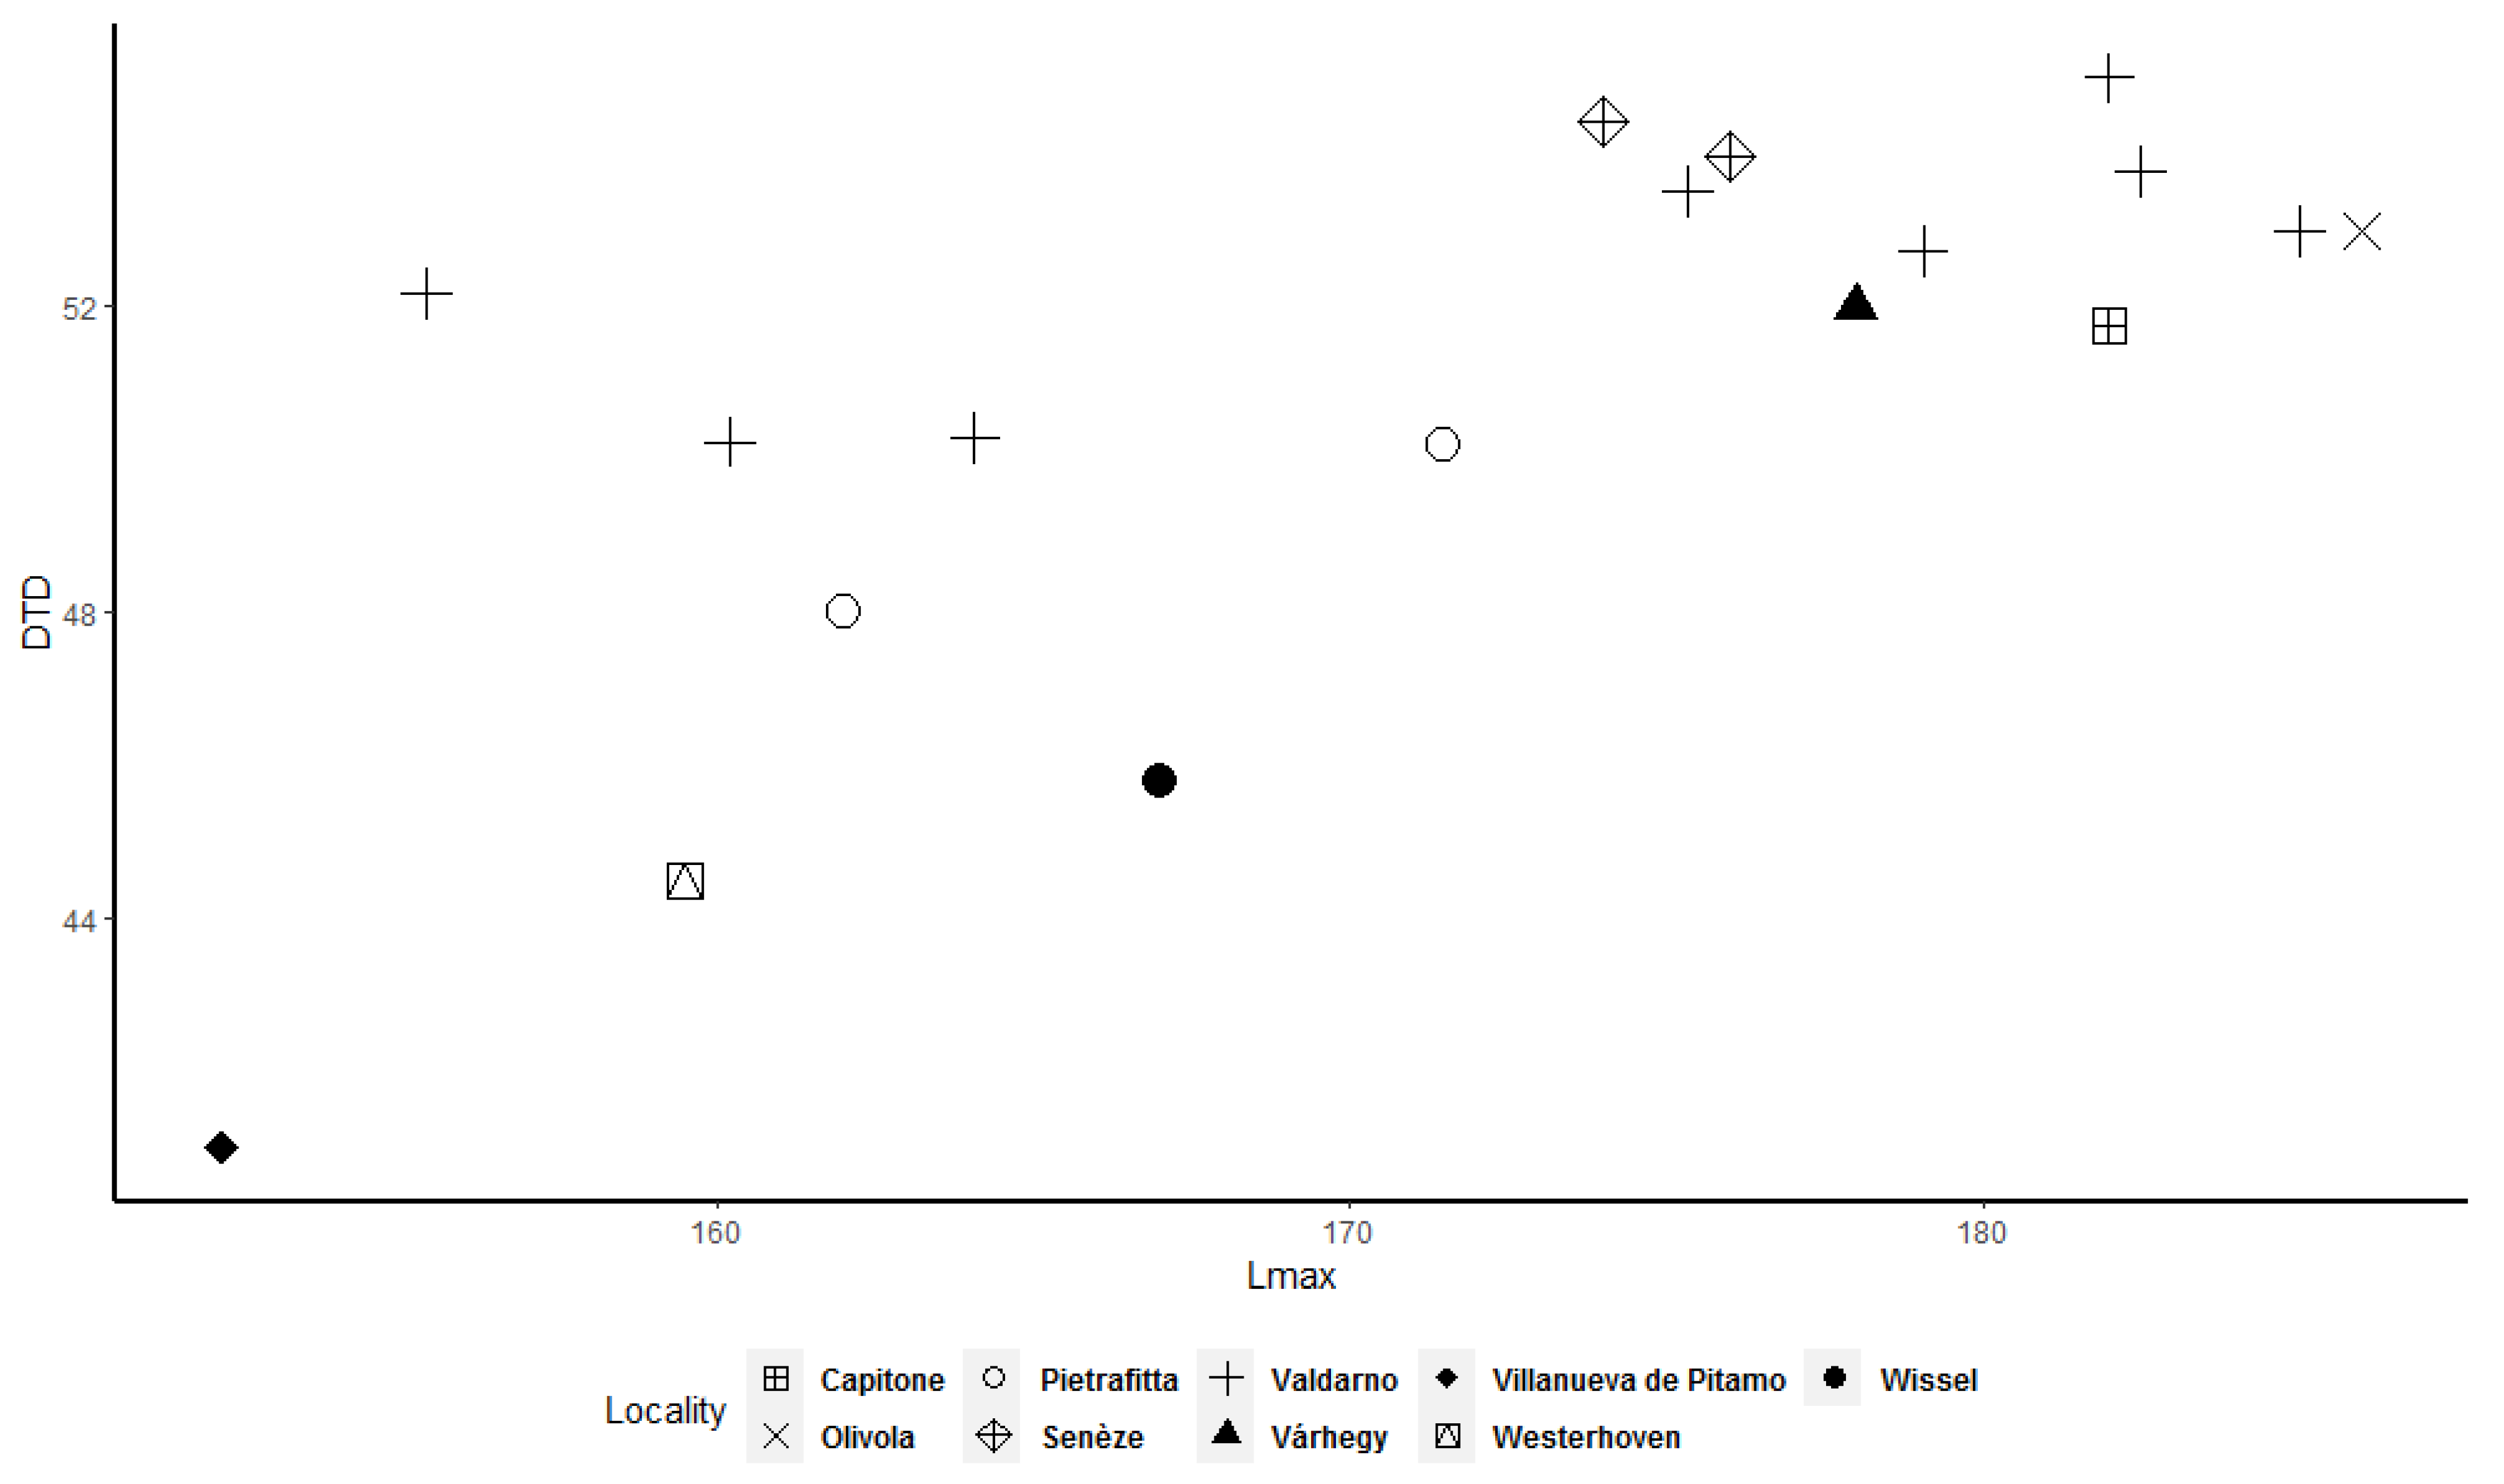
Table 5) the DTD passes all three tests, while the APDs of proximal and distal epiphyses have a high coefficient of variation; other measurements such as APDS and Lmax have a coefficient of variation close to 10 and, just for Lmax, a relatively high coefficient of bimodality, possibly indicating a faint signal of bimodality. In the third metacarpal (
Table 6), only the Lmax and the PTD deviate significantly from the normal distribution, with Lmax having a relatively high coefficient of bimodality.
Frequency histograms and bivariate plots of postcranial dimensions are shown in
Figure 1,
Figure 2,
Figure 3,
Figure 4,
Figure 5,
Figure 6,
Figure 7,
Figure 8,
Figure 9,
Figure 10,
Figure 11 and
Figure 12. Using these two types of visual representation, it is easier to observe the bimodal distribution in the dataset. Due to the small number of complete specimens, the values collected from the radius are too scattered to be grouped in two clusters (
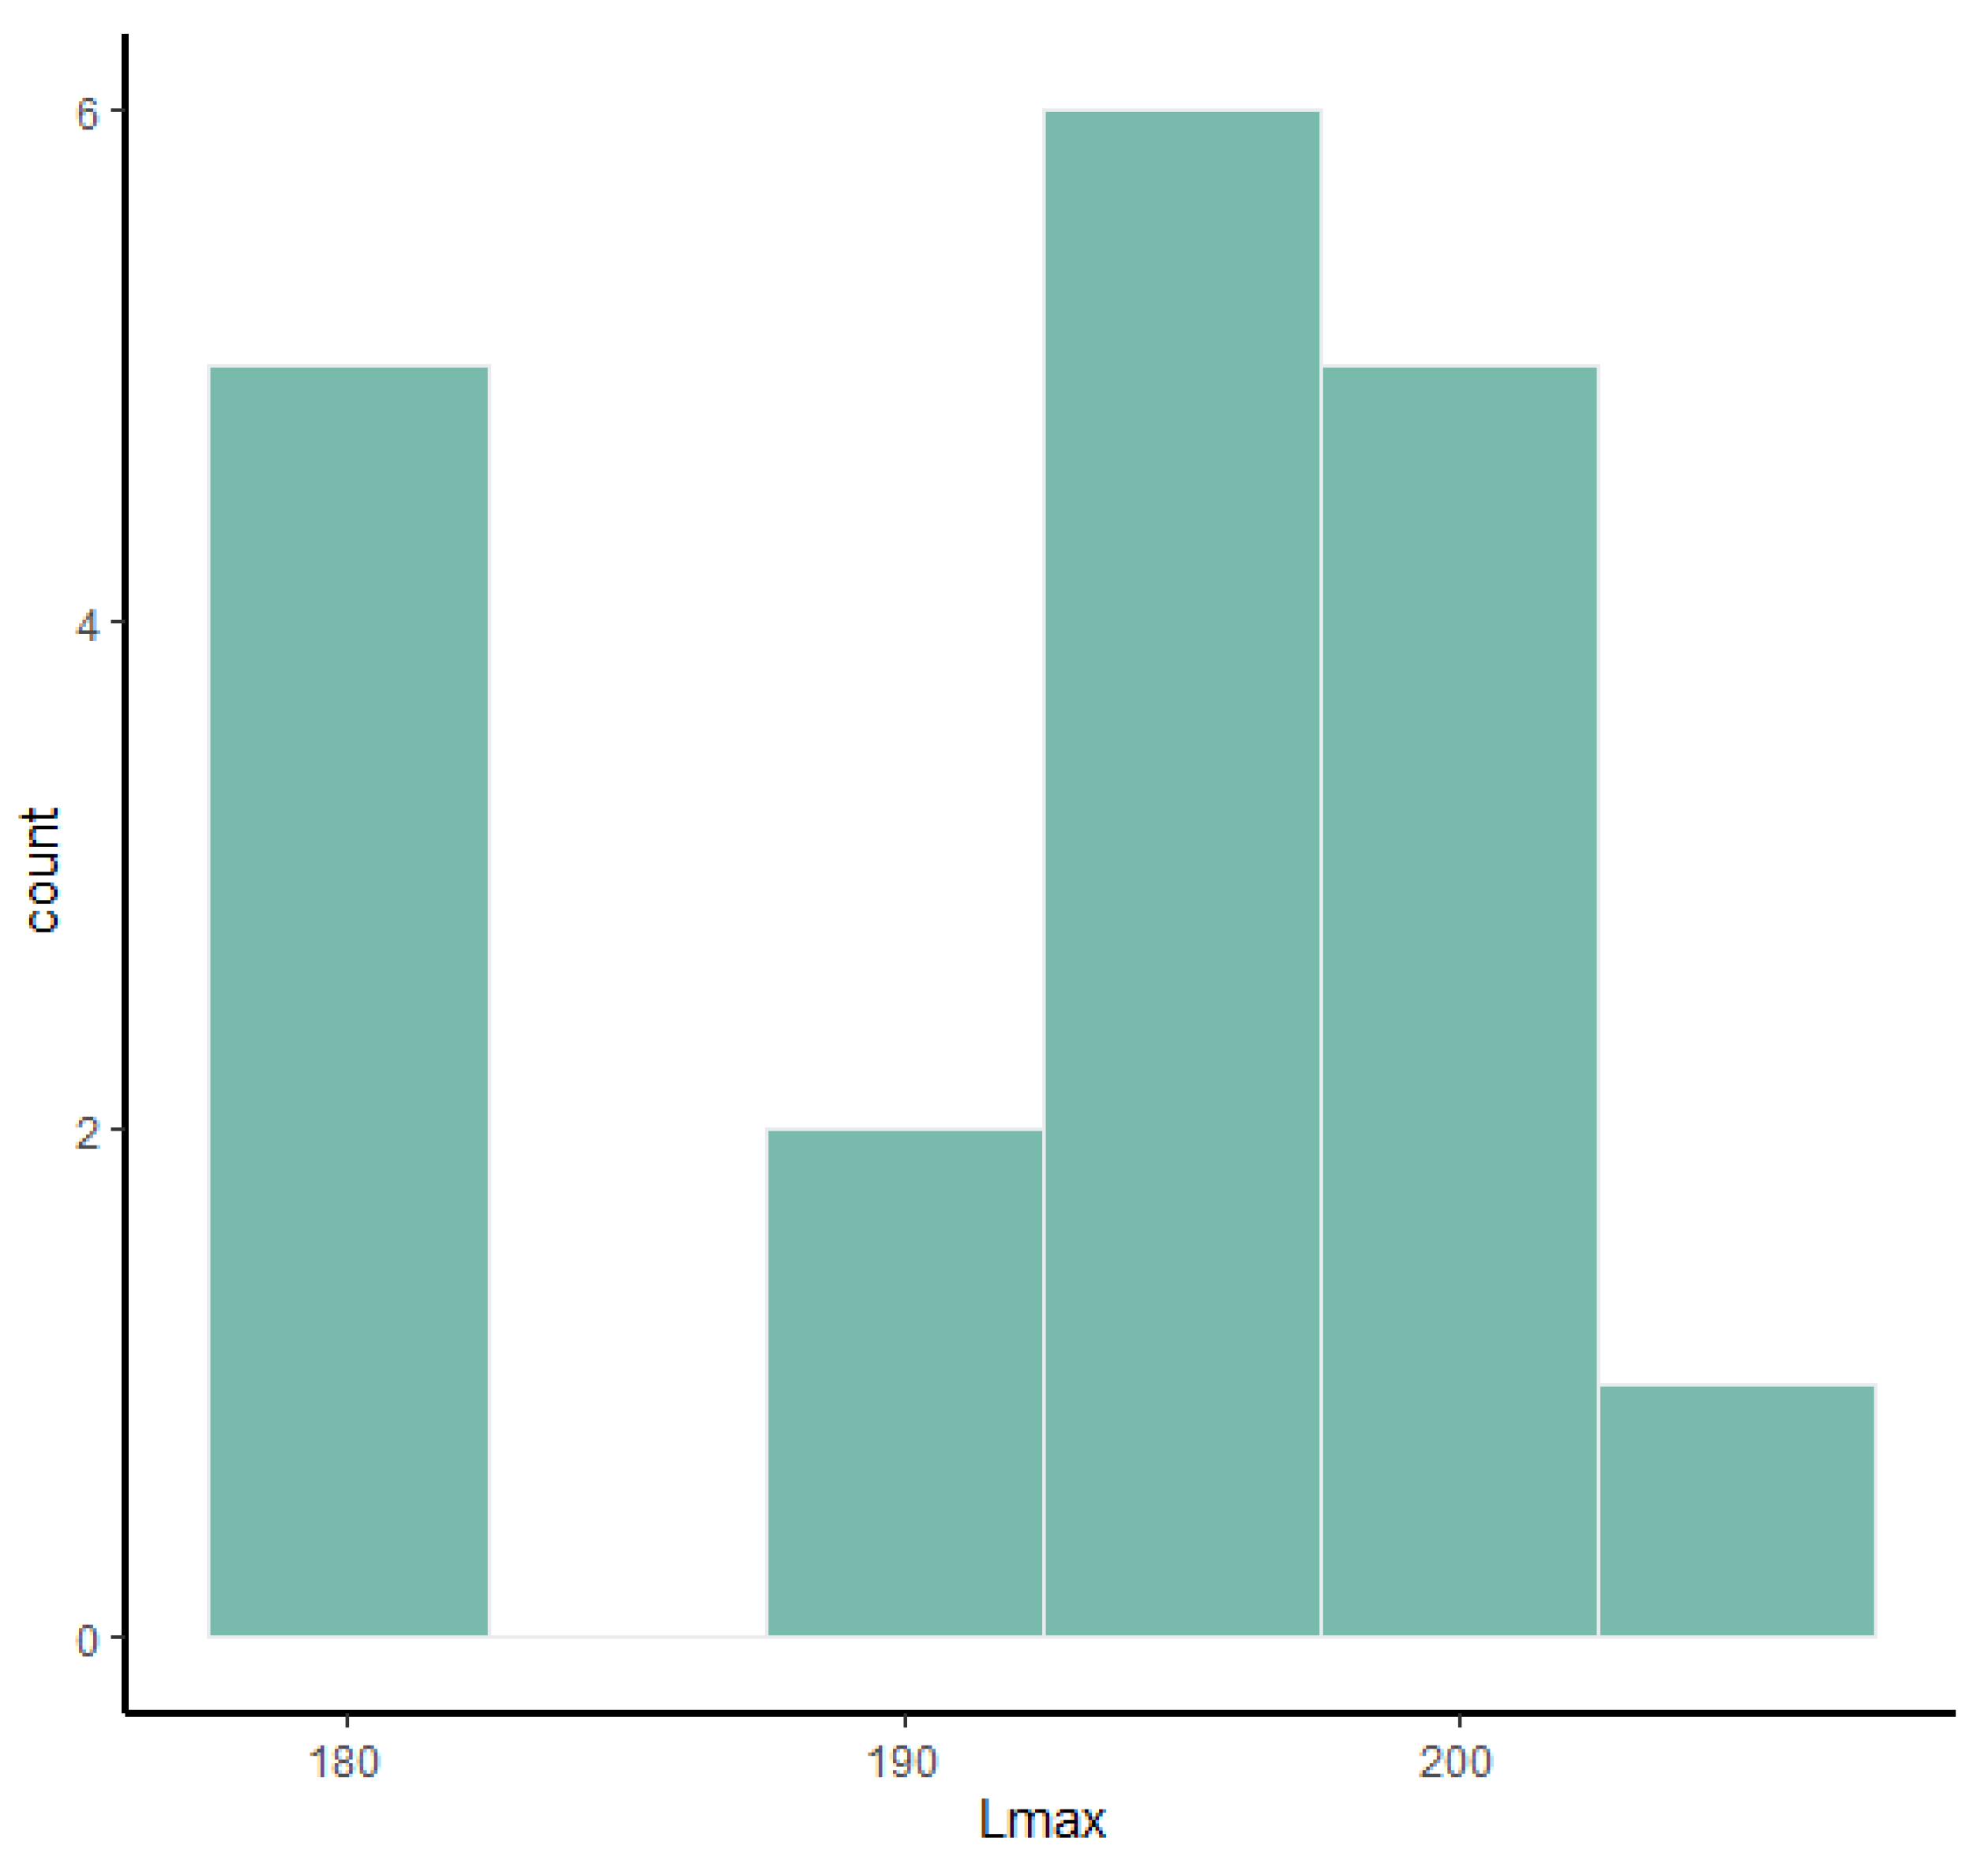
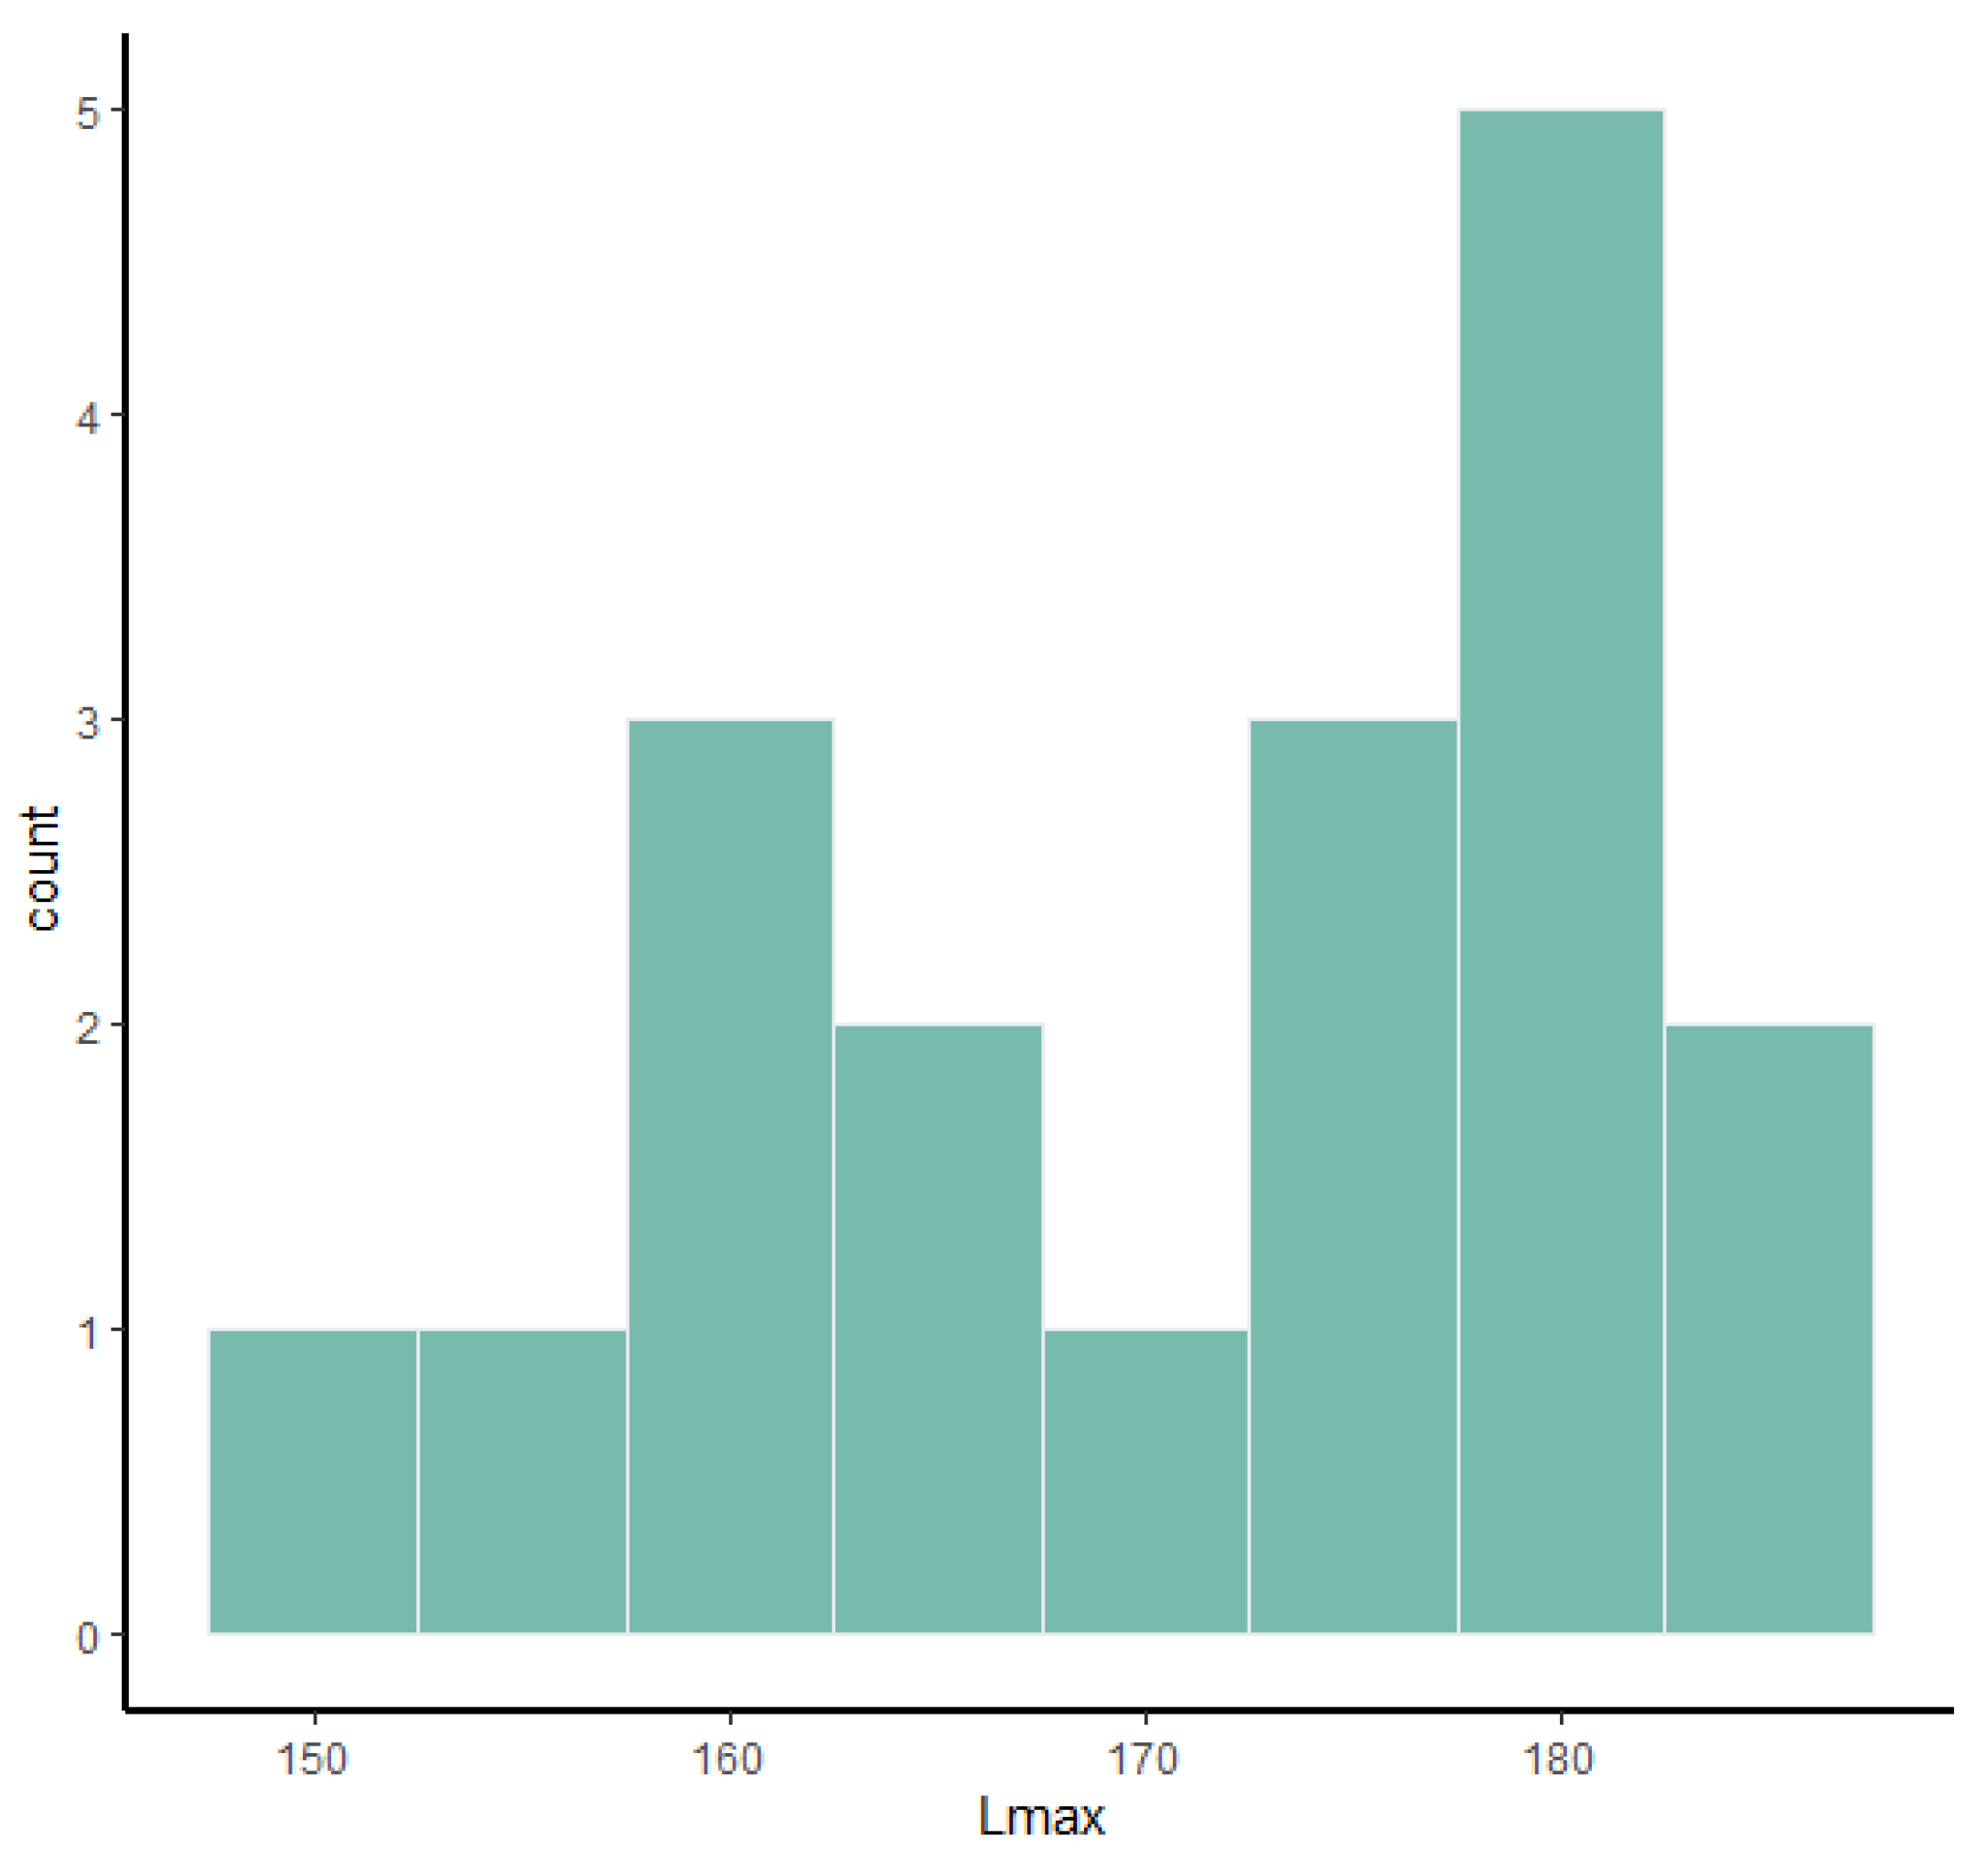
Figure 7). Histograms of tibia’s Lmax, calcaneum’s Hmax and metapodials’ Lmax (
Figure 2,
Figure 4,
Figure 5 and
Figure 6) show that there are two different values around which the measurements are distributed, while the histogram on astragalus (
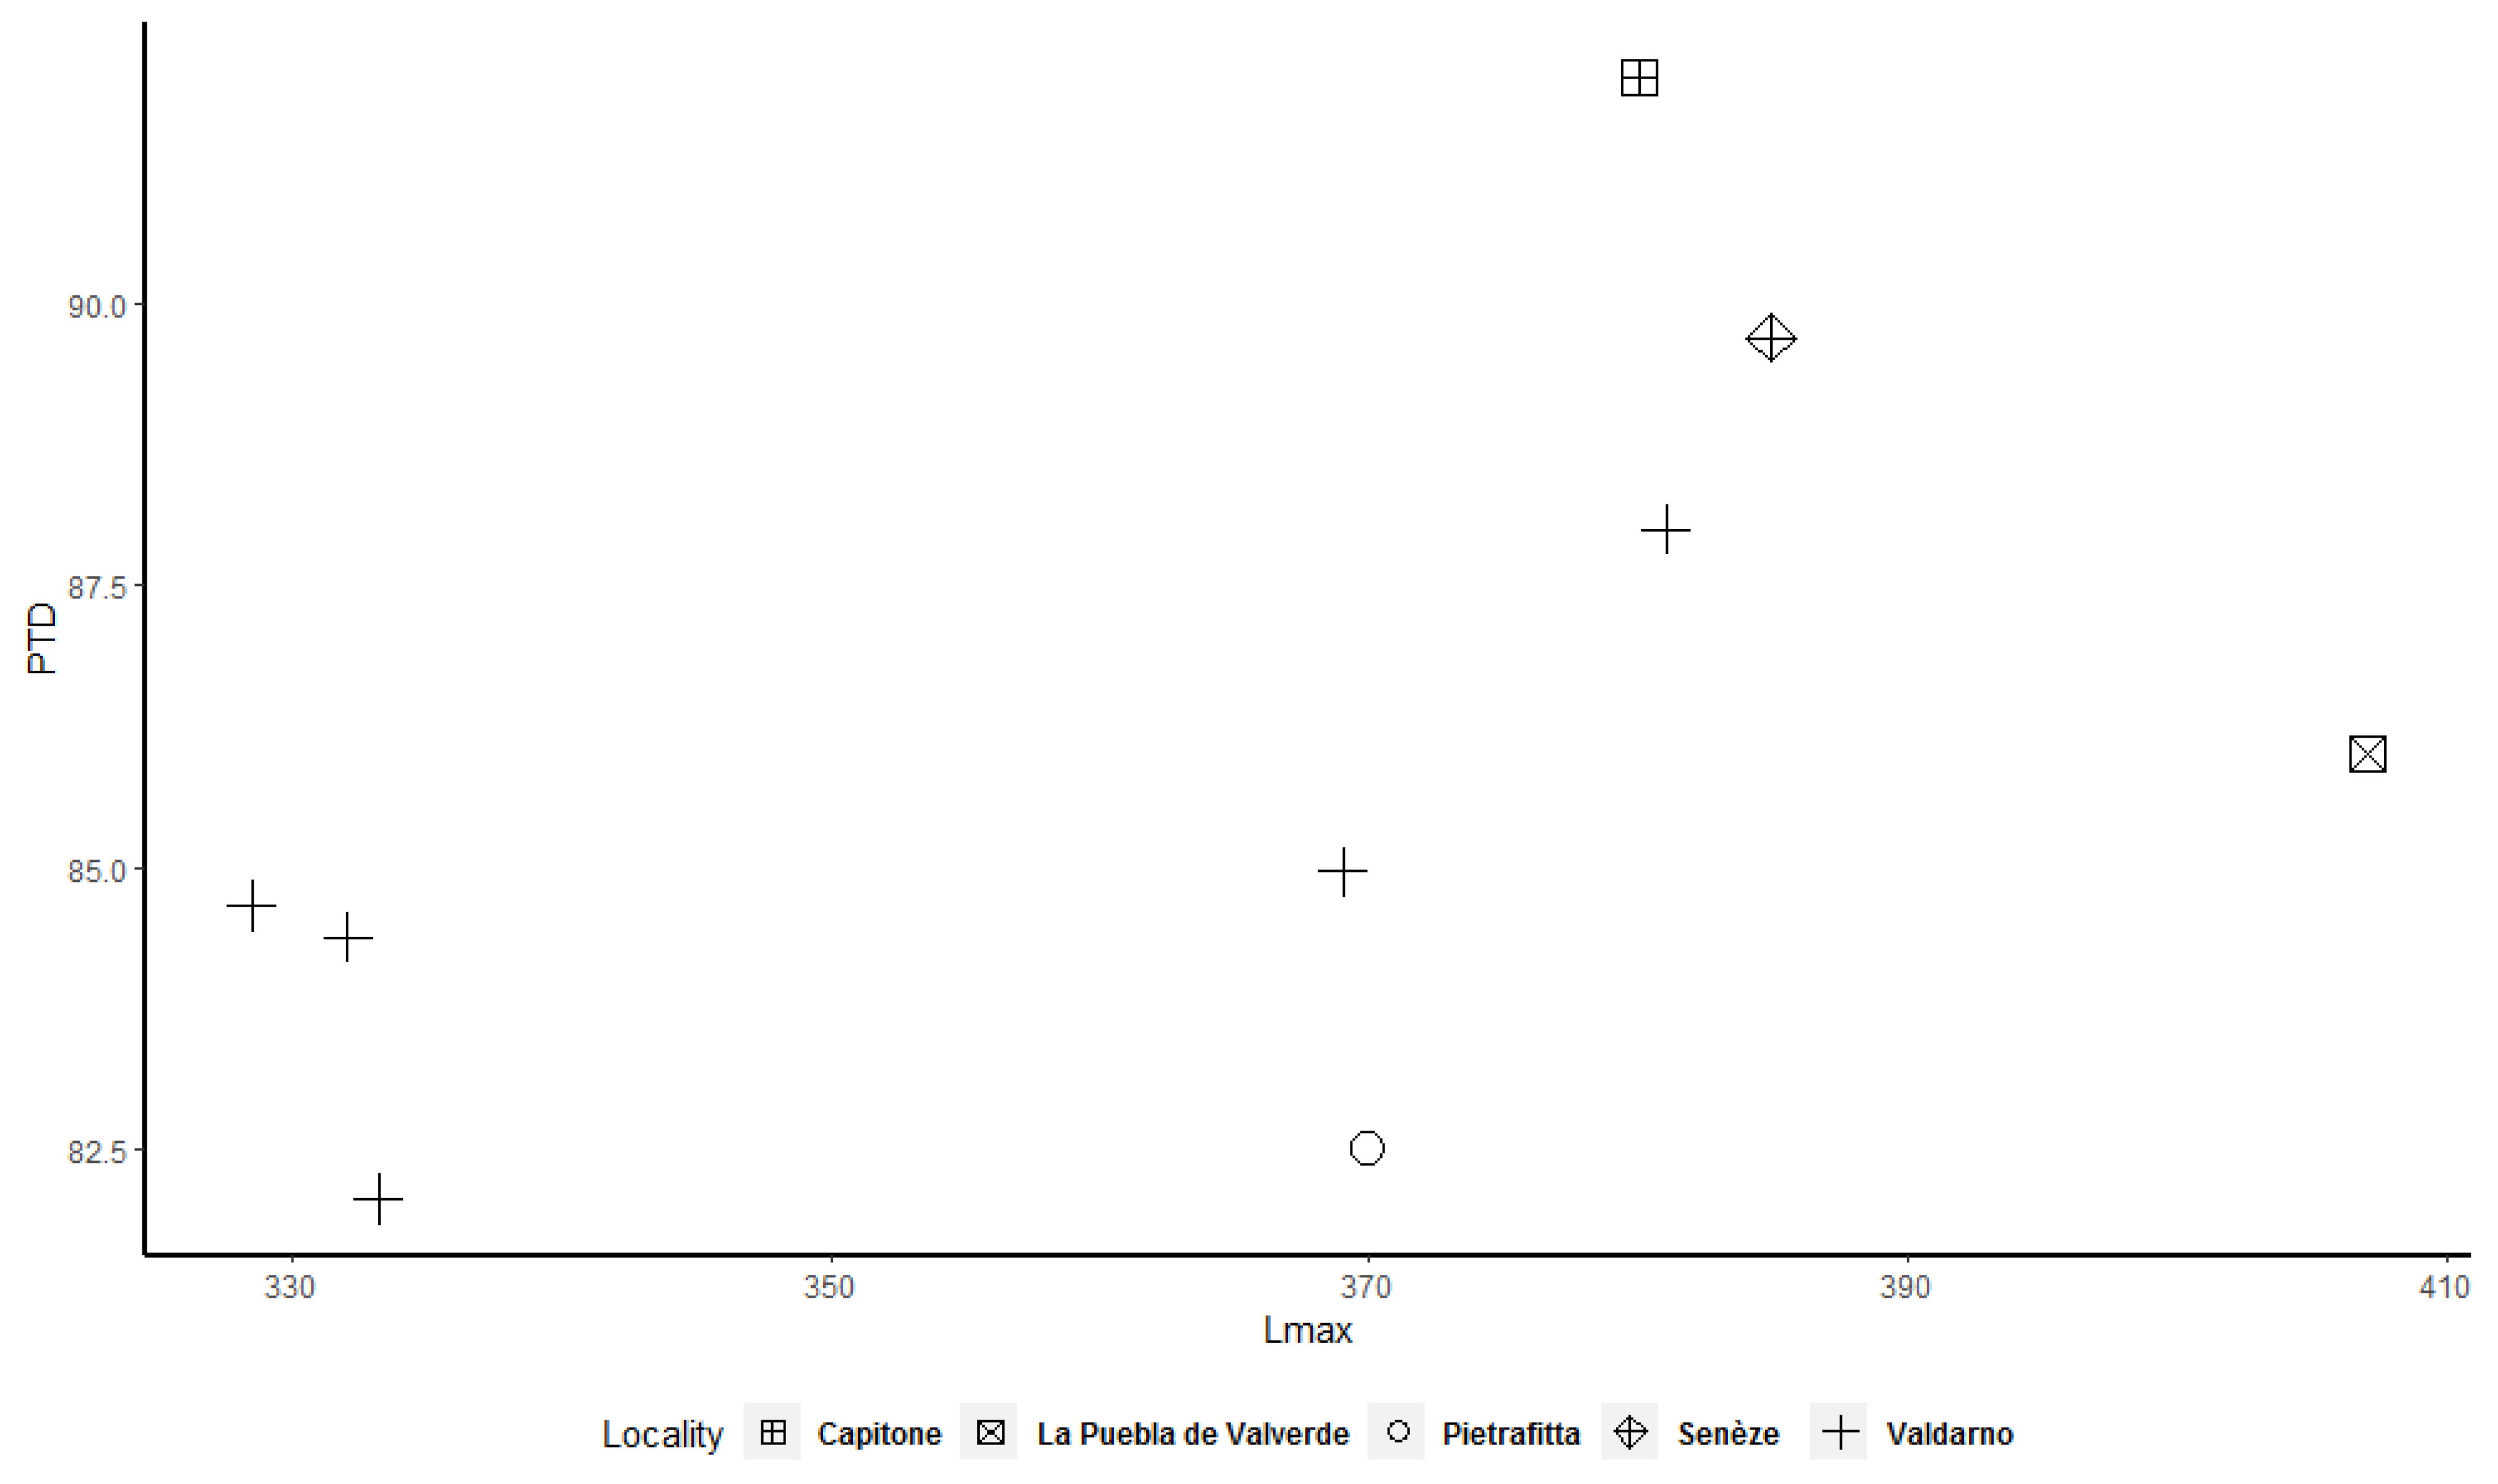
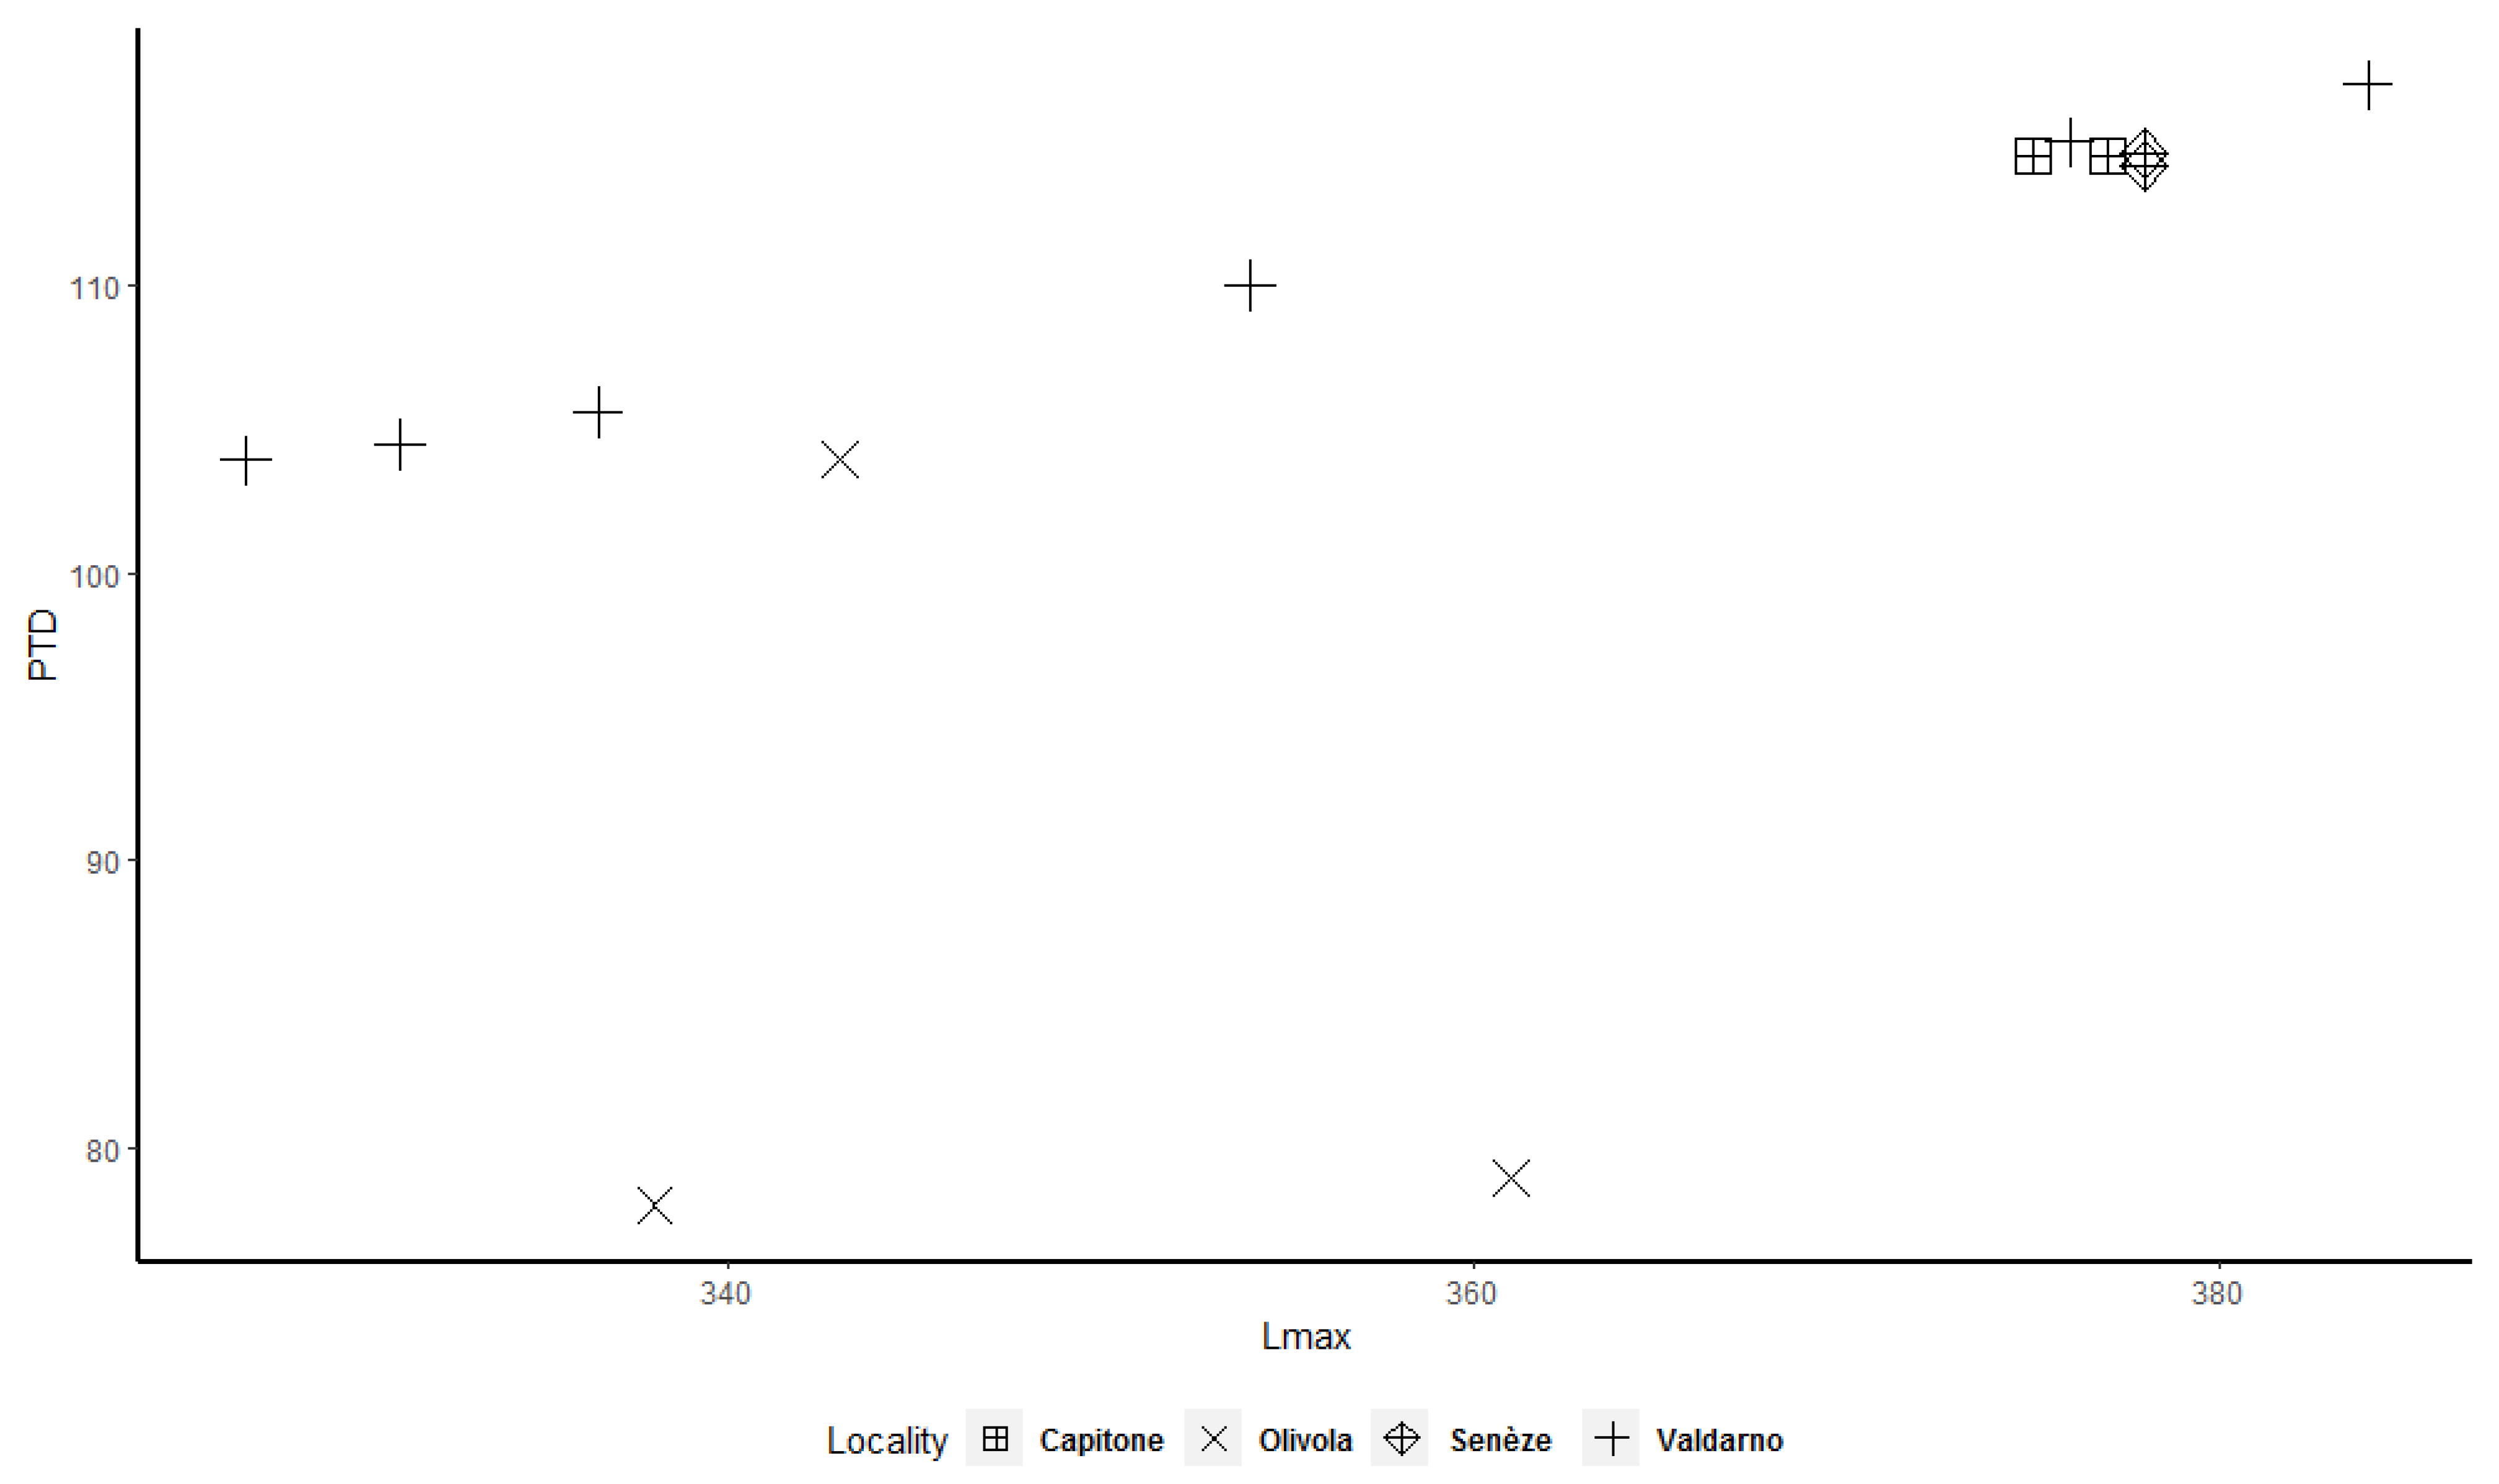
Figure 3) shows a less evident bimodal distribution. Bivariate plots (
Figure 7,
Figure 8,
Figure 9,
Figure 10,
Figure 11 and
Figure 12) allow better underlining of the presence of two clusters, in particular for the astragalus, calcaneum, and MTIII (
Figure 9,
Figure 10 and
Figure 12). The tibia and MCIII bivariate plots (
Figure 8 and
Figure 11) suggest the presence of two different clusters, but in both cases the cluster made up of the smallest individuals contains only a few specimens.
4. Discussion
Three sex-combined statistical methods allowed us to detect a weak signal of sexual dimorphism for each considered postcranial element of
S. etruscus. The results that indicate a possible bivariate distribution for each statistical analysis and for each postcranial element are summarized in
Table 7.
The presence of sexual dimorphism in fossil Rhinocerotidae has been investigated primarily on cranial remains [
10,
11,
12,
13,
14,
15,
16,
17,
18,
22], but little has been done on the variability of the postcranial elements [
13,
15,
16,
17]. This is mainly related to the frequently disarticulated nature of the remains and the need of a large dataset for comparison. Mead [
15] observed that the Miocene rhinoceros
Teleoceras major from the Ashfall beds shows a high degree of dimorphism in both the anterior and posterior limbs. Mihlbachler [
16], using sex-combined summary statistics, confirmed the presence of sexual dimorphism in the postcranial elements of
Teleoceras major and observed it for the first time in
Teleoceras proterum and
Aphelops malacorhinus. Mihlbachler [
17] investigated the presence of sexual dimorphism in the limbs of
M. arikarense but did not find any clear evidence of sex variance. Lastly, Lu et al. [
13] suggested that female individuals of
P. gracile were longer and taller while male individuals were generally smaller but more robust.
Pleistocene
Stephanorhinus species have been the subject of numerous morphological and morphometric studies in Europe, but only a few of them discussed the presence of sexually dimorphic characters, in particular on cranial remains. Thenius [
34] suggested that there are a few adult specimens of the Etruscan rhinoceros in which the nasal septum is not ossified, probably representing females. A distinction between males and females in
Stephanorhinus was then suggested on the basis of the nasal width [
35]. To the contrary, Loose [
24] reported that the variability of nasal horns is so large that it is impossible to correlate its development with the sex of the animal. No inquiry was made into postcranial remains [
22].
Due to its abundance and geographic distribution [
36],
S. etruscus is the Quaternary Eurasian
Stephanorhinus that is best suited to be tested for sexual dimorphism.
Here, using sex-combined summary statistics, we detected the presence of a bimodality distribution for some measurements in all of the considered bones (
Table 1,
Table 2,
Table 3,
Table 4,
Table 5 and
Table 6). The total length of the bones and the diameters of the epiphyses are the measurements that are more often bimodal or at least weakly bimodal. The astragalus (
Table 3) and calcaneum (
Table 4) are weakly bimodal in some characters such as Tdmax, DTDa, TDl, Htm, and APDm for the astragalus and Hmax, TDs, and TDst for the calcaneum. Even though it was impossible to determine the sex of the studied material a priori, the use of frequency histograms (
Figure 1,
Figure 2,
Figure 3,
Figure 4,
Figure 5 and
Figure 6) and, above all, bivariate plots (
Figure 7,
Figure 8,
Figure 9,
Figure 10,
Figure 11 and
Figure 12) shows that two clusters exist among the considered specimens. Bivariate plots can represent the bimodality signal obtained through the use of sex-combined summary statistics, highlighting that some adult individuals were taller and more robust than others.
More importantly, we observed that some adult specimens collected from the same locality, and therefore geographically and temporally close to each other, are plotted in two different clusters and are, in many cases, widely separated (
Figure 7,
Figure 8,
Figure 9,
Figure 10,
Figure 11 and
Figure 12). As a result, individuals from Valdarno (the most frequently represented locality in the dataset and the type area of the species), Pietrafitta, Olivola, and Senèze suggest that morphometrical variation attributable to sexual dimorphism is not overshadowed by the variability related to the geographical and temporal distribution of the species. However, the analysis of the Valdarno sample only (
Supplementary Materials S2) did not strongly support the bimodality patterns observed through bivariate plots (
Tables S1–S6) due to the too small number of observations. Only a few measurements (e.g., DTD of MTIII) are indeed statistically significant.
Accordingly, we can assume that
S. etruscus shows a relatively weak degree of sexual dimorphism in the limbs’ dimensions. In extant Indian, Sumatran, African [
8,
9,
37,
38,
39], and fossil [
15,
16,
18] Rhinocerotidae, males are larger than females; thus it is possible to hypothesize that in
S. etruscus males were also slightly larger than females.
5. Conclusions
The abundance of
S. etruscus in the fossil record allows us to investigate the presence of sexual dimorphism in the limb bones of this taxon. Moreover, the present work represents the first application of sex-combined statistical analysis to a dataset composed of individuals from various European localities. The morphometrical analyses revealed that quantifiable relatively weak sexual dimorphism is present in all the considered bones (
Table 1,
Table 2,
Table 3,
Table 4,
Table 5 and
Table 6). Adult
S. etruscus males probably exhibited slightly larger forelimbs and hindlimbs than females;
S. etruscus, similarly to African rhinos, had extremely reduced or absent incisors [
36], and it is therefore logical to assume that males confronted each other using their horns.
However, the results obtained for the Valdarno dataset demonstrated the limits of the applied statistical methods.
The recognition of a relatively weak sexual dimorphism in the postcranial bones of S. etruscus furthers our understanding of the paleoecology of this extinct taxon. However, only a better study of the morphological and morphometrical variability of the cranium of this fossil rhinoceros could deeply contribute to the investigation of the sociability and behavior of the species.


