1. Introduction
Fast development of urban centres is characterised by a strong increase in demand for expansion areas, with consequent planning problems. The urban development of cities or new neighbourhoods always generates a landscape that is very different from the previous ones [
1]. Settlements often occur on large flat structures, sometimes interrupted by natural, or artificially rectified, ditches and/or rivers. Therefore, the study of highly urbanised urban contexts which are vulnerable from a hydrogeological point of view [
2,
3] represents a very interesting field of research [
4]. This approach is very important, both for the safeguarding of human lives and for the protection and maintenance of artistic and monumental heritage [
5,
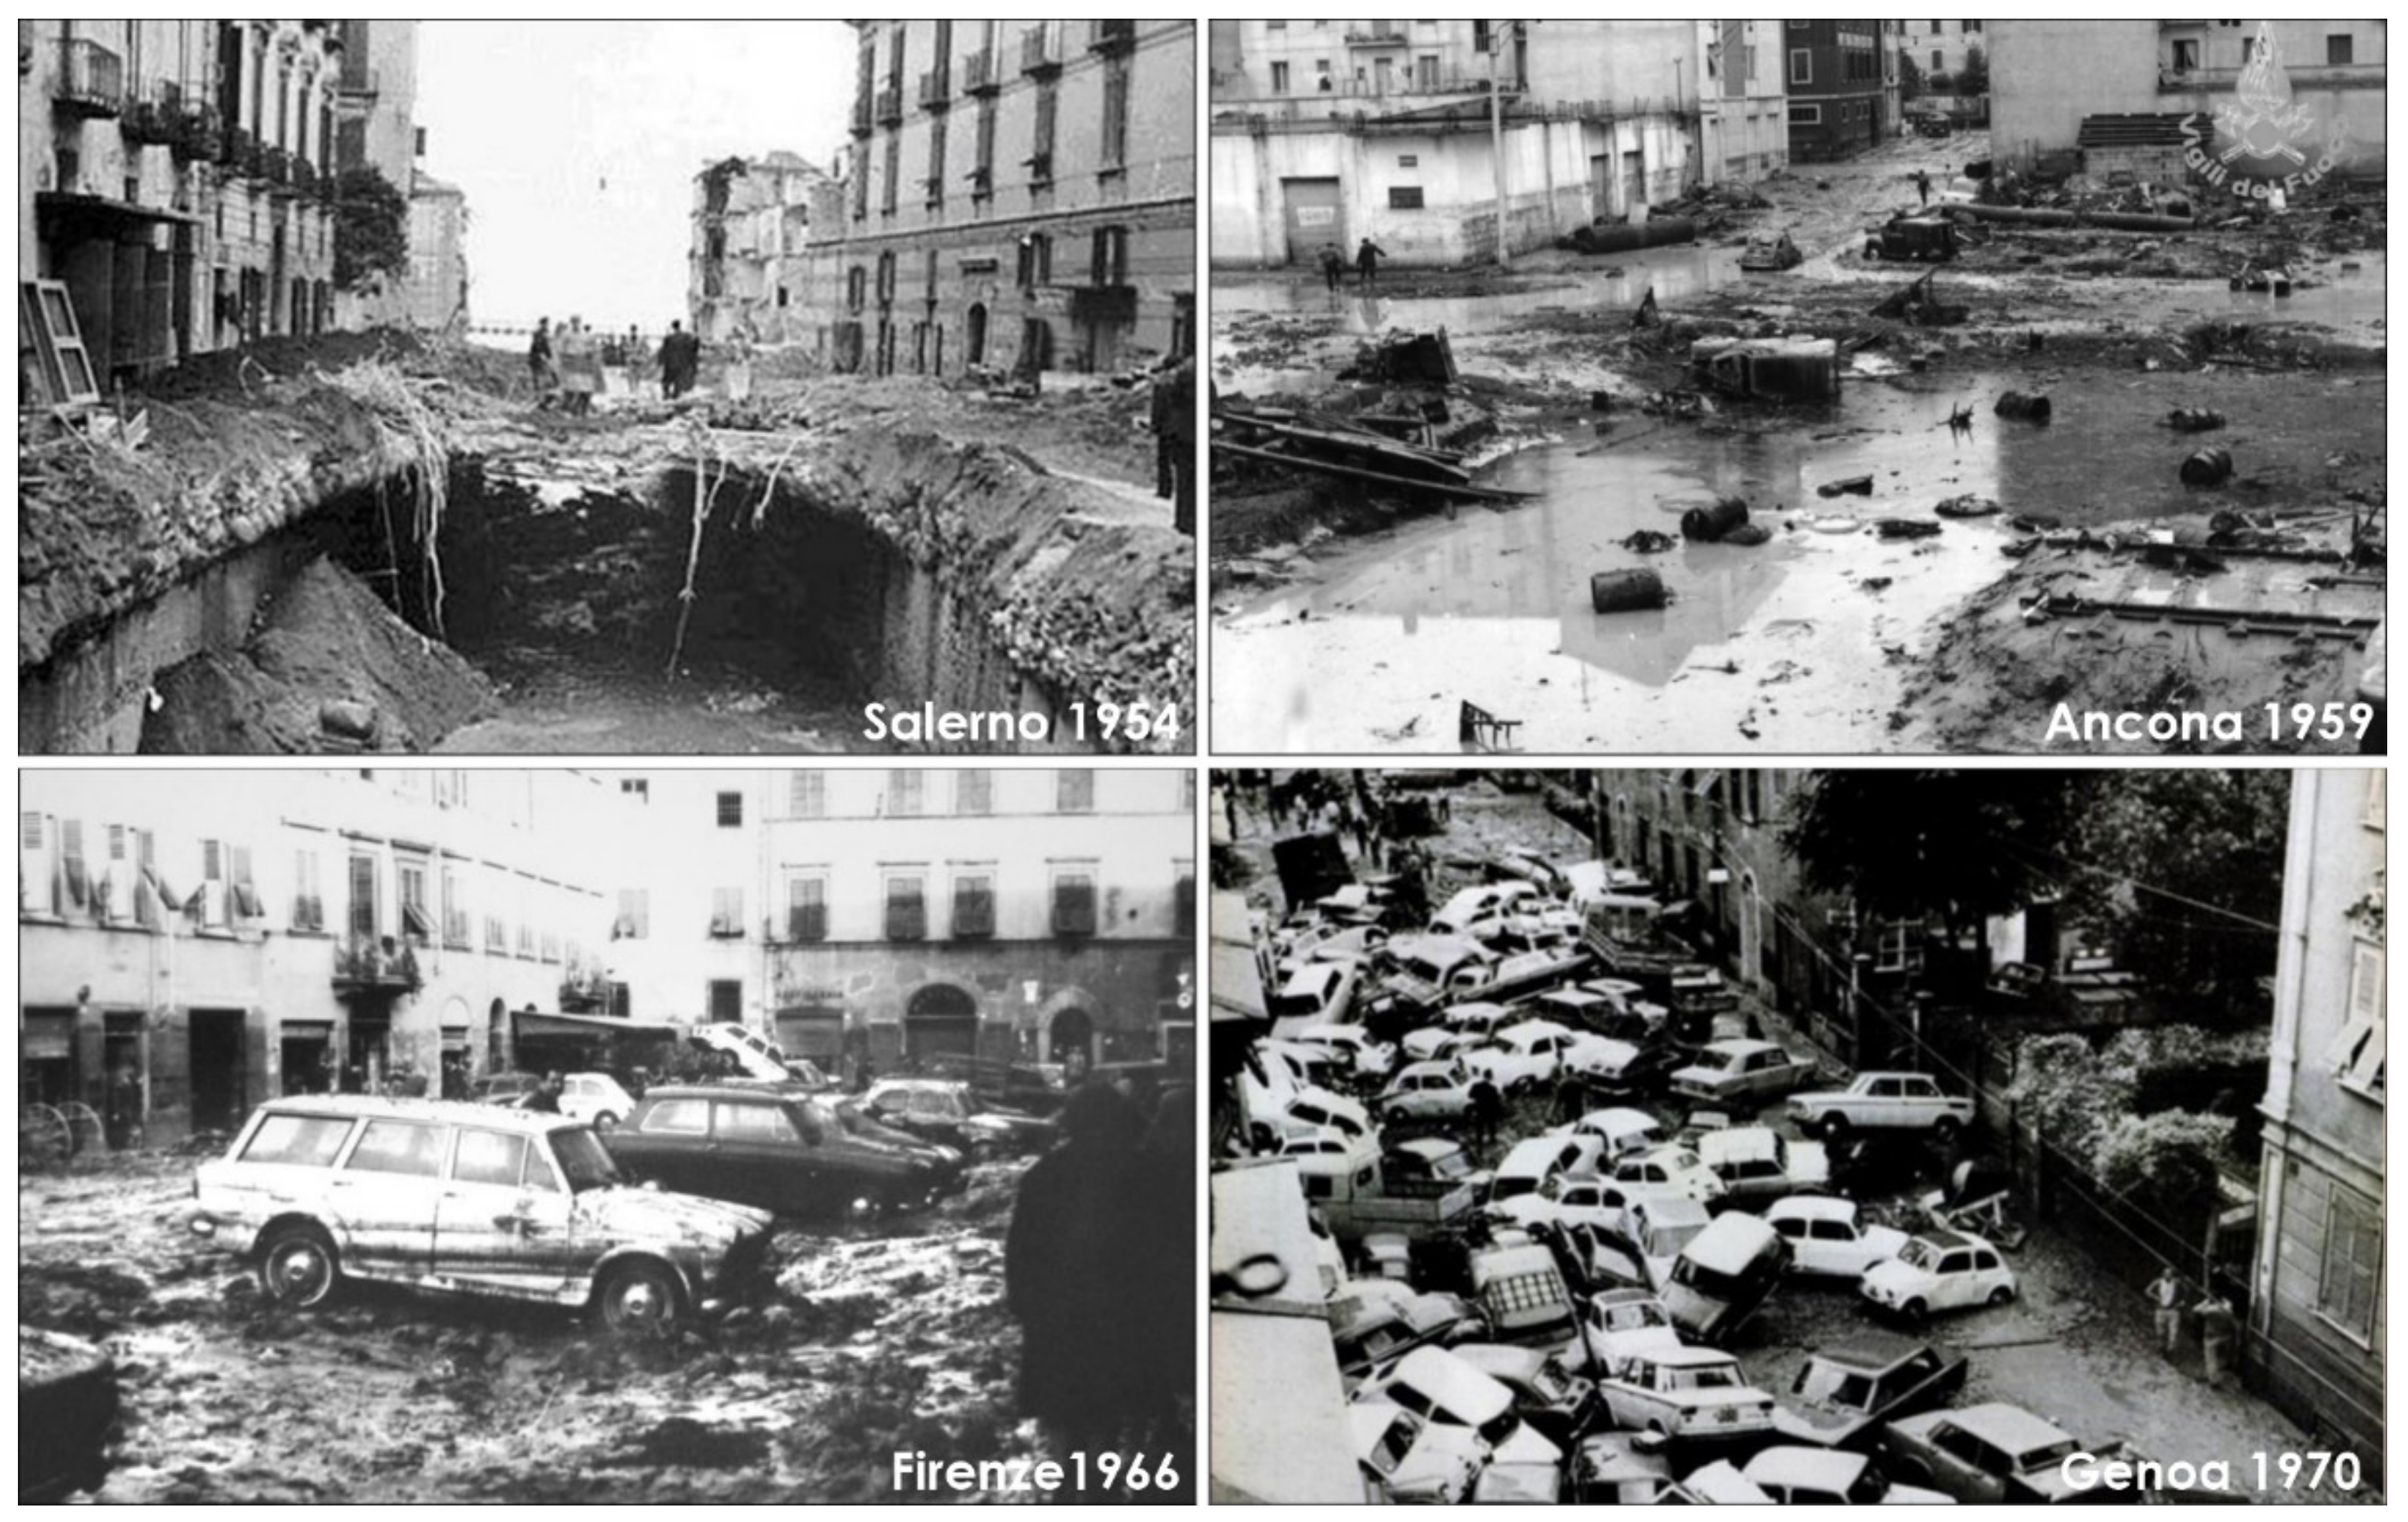
6]. In Italy the chronicle is full of dramatic examples: among the most emblematic are the cases of Salerno 1954; Ancona, 1959; Florence 1966; Genoa 1970, 2011, 2014, etc. (various photos of the events can be seen in
Figure 1). Loss of life between 1951 and 2021 has been considerable, at about 1400 (see
Table 1). Therefore, the analysis of all the factors that detract from the preservation of existing historic assets is critical.
For this analysis, an important aspect is having knowledge of all the elements that can contribute, so as to evaluate the predisposing and triggering causes of the catastrophic phenomena [
7,
8]. The main problems lie in the difficulty of reconstructing the exact subsoil framework that, in historic centres, is extremely heterogeneous due, sometimes, to anthropogenic fills of high thickness. The bibliography is full of innovative examples, offering different methodologies on how we can approach the definition and representation of the subsoil. Among the many works analysed, those that have been most useful in preparing this paper are here described. De Beer et al. [
9] show that 3D geological and anthropogenic models at various scales can offer a holistic system for subsurface management. They integrated spatial and process models for the potential preservation of buried heritage. Furthermore, they performed a collaborative approach to implement geological and archaeological modelling for heritage preservation. Tame et al. [
10] investigated a 3D spatial modelling method to reconstruct the subsurface structure and thus to reduce risk and uncertainty in urban planning [
11]. Their process has been improved by increase in computing capacity and digitisation of geological information. This approach could have some uncertainties for smaller urban scales. In these urban centres, the main problems are the anthropogenic deposits that form the subsurface because their geological characterisation is less complete. Therefore, they tried to apply the method in a small urban centre with a complex site history for the purpose of proper urban regeneration and redevelopment. In the paper, geognostic drilling data and local geologic maps were used to identify and model the anthropogenic deposits, validating the results with shallow geophysical data. Jiateng et al. [
12] presented an automated 3D modelling and visualisation method to urban drilling data greatly simplifying some manual operations. The Implicit Hermite Radial Basis Function (HRBF) was used to simulate the interfaces between different lithological units. In addition, subsurface visualisation was optimised to extract mesh models from geological surfaces. The proposed geological modelling method of urban underground is adequate to visualise both structural shapes and layer properties. The approach can be applied to predict particular subsoil conditions and to reduce risks for urban geotechnical engineering projects [
13]. Petrosino et al. [
14] expanded the geological knowledge of the Naples subsoil. The study was based on 290 drilling sequences and a complete set of stratigraphic, sedimentological and paleo-ecological data. The result was a conceptual hydrogeological model of the water and paleo-environmental circulation of the historic Naples city centre. Dou et al. [
15] provide more useful information for the planning, sustainable development, and use of urban underground space. Their study introduces a geological suitability evaluation for urban underground space (3D-UGSE) integrating much geological data with 3D technology in several steps: collecting data, constructing 3D geological modelling with an implicit method, creating a 3D evaluation index system, based on the available data, and producing 3D thematic maps, using comprehensive evaluation methods. He et al. [
16] studied 3D geological modelling applied to analyses of the complex nature of superficial deposits in the urban underground space construction in Beijing City. They created a novel 3D model (Creatar Xmodeling Software—developed by the Beijing Chaowai Creation Information Technology Co.—2018) that couples geological sequences setting up to 50 m from the topographic surface with geotechnical properties of subsoils. The modelling has especially provided an insight into the complicated alluvial environment. As is therefore evident in complex geological contexts, the focus is critical examination of both the action of man and the geological evolution of the environment in which humans have settled. The soils involved often require geological investigations aimed at gaining insights into hydrogeology and study of the current geomorphology to ensure safe and sustainable urban development. It is important to address the geological-technical problems with the development of new monitoring approaches and with advanced numerical techniques, able to simulate and predict the deformations evolution of the soil when subject to external stresses of any nature [
17]. In this paper, we studied the Historic Centre of Lanciano (Abruzzo Region—Italy), which has high architectural value and historical heritage of great value, dating back to the pre-Roman period. The choice of the place was dictated by the considerable geo-hydrological and geotechnical problems that have recently been exacerbated by flooding and subsidence of buildings in the area. The study was also integrated with the realisation of a monitoring system for the control of the deformations of some buildings that have undergone important lesion phenomena.
2. Geological and Hydrogeological Setting
The municipal area of Lanciano presents great variability in natural environments. The district is inserted between hilly reliefs that alternate towards the coast with large plateaus separated by valley engravings with a SW–NE trend, such as the Moro River, the Feltrino stream and, further south, the Sangro River. The hills appear, in the upper part, settled by numerous urban agglomerations separated by pronounced valleys and ditches, parallel to each other. The area of the urban centre of Lanciano is part of a large morphological terrace stretching towards the North East–South West. In
Figure 2, the large plateau of regressive genesis does not have a monotonous and continuous appearance but is fractured and furrowed by torrential incisions, such as the Spirito Santo ditch to the east, and the Santa Maria dei Mesi ditch to the west, both tributaries to the hydrographic right of the Feltrino stream (
Figure 2).
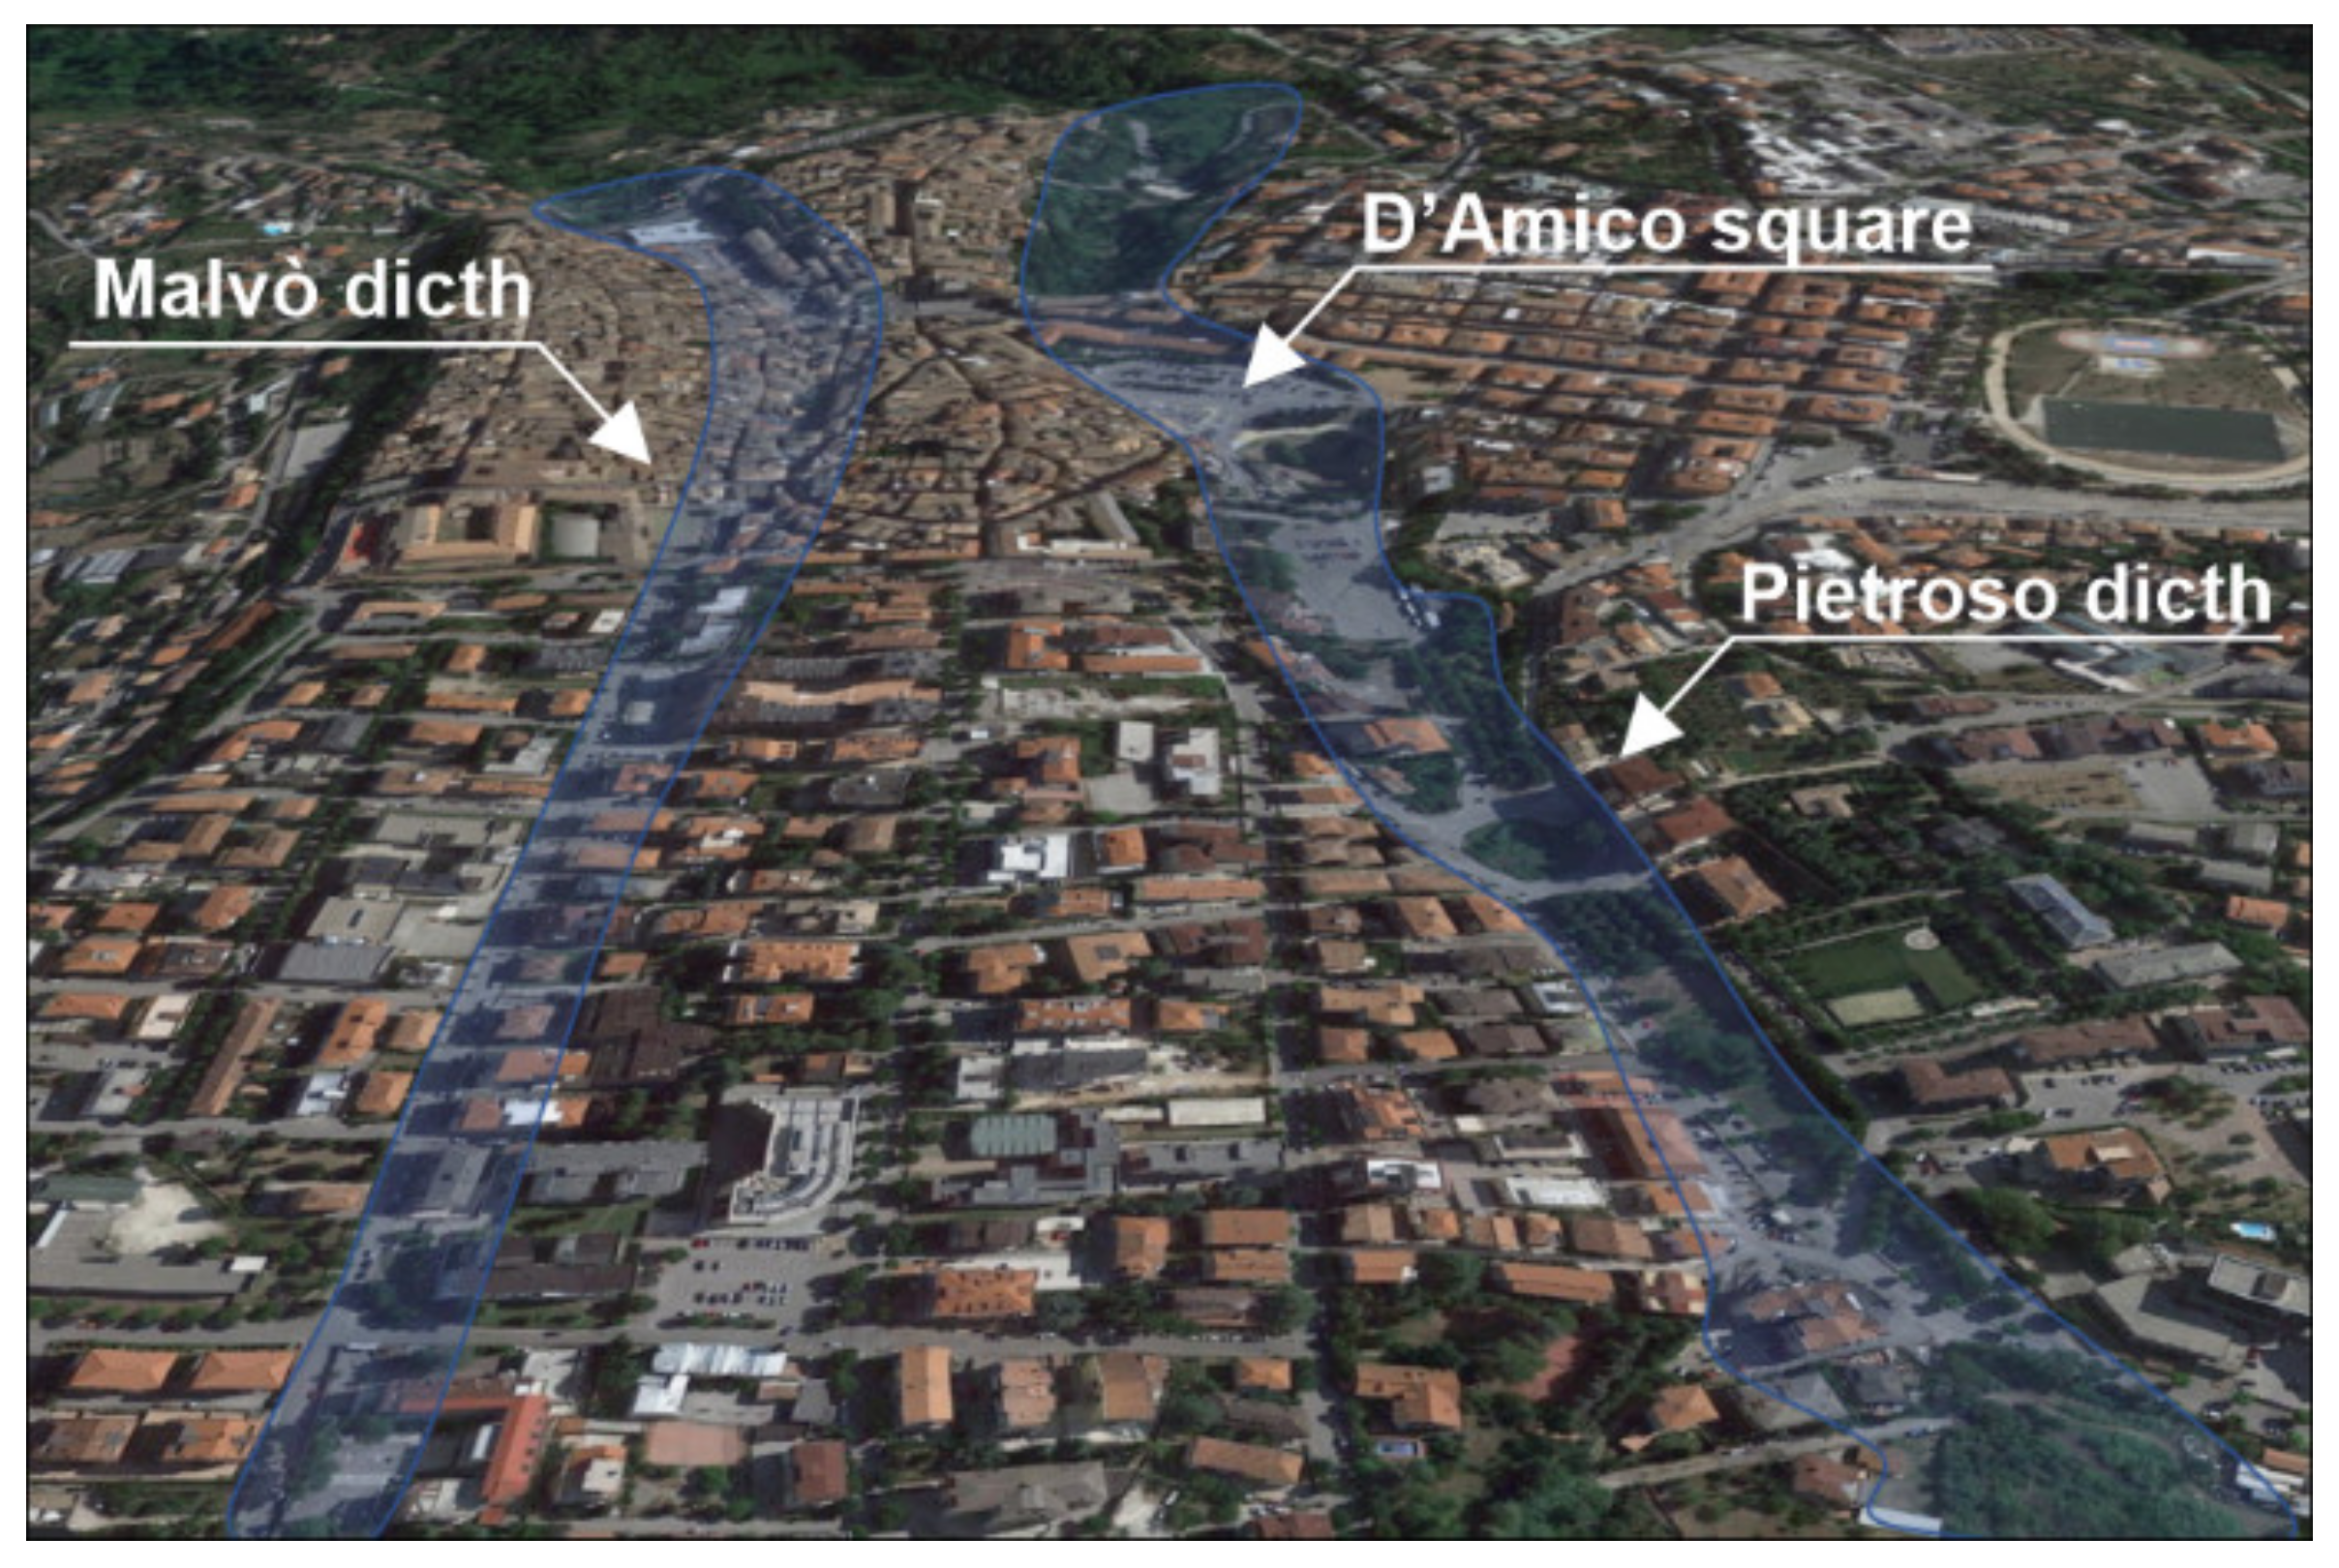
The modern town of Lanciano (developed at the beginning of the twentieth century) is almost completely settled on gravelly and sandy-arenaceous soils, unlike the older part to the west, (overlooking the Feltrino valley) where the gravelly component tends to almost disappear. The erosive pattern is usually imprinted in sandy-arenaceous deposits, and structural control can be hypothesised due to a system of fractures that have markedly conditioned the flow of water courses according to a precise orientation. In detail, the regulation of surface waters has a strong conditioning, due to the realisation of anthropic backfill. These materials block the natural flow of meteoric waters that have been regulated by realising draining tunnels or collectors, currently with an insufficient section and not very functional. We can recognise in
Figure 3 the ancient Malvò ditch, completely entropised, whose waters are regulated by collectors now obsolete and mixed with black waters, and the Pietroso ditch barred by what is now D’Amico Square.
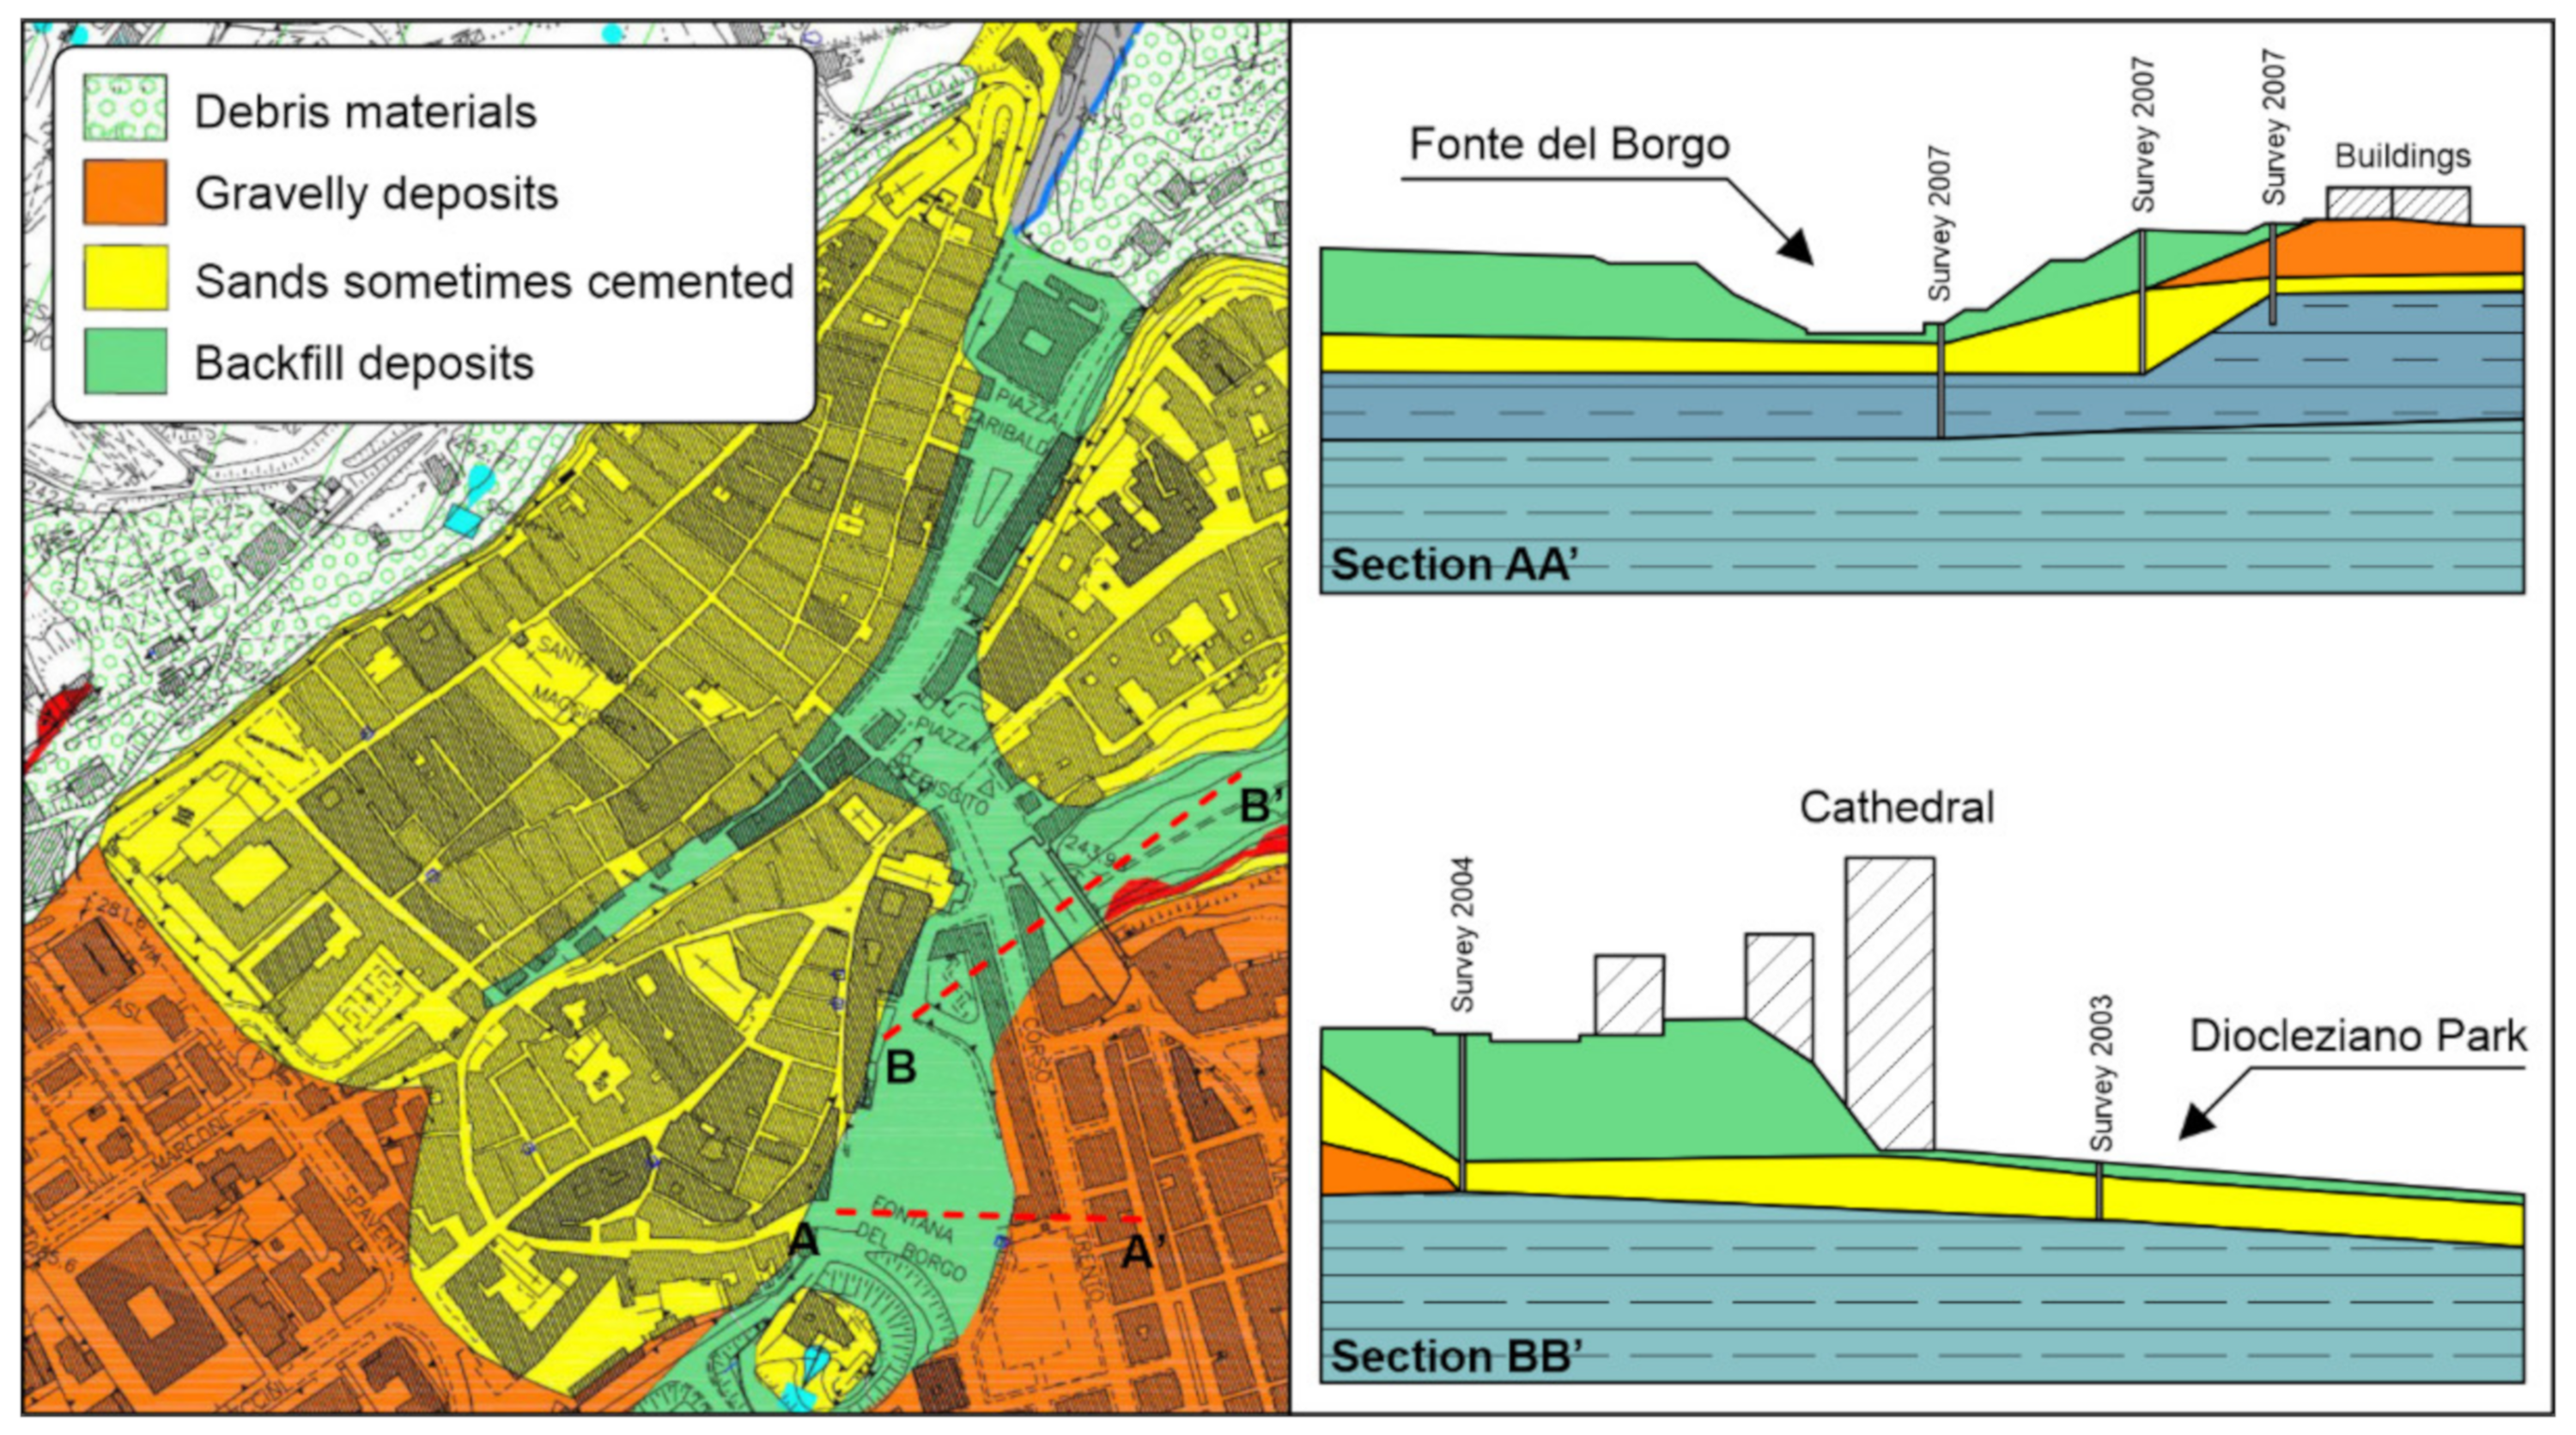
The surficial geology of Lanciano is characterised by two main lithotypes: heterogeneous gravelly deposits of variable consistency and cemented sands. The substratum consists of gray-blue clay formation. In the area of interest, the formations are mainly sandy. Also identifiable is a large area between Plebiscito Square and D’Amico Square in which considerable thicknesses of residual soils have accumulated. These backfill deposits are extremely heterogeneous and composed of different materials of both natural and anthropic origin, which make their physical and mechanical characterization very complex.
Figure 4 shows a simplified geological map of Lanciano historical centre and two schematic sections. The subsoil of important historical centres of relevant archaeological value, like Lanciano, is frequently constituted such as to overlap portions of old structures belonging to different epochs. Often, in these contexts, the presence of hypogeal cavities, even natural ones, make the reconstruction of the geological model even more complex.
Originally, Lanciano territory was characterised by a succession of distinct hills, the connecting valleys of which represented natural impluvium of the meteoric waters of superficial runoff. Over time, these valleys were filled in and replaced by deep drainage collectors. In
Figure 4 the extension of the filled areas (green background), with thickness that in some points exceeds 24 m, is very evident. A more recent geognostic survey confirms the data from Carabba [
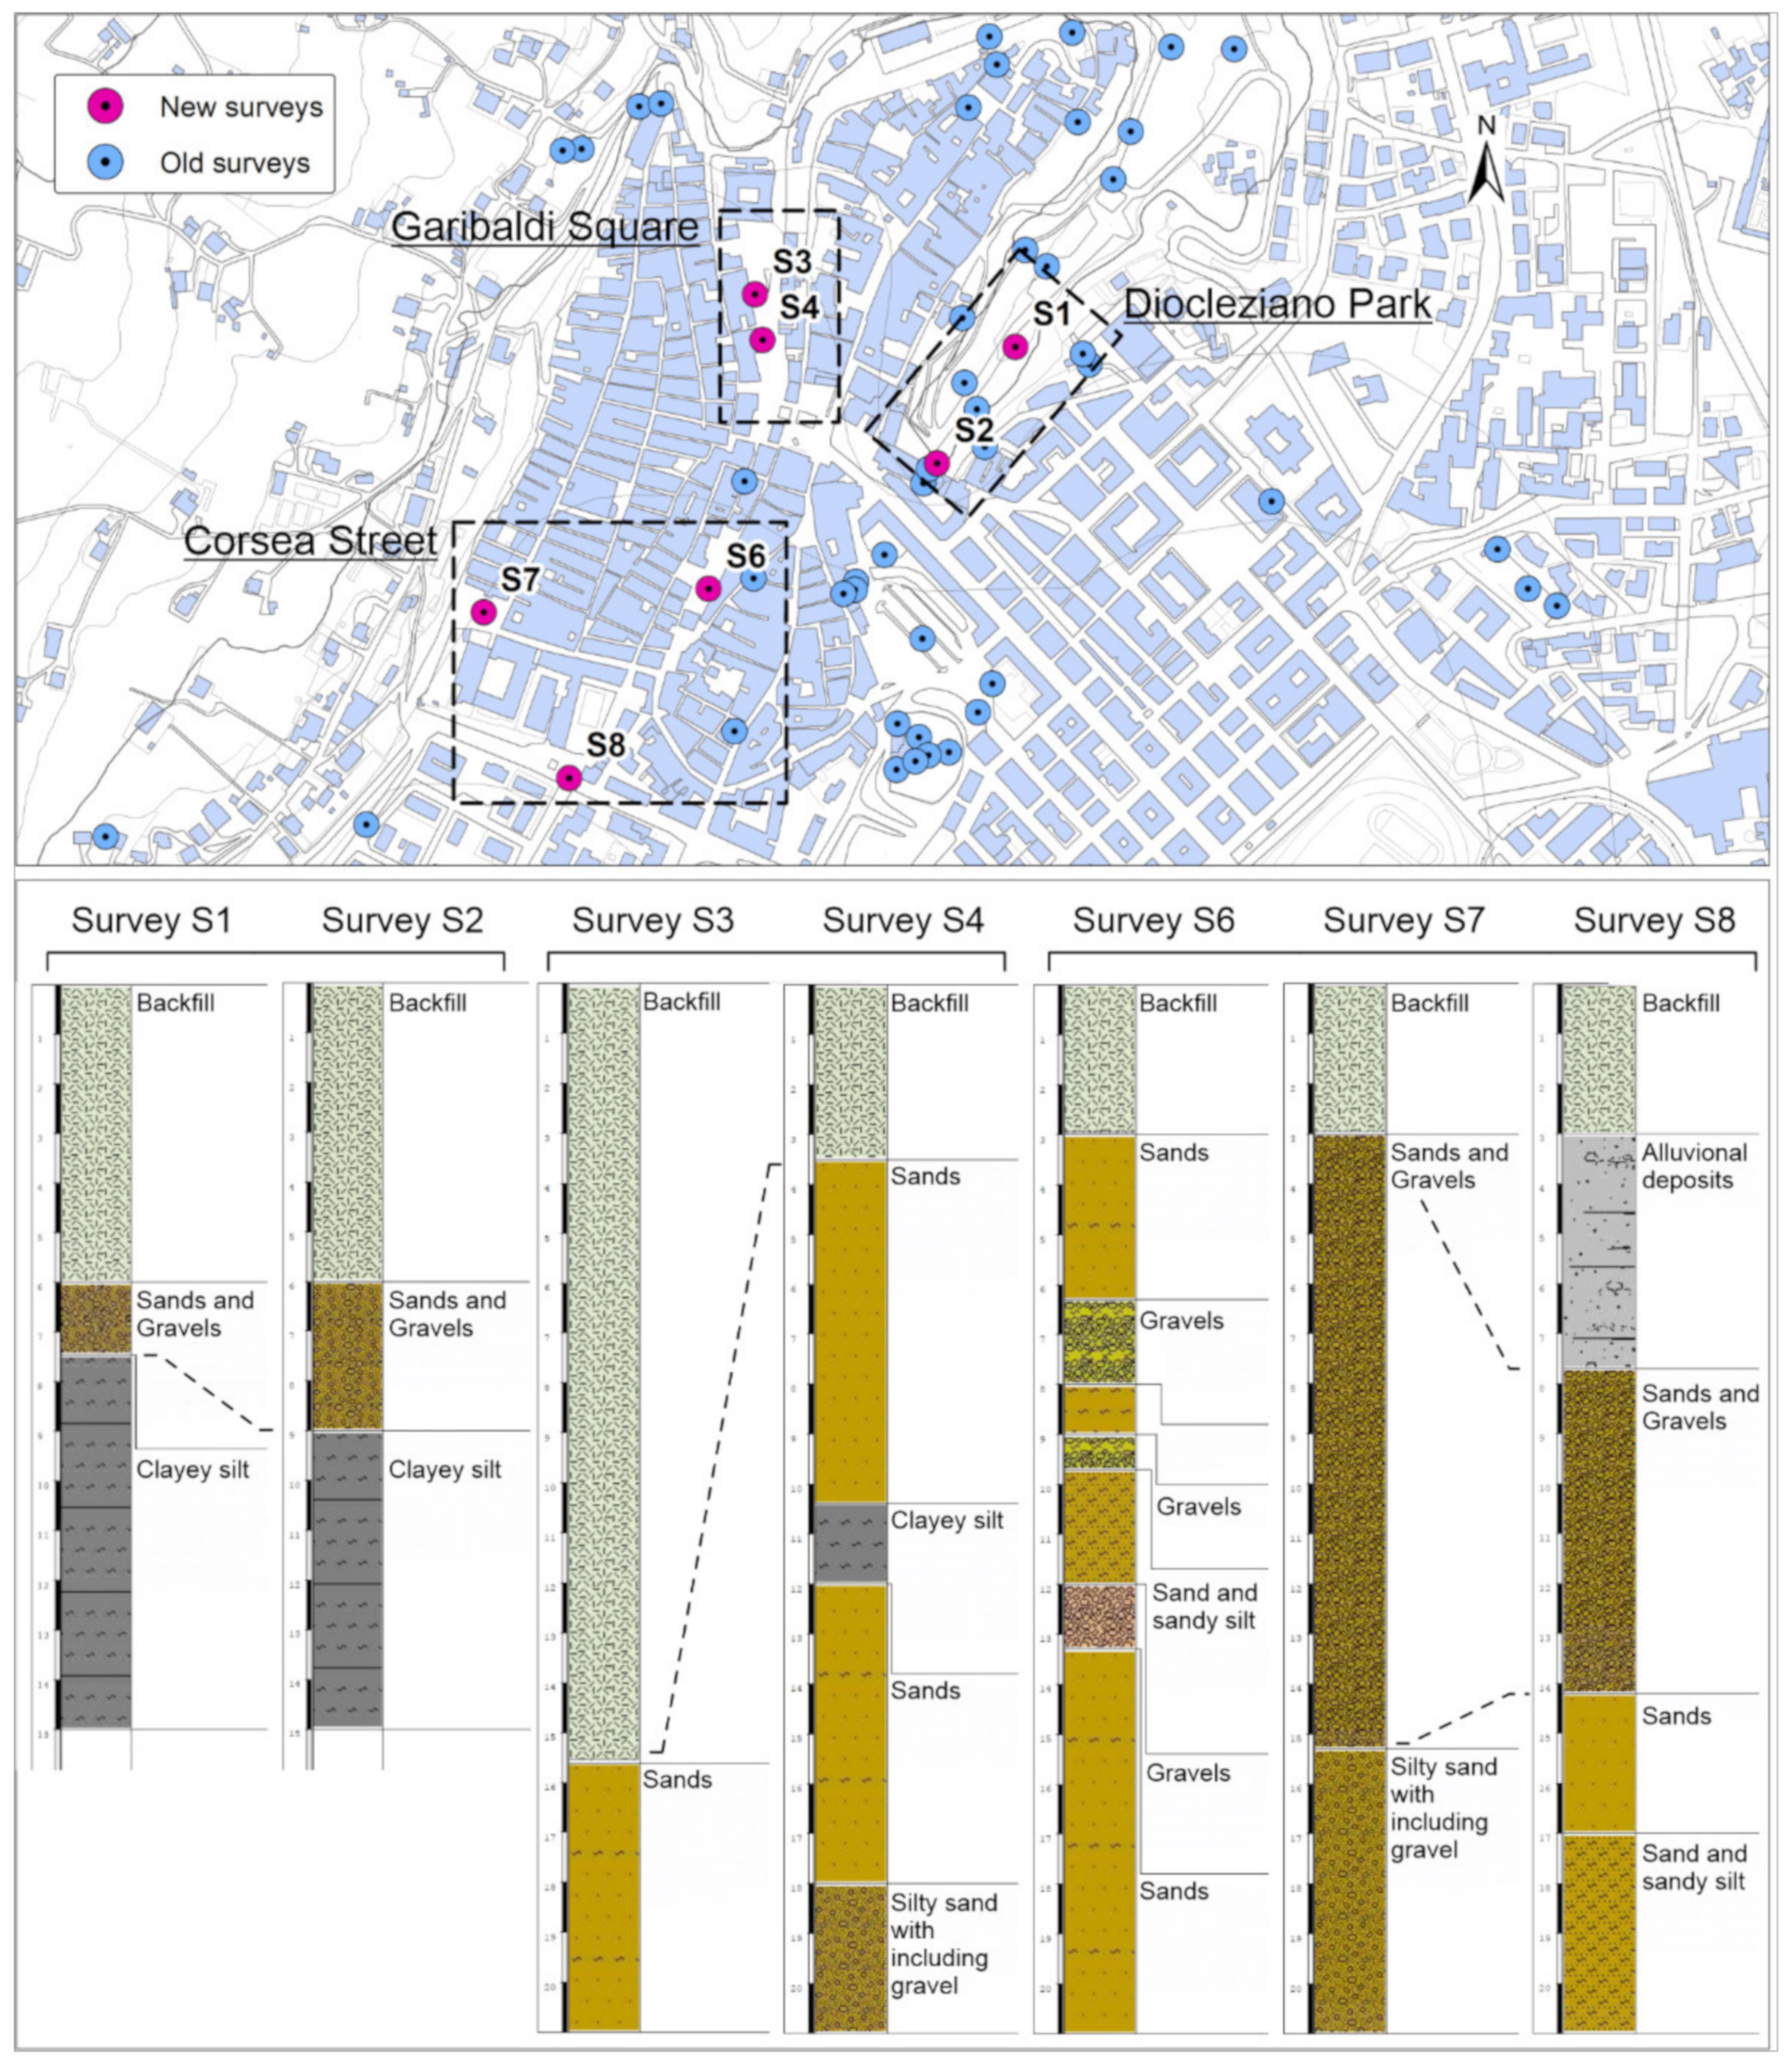
18], providing an exhaustive framework of the stratigraphy (
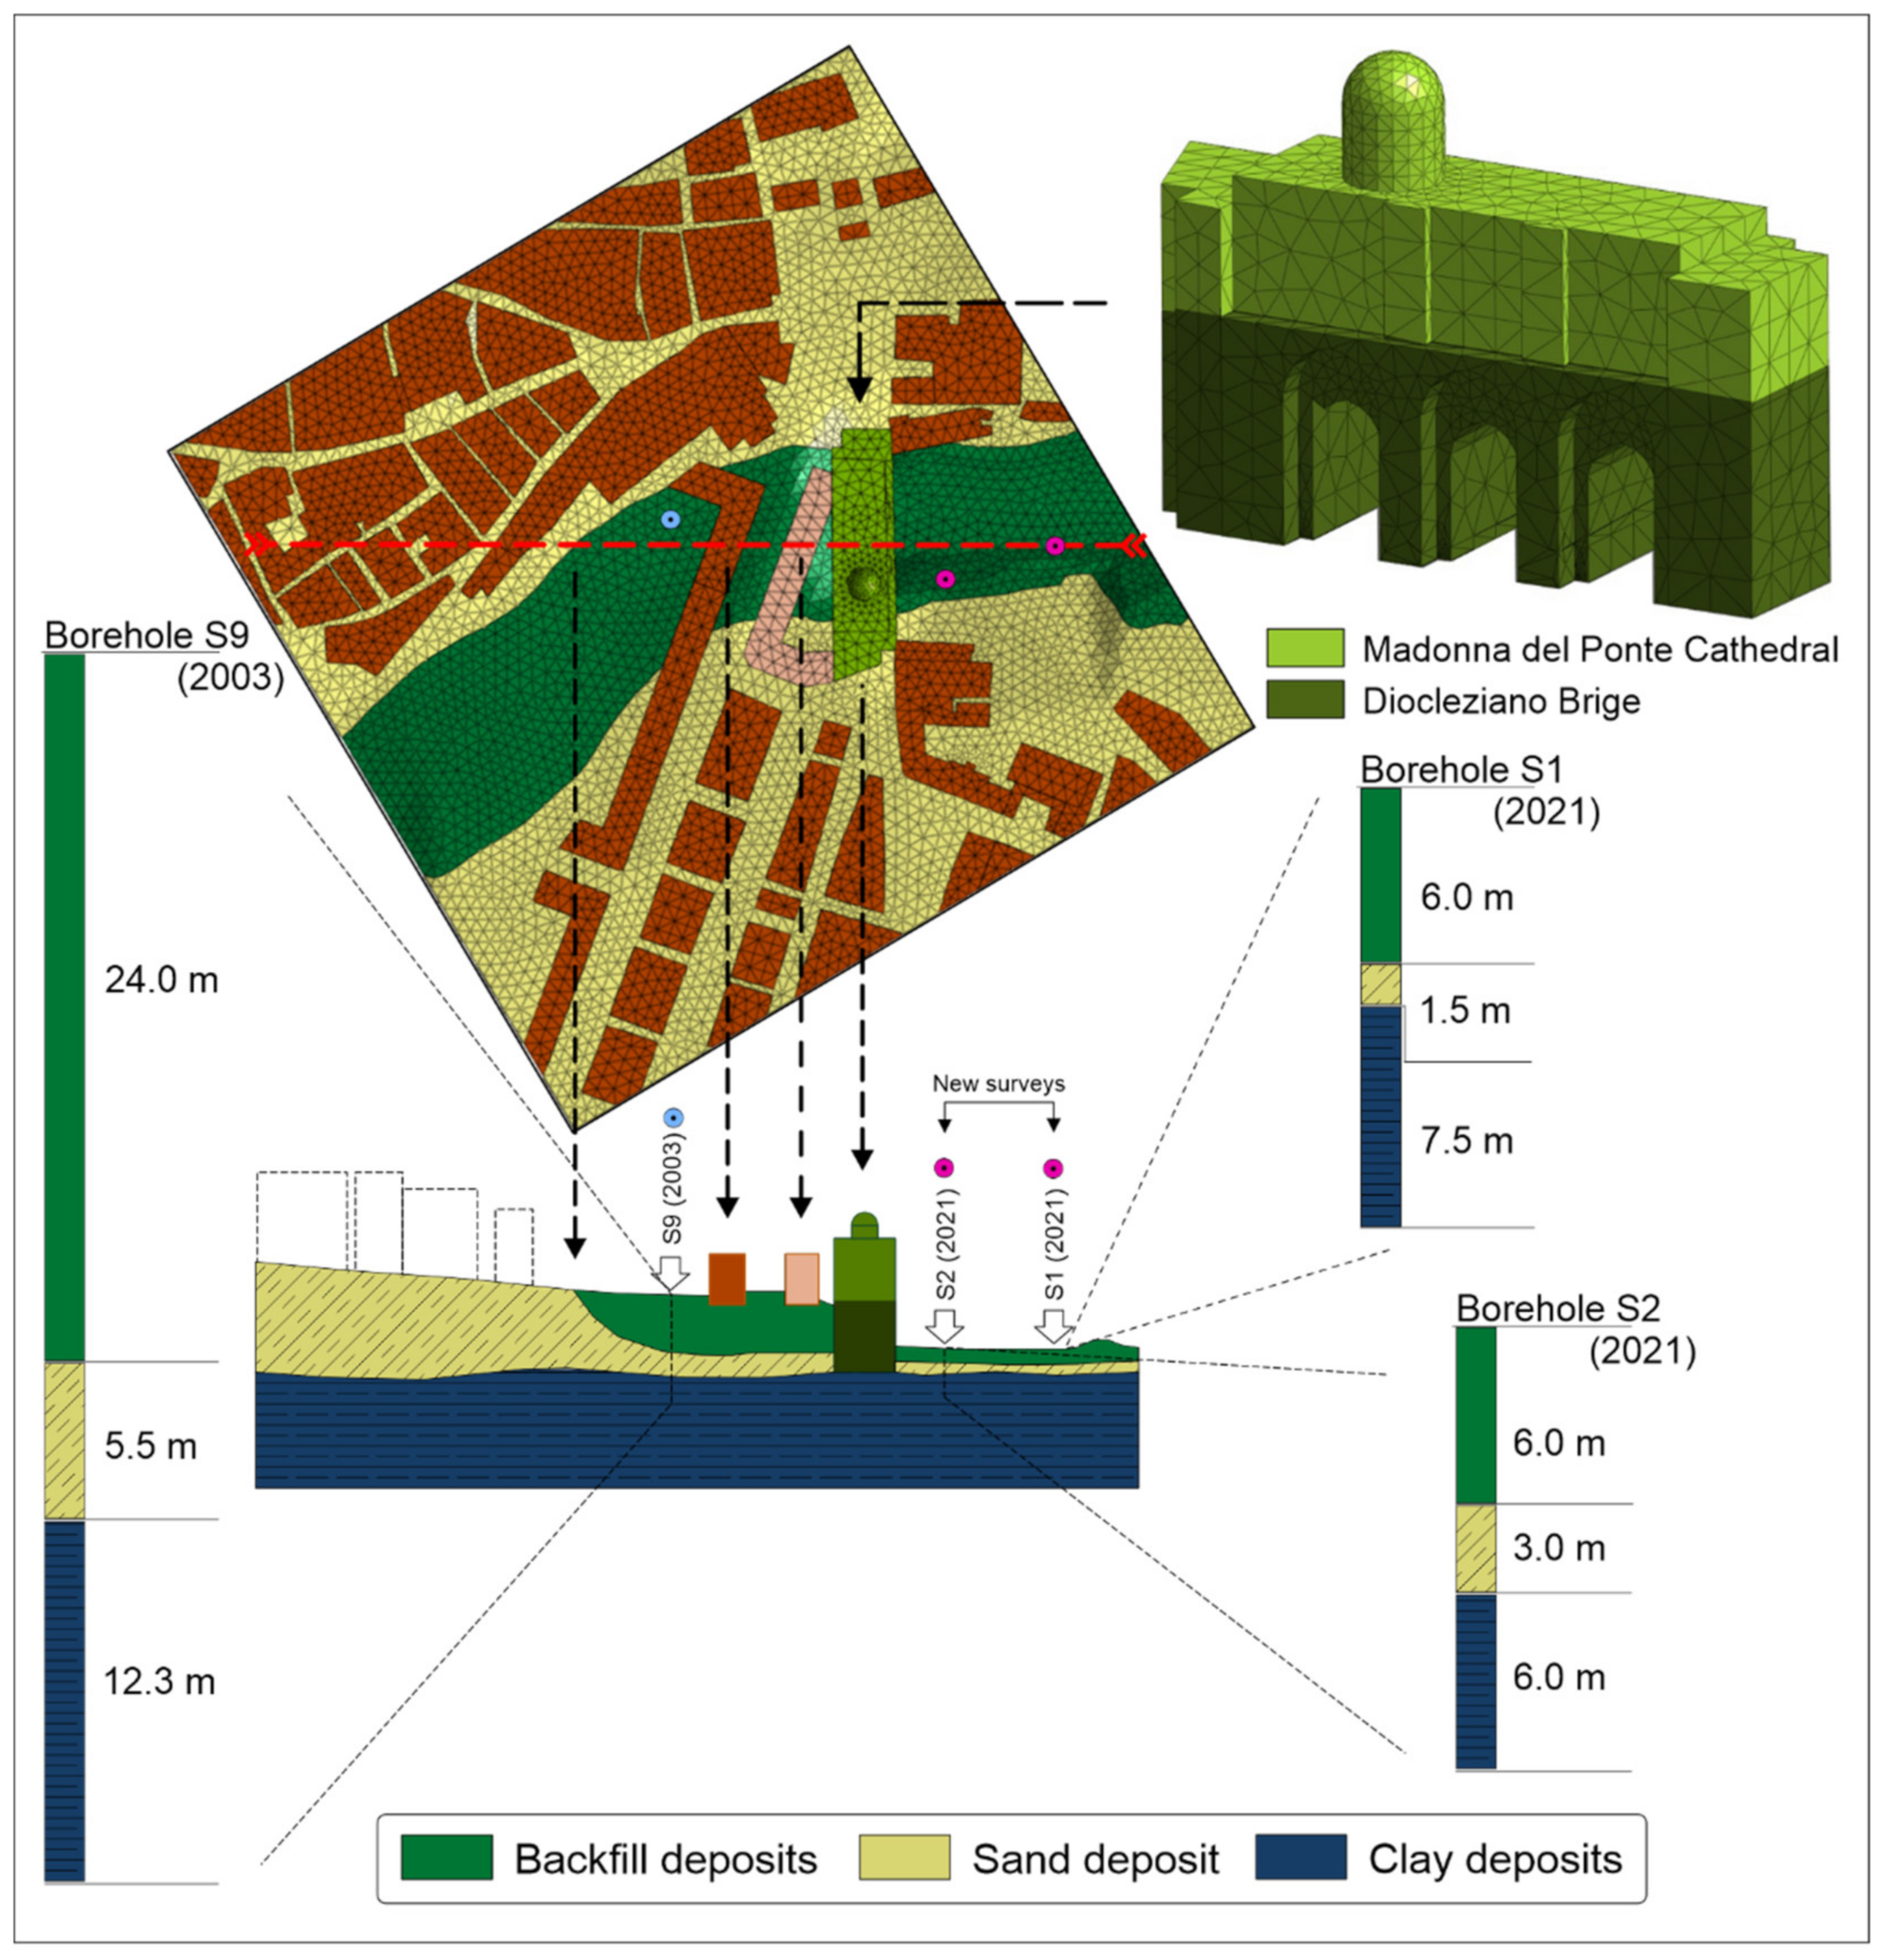
Figure 5).
The results of the new geognostic survey were integrated with all geological investigation recovered in the area. This analysis highlighted the actual backfill thickness and its main physical characteristics. The geological reconstruction was based on all the data that indicates the planimetry of
Figure 5. New boreholes were used to define the actual thicknesses of the backfill deposits inside Diocletian Park (S1–S2), at Garibaldi Square (S3–S4) and along Corsea Street (S6–S7–S8). The stratigraphic correlations establish that, in depth, the contacts between the in-situ soils and backfill deposits are very variable. The calculated thicknesses vary from 3.0 m to 24.5 m; in the Corsea Street area, there is the smallest thickness, while at the Diocleziano Park area the thicknesses sometimes exceed 6 m. Furthermore, the variability in Garibaldi Square is more marked. In this zone, the anomaly visible in
Figure 5 (cross-correlation between S3-S4) was recorded, with a depth of over 15.0 m of backfill deposits. The results agree with historical knowledge of the sites and with period photographs that confirm the subsequent filling up of the area. The results were integrated with some lines of geophysical investigation, so it was possible to reconstruct the spatial layout of the soils. It is interesting to contextualize the geo-electrical investigations (ERT—Electrical Resistivity Tomography) in the urban area, which is clearly shown in
Figure 6.
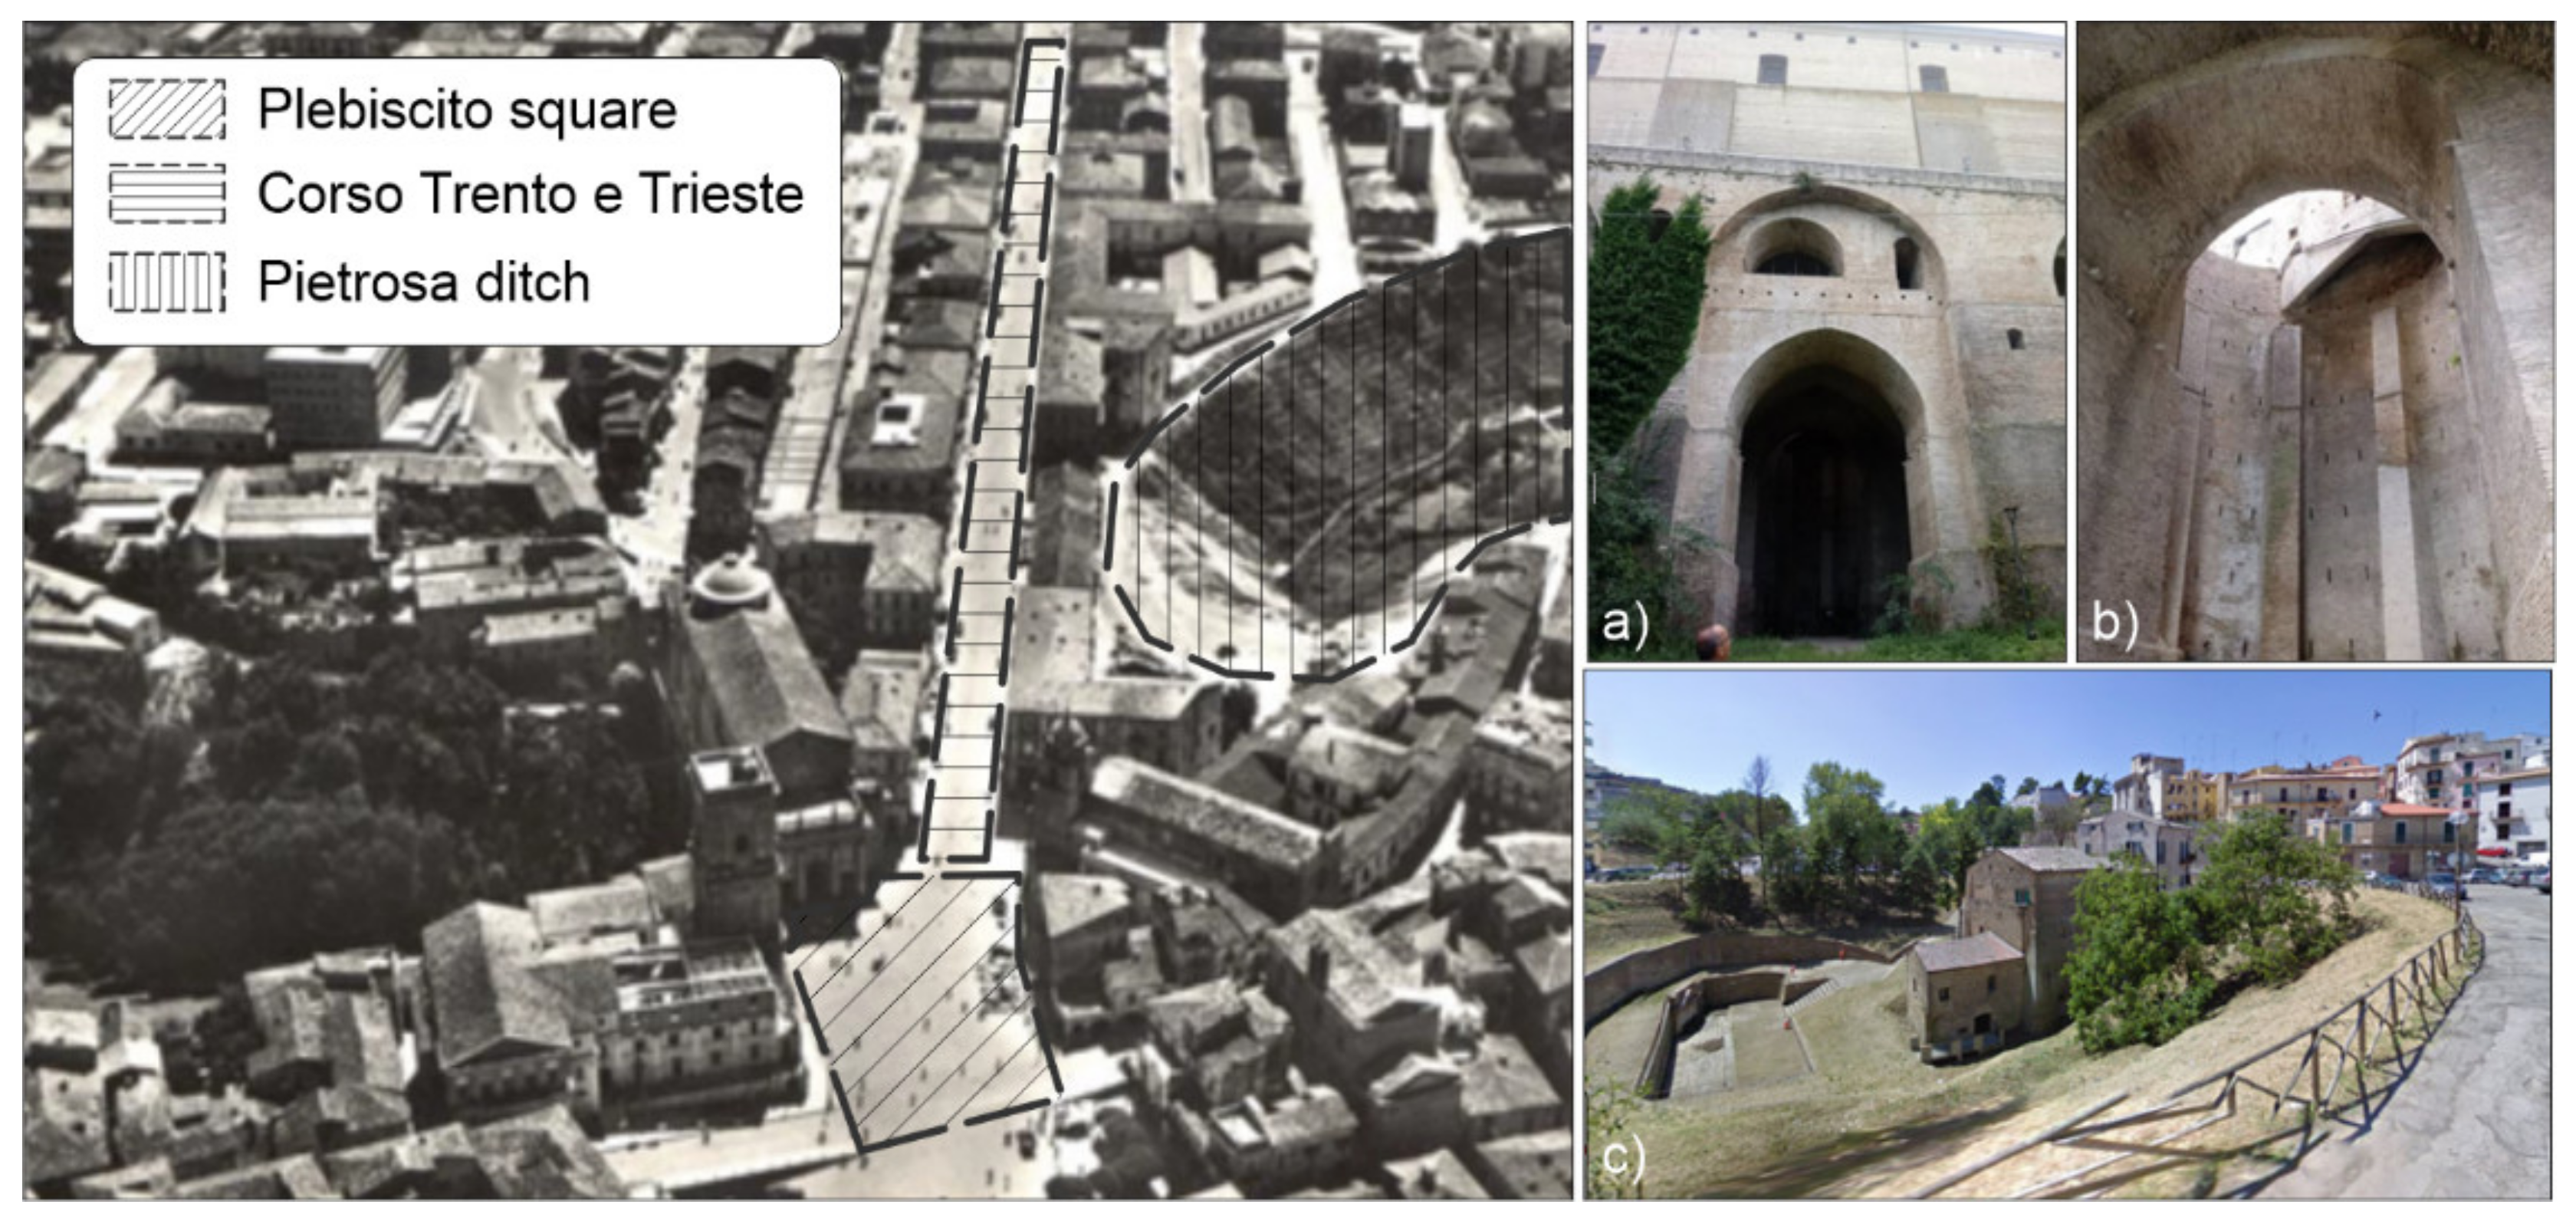
D’Amico Square and part of the Historic Centre are grounded on important filling that was carried out in more phases from the end of the 19th century. The historical reconstruction could be done through some ancient photos that testify to the original shapes of the places. In the early 1900s D’Amico Square did not exist and one can recognise (
Figure 7) the Cathedral and the arched wall built to support later filling. In the following photos, there are particulars of the drainage gallery designed by the engineer, Sargiacomo, to regulate the water flow of the Pietroso ditch, and the embankment above it is also visible (
Figure 8).
Furthermore, an arched wall was built to support the current Cathedral (
Figure 8a,b) and to retain the thrusts of the backfill that was built out in later times. We also report a photo of the Piazza D’Amico area down from the Fonte del Borgo (
Figure 8c) at the present time. This spring has a perennial flow rate, testifying to the presence of springs in contact between the sandy formations in place and the silty-clayey substratum. The water presumably drains from the ancient Sargiacomo conduit to be disposed of in Diocleziano Park.
3. Control and Monitoring
Following the serious consequences of the cloudburst of 22 June 2018 (
Figure 9), an important system of control of the cracking state was set up, resulting mainly from the subsidence of the ground under some houses located downstream at the end of Trento and Trieste Avenues. Monitoring activities represent an indispensable tool to interpret the evolutive trend of natural phenomena. In this case, the instrumentations testify to a situation of ground subsidence under the area of the historical centre.
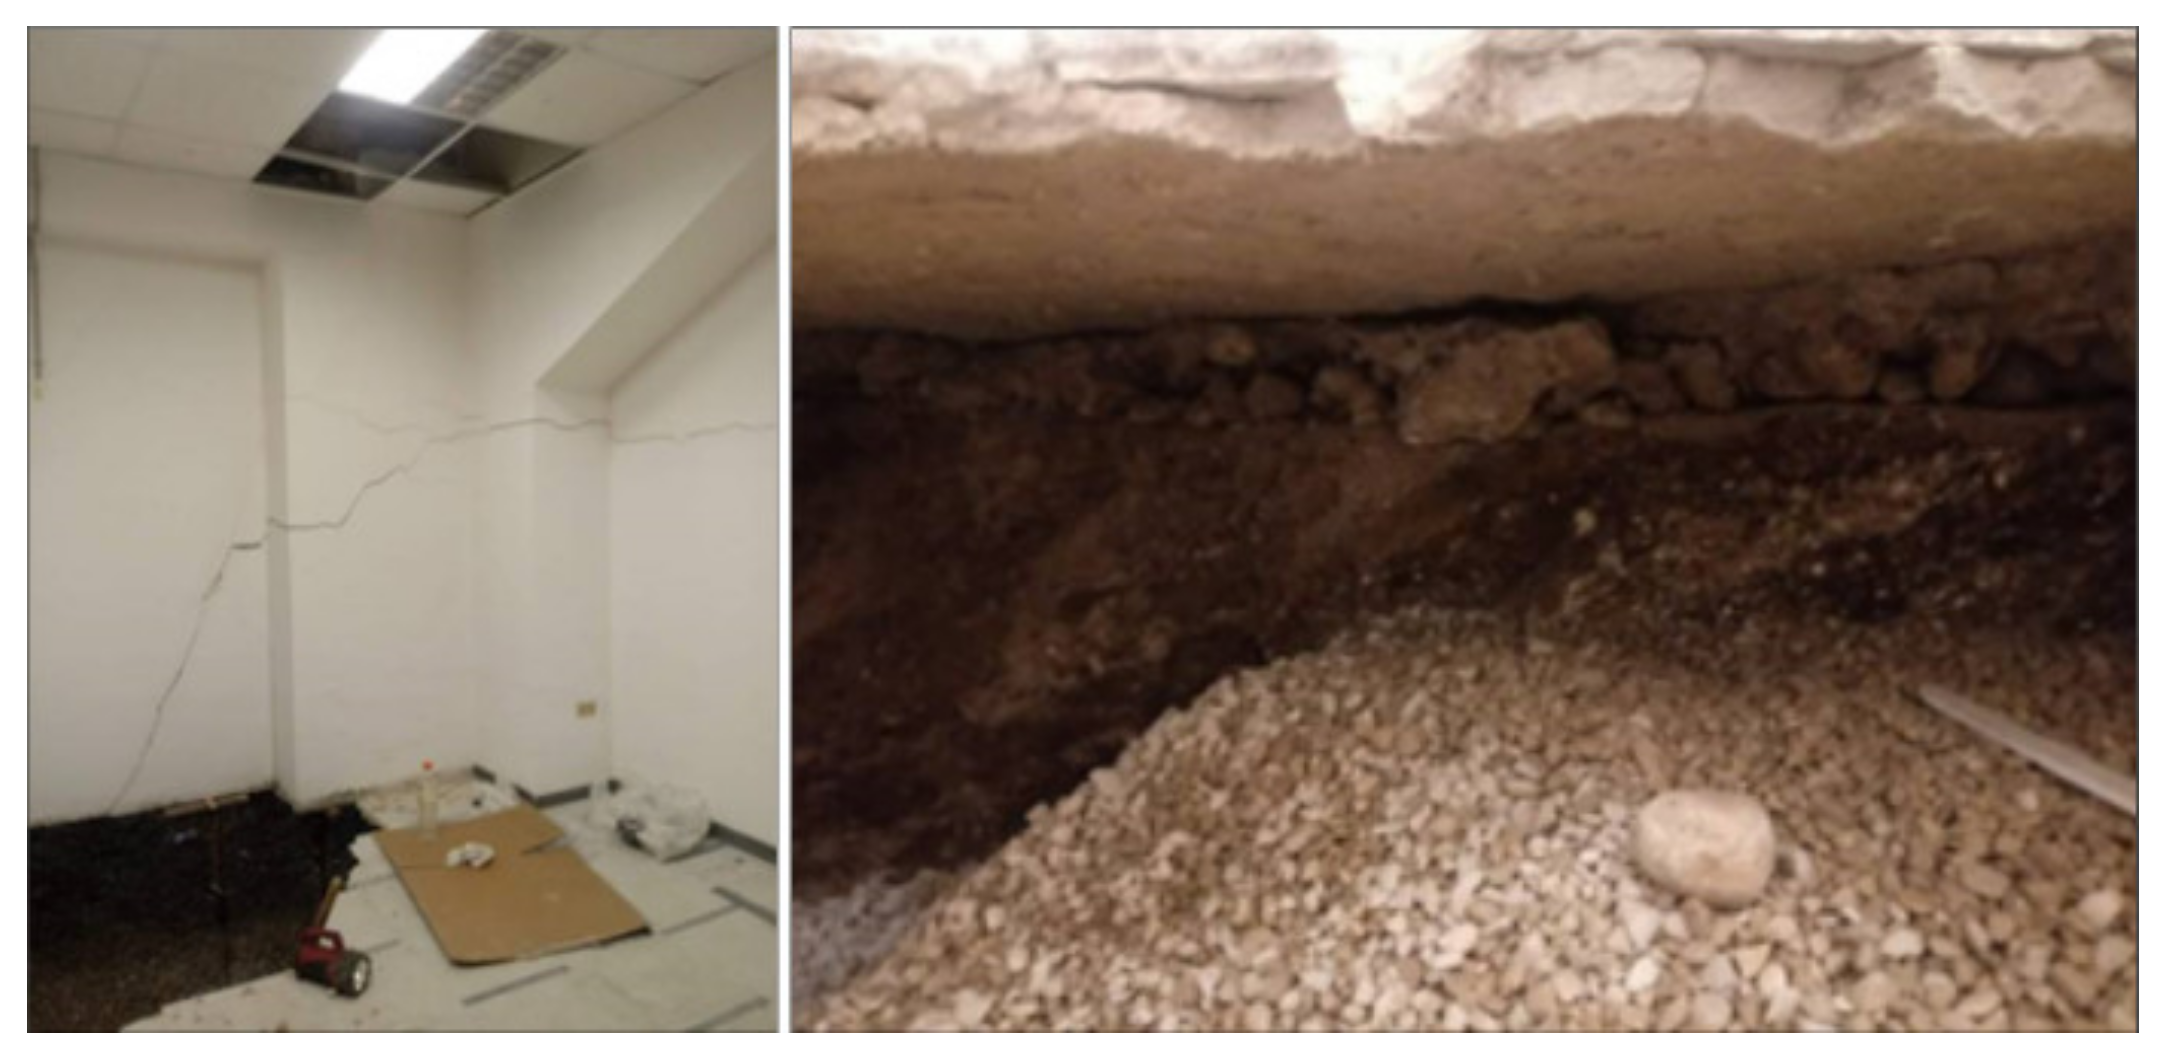
The subsidence is mainly due to the disposal of filtration water from the subsurface drainage system that runs from D’Amico Square to the Madonna del Ponte Cathedral. It is probable that this drainage system has a section that is insufficient to drain all the water flow, creating conditions of oversaturation of the topsoil in conjunction with exceptional rainfall phenomena [
19]. This condition favours the onset of internal filtration motions that can create settings for runoff and transport of fine materials, creating additional voids within the backfill deposits [
20]. In fact, the siphoning phenomena have occurred under the foundation plane of some buildings (
Figure 10).
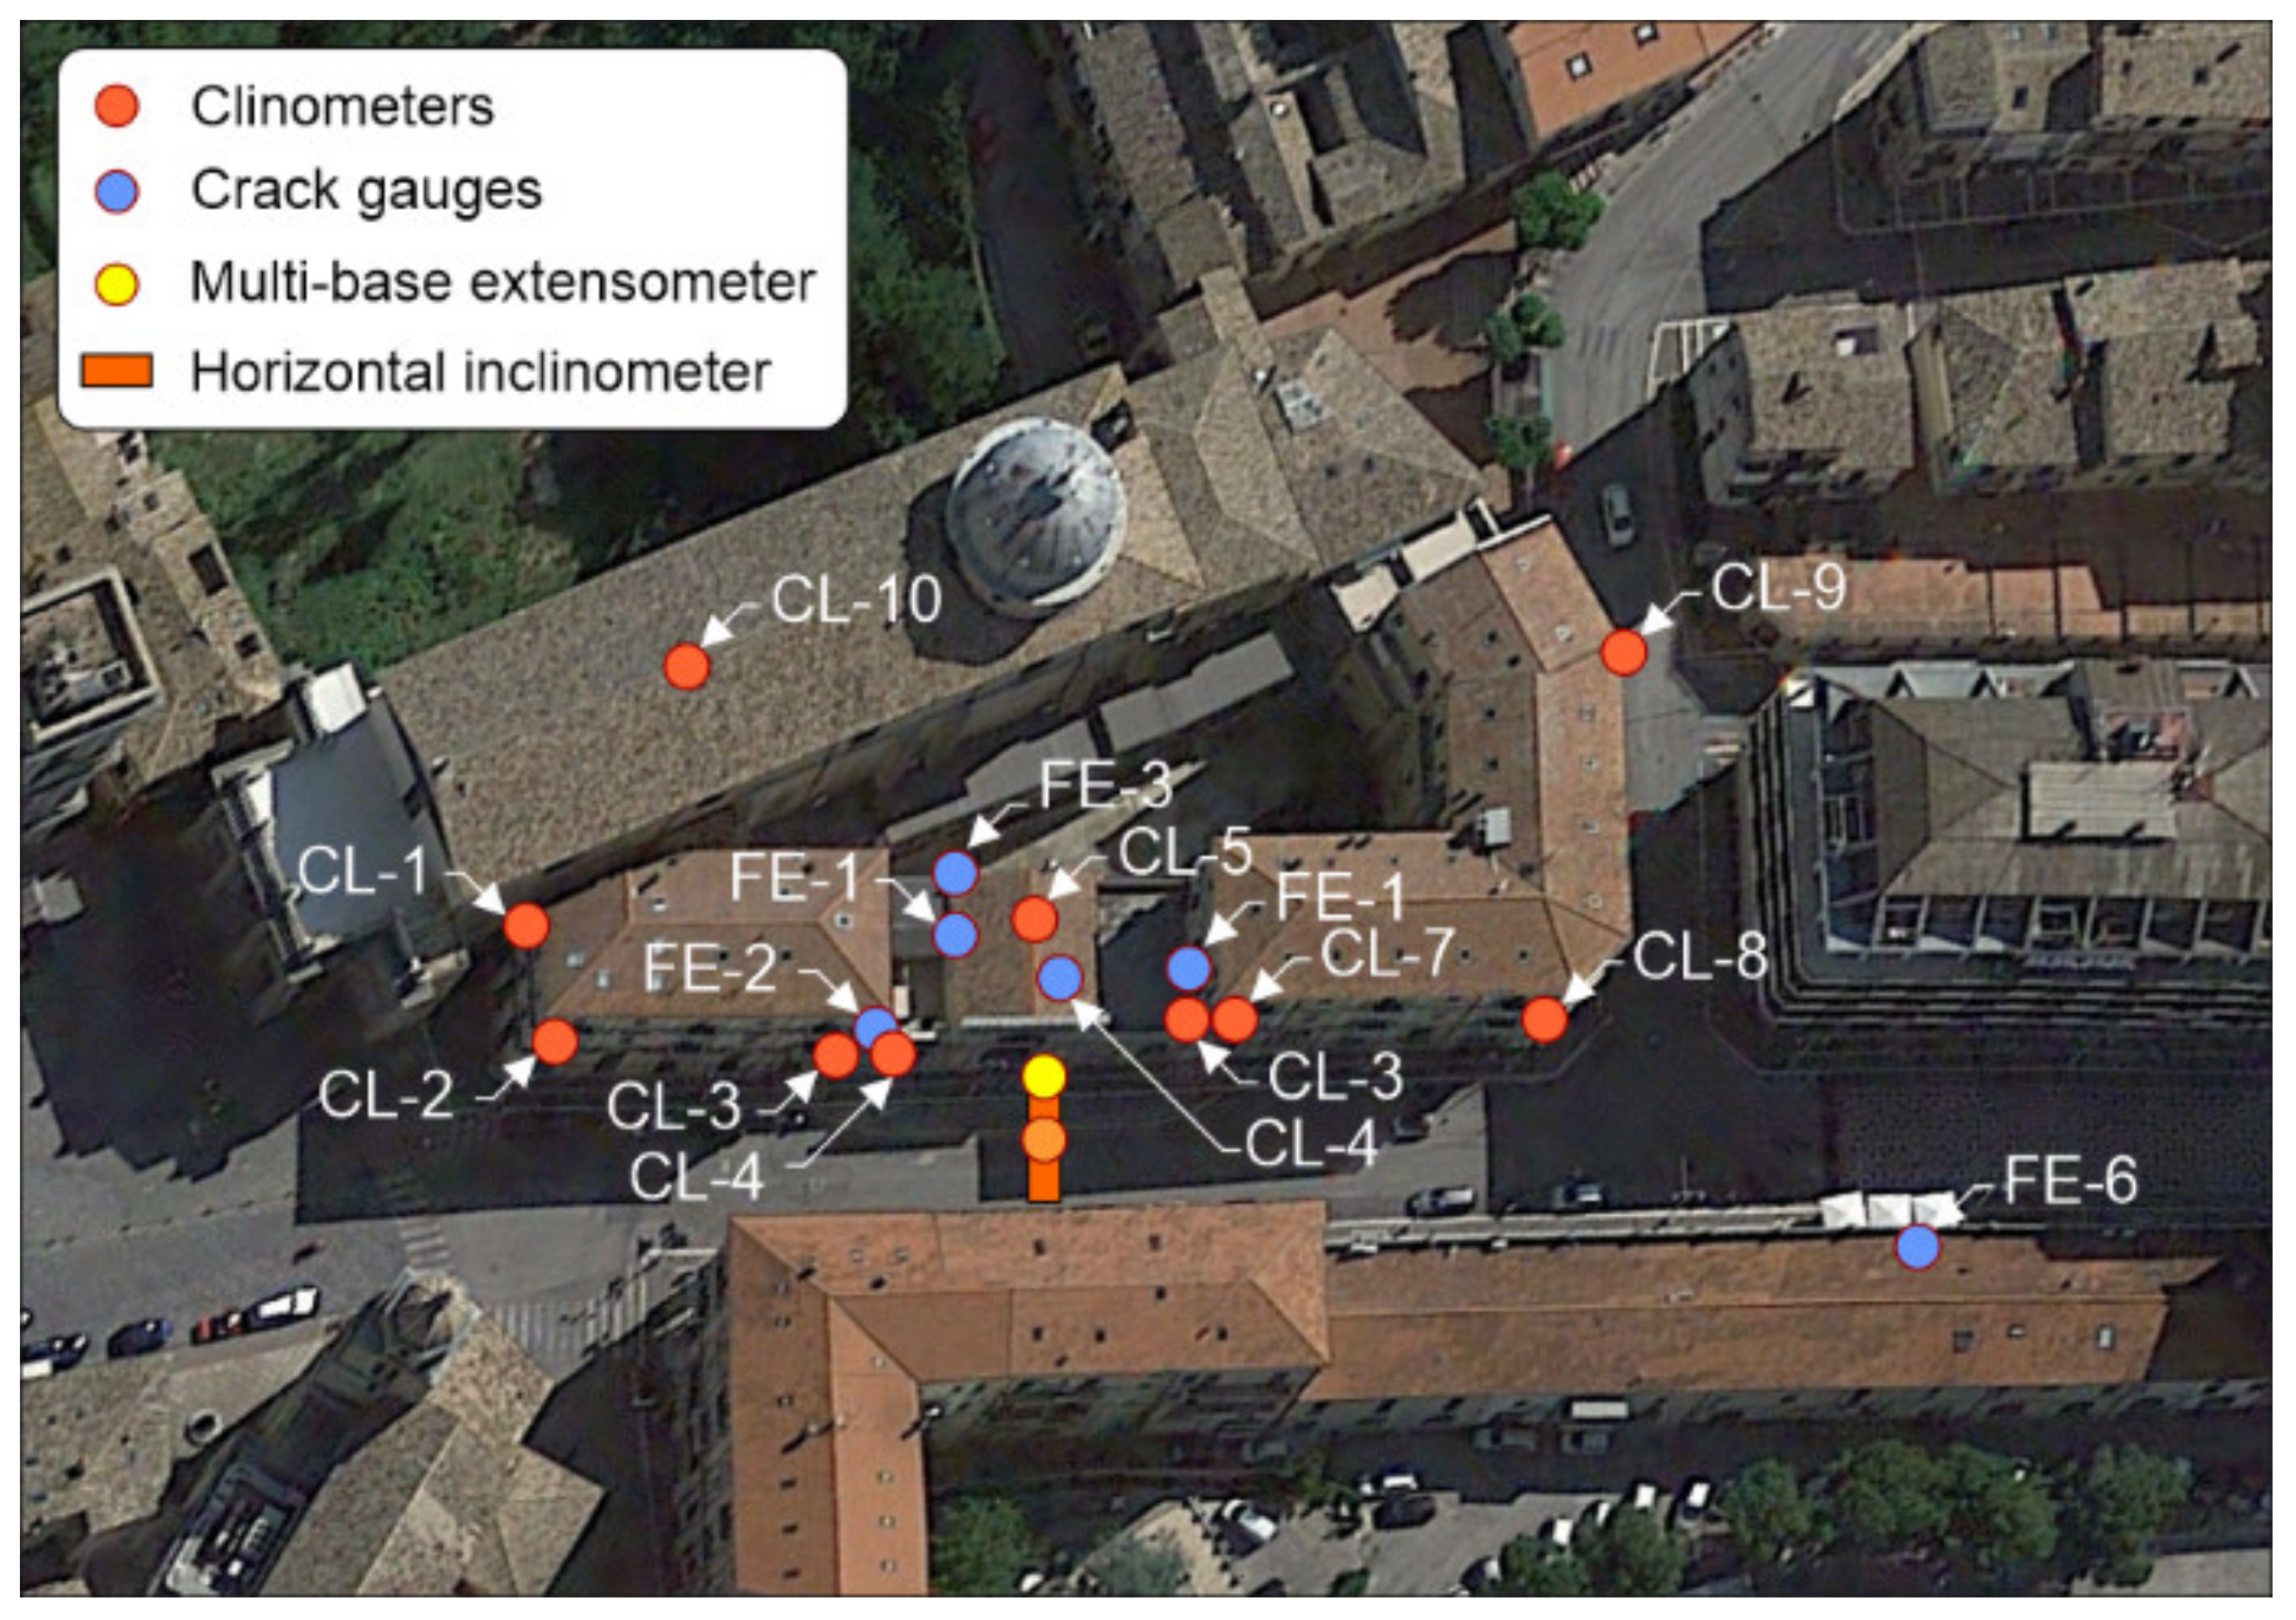
The monitoring network is schematised in
Figure 11; the network consists of crack testers, clinometers and extensometers that update their readings every 3 h. A thermometric sensor is also present to detect the variability of readings as a function of temperature. This is essential for instruments installed outdoors that could be affected by temperature changes in a non-negligible way.
We report below some of the data acquired to extract some elements of interest that highlight the possible evolutive trend of active deformation phenomena.
Clinometers—Ten clinometers were installed (orange marks in
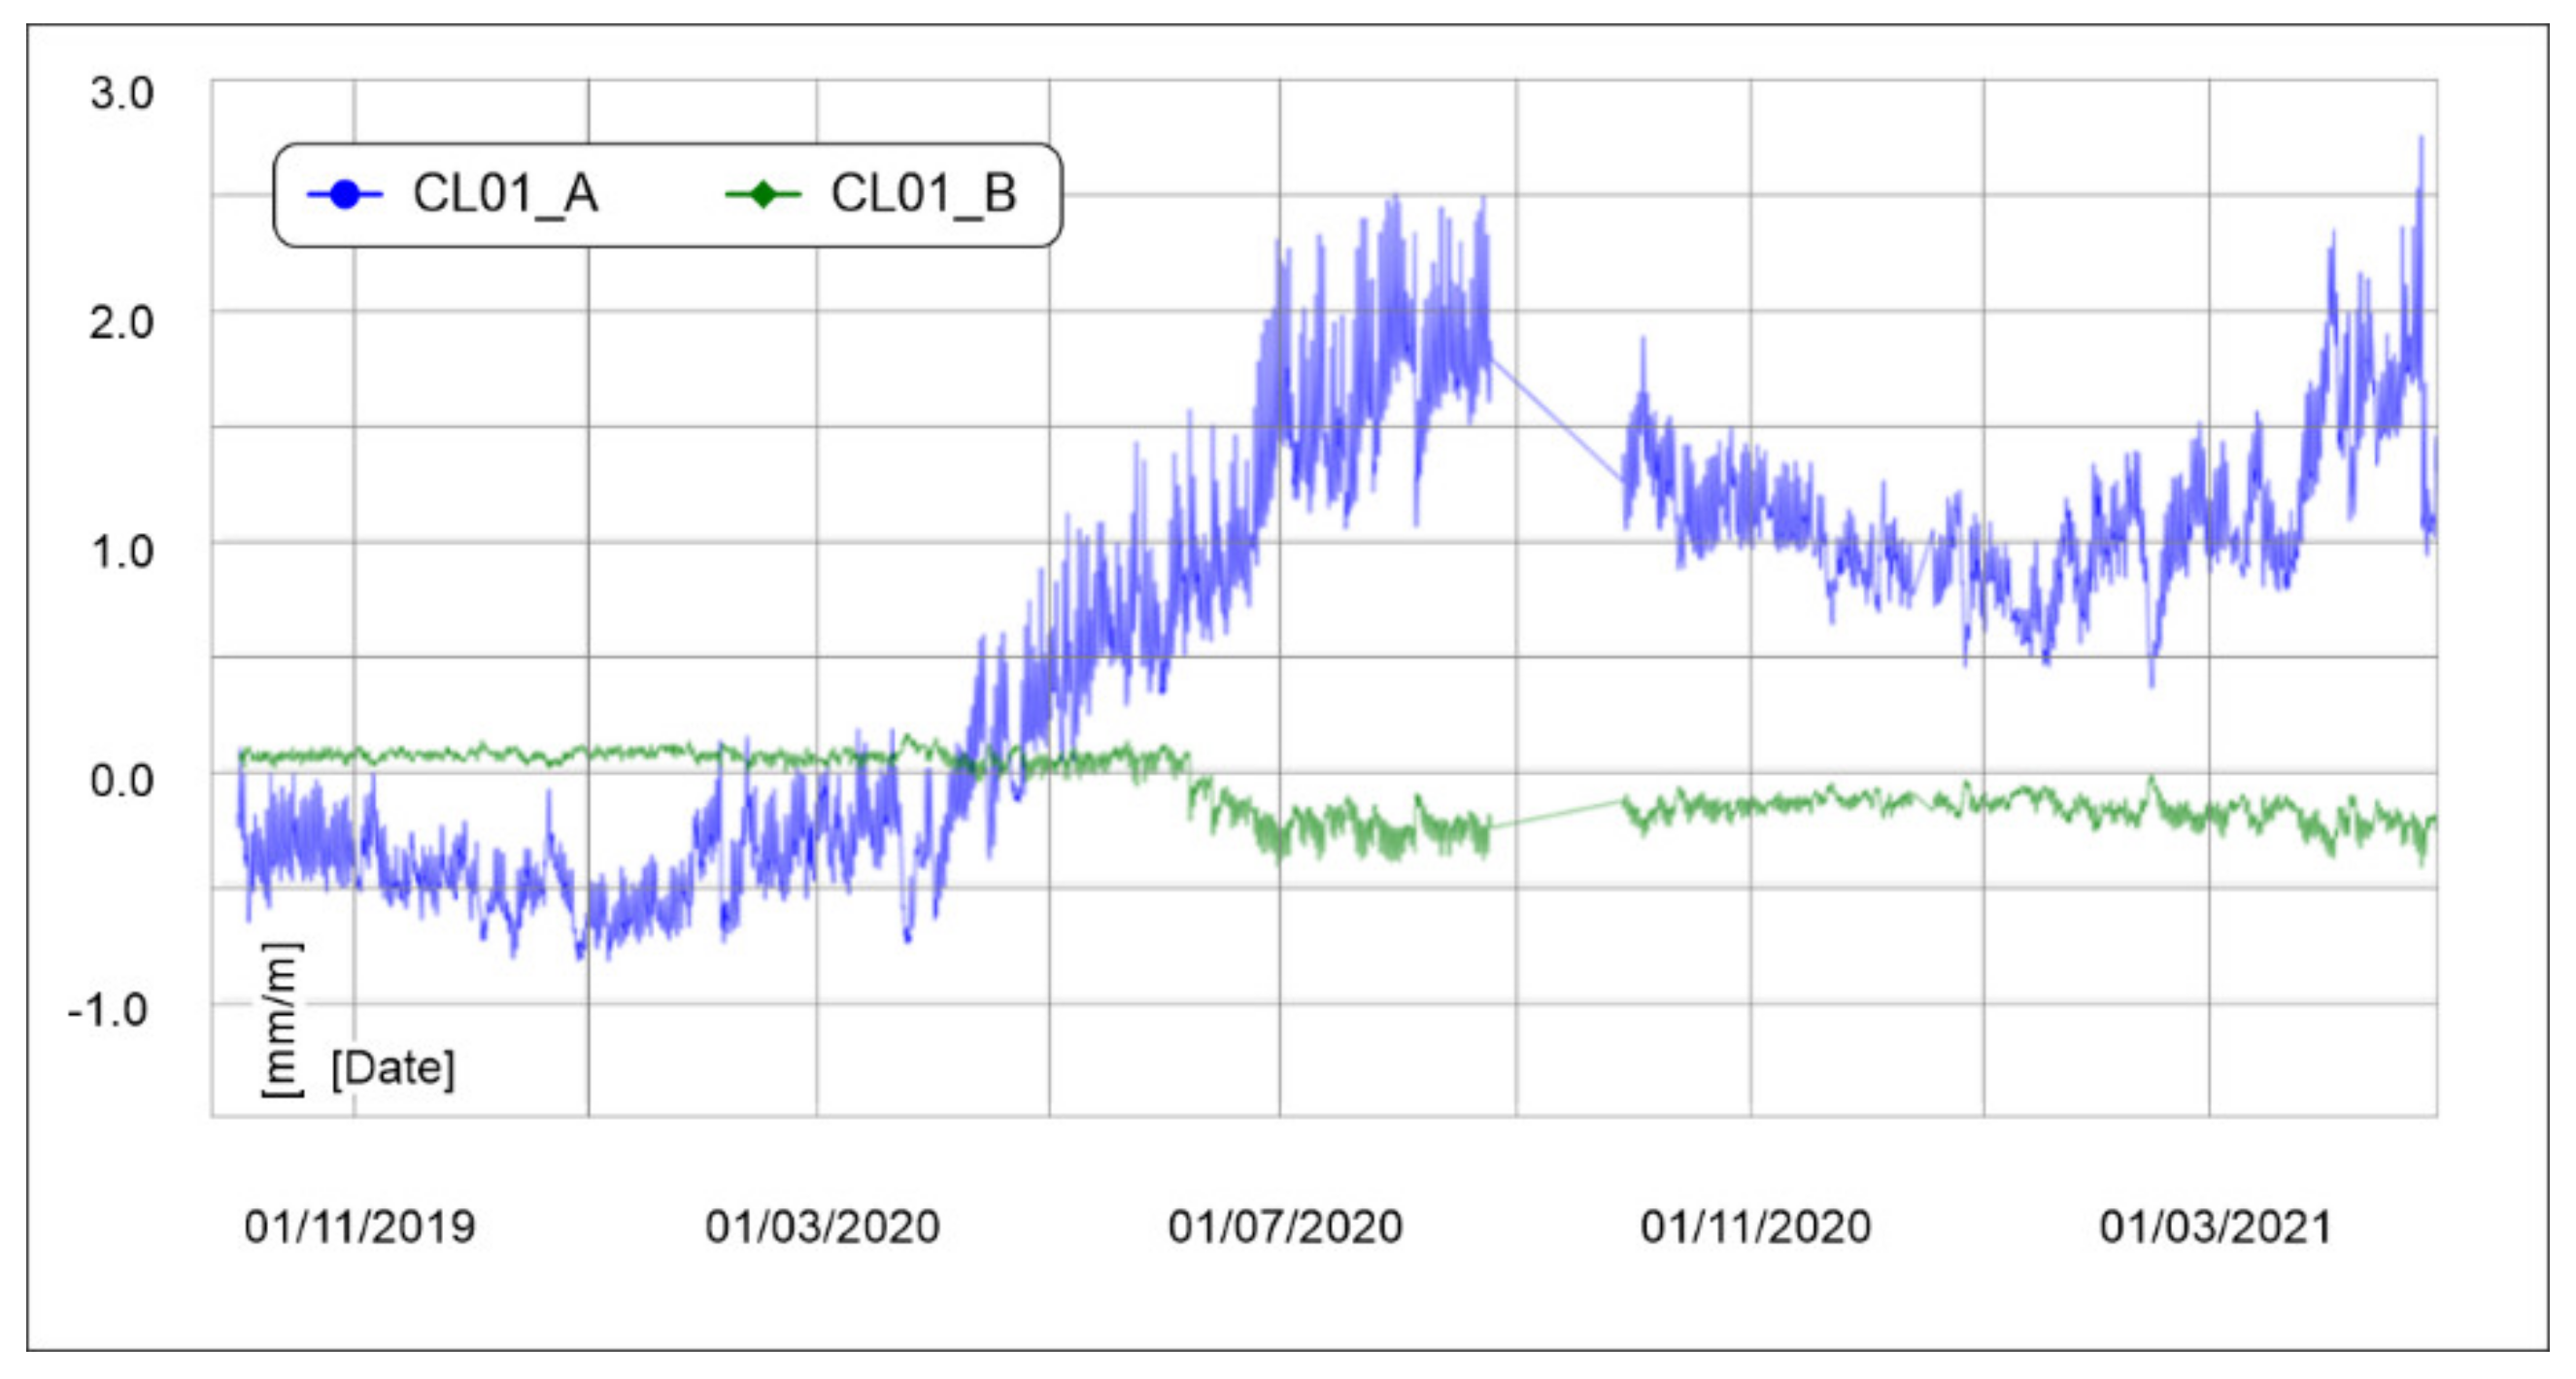
Figure 12). We comment below on the results of some of them (CL01, CL02, CL05 and CL08) their behaviour being congruent with in-situ evidence and being the most representative. The CL01 clinometer (
Figure 13) is located on the external wall of the Madonna del Ponte Cathedral, on the Trento-Trieste Avenue side. This sensor has recorded, in the observation period, zero deformation from October 2019 to April 2020, and then evolved up to 2.5 mm/m (circa 0.14°) until September 2020. Following that, the deformation then stabilized and remained stationary.
The CL02 clinometer (
Figure 13) is positioned on the external wall of the first building at the bottom of Corso Trento e Trieste. The sensor showed a continuous evolutive trend during the observation period. The recorded deformation is 0.65 mm/m (about 0.04°) in the period October 2019-May 2021, which, though continuous, is very small. These deformations match with the registrations of other sensors positioned along the same street.
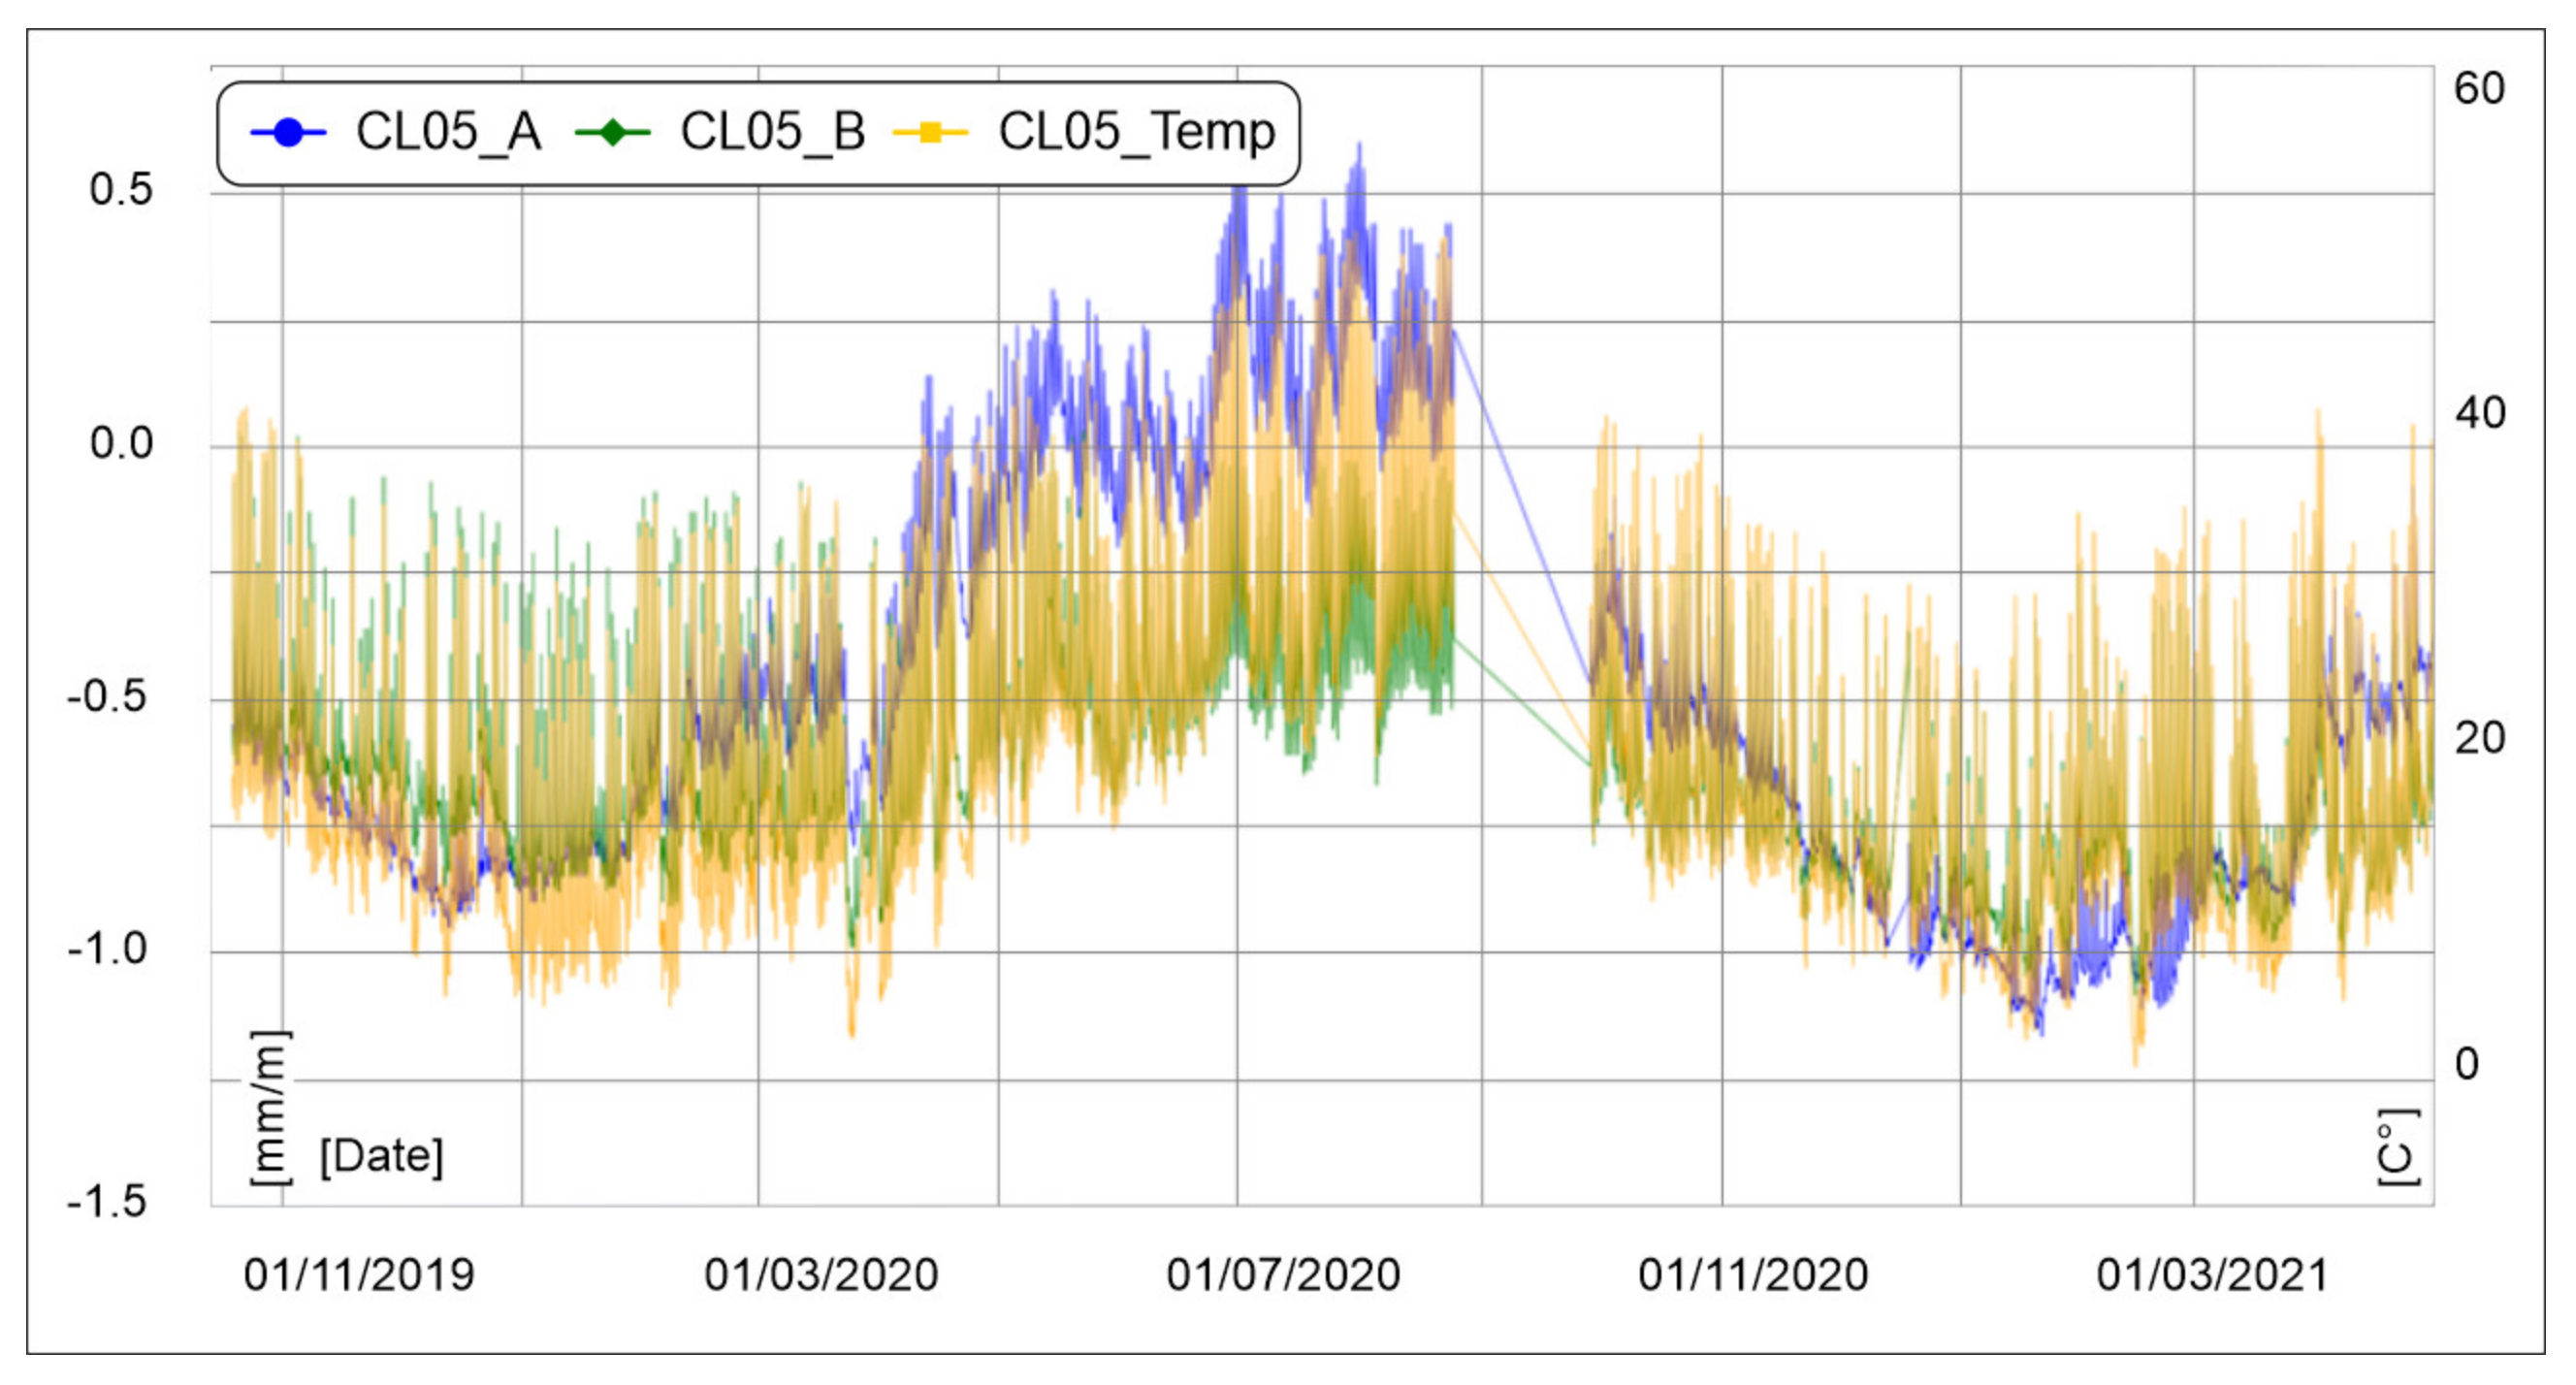
The CL05 clinometer (
Figure 14), positioned on the external wall of a building at Corso Trento e Trieste, showed general stability during the observation period. This statement is confirmed by the sinusoidal trend of the deformation which is strongly dependent on variations of temperature. In fact, the graph of
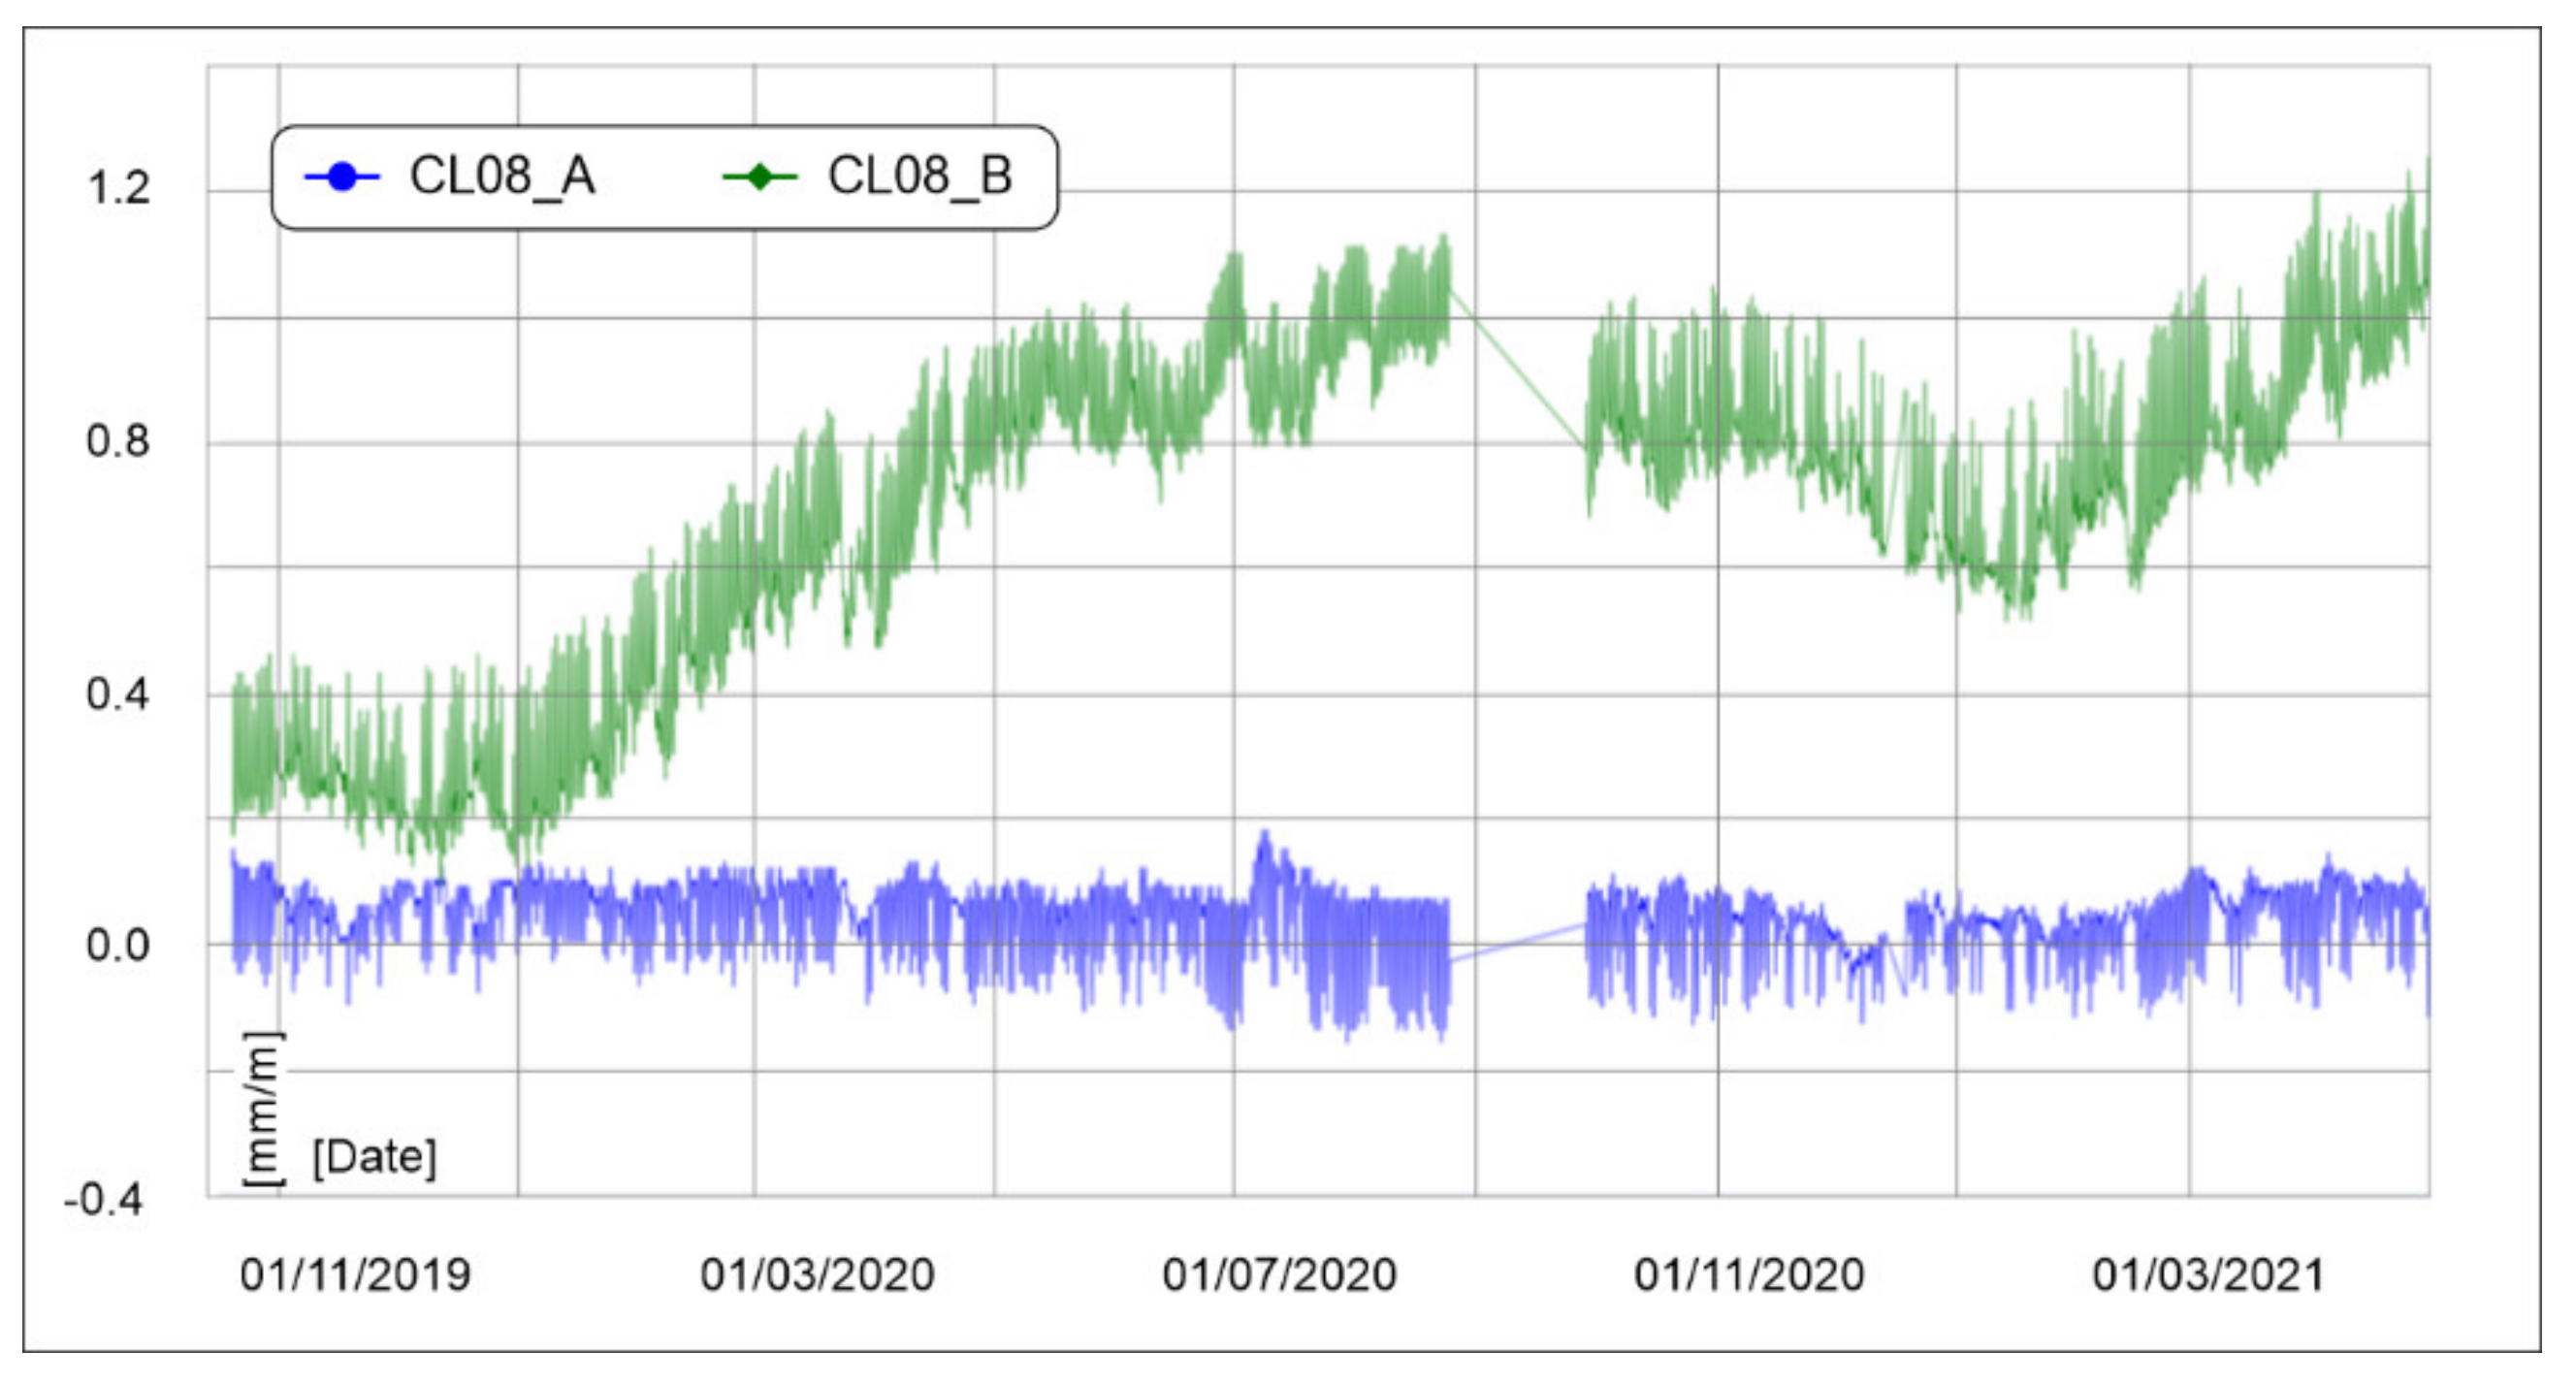
Figure 14 also shows the temperature variation for the entire observation period (yellow curve). Another interesting sensor is the CL08 (
Figure 15). It is located on the outside of the building at the corner of Corso Trento e Trieste and Salita della Posta Street. In the first period, it remained substantially stable. Between January and July 2020, it underwent a slight deformation, which then stabilised until January 2021, even showing a weak recovery. Since January 2021, it showed a constant evolutionary trend. This trend is similar with that shown in the CL01 and CL02 clinometers.
Crack gauges—Crack gauges are monitoring instruments that show the change in width of fractures along the installation line of the instrument. These instruments are positioned along Corso Trento e Trieste area (blue marks in
Figure 11). The diagrams of the Fe03 and Fe05 crack gauges are most significant because they monitor some cracks present inside the buildings that have undergone subsidence phenomena. The Fe03 (
Figure 16) shows a sinusoidal trend congruent with temperature variations.
These temperatures are relative to an indoor room that has not undergone any unnatural heating or cooling during the period of measurement (the room is uninhabited). The fluctuation is typical of a behaviour that is only related to thermal variations. The Fe05 is located at a strategic point of the monitoring. The instrument records the vertical displacements of a wall bordering two adjacent buildings. It was placed at the vertical part of the building, which experienced displacement after the events of 22 June 2018. The acquired data show some unusual points (red circle in
Figure 17), probably due to instrumental errors.
The anomalous data were eliminated and, to reduce the fluctuation, the data were elaborated using moving averages of twentieth order, which are acceptable since the data available exceed 4000 records. The result is shown in
Figure 18.
In particular, from uninterpretable data, it is possible to obtain a series of values that show with more clarity the variability of the displacements recorded (
Figure 18). In addition, for the Fe05, overlaying the data of the crack meter on those of temperature, the variations are only affected by thermal variations.
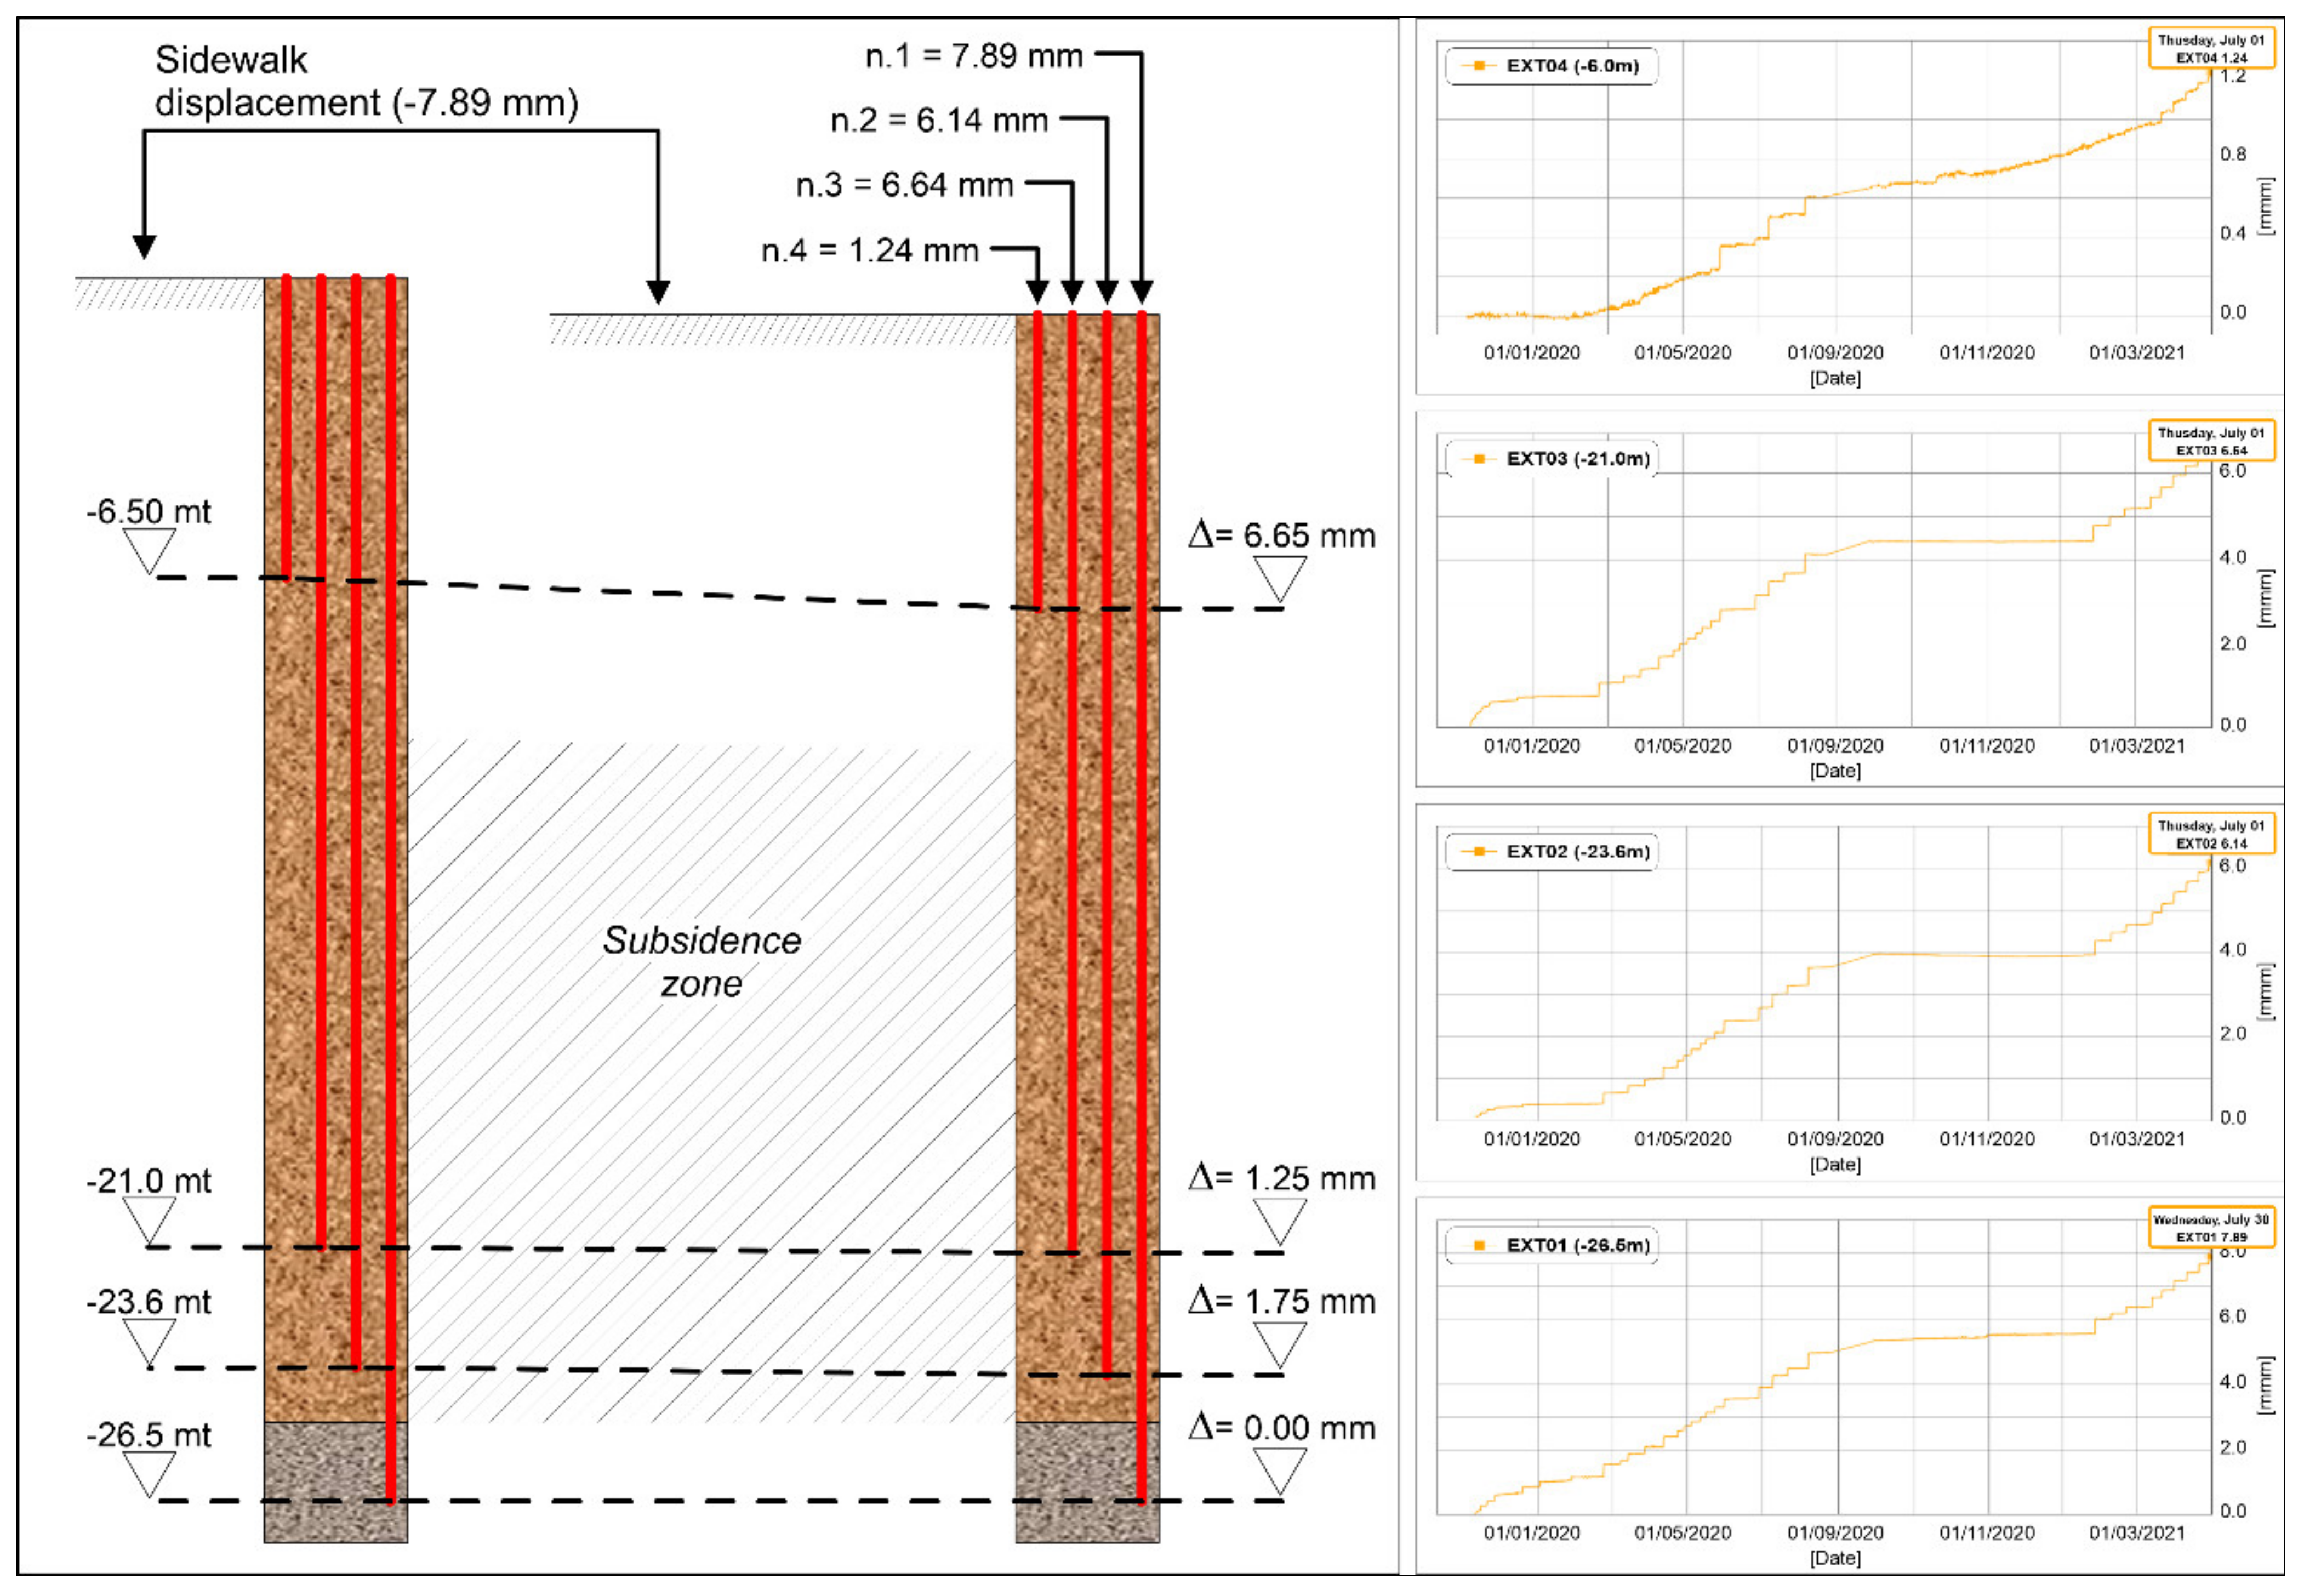
Multi-base extensometer—A multi-base extensometer was positioned at the sidewalk adjacent to the building that suffered the greatest deformations (
Figure 19). The equipment was installed with a set of four strain gauges. Three bars are entirely inside the backfill deposits, while only the fourth is anchored within the intact subsoil (sands).
This multi-base extensometer was used to record the soil subsidence from the topographic surface to the base. The bars are anchored at −6.5, −21.0, −23.6, and −26.5 m from the top, and positioned on perfect verticality. The values recorded show that all the bars have had deformations (
Figure 19). From October 2019 to July 2021, subsidence of 1.24, 6.64, 6.14, and 7.89 mm were recorded. The interpretation of these data leads to the conclusion that the backfill zone is still subject to subsidence phenomena that are mainly concentrated between −10.0 and −25.0 m depth. The most superficial extensometer (n.4) has undergone small deformation compared to the others having been dragged entirely downwards. The two intermediate crack gauges show the same behaviour with similar subsidence.
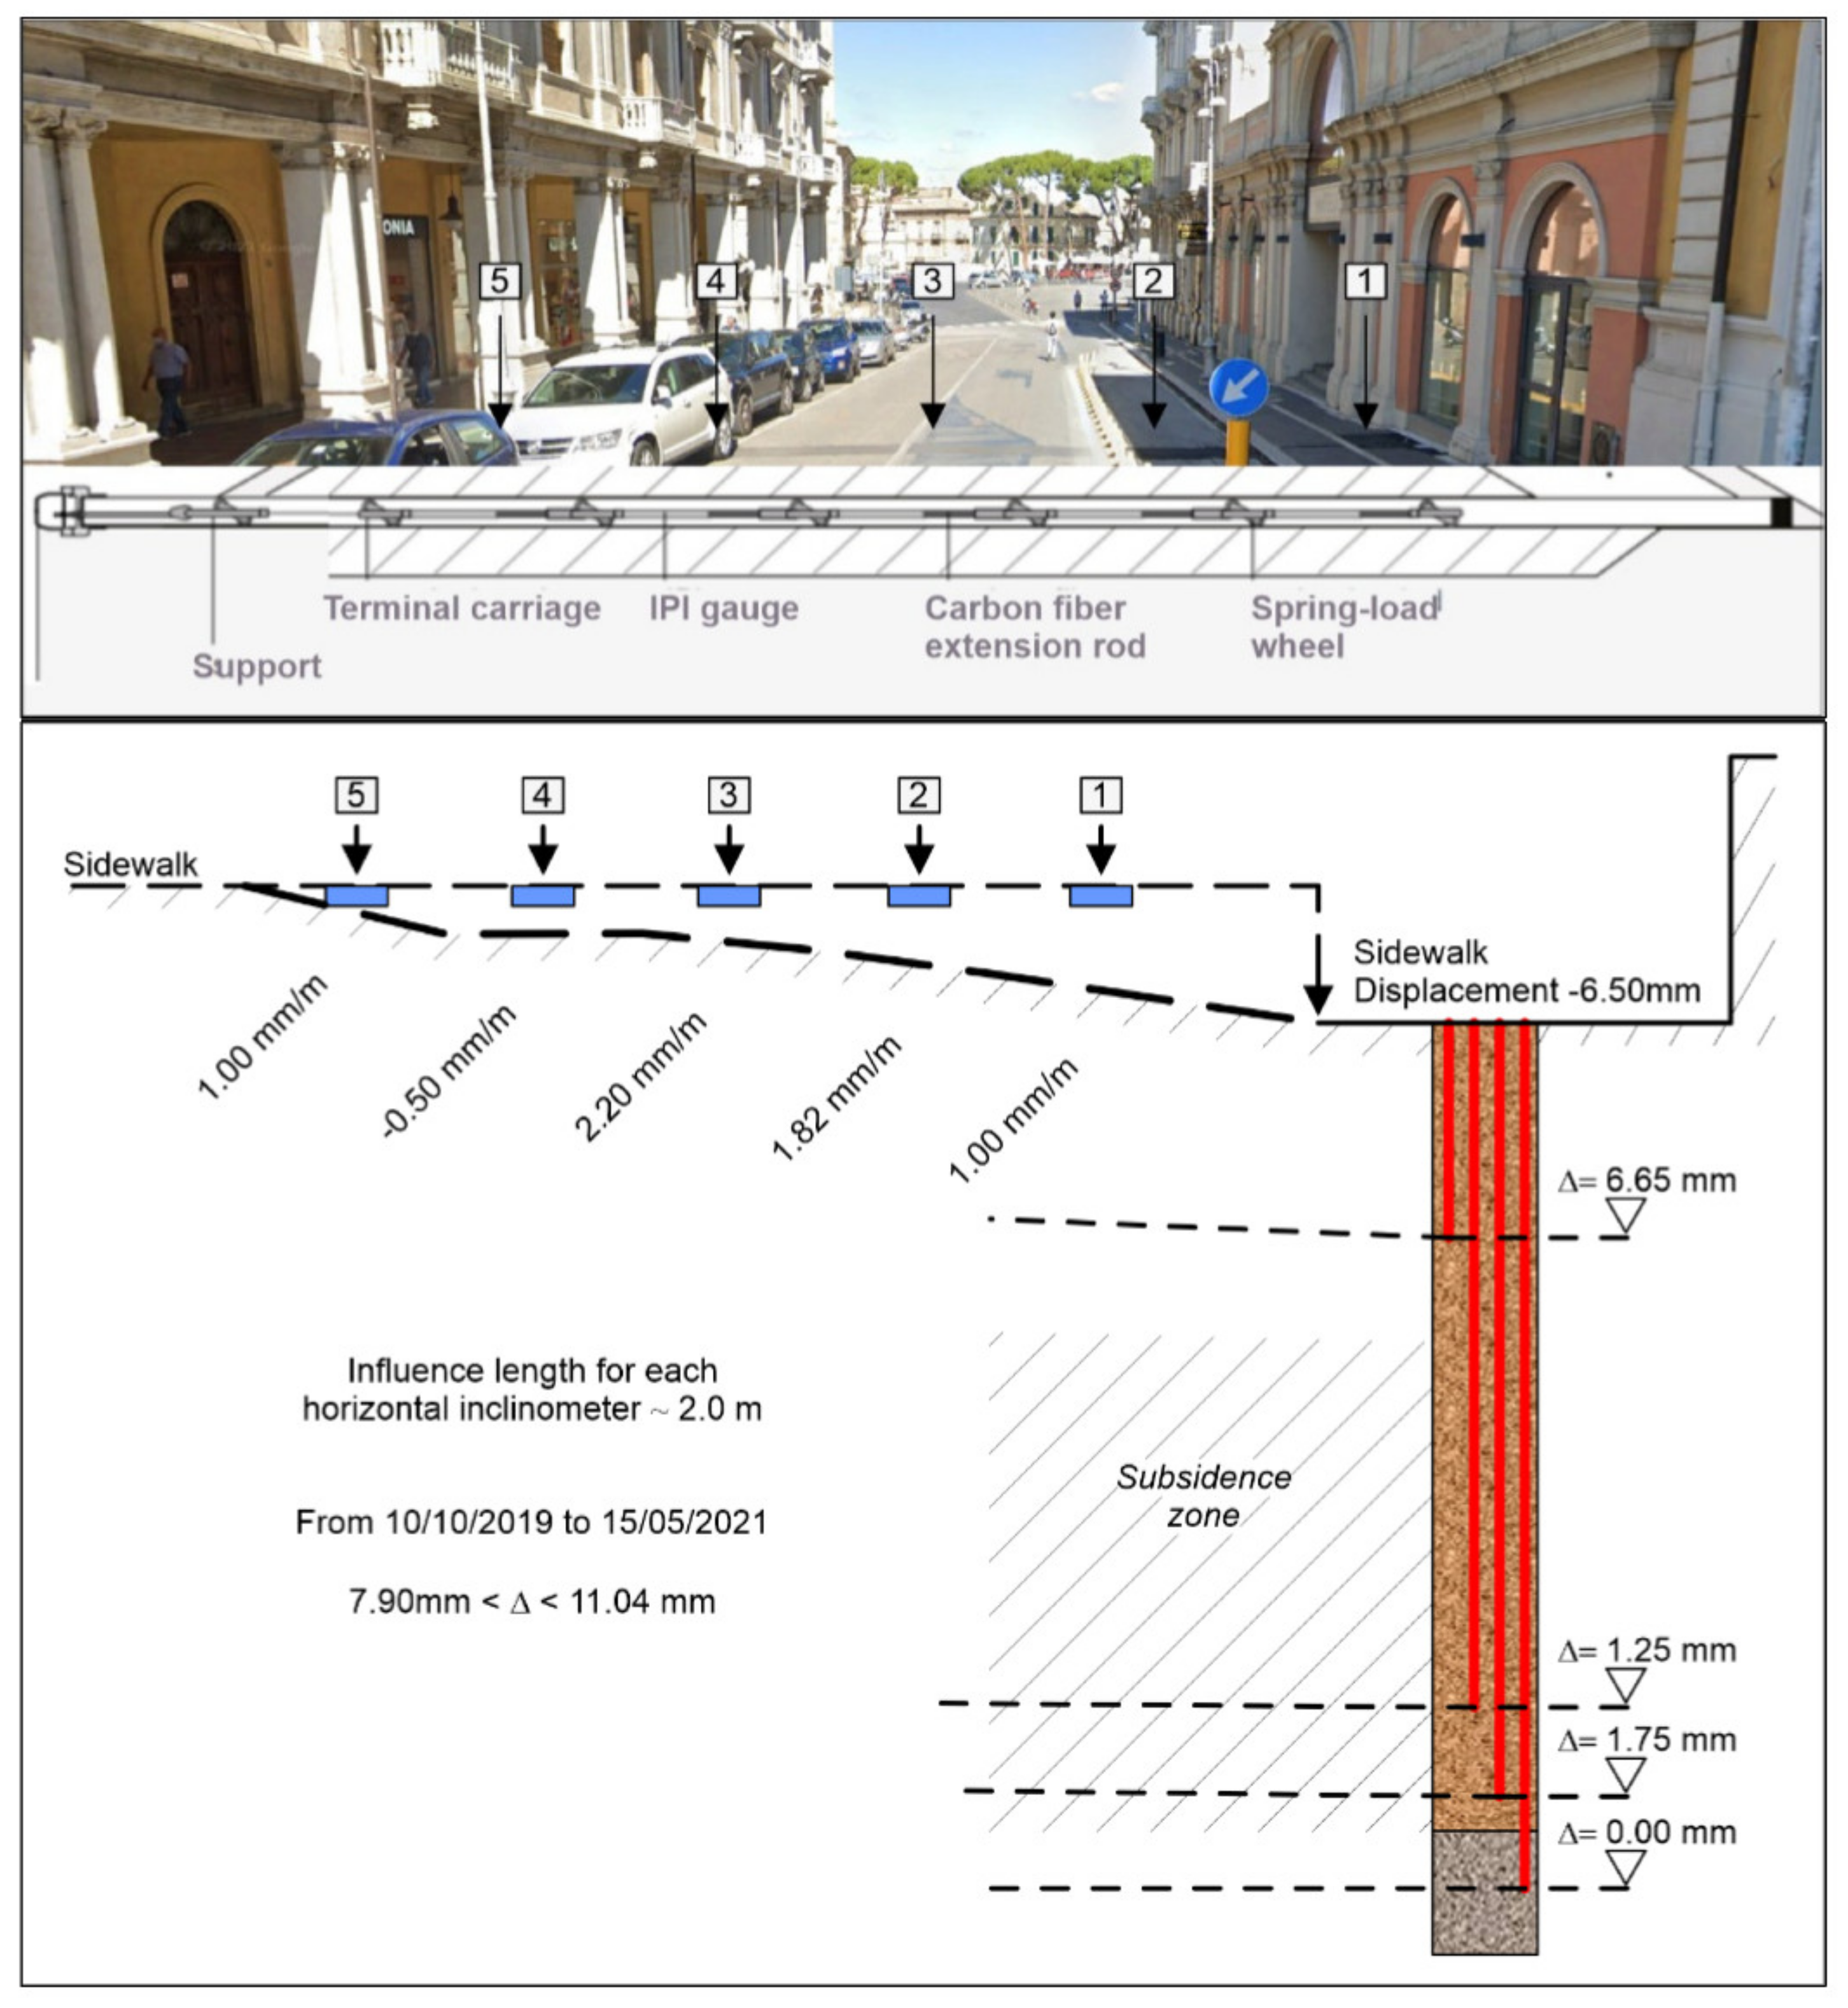
Horizontal inclinometer—Along Trento and Trieste Avenue, between two opposite sidewalks, five horizontal inclinometers were installed (
Figure 20). For major precision in the interpretation of the results, the instruments were positioned in correspondence with the multi-base extensometers. All measures show continuous progressive deformations; the most deformed are n.1, n.3 and n.5. The vertical displacement is very evident, both in the horizontal inclinometers and in the extensometer results. In fact, in both instruments, the subsidence phenomena are evident in the area where the 2018 post-flood problems occurred. In
Figure 20 it is also possible to observe this correlation that highlights how the settlement of the ground is between about 7.9 mm (extensometers) and 11.04 mm (summation of the data recorded by the inclinometers).
4. 3D Numerical Simulation and Results
After the reconstruction of the geological model of the subsoil and ascertainment that the deformation of the soil is still active, an analysis of the hydraulic flows that have caused, and could still cause, phenomena of instability was carried out [
21,
22]. We used the finite element code Midas GTS/NX (MIDAS Geotechnical Analysis System) to generate 3D numerical analysis. The target is the rebuild of the flow direction and the interaction with the underground structures [
23,
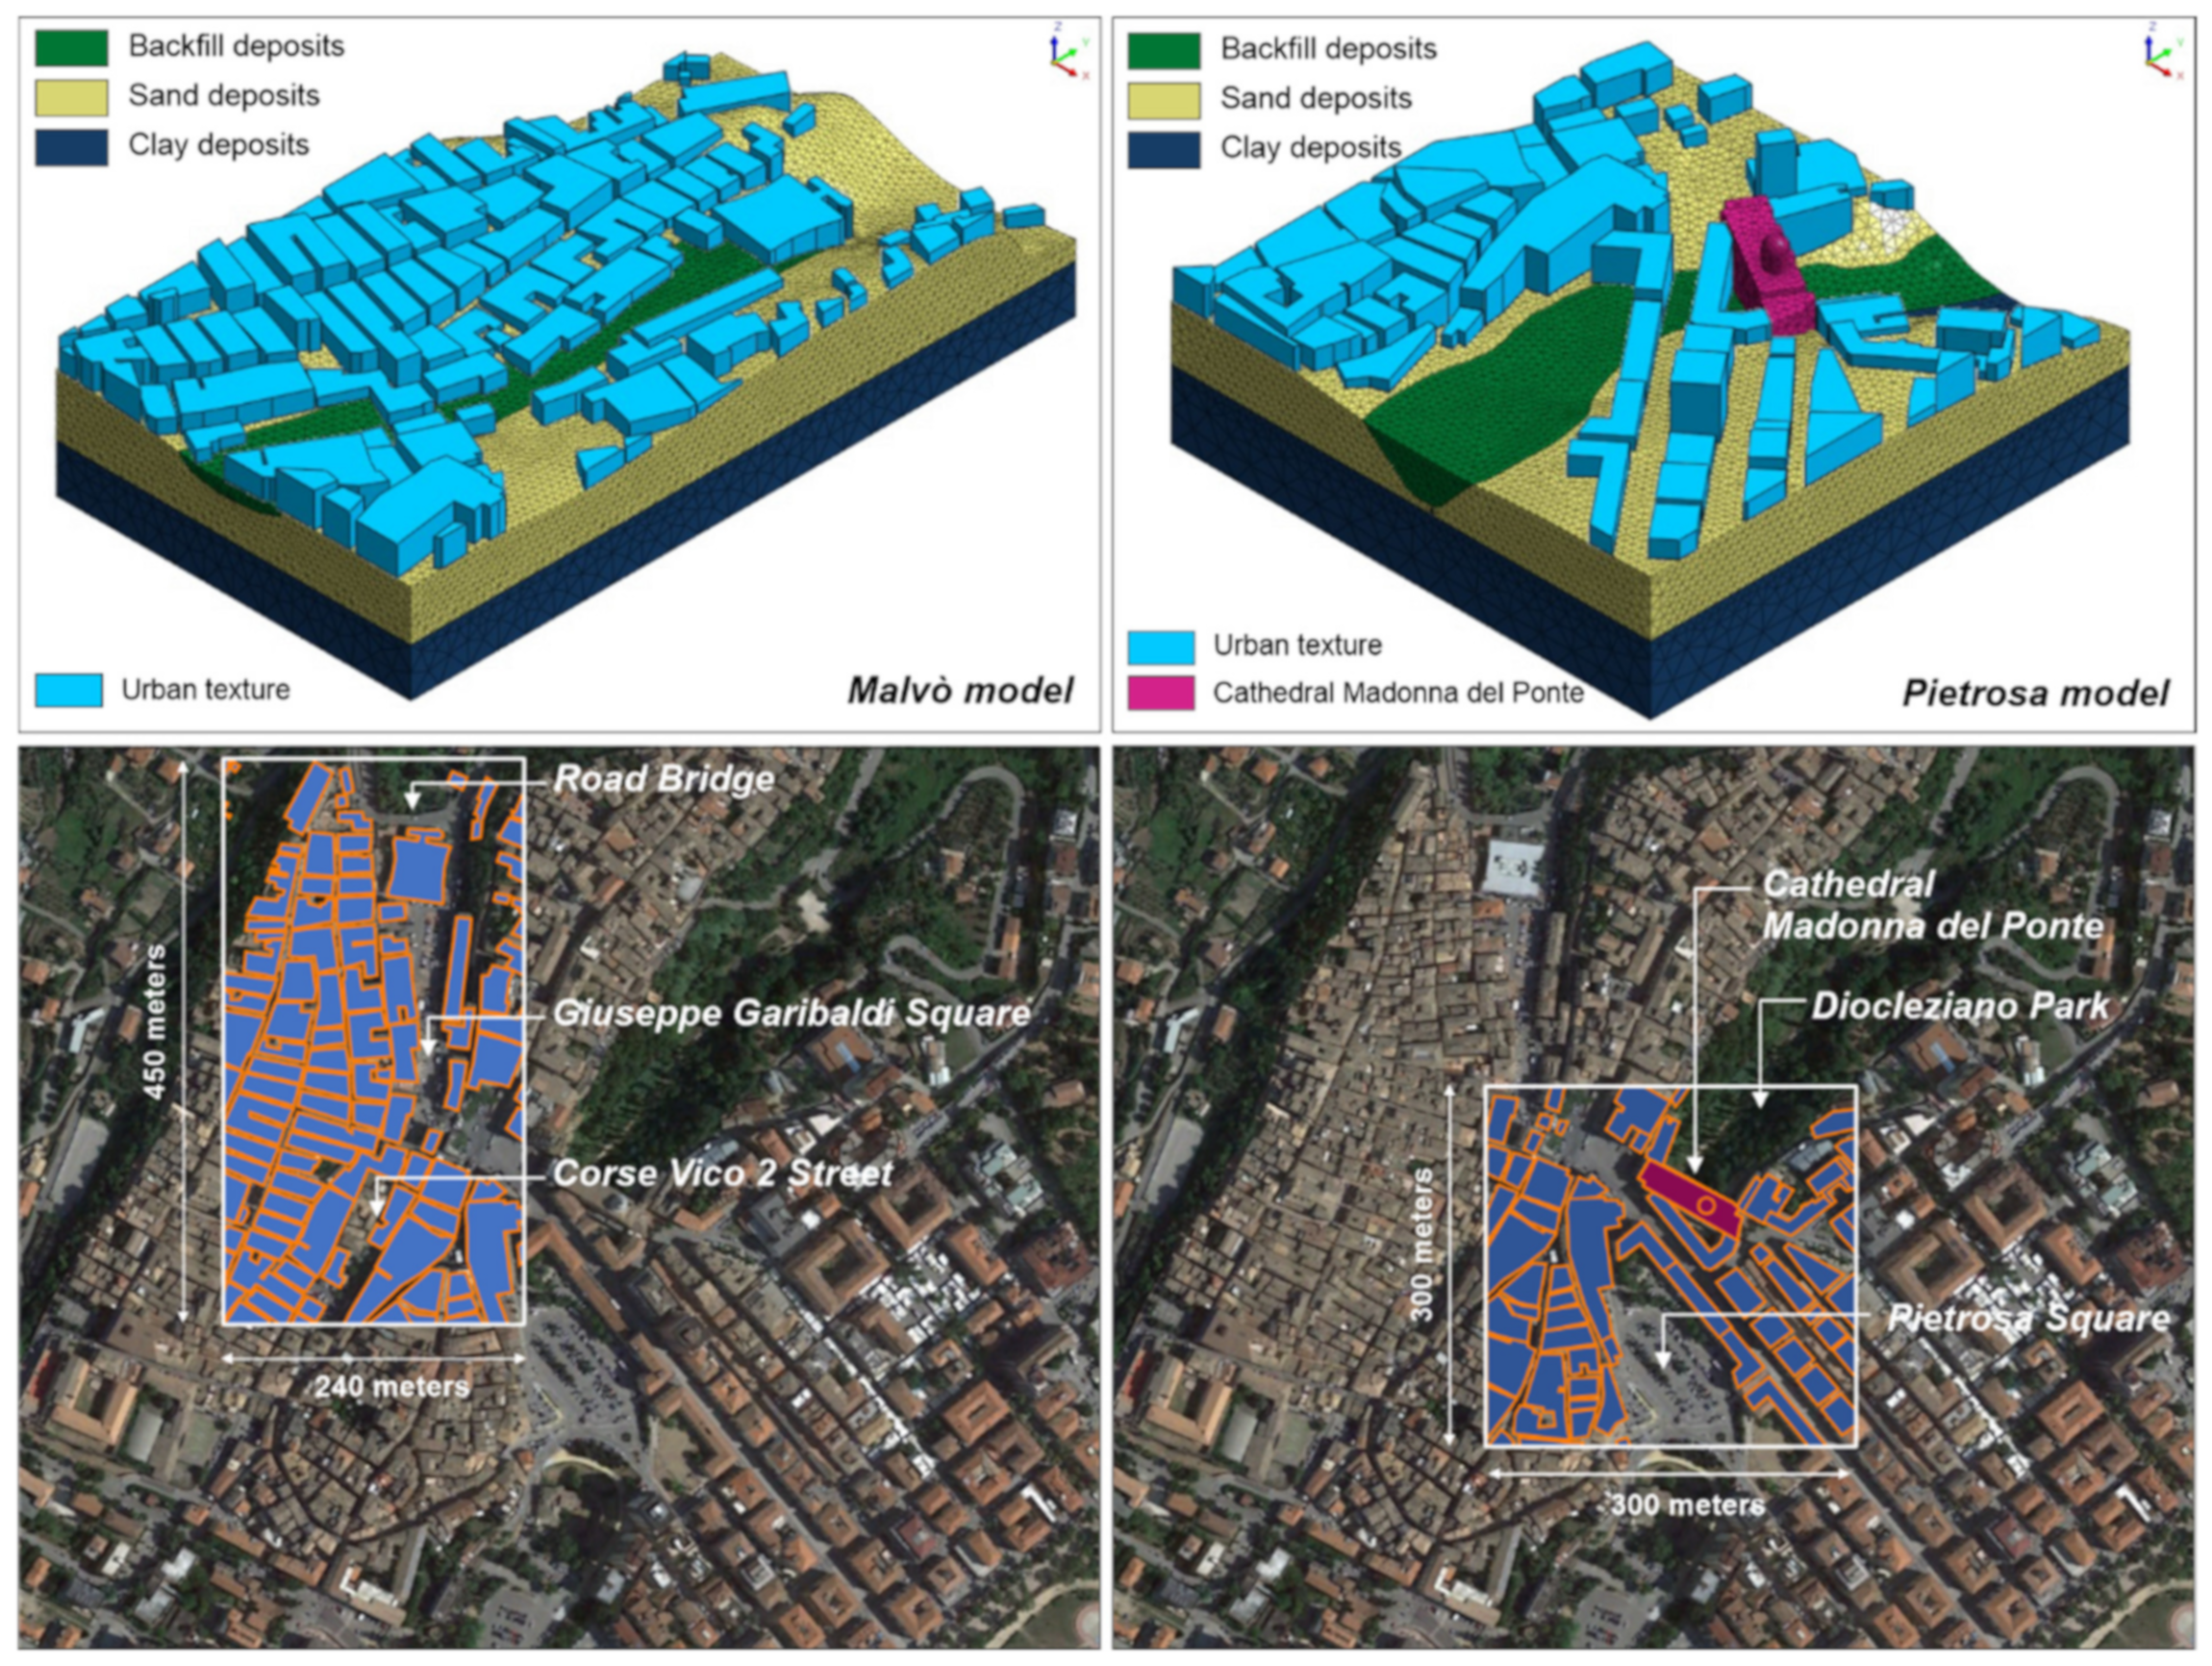
24]. Two geological models were studied: Pietrosa ditch, with a plan size of 300 m × 300 m, and the Malvò ditch, with a plan size of 240 m × 450 m. Both models have variable height as a function of the real topographic shapes [
25]. The computational models used in the calculation are shown in
Figure 21.
The canal flows out under the bridge and is subsequently buried under the current Diocleziano Park [
26,
27]. This structure is very interesting, both for its geometry and for its position with respect to the surrounding area, because it constitutes a barrier to the natural runoff of the aquifers [
28,
29]. In
Figure 22, the geological model is shown. The 3D-Mesh was built with tetragonal elements of constant size combined with elements of variable size. The different size is gradual from 2.0 m (in the most superficial layer) to 5.0 m (in the basic layer) with greater precision in the areas surrounding the cathedral. The 3D-Mesh of the cathedral structure and of the bridge was carried out, giving greater importance to its planimetric shape, to understand the volumes busy in the Pietrosa ditch. Similar geometrical problems are present in the Malvò model too (
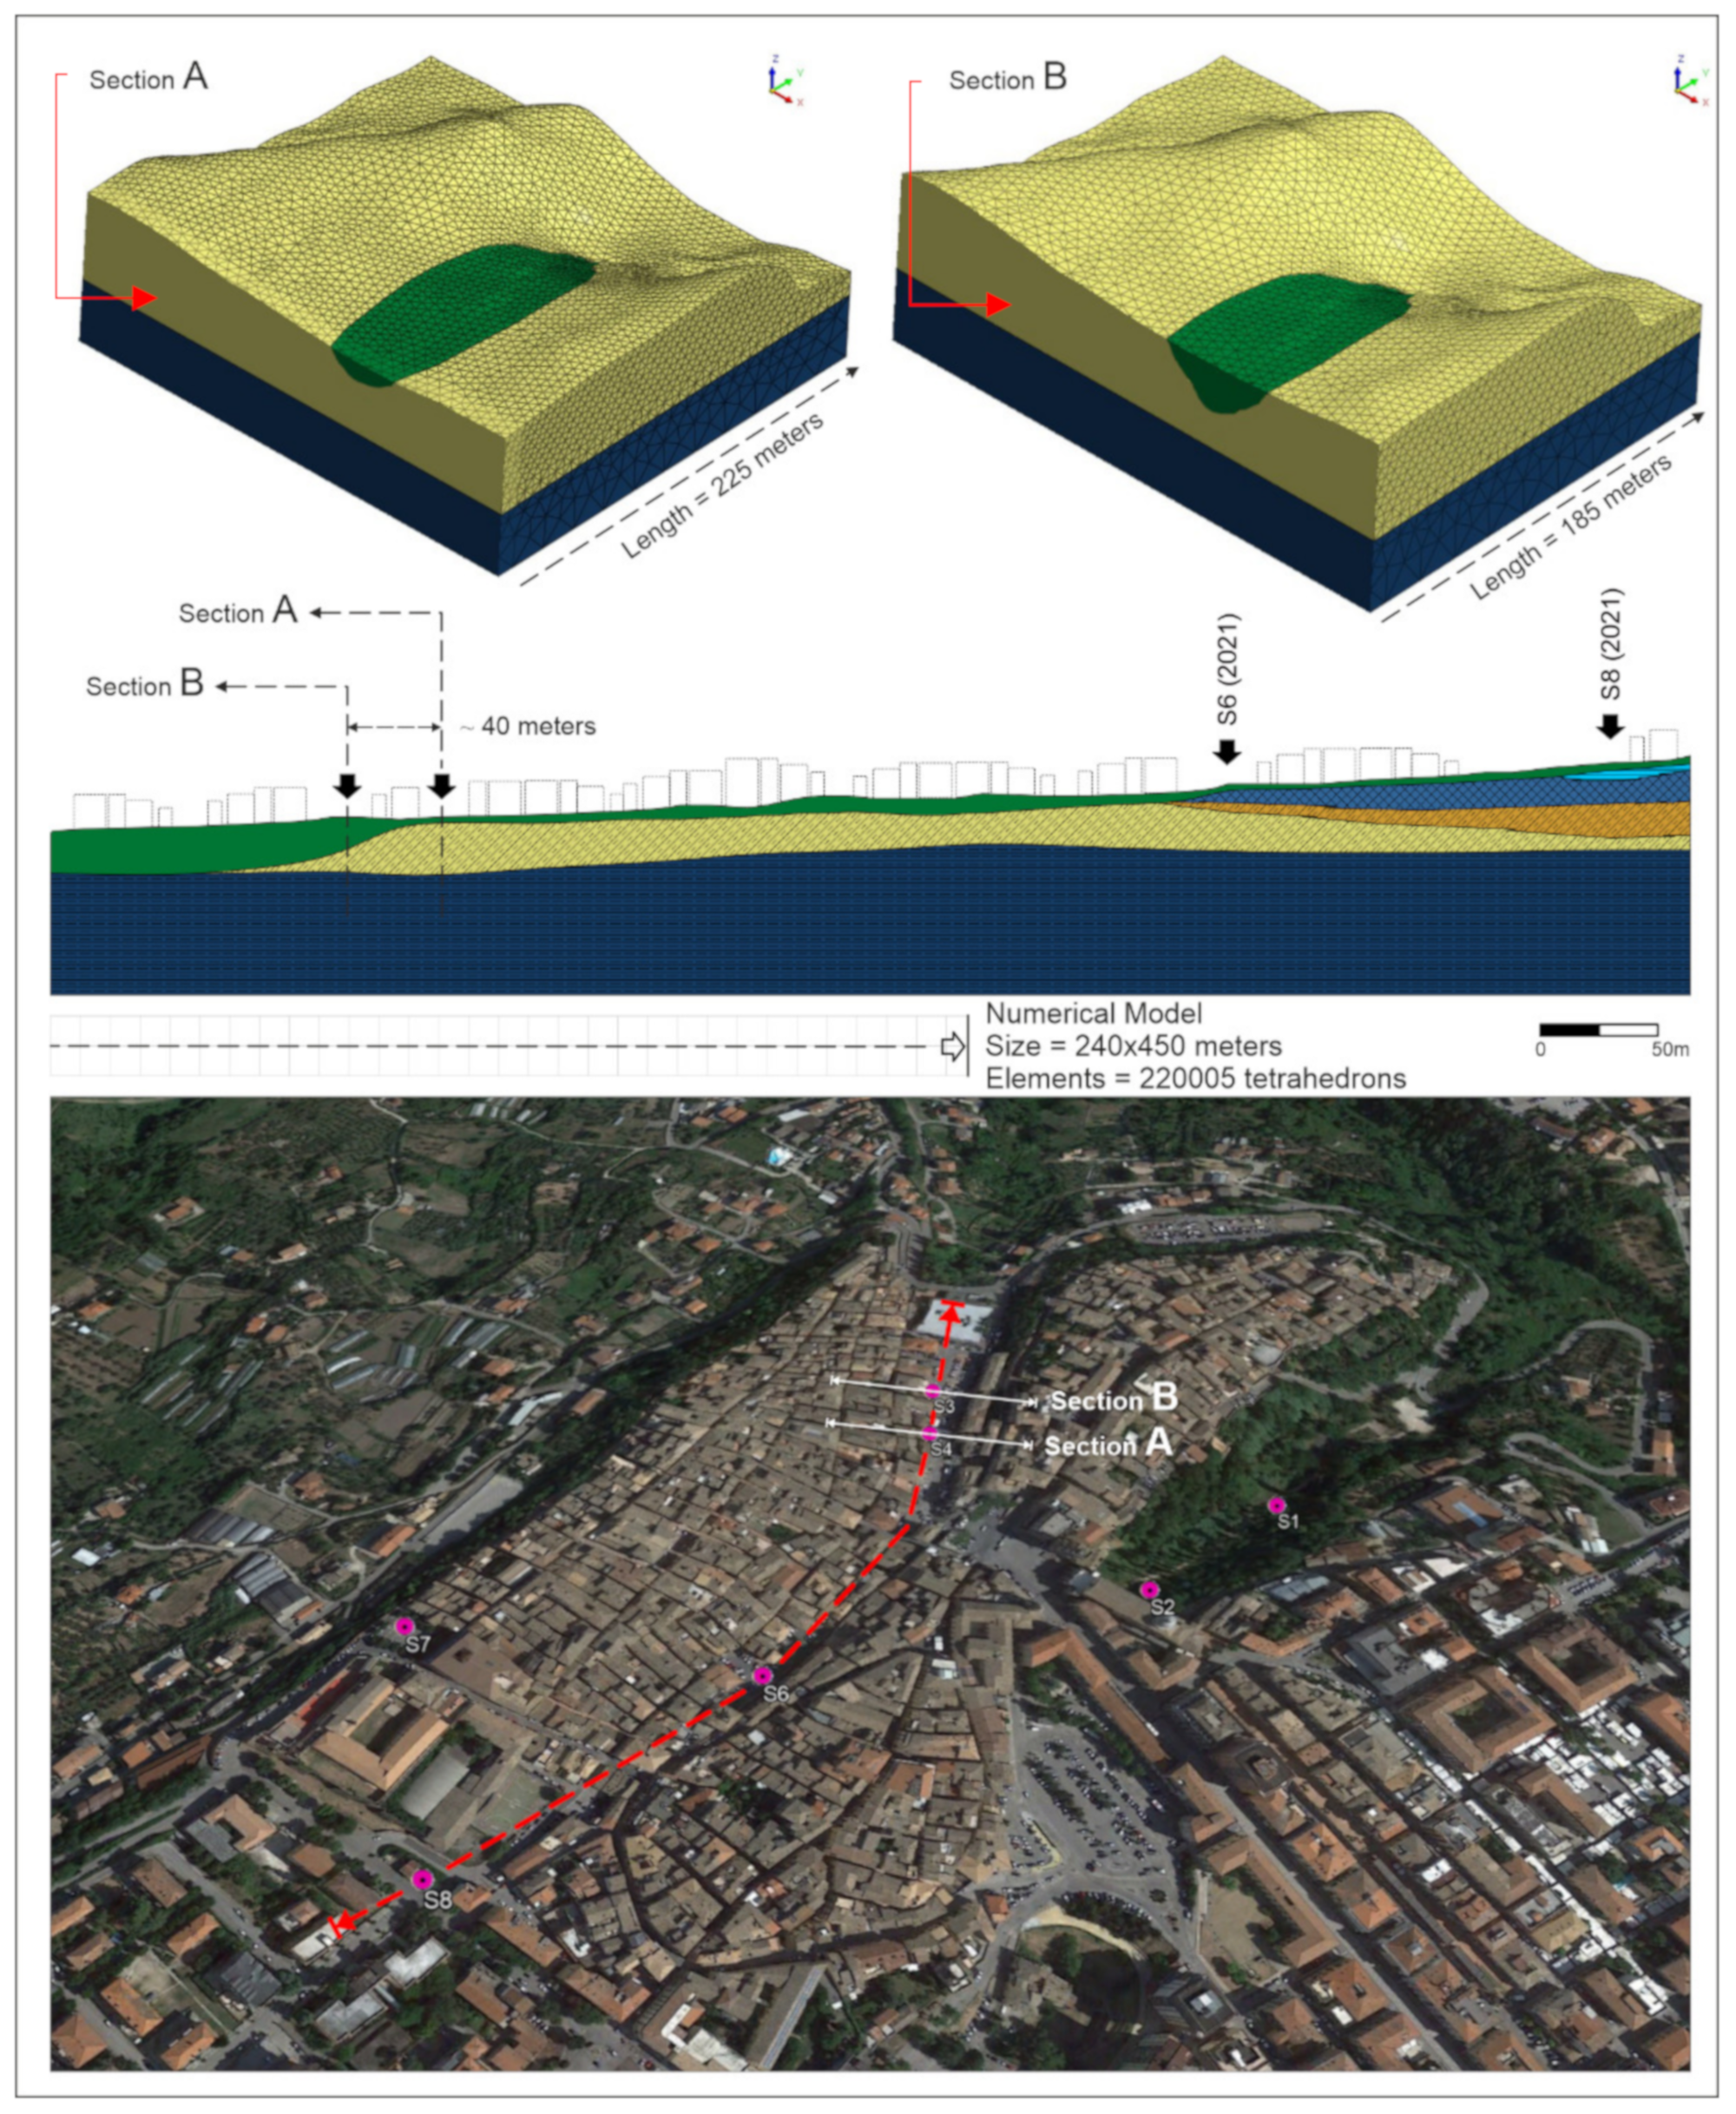
Figure 23). The Malvò ditch was filled to favor the expansion of the city and the watercourse was ducted into a shallow artificial conduit. At present, after several inspections, the canal results are partially obstructed by landslides and subsidence.
In the Malvò model it is important to note the rebuilding of the slope change at the backfill base, as observed by geological surveys S3 and S4 (2021). In this zone (view section A and B in
Figure 23), the backfill deposit has a vertical thickness difference of 12.0 m in 40 linear meters of distance.
Numerical approach—The numerical approach is a Finite Element Method (FEM), where the integration continuous domain is discretised with regular geometry elements (tetrahedron). Each element is assembled with a defined scheme to generate a global model with irregular topography/stratigraphy as close as possible to the real conditions to be analysed. The system solution is a function of the behaviour of each element, that it is calculated with an iterative non-linear analysis scheme. In addition, the Newton-Raphson method is used for more accurate results. Darcy’s law [
18] regulates the filtration effects in porous mediums, where the quantity of flow cross through the soil volume is calculated according to the equation:
v =
k i, where
v is the infiltration rate for unit area,
k is the hydraulic conductivity and
i is the hydraulic gradient. The fluid mass balance checks were performed by the iterative finite element solution of the following equation:
where:
H = total hydraulic head;
kx,
ky,
kz = hydraulic conductivity;
Q = external boundary flux;
θ= volumetric water content. With this law, the sum of the rates of flow changes (
x,
y, and
z directions) and the external boundary flux are equal to the rate of volumetric change of water content per unit time.
General setting and target results—The analysis was executed to rebuild the underground flow path directions qualitatively. Both models were calculated using the water table depth measured in the boreholes and subsequently increased up to ground level. The pressure difference applied to the borders of models was set such as to respect the ditches’ original flow directions. The physical parameter of reference was the hydraulic conductivity [
30,
31]. In recent geological surveys, which were only for sandy materials, Lefranc tests were conducted, and subsequently hydraulic conductivity values were calculated. Bibliographic research and previous works were used to define the permeability values for backfill and clay deposits. An isotropic hydraulic conductivity was considered. Only for clay deposits, an undrained condition was used and the structural elements were considered waterproof. In
Table 2, the main parameter values are reported.
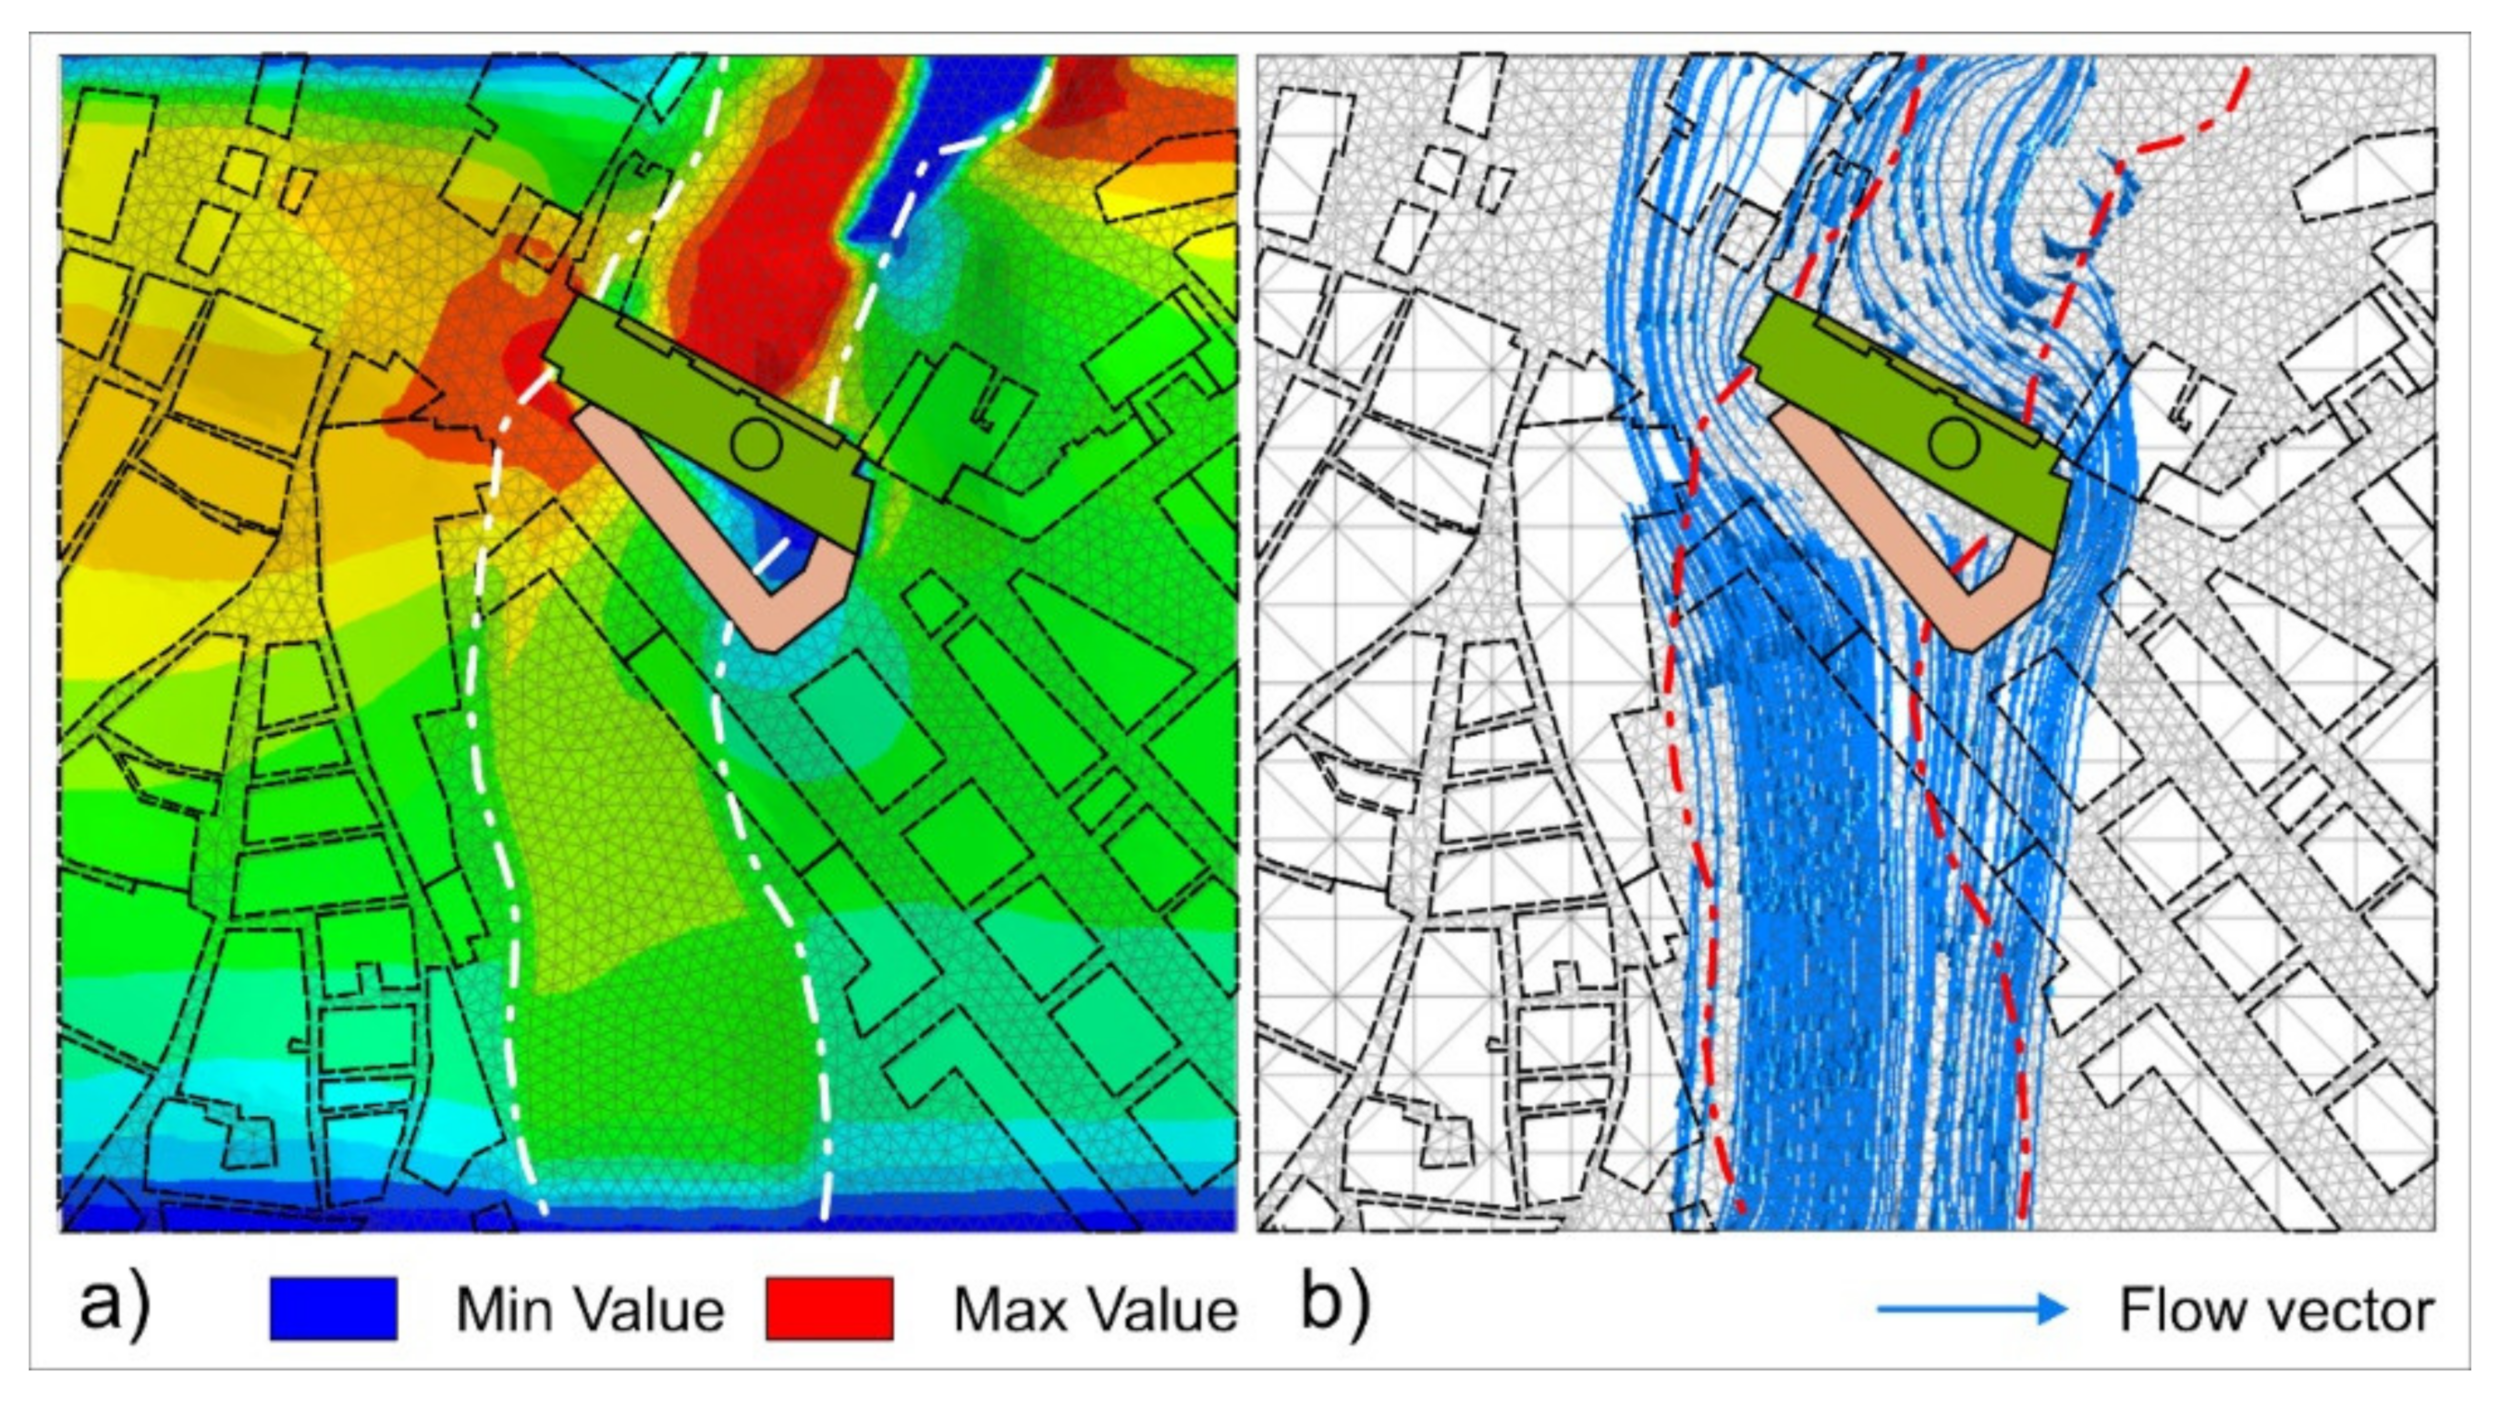
For the Pietrosa model, both flow velocity (A) and flow-path (B) are shown in
Figure 24. It is important to note the interference between the flow and Diocleziano Bridge (green structure). The barrier effect of the bridge/cathedral, which totally hinders the natural underground flow, is evident (
Figure 24b). This effect is more concentrated in the contact zone between the backfill deposit and the sand deposit that have different hydraulic conductivities. This aspect is also visible in the seepage velocity map, which presents maximum values in the left corner (
Figure 25) of the structures (cathedral and adjacent structures) and in the Diocletian Park.
The seepage flow occurs along the path flow that connects the pores between the soil particles. If the flow velocity exceeds the pore capacity to dispose of it, the velocity is higher than the soil permeability, and the water comes under pressure. This effect pushes the particles sideways, causing the pores to widen and a reduction in the contact surfaces between the particles, resulting in a solid transport. This aspect is evident in Diocleziano Park with a real erosion effect (
Figure 24). In detail, the following
Figure 25 shows a section of the Diocleziano Bridge and of the adjacent structure.
The maximum flow velocity is equal to 1.72 × 10
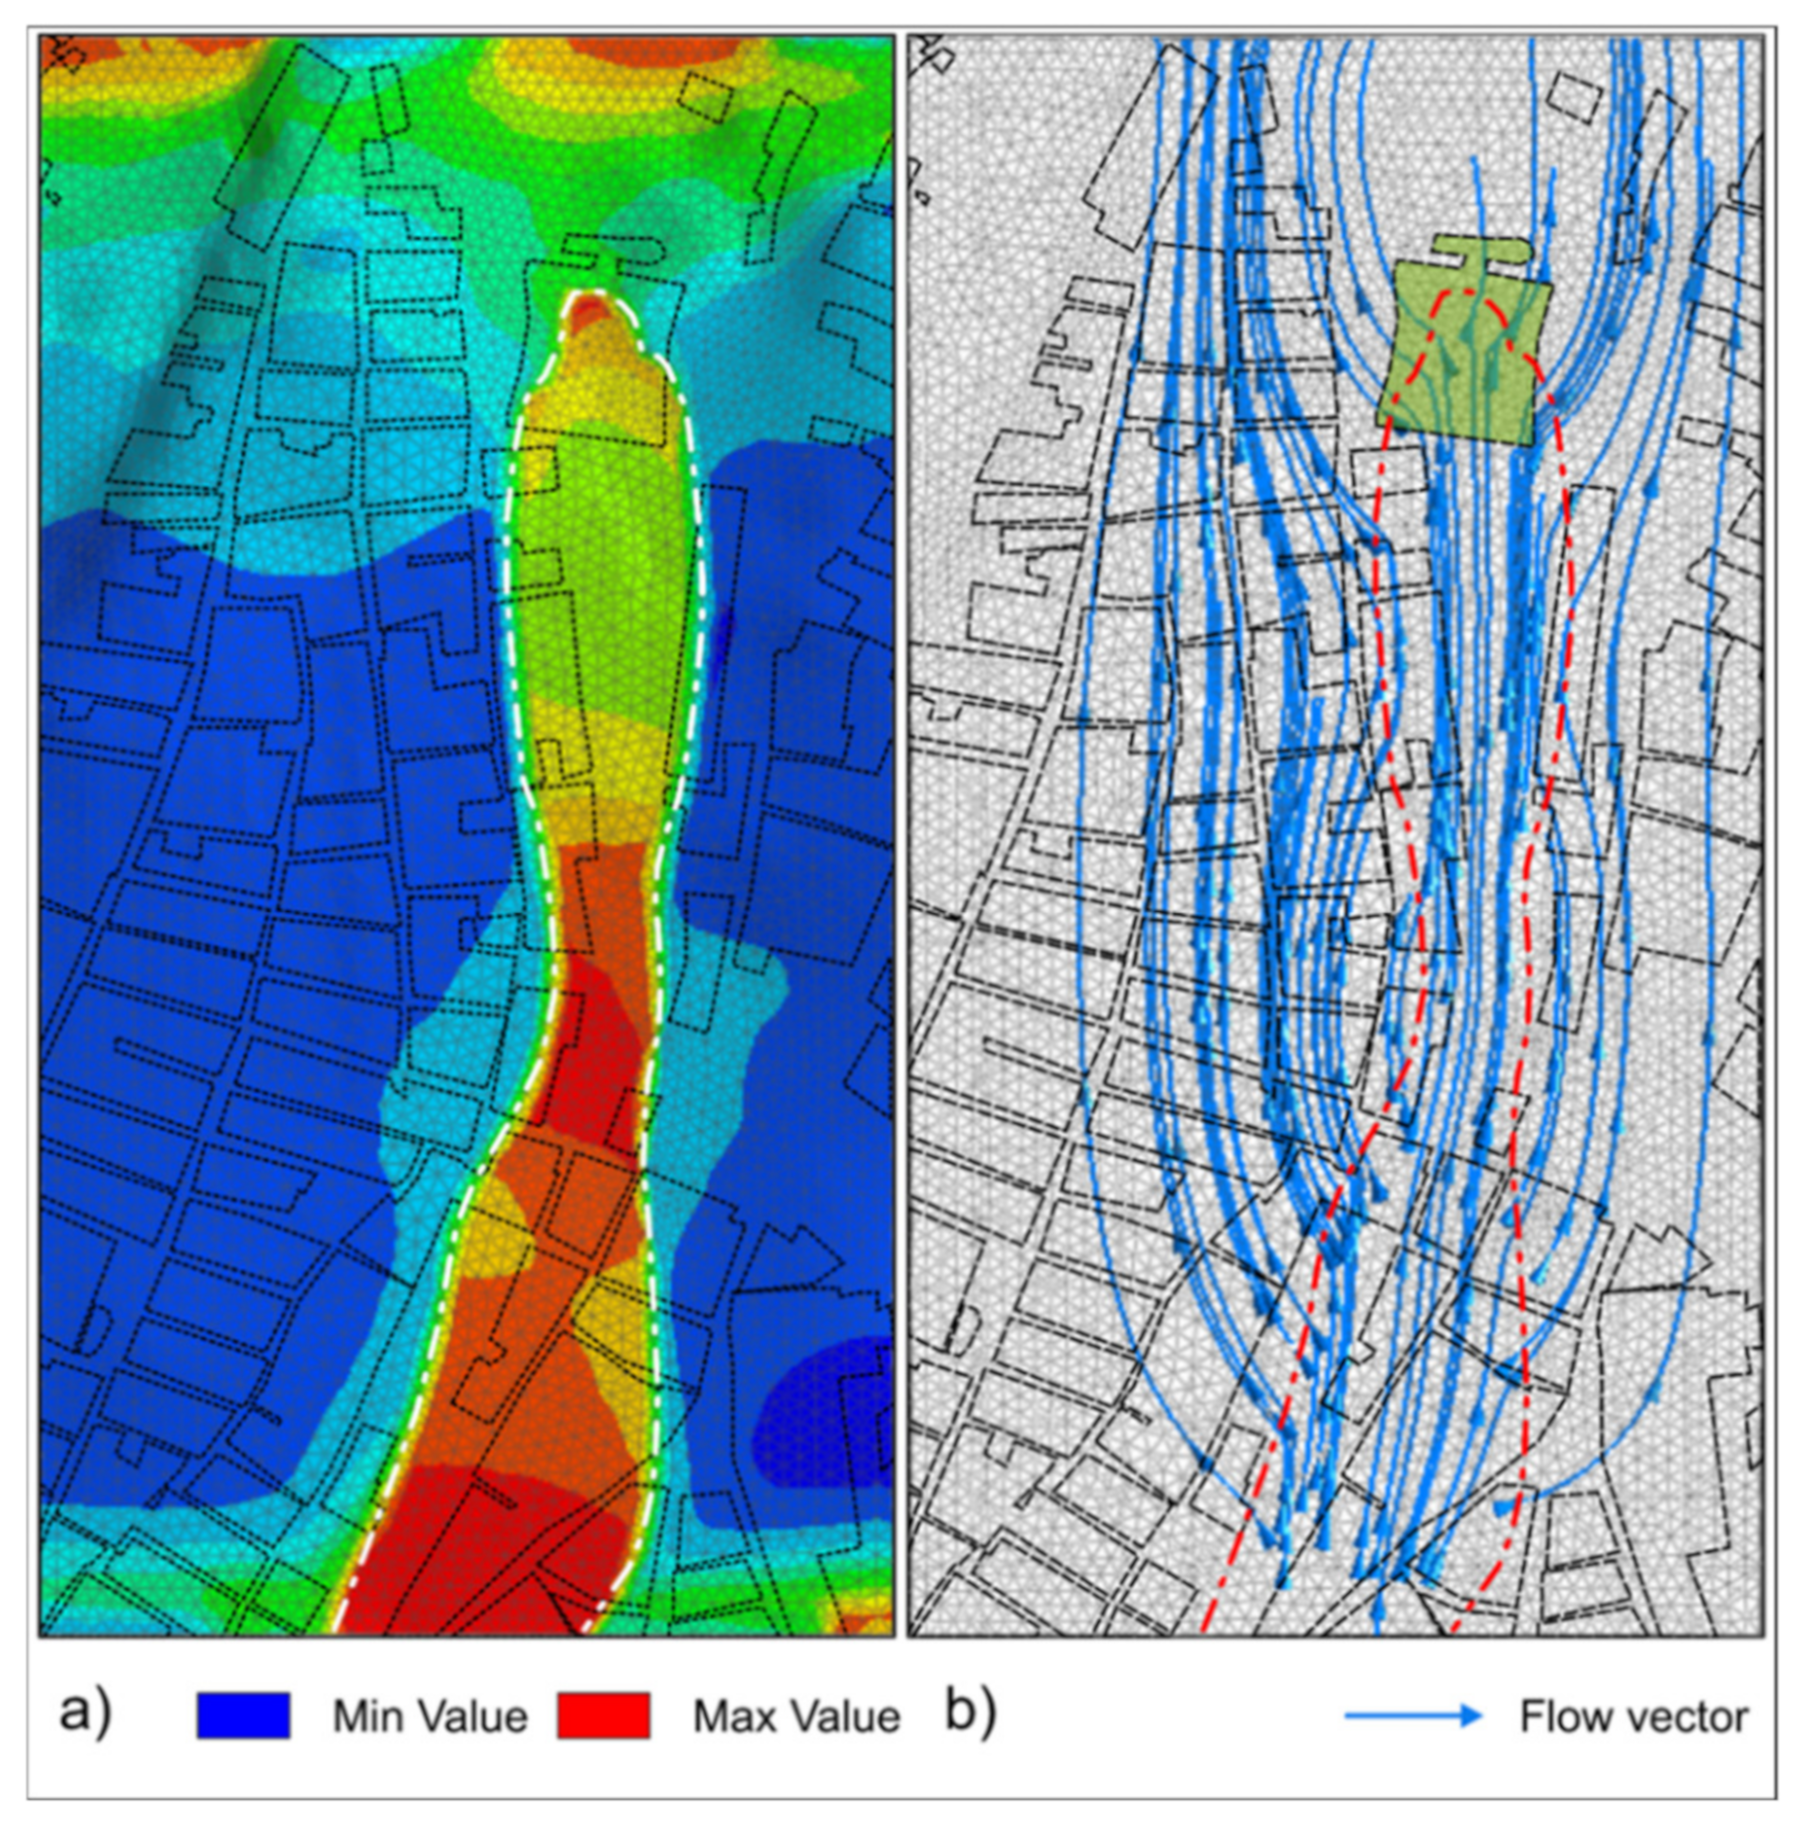
−3 m/sec near the contact between sand deposit, backfill deposit and structure foundation. In real conditions, the structure near the cathedral (beige colour) is subbject to important vertical deformation with damage and cracks to the left corner. In the Malvò model, the trend is similar (
Figure 26). In the map of the flow velocity a maximum value of 1.32 × 10
−4 m/s was recorded (red colours map). The seepage flow velocities are concentrated mainly under Corsea Vico Street and part of Giuseppe Garibaldi Square (
Figure 26).
For both models the seepage flow velocity shows values higher than hydraulic conductivity values. For this reason, it is not possible to exclude problems of solid transport that have occurred over the years. In particular, the maximum values are focused in the backfill deposits. This aspect is more evident in the Malvò model where the depth of backfill is less because the reduced thickness does not favour complete drainage for important water flows. This aspect is evident also in the Pietrosa model, principally near the structure backing to the Cathedral.
5. Discussion
This perfomed study aimed to highlight the methods of analysis of geo-hydrological hazards related to complex geological contexts, particularly in inhabited areas of centres of historical and cultural value [
32,
33,
34,
35,
36].
The methodological approach consisted of detailed geometric and stratigraphic characterisation of the subsoil [
37,
38], through a historical investigation of the geological surveys carried out in the past and their implementation, a phase of control of the deformations present in some dwellings and 3D numerical modelling that simulated the general behaviour of the soil system.
Of particular interest were the monitoring results that facilitated interpretation of subsequent numerical modelling. Some sensors show the deformation variation function of the temperature trend with reactivations in accordance with periods of greater rainfall. The most deformations were recorded from the horizontal inclinometer and from the extensometer values, where the vertical displacements are very marked. In the area where the 2018 post-flood problems occurred, the subsidence of the ground is between about 7.9 mm and 11.04 mm. At present, the deformational state is still in progress.
The importance of the monitoring was fundamental as it allowed us to circumscribe the area affected by active instabilities. The most at risk areas remain those between the Madonna del Ponte Cathedral and Trento-Trieste Avenue and the area of Garibaldi Square.
The numerical modelling permitted evaluation of the main underground hydraulic flows under the maximum piezometric height regime. The objective was also the reconstruction of the flow direction and the interaction with the underground structures for the Pietrosa ditch and the Malvò ditch. The results highlighted the fact that the seepage flow velocity values are higher than the hydraulic conductivity values. Probably the physical heterogeneity of the soils does not allow particular precision on the attribution of geotechnical parameters to the model. Moreover, the results of maximum flow velocities are concentrated in zones of the city subject to real flooding and subsidence problems. For this aspect, it is not possible to exclude problems of solid transport that occurred in past years, with consequent subsidence phenomena.
The correlation between control of the vertical soil deformations and the filtration phenomena in the subsoil also allowed us to identify the effects of a very severe consolidation phenomenon. The subsidence recorded is, therefore, also related to this type of phenomenon, well verified by the multi-base extensometric sensors.
6. Conclusions
The urban development of cities or new neighborhoods always generate a landscape that is very different from the previous ones. Urban settlements often occur on large flat structures, sometimes interrupted by natural, or artificially rectified, ditches or streams. The filling of the depressions with various natural materials inevitably changes the hydraulic and hydrogeological order of the subsoil, generating, over time, a different degree of thickness and permeability. The focus is to recognize the methodologies that identify the processes of gravitational phenomena and/or siphoning and the most suitable investigation and consolidation techniques, considering the characteristics of the historical centre and the complex architectural and urban development of the same. This paper showed the results of an interdisciplinary study related to the geo-hydrological problems of the Historical Centre of Lanciano City, a flourishing historical city in central Italy. The geological and hydrogeological structure of the subsoil was studied by implementing previous subsoil surveys with new investigations positioned at strategic points of the city. The new investigations carried out (borehole and electrical resistivity tomography) have made it possible to compute the geometrical stratigraphical shapes, to highlight saturation zones to be drained and to define litho-stratigraphic and geotechnical characteristics. Heterogeneous consistency of gravelly deposits, cemented sands and substratum of gray-blue clays characterise the geology of Lanciano City. Furthermore, variable thicknesses of backfill deposits have been found and they are extremely heterogeneous and composed of different materials, both natural and of anthropic origin. In particular, these materials have been used to fill natural channels, such as the Malvò ditch and the Pietroso ditch, to allow expansion of the city. Currently, these zones are used as public streets and parking areas, and are filled with variable thicknesses of materials from a few meters to 24/25 m. On 22 June 2018 the Historic Centre was affected by heavy flooding, with consequent deformation and soil failure problems. The executed 3D modelling was also performed to determine the most appropriate types of remedial works, both to improve the internal characteristics of the land and to carry out appropriate drainage works and/or disposal of filtration water. These interventions are summed up in the realisation of deep drainage works, in the requalification of the sewerage pipes (also historical ones) still existing, in the physical consolidation of the carryover lands and in the strengthening of the monitoring instruments. This latter type of intervention, by definition not structural, is the most valid measure for the definition of the actual geo-hydrological hazards of the area under study.


