Article

Paleogene Lithostratigraphy and Recognition of the Marine Incursion of the Proto-Paratethys Sea in the Fergana Basin, Uzbekistan

by
Otabek Ulugbek Ogli Anvarov
1,*,
Yoshihito Kamata
2,
Teruyuki Maruoka
2,
Junichiro Kuroda
3,4,
Shigeyuki Wakaki
5 and
Ken-ichiro Hisada
2,6
1
Graduate School of Life and Environmental Sciences, University of Tsukuba, Tsukuba 305-8572, Japan
2
Department of Geosciences, Faculty of Life and Environmental Sciences, University of Tsukuba, Tsukuba 305-8572, Japan
3
Atmosphere and Ocean Research Institute, The University of Tokyo, Kashiwa 277-0882, Japan
4
Japan Agency for Marine—Earth Science and Technology (JAMSTEC), Yokosuka 237-0061, Japan
5
Kochi Institute for Core Sample Research, Japan Agency for Marine—Earth Science and Technology (JAMSTEC), Nankoku 782-8502, Japan
6
Faculty of Education, Bunkyo University, Koshigaya 345-8511, Japan
*
Author to whom correspondence should be addressed.
Submission received: 23 March 2022 / Revised: 27 April 2022 / Accepted: 5 May 2022 / Published: 10 May 2022

Abstract

:
Lithostratigraphy and isotopes of Paleogene sequences consisting mainly of terrestrial clastics and limestone were examined in the northern Fergana Basin of Uzbekistan. The studied sections consisted of two facies: the lower sequence coarse-grained terrestrial clastics and the upper sequence limestone clastics characterized by limestone beds. The sulfur isotopic composition of the bivalve obtained from the lower sequence was relatively low, namely, 14.94–16.82‰, which is equivalent to the Early Cretaceous; however, it is possible that the isotopic composition differed from that obtained in open seawater due to the presence of terrestrial clastics and the freshwater effect. In contrast, the sulfur isotopic composition of limestone from the upper sequence was relatively high, namely, 19.37–21.19‰, thereby indicating that they were likely to originate from the Early to Middle Eocene. Furthermore, the strontium isotopic compositions of the lower and upper sequences were 0.707772–0.707875‰ and 0.707812–0.708063‰, respectively. These values are more similar to those of the Paleogene than the Cretaceous. Finally, lithostratigraphy and age determination allowed us to correlate the upper sequence with representative limestone from the fourth transgression of the proto-Paratethys Sea, whilst the limestone beds were deduced to be remnants of the Eocene marine incursion of the proto-Paratethys Sea.

1. Introduction

The Fergana Basin is among the largest intermountain depressions of the southwest Tien Shan Mountains and is located between the northern Chatkal range and the southern Alai range. In addition, it is separated from the Central Tien Shan by the Fergana Range in the east (Figure 1A,B). To record the spread of the proto-Paratethys Sea in Central Asia, in addition to monitoring the tectonic spread after the collision with the Indian subcontinent, the Mesozoic–Cenozoic sediments distributed in the Fergana Basin have been studied, as have the sediments of the Afghan–Tajik and Tarim basins. In particular, from the Mesozoic to the Early Cenozoic, the sedimentary sequences recorded for the three basins indicate the repeated deposition of terrestrial and marine sediments, and thus, were interpreted as recording the transgression and regression of the proto-Paratethys Sea [1,2,3].
The Fergana Basin, which was the focus of this study, is surrounded by the Chatkal Range, Alai Range, and Talas–Fergana Fault on the northern, southern, and eastern sides, respectively, and has a unique triangular shape, as shown in Figure 1B. Although several studies focused on the sedimentary rocks of the Afghan–Tajik and Tarim basins, and the stratigraphic concepts of the Mesozoic and Cenozoic were established, such detailed studies have yet to be established for the Fergana Basin.
Indeed, previous studies that focused on the Fergana Basin focused mainly on the southern part of the basin, where the natural resources were of particular interest [5,6,7,8,9,10]. In addition, several geochronological issues remained unresolved, and to date, the Mesozoic deposits of the northern part remain undifferentiated. Furthermore, some studies [6,7,8] suggested the existence of Triassic and Jurassic sediments at the base of the northern part, while a more recent study [11,12] identified deposits originating from the Lower Cretaceous Aptian–Albian and all stages of the Upper Cretaceous in the north of the basin. It should be noted that these studies were performed by the stratigraphers of the Geological Survey of Uzbekistan between 2007 and 2012, and the age determination of the sequences was based on biostratigraphy. In addition, during these studies, fossils such as foraminifers and mollusks were identified, which suggested the existence of all Cretaceous sediments in the northern part of the basin. However, no columnar sections or identified fossils were illustrated in the reports, and thus, it is not possible to carry out an accurate comparison or verification of the results. As such, we considered it necessary to fully describe and illustrate these columnar sections and fossils to perform a geological correlation with the Afghan–Tajik and Tarim Basins.
Thus, we herein report our investigation and examination of the Cretaceous–Paleogene strata in the northern part of the Fergana Basin, which was carried out in 2017 and 2018. The study area is located in the northern part of the Fergana Basin at the southern foothills of the Chatkal Range close to Chust City and corresponds to a range of approximately 10 km from the southwest to the northeast. Four sections were chosen for the study, and these were located close to the Gava province, the Varzyk province, and the Karabulak water dam (Figure 2). Furthermore, we describe the lithology based on the field and microscopic observations and report the results of the geological age determined using sulfur and strontium isotope analyses.

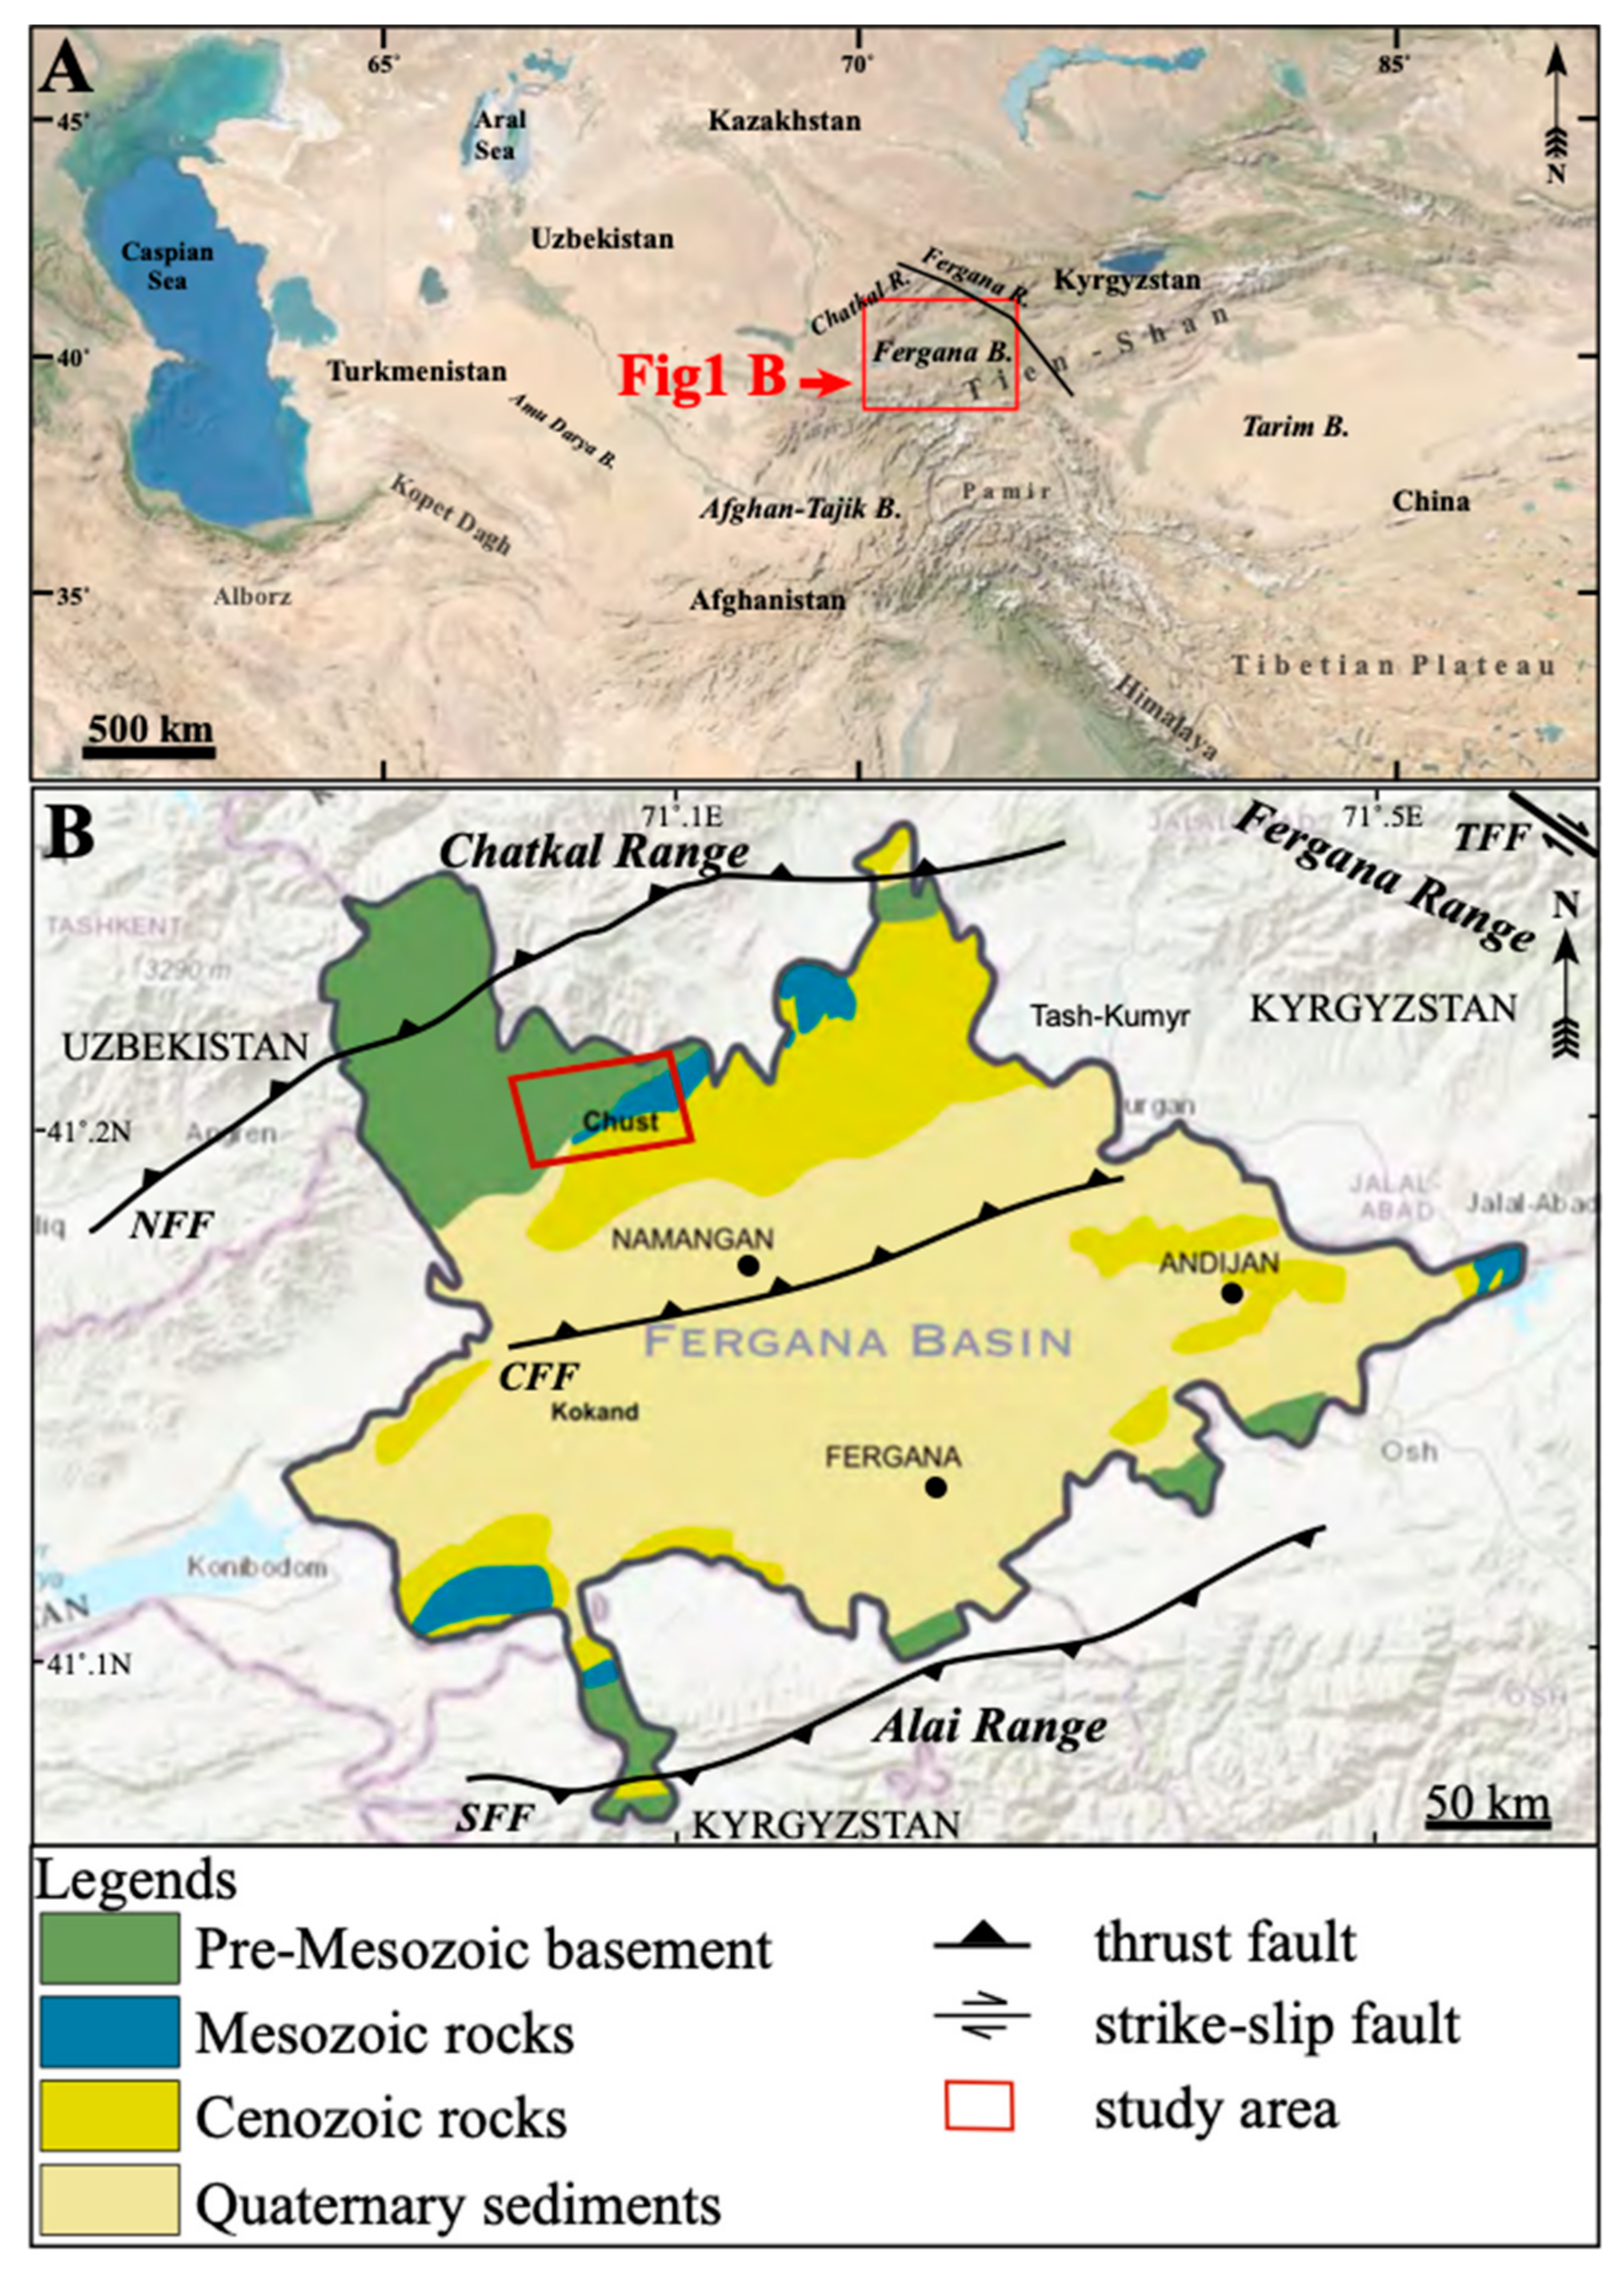
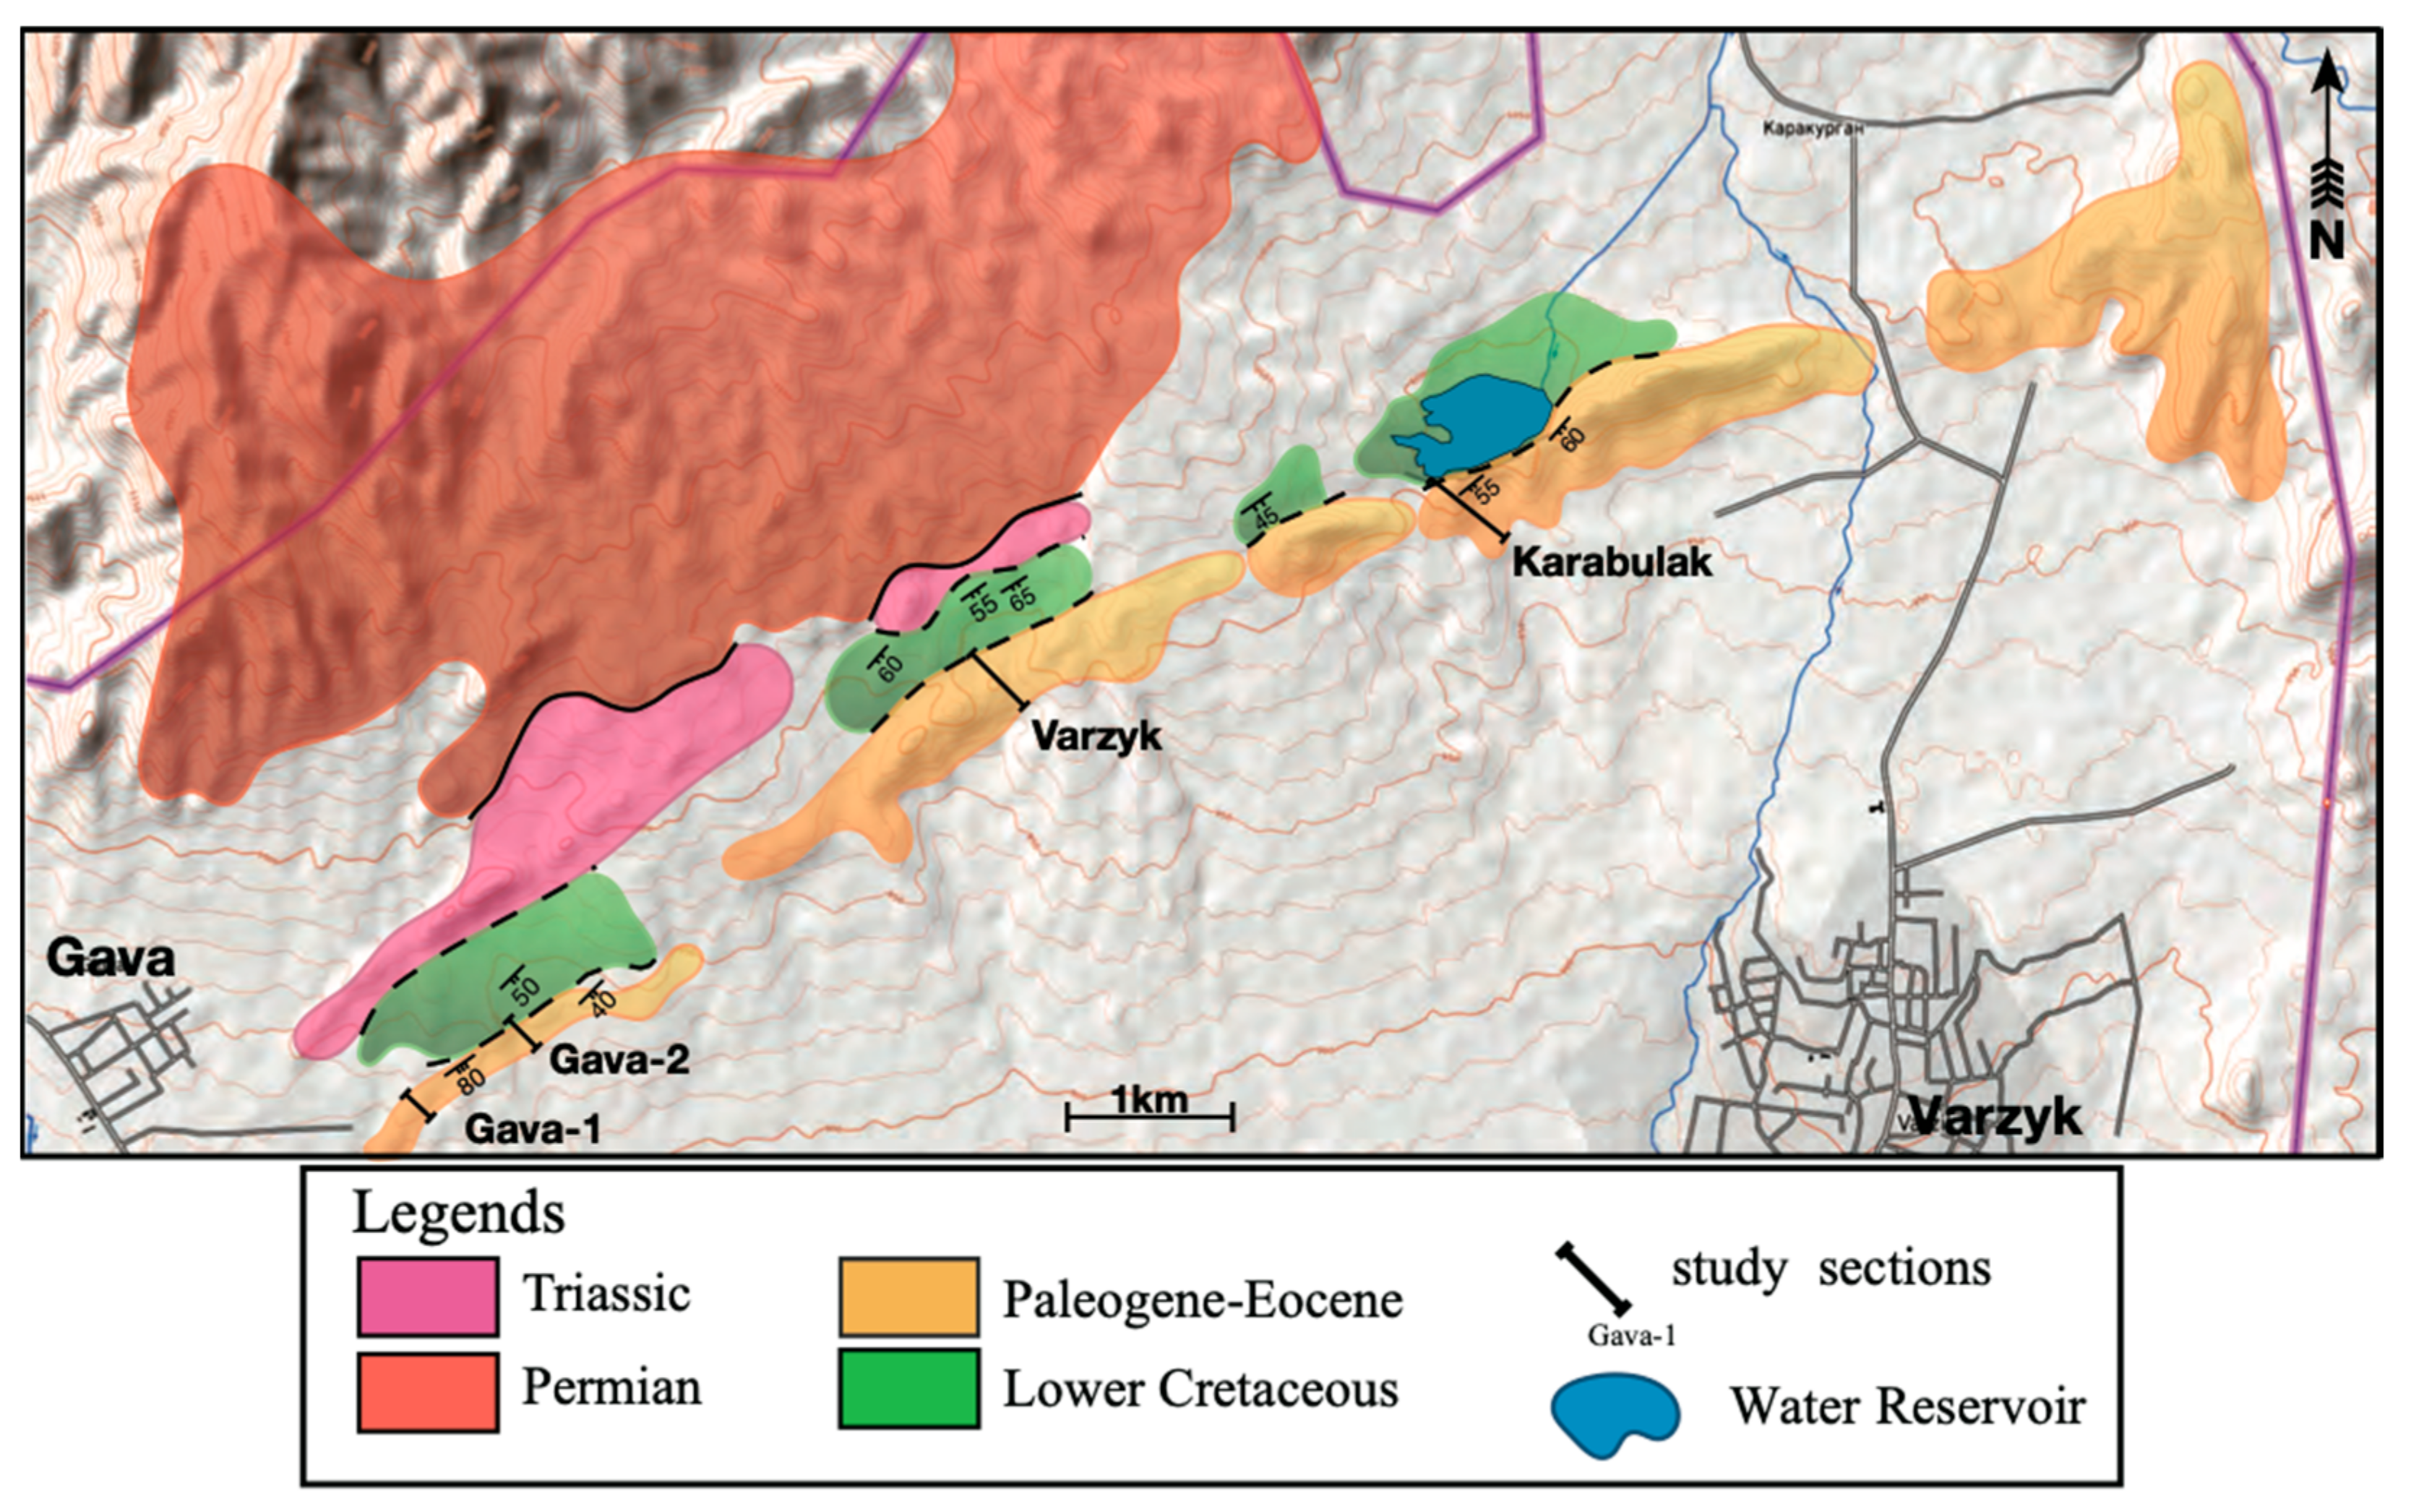
2. Geological Settings

The Fergana Basin is bounded by thrust faults in the North Fergana Fault (NFF) and the South Fergana Fault (SFF), bordering the Chatkal Range in the north and the Alai Range in the south. The northeast side of the basin is bounded by the Talas–Fergana Fault (TFF) of the dextral strike-slip fault (Figure 1A,B). These faults were caused by a collision with the Eurasian continent and the Indian subcontinent owing to the northward movement of the latter after the Eocene [13,14]. It was proposed that the basin formed owing to late Paleozoic–early Mesozoic (Permian to Triassic) rifting of the Paleozoic basement, and mainly Permian–Early Triassic volcanic rocks, Jurassic coal facies, and Early Cretaceous continental deposits filled the depression basin [3,11,12,15].
In the northern Fergana Basin, the study area is predominantly occupied by Permian igneous rocks, Triassic continental deposits, Cretaceous to Paleogene sedimentary rocks, and Quaternary sediments (Figure 2). Mesozoic-to-Quaternary sedimentary rocks and sediments trend approximately east–west and dip to the south. The Permian rocks are represented by granodiorite, alkaline basalt, and gabbro, and the absolute ages of these rocks are 299 ± 16 Ma for granodiorite and 252 ± 13 Ma for alkaline basalt, according to previously reported radiometric measurements [16]. Only continental Lower Triassic sediments were detected, and these unconformably overlie Permian igneous rocks; however, the Middle and Upper Triassic sediments are missing [8,10]. Jurassic coal-bearing formations are distributed in the northern Tash-Kumyr region of the Kyrgyz Republic, with interbeds of sandstone and shale containing the lenses of lacustrine bauxites and bauxite rocks in the south [11,12,17,18]. The deposition of the coal-bearing facies ends with the development of the Upper Jurassic and Lower Cretaceous red beds. Previously reported stratigraphic and sedimentological analyses of the areas adjacent to the Fergana Basin, such as the Tash-Kumyr, Kalaza, Tarim, and Junggar areas [3], suggest that the tectonic activities continued during the Jurassic and Cretaceous transition and that the change in sedimentary facies from sandy to conglomeratic deposits was highly linked with the expansion of the arid climate. At the northern edges of the basin, Jurassic deposits are represented by purple-to-dark-red conglomerates, and Cretaceous deposits containing oyster beds were also identified [6].
In almost all sections of the basin, the Paleogene deposits are strongly deformed owing to the tectonic activities of the Cenozoic orogeny. The main factor causing such deformation has been identified as the activity of the Talas–Fergana Fault after the rapid exhumation event at 25 Ma, which took place at the northwest Tien Shan due to the collision of the Indian subcontinent with Eurasia; this process began at approximately 50 Ma and continues to this day [18]. As a result, the activity of the Talas–Fergana Fault and the northward compression of the Pamir Range reshaped the basin and caused a counter-clockwise rotation of the northwestern edges (Figure 1B).

3. Samples and Analytical Methods

3.1. Sampling

Bivalve fossil shells (56 samples) and limestone rock samples (3 samples) were collected from the four studied sections. A list of the collected samples is given in Table 1, and the sample collection level for each section is shown in Figure 3.

3.2. Sample Preparation for S Isotope Analyses

All samples were cleaned to avoid contamination, and only the clean shell parts of the fossils and silica-free limestones were separated and powdered using an agate mortar for sulfur (S) isotope analysis. The powdered samples (0.35–1.88 g) were processed according to a modified literature procedure [19]. More specifically, the powdered samples were subjected to leaching with a 30% H2O2 solution at room temperature (~25 °C) for 24 h and then at 50 °C for 24 h. This step was necessary to remove any organic sulfur or sulfide compounds that were present since these compounds are vulnerable to oxidation. The residual sample powder was then carefully rinsed with deionized water and subjected to leaching with a 10% NaCl solution for 24 h to remove sulfates, including any adsorbed evaporitic calcium sulfate or other sulfates generated from sulfide oxidation. After carefully rinsing with deionized water, the residual sample powder was dissolved in a 6 M HCl solution. The dissolved sulfates were precipitated as BaSO4 via the addition of a BaCl2 solution after adjusting the pH to 2–3 using a 6 M KOH solution. Finally, the BaSO4 precipitate was filtered using a membrane filter with a 0.2 μm pore size. All procedures were performed under an inert (N2) atmosphere to prevent oxidation.

3.3. Sulfur Isotope Analysis of the BaSO4 Precipitates of the Carbonate-Associated Sulfate

The sulfur isotopic compositions of the BaSO4 precipitates were determined using a continuous-flow isotope ratio mass spectrometer (CF-IR-MS; ISOPRIME-EA; Isoprime Ltd., Manchester, UK) at the University of Tsukuba [19]. For this purpose, the BaSO4 precipitate (0.25 mg), corresponding to 30 μg of sulfur, was weighed in a 3.3 × 5 mm tin capsule, and V2O5 (300 μg, Nacalai Tesque, Inc., Kyoto, Japan) was added to promote complete combustion. Using an auto-sampler, the samples were introduced into a combustion/reduction quartz tube maintained at 1090 °C under a flow of helium gas (90 mL/min) and were then oxidized using an oxygen pulse. It should be noted here that the combustion/reduction tube contained tungstic trioxide and pure copper wires. The former promotes complete oxidation, while the latter removes excess oxygen and converts sulfur trioxide into sulfur dioxide. The water generated during the combustion reaction was removed using a magnesium perchlorate water trap.
The gases produced in the combustion/reduction tube were introduced with a continuous He flow into a quartz tube containing quartz wool maintained at 890 °C to minimize the oxygen isotope variation of SO2, which can occur via a SO2–SiO2 equilibrium reaction [20]. Sulfur dioxide and other gases, such as CO2 and N2, were separated via gas chromatography using a Ludi Swiss AG (Flawil, Switzerland) column (#99.0723.10) at 60 °C. The gases were introduced into the mass spectrometer through an open-split interface.
The sulfur isotopic compositions were expressed in terms of δ34S (‰) relative to the Vienna–Canyon Diablo Troilite (V-CDT) standard [21]. The results obtained using two International Atomic Energy Agency (IAEA) silver sulfide standards (IAEA-S-1, −0.3‰; IAEA-S-2, +21.80‰) [22] were compared to constrain the δ34S values. The isotopic compositions of sulfur were determined to a precision (1σ) of ±0.1‰ for 30 μg of sulfur. The precisions were determined based on a combination of the standard deviations obtained from repeated analyses of the samples and the standards [23]. Each sample was analyzed at least in triplicate.

3.4. Sr Isotope Analysis

Out of 59 samples, 9 were chosen for Sr isotope measurements, and Sr separation was performed at JAMSTEC according to a previously described method [24,25]. More specifically, the sample powders were leached using acetic acid to decompose the carbonate fraction. Strontium was then separated from the other elements using Eichrom Sr Spec resin. Subsequently, the Sr sample (100 ng) was loaded onto a single W filament together with a Ta activator, and the Sr isotopic ratios were measured in the static multi-collection mode using a Thermo Scientific TRITON thermal ionization mass spectrometer at the Kochi Core Center, as described previously [26]. Each measurement consisted of 140 cycles of 16.8 s integrations with 88Sr ion beams of 4 V. The instrumental mass fractionation was corrected to 86Sr/88Sr = 0.1194 using the exponential law. The baselines of the Faraday cup detectors were measured for 300 s immediately before each measurement. The average 87Sr/86Sr ratio of NIST SRM 987 was 0.710247 ± 0.000013 (2SD, n = 5), and the 87Sr/86Sr ratio of the target sample was corrected to 87Sr/86SrSRM 987 = 0.710248 [27] using this measured value.

4. Results

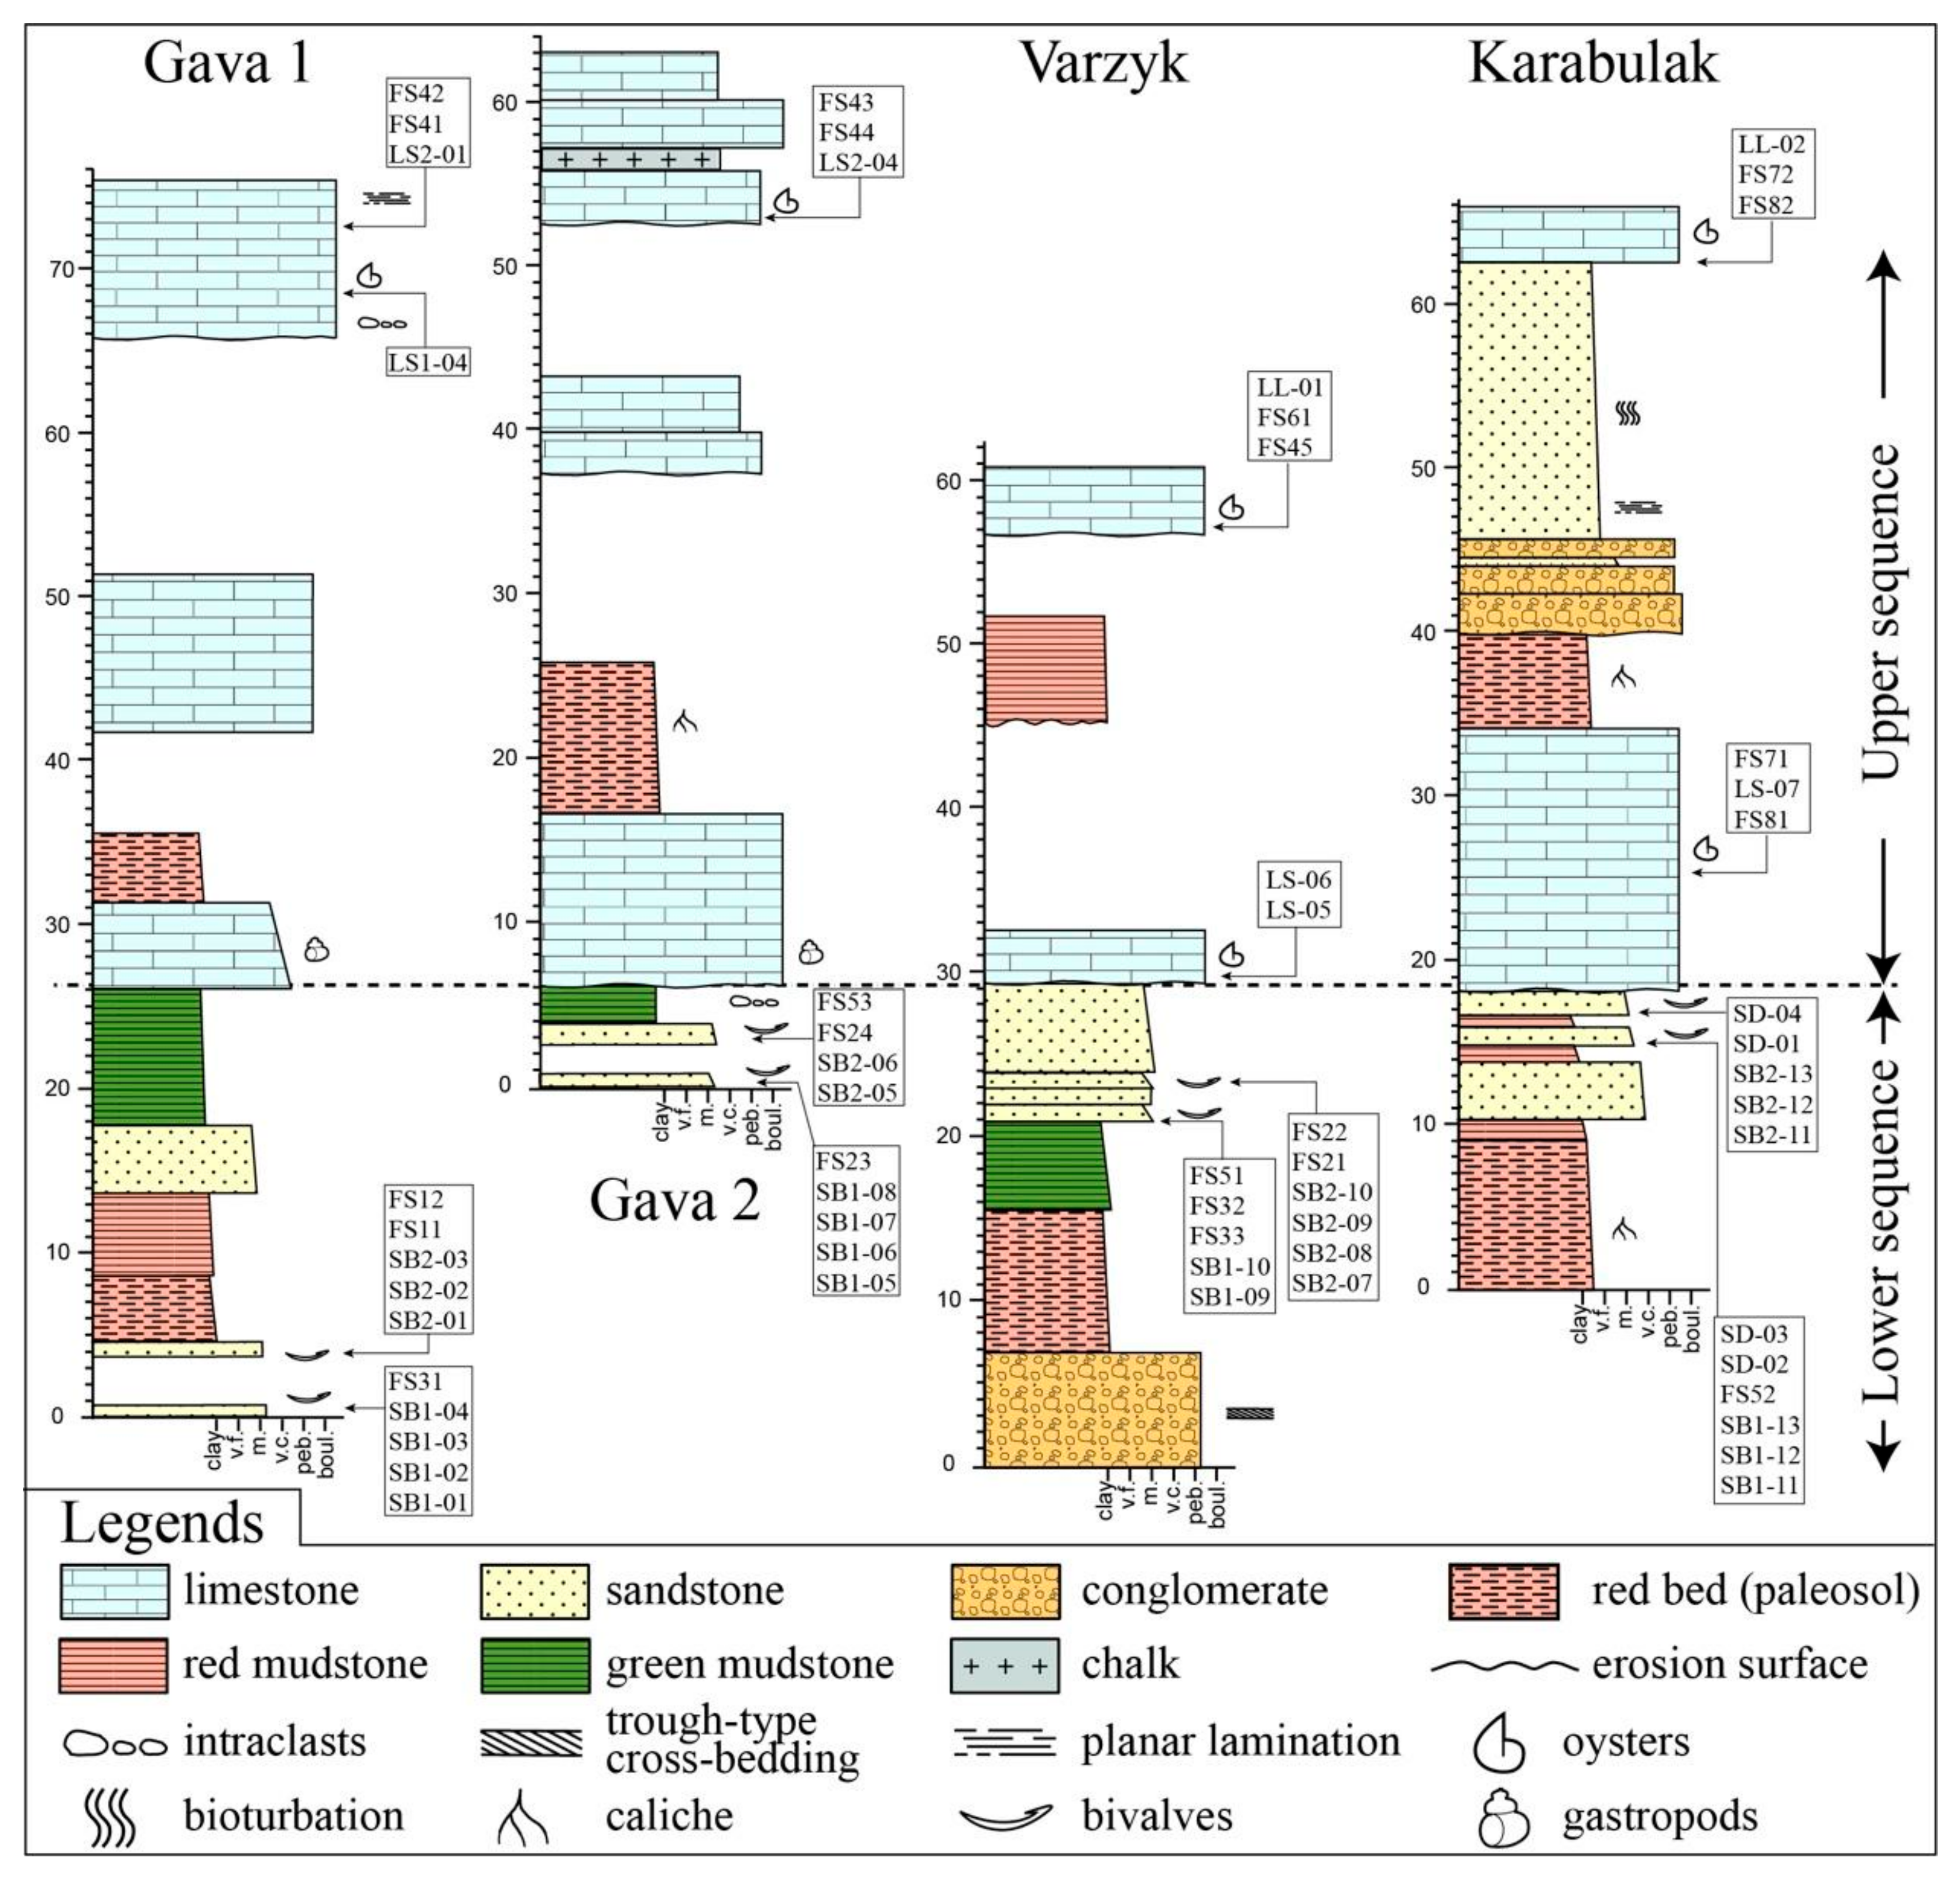
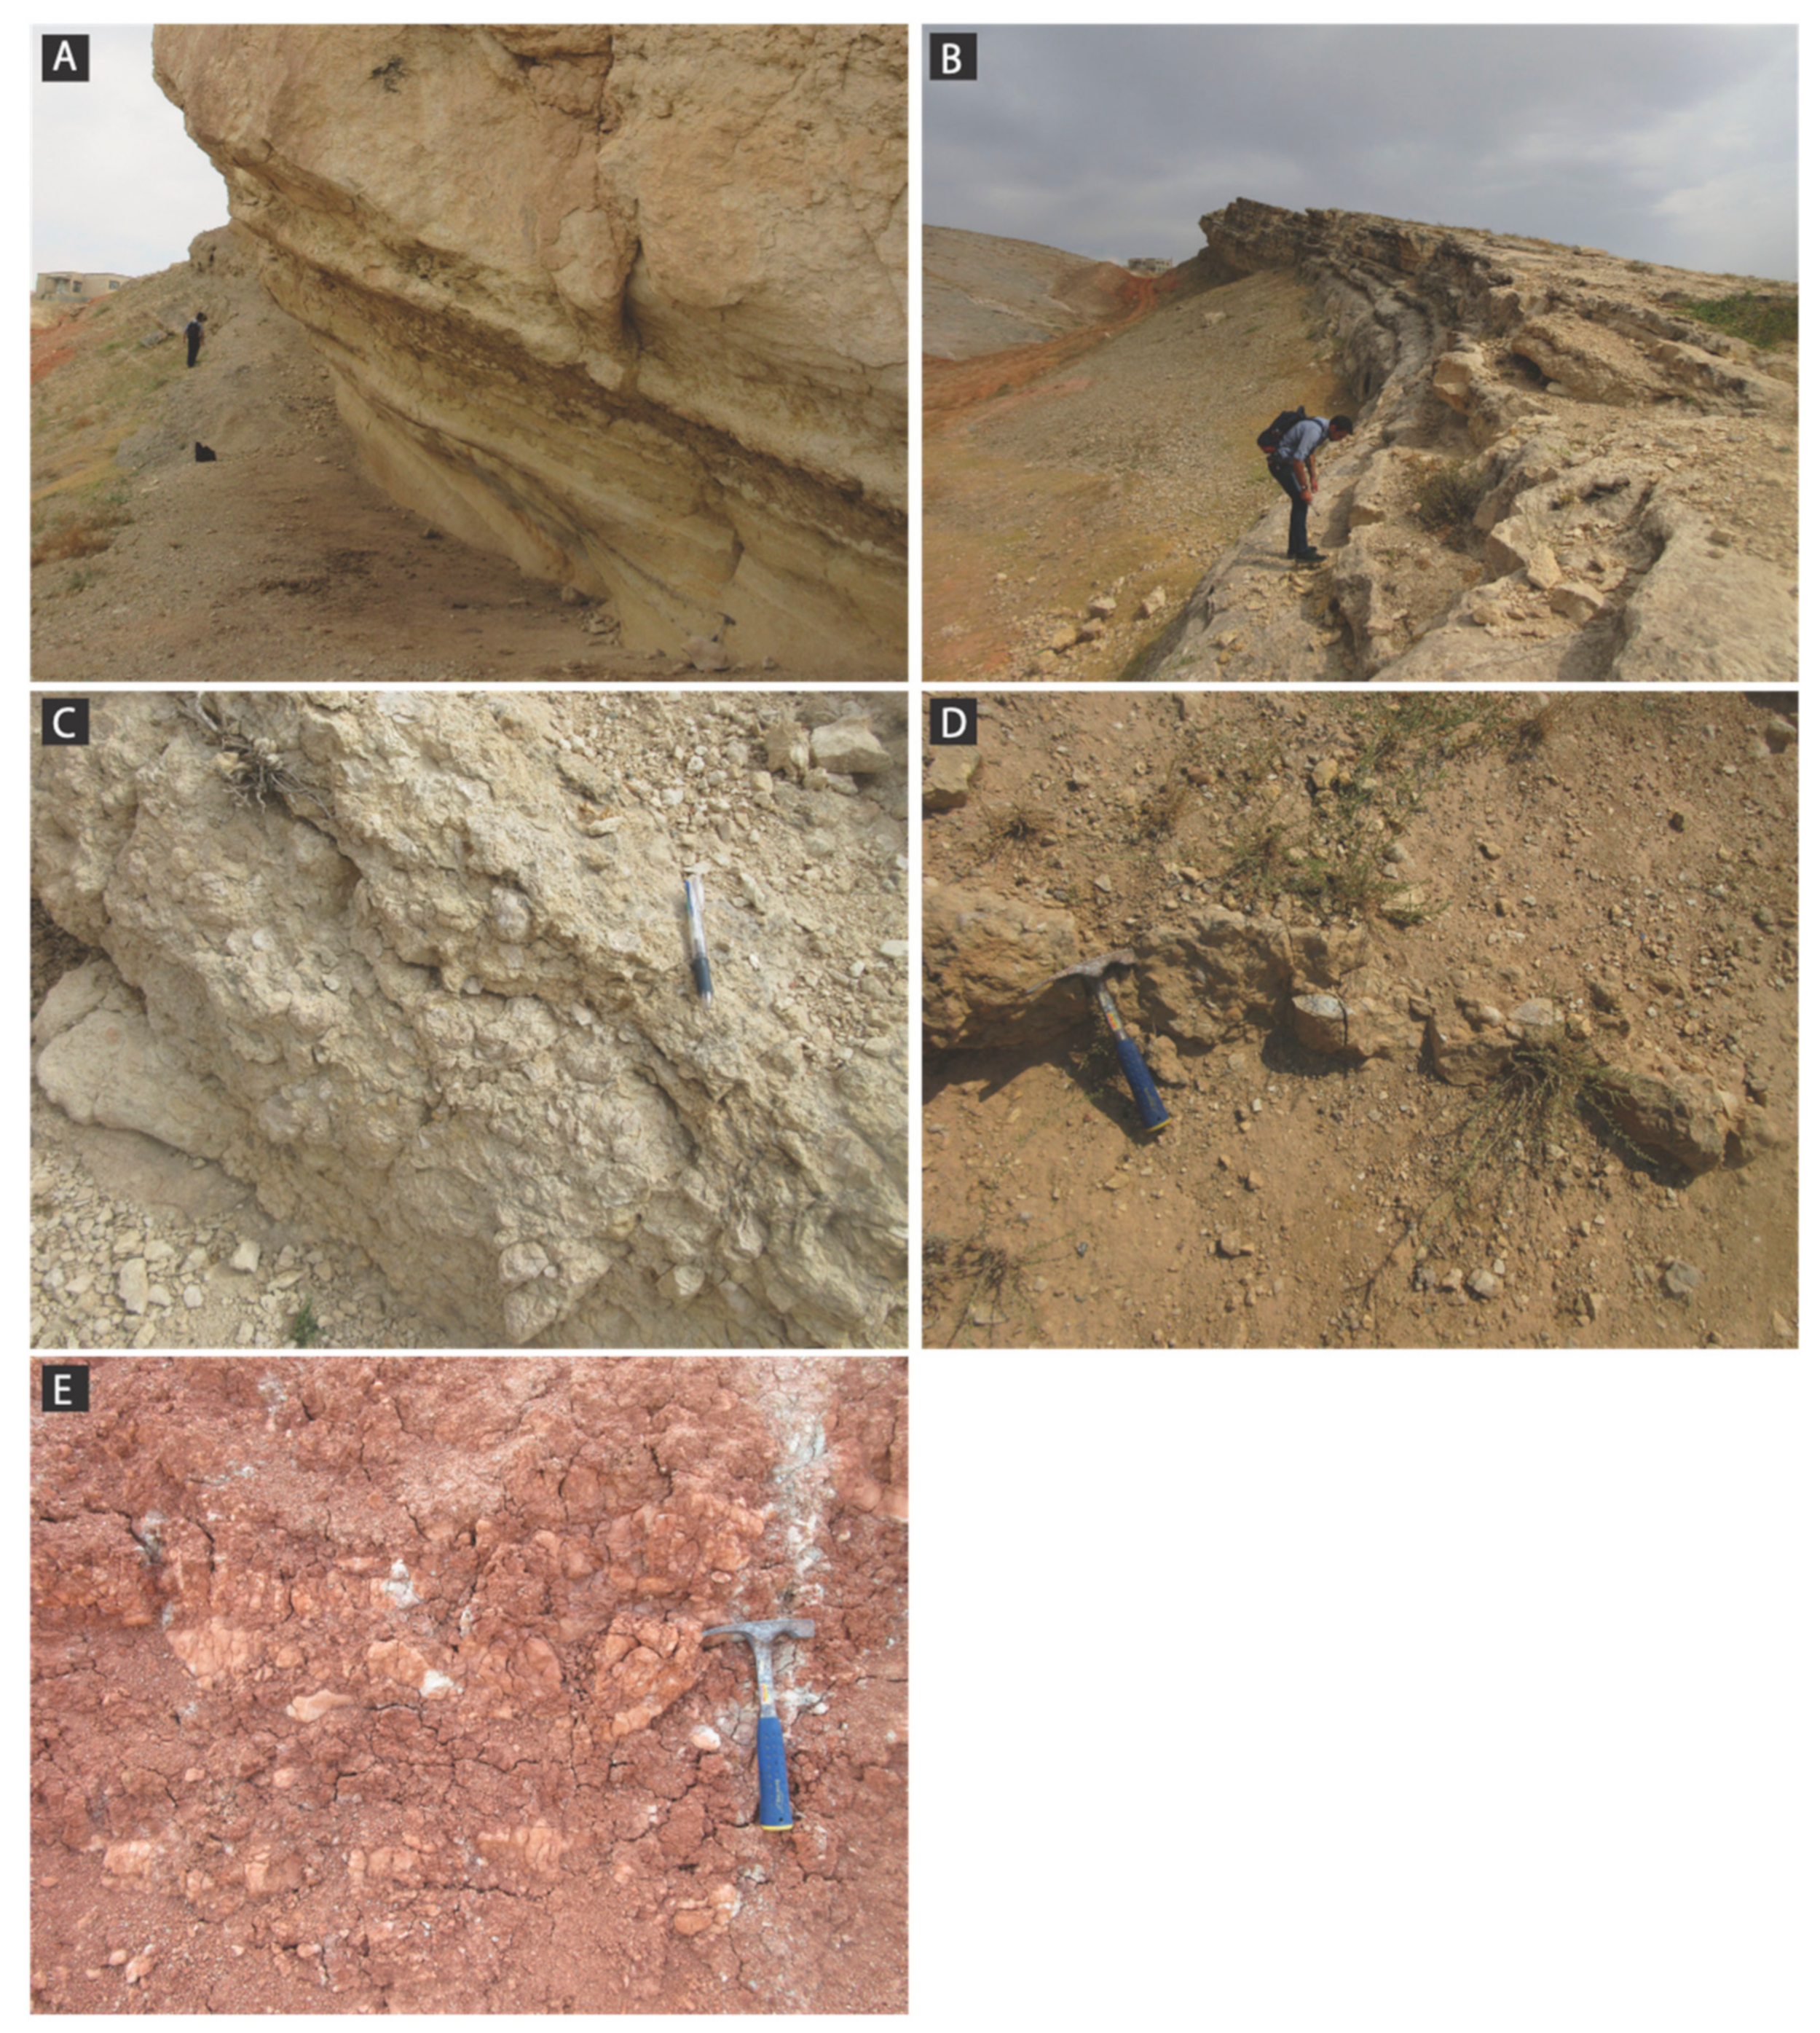
4.1. Lithological Descriptions of the Studied Sections

A laterally continuous limestone and clastic sequence covering 10 km was present in the northwestern Fergana Basin. The conspicuous sequence was composed of two or three limestone beds and intercalated fine-grained sandstone and red beds. This sequence could be observed at three localities, namely, Gava, Varzyk, and Karabulak, from west to east. The Gava section consisted of Gava-1, which was along the village road, and Gava-2, which was located approximately 500 m eastward (Figure 2). The Karabulak section corresponding to the type section is shown in Figure 3, and representative field photographs are presented in Figure 4 and Figure 5. Each section was treated here in terms of the lower sequence and the upper sequence (Figure 3). The field photographs of the remainder of the Gava and Varzyk sections are provided as supplementary materials (i.e., Figures S1 and S2).

4.1.1. Karabulak Section

This section was located at the southern bank of the water reservoir and the lower sequence was composed of coarse-grained clastics (Figure 2 and Figure 3). Its thickness was more than 15 m and the upper part comprised medium- and coarse-grained sandstone accompanied by sandy shell beds (Figure 4D). These sandy shell beds were developed in at least two stratigraphic levels with a 1 m interval. The presence of shell beds was remarkably different from the case of the limestone beds in the upper sequence. Microscopic observations showed that the sandy-shell bed consisted of quartz grains within a sparry calcite cement matrix. Plagioclase and calcite grains were also present as minor components, although monocrystalline quartz was predominant. These grains were medium- to coarse-grained, very angular to angular, and poorly sorted (Figure 6C,D). In addition, the lower part of the Karabulak section comprised a red bed that was approximately 8 m thick. The red bed contained characteristically reworked calcareous nodules (Figure 4E), which may have been of caliche origin. Thus, the red bed was classified as a paleosol [28].
As shown in Figure 3, the upper sequence was characterized by intercalated limestone beds and began with 15 m thick limestone, followed by 30 m thick mudstone and fine-grained sandstone with conglomeratic beds, and then 5 m thick limestone, in that order (Figure 5A). The two limestone beds of the upper sequence were rich in oyster shells and represent coquina shell beds. Microscopic observations showed that the lower limestone predominantly consisted of several fine-grained fragments of calcareous bioclasts, such as bivalve shells and corals, while the upper limestone was characterized by the presence of microoncoids, oolite grains, and bioclastic fragments (such as gastropods and bivalves) within a dusty matrix (Figure 6G,H). In addition, it should be noted here that the clastics were red in the lower part and yellowish-gray in the upper part, and thus, the transition from the red bed to the upper limestone could be distinctly observed (see Figure 5B). As depicted in Figure 5C, the crudely bedded red bed consisted of mudstone, in addition to some pebbles and cobbles, and it was overlain by a clast-supported conglomerate (Figure 5D). This conglomerate consisted of pebbles and cobbles and was subangular to subrounded clasts composed of fine-grained sandstone that was approximately 5 m in thickness. This conglomerate was also crudely bedded with fine-grained sandstone and was overlain by parallel laminated fine- to very fine-grained sandstone that was approximately 3 m thick (Figure 5E).
It should be noted here that the sandstone was characterized by the intercalation of a matrix-supported conglomerate in which burrows were developed (Figure 5F). More specifically, burrows developed in the 3 m thick fine-grained sandstone overlay the parallel-laminated sandstone unit. As shown in Figure 5F, the burrow density increased upward, and the burrow-containing sandstone was overlain by shell beds (Figure 4A) ranging from 10 cm to 1 m in thickness (Figure 4B). The accumulation of shells was found to be considerably dense (Figure 4C), and the total thickness of the shell bed was determined to be 5 m.
This sequence of red beds, conglomerates, burrow sandstone, laminated sandstone, and shell beds represented the main facies of the Cenozoic System in the northeastern Fergana Basin, thereby suggesting a transgressive sequence.

4.1.2. Varzyk Section

The lower sequence of the Varzyk section was composed of conglomerates, red-green beds, and fine-grained sandstone, in ascending order. As shown in Figure S1D, the total section of the lower sequence, approximately 30 m thick, was observed precisely, and the conglomerate consisted of rounded pebbles within a muddy matrix. In addition, the conglomerates were crudely stratified and were overlain by red-green beds composed mainly of mudstone (approximately 15 m thickness) and fine-grained sandstone. The red-green beds were composed mainly of mudstone. The sandstone bed sporadically yielded shell fossils (Figure S1E).
Two shell beds of limestone were present in the upper sequence of the Varzyk section, wherein both the lower and upper shell beds created ridges in the cuesta topography (Figure S1A). The red beds between the two shell beds were strongly weathered, and as a result, the relationship between the lower and upper shell beds could not be observed (Figure S2B). Indeed, the red beds were observed only along the artificially excavated trench (Figure S1C). Furthermore, the lower limestone was approximately 3 m thick, whereas the upper limestone was approximately 4 m thick. The stratigraphic gap between the two limestone beds was estimated to be 25 m at least, and the red beds occupied the upper parts. Both limestone levels were thickly bedded and were a few dozen centimeters thick. The lower beds characteristically yielded abundant oyster shells (Figure S1B).

4.1.3. Gava-1 and Gava-2 Sections

The Gava section comprised both Gava-1 and Gava-2. The lower sequence was moderately well exposed in the Gava section, and in particular, in the Gava-2 section, the shell bed was present approximately 3 m below the upper sequence (Figure 3 and Figure S2B,C). The microscopic features of the shell beds at Gava-1 were comparable with those of the Karabulak section, wherein several very angular quartz grains were present within the sparite matrix containing bivalve shells (Figure 6C,D). The lower sequence was underlain by various colors of mudstone intercalating the shell beds. Mudstone, red-green beds, and conglomerates were also exposed in the lower sequence.
The upper sequence of the Gava section is comprised of three limestone beds (Figure 3 and Figure S2A), unlike in the case of the Karabulak and Varzyk sections. More specifically, the lower two limestone beds were intercalated with red beds, although there was no rock exposure in the upper interval between the upper limestone beds. Furthermore, the lower and middle limestone beds could be observed in the Gava-1 section (Figure S2D). In this case, the lower limestone bed was crudely stratified, was rich in oyster shells, and was categorized as a coquina bed (Figure S2E). It was also overlain by a 4 m thick red bed. The middle limestone bed was micritic, and no fossils have been detected thus far (Figure S2F,G). The middle limestone bed was also thick and crudely stratified. In contrast, the upper limestone layer yielded abundant oyster shells, and based on microscopic observations, it was categorized as an oncoidal and bioclastic grainstone (Figure 6E,F). Several oolitic grains and bioclastic fragments, such as bivalves, gastropods, and foraminifers, were also present within a sparry calcite cement matrix, while the microscopic bio-skeletons and fragments with diameters less than 1 mm were identified as microlite-coated cortoid particles.

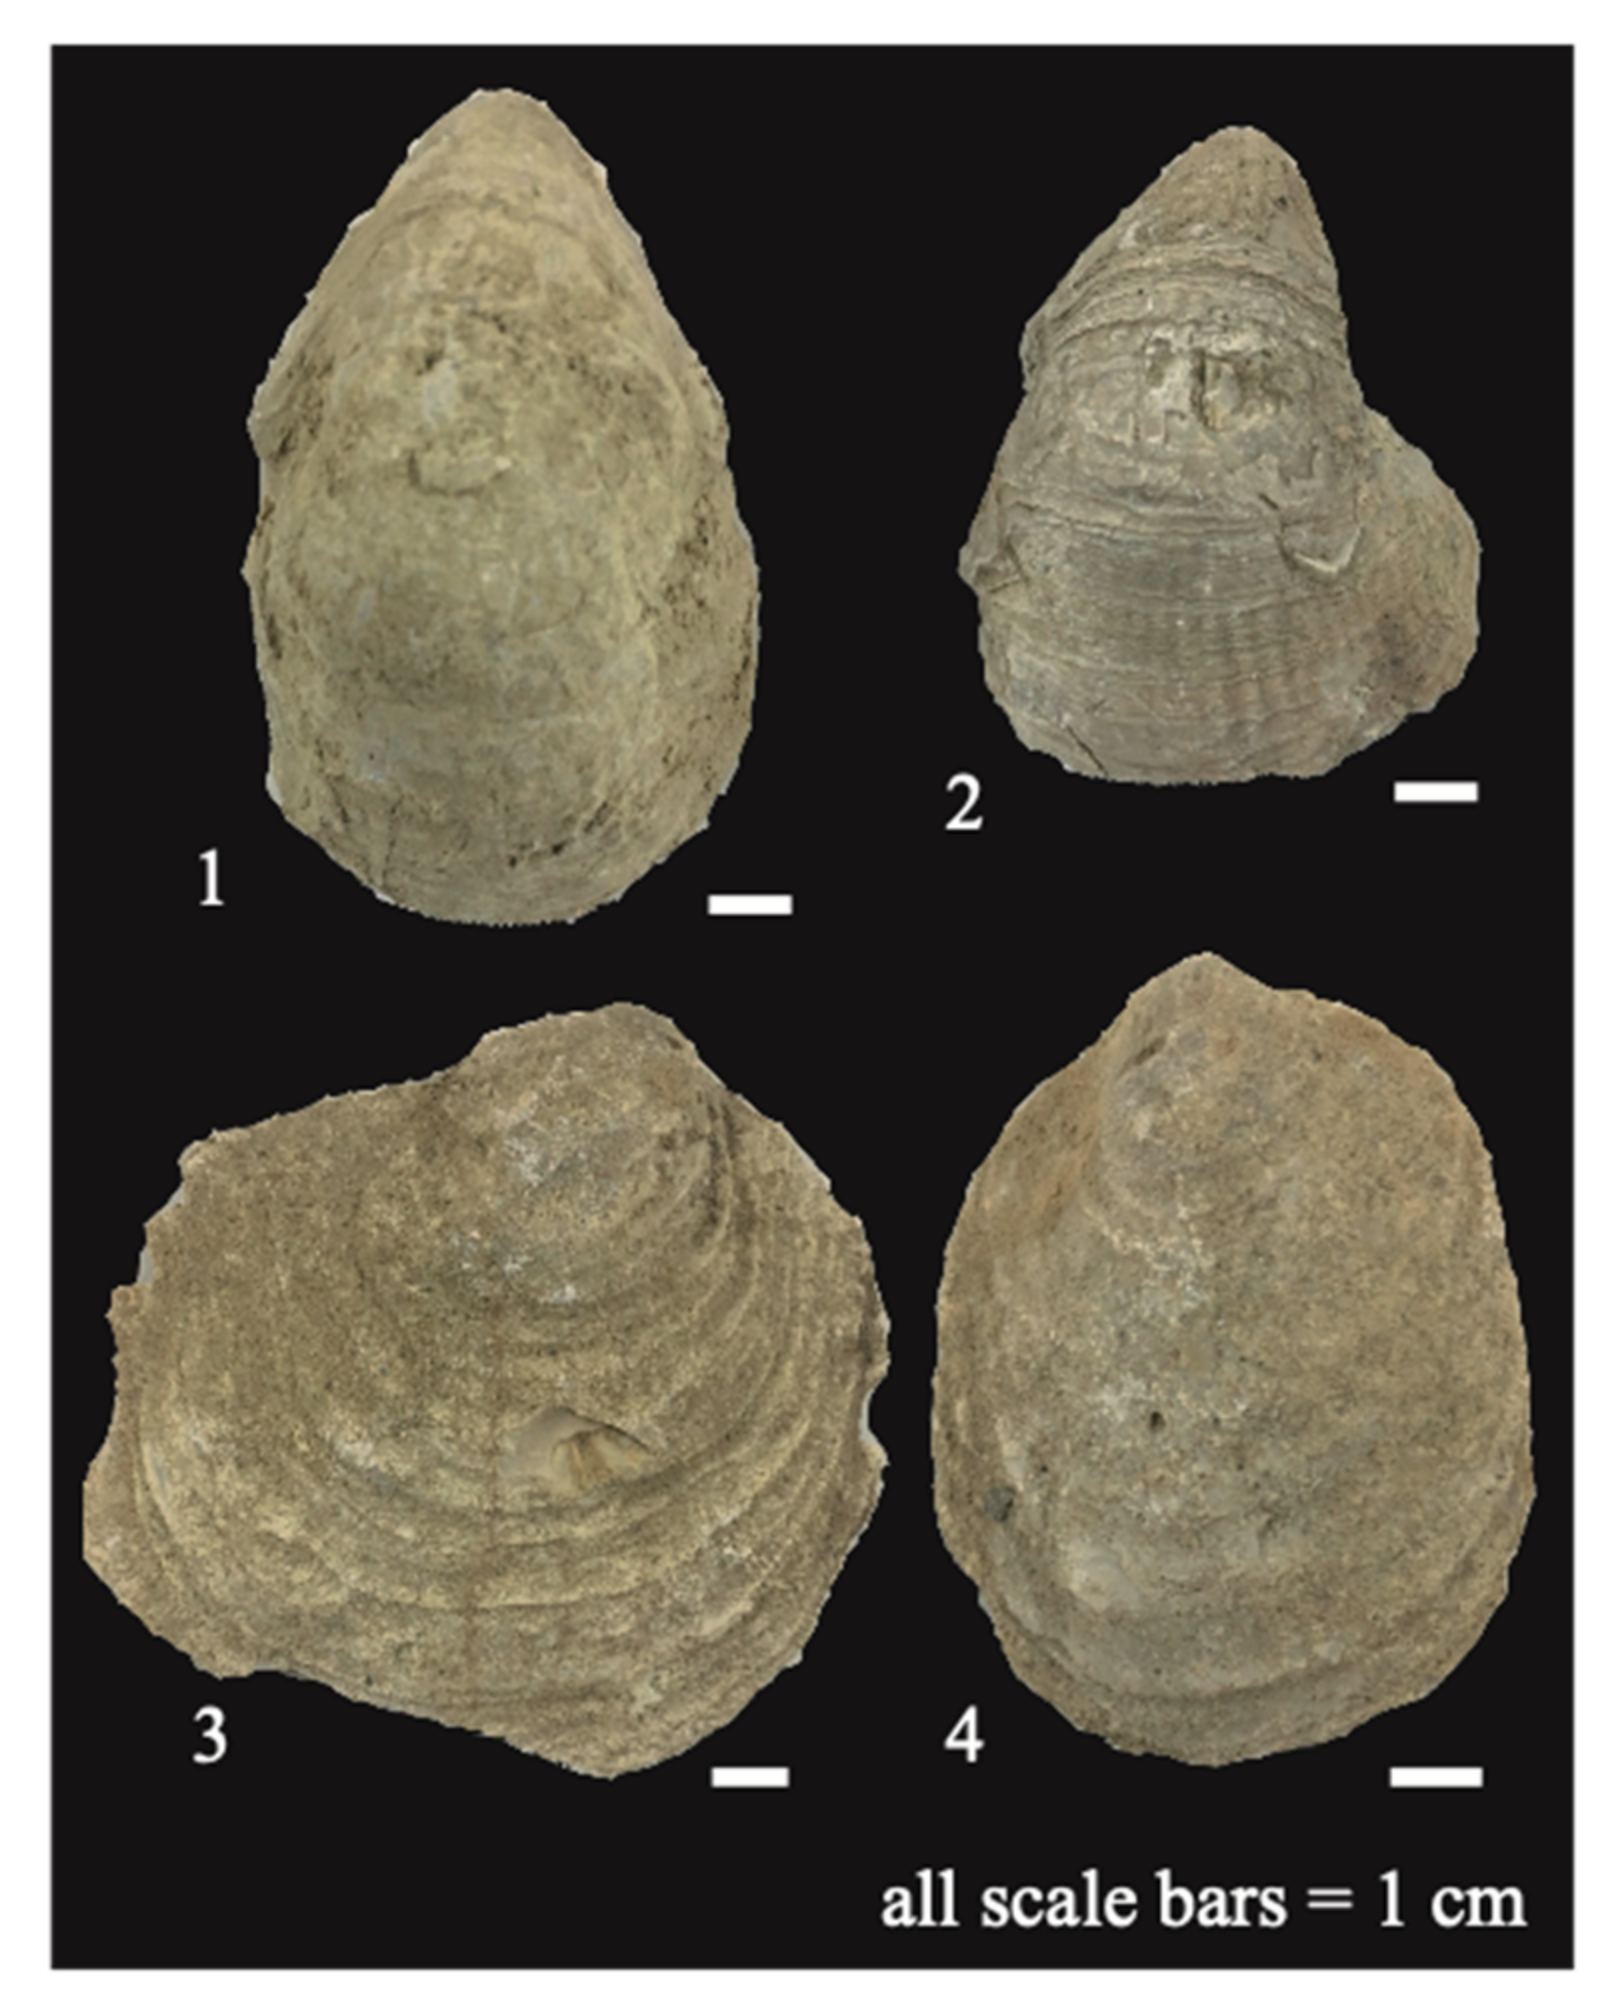
4.2. Fossil Occurrence

Shell beds containing numerous mollusk fossils were observed in all the measured sections (Figure 3 and Figure 7). These shell beds were densely packed with bivalves, such as oyster fossils, and several oysters corresponding to the Pycnodonte, Liostrea, Gryphae (Crassostrea), and Ostrea (Turkostrea) genera were identified (Figure 7). Generally, the ages of these genera are Maastrichtian–Middle Miocene for Pycnodonte, Ladinian–Holocene for Liostrea, Ladinian–Late Eocene for Gryphaea (Crassostrea), and Maastrichtian–Middle Miocene for Ostrea (Turkostrea). However, due to the moderately long ranges of these genera, a detailed geological age cannot be assigned to the mollusk fossils. However, considering the co-occurrence of these fossils and the stratigraphy and geological examinations carried out in previous studies [5,6,7,11,12], the geological ages suggested by these fossils indicated Late Cretaceous to Eocene.

4.3. Isotope Results

As presented in Table 1 and Figure 7, the sulfur isotopic compositions (𝛿34S) of the measured fossil shells from the sandstone shell beds of the lower sequence were between 14.94 and 16.82‰. In addition, the 𝛿34S values for the limestone and fossils from the lower sequences of the four sections range between 19.37 and 21.19‰, which deviated from the result obtained for the sandstone shell beds. Furthermore, the 87Sr/86Sr ratios of the bivalve fossil samples from the lower sequence ranged between 0.707772 and 0.707875 (Table 1, Figure 7), whereas the 87Sr/86Sr ratios of the upper sequence samples ranged between 0.707812 and 0.708063 (Figure 7).

5. Discussion

5.1. Geological Correlation Based on Lithostratigraphy and Fossil Occurrence

The regional stratigraphy and lithological features distributed in the northern part of the Fergana Basin are characterized by various clastic rocks intercalated with several horizons of limestone beds. The clastic rocks of the studied sections predominantly comprise intercalated red mudstone and sandstone with several beds of a conglomerate. As mentioned above, reddish mudstone often contains caliches and is interpreted as terrestrial sediment [28].
It was also found that two or three limestone beds contained mollusk (i.e., oyster) fossils. As mentioned above, these limestone beds contained many oncoidal bioclastics, including gastropods, bivalves, foraminifers, and oolite grains. Thus, along with the microscopic textures of these beds, the presence of such components indicated that the limestone was of shallow marine origin. In addition, due to the fact that the surfaces of these calcareous substances were only dissolved to a small extent, the sedimentary site of the oncoidal particles was likely a moderately low-energy setting that contained water that was not saturated with calcium carbonate (e.g., a tidal flat). However, the moderately large shells, such as bivalves, did not present a microlite film, and so the presence of a sparite matrix suggests deposition in a moderately high-energy environment (e.g., a shoreface). Thus, the oncoidal particles were regarded as having been deposited in a low-energy sedimentary environment and then reworked in a relatively high-energy environment.
The characteristics of these limestone beds contrasted with the surrounding terrestrial beds and are favorable landmarks from a geological correlation perspective. This line of evidence indicated that the sedimentary sequence of the study sections could be correlated with a sequence of rocks referred to as the Fergana Formation in [2,18]. In particular, based on the lithological sequence, the upper sequence, which was characterized by the intercalation of limestone beds, correlated with the Alai and/or Turkestan formations (Table 2) [18,29]. In addition, the mollusk fauna from shell beds associated with the marine limestone beds was dominated by oysters, as mentioned above (see also Figure 7); the inclusion of this type of marine fauna within terrestrial reddish facies was previously reported in the proto-Paratethys sediments of the Afghan–Tajik and Tarim basins [2]. Although a few bivalves were identified in this study, their dense occurrence and the predominant presence of oysters indicated that the limestone beds and the shell bed could be broadly correlated. Thus, the geological correlation indicated that the limestone beds distributed in the northern part of the Fergana Basin, Eastern Uzbekistan, were a product of the incursion of the proto-Paratethys Sea [2,18].

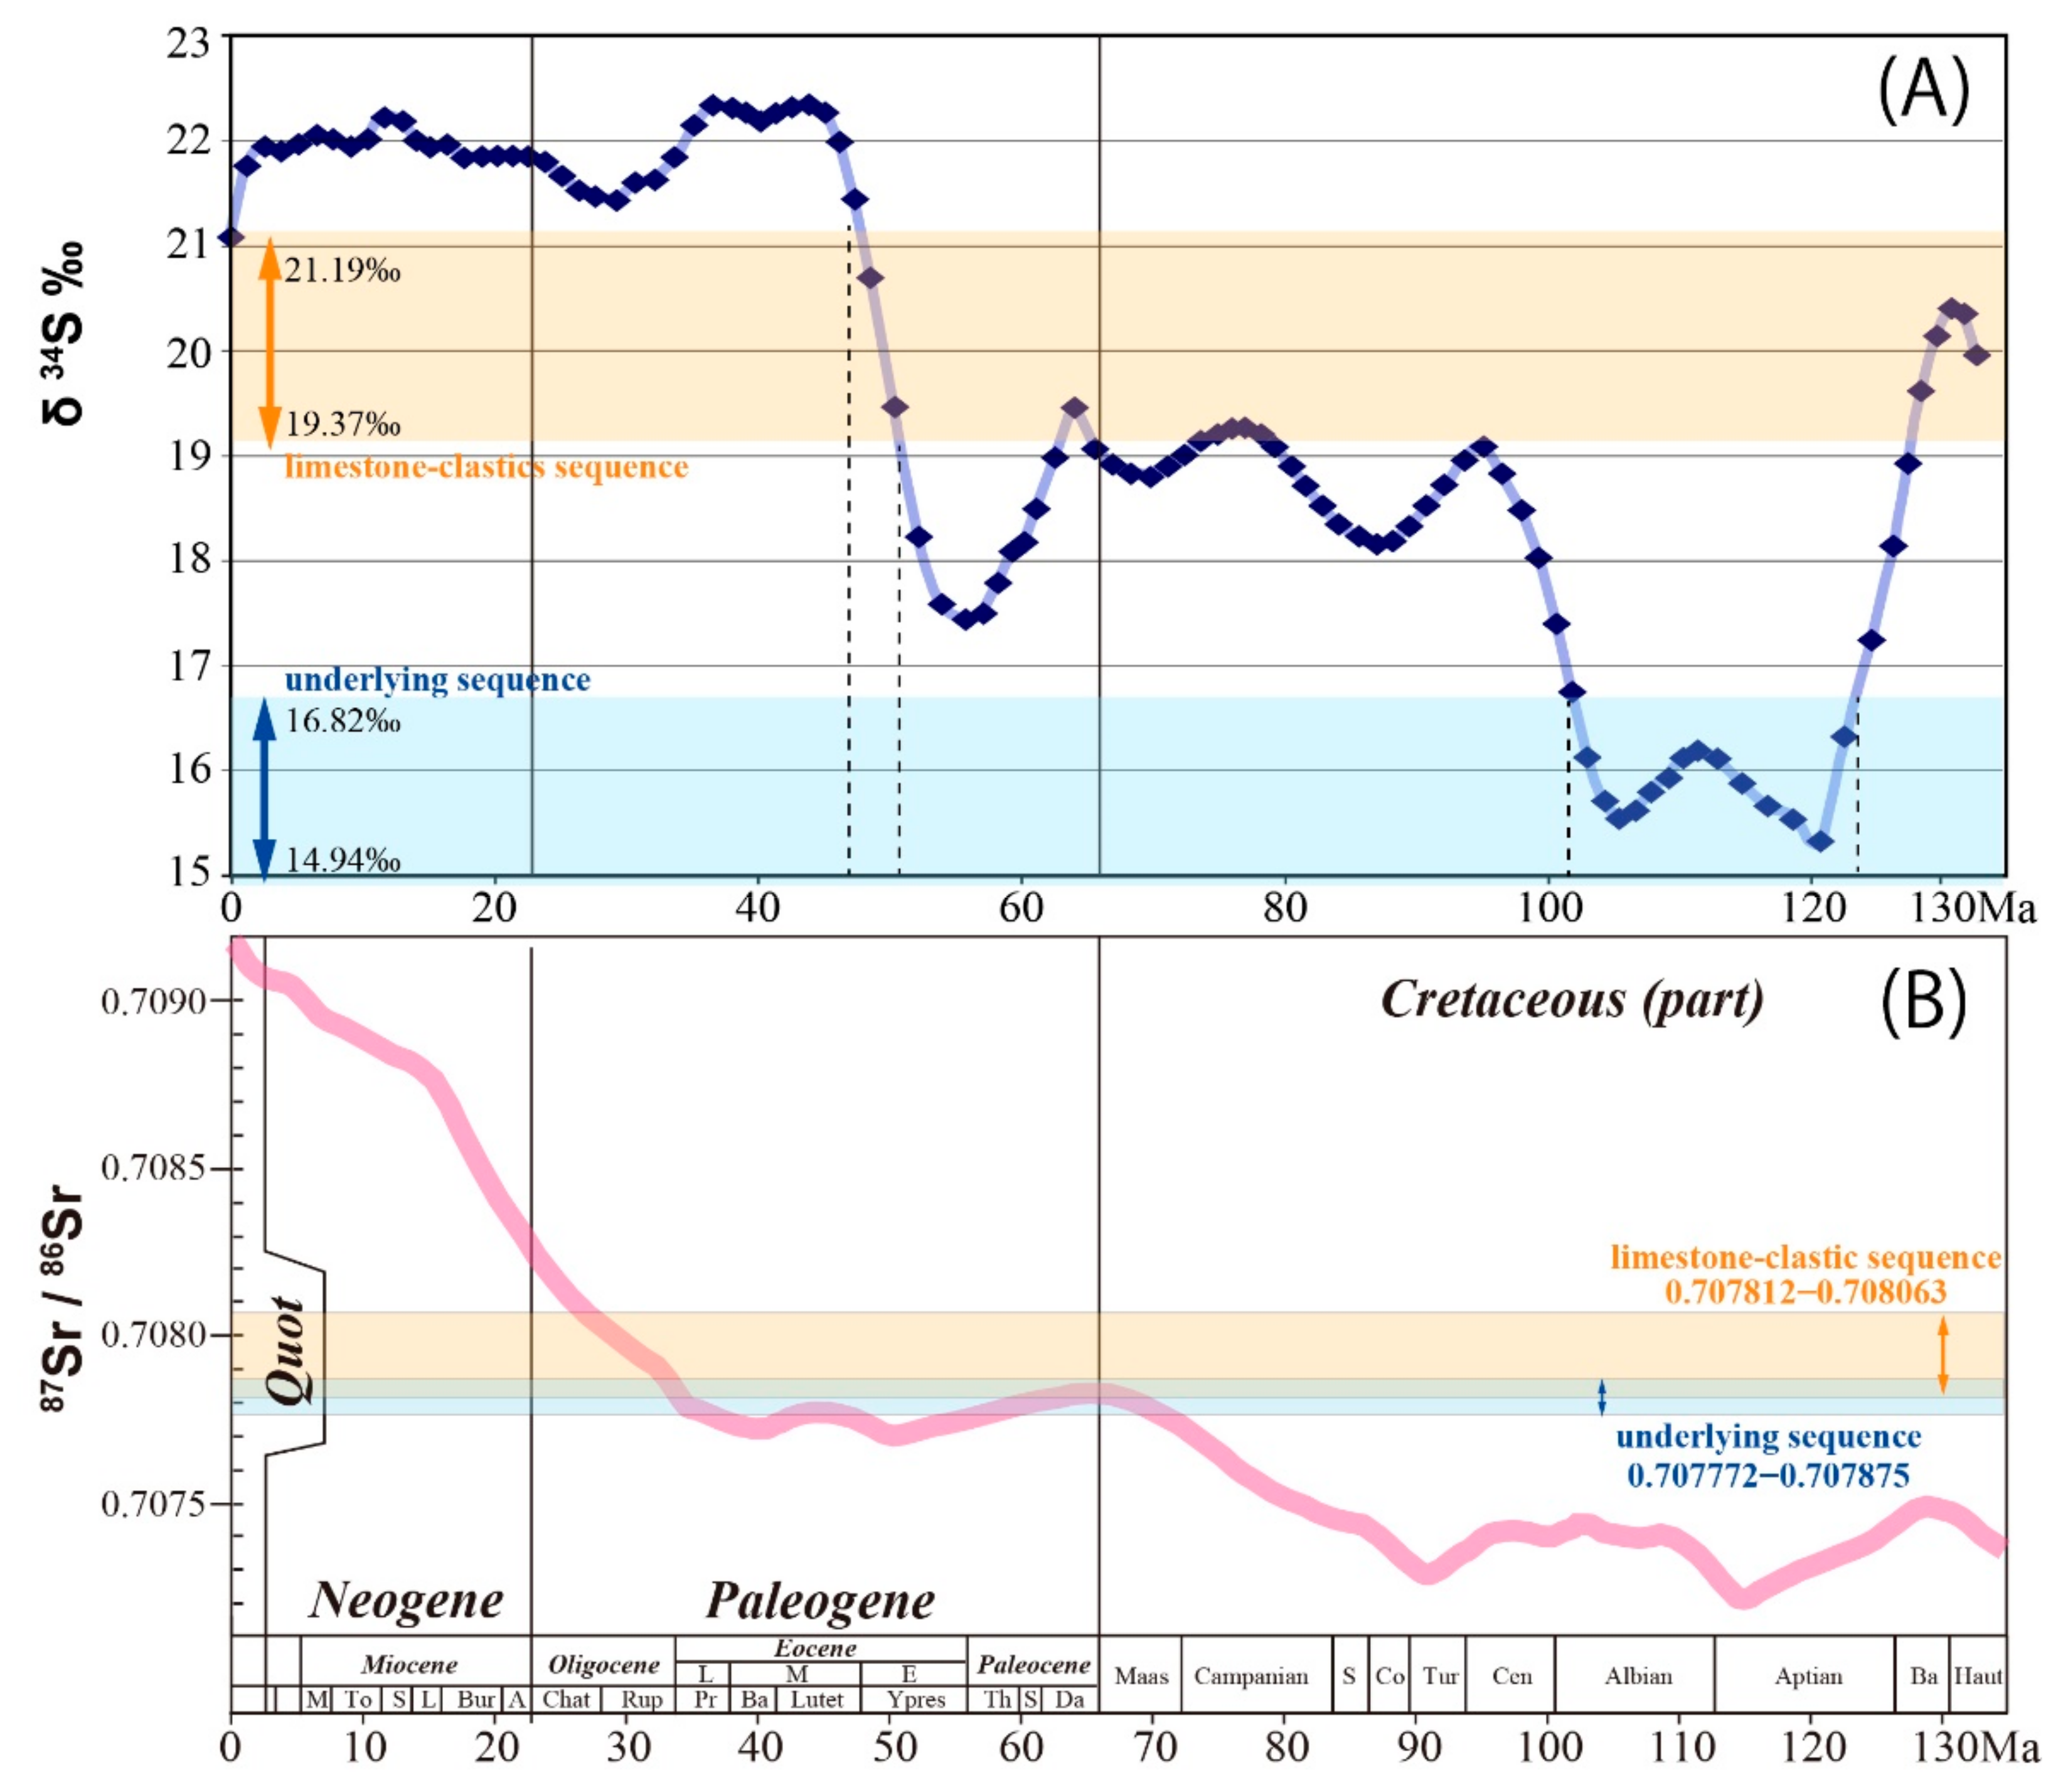
5.2. Geological Age Estimation by S and Sr Isotopes

The sulfur isotopic composition of the dissolved sulfate in seawater varies with geological time, and sulfur isotope records include data sets from the Cambrian to the present [30,31,32]. The variation and moderately high rates of change of this composition show distinctive excursion curves and characterize specific time intervals in geological time [33], and thus, it is possible to form geological correlations and determine the geological ages of sediments using sulfur isotope analysis [34,35]. In particular, from the Cretaceous to the Cenozoic, high-resolution sulfur isotope excursion was restored based on barite within precisely age-determined core sediments [36,37], and a sulfur isotope curve was obtained from pelagic marine barites of the Cretaceous and Cenozoic periods, resulting in an unprecedented temporal resolution [36,37]. These results generally agree with those obtained from the carbonate-associated sulfates that are present in carbonate sediments [32]. As mentioned above, since the sulfur isotope ratio curve plotted from the Cretaceous to the Cenozoic is considered to be effective for age dating, we discuss the age determination of our samples based on the sulfur isotope ratios determined during our study.
As mentioned in the context of fossil occurrence, the mollusk fauna obtained from the studied sections consisted mainly of oyster fauna. In addition, rudists, which are the representative bivalves that were extinct at the end of the Cretaceous, were absent from this fauna. This almost surely excluded the Cretaceous period from the age determination process based on the observed fossil occurrence.
Based on the sulfur isotopic curve plotted from the Cretaceous to the present time [34], the isotopic composition of the limestone beds comprising the upper sequence corresponded to the steep 50–45 Ma section of the slope (Figure 8A). This part of the slope correlates with the period during which the sulfur isotope ratio rose rapidly and corresponded to the Early to Middle Eocene. In addition, the increasing trend of the δ34S values from the lower layer to the upper layer (i.e., from 19.44 to 20.46‰ for the Gava-1 section) also supported this age assignment since higher isotopic values ranging from 19.37 to 21.19‰ were observed for the lowest Cretaceous in the isotope curve. However, as mentioned above, this age should be excluded based on fossil occurrence.
In contrast, the low values (i.e., 14.94‰ and 16.82‰) obtained from the shells of the lower sequence were similar to those of the Early Cretaceous (approximately 120 and 100 Ma) when the sulfur isotope ratio was extremely low. However, considering the range of fossils that were present in this sample, it was difficult to make such a specific assignment to the Early Cretaceous. It should be noted here that the inconformities and eroded surfaces that indicated a large time gap was not observed between the upper and the lower sequences. Although the lithology and fossil contents of the limestone beds comprising the upper sequence indicated a shallow marine origin, the numerous clastics that comprised the lower sequence indicated that this sequence may be affected by terrestrial sedimentation and fresh water. It is, therefore, possible that this supply of terrestrial water recorded a sulfur isotope ratio lower than that of the seawater at that time. This could be attributed to the fact that the sulfur isotope ratios of seawater were higher than those of any of the ocean input sources due to the removal of low-δ34S sulfur from seawater through bacterial sulfate reduction [39]. In addition, although unlikely, the reworking of the bivalves could not be excluded as a cause of the observed isotopic compositions.
In addition to the S isotopic composition, the strontium (Sr) isotopic composition was also measured in this study. More specifically, the Sr isotopic compositions of the measured samples were 0.707812–0.708063 for the lower sequence and 0.707772–0.707875 for the upper sequence (Table 1, Figure 8B). These Sr isotopic compositions are equivalent to the Paleogene value of the LOWESS (locally weighted scatterplot smoothing) curve (see also Figure 8B) [27,38]. Although this result was not exactly concordant with the geological age indicated by the sulfur isotope ratio, it was closer to the value of the Paleogene than that of the Cretaceous. As a result, the Sr isotope ratio appeared to support our interpretation regarding the geological age estimation based on the fossil contents and the S isotopic composition. However, further studies are required to determine whether the effects of freshwater and terrestrial materials are also observed in the case of the Sr isotopic composition.
As described in detail above, the sections in this study were characterized by large amounts of terrestrial and reddish clastics, in addition to the intercalation of two or three marine limestone beds. These stratigraphic and lithologic properties were extremely similar to those of the Suzak, Alai, and Turkestan Formations of the Fergana Group in the northern Fergana Basin within Kyrgyzstan [2,18], and within the Alai Valley Basin [2,18], which was assigned to the Early to Middle Eocene (Table 2). Because the Cenozoic sedimentary rocks distributed in the Fergana Basin contained a large amount of terrestrial sediments, it was difficult to precisely determine their geological age. Although the depositional age was estimated using mollusks and two isotopic compositions (S and Sr), further studies are required based on the investigation of microfossils, such as foraminifera.

5.3. Recognition of the Fourth Transgression at the Northern Fergana Basin

Mesozoic and Cenozoic sediments distributed in the Fergana Basin, along with rocks from the Afghan–Tajik and Tarim basins, were targeted to examine the range of the proto-Paratethys Sea in Central Asia. As mentioned above, the lithology and stratigraphy of the studied sections, in addition to the mollusk fossil contents and the depositional ages determined by the S and Sr isotopic compositions, indicated that the study sections should be assigned to the Early to Middle Eocene. Recently, the lithostratigraphy and depositional ages of the Cretaceous to Paleogene sediments distributed in the southern part of the Fergana Basin were investigated and its equivalent sequences distributed in the Afghan–Tajik Basin and the Alai Valley Basin were reviewed [2,29]. These studies established a detailed geological correlation of the sequence among the basins in Central Asia and clarified the transitions of the proto-Paratethys Sea during the Cretaceous to Paleogene, wherein five cycles of transgression and regression occurred. The third of these cycles was considered to be the largest [2,13,40,41], and the peak of the fourth transgression was estimated to have taken place around the Middle Eocene (Lutetian) [29,42]. As shown in the LOWESS curve of Figure 8, the limestone beds in the upper sequence possess S and Sr isotopic values equivalent to those of the Early to Middle Eocene (ca. 50–45 Ma). In addition to the depositional age estimated by S and Sr isotopic analyses, the presence of microscopic features that were characterized by shallow-water indicators, such as oncoidal and oolite grains, indicated that the limestone beds should correspond to the fourth transgression stage of the proto-Paratethys Sea in the study area. Moreover, the sandstone shell beds of the lower sequence densely yielded oyster shells and consisted mainly of angular and poorly sorted quartz grains. Since the sulfur isotope ratio indicates the influence of fresh water, it was predicted that these shell beds corresponded to the intertidal deposits. The transition from the terrestrial lower sequence to the upper sequence consisting of limestone clastics may therefore represent the fourth transgression stage of the proto-Paratethys Sea in the Early to Middle Eocene in the northern part of the Fergana Basin within Uzbekistan.

6. Conclusions

In summary, the lithostratigraphy of the limestone and clastic rocks of the northern Fergana Basin, Eastern Uzbekistan, was investigated and described. For this purpose, the studied sections were divided into two sequences, namely, the lower sequence consisting of coarse-grained terrestrial clastics and the upper sequence consisting of limestone clastics characterized by intercalated limestone beds. Macrofossils represented by bivalves, such as oysters, were obtained from sandstone shell beds of the lower sequence and the limestone beds of the upper sequence. In addition, the determination of the sulfur isotope values of the limestone beds of the upper sequence indicated a moderately high sulfur isotopic composition in the 19.37–21.19‰ range. Conversely, the strontium isotopic compositions of the measured samples were 0.707812–0.708063 for the lower sequence and 0.707772–0.707875 for the upper sequence. Furthermore, the sulfur isotopic composition of the lower sequence shell bed gave a moderately low composition, ranging from 14.94 to 16.82‰. Tangents between this isotopic composition and the LOWESS (locally weighted scatterplot smoothing) curves indicated that this sequence originated from the Early Cretaceous period; however, it is probable that the isotopic composition differed from that of seawater at the time owing to the presence of terrestrial clastics and the freshwater effect. These results indicated that further studies are required to accurately determine the age of the lower sequence. In addition, the absence of the rudist from current macrofossil fauna excluded the lower sequence from the Cretaceous; therefore, determining the age of the lower sequence requires further studies. On the other hand, the tangents between the isotopic compositions from the limestones and oyster shells from the upper sequence and LOWESS curves indicated the Early to Middle Eocene (ca. 50-45 Ma). Moreover, the lithofacies and age determination of the upper sequence indicated that the upper sequence could be correlated with the Fergana Group in the Fergana Basin within the Kyrgyzstan territory, as well as the Suzak, Alai, and Turkestan Formations in the Alai Valley Basin, which are representative horizons of the fourth transgression of the proto-Paratethys Sea. Thus, the lithofacies, macrofossil contents, geological correlations, and age determination based on the S and Sr isotopic compositions indicated that the limestone beds distributed in the northern Fergana Basin were remnants of the fourth transgression of the proto-Paratethys Sea during the Eocene.

Supplementary Materials

The following supporting information can be downloaded at: https://0-www-mdpi-com.brum.beds.ac.uk/article/10.3390/geosciences12050203/s1, Figure S1: Field view of the sedimentary rocks at the Varzyk section of the northern Fergana Basin; Figure S2: Field view of the sedimentary rocks at the Gava section of the northern Fergana Basin.

Author Contributions

O.U.O.A. was responsible for planning the research methodology, conducting the research, analyzing the data, and concluding the research results. Y.K. was responsible for the lithostratigraphy and microscopic observations of the limestone texture. T.M. was responsible for the sulfur isotopic analysis. J.K. and S.W. were responsible for the strontium isotopic analysis. K.-i.H. initiated the study and conducted the field investigations. All authors read and agreed to the published version of the manuscript.

Funding

O.U.O.A. received the Takayama International Education Foundation scholarship for five years. Scholarship ID: 16-31-11-497.

Data Availability Statement

Not applicable.

Acknowledgments

We would like to thank Q. Mingboev and M. Rizayev of the Regional SUE of the State Committee of the Republic of Uzbekistan for Geology and Mineral Resources for their support during our geological survey in Uzbekistan. Special acknowledgments should also be paid to Sherzod Makhmudov for his sincere support during our survey, in addition to providing accommodation and transportation. We would also like to thank two anonymous reviewers for their thorough review of our manuscript and their valuable comments and suggestions. Furthermore, we thank K. Nagaishi and T. Kawai (Marine Work Japan Co., Ltd.) for their technical support during sample preparation and during the strontium isotopic analyses at the Kochi Core Center, JAMSTEC. We also thank K. Sugihara (University of Tsukuba) for helpful suggestions during the microscopic observation of the limestone samples. Finally, we thank M. Watarai (Meikei High School) and K. Asato (Fukui Prefectural Dinosaur Museum) for assistance with the bivalve observation and identification processes. This research consisted of some of the IGCP 710 projects.

Conflicts of Interest

The authors declare no conflict of interest.

References

  1. Burtman, V.S. Cenozoic crustal shortening between the Pamir and Tien Shan and reconstruction of the Pamir-Tien Shan transition zone for the Cretaceous and Palaeogene. Tectonophysics 2000, 319, 69–92. [Google Scholar] [CrossRef]
  2. Bosboom, R.E.; Dupont-Bosboom, R.; Mandic, O.; Dupont-Nivet, G.; Proust, J.-N.; Ormukov, C.; Aminov, J. Late Eocene palaeogeography of the proto-Paratethys Sea in Central Asia (NW China, southern Kyrgyzstan and SW Tajikistan). In Geological Evolution of Central Asian Basins and the Western Tien-Shan Range; Brunet, M.-F., McCann, T., Sobel, E.R., Eds.; Geological Society of London, Special Publications: London, UK, 2017; Volume 427, pp. 565–588. [Google Scholar]
  3. Jolivet, M. Mesozoic tectonic and topographic evolution of Central Asia and Tibet: A preliminary synthesis. In Geological Evolution of Central Asian Basins and the Western Tien-Shan Range; Brunet, M.-F., McCann, T., Sobel, E.R., Eds.; Geological Society of London, Special Publications: London, UK, 2017; Volume 427. [Google Scholar]
  4. Mirkamalov, R.H. Geological map of the Republic of Uzbekistan (1:2,500,000). In Atlas of the Geological Maps of the Republic of Uzbekistan; Turamuratov, I.B., Mirkamalov, R.H., Eds.; Research Institute of Mineral Resources (RIMR): Tashkent, Uzbekistan, 2016; pp. 18–19. [Google Scholar]
  5. Vialov, O.S. The Cretaceous and Paleogene of Fergana. Ac. Sci. USSR. Tadjik-Pamir Exped. Publ. 1936, 47, 1–47. [Google Scholar]
  6. Vialov, O.S. The boundary between the Cretaceous and the Paleogene at Fergana. Rep. Ac. Sci. USSR 1944, 42, 78–80. [Google Scholar]
  7. Vialov, O.S. The types of the Cretaceous Sections of Fergana. Rep. Ac. Sci. USSR 1945, 49, 277–280. [Google Scholar]
  8. Verzilin, N.N. The Cretaceous and pre-Cretaceous weathering crust of the Northern Fergana. Rep. Acad. Sci. USSR 1962, 146, 1153–1155. [Google Scholar]
  9. Verzilin, N.N. The Cretaceous deposits of the northern Fergana Basin and their oil-gas bearing. Leningr. Union Nat. Exp. Res. (LNR) Geol. Mineral. Dep. 1963, 120, 35–78. [Google Scholar]
  10. Glumakov, P.V. Fergana Depression. In Tectonics, Formation, and Oil-Gas Depositions of the Intermountain Basins; Nauka: Moscow, Russia, 1988; pp. 5–39. [Google Scholar]
  11. Abduazimova, I.M.; Kan, O.Y. The stratigraphy and paleogeography of the Cretaceous Fergana Depression by new case studies Part 1: Stratigraphy. J. Geol. Min. Res. 2012, 5, 3–12. [Google Scholar]
  12. Abduazimova, I.M.; Kan, O.Y. The stratigraphy and paleogeography of the Cretaceous Fergana Depression by new case studies Part 2: Paleogeography. J. Geol. Min. Res. 2012, 6, 3–10. [Google Scholar]
  13. Burtman, V.S.; Molnar, P. Geological and Geophysical Evidence for Deep Subduction of Continental Crust Beneath the Pamir; Special Papers; GSA: Boulder, CO, USA, 1993; Volume 281. [Google Scholar]
  14. Burtman, V.S.; Skobelev, S.F.; Molnar, P. Late Cenozoic slip on the Talas-Fergana Fault, the Tien Shan, Central Asia. GSA Bull. 1996, 108, 1004–1021. [Google Scholar] [CrossRef]
  15. Pomazkov, K.D. (Ed.) Kyrgyz Ssr Geological Description; USSR Geology Publishing House (NEWPA): Moscow, Russia, 1972. [Google Scholar]
  16. Askarov, F.A.; Bigaeva, A.R.; Saydyganiev, S.S. Absolute Geochronology of the Magmatic Formations of Uzbekistan; FAN UzSSR; Publications of Academy of Sciences UzSSR: Tashkent, Uzbekistan, 1974; pp. 127–134. (In Russian) [Google Scholar]
  17. Nalivkin, D.V. Geology of USSR; Publications of the Academy of Science USSR: Moscow, Russia, 1962. [Google Scholar]
  18. Bande, A.; Radjabov, S.; Sobel, E.D.; Sim, T. Cenozoic palaeoenvironmental and tectonic controls on the evolution of the northern Fergana Basin. In Geological Evolution of Central Asian Basins and the Western Tien Shan Range; Brunet, M.-F., McCann, T., Sobel, E.R., Eds.; The Geological Society of London, Special Publications: London, UK, 2017; Volume 427, pp. 313–335. [Google Scholar]
  19. Maruoka, T.; Isozaki, U. Sulfur and carbon isotopic systematics of Guadalupian-Lopingian (Permian) mid-Panthalassa: δ34S and δ13C profiles in accreted paleo-atoll carbonates in Japan. Island Arc 2020, 29, e12362. [Google Scholar] [CrossRef]
  20. Fry, B.; Silva, S.R.; Kendall, C.; Anderson, R.K. Oxygen isotope corrections for online δ34S analysis. Rapid Commun. Mass Spectrom. 2002, 16, 854–858. [Google Scholar] [CrossRef] [PubMed]
  21. Coplen, T.B.; Krouse, H.R. Sulphur isotope data consistency improved. Nature 1998, 392, 32. [Google Scholar] [CrossRef]
  22. Mayer, B.; Krouse, H.R. Procedures for sulfur isotope abundance studies. In Handbook of Stable Isotope Analytical Techniques; de Groot, P.A., Ed.; Elsevier: Amsterdam, The Netherlands, 2004; Volume 1, pp. 538–596. [Google Scholar]
  23. Maruoka, T.; Koeberl, C.; Matsuda, J.; Syono, Y. Carbon isotope fractionation between graphite and diamond during shock experiments. Meteorit. Planet. Sci. 2003, 38, 1255–1262. [Google Scholar] [CrossRef]
  24. Takahashi, T.; Hirahara, Y.; Miyazaki, T.; Vaglarov, B.S.; Chang, Q.; Tatsumi, Y. Precise determination of Sr isotope ratios in igneous rock samples and application to micro-analysis of plagioclase phenocrysts. JAMSTEC Rep. Res. Dev. 2009, 2009, 59–64. [Google Scholar] [CrossRef] [Green Version]
  25. Kuroda, J.; Hara, H.; Ueno, K.; Charoentitirat, T.; Maruoka, T.; Miyazaki, T.; Miyahigashi, A.; Lugli, S. Characterization of sulfate mineral deposits in central Thailand. Island Arc 2017, 26, e12175. [Google Scholar] [CrossRef] [Green Version]
  26. Wakai, S.; Kawai, T.; Nagaishi, K.; Ishikawa, T. Sequential chemical separation of Sr, Nd and Pb from geological samples using multi-step extraction column chromatography. JAMSTEC Rep. Res. Dev. 2018, 27, 1–12. [Google Scholar] [CrossRef] [Green Version]
  27. McArthur, J.M.; Howarth, R.J.; Shields, G.A. Strontium Isotope Stratigraphy. In The Geologic Time Scale 2012, 1st ed.; Gradstein, F.M., Ogg, J.G., Schmitz, M.D., Ogg, G.M., Eds.; Elsevier: Amsterdam, The Netherlands, 2012; Volume 1, pp. 127–144. [Google Scholar]
  28. Horiuchi, Y.; Charusiri, P.; Hisada, K. Identification of an anastomosing river system in the Early Cretaceous Khorat Basin, northern Thailand, using stratigraphy and paleosols. J. Asian Earth Sci. 2012, 61, 62–77. [Google Scholar] [CrossRef]
  29. Bosboom, R.E.; Dupont-Nivet, G.; Houben, A.J.; Brinkhuis, H.; Villa, G.; Mandic, O.; Stoica, M.; Zachariasse, W.J.; Guo, Z.; Li, C.; et al. Late Eocene sea retreat from the Tarim Basin (West China) and concomitant asian paleoenvironmental change. Palaeogeogr. Palaeoclimatol. Palaeoecol. 2011, 299, 385–398. [Google Scholar] [CrossRef]
  30. Claypool, G.E.; Holser, W.T.; Kaplan, I.R.; Sakai, H.; Zak, I. The age curves of sulfur and oxygen isotopes in marine sulfate and their mutual interpretation. Chem. Geol. 1980, 28, 199–260. [Google Scholar] [CrossRef]
  31. Strauss, H. The isotopic composition of sedimentary sulfur through time. Palaeogeogr. Palaeoclimatol. Palaeoecol. 1997, 132, 97–118. [Google Scholar] [CrossRef]
  32. Kampschulte, A.; Strauss, H. The sulfur isotopic evolution of Phanerozoic seawater based on the analysis of structurally substituted sulfate in carbonates. Chem. Geol. 2004, 204, 255–286. [Google Scholar] [CrossRef]
  33. Surakotra, N.; Promkotra, S.; Charusiri, P.; Maruoka, T.; Hisada, K. Sulfur, strontium, carbon, and oxygen isotopes of calcium sulfate deposits in Late Carboniferous rocks of the Loei-Wang Saphung (LWS) Area, Loei Province, Thailand. Geosciences 2018, 8, 229. [Google Scholar] [CrossRef] [Green Version]
  34. Paytan, A.; Gray, E.T. Sulfur Isotopic Stratigraphy. In The Geological Time Scale 2012, 1st ed.; Gradstein, F.M., Ogg, J.G., Schmitz, M.D., Ogg, G.M., Eds.; Elsevier: Amsterdam, The Netherlands, 2012; Volume 1, pp. 167–180. [Google Scholar]
  35. Paytan, A.; Yao, W.; Faul, K.L.; Gray, E.T. Sulfur Isotope Stratigraphy. In The Geologic Time Scale 2020, 1st ed.; Gradstein, F.M., Ogg, J.G., Schmitz, M.D., Ogg, G.M., Eds.; Elsevier: Amsterdam, The Netherlands, 2020; Volume 1, pp. 259–278. [Google Scholar]
  36. Paytan, A.; Kastner, M.; Campbell, D.; Thiemens, M.H. Sulfur isotope composition of Cenozoic seawater sulfate. Science 1998, 282, 1459–1462. [Google Scholar] [CrossRef] [PubMed] [Green Version]
  37. Paytan, A.; Kastner, M.; Campbell, D.; Thiemens, M.H. Seawater sulfur isotope fluctuations in the cretaceous. Science 2004, 304, 1663–1665. [Google Scholar] [CrossRef] [PubMed] [Green Version]
  38. McArthur, J.M.; Howarth, R.J.; Shields, G.A.; Zhou, Y. Strontium Isotope Stratigraphy. In The Geologic Time Scale 2020, 1st ed.; Gradstein, F.M., Ogg, J.G., Schmitz, M.D., Ogg, G.M., Eds.; Elsevier: Amsterdam, The Netherlands, 2020; Volume 1, pp. 211–238. [Google Scholar]
  39. Kaplan, I.R.; Rittenberg, S.C. Microbiological fractionation of sulfur isotopes. J. General Microbiology 1964, 34, 195–212. [Google Scholar] [CrossRef] [PubMed] [Green Version]
  40. Tang, T.; Yang, H.; Lan, X.; Yu, C.; Xue, Y.; Zhang, Y.; Hu, L.; Zhong, S.; Wei, J. Marine Late Cretaceous and Early Tertiary Stratigraphy and Petroleum Geology in Western Tarim Basin, China; China Sci. Press: Beijing, China, 1989; 141p. [Google Scholar]
  41. Lan, X.; Wei, J. Late Cretaceous-Early Tertiary Marine Bivalve Fauna from the Western Tarim Basin; China Sci. Press: Beijing, China, 1995; pp. 1–212. [Google Scholar]
  42. Bosboom, R.E.; Dupont-Nivet, G.; Grothe, A.; Brinkhuis, H.; Villa, G.; Mandic, O.; Stoica MHuang, W.; Yang, W.; Guo, Z.; Krijgsman, W. Linking Tarim Basin sea retreat (west China) and Asian aridification in the late Eocene. Basin Res. 2014, 26, 621–640. [Google Scholar] [CrossRef]
Figure 1. (A) Index map of the Republic of Uzbekistan. The map shows the location of the Fergana Basin with regional and adjacent structures around Tien Shan, central Asia. (B) Outline geological map of the Fergana Basin (modified from [4]). TFF: Talas–Fergana Fault; NFF: North Fergana Fault; CFF: Central Fergana Fault; SFF: South Fergana Fault.
Geosciences 12 00203 g001
Figure 2. Outline geological map of the northern part of the Fergana Basin within the territory of the Republic of Uzbekistan, at the southern foothills of the Chatkal Range close to the villages of Gava and Varzyk, and the Karabulak water dam. The locations of the studied sections are shown.
Geosciences 12 00203 g002
Figure 3. Columnar sections of the study area in the northern part of the Fergana Basin within Uzbekistan.
Geosciences 12 00203 g003
Figure 4. Field view of the sedimentary rocks at the Karabulak section of the northern Fergana Basin. (A) Transition of parallel sandstone to burrow-containing sandstone. The density of the burrows increased in the upward direction. The height of an average-sized man is shown for scale. (B) Bedded shell beds, which overlie the burrow-containing sandstone. (C) Close-up of the shell beds. (D) A shell bed in the lower sequence. (E) Caliche in the red beds of the lower sequence.
Geosciences 12 00203 g004
Figure 5. Field view of the sedimentary rocks at the Karabulak section of the northern Fergana Basin. (A) Eastward view from Karabulak, where two limestone beds and intercalating beds can be observed. The lower left part of the view shows the reservoir dam. (B) Clastics and overlying limestone. The clastics part was comprised of red beds, conglomerates, and fine-grained sandstone. The height of an average-sized man is shown for scale. (C) Red beds of conglomerate. Some low-angled cross-beds can be observed. (D) Crudely stratified conglomerate. Some clasts are sub-angular. (E) Parallel laminated fine-grained sandstone. A small number of burrows developed sporadically. (F) Densely developed burrows in the fine- to very fine-grained sandstone.
Geosciences 12 00203 g005
Figure 6. Photomicrographs of limestone and clastic sedimentary rocks in the study section. (A,B) Shell bed of the lower sequence of the Gava-1 section (sample number, SB1-02). Very angular medium- to coarse-grained quartz (qtz) grains were contained within the fine calcareous muddy matrix. Few bivalve shells (bs) were scattered in the sandstone. (A) Under open polarized light and (B) under cross-polarized light. (C,D) Shell bed of the lower sequence of Karabulak section (sample number, SB1-12). Very angular and poorly sorted medium- to coarse-grained quartz grains were contained within a sparry calcite cement matrix. Some bivalve shells and tube-like fragments were scattered throughout the matrix. A miniscule amount of plagioclase grains was recognized as clastic grains. (C) Under open polarized light and (D) under cross-polarized light. (E) Bioclastic packstone of the upper sequence of the Gava-1 section (sample number, LS2-01). Numerous bioclastic fragments, such as gastropods, bivalves, and foraminifers, were contained within a calcareous muddy matrix. Under open polarized light. (F) Oncoids and bioclastic grainstone of the Gava-1 section (sample number, LS1-04). Numerous cortoid particles could be observed. Under open polarized light. (G) Microoncoids (indicated with arrows), oolite grains (o), and bioclastic limestone of the upper sequence of Karabulak section. Under open polarized light. (H) Bioclastic limestone of Karabulak section (sample number, LS-07). Bivalve shell and fragments of bryozoa (bz) were included. Under open polarized light.
Geosciences 12 00203 g006
Figure 7. Photographs showing macrofossils obtained from the study sections. (1) Gryphaea (Pojarkovy) angulata, FS61, Varzyk section. (2) Ostrea (Turkostrea) bellovacina, FS42, Karabulak section. (3) Pycnodonte sp. FS12, Karabulak section. (4) Liostrea sp. FS31, Karabulak section.
Geosciences 12 00203 g007
Figure 8. LOWESS curve of the sulfur and strontium isotopic values for the last 130 million years. The sulfur isotopic compositions (A) were obtained from [37], while the Sr isotopic compositions (B) were obtained from [27,38]. Tangents between the sulfur isotope value obtained in this study and the LOWESS curve allowed for the determination of the geological age (A).
Geosciences 12 00203 g008
Table 1. Details of the samples employed for sulfur and strontium analyses and the corresponding results.
SectionSequenceSample No.LithologyMaterialSCAS (wt%)Errorδ34SError87Sr/86Sr2SE Error
Gava 1UpperFS42Limestone BedOyster0.1410.00419.9880.745
FS41Limestone BedOyster0.2200.00320.1280.0660.7078260.000006
LS2-01Limestone BedOyster0.0930.00621.1930.1110.7080630.000007
LS1-04Limestone BedLimestone0.0260.00119.4370.0800.7078890.000006
LowerFS12Shell BedBivalve0.1600.00116.6270.067
FS11Shell BedBivalve0.1360.00716.4290.0940.7077720.000006
SB2-03Shell BedBivalve0.1570.00416.6630.130
SB2-02Shell BedBivalve0.2120.00516.6330.096
SB2-01Shell BedBivalve0.1750.00216.6380.106
FS31Shell BedBivalve0.2710.01114.9360.055
SB1-04Shell BedBivalve0.1810.00216.5230.1160.7077890.000006
SB1-03Shell BedBivalve0.2260.00716.4390.137
SB1-02Shell BedBivalve0.2180.00216.4540.087
SB1-01Shell BedBivalve0.2380.00216.4450.126
Gava 2UpperFS43Limestone BedOyster0.1880.00220.8880.076
FS44Limestone BedOyster0.1420.00619.4480.074
LS2-04Limestone BedOyster0.0470.00219.3720.096
LowerFS53Shell BedBivalve0.2370.00316.2420.061
FS24Shell BedBivalve0.2070.00316.0630.070
SB2-06Shell BedBivalve0.1930.00116.3780.090
SB2-05Shell BedBivalve0.1720.00116.7590.078
FS23Shell BedBivalve0.1780.00316.1500.068
SB1-08Shell BedBivalve0.1250.00116.5770.098
SB1-07Shell BedBivalve0.2500.00516.5040.105
SB1-06Shell BedBivalve0.1850.00216.3170.098
SB1-05Shell BedBivalve0.1350.00216.1720.076
VerzykUpperLL-01Limestone BedLimestone0.1070.00220.0260.086
FS61Limestone BedOyster0.1120.00220.2130.075
FS45Limestone BedOyster0.0770.00220.3510.095
LS2-06Limestone BedOyster0.0460.01219.7770.155
LS2-05Limestone BedOyster0.0720.00119.9130.115
LowerFS22Shell BedBivalve0.1620.00216.6530.0750.7077940.000007
FS21Shell BedBivalve0.1950.00816.3710.132
SB2-10Shell BedBivalve0.1530.02716.2410.289
SB2-09Shell BedBivalve0.3130.00416.3200.083
SB2-08Shell BedBivalve0.2020.00416.6240.084
SB2-07Shell BedBivalve0.2280.01616.6420.093
FS51Shell BedBivalve0.1860.00815.4850.068
FS32Shell BedBivalve0.1610.00515.9920.062
FS33Shell BedBivalve0.1920.00216.6380.089
SB1-10Shell BedBivalve0.1550.00116.8180.080
SB1-09Shell BedBivalve0.1540.00116.6780.080
KarabulakUpperLL-02Limestone BedLimestone0.1160.00220.4870.090
FS72Limestone BedOyster0.0900.00220.4870.0910.7078120.000005
FS82Limestone BedOyster0.1290.00220.2530.131
FS71Limestone BedOyster0.1310.00120.2330.079
LS2-07Limestone BedOyster0.1270.00319.6650.097
FS81Limestone BedOyster0.1110.00319.4050.080
LowerSD-04Shell BedBivalve0.1280.00315.9570.079
SD-01Shell BedBivalve0.1610.00316.0180.103
SB2-13Shell BedBivalve0.1760.00116.3080.0870.7078110.000006
SB2-12Shell BedBivalve0.2410.02516.7050.087
SB2-11Shell BedBivalve0.2020.00516.5900.092
SD-03Shell BedBivalve0.1890.00316.5880.082
SD-02Shell BedBivalve0.1710.00716.7760.153
FS52Shell BedBivalve0.1390.00216.1470.065
SB1-13Shell BedBivalve0.1430.00116.5540.073
SB1-12Shell BedBivalve0.1750.00116.6540.0860.7078750.000007
SB1-11Shell BedBivalve0.1280.00216.6040.127
Table 2. Simplified lithostratigraphy and geological correlations of the studied section. The stratigraphy and lithology of the Alai Valley Basin and the Fergana Basin (Kyrgyzstan) were obtained from [2].
Alai Valley Basin and Fergana Basin (Kyrgyzstan) This Study (Fergana Basin, Uzbekistan)
SystemFormationThickness (m) AgeLithology seq.Thickness (m)Lithology
PalaeogeneMassaget
Fm
Oligocene
–Miocene
Massive red sandstones and conglomerates
Shurysay
Fm
20–160OligoceneBrownish red-mudstones intercalated by siltstones, evaporite beds and sandstones
Sumsar
Fm
0–70Late Eocene
–Oligocene
Reddish-brown mudstones and grey sandstones rich in oysters andother bivalves, shark teeth
Hanabad
Fm
5–70Late Eocene
–Oligocene
Greenish-grey and red (calcareous) mudstones and siltstones, somemarls with bivalves
Isfara
Fm
5–55Late EoceneGreenish-grey (calcareous) mudstones and siltstones, some green or white sandstones, somemarls with bivalves
Rishtam
Fm
5–60Late EoceneRed mudstones with thin beds of red or grey siltstone and sandstone, some interbeds of marl and limestone with bivalves
Turkestan
Fm
5–150Middle–late EoceneGreenish-grey mudstones with grey and white siltstones, sandstones, marls and limestones, red mudstone intervals at the top, rich in oysters and other bivalvesupper
sequence
30–50red mudstones with sandstones,
several limestone beds,
rich in oysters
Alai
Fm
10–210Middle EoceneGreenish-grey mudstones with grey and white siltstones, marls and limestones, some gypsiferous red mudstone intervals in middle, richin oysters and other bivalves
Suzak
Fm
5–120Early EoceneComplex coloured (calcareous) mudstones, siltstones and sandstones, bivalves?
lower
sequence
5–30reddish- and greenish-color
mudstones,
sandstone shell beds, bivalves
Bukhara
Fm
20–80PaleoceneLimestones, evaporite beds and white sandstones with thin calcareous mudstone layers, bivalves and gastropods
Akdzhar
Fm
25–125PaleoceneRed mudstones and siltstones with interbeds of evaporite and dolomite
Publisher’s Note: MDPI stays neutral with regard to jurisdictional claims in published maps and institutional affiliations.

