
The Energy Cost of Extracting Critical Raw Materials from Tailings: The Case of Coltan


1
Research Centre for Energy Resources and Consumption (CIRCE), Universidad de Zaragoza, CIRCE Building, Campus Río Ebro, Mariano Esquillor Gómez, 15, 50018 Zaragoza, Spain
2
Research Centre for Energy Resources and Consumption (CIRCE), Universidad de Zaragoza, 50018 Zaragoza, Spain
*
Author to whom correspondence should be addressed.
Geosciences 2022, 12(5), 214; https://0-doi-org.brum.beds.ac.uk/10.3390/geosciences12050214
Submission received: 27 February 2022
/
Revised: 2 May 2022
/
Accepted: 13 May 2022
/
Published: 17 May 2022
Abstract
:Niobium and tantalum are mainly produced from columbite–tantalite ores, and 60% of their production is nowadays located in the Democratic Republic of Congo and Rwanda. The concentration of supply, the scarcity, the wide range of use in all electronic devices, and the expected future demand boosted by the clean and digital transition means that Nb and Ta have high supply risks. In this context, extraction from rich Ta and Nb tailings from abandoned mines could partly offset such risks. This study analyzes the energy cost that the reprocessing of both elements from tailings would have. To that end, we simulate with HSC Chemistry software the different processes needed to beneficiate and refine both metals from zinc tailings as a function of Nb and Ta concentration. At current energy and metal prices, tantalum recovery from rich Ta-Nb tailings would be cost-effective if ore-handling costs were allocated to a paying metal. By way of contrast, niobium recovery would not be favored unless market prices increase.
1. Introduction
Several authors have defined the 21st century as the Technological Age [1]. The number of connected devices has risen exponentially in the last few years. An increase of around 3–5% in the production of electric and electronic equipment (EEE) is expected [2]. From around 2 billion devices (primarily personal computers and smartphones) sold in 2000, the world has progressed to more than 22 billion in 2018. According to some estimations, this number could even reach 38 billion by 2025 [3]. The type of technologies in use has also changed, incorporating many different devices such as tablets, smart TVs, wearables, and the internet of things.
The penetration of advanced technologies implies using a more-significant number and variety of raw materials [4,5]. Specifically, two metals are of extraordinary relevance in this context: niobium and tantalum, which have a wide range of uses. Their main applications are the fabrication of smaller and more effective condensers, which allow smaller, more efficient devices to operate at higher performance levels [6,7]. Ta and Nb are also becoming key metals in the green energy transition, being present in large amounts of electric vehicles. This is why both elements are present in the list of the so-called critical raw materials of several studies (i.e., Calvo et al. [8] and Moss et al. [9]) and institutions, such as the list of Critical Raw Materials developed by the European Commission [10] and the report of the Critical Defense Materials of the United States Government [11], among others.
Niobium and tantalum are mainly produced from columbite–tantalite ores, also known as coltan. The importance of both metals is such that some authors have claimed that we live in the Coltan Age, rather than in the Technology Age [12].
Although coltan is vital for our society, various issues related to its extraction and production must be considered [13,14]. Coltan extraction is mainly concentrated in the Democratic Republic of Congo (DRC) and Rwanda. Two countries that arguably do not respect human rights and whose extraction processes have been questioned many times by international organizations [13]. The United Nations has published several reports asking for governments, markets, and companies to monitor the supply chain of these metals [15,16]. A similar movement is also led by the Group of 8 (G8). With the promotion of a voluntarily certified trade chain (CTC) in mineral production, the aim is to prevent poverty and encourage political stabilization. The use of materials from countries in conflict, where the chain of custody is not assured, could be reduced and those suppliers who focus on using “blood free” materials rewarded [17].
Given that it is related to the use of new technologies, the global extraction of Nb and Ta has increased in the last decades [18]. Australia has been the largest producer of these elements for several years, with more than 60% of the total share in 2005 [19]. In 2008, there was a noticeable reduction in Australian production. This was mainly because one of its main exploitations, Sons of Gwalia, had to close, reducing to almost zero Australia’s coltan production in 2010 [13,19]. More recently, the Wodgina mine, also located in Australia, ceased production in 2017 as Ta concentration was too low to be cost-effective [20]. This is why, from 2010 on, African countries have notably increased their world coltan production, particularly the Great Lakes Region, accounting for more than 50% of the total share. Nonetheless, this figure must be taken very carefully, as not all the mining production is always reported in official sources of the country, and the amount extracted could be even higher [21].
Although Central Africa has been the main producer of Ta in the last decade, the largest reserves are not located in that region. According to Nikishina et al. [22], South America holds 41% of the total Ta reserves of the world, followed by Australia with 21%. As for Nb, reserves are mainly concentrated in Brazil, with 16,000,000 tons, and Canada, with 1,600,000 tons [23].
Still, there is a limited amount of these two elements in the Earth’s crust. Some authors state that the Ta maximum-production peak occurred in 2005 [24], while others locate it in 2039 [25]. As for Nb, the expected maximum-production peak could be around 2030 [24]. Even if the difference between all these estimations might seem significant, the truth is that the order of magnitude is very similar, and even an increase in reserves might not postpone it much farther in time [25]. This, combined with the Nb and Ta expected growing demand, means that the supply of these metals could be at risk in the medium term.
There is another issue that is not being sufficiently addressed in the literature. With increasing extraction, high-grade mines become depleted. Consequently, it is necessary to resort to lower-grade mines, which entails an increase in energy consumption and the generation of waste rock if no additional measures are taken [26]. With declining ore grades, a new source of coltan may become competitive: mining tailings.
Certainly, some mine tailings may contain concentrations of metals that were discarded when the mine was in operation [27]. This can be explained due to technological limitations at the moment of extraction or to low prices of the commodities, among others. Accordingly, waste rock that, in the past, was considered non-profitable might even have a higher metal content than currently operative mines [27]. Such is the case of a mine in Kasese, Uganda, where cobalt-rich tailings generated during the primary extraction of copper are now being reprocessed years after the mine ceased its operations [28]. Another case is the Penouta mine, located in the north west of Spain, which was one of the most important tin mines in Europe [18]. In the 21st century, new studies were carried out, identifying a significant amount of tantalite concentrate in Penouta [29]. For the Balsa Grande tailings area, estimated resources add up to 4.8 Mt of residue containing 48 ppm of Ta and 39 ppm of Nb, while for the other tailings area (Balsa Pequeña), resources are estimated at around 0.22 Mt with 42 ppm of Ta and 34 ppm for Nb.
Valero et al. [5] carried out an analysis to calculate the cumulative expected material demand from 2016 to 2050 in green technologies, including wind energy, solar photovoltaic, solar thermal power and light-duty vehicles, estimating that the amount of Ta and Nb required could be around 54.60 ktons for Ta and 2287.95 ktons for Nb. This means that, if the whole tantalum present in Penouta mine tailings could be recovered, it would account for more than 43% of the total required from 2016 to 2050. As for Nb, this value would reach 1%.
That said, is it feasible to recover all such resources with available technology? What would be the energy cost to recover them? The Second Law of Thermodynamics states that energy costs spiral with declining ore grades [30], meaning that not only quantity but the concentration of both elements in the tailings are key to determining whether they are recoverable.
The main goal of this paper is to analyze the evolution of the specific energy needed to concentrate Nb and Ta as a function of ore-grade decline. This way, it will be possible to estimate the point at which tailings become a viable alternative to current mines from an energy point of view. Some studies in the literature follow a similar approach, recovering gold through a unique beneficiation process [31]. In the particular case of Nb and Ta, as they are both recovered during the beneficiation and refining stages as by-products of tin ores, the complexity of the process is higher, and the consequences of ore-grade decline are worth studying in more detail.
The analysis presented in this paper was carried out using specialized software called HSC Chemistry, modelling all the mining and metallurgical processes required to obtain pure Ta and Nb as a final product. The software includes different modules providing chemical/thermodynamic data for mining and metallurgical operations. For the simulation, 12 different scenarios were created.
2. Ta and Nb Processing
Ta and Nb often occur together in different minerals and in combination with oxide impurities [32]. As these two metals have similar chemical and physical properties, it is difficult and costly to separate them and obtain a high metal concentration [33]. Ta and Nb sources can be divided into three main groups: pyrochlore, alkaline, and granites [34]. Within these sources, many minerals contain Ta and Nb. Still, only two are currently cost-effective: titano-niobates and tantalum-niobates [35]. However, if the ore grade decreased to a point where the process were no longer cost-effective, it would be necessary to look for alternative sources for these metals [18,36]. In this case, tin slags could be considered another viable source of Nb and Ta, for their relatively high concentrations [35].
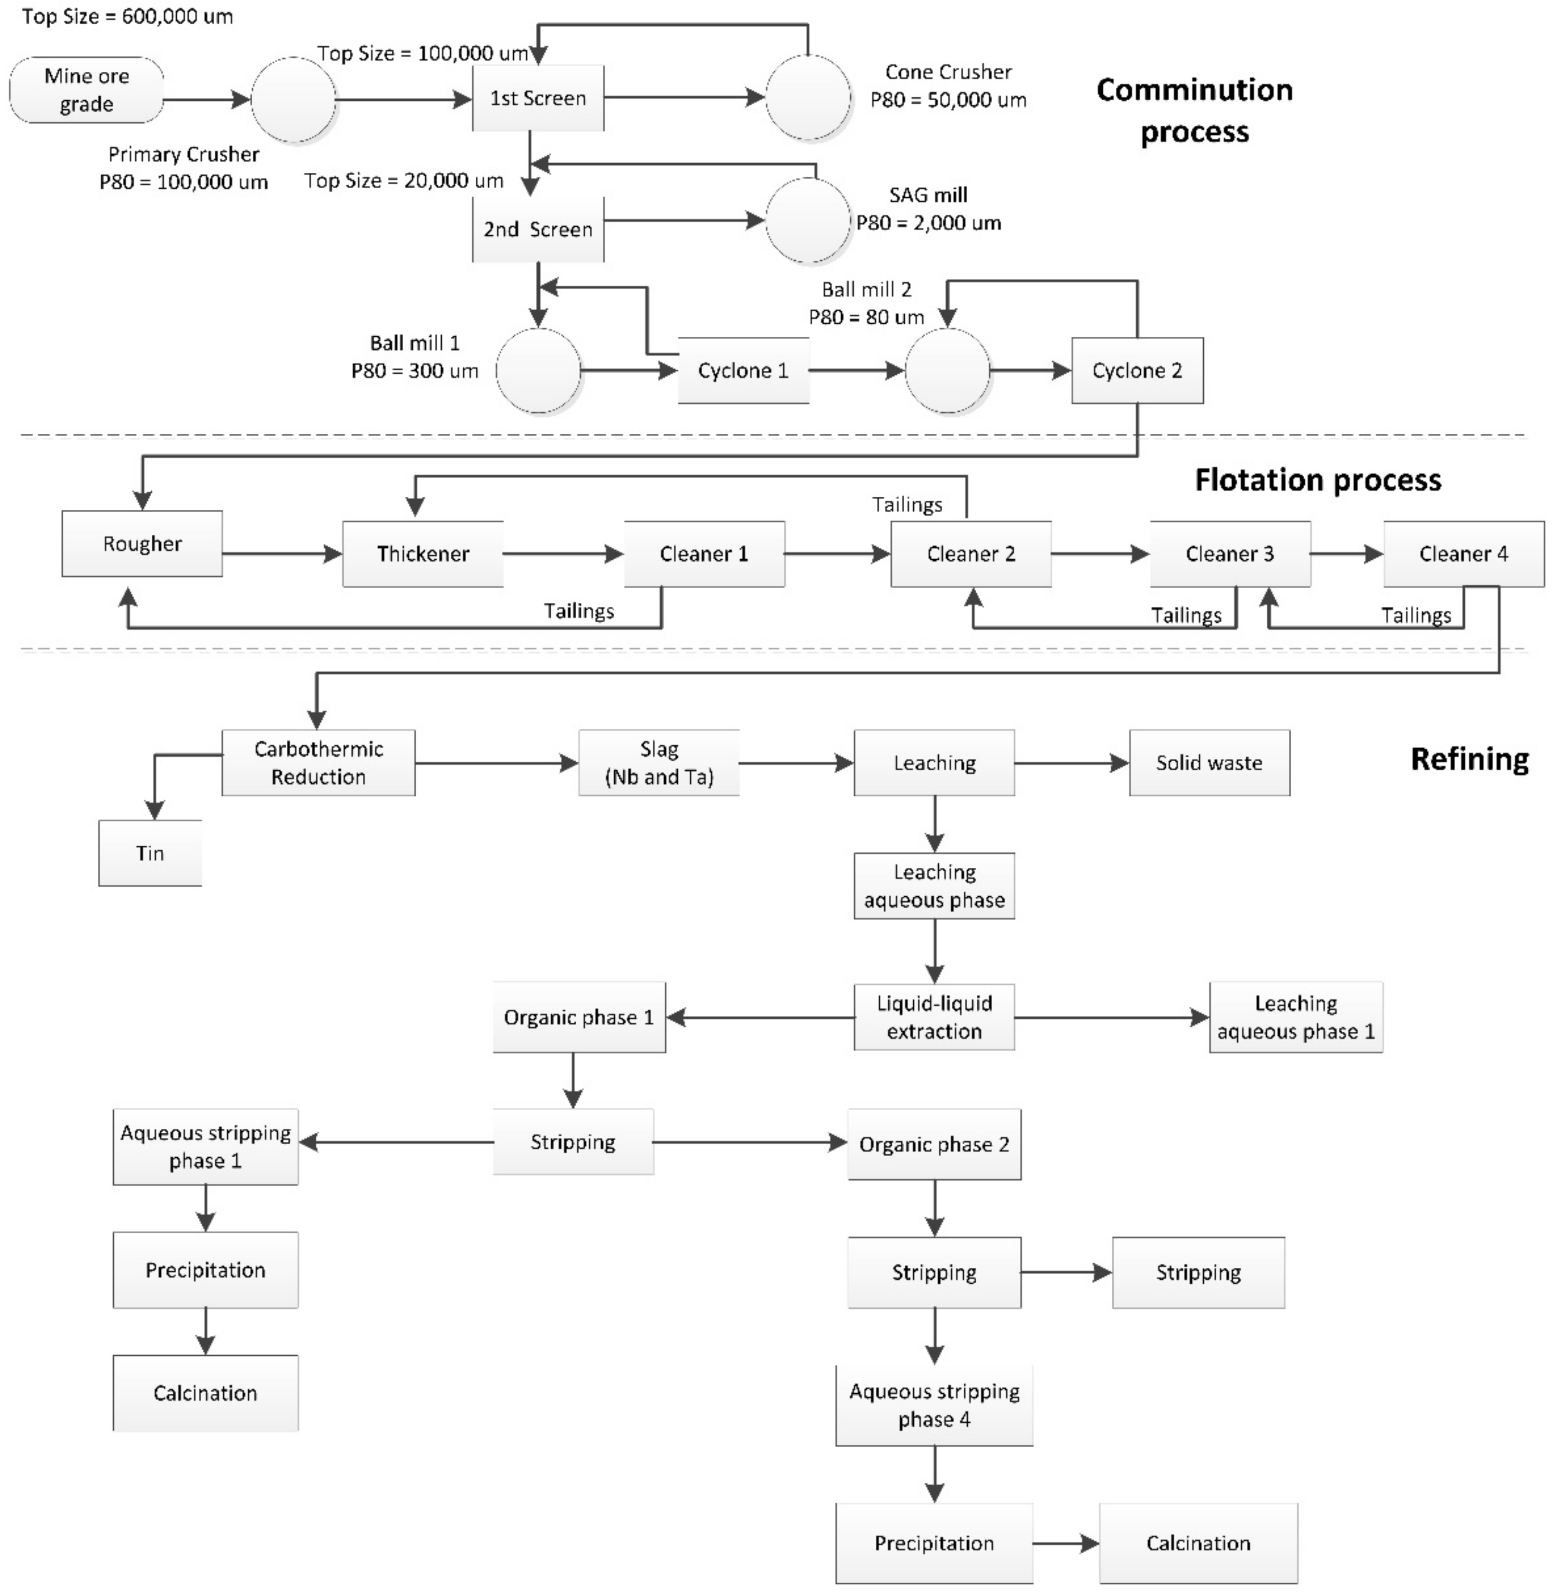
Figure 1 shows a general flowsheet for the extraction of Ta and Nb from tin tailings [37,38,39,40,41]. There are three main steps in this process: (1) comminution, (2) flotation and (3) refining.
2.1. Comminution
The first step, comminution, seeks to reduce the particle size to facilitate the separation of the minerals [42,43]. This stage can be divided into three steps: crushing, grinding, and regrinding.
Minerals have different chemical and physical properties that influence the power demand in the units to reduce their particle size. The Bond work index is the most widely used parameter to measure ore hardness. The amount of comminution energy depends on the Bond index of each metal and it is calculated through Equation (1).
For the case study, the major component of the mine is tin (Sn). The Bond index for this metal ranges from 10–14 kWh/t [38,44]. Thus, an average value was chosen for the simulation (12 kWh/t).
It must be noted that efficiency factors must be considered, as they can reach up to 20% of the final energy. Still, other authors have considered this factor as zero to simplify calculations [31,45]. As these factors modify the power depending on the size of the mill, the feed, circuit, etc. [38,39,46], efficiency factors were included, after a literature review, to approximate the power calculated to an actual process.
Equation (1) depends on the Bond index (Wi); the diameter in microns (P80), meaning that 80% of the product passes; and the size of the feed (F80), meaning that 80% of the feed passes [40]. The last term of the equation is the efficiency factor (EFx), which depends on the mill, and the particle size, among other factors.
The reduction ratio (P80 and F80) is one of the main factors in the equation. The units in the comminution process can treat a wide range of reduction ratios, which were selected after a literature review [35], considering the feed introduced and other factors such as the number of units.
2.2. Flotation
During flotation, the minerals are concentrated using additives and flotation cells. The particle size is already small at this stage, so flotation circuits are needed to concentrate Ta and Nb. These flotation circuits are mainly composed of conditioners, roughers, and cleaners, and, in this case, a thickener is also needed [47,48]. The feed from the comminution process is introduced in a rougher and then in a thickener. After the thickener, there are four cleaners in a row, where the concentrate stream goes to the following cleaner. At the same time, all tailings are recirculated to the previous cleaner to try to recover as much Ta and Nb as possible. For that reason, residence time, volume cell, recovery ratio, and pH were introduced in the simulation [47,48].
2.3. Refining
After flotation, the feed is sent to the final step, refining, where the targeted metals are separated from the rest of the metals. This last process can be carried out using a combination of hydrometallurgy and pyrometallurgy.
At this point, the feed must have a specific concentration to make purification feasible. Since Nb and Ta are being recovered as by-products of Sn, two different metallurgical processes are needed to obtain the three metals individually. Accordingly, the feed goes through carbothermic reduction, obtaining a Sn concentrate and slags with a high concentration of Ta and Nb. Then, the Sn stream is introduced in an electrolysis step (and then purified) while the slags are introduced in a leaching and precipitation circuit. Subsequently, Ta and Nb are separated in a leaching unit, applying calcination at the end of each process, obtaining pure Ta and Nb separately [35,36].
3. HSC Simulation
An extensive literature review was carried out to obtain reliable data to run the simulation: the ore grade in the mines, concentration needed before refining the feed, number of cleaners and roughers needed to concentrate the mineral, power used in the comminution process, etc.
The average coltan concentration in the crust is around 2 ppm (parts per million) [13,35]. Obviously, in the mines, this concentration is higher. For the simulation, cassiterite-columbite mineral bearing was chosen as a reference, with a global average in a mine of 0.2 wt-% [34,49]. This value is similar to the one found in the Penouta Mine (Spain) [50,51]. However, although the global average concentration is 0.2 wt-%, the initial concentration must be set up for Ta and Nb individually in the simulation. Accordingly, based on the literature review, it is possible to find a range of concentrations for Ta and Nb in mined ore, as reflected in Table 1 [50].
Table 1 also shows the concentration along the beneficiation process for both elements. The concentration gradually increases in the first steps. After the flotation process, the Ta concentration must be 8.45 wt-% for Ta and 5.40 wt-% for Nb, something that is achieved using additives or repeated concentration. Then, the purification of each metal is carried out during the refining process, with a final concentration of 79.67 wt-% and 98.45 wt-% for Ta and Nb, respectively.
The ore grade and energy consumption evolution were analyzed using twelve different scenarios. The initial concentration was calculated as the average between the lowest and highest concentration values, 2.1 wt-% and 1.2 wt-% for Ta and Nb, respectively. Accordingly, this concentration decreased consecutively by one third in each scenario. This way, the future behavior of mines can be simulated, estimating the specific energy for concentration for each metal from current mines to the worst-case scenario.
The specific data used in the simulation for the different steps of the extraction of Ta and Nb are described next.
3.1. Comminution
In the simulation, Nb and Ta were extracted from Sn ores, specifically, cassiterite. Thus, it was necessary to set up a feed for the comminution process to proceed with the calculations. Twelve different feeds were defined, as shown in Table 2, to analyze the evolution of energy consumption.
As stated before, the Bond index is an important factor for the calculations in the comminution process (which holds the highest energy share for low ore grades). We selected a value found in the bibliography (12 kWh/t) according to certain parameters, such as the bearing mineral and the concentration of metals in the mineral. Considering a different Bond index would affect the results obtained at the end of the model.
If the ore grade decreases, it is necessary to process more rock to obtain the same amount of ore. For this reason, the as wis increased by 50 t/h until the fifth scenario. Then, it was increased from 100 t/h up to 600 t/h, reaching the top feed for the last scenario, 3000 t/h. This last scenario considers a very low ore grade in the mine, close to depletion.
With this increase between scenarios, the software could reach the concentration goals established along the different stages during the simulation, avoiding any lack of feed.
Different studies were conducted to determine the optimal particle size for the comminution process as it could affect the whole process [48,52]. A too-large particle size could negatively affect further steps and lead to a less-efficient flotation process. On the other hand, a too-small particle size could decrease the efficiency of the additives.
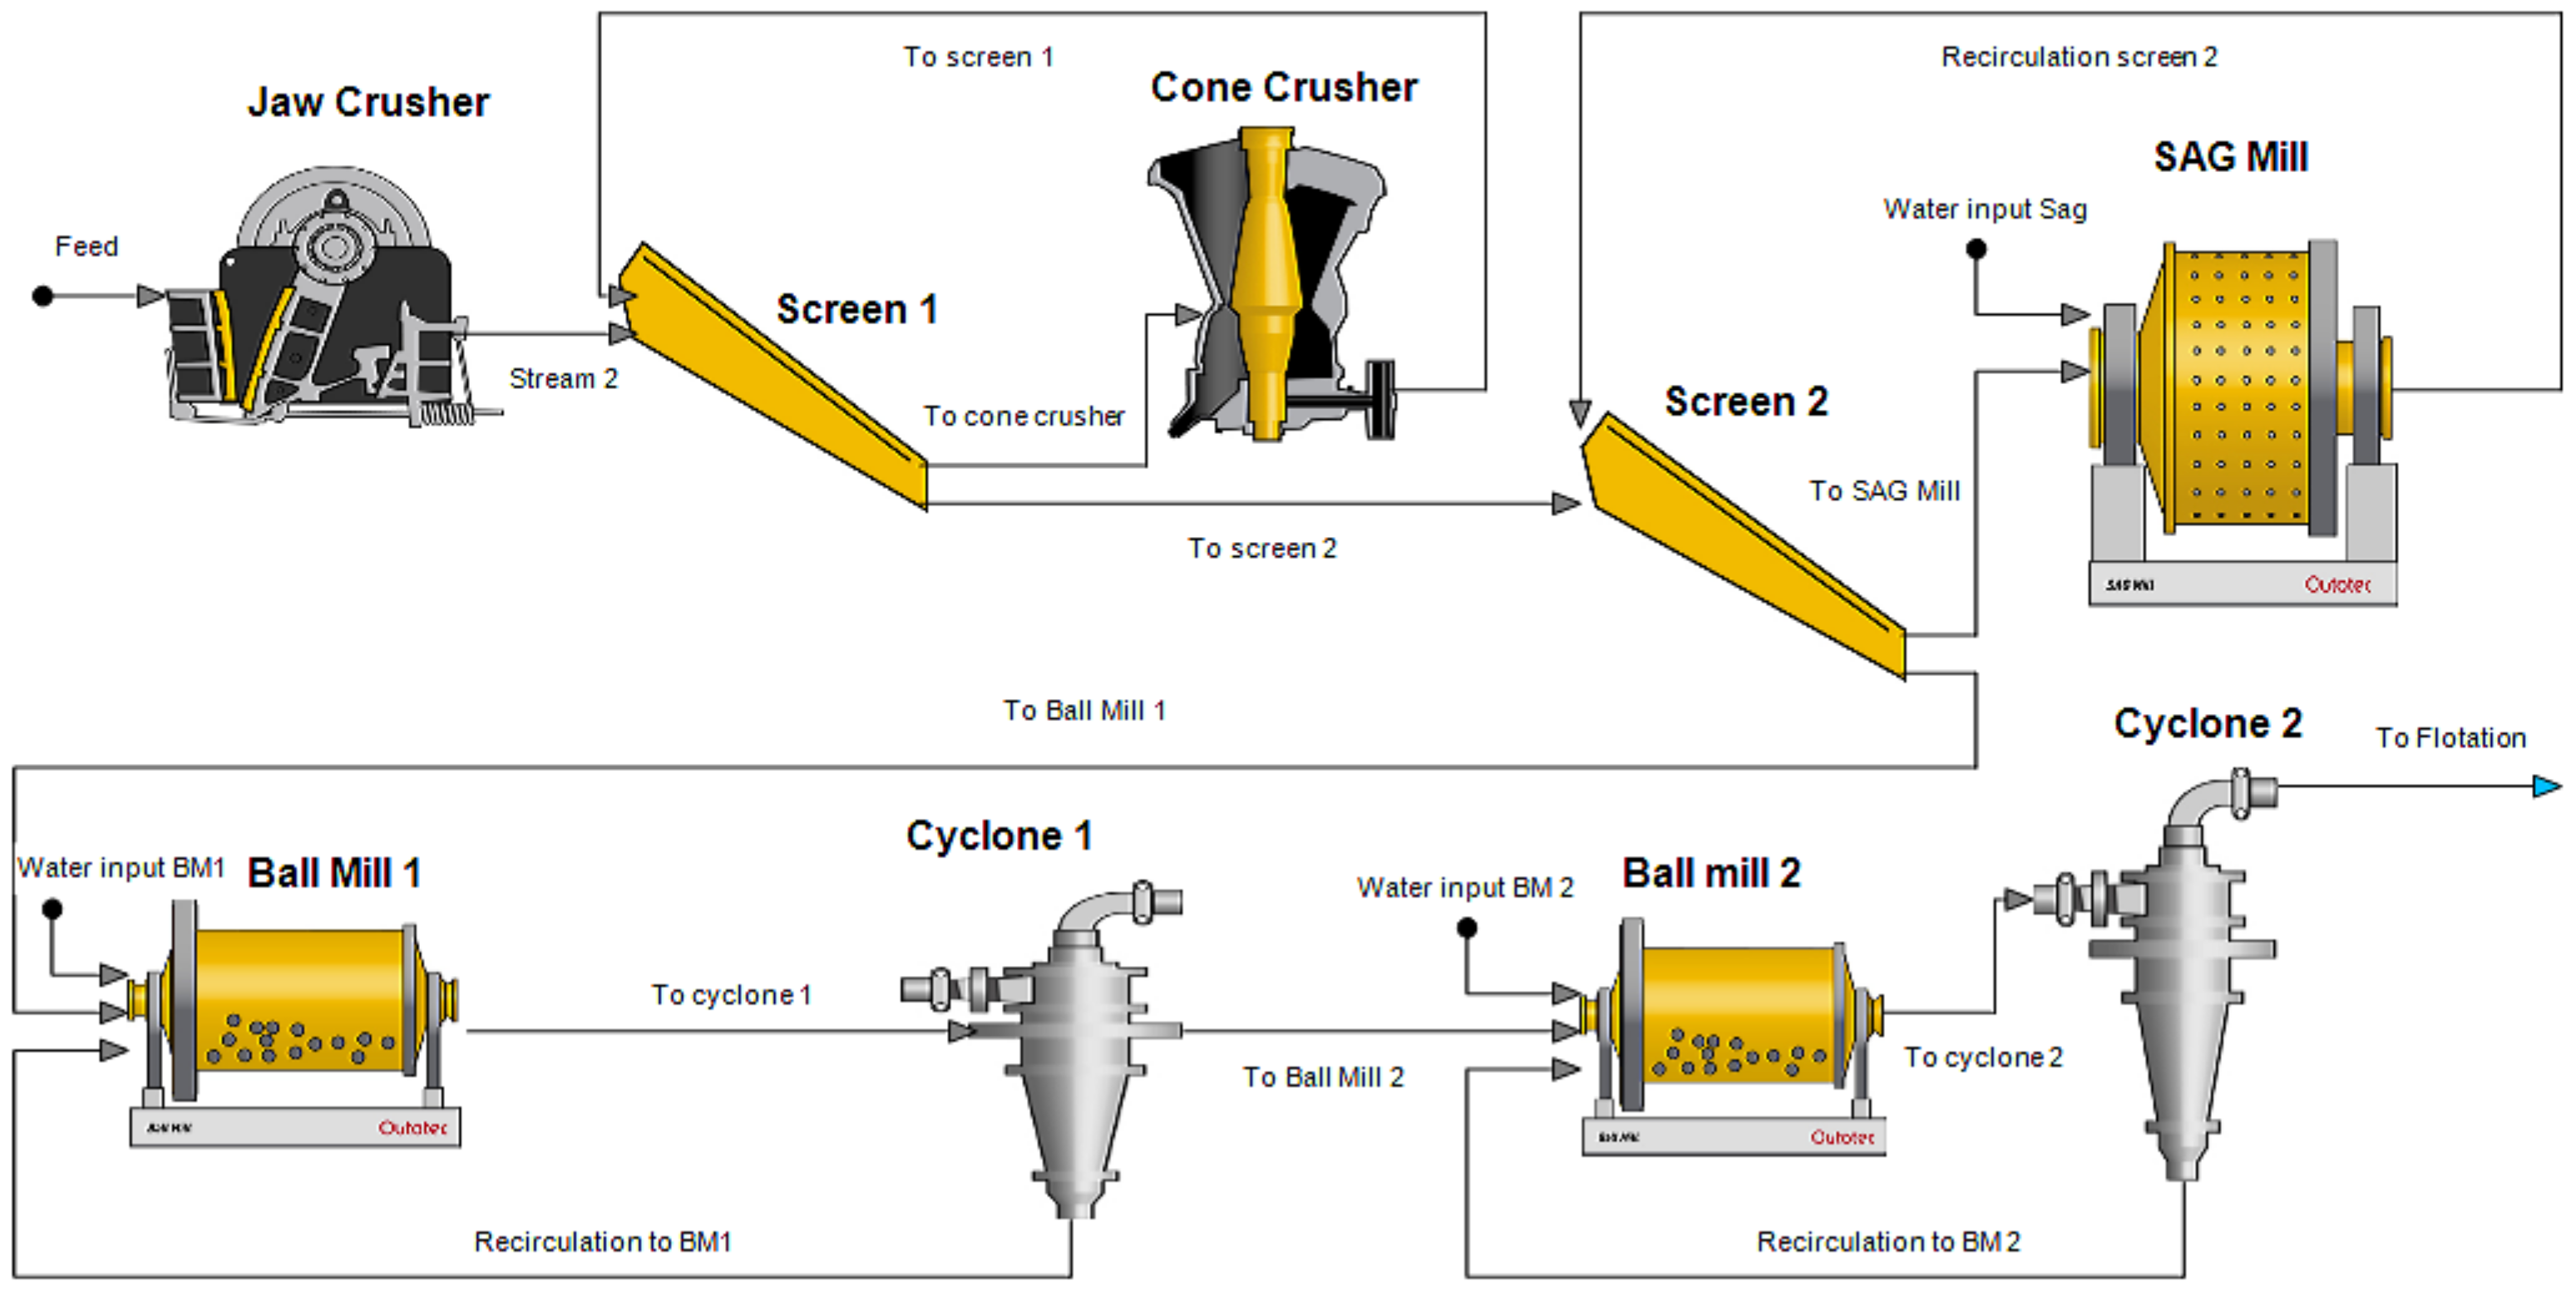
The comminution process starts with the crushing stage (Figure 2). Following a literature review [38,53], the particle size is reduced from 600 mm to 50 µm in the regrinding unit, which was incorporated at the beginning of the flotation process. With a top size of 600 mm, the feed is introduced to the jaw crusher to reduce the particle size to 100,000 µm. Some particles will have a final smaller or larger size, so a screen is applied to separate them. Larger particles are sent to the cone crusher unit, reducing its size to 50,000 µm to accomplish the requirements. Another screen is applied to filter the feed with a top size of 20,000 µm, sending larger particles to be reduced in a SAG Mill. When the feed of the second screen is filtered, the grinding stage starts, which is composed of a ball mill circuit followed by cyclones. In the first unit, the size is reduced to 300 µm, while in the second ball mill, the size is decreased to 80 µm. Cyclones are incorporated after every ball mill to avoid larger particles in further steps. The last step in the comminution process is regrinding. This step is applied at the beginning of the flotation process, reducing the particle size to 50 µm.
Table 3 summarizes the power demanded in every unit and the specific energy in kWh per ton of rock for scenario 1. The grinding process has the highest power demand. This could be easily explained due to the small particle size required for further process steps. The smaller the particle size, the lower the efficiency, and, therefore, the more energy is needed to reduce the size to these values. These numbers are within the same order of magnitude as those obtained by Latchireddi et al. [54].
3.2. Flotation
After the comminution process, the feed is introduced in a rougher where it is diverted into two outputs, the concentrated feed, and the tailings. The concentrated feed is sent to the last ball mill and, subsequently, to a thickener to separate the pulp. Then, several cleaners are applied to increase the feed concentration before sending it to the metallurgical process. While the kinetics is not being considered, every cleaner was designed considering the residence time, volume cell, the power demanded, etc., using bibliography data [47,48].
The lower the ore grade in the initial feed, the more cleaners have to be introduced before the flotation process, and the more specific energy is required to obtain the concentration required at the end of the process.
3.3. Refining
Metallurgical processing requires an organized and coordinated arrangement of unit operations designed to provide physical and chemical changes to purify certain raw materials and leave them ready for use in the industry [55]. This process was divided into two steps: (1) Sn recovery, (2) Ta and Nb recovery [56].
For the recovery of Sn, the feed is sent to the refinery so carbothermic reduction can be applied. After this process, Sn with a concentration higher than 96 wt-% is obtained. Then, electrolysis is applied to obtain pure Sn. High amounts of water and sulphuric acid are needed to reach the desired concentration (99.99% Sn).
As the slags generated during this process have a high Ta and Nb concentration, they are further processed to obtain pure Ta and Nb. First, leaching is applied, introducing different additives to change the pulp mix. Then, another unit transforms part of the pulp from an aqueous into an organic phase. The next unit is the first stripping, where Ta and Nb are separated. While Nb is converted into the aqueous phase, Ta remains in the organic phase and is sent into a new stripping unit. After the first stripping, Nb is diverted to the precipitation unit, where it reacts with certain chemicals and is then sent to the last step, calcination, to eliminate the excess water.
On the other hand, Ta is sent into a new organic phase where more ammonium fluoride and ammonia are poured, sending the feed to an aqueous stripping process. Subsequently, Ta feed is precipitated and sent into a calcination process to obtain pure Ta. Table 4 summarizes the reagents needed to purify the three metals analyzed in this study.
It is important to highlight that almost 40% of the total water needed in the process is introduced during electrolysis to obtain pure Sn.
Table 5 summarizes the mass balance of the three metals (Sn, Ta and Nb) at the beginning and at the end of the beneficiation process. More than 92% of Sn, 95% of Ta, and 67% of Nb are recovered, reaching, thus, high recover yields. However, more than 40% of the inputs end up as waste rock along the process. Additionally, this material is usually contaminated with chemicals and additives applied during the flotation and the refining process, entailing other consequences during waste management.
4. Results and Discussion
Increasing demand, the corresponding rise in commodity prices, and potential technological improvements could make lower-grade mines profitable [57]. Beneficiation processes would undoubtedly improve with technological development [57,58]. More-efficient machines and units could be developed and used to maintain the energy for the beneficiation process within the same order of magnitude. This is in line with other studies that state that, as reserves partially rely on economic factors, they could increase in the next two centuries for both metals, thus eliminating any possible risks of supply or bottlenecks [59]. That said, the question now is whether the recovery of key elements from low-grade deposits such as niobium and tantalum would be cost-effective with current technology.
To answer that question, we created twelve scenarios to calculate energy consumption as a function of ore-grade decline.
4.1. Specific Energy for Concentration
Ore-grade values of Ta range from 2.1 wt-% in Scenario 1 to 0.000012 wt-% in Scenario 12, and from 1.2 to 0.000007 wt-% for Nb. Comminution and flotation processes are common for the three metals to be recovered: Sn, Ta and Nb. A cost allocation based on the metal output was applied, with the following share: 80% for Sn, 12% for Ta and 8% for Nb.
Table 6 shows the evolution of the specific energy for the concentration stage for Ta and Nb applied during the flotation process for the 12 scenarios.
4.2. Specific Energy for Refining
Ta and Nb are extracted as by-products of Sn, as the slag generated during the beneficiation process of this metal contains a very high concentration of both elements. Therefore, a fair allocation must also be applied. At this stage, since both elements share the same processes, Ta and Nb each account for 50% of the costs.
It is important to note that the metallurgical processes for both metals remain the same in all the scenarios. This is so because the concentration at the beginning of the metallurgical stage is always the same, and, hence, the same processes apply to all scenarios.
With all the processes simulated in HSC and the considered allocation procedure, the values calculated for the Ta and Nb total refining process are 13.69 GJ/t-Ta and 13.21 GJ/t-Nb, respectively. These data are within the same order of magnitude as those found in other studies [60].
4.3. Total Energy
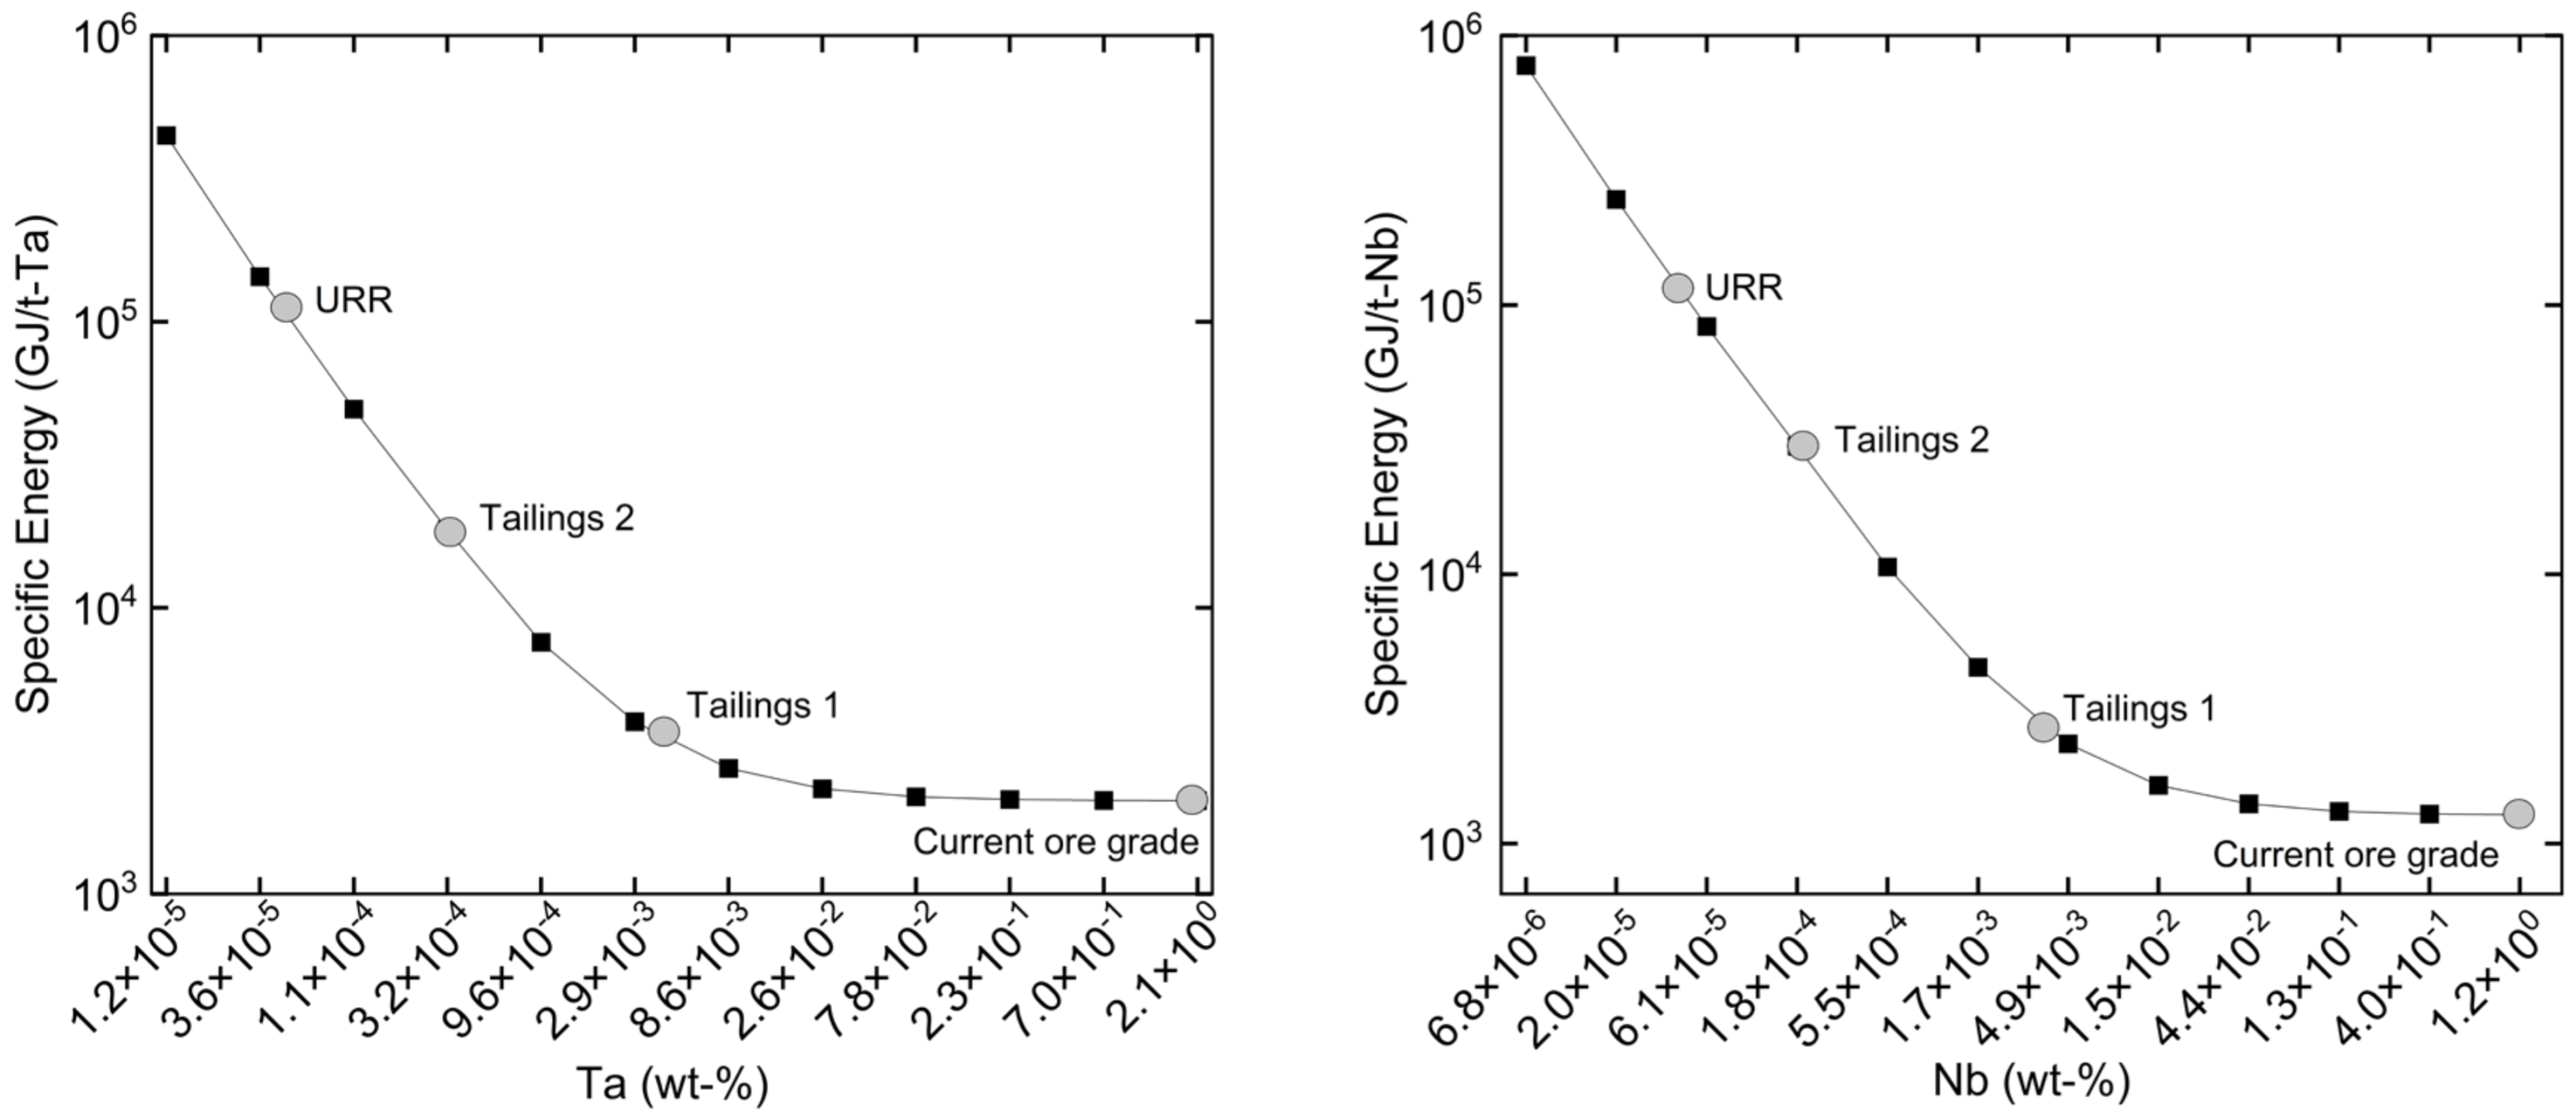
Figure 3 shows the evolution, in logarithmic scale, of the total specific energy for Ta and Nb, including the comminution, the flotation and the refining stages.
As observed, the specific energy experiences significant growth in both cases as the ore grade declines. It is important to note that the results are on a logarithmic scale, which means that the curve becomes exponential when the ore grade is drastically reduced or, in other words, when the mine approaches depletion. This is in line with other studies, where the evolution of the energy consumption as a function of the ore grade in different mines was analyzed [63]. Tailings 1 and 2 and URR are three relevant points with a particular concentration, explained in the next section.
In the current case study, several reasons can explain this growth. First of all, the amount of rock that has to be processed in each scenario grows considerably [64,65,66]. As the ore grade decreases at the beginning of the beneficiation process, the feed that reaches the flotation circuit is less concentrated, implying that more units are needed to concentrate the feed. Alternatively, more time is required to obtain the desired grade for further processing, which results in more specific energy for the flotation stage. Unlike in the comminution and flotation processes, the specific energy for concentration for the refining stage is always the same, as stated in the previous section.
It must be noted that ore-handling costs should also be considered, including transportation, feeding, and washing [67]. Ore-handling costs can be as high as those for beneficiation and refining or even higher, depending on the ore concentration [31]. All such costs are assigned in this paper to tin production, as it is considered the paying metal.
4.4. Tailings Ore-Grade Analysis
After carrying out the simulation, the energy requirements of very depleted mines can be appropriately assessed. Two situations are compared: extraction from current mines and extraction from tailings.
Current ore grade in mines has already been established and is represented by Scenario 1, being 2.1 wt-% and 1.2 wt-% for Ta and Nb, respectively. The average values considered for “Tailings 1” are 4.4 × 10⁻³ wt-% for Ta and 3.6 × 10⁻³ wt-% for Nb, corresponding to those of the Penouta mine in Spain (considering Balsa grande and Balsa pequeña) [29]. Tailings 2 is an even lower value, which has been arbitrarily reduced one order of magnitude with respect to Tailings 1, i.e., 3.2 × 10⁻⁴ wt-% for Ta and 1.83 × 10⁻⁴ wt-% for Nb.
Table 7 shows the energy requirements obtained. As can be seen, with current ore grades, the energy required to recover Ta and Nb is around 900 GJ/ton for Ta and 80 GJ/ton for Nb. Reducing the concentration to the Tailings 1 grade would increase energy costs to about 2140 GJ/ton of Ta and 1550 GJ/ton of Nb. Going beyond and considering Tailings 2 concentration would increase that energy to 17,540 GJ/ton of Ta and 28,700 GJ/ton of Nb. All such figures can be compared with energy requirements for the beneficiation of gold, one of the commodities for which ore grades are very low. As seen in Table 7, extracting Ta and Nb from Tailings 1 or 2 entail energy costs that are well below the current energy cost for the recovery of a ton of gold, which, according to Calvo et al. [63], is 145,000 GJ/t-gold. Accordingly, extracting Ta from Tailings 1 and Tailings 2 grades would have an energy cost equivalent to 1.48 and 12.09%, respectively, regarding gold beneficiation energy. For Nb, the figures would be 1.07 and 19.79%, respectively. Such high energy costs for gold are only justified by its elevated market price, which in 2021 reached an average price of 58,000 USD/kg [68]. Comparatively, the price of Ta was 160 USD/kg and for Nb 20 USD/kg that same year, i.e., 0.28 and 0.03% of gold market price, respectively [68].
Nonetheless, some authors state that there is a minimum concentration value from which beneficiation could be still profitable [24,69]. Hence, we could even go beyond and analyze the extraction energy costs of the so-called ultimate recoverable resources (URR), which are defined as the total amount of a certain mineral that could ever be recovered and produced [70]. Sverdrup and Rangnasdottir [24] proposed this limit grade at 5 × 10⁻⁵ wt-% for any metal. These authors’ limit is based on the well-known Hubbert’s peak model [71]. Considering the URR concentration of 5 × 10⁻⁵ wt-%, the energy costs would increase to 3401 toe/t for Ta and 1956 toe/t for Nb, reaching similar energy costs as for current gold extraction (Table 7).
To put these values in context, considering the worst-case scenario from a production perspective, some authors estimate the production of 6.5 kt of Ta in 2050 [72]. Regarding Nb, the expected demand for 2050 could increase to up to 250 kt [59]. If all this amount had to be extracted from mines that have reached this limit grade, the energy needed would represent almost 20% of the renewable energy generated that same year [73].
4.5. Economic Assessment
Knowing that the expected energy increases due to the reduction of mine grades, we can economically evaluate the extent to which these elements’ extraction in tailings could become profitable. High energy costs with low commodity prices are decisive factors for reclaiming tailings materials. It is thus essential to consider both aspects.
The primary energy source applied during the comminution process is electricity. For the refining process, natural gas and coal also come into play. Energy values can be transformed into monetary values through energy prices. For the study, the average price for electricity in 2021 in Spain has been chosen as 0.25 USD/kWh according to Eurostat [74], and for natural gas and coal, 0.086 USD/kWh and 123 USD/ton, respectively. It should be remembered that ore-handling energy costs (most of them in the form of diesel) are not considered here, as they are entirely allocated to the paying metal Sn.
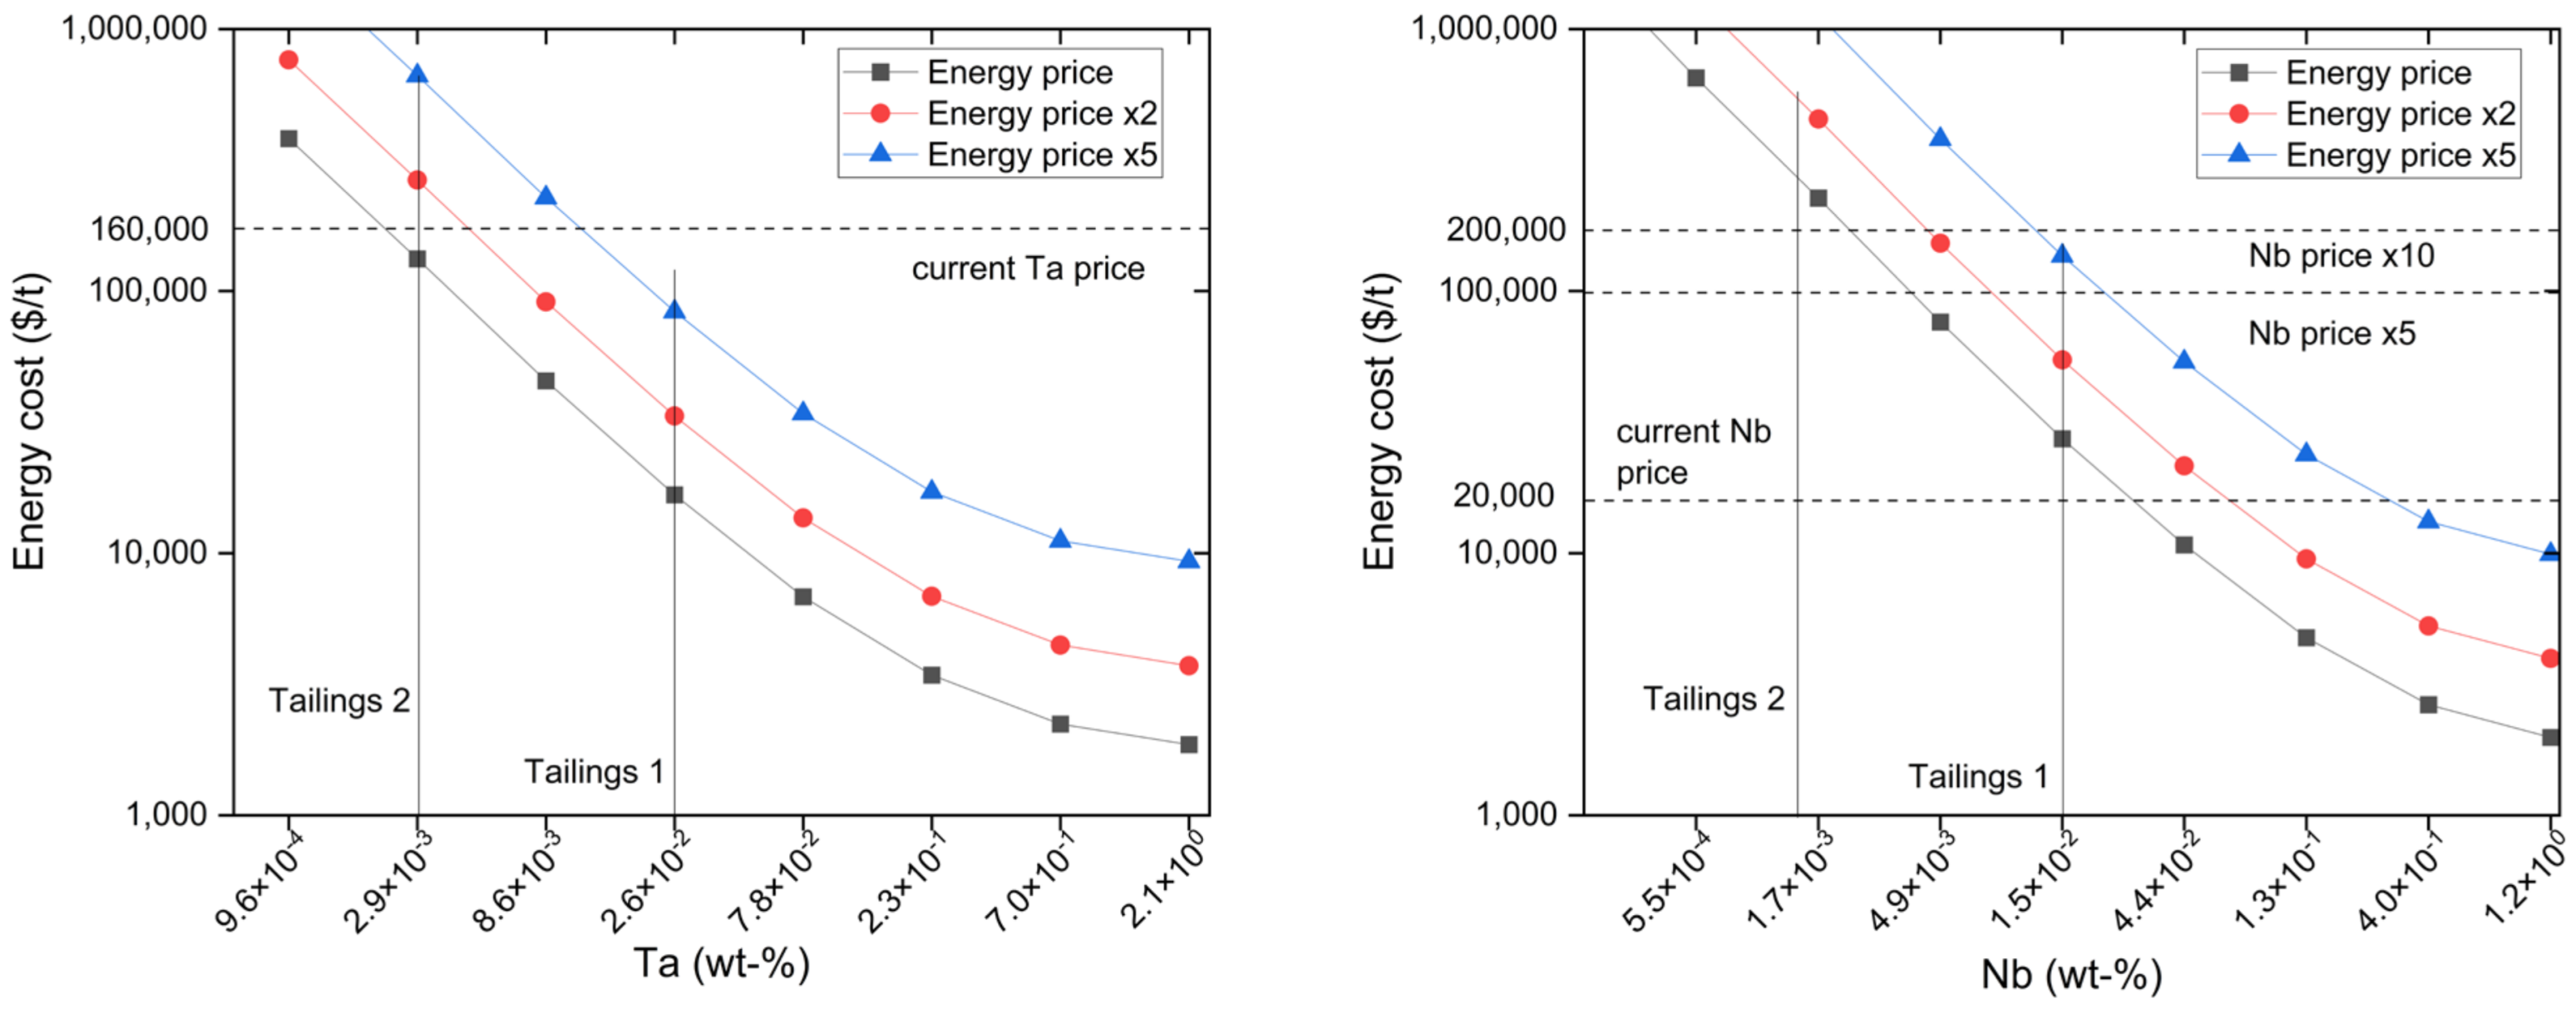
Accordingly, the estimated energy costs for Ta and Nb in Scenario 1 (i.e., considering current ore grades) are 1861 USD/t and 1984 USD/t, respectively, which constitute 1.16 and 9.92% of the average price for Ta and Nb in 2022 [68] (Ta: 160,000 USD/t, Nb: 20,000 USD/t). This leaves wide room for manoeuvre, even if many other costs need to be added, including investment costs, wages, water and chemical costs, emission abatement costs, etc. Figure 4 has been elaborated, considering different scenarios with rising energy costs. For instance, electricity prices increased from 0.14 USD/kWh to 0.31 USD/kWh from January 2021 to January 2022 in Spain [75]. Triggered by the soaring demand and supply-chain disruptions, commodity prices also increase. For instance, nickel and lithium recorded an increase of around 30% and 110% in the last year, respectively [68].
As shown in Figure 4, for the Tailings 1 scenario, with constant energy prices, energy costs rise by a factor of 10. For tantalum, energy costs still represent only a small fraction of current commodity prices (10%). If energy prices were to double, energy costs would represent 50% of current commodity prices, putting the viability of its extraction at risk. Tailings 2 scenario would be unfeasible even at current energy prices.
The case of niobium is slightly different, since the current Nb price is eight times lower than the Ta price, yet energy costs are similar due to their production routes. This means that Nb recovery from Tailings 1 is not cost-effective, even considering low energy prices. If Nb price were to increase fivefold, its recovery would likely be profitable if energy prices doubled. However, this would not be the case if, at the same time, energy prices increased fivefold. In that case, Nb extraction would only be likely viable if its market price increased tenfold. Extraction from Tailings 2 would be unfeasible in any analyzed scenario.
These results need to be interpreted with caution, as they are particularly sensitive to the metallogenesis of the ore and the allocation procedure. Niobium extraction is unfavored due to its low market price. A higher cost allocation towards tantalum would improve its viability. Similarly and as stated before, ore-handling energy costs were entirely assigned to the paying metal tin. Allocating part of such costs to tantalum or niobium would radically change the picture, questioning their profitability even at current ore grades.
5. Conclusions
Tantalum and niobium have become essential elements for the current society, as they are used in millions of electric and electronic devices and renewable technologies. The concentration of supply of both commodities, their scarcity, meagre recycling rates and soaring demand make these two metals very critical. This is why a new source of niobium and tantalum resources comes into play: tailings.
This paper analyzed the energy costs associated with the recovery of both elements as a function of their concentration in tin tailings. With the help of a simulation software, HSC Chemistry, we simulated the specific energy in every stage: comminution, flotation and refining.
Specifically, four situations were analyzed. The first corresponds to the current ore grade of both metals. The second one is based on the composition and concentration of current tailings in Penouta (Tailings 1). The third is a hypothetical situation with a concentration of one order of magnitude lower than that in Penouta (Tailings 2). The fourth is an extreme situation where the concentration reached is that of the so-called ultimate recoverable resources (URR).
As expected, it was found that the amount of energy required to extract a ton of Ta and Nb would considerably increase when ore grade declines, even if the best available technology were applied. However, for the first three scenarios, energy costs would still be significantly lower than current gold energy requirements and comparable with the URR scenario.
A preliminary economic assessment shows that, at the current commodity and energy prices and considering that ore-handling costs are allocated to tin in its entirety, the recovery of tantalum in the Tailings 1 scenario would be cost-effective, even if energy prices were to double. On the contrary, the recovery of niobium would not be favored because of its current low market price. If Nb prices increased or if most energy costs were allocated to tantalum, the situation would change.
There are many metals in abandoned mines and tailings that could be recovered in the future. Similarly, mountains of waste from electric and electronic equipment, with high concentrations of valuable metals, are filling worldwide landfills and are creating serious environmental problems. The time has come to recognize this waste as an opportunity, yet much more research needs to be undertaken to assess its recoverability.
Author Contributions
Investigation, simulation, writing—original draft preparation, R.M.; conceptualization, methodology, supervision, funding acquisition, A.V.; methodology, writing—review and editing, supervision, G.C. All authors have read and agreed to the published version of the manuscript.
Funding
This research was funded by the Spanish Ministry of Economy and Competitiveness (PID2020-116851RB-I00).
Institutional Review Board Statement
Not applicable.
Conflicts of Interest
The authors declare no conflict of interest.
References
- Kumar, V.; Ramachandran, D.; Kumar, B. Influence of new-age technologies on marketing: A research agenda. J. Bus. Res. 2020, 125, 864–877. [Google Scholar] [CrossRef]
- Hischier, R.; Wäger, P.; Gauglhofer, J. Does WEEE recycling make sense from an environmental perspective? The environmental impacts of the Swiss take-back and recycling systems for waste electrical and electronic equipment (WEEE). Environ. Impact Assess. Rev. 2005, 25, 525–539. [Google Scholar] [CrossRef]
- Watkins, D. Global Connected and IoT Device Forecast Update. Strategic Analytics. 2019. Available online: https://www.strategyanalytics.com/ (accessed on 16 May 2022).
- Calvo, G.; Valero, A. Strategic mineral resources: Availability and future estimations for the renewable energy sector. Environ. Dev. 2021, 41, 100640. [Google Scholar] [CrossRef]
- Valero, A.; Valero, A.; Calvo, G.; Ortego, A. Material bottlenecks in the future development of green technologies. Renew. Sustain. Energy Rev. 2018, 93, 178–200. [Google Scholar] [CrossRef]
- Salazar, I.P.; Valdés, D.A.; Bustamante, N. Análisis descriptivo del coltán en Colombia y sus posibles mercados potenciales. Ph.D. Thesis, Universidad del Rosario, Bogotá, Colombia, 2010. [Google Scholar]
- González, H.D. Trasgresión de derechos humanos a raíz del tráfico ilegal de coltán en el Departamento del Guainía. Cienc. Poder Aéreo 2015, 10, 151–168. [Google Scholar] [CrossRef] [Green Version]
- Calvo, G.; Valero, A.; Valero, A.; Sevillano, G.C. Thermodynamic Approach to Evaluate the Criticality of Raw Materials and Its Application through a Material Flow Analysis in Europe. J. Ind. Ecol. 2017, 22, 839–852. [Google Scholar] [CrossRef] [Green Version]
- Moss, R.L.; Tzimas, E.; Kara, H.; Willis, P.; Kooroshy, J. Critical Metals in Strategic Energy Technologies; JRC-Scientific and Strategic Reports; European Commission Joint Research, Centre Institute for Energy and Transport: Petten, The Netherlands, 2011; Volume JRC 65592. [Google Scholar] [CrossRef]
- EC. EU Critical Raw Materials in the Circular Economy and Strategic Value Chains and EU R&D Funding. European Comission, Brussels, January, 19. 2019. Available online: https://www.euchems.eu/wp-content/uploads/2019/01/The-Periodic-Table-and-us-Handley-European-Commission.pdf (accessed on 13 January 2022).
- Critical Defense Materials. Government Collected Data Are Sufficiently Reliable to Assess Tantalum Availability. 2016. Available online: https://www.gao.gov/products/gao-16-335 (accessed on 13 January 2022).
- Monsalve, L. La Edad del Coltán. 2012. Available online: https://www.saladeespera.com.ve (accessed on 25 January 2021).
- Bleischwitz, R.; Dittrich, M.; Pierdicca, C. Coltan from Central Africa, international trade and implications for any certification. Resour. Policy 2012, 37, 19–29. [Google Scholar] [CrossRef] [Green Version]
- D’Angelo, L.; Pijpers, R. Mining Temporalities: An Overview. Extr. Ind. Soc. 2018, 5, 215–222. [Google Scholar] [CrossRef]
- Consejo de Seguridad de Naciones Unidas. Resolución 1952. 2010. [Google Scholar]
- Security Council United Nations. Final Report 2010, Vol. 1533. Available online: https://www.un.org/securitycouncil/sanctions/1533/panel-of-experts/expert-reports (accessed on 13 January 2022).
- Van Bockstael, S. The emergence of conflict-free, ethical, and Fair Trade mineral supply chain certification systems: A brief introduction. Extr. Ind. Soc. 2018, 5, 52–55. [Google Scholar] [CrossRef]
- Magdalena, R.; Valero, A.; Calvo, G.; Alguacil, F.J.; López, F.A. Simulation to Recover Niobium and Tantalum from the Tin Slags of the Old Penouta Mine: A Case Study. Minerals 2021, 11, 1123. [Google Scholar] [CrossRef]
- Schütte, P.; Näher, U. Tantalum supply from artisanal and small-scale mining: A mineral economic evaluation of coltan production and trade dynamics in Africa’s Great Lakes region. Resour. Policy 2020, 69, 101896. [Google Scholar] [CrossRef]
- Emery, K. GAM Closes Wodgina Tantalum Mine. The West Australian. 2012. Available online: https://thewest.com.au/ (accessed on 23 February 2022).
- Nathan, D.; Sarkar, S. Blood on your mobile? Econ. Political Wkly. 2010, 45, 22–24. [Google Scholar]
- Nikishina, E.E.; Drobot, D.V.; Lebedeva, E.N. Niobium and tantalum: State of the world market, application fields, and sources of raw materials. Part 2. Russ. J. Non-Ferrous Met. 2014, 55, 130–140. [Google Scholar] [CrossRef]
- United States Geological Survey (USGS). Niobium (Columbium). 2021. Available online: https://pubs.usgs.gov/periodicals/mcs2021/mcs2021-niobium.pdf (accessed on 13 January 2022).
- Sverdrup, H.; Ragnarsdottir, K.V. Natural resources in a planetary perspective. Geochem. Perspect. 2014, 3, 129–341. [Google Scholar] [CrossRef] [Green Version]
- Calvo, G.; Valero, A.; Valero, A. Assessing maximum production peak and resource availability of non-fuel mineral resources: Analyzing the influence of extractable global resources. Resour. Conserv. Recycl. 2017, 125, 208–217. [Google Scholar] [CrossRef]
- Valero, A.; Valero, A.; Calvo, G. The Material Limits of the Energy Transition: Thanatia; Springer: Zaragoza, Spain, 2021. [Google Scholar]
- Falagán, C.; Grail, B.M.; Johnson, D.B. New approaches for extracting and recovering metals from mine tailings. Miner. Eng. 2017, 106, 71–78. [Google Scholar] [CrossRef]
- Morin, D.H.R.; D’Hugues, P. Bioleaching of a cobalt-containing pyrite in stirred reactors: A case study from laboratory scale to industrial application. Biomining 2007, 35–55. [Google Scholar] [CrossRef]
- Alfonso, P.; Hamid, S.A.; Anticoi, H.; Garcia-Valles, M.; Oliva, J.; Tomasa, O.; López-Moro, F.J.; Bascompta, M.; Llorens, T.; Castro, D.; et al. Liberation characteristics of ta–sn ores from penouta, nw spain. Minerals 2020, 10, 509. [Google Scholar] [CrossRef]
- Valero, A.; Valero, A.; Arauzo, I. Evolution of the decrease in mineral exergy throughout the 20th century. The case of copper in the US. Energy 2008, 33, 107–115. [Google Scholar] [CrossRef]
- Palacios, J.-L.; Abadias, A.; Valero, A.; Valero, A.; Reuter, M.A. Producing metals from common rocks: The case of gold. Resour. Conserv. Recycl. 2019, 148, 23–35. [Google Scholar] [CrossRef]
- Ungerer, M.; van der Westhuizen, D.; Lachmann, G.; Krieg, H. Comparison of extractants for the separation of TaF5 and NbF5 in different acidic media. Hydrometallurgy 2014, 144–145, 195–206. [Google Scholar] [CrossRef]
- Ayanda, O.S.; Adekola, F.A. A Review of Niobium-Tantalum Separation in Hydrometallurgy. J. Miner. Mater. Charact. Eng. 2011, 10, 245–256. [Google Scholar] [CrossRef]
- Melcher, F.; Graupner, T.; Gäbler, H.-E.; Sitnikova, M.; Oberthür, T.; Gerdes, A.; Badanina, E.; Chudy, T. Mineralogical and chemical evolution of tantalum–(niobium–tin) mineralisation in pegmatites and granites. Part 2: Worldwide examples (excluding Africa) and an overview of global metallogenetic patterns. Ore Geol. Rev. 2017, 89, 946–987. [Google Scholar] [CrossRef]
- Shikika, A.; Sethurajan, M.; Muvundja, F.; Mugumaoderha, M.; Gaydardzhiev, S. A review on extractive metallurgy of tantalum and niobium. Hydrometallurgy 2020, 198, 105496. [Google Scholar] [CrossRef]
- López, F.A.; García-Díaz, I.; Largo, O.R.; Polonio, F.G.; Llorens, T. Recovery and purification of tin from tailings from the Penouta Sn-Ta-Nb deposit. Minerals 2018, 8, 20. [Google Scholar] [CrossRef] [Green Version]
- Crundwell, F.; Moats, M.; Ramachandran, V.; Robinson, T.; Davenport, W. Smelting of Nickel Sulfide Concentrates by Roasting and Electric Furnace Smelting. Extr. Metall. Nickel Cobalt Platin. Group Met. 2011, 199–214. [Google Scholar] [CrossRef]
- Metso. Basics in Minerals Processing, 10th ed.; Metso Corporation: Helsinki, Finland, 2015; Available online: http://www.metso.com/miningandconstruction/MaTobox7.nsf/DocsByID/EAE6CA3B8E216295C2257E4B003FBBA6/$File/Basics-in-minerals-processing.pdf (accessed on 13 January 2022).
- Rankin, W. Minerals, Metals and Sustainability. Meeting Future Material Needs; CSIRO Publishing: Clayton, Australia, 2011. [Google Scholar] [CrossRef]
- Napier-Munn, T.; Barry, A.W. Mineral Processing Technology. An Introduction to the Practical Aspects of Ore Treatment and Mineral Recovery. Wills’ Mineral Processing Technology, 7th ed.; B&H Publisher: Nashville, TN, USA, 2006. [Google Scholar] [CrossRef]
- Black, Z.J.; Brown, J.J.; Dempers, N.; Drielick, T.L.; Ibrado, A.S.; Patterson, E.L.; Welhener, H.E. NorthMet Project. Technical Report 2018, Vol. March 26. Available online: https://polymetmining.com/wp-content/uploads/2018/10/PN150163-PolyMet-NI-43-101-Technical-Report-2018_03_26_Rev0.pdf (accessed on 13 January 2022).
- Kapadia, S. Comminution in Mineral Processing; Institute of Mineral Processing, Department of Mechanical Engineering: Clausthal-Zellerfeld, Germany, 2018. [Google Scholar]
- Valero, A.; Valero, A. Exergy of comminution and the Thanatia Earth’s model. Energy 2012, 44, 1085–1093. [Google Scholar] [CrossRef]
- Michaud, D. Table of Bond Work Index by Minerals. 911 Metallurgist. 2015. Available online: https://www.911metallurgist.com/blog/table-of-bond-work-index-by-minerals. (accessed on 16 May 2021).
- Palacios, J.-L.; Fernandes, I.; Abadias, A.; Valero, A.; Valero, A.; Reuter, M.A. Avoided energy cost of producing minerals: The case of iron ore. Energy Rep. 2019, 5, 364–374. [Google Scholar] [CrossRef]
- Rowland, C.A. Using the Bond work index to measure operating comminution efficiency. Min. Met. Explor. 1998, 15, 32–36. [Google Scholar] [CrossRef]
- Gibson, C.; Kelebek, S.; Aghamirian, M. Niobium oxide mineral flotation: A review of relevant literature and the current state of industrial operations. Int. J. Miner. Process. 2015, 137, 82–97. [Google Scholar] [CrossRef]
- Ghorbani, Y.; Fitzpatrick, R.; Kinchington, M.; Rollinson, G.; Hegarty, P. A process mineralogy approach to gravity concentration of tantalum bearing minerals. Minerals 2017, 7, 194. [Google Scholar] [CrossRef] [Green Version]
- Neto, A.C.B.; Pereira, V.P.; Ronchi, L.H.; De Lima, E.F.; Frantz, J.C. The world-class Sn, Nb, Ta, F (Y, REE, Li) Deposit and the massive cryolite associated with the albite-enriched facies of the madeira a-type granite, Pitinga Mining District, Amazonas State, Brazil. Can. Miner. 2009, 47, 1329–1357. [Google Scholar] [CrossRef]
- López-Moro, F.J.; Polonio, F.G.; González, T.L.; Contreras, J.L.S.; Fernández, A.F.; Benito, M.C.M. Ta and Sn concentration by muscovite fractionation and degassing in a lens-like granite body: The case study of the Penouta rare-metal albite granite (NW Spain). Ore Geol. Rev. 2017, 82, 10–30. [Google Scholar] [CrossRef]
- Haapala, I. Magmatic and postmagmatic processes in tin-mineralized granites: Topaz-bearing leucogranite in the Eurajoki rapakivi granite stock, Finland. J. Pet. 1997, 38, 1645–1659. [Google Scholar] [CrossRef]
- Shikika, A.; Muvundja, F.; Mugumaoderha, M.; Gaydardzhiev, S. Extraction of Nb and Ta from a coltan ore from South Kivu in the DRC by alkaline roasting—thermodynamic and kinetic aspects. Miner. Eng. 2021, 163, 106751. [Google Scholar] [CrossRef]
- Crundwell, F.K.; Moats, M.S.; Ramachandran, V.; Robinson, T.G.; Davenport, W.G. Extractive Metallurgy of Nickel, Cobalt and Platinum-Group Metals; Elsevier Ltd.: Amsterdam, The Netherlands, 2011. [Google Scholar]
- Latchireddi, S.; Faria, E. Achievement of high energy efficiency in grinding mills at Santa Rita. In Proceedings of the 45th Annual Meeting of the Canadian Mineral Processors, Ottawa, ON, Canada, 22–24 January 2013; pp. 97–110. [Google Scholar]
- Kolmetz, K.; Kolmetz, K. Practical Engineering Guidelines for Processing Plant Solutions; KLM Technology Group: Johor Bahru, Malaysia, 2020. [Google Scholar]
- Rodríguez, O.; Alguacil, F.J.; Baquero, E.E.; García-Díaz, I.; Fernández, P.; Sotillo, B.; López, F.A. Recovery of niobium and tantalum by solvent extraction from Sn-Ta-Nb mining tailings. RSC Adv. 2020, 10, 21406–21412. [Google Scholar] [CrossRef]
- Rötzer, N.; Schmidt, M. Decreasing metal ore grades-Is the fear of resource depletion justified? Resources 2018, 7, 88. [Google Scholar] [CrossRef] [Green Version]
- West, J. Decreasing Metal Ore Grades: Are They Really Being Driven by the Depletion of High-Grade Deposits? J. Ind. Ecol. 2011, 15, 165–168. [Google Scholar] [CrossRef]
- Sverdrup, H.U.; Olafsdottir, A.H. A System Dynamics Model Assessment of the Supply of Niobium and Tantalum Using the WORLD Model. BioPhysical Economics and Resource Quality; Springer: Berlin/Heidelberg, Germany, 2018; Volume 3. [Google Scholar] [CrossRef]
- Smith, L.; Ibn-Mohammed, T.; Koh, S.L.; Reaney, I. Life cycle assessment and environmental profile evaluations of high volumetric efficiency capacitors. Appl. Energy 2018, 220, 496–513. [Google Scholar] [CrossRef]
- Ministerio de Trabajo y Asuntos Sociales. Poder Calorífico (q) de Diversas Sustancias Producto; Instituto Nacional de Seguridad e Higiene en el Trabajo: Salamanca, Spain, 2020.
- ESSOM Co. Ltd. Heating Values of Hydrogen and Fuels, 1. 2019. Available online: https://chemeng.queensu.ca/courses/CHEE332/files/ethanol_heating-values.pdf (accessed on 13 January 2022).
- Calvo, G.; Mudd, G.; Valero, A.; Valero, A. Decreasing Ore Grades in Global Metallic Mining: A Theoretical Issue or a Global Reality? Resources 2016, 5, 36. [Google Scholar] [CrossRef] [Green Version]
- Mudd, G.M. The Sustainability of Mining in Australia: Key Production Trends and Their Environmental Implications for the Future; Department of Civil Engineering, Monash University and Mineral Policy Institute: Clayton, Australia, 2009. [Google Scholar]
- Norgate, T.; Haque, N.; Wright, S.; Jahanshahi, S. Opportunities and technologies to reduce the energy and water impacts of deteriorating ore reserves. In Proceedings of the Sustainable Minning Conference, Australia, Kalgoorlie, 17–19 August 2010; pp. 128–137. [Google Scholar]
- Mudd, G.M. The Environmental sustainability of mining in Australia: Key mega-trends and looming constraints. Resour. Policy 2010, 35, 98–115. [Google Scholar] [CrossRef]
- Sutherland, C.A.; Milner, E.F.; Kerby, R.C.; Herbert, T.; Melin, A.; Bolt, H.M. Lead Ullmann’s Encyclopedia. Encyclopedia of Industrial Chemistry; Wiley: Weinheim, Germany, 2011. [Google Scholar]
- U.S. Geological Survey. Mineral Commodity Summaries 2022. 2022. Available online: https://www.economia.gob.mx/files/gobmx/mineria/manual_del_inversionista.pdf (accessed on 13 January 2022).
- Valero, A.; Valero, A. Thanatia: The Destiny of the Earth’s Mineral Resources; World Scientific Publishing: Zaragoza, Spain, 2014. [Google Scholar]
- McGlade, C.E. A review of the uncertainties in estimates of global oil resources. Energy 2012, 47, 262–270. [Google Scholar] [CrossRef] [Green Version]
- Servicio Geólogico de Mexico. Asignación Minera “CAÑA DE ORO”. 2011. Available online: https://0-www-sciencedirect-com.brum.beds.ac.uk/science/article/pii/S036054421200597X?via%3Dihub (accessed on 13 January 2022).
- Watari, T.; Nansai, K.; Nakajima, K. Review of critical metal dynamics to 2050 for 48 elements. Resour. Conserv. Recycl. 2020, 155, 104669. [Google Scholar] [CrossRef]
- EU Commision. Trends to 2050. 2013. Available online: https://ec.europa.eu/energy/sites/ener/files/documents/trends_to_2050_update_2013.pdf (accessed on 16 May 2022).
- Eurostat. Electricity Price Statistics. 2021. Available online: https://ec.europa.eu/eurostat/statistics-explained (accessed on 27 April 2022).
- Selectra. Evolución Precio de la luz en España. Precio de la luz Hora a Hora en España (Electricity Price by Hour in Spain). 2021. Available online: https://selectra.es/energia (accessed on 27 April 2022).
Figure 1.
Flowsheet for the extraction of Ta and Nb from tin tailings.

Figure 2.
Comminution process.

Figure 3.
Specific energy for concentration for Ta (left) and Nb (right). In both cases, the Y axis is in log scale. For the sake of clarity, the points representing the scenarios have been joined to form a continuous line.
Figure 3.
Specific energy for concentration for Ta (left) and Nb (right). In both cases, the Y axis is in log scale. For the sake of clarity, the points representing the scenarios have been joined to form a continuous line.

Figure 4.
Evolution of energy costs as a function of ore-grade decline for different scenarios.


Table 1.
Concentration along the beneficiation and refining process (%).
| In Mined Ore [50] | After Flotation [36] | After Refining [33,36] | |
|---|---|---|---|
| Ta2O5 | 0.51–3.7 | 8.45 | 79.67 |
| Nb2O5 | 0.16–2.22 | 5.40 | 98.45 |
Table 2.
Feed for every scenario created.
| Scenario | Feed [t/h] | Scenario | Feed [t/h] |
|---|---|---|---|
| 1 | 400 | 7 | 800 |
| 2 | 450 | 8 | 1000 |
| 3 | 500 | 9 | 1400 |
| 4 | 550 | 10 | 1800 |
| 5 | 600 | 11 | 2400 |
| 6 | 700 | 12 | 3000 |
Table 3.
Detail of the units of the comminution process for scenario 1.
| Equipment | Power Demand [MW] | Specific Energy [kWh/t Rock] |
|---|---|---|
| Primary crusher | 0.365 | 0.38 |
| Cone crusher | 0.477 | 0.88 |
| SAG mill | 3.975 | 7.27 |
| Grinding—Ball mill 1 | 22.927 | 12.05 |
| Grinding—Ball mill 2 | 11.960 | 9.68 |
| Re-grinding | 3.735 | 10.46 |
Table 4.
Summary of the inputs introduced in the metallurgy process for a ton of rock (data in t/h).
Table 4.
Summary of the inputs introduced in the metallurgy process for a ton of rock (data in t/h).
| Reagents | Electr. 1 | Casting | C. Tower 2 | Leaching | Liquid. Extra. | Stripping | Pre. Nb 3 | Calc. Nb 4 | Stripping 2 | Pre. Ta 5 | Calc. Ta 6 |
|---|---|---|---|---|---|---|---|---|---|---|---|
| H2O | 10.24 | 0.08 | 0.13 | 1.97 | - | 4.05 | - | - | 3.94 | 7.67 | - |
| HF | - | - | - | 0.49 | - | - | - | - | - | - | - |
| H2SO4 | 0.88 | - | - | 1.59 | - | - | - | - | - | - | - |
| Cyanex | - | - | - | - | 4.2 | - | - | - | - | - | - |
| NH4F | - | - | - | - | - | 0.04 | - | - | 0.17 | - | - |
| NH3 | - | - | - | - | - | 0.01 | 0.60 | - | 0.03 | - | - |
| KF | - | - | - | - | - | - | - | - | - | 0.76 | - |
| Natural gas | - | - | - | - | - | - | - | 0.0038 | 0.022 | - | 0.0063 |
1 electrolysis; 2 cooling tower; 3 precipitation Nb; 4 calcination Nb; 5 precipitation Ta; 6 calcination Ta.
Table 5.
Summary of the mass balance for the three metals studied using a ton of rock as input in the metallurgy process.
Table 5.
Summary of the mass balance for the three metals studied using a ton of rock as input in the metallurgy process.
| Beginning of the Process | End of the Process | Recovery Yield | |||
|---|---|---|---|---|---|
| t/h | wt-% | t/h | wt-% | % | |
| Sn | 0.54 | 54.35 | 0.50 | 99.99 | 92 |
| Ta | 0.06 | 6.51 | 0.06 | 79.67 | 95 |
| Nb | 0.04 | 4.68 | 0.03 | 98.45 | 67 |
Table 6.
Evolution of the specific energy for concentration obtained during the flotation stage (data in GJ/t-ore).
Table 6.
Evolution of the specific energy for concentration obtained during the flotation stage (data in GJ/t-ore).
| Ta | Nb | |
|---|---|---|
| Scenario 1 (con. in mine) | 0.68 | 1.21 |
| Scenario 2 | 1.14 | 2.17 |
| Scenario 3 | 2.12 | 4.26 |
| Scenario 4 | 6.11 | 12.23 |
| Scenario 5 | 17.30 | 21.16 |
| Scenario 6 | 45.89 | 48.25 |
| Scenario 7 | 136.57 | 178.23 |
| Scenario 8 | 328.41 | 360.23 |
| Scenario 9 | 703.33 | 768.15 |
| Scenario 10 | 1729.44 | 1974.79 |
| Scenario 11 | 4495.87 | 5280.51 |
| Scenario 12 | 13,135.13 | 16,192.05 |
Table 7.
Comparison of the specific energy and % of the energy compared with the gold beneficiation process.
Table 7.
Comparison of the specific energy and % of the energy compared with the gold beneficiation process.
| Ta | Nb | |||||||
|---|---|---|---|---|---|---|---|---|
| Ore Grade | wt-% | GJ/t-Ta | toe/t-Ta | % Compared with Gold 1 [63] | wt-% | GJ/t-Nb | toe/t-Nb | % Compared with Gold 1 [63] |
| Current | 2.10 | 916.70 | 21.89 | 0.63% | 1.20 | 78.47 | 1.87 | 0.05% |
| Tailings 1 | 4.4 × 10⁻³ | 2144.8 | 51.22 | 1.48% | 3.6 × 10⁻³ | 1552.6 | 37.08 | 1.07% |
| Tailings 2 | 3.2 × 10⁻⁴ | 17,541.8 | 418.97 | 12.09% | 1.83 × 10⁻⁴ | 28,709.7 | 685.70 | 19.79% |
| URR | 5 × 10⁻⁵ | 142,413 | 3401 | 98.21% | 5 × 10⁻⁵ | 81,912 | 1956 | 56.49% |
1 % compared with the average energy requirements for gold beneficiation.
Publisher’s Note: MDPI stays neutral with regard to jurisdictional claims in published maps and institutional affiliations. |
© 2022 by the authors. Licensee MDPI, Basel, Switzerland. This article is an open access article distributed under the terms and conditions of the Creative Commons Attribution (CC BY) license (https://creativecommons.org/licenses/by/4.0/).
Share and Cite
MDPI and ACS Style
Magdalena, R.; Calvo, G.; Valero, A. The Energy Cost of Extracting Critical Raw Materials from Tailings: The Case of Coltan. Geosciences 2022, 12, 214. https://0-doi-org.brum.beds.ac.uk/10.3390/geosciences12050214
AMA Style
Magdalena R, Calvo G, Valero A. The Energy Cost of Extracting Critical Raw Materials from Tailings: The Case of Coltan. Geosciences. 2022; 12(5):214. https://0-doi-org.brum.beds.ac.uk/10.3390/geosciences12050214
Chicago/Turabian StyleMagdalena, Ricardo, Guiomar Calvo, and Alicia Valero. 2022. "The Energy Cost of Extracting Critical Raw Materials from Tailings: The Case of Coltan" Geosciences 12, no. 5: 214. https://0-doi-org.brum.beds.ac.uk/10.3390/geosciences12050214
Note that from the first issue of 2016, this journal uses article numbers instead of page numbers. See further details here.