
The Arkalochori Mw = 5.9 Earthquake of 27 September 2021 Inside the Heraklion Basin: A Shallow, Blind Rupture Event Highlighting the Orthogonal Extension of Central Crete

 ,
,  , , , , , and
Abstract
:1. Introduction
2. Tectonic Setting
3. Data & Methods
3.1. The 2021 Seismic Sequence of Arkalohori
3.2. GNSS Data Processing
3.3. Geodetic Data from Sentinel-1 SAR Interferometry
4. Inversion for Coseismic Slip Model
5. Discussion
5.1. The Arkalochori Rupture Characteristics
5.2. Normal Fault Segmentation and the 27 September 2021 Rupture
5.3. The Relative Value of InSAR vs. GNSS Observations
6. Conclusions
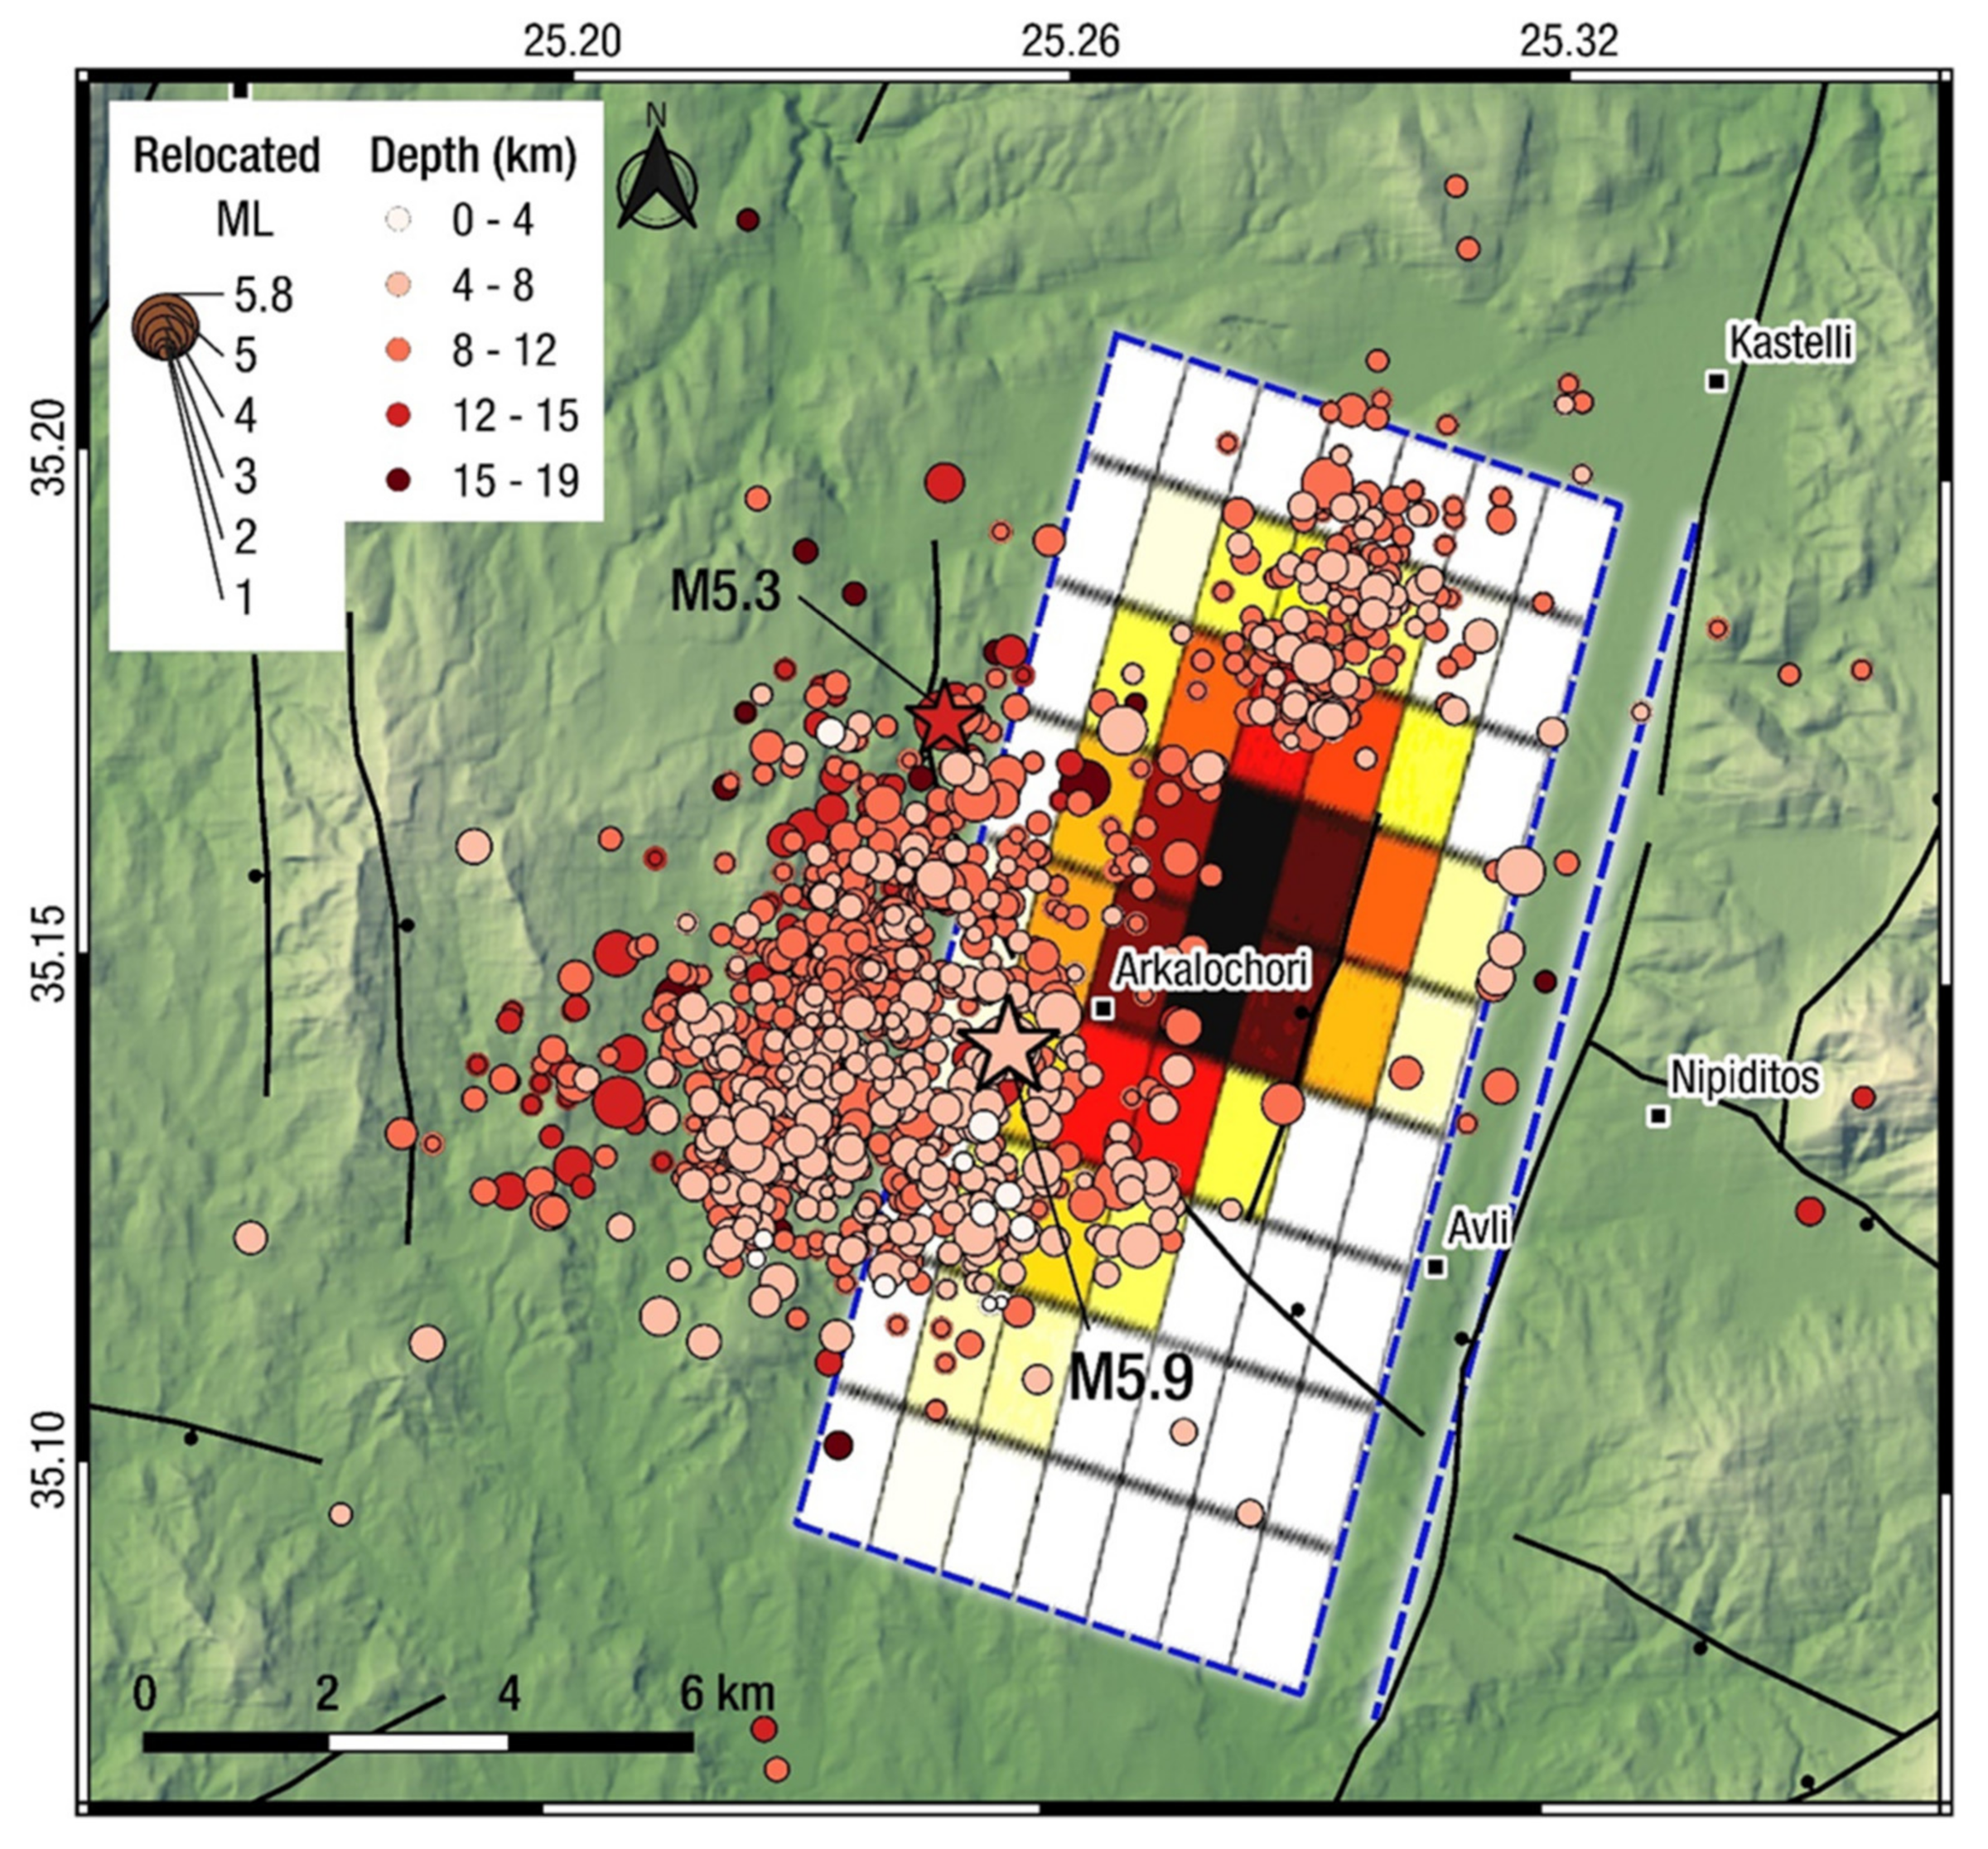
- The 27 September 2021 M5.9 earthquake produced significant ground deformation in the vicinity of the village of Arkalochori, but no surface ruptures of primary (tectonic) origin.
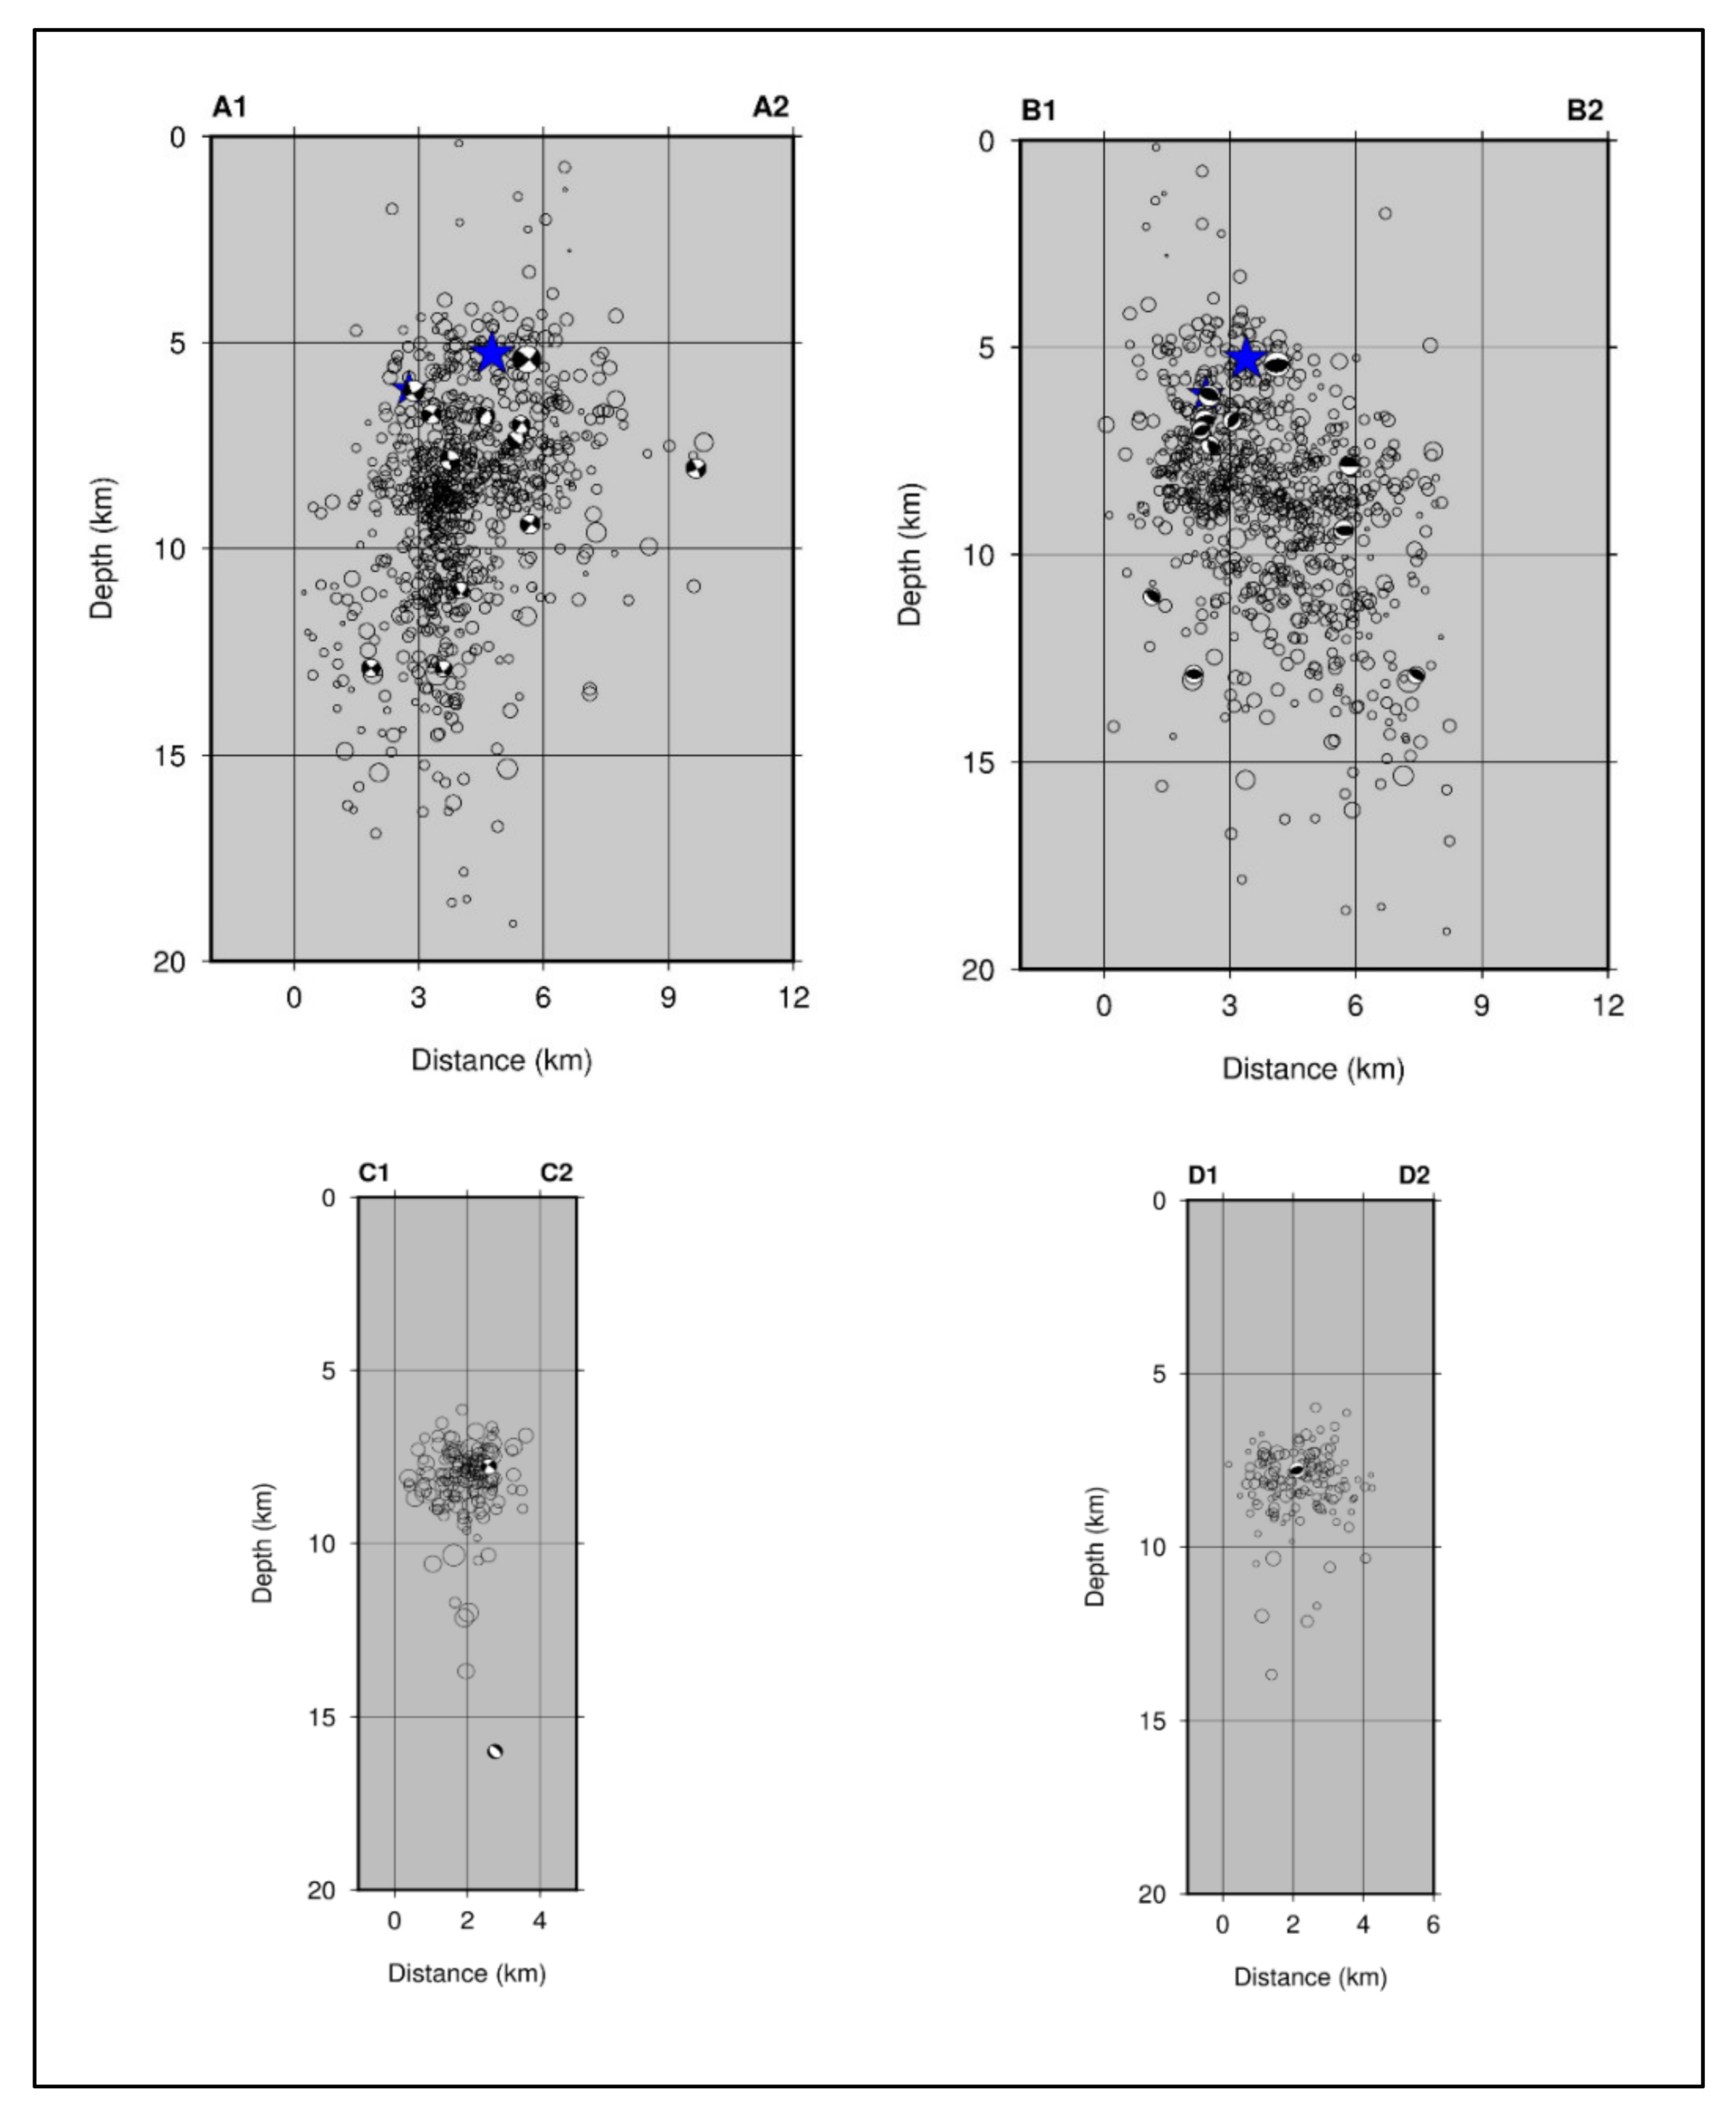
- The distribution of the relocated aftershocks revealed a west-dipping fault with activity limited to depth up to 12 km. The clustering of aftershocks indicates that another shallow structure or a neighbouring segment of the same fault zone was activated right after the occurrence of the mainshock, to the NE of the rupture.
- We used geodetic data (InSAR & GNSS) to derive a finite fault model. The along-strike averaged coseismic slip has a maximum at depth of 4–6 km, with a maximum amplitude of 1.2 m.
- The geodetic moment of this earthquake was found in the order of 1.1 × 10¹⁸ N·m, which corresponds to an earthquake moment magnitude Mw = 5.96.
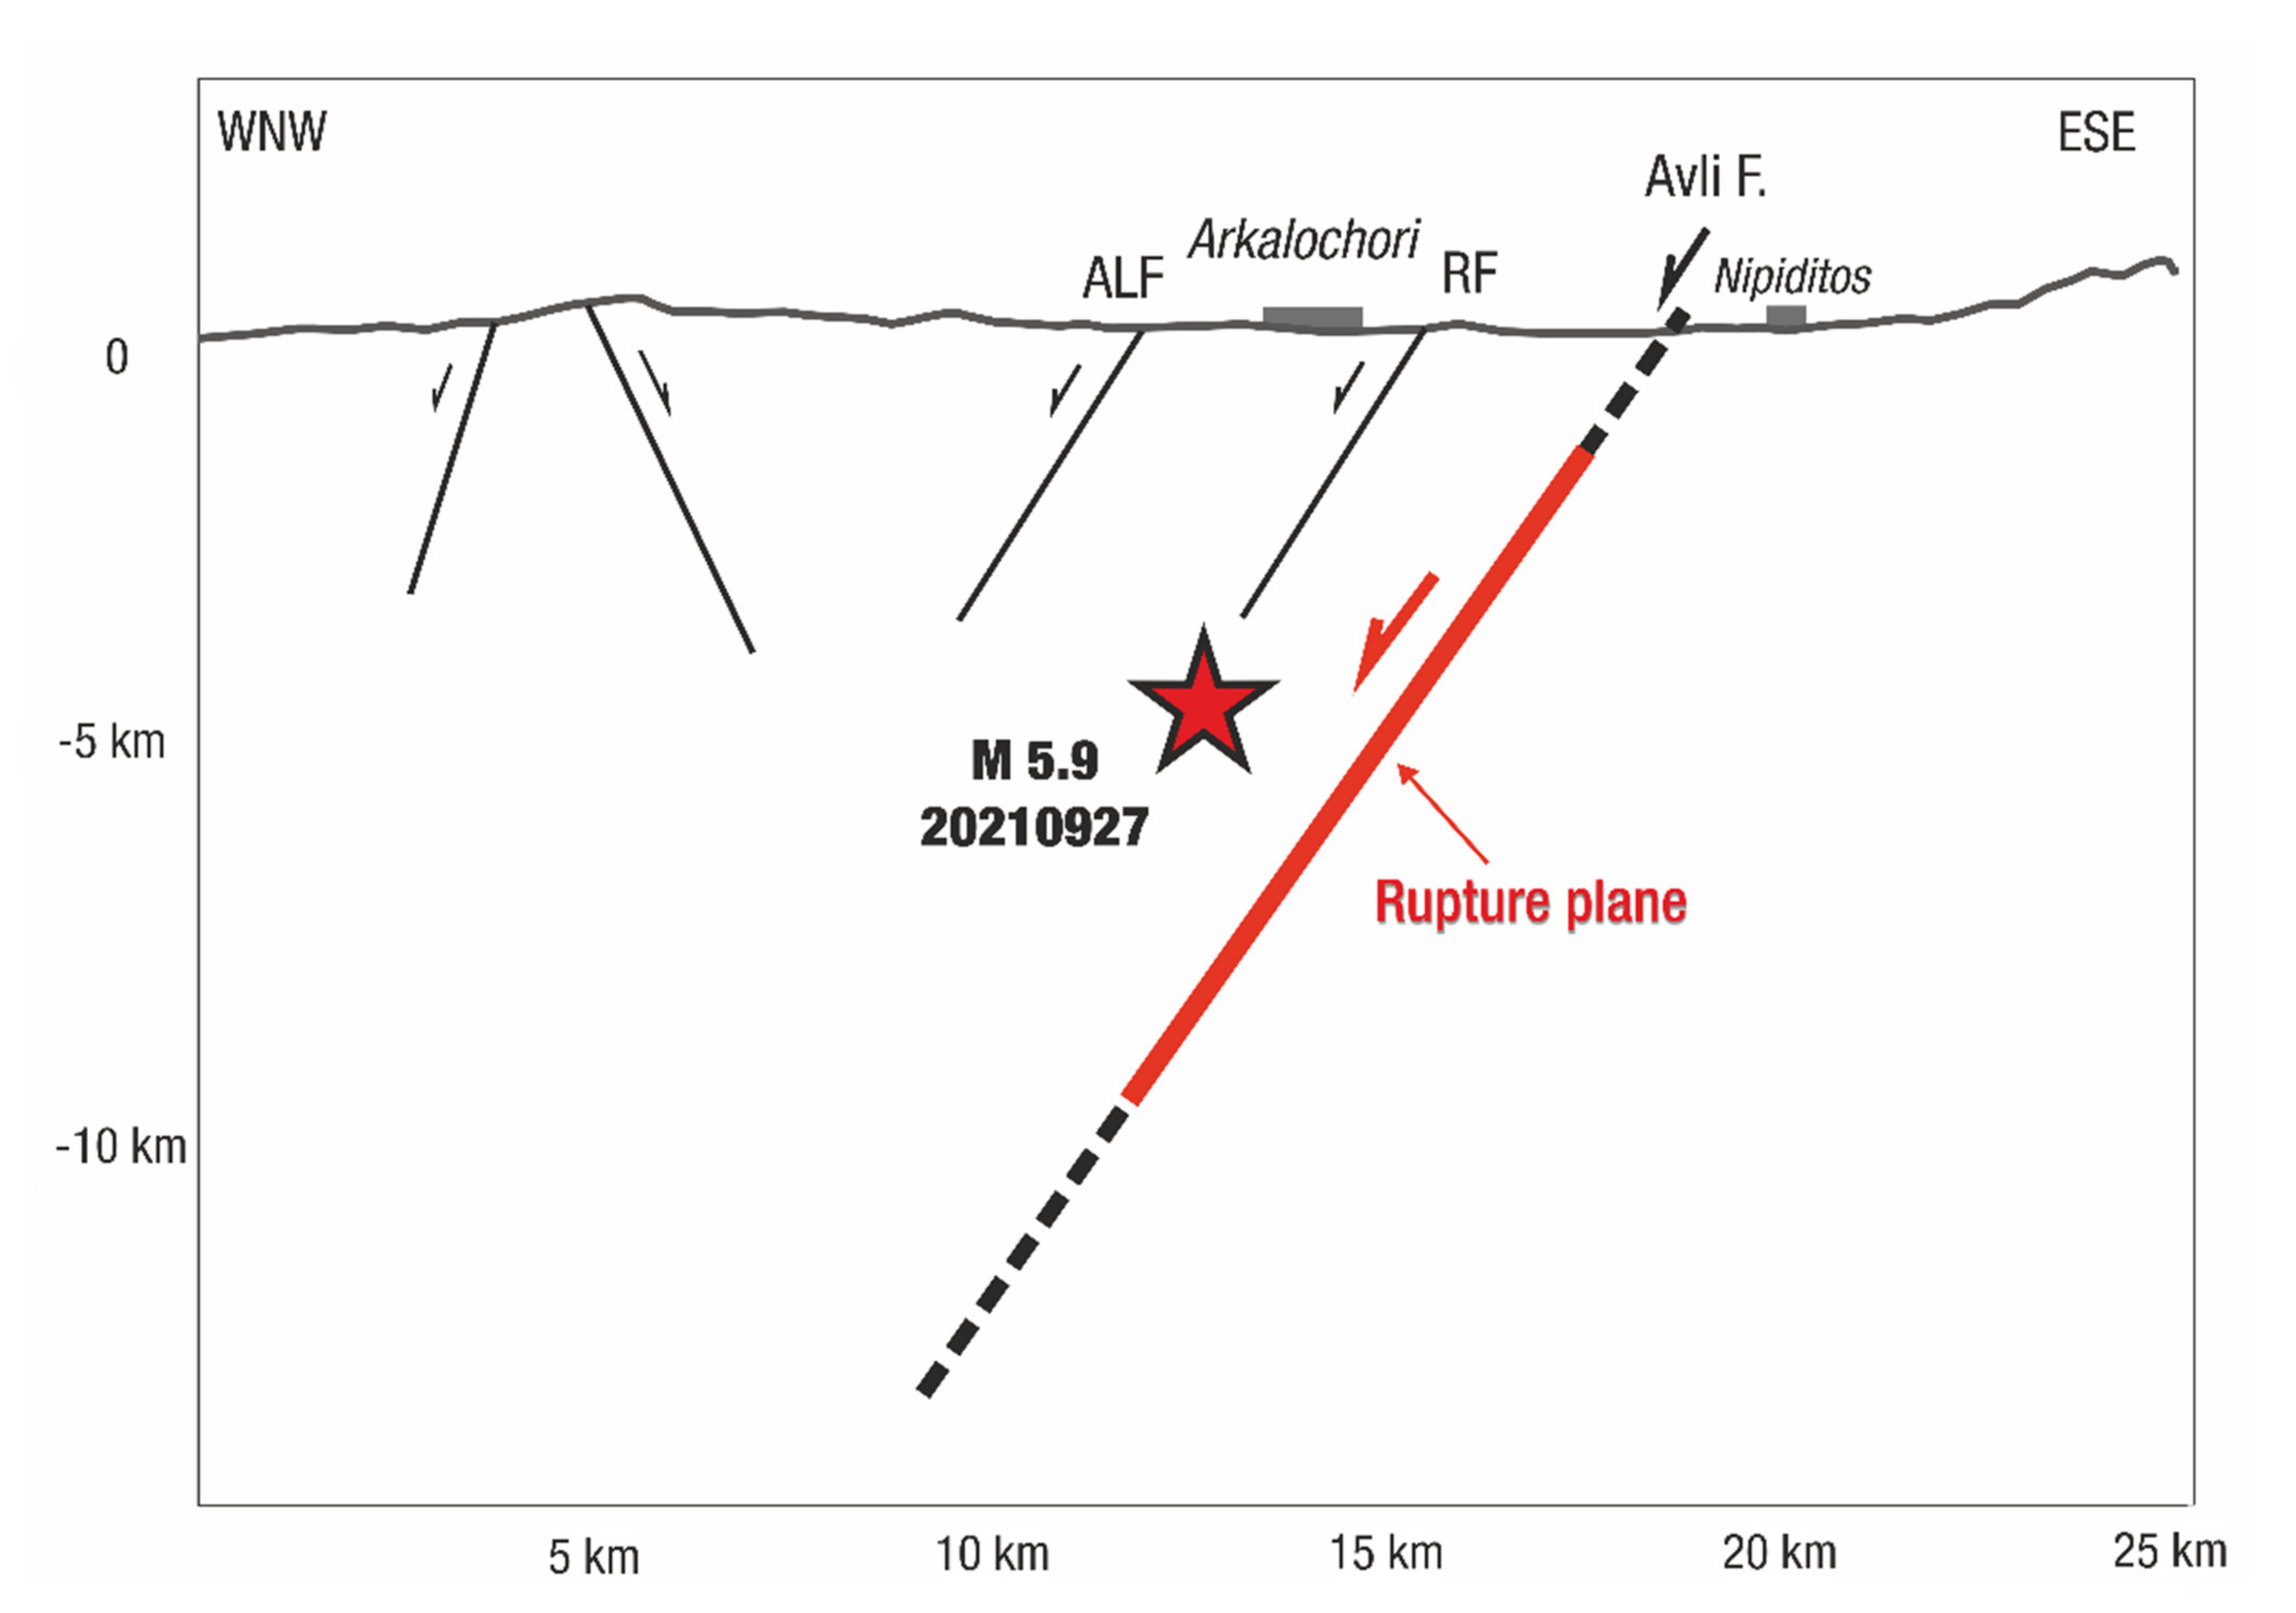
- Our data (seismological and geodetic) support the activation of a 13 km-long planar fault striking N195° E and dipping 55° towards WNW which intersects the free surface along the mountain front of the Kastelli basin.
- The seismic fault may be identified with the neotectonic Avli Fault segment (AF) of the NNE-SSW striking, west-dipping, 23 km-long Kastelli Fault zone (KFZ). Part of the rupture propagated along the Kastelli Fault segment (KF) indicating a possible fault segment linkage and, therefore, a history of overlapping ruptures along the KFZ.
- Based on geological data and footwall topography, we estimate an average Quaternary slip rate between 0.17–0.26 mm/yr for the KFZ.
- We found no tectonic surface breaks. The decrease in the fault offsets toward the Earth’s surface is likely caused by an increased frictional resistance of the shallow layer to rapid coseismic slip.
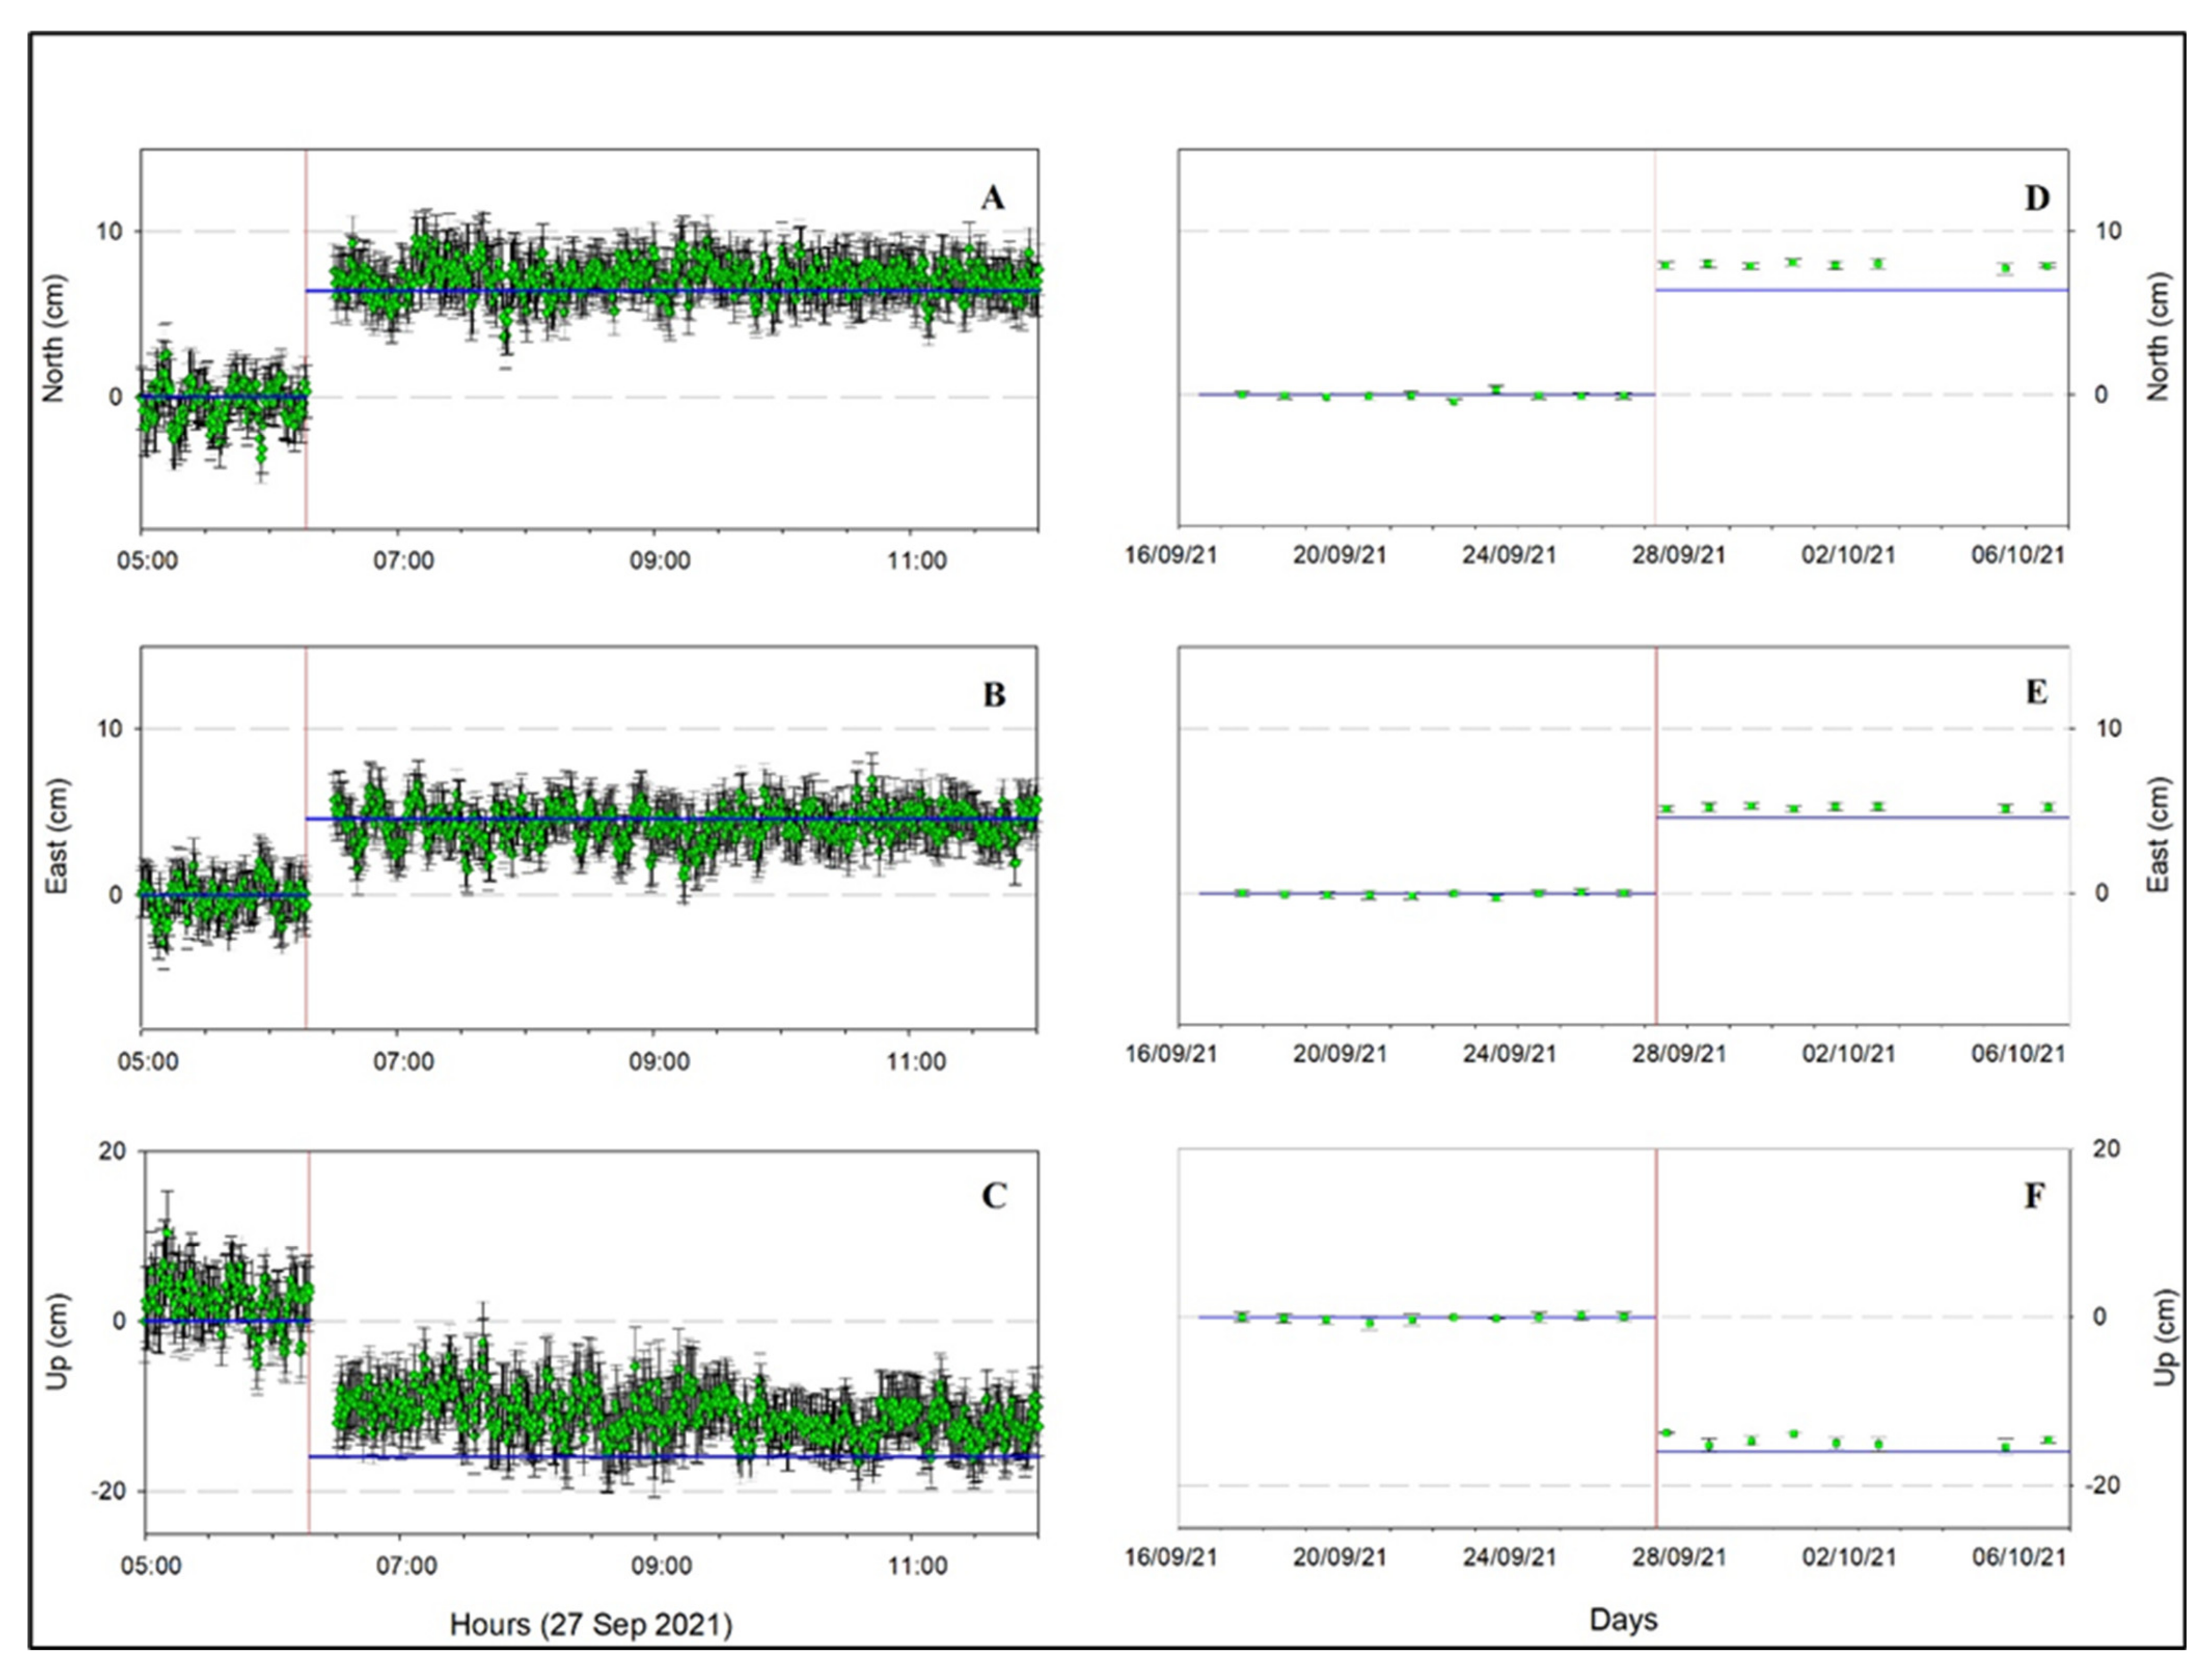
- Satellite observations made in the first month after the earthquake detected no post-seismic deformation (i.e., below one fringe or 2.8 cm) but the GNSS station ARKL recorded a 2 cm postseismic motion with a relaxation period of 75 days.
Supplementary Materials
Author Contributions
Funding
Data Availability Statement
Acknowledgments
Conflicts of Interest
References
- Vallianatos, F.; Michas, G.; Hloupis, G.; Chatzopoulos, G. The Evolution of Preseismic Patterns Related to the Central Crete (Mw6.0) Strong Earthquake on 27 September 2021 Revealed by Multiresolution Wavelets and Natural Time Analysis. Geosciences 2022, 12, 33. [Google Scholar] [CrossRef]
- Triantafyllou, I.; Karavias, A.; Koukouvelas, I.; Papadopoulos, G.A.; Parcharidis, I. The Crete Isl. (Greece) Mw6.0 Earthquake of 27 September 2021: Expecting the Unexpected. Geo Hazards 2022, 3, 6. [Google Scholar] [CrossRef]
- Vassilakis, E.; Kaviris, G.; Kapetanidis, V.; Papageorgiou, E.; Foumelis, M.; Konsolaki, A.; Petrakis, S.; Evangelidis, C.P.; Alexopoulos, J.; Karastathis, V.; et al. The 27 September 2021 Earthquake in Central Crete (Greece)—Detailed Analysis of the Earthquake Sequence and Indications for Contemporary Arc-Parallel Extension to the Hellenic Arc. Appl. Sci. 2022, 12, 2815. [Google Scholar] [CrossRef]
- Karakostas, C.; Lekidis, V.; Makra, K.; Margaris, B.; Morfidis, K.; Papaioannou, C.; Petala, Z.; Rovithis, E.; Salonikios, T.; Theodoulidis, N. OΙ ΣΕΙΣΜOΙ ΤOΥ AΡΚAΛOΧΩΡΙOΥ-Μ6.0, 27 Σεπτεμβρίου 2021 και Μ5.3, 28 Σεπτεμβρίου 2021. Προκαταρκτική έκθεση. Zenodo 2021. [Google Scholar] [CrossRef]
- Papadopoulos, G.A. A Seismic History of Crete: Earthquakes and Tsunamis, 2000 B.C.–A.D. 2010, 1st ed.; Ocelotos Publ.: Athens, Greece, 2011; p. 415. ISBN 978-960-9499-68-2. [Google Scholar]
- Papadopoulos, G.A. Earthquake sources and seismotectonics in the area of Crete. In Minoan Earthquakes-Breaking the Myth through Interdisciplinarity, 1st ed.; Jusseret, S., Sintubin, M., Eds.; Leuven University Press: Leuven, Belgium, 2017; pp. 165–190. [Google Scholar]
- Angelier, J.; Lyberis, N.; Le Pichon, X.; Barrier, E.; Huchon, P. The tectonic development of the Hellenic arc and the sea of Crete: A synthesis. Tectonophysics 1982, 86, 159–196. [Google Scholar] [CrossRef]
- Armijo, R.; Lyon-Caen, H.; Papanastassiou, D. East-west extension and Holocene normal-fault scarps in the Hellenic arc. Geology 1992, 20, 491–494. [Google Scholar] [CrossRef]
- Fassoulas, C. The tectonic development of a Neogene basin at the leading edge of the active European margin: The Heraklion basin, Crete, Greece. J. Geodyn. 2001, 31, 49–70. [Google Scholar] [CrossRef]
- Peterek, A.; Schwarze, J. Architecture and Late Pliocene to recent evolution of outer-arc basins of the Hellenic subduction zone (south-central Crete, Greece). J. Geodyn. 2004, 38, 19–55. [Google Scholar] [CrossRef]
- Monaco, C.; Tortorici, L. Faulting and effects of earthquakes on Minoan archaeological sites in Crete (Greece). Tectonophysics 2004, 382, 103–116. [Google Scholar] [CrossRef]
- Tsimi, C.; Ganas, A.; Ferrier, G.; Drakatos, G.; Pope, R.J.; Fassoulas, C. Morphotectonics of the Sfakia normal fault, south-western Crete, Greece. In Proceedings of the 8th Pan-Hellenic Geographical Conference, Athens, Greece, 4–7 October 2007; Volume 1, pp. 186–194. [Google Scholar]
- Caputo, R.; Catalano, S.; Monaco, C.; Romagnoli, G.; Tortorici, G.; Tortorici, L. Active faulting on the island of Crete (Greece). Geophys. J. Int. 2010, 183, 111–126. [Google Scholar] [CrossRef]
- Veliz, V.; Mouslopoulou, V.; Nicol, A.; Fassoulas, C.; Begg, J.; Oncken, O. Millennial to million year normal-fault interactions in the forearc of a subduction margin, Crete, Greece. J. Struct. Geol. 2018, 113, 225–241. [Google Scholar] [CrossRef]
- Robertson, J.; Meschis, M.; Roberts, G.; Ganas, A.; Gheorghiu, D. Temporally constant quaternary uplift rates and their relationship with extensional upper-plate faults in South Crete (Greece), constrained with 36Cl cosmogenic exposure dating. Tectonics 2019, 38, 1189–1222. [Google Scholar] [CrossRef] [Green Version]
- Nicol, A.; Mouslopoulou, V.; Begg, J.; Oncken, O. Displacement Accumulation and Sampling of Paleoearthquakes on Active Normal Faults of Crete in the Eastern Mediterranean. Geochem. Geophys. Geosystems 2020, 21, e2020GC009265. [Google Scholar] [CrossRef]
- Meier, T.; Rische, M.; Endrun, B.; Vafidis, A.; Harjes, H.-P. Seismicity of the Hellenic subduction zone in the area of western and central Crete observed by temporary local seismic networks. Tectonophysics 2004, 383, 149–169. [Google Scholar] [CrossRef]
- Kreemer, C.; Chamot-Rooke, N. Contemporary kinematics of the southern Aegean and the Mediterranean Ridge. Geophys. J. Int. 2004, 157, 1377–1392. [Google Scholar] [CrossRef] [Green Version]
- Papadimitriou, E.; Karakostas, V.; Mesimeri, M.; Vallianatos, F. The Mw6.7 12 October 2013 western Hellenic Arc main shock its aftershock sequence: Implications for the slab properties. Int. J. Earth Sci. (Geol. Rundsch.) 2016, 105, 2149–2160. [Google Scholar] [CrossRef]
- Görgün, E. Source Mechanisms and Stress Fields of the 15–16 June 2013 Crete Earthquake Sequence Along Hellenic Subduction Zone. Pure Appl. Geophys. 2017, 174, 1181–1199. [Google Scholar] [CrossRef]
- Kapetanidis, V.; Kassaras, I. Contemporary crustal stress of the Greek region deduced from earthquake focal mechanisms. J. Geodyn. 2019, 123, 55–82. [Google Scholar] [CrossRef]
- Kkallas, C.; Papazachos, C.; Scordilis, E.; Margaris, B. Active stress field of the Southern Aegean Sea subduction area from fault-plane solutions on the basis of different stress inversion approaches. J. Geodyn. 2021, 143, 101813. [Google Scholar] [CrossRef]
- Briole, P.; Ganas, A.; Elias, P.; Dimitrov, D. The GPS velocity field of the Aegean. New observations, contribution of the earthquakes, crustal blocks model. Geophys. J. Int. 2021, 226, 468–492. [Google Scholar] [CrossRef]
- Ganas, A.; Palyvos, N.; Mavrikas, G.; Karastathis, V.; Drakatos, G.; Makropoulos, K. Recognition and Characterisation of Neotectonic Faults in Heraklion City area (Crete, Greece): A multidisciplinary approach. Geophys. Res. Abstr. 2011, 13, EGU2011-4824. [Google Scholar]
- Ganas, A.; Fassoulas, C.; Moschou, A.; Bozionelos, G.; Papathanassiou, G.; Tsimi, C.; Valkaniotis, S. Geological and seismological evidence for NW-SE crustal extension at the southern margin of Heraklion Basin, Crete. Bull. Geol. Soc. Greece 2017, 51, 52–75. [Google Scholar] [CrossRef] [Green Version]
- Zygouri, V.; Koukouvelas, I.; Ganas, A. Palaeoseismological analysis of the East Giouchtas fault, Heraklion basin, Crete (preliminary results). Bull. Geol. Soc. Greece 2016, 50, 563–571. [Google Scholar] [CrossRef] [Green Version]
- Vassilakis, E. Study of the Tectonic Structure of the Messara Basin, Central Crete, With the AID of Remote Sensing Techniques and G.I.S. Ph. D. Thesis, National and Kapodistrian University of Athens, Athens, Greece, 2006; p. 564. [Google Scholar]
- Ekström, G.; Nettles, M.; Dziewonski, A.M. The global CMT project 2004–2010: Centroid-moment tensors for 13,017 earthquakes. Phys. Earth Planet. Inter. 2012, 200–201, 1–9. [Google Scholar] [CrossRef]
- Caputo, R.; Monaco, C.; Tortorici, L. Multiseismic cycle deformation rates from Holocene normal fault scarps on Crete (Greece). Terra Nova 2006, 18, 181–190. [Google Scholar] [CrossRef]
- Meulenkamp, J.E.; Dermitzakis, M.; Georgiadou-Dikaioulia, E.; Jonkers, H.A.; Boger, H. Field Guide to the Neogene of Crete; Series A, No. 32; Publications of the Department of Geology and Paleontology, University of Athens: Athens, Greece, 1979. [Google Scholar]
- Bonneau, M. Geological Map of Greece 1:50,000 Scale. Akhendrias Sheet; I.G.M.E.: Athens, Greece, 1984. [Google Scholar]
- Davi, E.; Bonneau, M. Geological Map of Greece 1:50,000 Scale. Andiskarion Sheet; I.G.M.E.: Athens, Greece, 1984. [Google Scholar]
- Vidakis, M.; Meulenkamp, J.E. Geological Map of Greece 1:50,000 Scale. Heraklion Sheet; I.G.M.E.: Athens, Greece, 1996. [Google Scholar]
- Vidakis, M.; Meulenkamp, J.E.; Jonkers, A. Geological Map of Greece 1:50,000 Scale. Ano Viannos Sheet; I.G.M.E.: Athens, Greece, 1989. [Google Scholar]
- Vidakis, M.; Jonkers, A.; Meulenkamp, J.E. Geological Map of Greece 1:50,000 Scale. Epano Arhanai Sheet; I.G.M.E.: Athens, Greece, 1994. [Google Scholar]
- Alexopoulos, A. Geological Hydrogeological Conditions in the Area of Mohos Topographical Sheet (Central-Eastern Crete). Ph.D. Thesis, National and Kapodistrian University of Athens, Athens, Greece, 1990; p. 598. [Google Scholar]
- Papanikolaou, D.; Vassilakis, E. Thrust faults and extensional detachment faults in Cretan tectono-stratigraphy: Implications for Middle Miocene extension. Tectonophysics 2010, 488, 233–247. [Google Scholar] [CrossRef]
- Evangelidis, C.P.; Triantafyllis, N.; Samios, M.; Boukouras, K.; Kontakos, K.; Ktenidou, O.-J.; Fountoulakis, I.; Kalogeras, I.; Melis, N.S.; Galanis, O.; et al. Seismic Waveform Data from Greece and Cyprus: Integration, Archival, and Open Access. Seismol. Res. Lett. 2021, 92, 1672–1684. [Google Scholar] [CrossRef]
- Delibasis, N.; Ziazia, M.; Voulgaris, N.; Papadopoulos, T.; Stavrakakis, G.; Papanastassiou, D.; Drakatos, G. Microseismic activity and seismotectonics of Heraklion Area (central Crete Island, Greece). Tectonophysics 1999, 308, 237–248. [Google Scholar] [CrossRef] [Green Version]
- Klein, F.W. User’s Guide to HYPOINVERSE-2000, A Fortran Program to Solve for Earthquake Locations and Magnitudes; U.S. Geological Survey: Reston, VA, USA, 2002; Volume 171, p. 123. [Google Scholar] [CrossRef] [Green Version]
- Waldhauser, F. hypoDD—A Program to Compute Double-Difference Hypocenter Locations: U.S. Geological Survey Open-File Report 01-113, 25p. 2001. Available online: https://pubs.usgs.gov/of/2001/0113/ (accessed on 1 December 2021).
- Waldhauser, F.; Ellsworth, W.L. A Double-Difference Earthquake Location Algorithm: Method and Application to the Northern Hayward Fault. California. Bull. Seismol. Soc. Am. 2000, 90, 1353–1368. [Google Scholar] [CrossRef]
- Herring, T.A.; King, R.W.; Floyd, M.A.; McCluskey, S.C. Introduction to GAMIT/GLOBK, Release 10.7; Massachusetts Institute of Technology: Cambridge, UK, 2018; p. 54. [Google Scholar]
- Altamimi, Z.; Rebischung, P.; Métivier, L.; Collilieux, X. ITRF2014: A new release of the International Terrestrial Reference Frame modeling nonlinear station motions. J. Geophys. Res. 2016, 121, 6109–6131. [Google Scholar] [CrossRef] [Green Version]
- Okada, Y. Internal deformation due to shear and tensile faults in a half space. Bull. Seism. Soc. America 1992, 82, 1018–1040. [Google Scholar] [CrossRef]
- Sandwell, D.T.; Xu, R.X.; Mellors, M.W.; Tong, X.; Wessel, P. GMTSAR: An InSAR Processing System Based on Generic Mapping Tools, 2nd ed. 2016. Available online: http://topex.ucsd.edu/gmtsar/tar/GMTSAR_2ND_TEX.pdf (accessed on 1 December 2019).
- Ganas, A. NOAFAULTS KMZ layer Version 4.0 (V4.0) [Data set]. Zenodo. 2022. Available online: https://zenodo.org/record/6326260#.Yoy6xlRBxN0 (accessed on 13 January 2022).
- Fialko, Y. Probing the mechanical properties of seismically active crust with space geodesy: Study of the co-seismic deformation due to the 1992 Mw 73 Landers (southern California) earthquake. J. Geophys. Res. 2004, 109, B03307. [Google Scholar]
- Hamiel, Y.; Fialko, Y. Structure mechanical properties of faults in the North Anatolian Fault system from InSAR observations of coseismic deformation due to the 1999 Izmit (Turkey) earthquake. J. Geophys. Res. 2007, 112, B07412. [Google Scholar] [CrossRef] [Green Version]
- Hamiel, Y.; Baer, G.; Kalindekafe, L.; Dombola, K.; Chindandali, P. Seismic and aseismic slip evolution and deformation associated with the 2009–2010 northern Malawi earthquake swarm, East African Rift. Geophys. J. Int. 2012, 191, 898–908. [Google Scholar] [CrossRef] [Green Version]
- Chiaraluce, L.; Valoroso, L.; Piccinini, D.; Di Stefano, R.; De Gori, P. The anatomy of the 2009 L’Aquila normal fault system (central Italy) imaged by high resolution foreshock aftershock locations. J. Geophys 2011, 116, B12311. [Google Scholar] [CrossRef]
- Ganas, A.; Elias, P.; Kapetanidis, V.; Valkaniotis, S.; Briole, P.; Kassaras, I.; Argyrakis, P.; Barberopoulou, A.; Moshou, A. The 20 July 2017 M6.6 Kos Earthquake: Seismic and Geodetic Evidence for an Active North-Dipping Normal Fault at the Western End of the Gulf of Gökova (SE Aegean Sea). Pure Appl. Geophys. 2019, 176, 4177–4211. [Google Scholar] [CrossRef]
- Ganas, A.; Valkaniotis, S.; Briole, P.; Serpetsidaki, A.; Kapetanidis, V.; Karasante, I.; Kassaras, I.; Papathanassiou, G.; Karamitros, I.; Tsironi, V.; et al. Domino-style earthquakes along blind normal faults in Northern Thessaly (Greece): Kinematic evidence from field observations seismology SAR interferometry, G.N.S.S. Bull. Geol. Soc. Greece 2021, 58, 37–86. [Google Scholar] [CrossRef]
- Melgar, D.; Ganas, A.; Geng, J.; Liang, C.; Fielding, E.J.; Kassaras, I. Source characteristics of the 2015 Mw6.5 Lefkada, Greece, strike-slip earthquake. J. Geophys. Res. Solid Earth 2017, 122, 2260–2273. [Google Scholar] [CrossRef]
- Melgar, D.; Ganas, A.; Taymaz, T.; Valkaniotis, S.; Crowell, B.W.; Kapetanidis, V.; Tsironi, V.; Yolsal-Çevikbilen, S.; Öcalan, T. Rupture kinematics of 2020 January 24 Mw 6.7 Doğanyol-Sivrice, Turkey earthquake on the East Anatolian Fault Zone imaged by space geodesy. Geophys. J. Int. 2020, 223, 862–874. [Google Scholar] [CrossRef]
- Mercier, J.L.; Mouyaris, N.; Simeakis, C.; Roundoyannis, T.; Angelidhis, C. Intraplate deformation: A quantitative study of the faults activated by the 1978 Thessaloniki earthquakes. Nature 1979, 278, 45–48. [Google Scholar] [CrossRef]
- Jackson, A.J.; Gagnepain, J.; Houseman, G.; King, G.C.P.; Papadimitriou, P.; Soufleris, C.; Virieux, J. Seismicity, normal faulting, and the geomorphological development of the Gulf of Corinth (Greece): The Corinth earthquakes of February and March. Earth Planet. Sci. Lett. 1981, 57, 377–397. [Google Scholar] [CrossRef]
- Lyon-Caen, H.; Armijo, R.; Drakopoulos, J.; Baskoutas, J.; Delibassis, N.; Gaulon, R.; Kouskouna, V.; Latoussakis, J.; Makropoulos, K.; Papadimitriou, P.; et al. The 1986 Kalamata (south Peloponnesus) earthquake: Detailed study of a normal fault. Evidences for east-west extension in the Hellenic arc 1988. J. Geophys. Res.-Solid Earth 1988, 93, 14967–15000. [Google Scholar] [CrossRef]
- Ganas, A.; Roberts, G.P.; Memou, T.Z. Segment boundaries, the 1894 ruptures and strain patterns along the Atalanti Fault, Central Greece. J. Geodyn. 1998, 26, 461–486. [Google Scholar] [CrossRef]
- Scholz, C.H. Earthquakes and friction laws. Nature 1998, 391, 37–42. [Google Scholar] [CrossRef]
- Kaneko, Y.; Fialko, Y. Shallow slip deficit due to large strike-slip earthquakes in dynamic rupture simulations with elasto-plastic off-fault response. Geophys. J. Int. 2011, 186, 1389–1403. [Google Scholar] [CrossRef] [Green Version]
- Pucci, S.; De Martini, P.M.; Civico, R.; Villani, F.; Nappi, R.; Ricci, T.; Azzaro, R.; Brunori, C.A.; Caciagli, M.; Cinti, F.R.; et al. Coseismic ruptures of the 24 August 2016, Mw 6.0 Amatrice earthquake (central Italy). Geophys. Res. Lett. 2017, 44, 2138–2147. [Google Scholar] [CrossRef]
- Civico, R.S.; Pucci, F.; Villani, L.; Pizzimenti, P.M.; De Martini, R.; Nappi the Open EMERGEO Working Group. Surface ruptures following the 30 October 2016 Mw 6.5 Norcia earthquake, central Italy. J. Maps 2018, 14, 151–160. [Google Scholar] [CrossRef] [Green Version]
- Mechernich, S.; Reicherter, K.; Deligiannakis, G.; Papanikolaou, I. Tectonic geomorphology of active faults in Eastern Crete (Greece) with slip rates and earthquake history from cosmogenic 36Cl dating of the Lastros and Orno faults. Quat. Int. 2022. [Google Scholar] [CrossRef]
- Fujiwara, S.; Nakano, T.; Morishita, Y. Detection of triggered shallow slips caused by large earthquakes using L-band SAR interferometry. Earth Planets Space 2020, 72, 119. [Google Scholar] [CrossRef]
- Moro, M.; Chini, M.; Saroli, M.; Atzori, S.; Stramondo, S.; Salvi, S. Analysis of large, seismically induced, gravitational deformations imaged by high-resolution COSMO-SkyMed synthetic aperture radar. Geology 2011, 39, 527–530. [Google Scholar] [CrossRef]
- Roberts, G.P.; Ganas, A. Fault-slip directions in central and southern Greece measured from striated and corrugated fault planes: Comparison with focal mechanism and geodetic data. J. Geophys. Res. 2000, 105, 23443–23462. [Google Scholar] [CrossRef]
- Roberts, G.P.; Michetti, A.M.; Cowie, P.; Morewood, N.C.; Papanikolaou, I. Fault slip-rate variations during crustal-scale strain localisation central Italy. Geophys. Res. Lett. 2002, 29, 1168. [Google Scholar] [CrossRef] [Green Version]
- Ganas, A.; Pavlides, S.B.; Sboras, S.; Valkaniotis, S.; Papaioannou, S.; Alexandris, G.A.; Plessa, A.; Papadopoulos, G.A. Active Fault Geometry and Kinematics in Parnitha Mountain, Attica, Greece. J. Struct. Geol. 2004, 26, 2103–2118. [Google Scholar] [CrossRef]
- Ganas, A.; Pavlides, S.; Karastathis, V. DEM-based morphometry of range-front escarpments in Attica, central Greece, and its relation to fault slip rates. Geomorphology 2005, 65, 301–319. [Google Scholar] [CrossRef]
- Kokkalas, S.; Pavlides, S.; Koukouvelas, I.; Ganas, A.; Stamatopoulos, L. Paleoseismicity of the Kaparelli fault (eastern Corinth Gulf): Evidence for earthquake recurrence and fault behaviour. Boll. Della Soc. Geol. Ital. 2007, 126, 387–395. [Google Scholar]
- Iezzi, F.; Roberts, G.; Faure Walker, J.; Papanikolaou, I.; Ganas, A.; Deligiannakis, G.; Beck, J.; Wolfers, S.; Gheorghiu, D. Temporal and spatial earthquake clustering revealed through comparison of millennial strain-rates from 36Cl cosmogenic exposure dating and decadal GPS strain-rate. Sci. Rep. 2021, 11, 23320. [Google Scholar] [CrossRef]
- Mozafari, N.; Özkaymak, Ç.; Sümer, Ö.; Tikhomirov, D.; Uzel, B.; Yeşilyurt, S.; Ivy-Ochs, S.; Vockenhuber, C.; Sözbilir, H.; Akçar, N. Seismic history of western Anatolia during the last 16 kyr determined by cosmogenic 36Cl dating. Swiss J. Geosci. 2022, 115, 5. [Google Scholar] [CrossRef]
- Stein, R.S.; Barka, A.A.; Dieterich, J.H. Progressive failure on the North Anatolian fault since 1939 by earthquake stress triggering. Geophys. J. Int. 1997, 128, 594–604. [Google Scholar] [CrossRef] [Green Version]
- King, G.C.P.; Cocco, M. Fault Interaction By Elastic Stress Changes: New Clues From Earthquake Sequences; Dmowska, R., Saltzman, B., Eds.; Advances in Geophysics, Elsevier: Amsterdam, The Netherlands, 2001; Volume 44, pp. 1–38. [Google Scholar] [CrossRef]
- Valkaniotis, S.; Briole, P.; Ganas, A.; Elias, P.; Kapetanidis, V.; Tsironi, V.; Fokaefs, A.; Partheniou, H.; Paschos, P. The Mw = 5.6 Kanallaki Earthquake of 21 March 2020 in West Epirus, Greece: Reverse Fault Model from InSAR Data and Seismotectonic Implications for Apulia-Eurasia Collision. Geosciences 2020, 10, 454. Available online: https://0-www-mdpi-com.brum.beds.ac.uk/2076-3263/10/11/454/htm (accessed on 13 January 2022). [CrossRef]
- Ganas, A.; Parsons, T. Three-dimensional model of Hellenic Arc deformation and origin of the Cretan uplift. J. Geophys. Res. 2009, 114, B06404. [Google Scholar] [CrossRef] [Green Version]
- Gallen, S.F.; Wegmann, K.W.; Bohnenstiehl, D.R.; Pazzaglia, F.J.; Brandon, M.T.; Fassoulas, C. Active simultaneous uplift and margin-normal extension in a forearc high, Crete, Greece. Earth Planet. Sci. Lett. 2014, 398, 11–24. [Google Scholar] [CrossRef]
- Briole, P.; Elias, P.; Parcharidis, I.; Bignami, C.; Benekos, G.; Samsonov, G.; Kyriakopoulos, C.; Stramondo, S.; Chamot-Rooke, N.; Drakatou, M.L.; et al. The seismic sequence of January-February 2014 at Cephalonia Island (Greece): Constraints from SAR interferometry. G.P.S. Geophys. J. Int. 2015, 203, 1528–1540. [Google Scholar] [CrossRef] [Green Version]
- Ilieva, M.; Briole, P.; Ganas, A.; Dimitrov, D.; Elias, P.; Mouratidis, A.; Charara, R. Fault plane modelling of the 2003 August 14 Lefkada Island (Greece) earthquake based on the analysis of ENVISAT SAR interferograms. Tectonophysics 2016, 693, 47–65. [Google Scholar] [CrossRef]
- Avallone, A.; Cirella, A.; Cheloni, D.; Tolomei, C.; Theodoulidis, N.; Piatanesi, A.; Briole, P.; Ganas, A. Near-source high-rate GPS, strong motion and InSAR observations to image the 2015 Lefkada (Greece) Earthquake rupture history. Sci. Rep. 2017, 7, 10358. [Google Scholar] [CrossRef] [Green Version]
- Ganas, A.; Kourkouli, P.; Briole, P.; Moshou, A.; Elias, P.; Parcharidis, I. Coseismic Displacements from Moderate-Size Earthquakes Mapped by Sentinel-1 Differential Interferometry: The Case of February 2017 Gulpinar Earthquake Sequence (Biga Peninsula, Turkey). Remote Sens. 2018, 10, 1089. [Google Scholar] [CrossRef] [Green Version]
- De Novellis, V.; Convertito, V.; Valkaniotis, S.; Casu, F.; Lanari, R.; Monterroso Tobar, M.F.; Pino, N.A. Coincident locations of rupture nucleation during the 2019 Le Teil earthquake, France and maximum stress change from local cement quarrying. Commun. Earth Environ. 2020, 1, 20. [Google Scholar] [CrossRef]
- Elias, P.; Spingos, I.; Kaviris, G.; Karavias, A.; Gatsios, T.; Sakkas, V.; Parcharidis, I. Combined Geodetic and Seismological Study of the December 2020 Mw = 4.6 Thiva (Central Greece) Shallow Earthquake. Appl. Sci. 2021, 11, 5947. [Google Scholar] [CrossRef]
- Song, C.; Yu, C.; Meldebekova, G.; Li, Z. Normal Fault Slips of the March 2021 Greece Earthquake Sequence from InSAR Observations. J. Geod. Geoinf. Sci. 2022, 5, 50–59. [Google Scholar] [CrossRef]
- Ganas, A.; Elias, P.; Valkaniotis, S.; Tsironi, V.; Karasante, I.; Briole, P. Petrinja earthquake moved crust 10 feet. Temblor 2021. [Google Scholar] [CrossRef]
- Atzori, S.; Manunta, M.; Fornaro, G.; Ganas, A.; Salvi, S. Postseismic displacement of the 1999 Athens earthquake retrieved by the Differential Interferometry by Synthetic Aperture Radar time series. J. Geophys. Res. 2008, 113, B09309. [Google Scholar] [CrossRef]
- Taymaz, T.; Ganas, A.; Yolsal-Çevikbilen, S.; Vera, F.; Eken, T.; Erman, C.; Keleş, D.; Kapetanidis, V.; Valkaniotis, S.; Karasante, I.; et al. Source mechanism and rupture process of the 24 January 2020 Mw 6.7 Doĝanyol-Sivrice earthquake obtained from seismological waveform analysis and space geodetic observations on the East Anatolian fault Zone (Turkey). Tectonophysics 2021, 804, 228745. [Google Scholar] [CrossRef]
- Wessel, P.; Luis, J.F.; Uieda, L.; Scharroo, R.; Wobbe, F.; Smith, W.H.F.; Tian, D. The Generic Mapping Tools version 6. Geochem. Geophys. Geosystems 2019, 20, 5556–5564. [Google Scholar] [CrossRef] [Green Version]


| Agency | LAT | LON | Strike | Dip | Rake | Strike | Dip | Rake | Depth | Mw | Moment |
|---|---|---|---|---|---|---|---|---|---|---|---|
| ° | ° | ° | ° | ° | ° | ° | ° | km | ×1018 Nm | ||
| GCMT | 35.12 | 25.18 | 40 | 43 | −85 | 214 | 47 | −94 | 12 | 5.9 | 1.01 |
| USGS | 35.25 | 25.27 | 55 | 57 | −79 | 215 | 35 | −106 | 12 | 6.0 | 1.08 |
| ERD | 35.39 | 25.35 | 35 | 47 | −97 | 225 | 44 | −83 | 10 | 5.7 | 0.76 |
| INGV | 35.10 | 25.18 | 22 | 53 | −108 | 230 | 41 | −68 | 10 | 6.0 | 1.2 |
| GFZ | 35.18 | 25.25 | 30 | 32 | −96 | 218 | 57 | −85 | 16 | 6/0 | 1.1 |
| CPPT | 35.24 | 25.37 | 20 | 68 | −107 | 239 | 28 | −55 | 16 | 6.0 | 1.23 |
| IPGP | 35.25 | 25.26 | 24 | 38 | −111 | 229 | 55 | −75 | 6 | 6.0 | 1.16 |
| KOERI | 35.12 | 25.21 | 44 | 41 | −76 | 207 | 50 | −101 | 10 | 6.0 | 1.13 |
| OCA | 35.13 | 25.26 | 11 | 45 | −35 | 245 | 60 | −56 | 10 | 5.9 | |
| NOA | 35.14 | 25.26 | 25 | 33 | −81 | 195 | 57 | −95 | 6.4 | 5.9 | 0.86 |
| UOA | 35.14 | 25.27 | 21 | 25 | −75 | 185 | 66 | −97 | 14 | 5.9 | 0.91 |
| Median | 25 | 43 | −96 | 218 | 50 | −85 | 10 | 1.09 | |||
| Mean | 30 | 44 | −95 | 218 | 49 | −83 | 11 | 1.04 | |||
| r.m.s. scatter | 12 | 14 | 13 | 13 | 12 | 16 | 3.7 | 0.18 | |||
| Model (this study) | 35.15 | 25.28 | 195 | 55 | −90 | 5.1 | 5.96 | 1.1 |
| Interferometric Pairs (yyyy/mm/dd) | Satellites | Relative | Incidence Mid Angle | Comments | |
|---|---|---|---|---|---|
| Orbit Number | |||||
| Ascending | 2021/09/17–2021/09/29 | Sentinel-1A | 102 | 44 | Co-seismic (Figure 7) |
| Descending | 2021/09/18–2021/09/30 | Sentinel-1A | 109 | 33.93 | Co-seismic (Figure 7) |
| Descending | 2021/10/01–2021/10/13 | Sentinel-1B | 36 | 43.87 | Post-seismic (Figure S6) |
| Centre of the Top-Fault | Size of The Fault | Fault Orientation | Fault Slip | |||||
|---|---|---|---|---|---|---|---|---|
| Long. | Lat. | Top | Length | Width | Azimuth | Dip | Rake | Max.Slip |
| ° | ° | km | km | km | ° | ° | ° | m |
| 25.309 | 35.138 | 1.2 | 13.4 | 10.5 | 195 | 55 | -90 | 1.2 |
Publisher’s Note: MDPI stays neutral with regard to jurisdictional claims in published maps and institutional affiliations. |
© 2022 by the authors. Licensee MDPI, Basel, Switzerland. This article is an open access article distributed under the terms and conditions of the Creative Commons Attribution (CC BY) license (https://creativecommons.org/licenses/by/4.0/).
Share and Cite
Ganas, A.; Hamiel, Y.; Serpetsidaki, A.; Briole, P.; Valkaniotis, S.; Fassoulas, C.; Piatibratova, O.; Kranis, H.; Tsironi, V.; Karamitros, I.; et al. The Arkalochori Mw = 5.9 Earthquake of 27 September 2021 Inside the Heraklion Basin: A Shallow, Blind Rupture Event Highlighting the Orthogonal Extension of Central Crete. Geosciences 2022, 12, 220. https://0-doi-org.brum.beds.ac.uk/10.3390/geosciences12060220
Ganas A, Hamiel Y, Serpetsidaki A, Briole P, Valkaniotis S, Fassoulas C, Piatibratova O, Kranis H, Tsironi V, Karamitros I, et al. The Arkalochori Mw = 5.9 Earthquake of 27 September 2021 Inside the Heraklion Basin: A Shallow, Blind Rupture Event Highlighting the Orthogonal Extension of Central Crete. Geosciences. 2022; 12(6):220. https://0-doi-org.brum.beds.ac.uk/10.3390/geosciences12060220
Chicago/Turabian StyleGanas, Athanassios, Yariv Hamiel, Anna Serpetsidaki, Pierre Briole, Sotiris Valkaniotis, Charalampos Fassoulas, Oksana Piatibratova, Haralambos Kranis, Varvara Tsironi, Ioannis Karamitros, and et al. 2022. "The Arkalochori Mw = 5.9 Earthquake of 27 September 2021 Inside the Heraklion Basin: A Shallow, Blind Rupture Event Highlighting the Orthogonal Extension of Central Crete" Geosciences 12, no. 6: 220. https://0-doi-org.brum.beds.ac.uk/10.3390/geosciences12060220