
Structural Complexity and Seismogenesis: The Role of the Transpressive Structures in the 1976 Friuli Earthquakes (Eastern Southern Alps, NE Italy)


Abstract
:1. Introduction

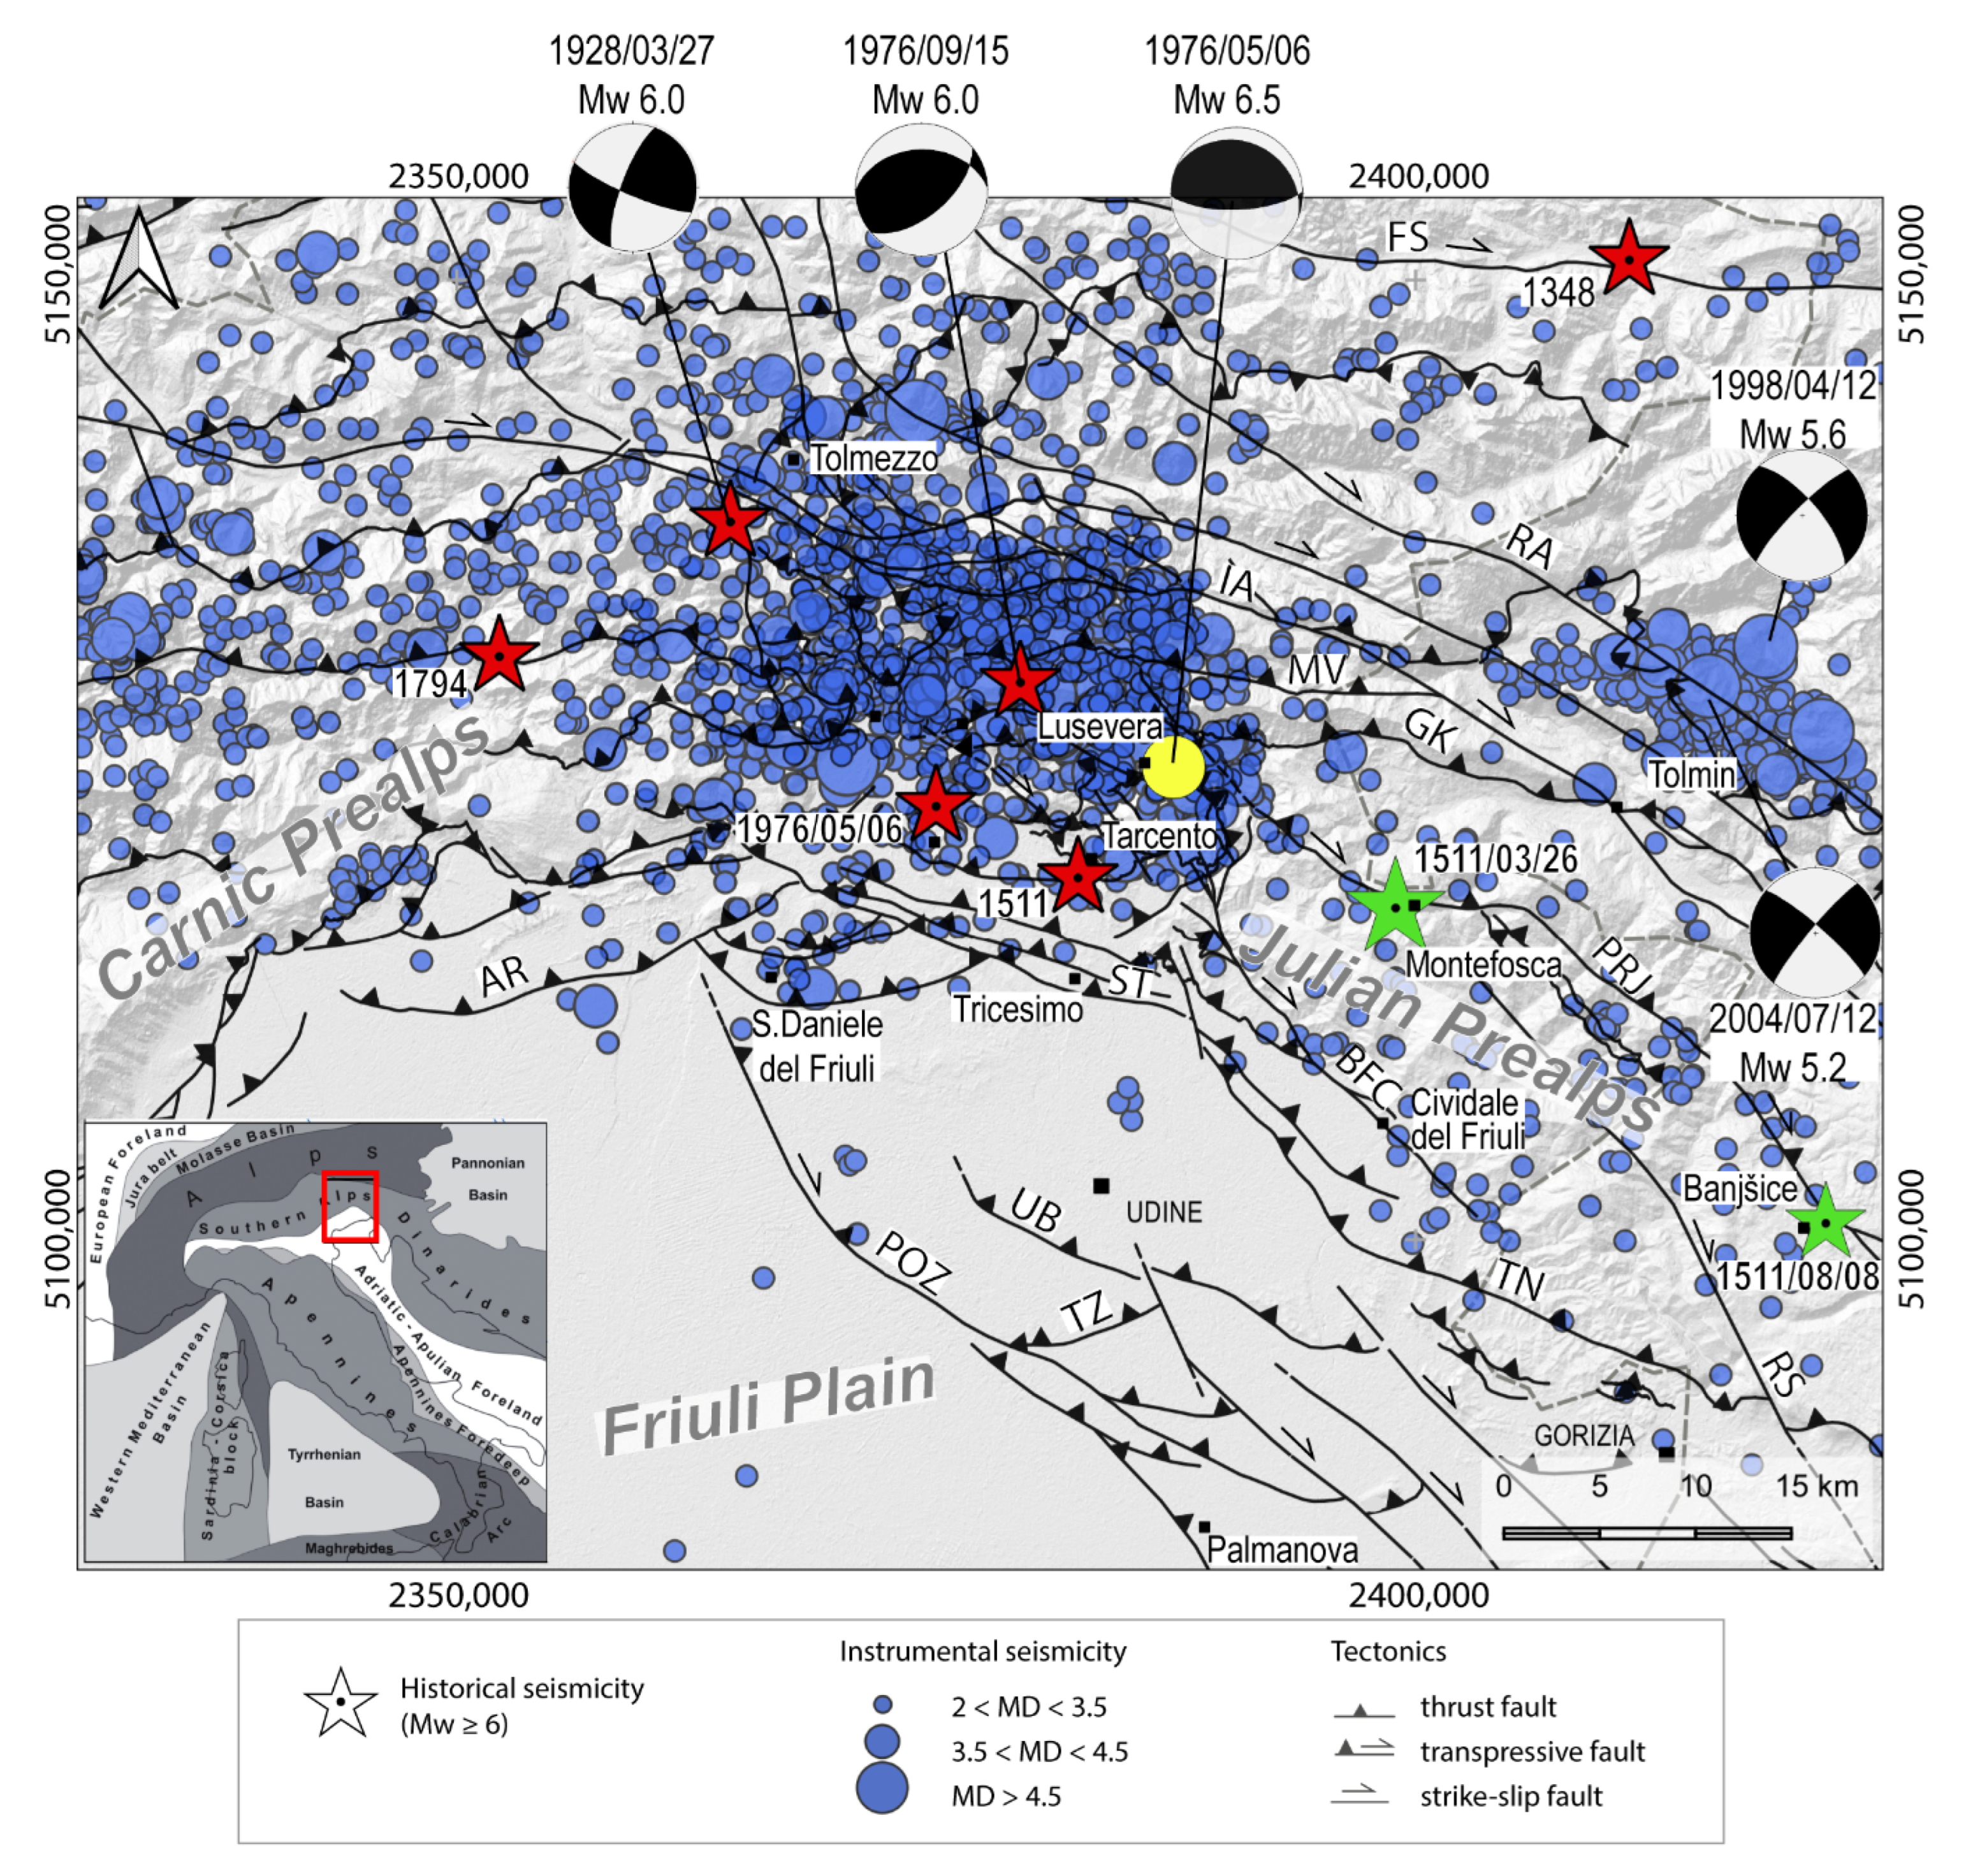
2. Geological and Seismotectonic Setting
3. Methodology
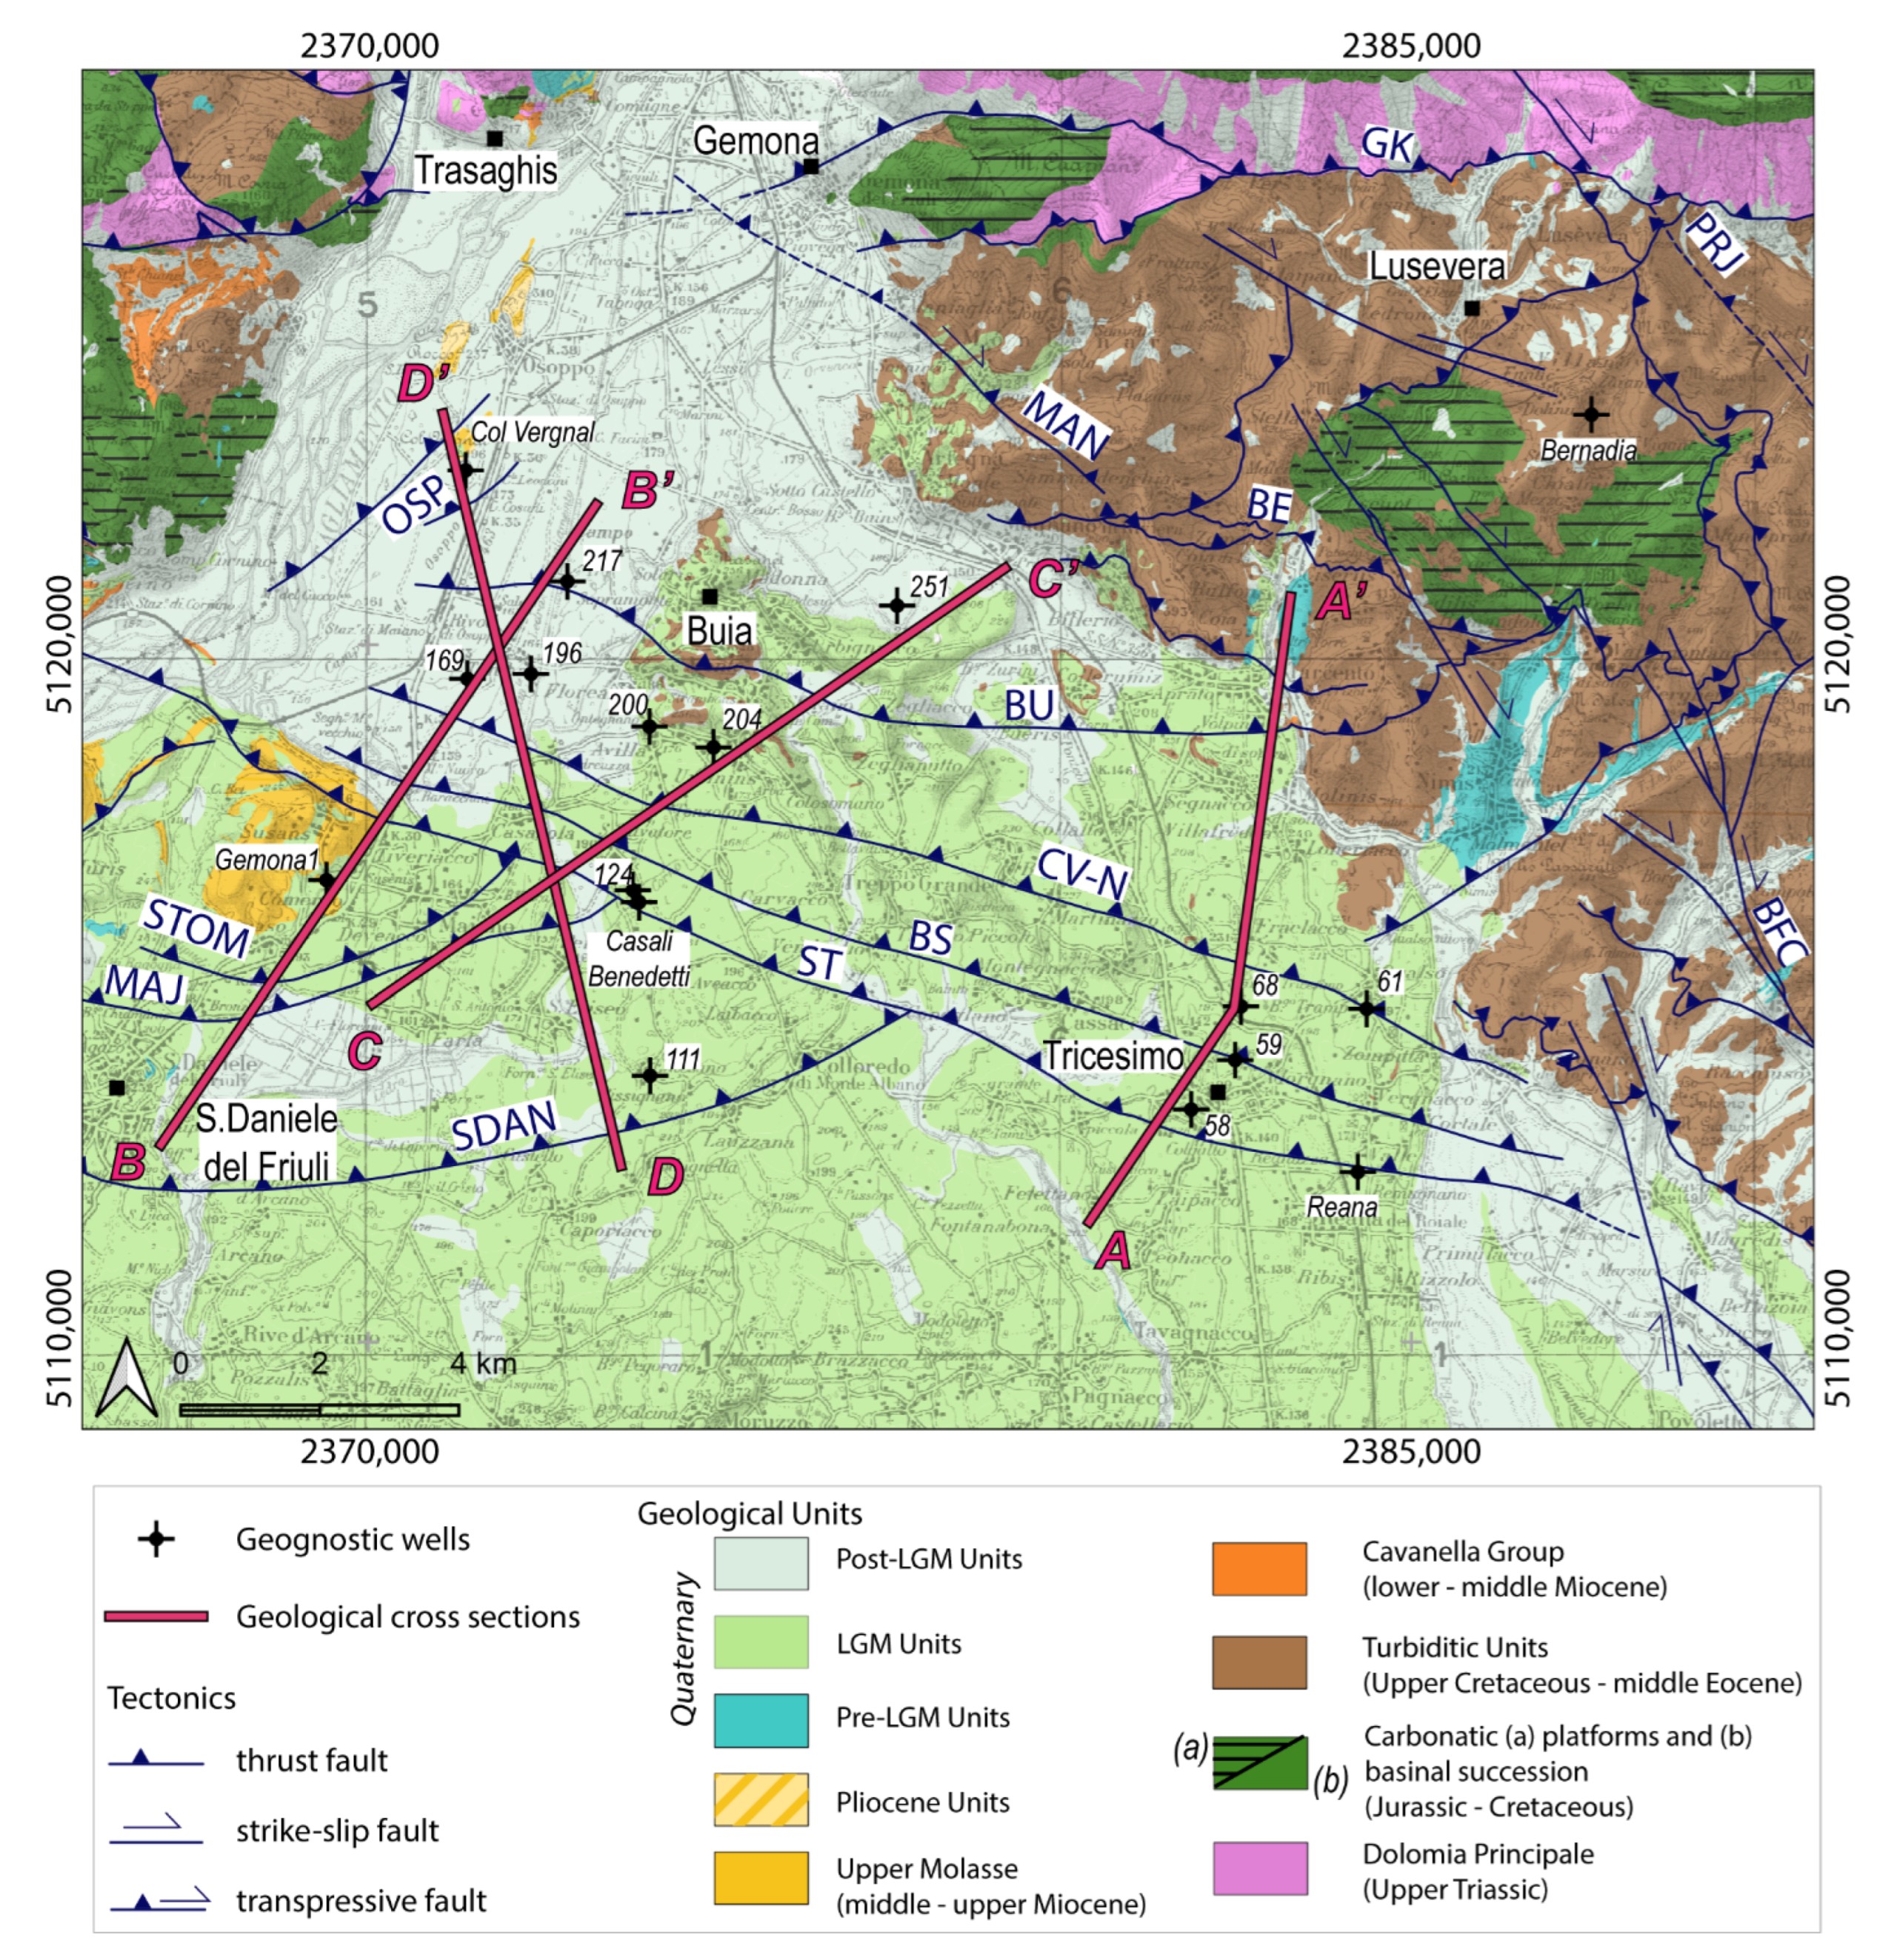
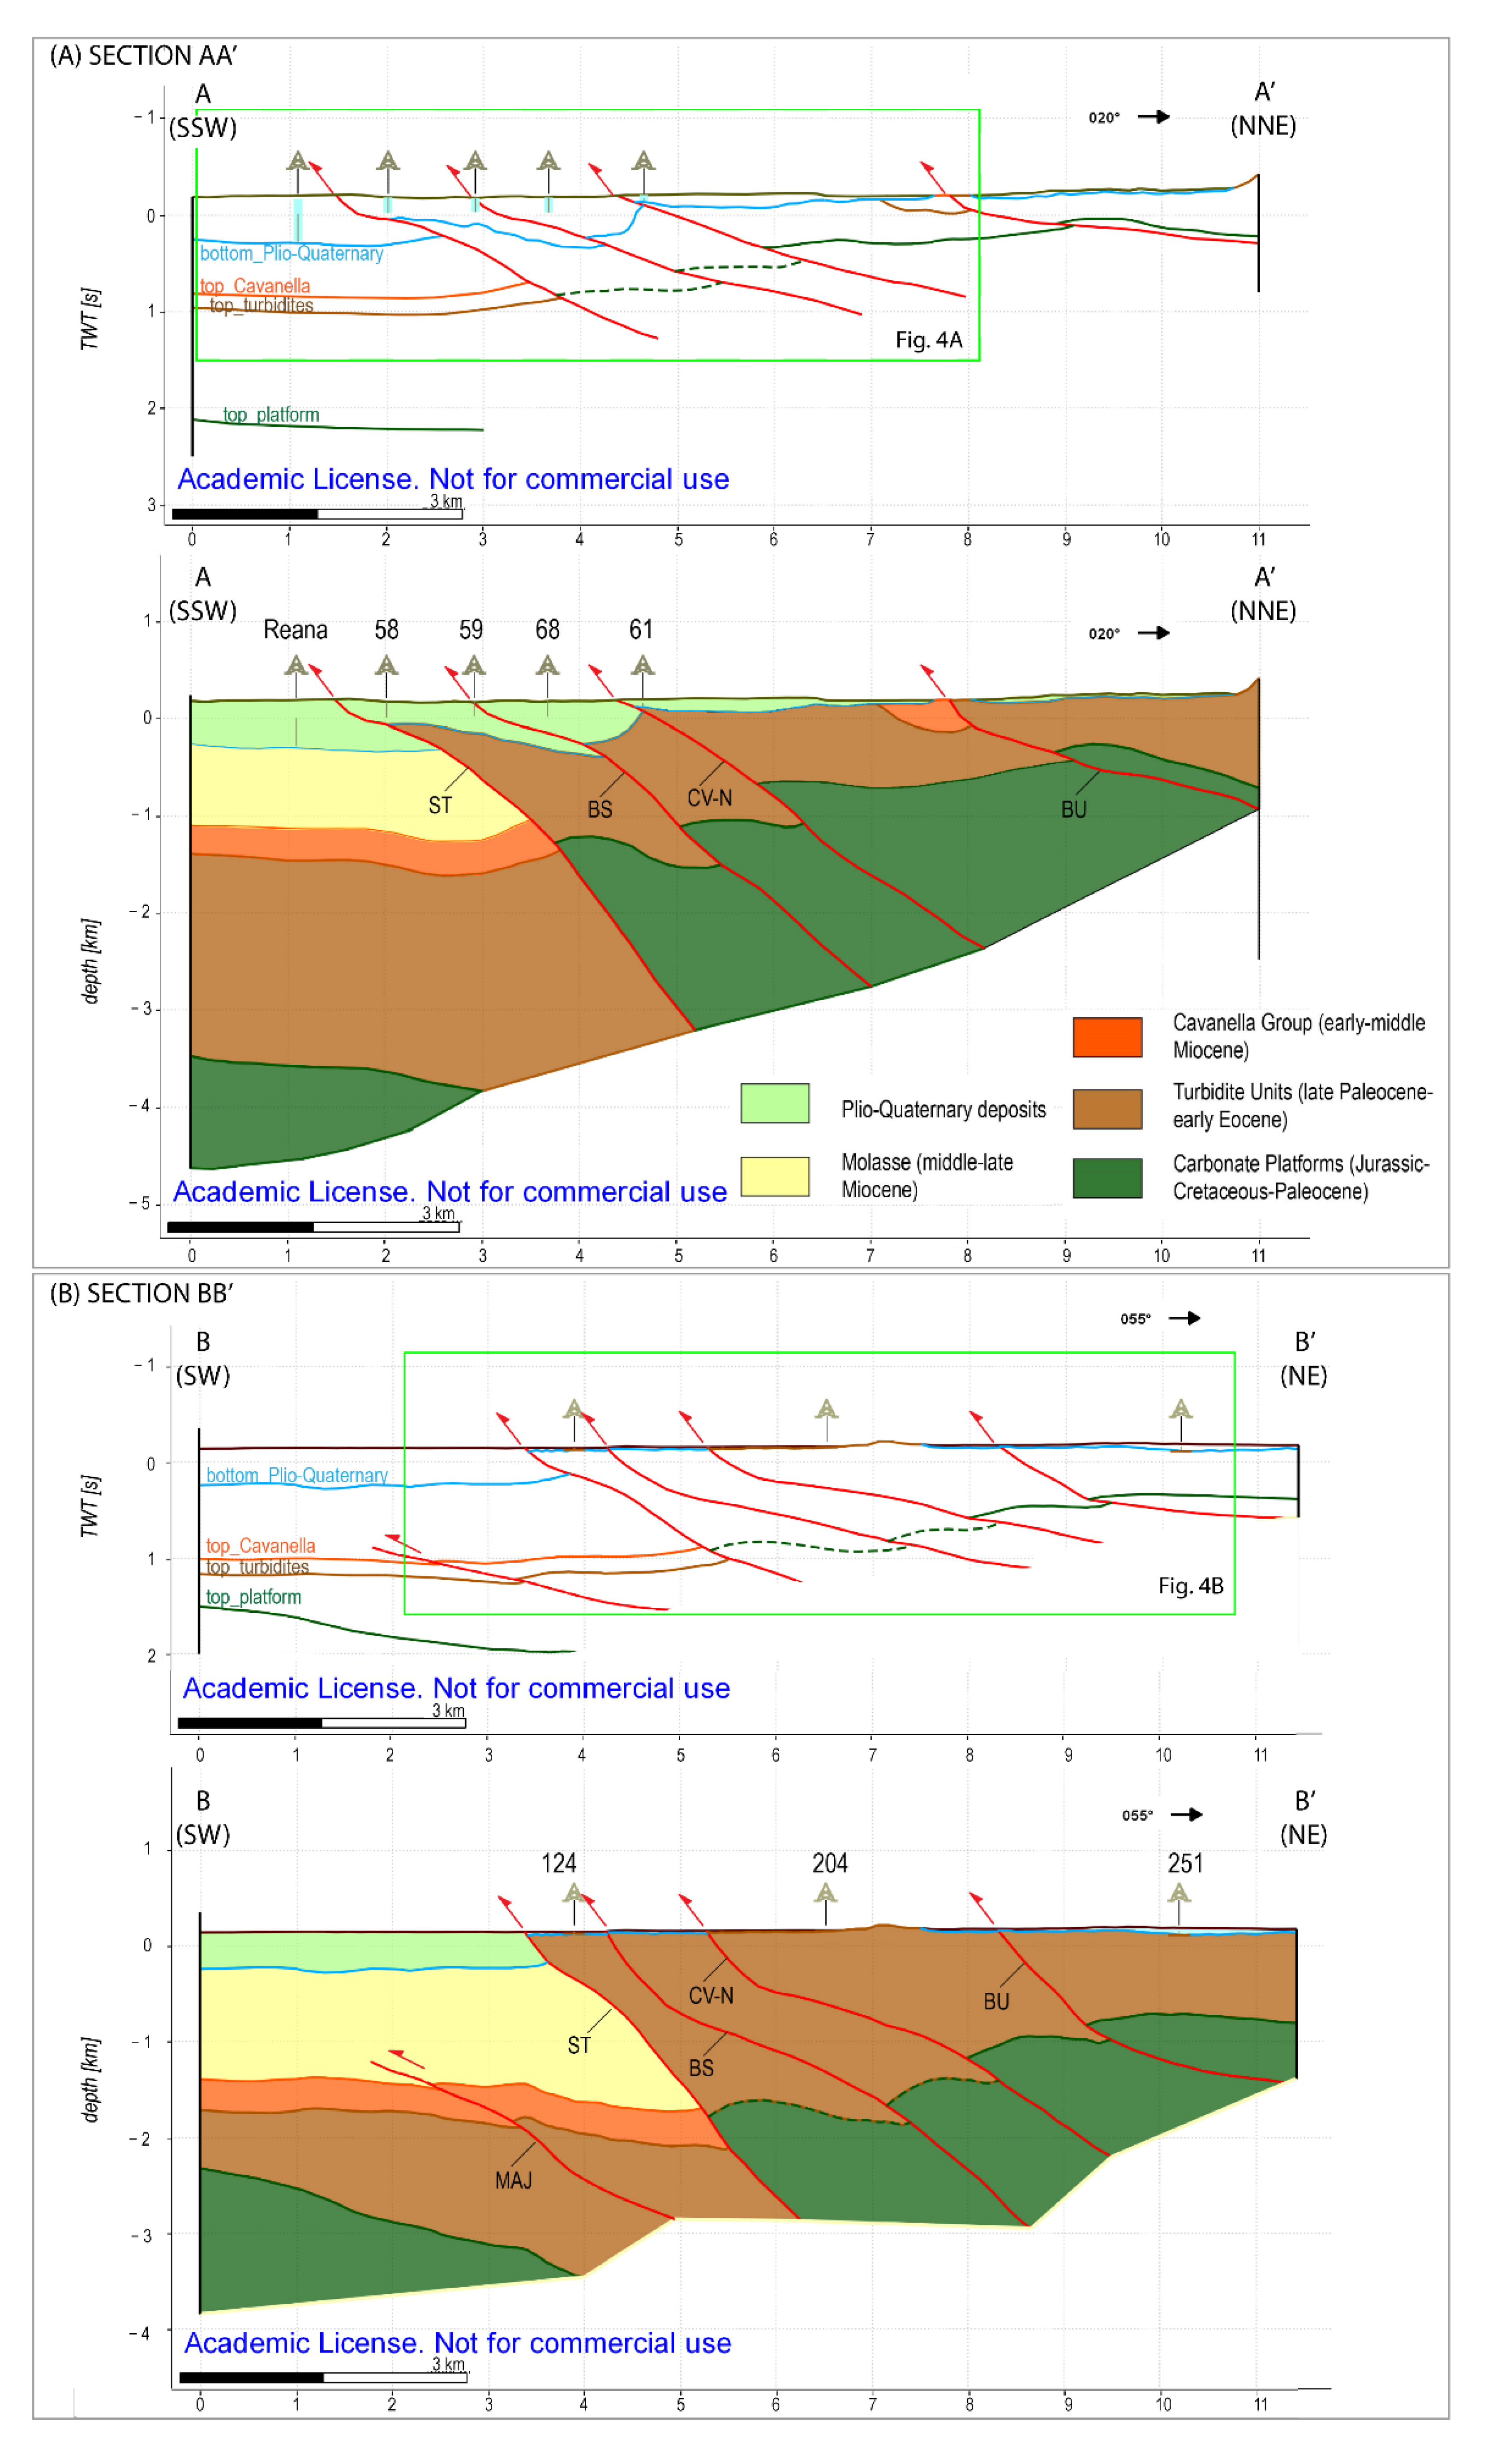
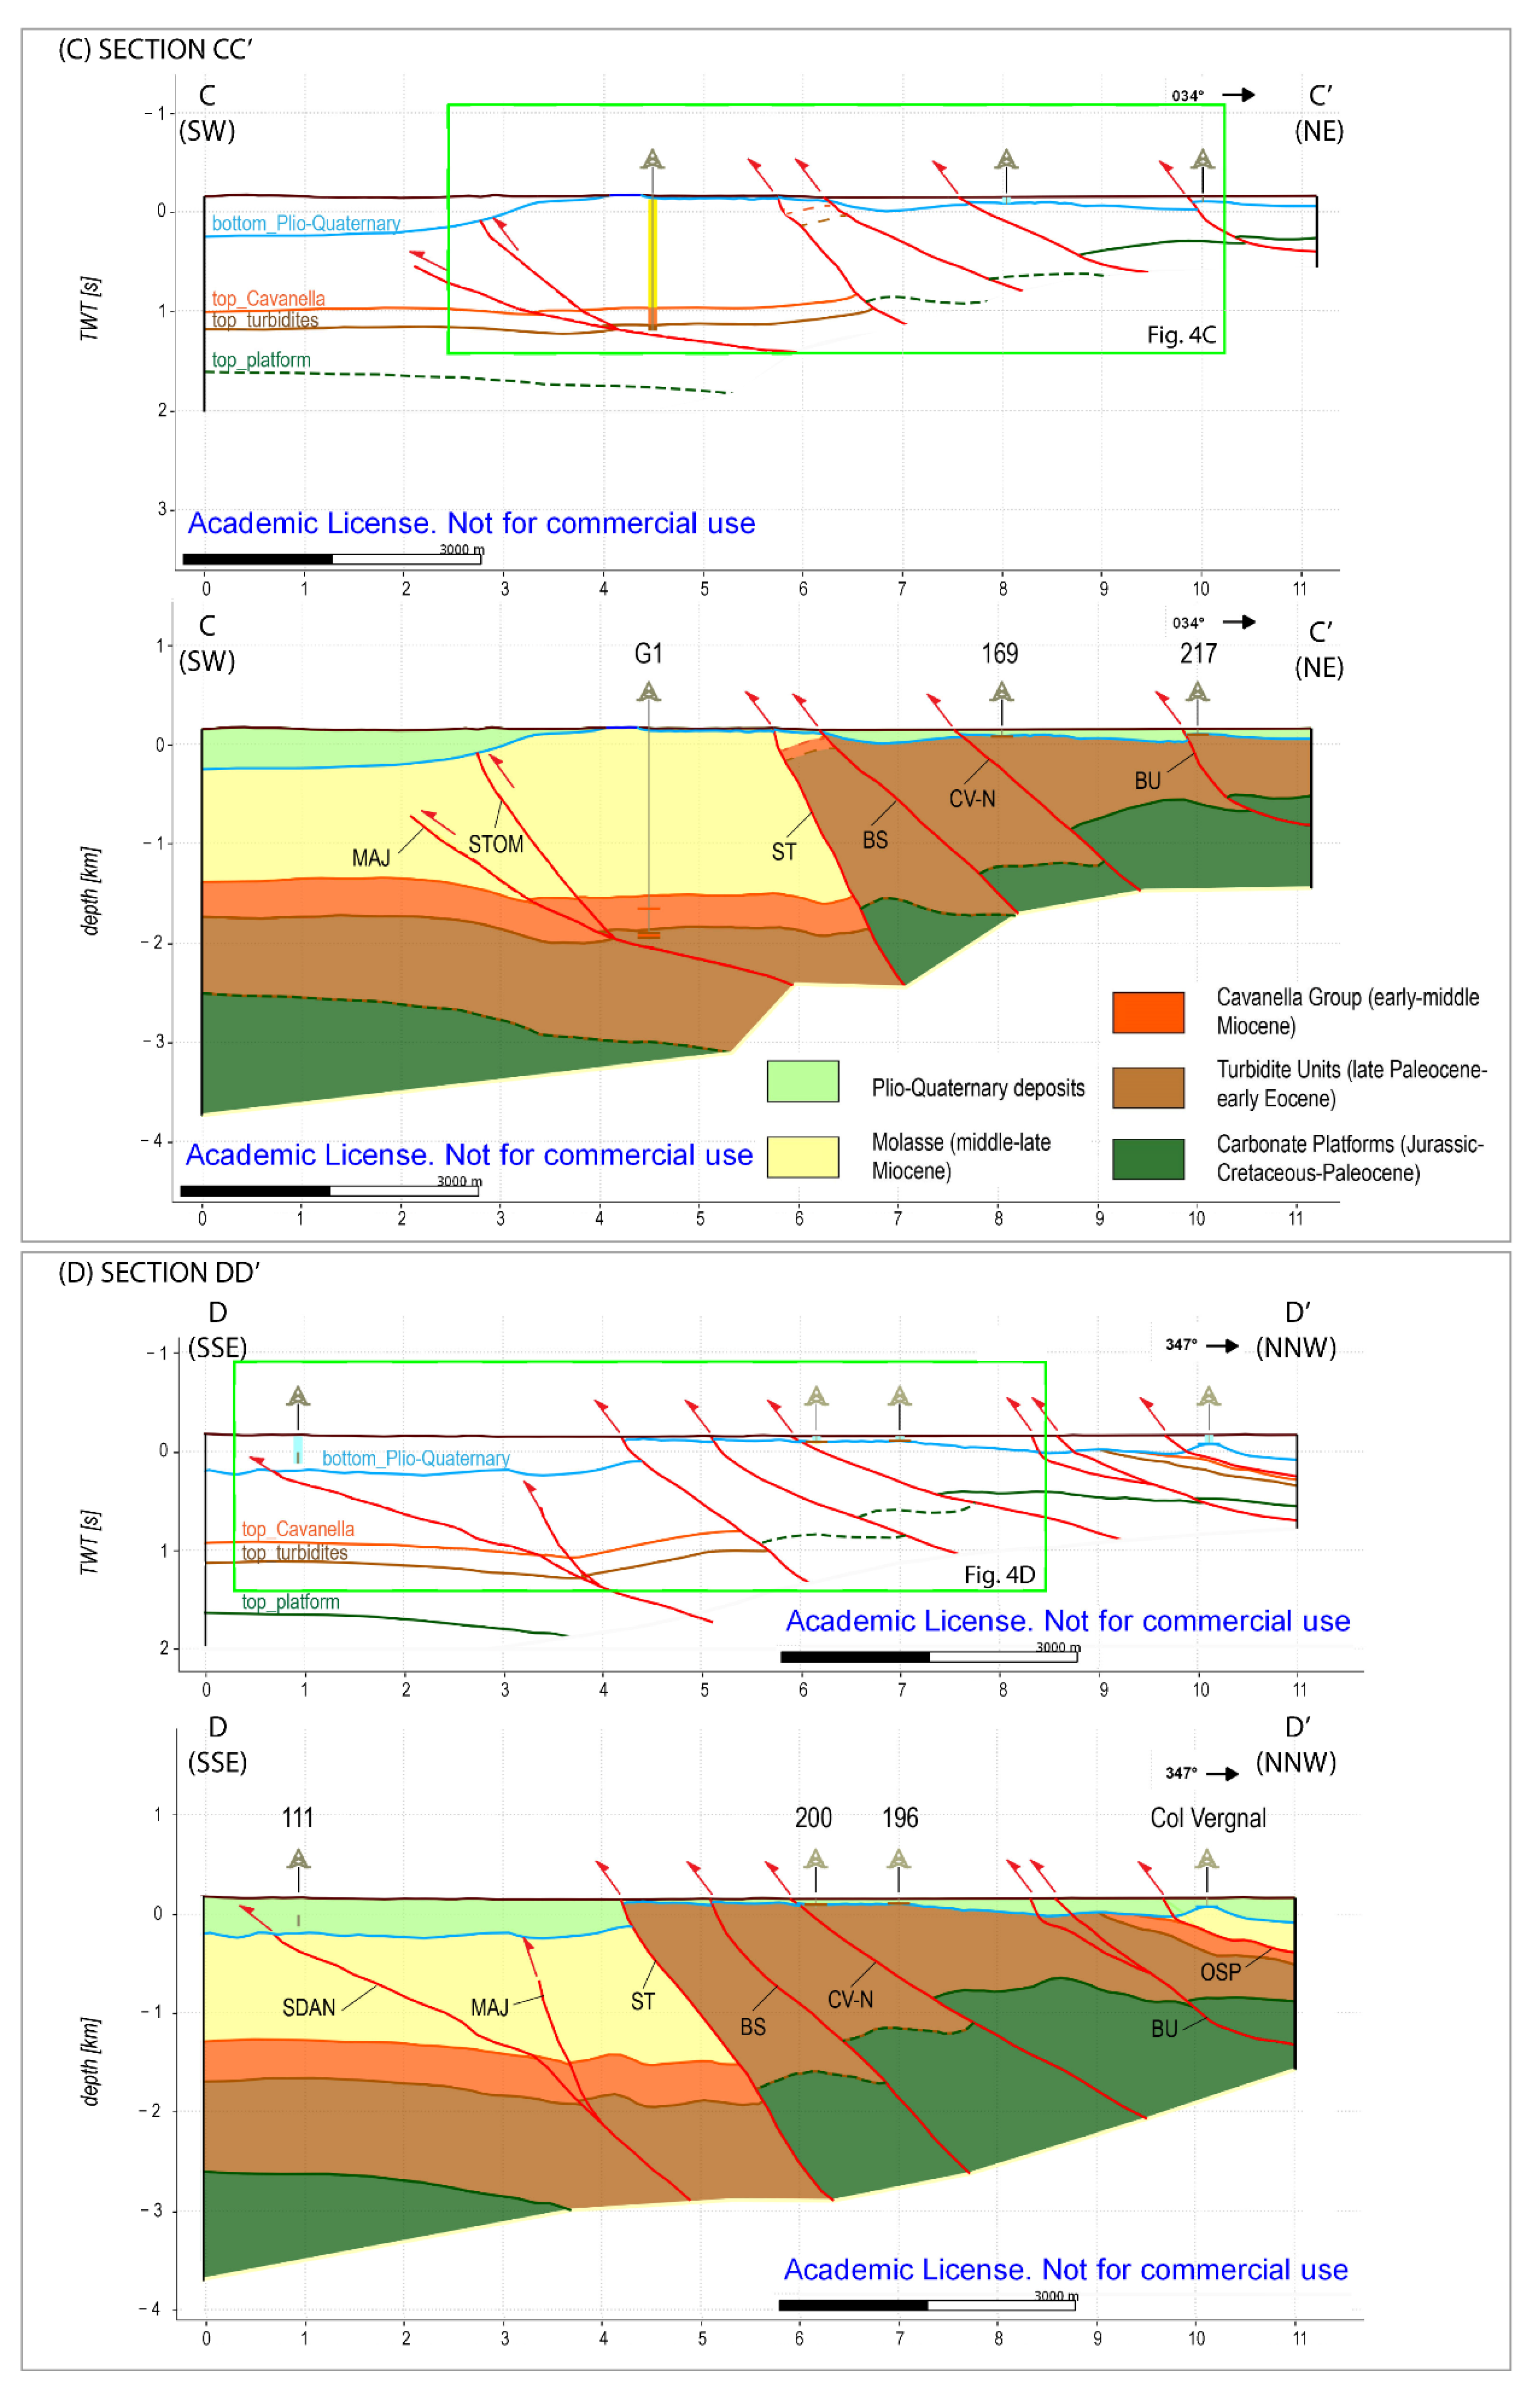
3.1. Structural Model Reconstruction
- -
- The Mesozoic platforms succession includes the Dolomia Principale and the Friuli–Dinaric carbonate platform [27], which developed from the late Triassic to middle-late Cretaceous. It is composed of an about 3000 m-thick sequence of platform facies, with locally transgressive and emersion episodes [58,59,60,61,62].
- -
- The Upper Cretaceous–Middle Eocene turbiditic sequence represents the filling of the foredeep of the SW-verging External Dinaric Chain. The complete westward thinning sequence up to 4000 m [18,63] is characterized by siliciclastic turbiditic sequence (Campanian–Maastrichtian flysch), carbonatic megabeds (seismoturbidites [64]) (Grivò Flysch, Thanetian p.p.–Ypresian p.p.) and calciclastic and siliciclastic turbidites in the upper part (Savorgnano Marls and Arenites and Cormons Flysch, lower-middle Eocene) [56,65,66,67].
- -
- The lower-middle Miocene sequence is commonly referred as the “Cavanella Group” and is composed of shallow-water marine sediments [18,23,68,69]. In the context of seismic lines interpretation, the Cavanella Group represents an important regional-scale seismo-stratigraphic group of reflectors, showing an overall tabular geometry and a southwestward thinning with thicknesses spanning from tens to hundreds of meters [22].
- -
- The middle to upper Miocene Molasse sequence represents the foredeep deposition of the southeastward verging and migrating south Alpine chain. In the Piedmont Friuli Plain, at the outer border of the pre-Alpine relieves, the upper portion of the sequence consists of very thick fan delta and alluvial deposits dated back to latest Tortonian–early Messinian (Montello Conglomerate, [56,70]), testifying the transition from terrigenous platform to continental facies [23,27].
- -
- The Plio-Quaternary sequence develops on top of the Messinian unconformity. It is composed of thick conglomeratic channel bodies filling the narrow Messinian canyons since the successive transgression episode [27,71]. The sea ingression extended in the Tagliamento paleovalley area and north up to Osoppo, where coarse-grained Gilbert-type deltaic bodies are preserved; the Osoppo Conglomerate dates back to upper Miocene–Pliocene [72] or to the Zanclean [25,73]. The middle-to-late Pleistocene sequence covering the erosional plain surface includes alluvial and glacial facies [27,56,70,71].
3.2. Instrumental Seismicity Analysis
4. Results
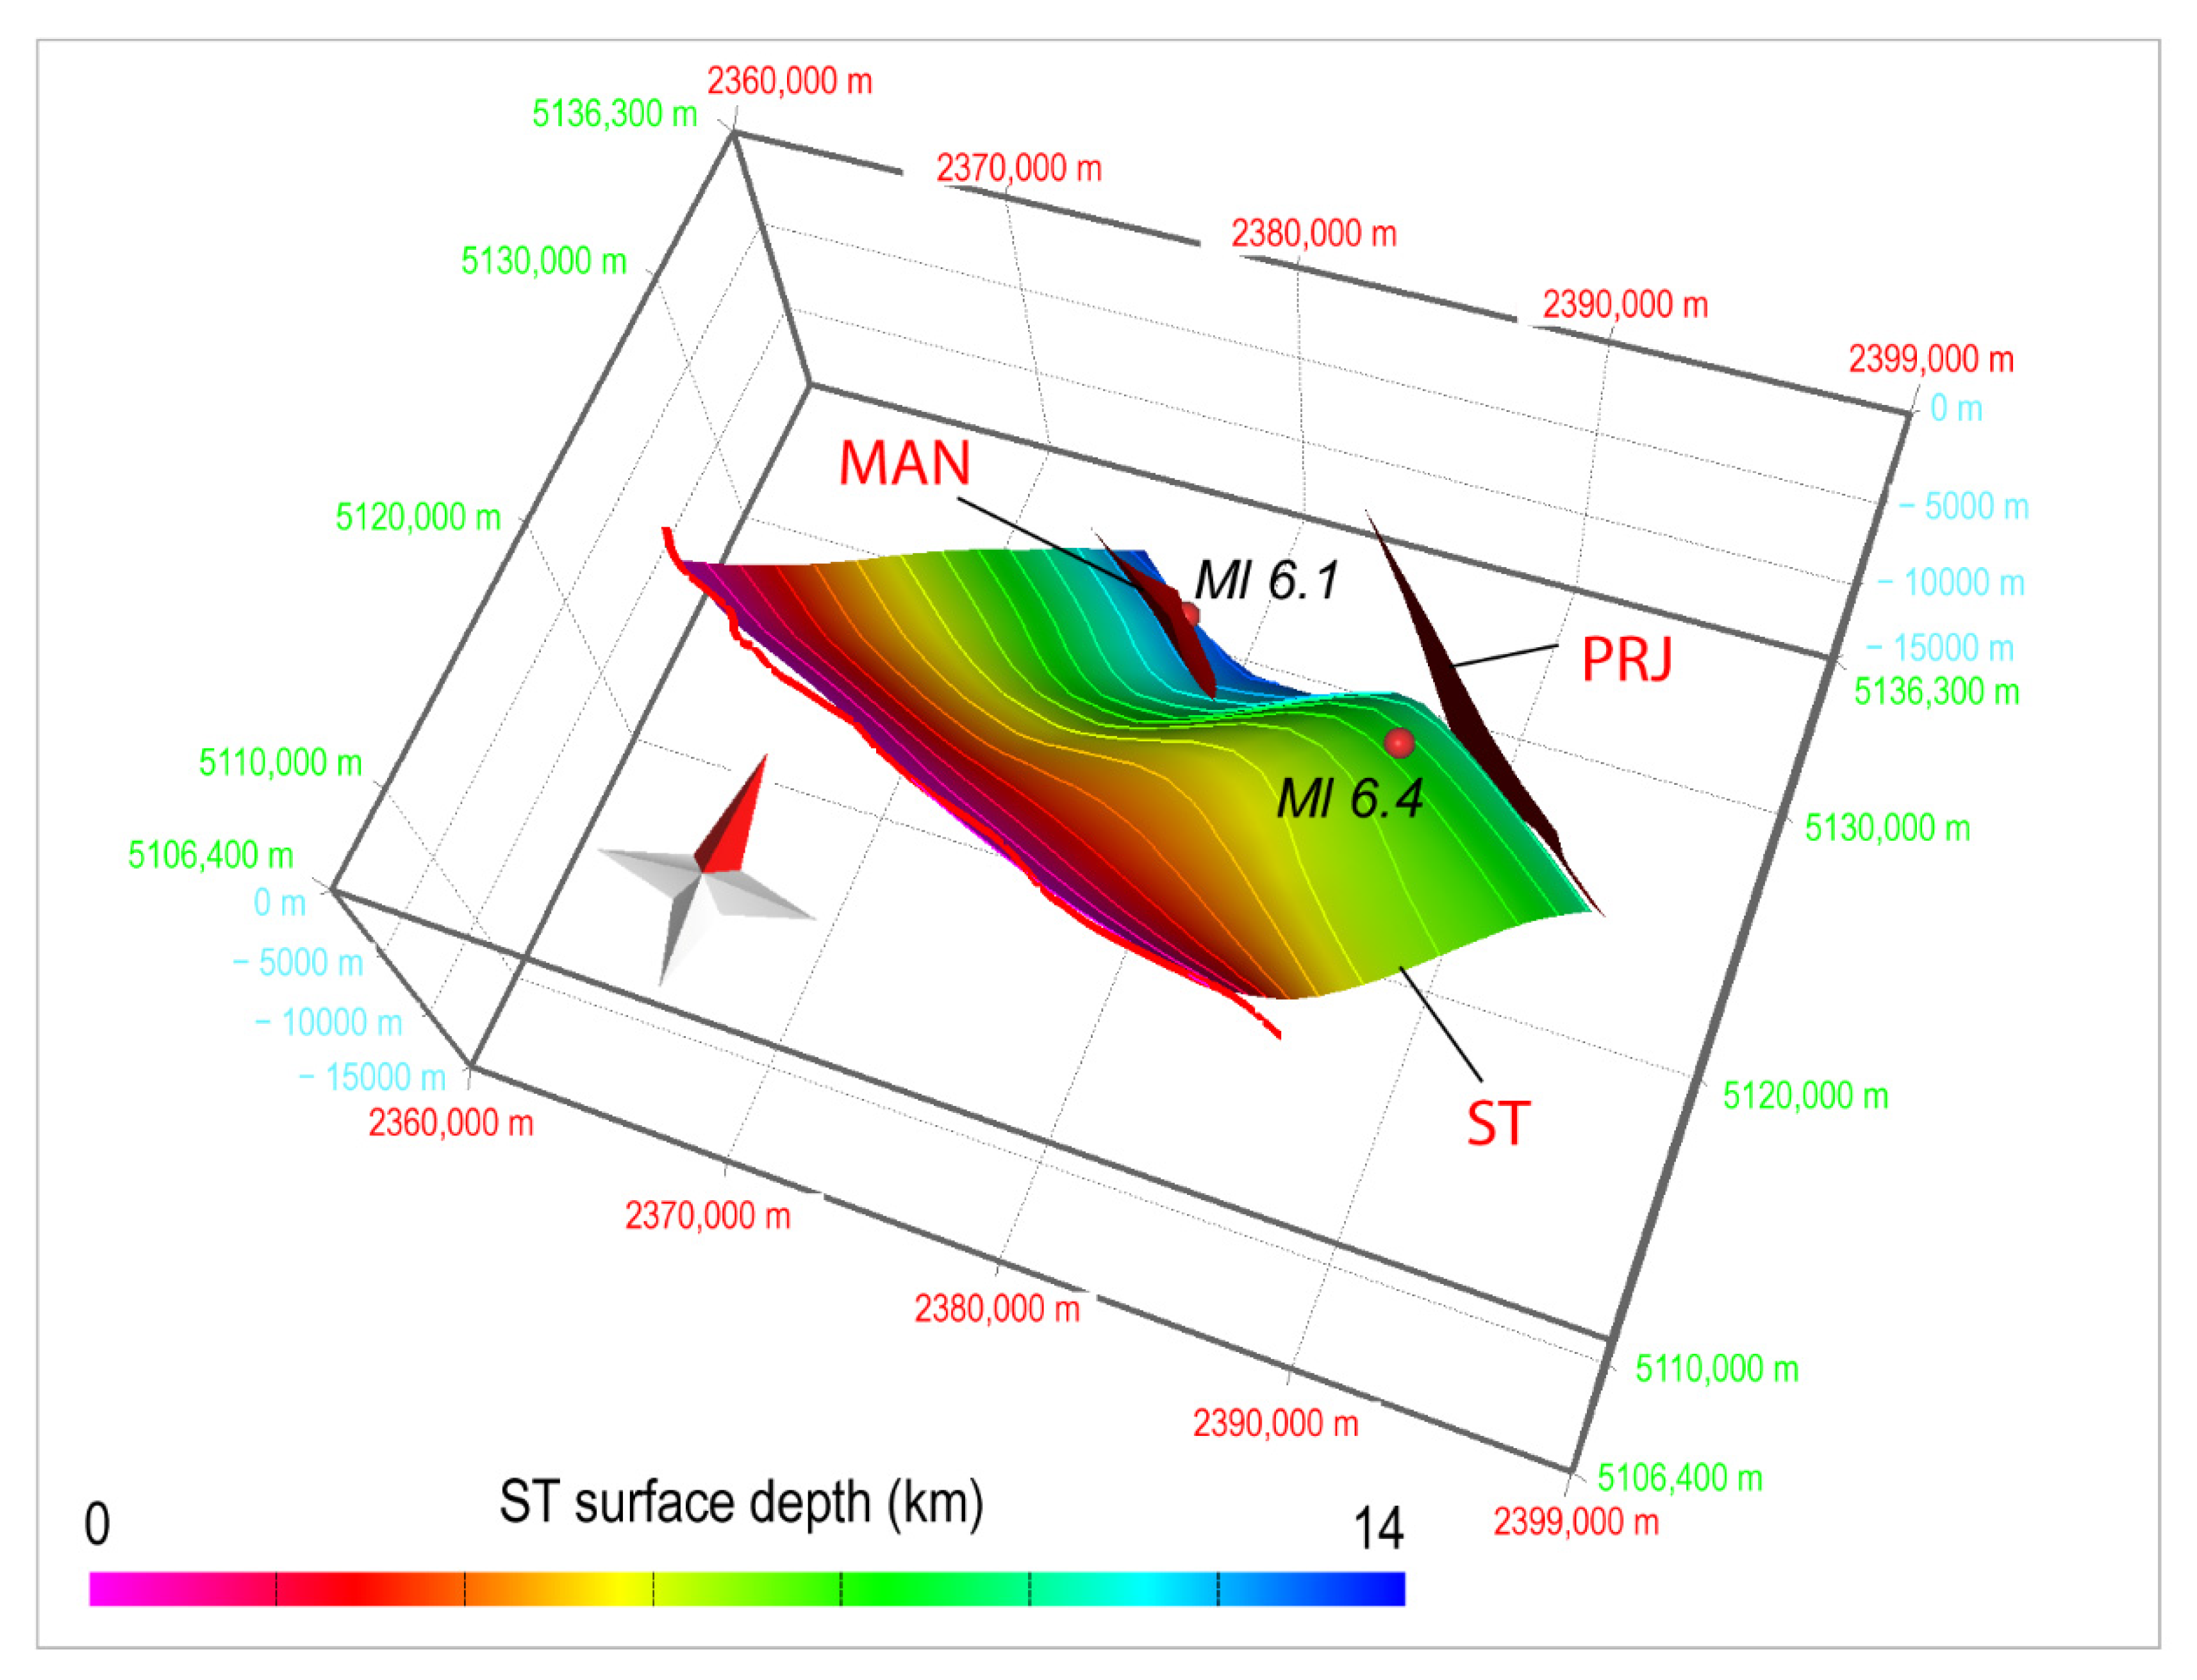
4.1. Three-Dimensional Reconstruction of the Susans–Tricesimo Thrust System
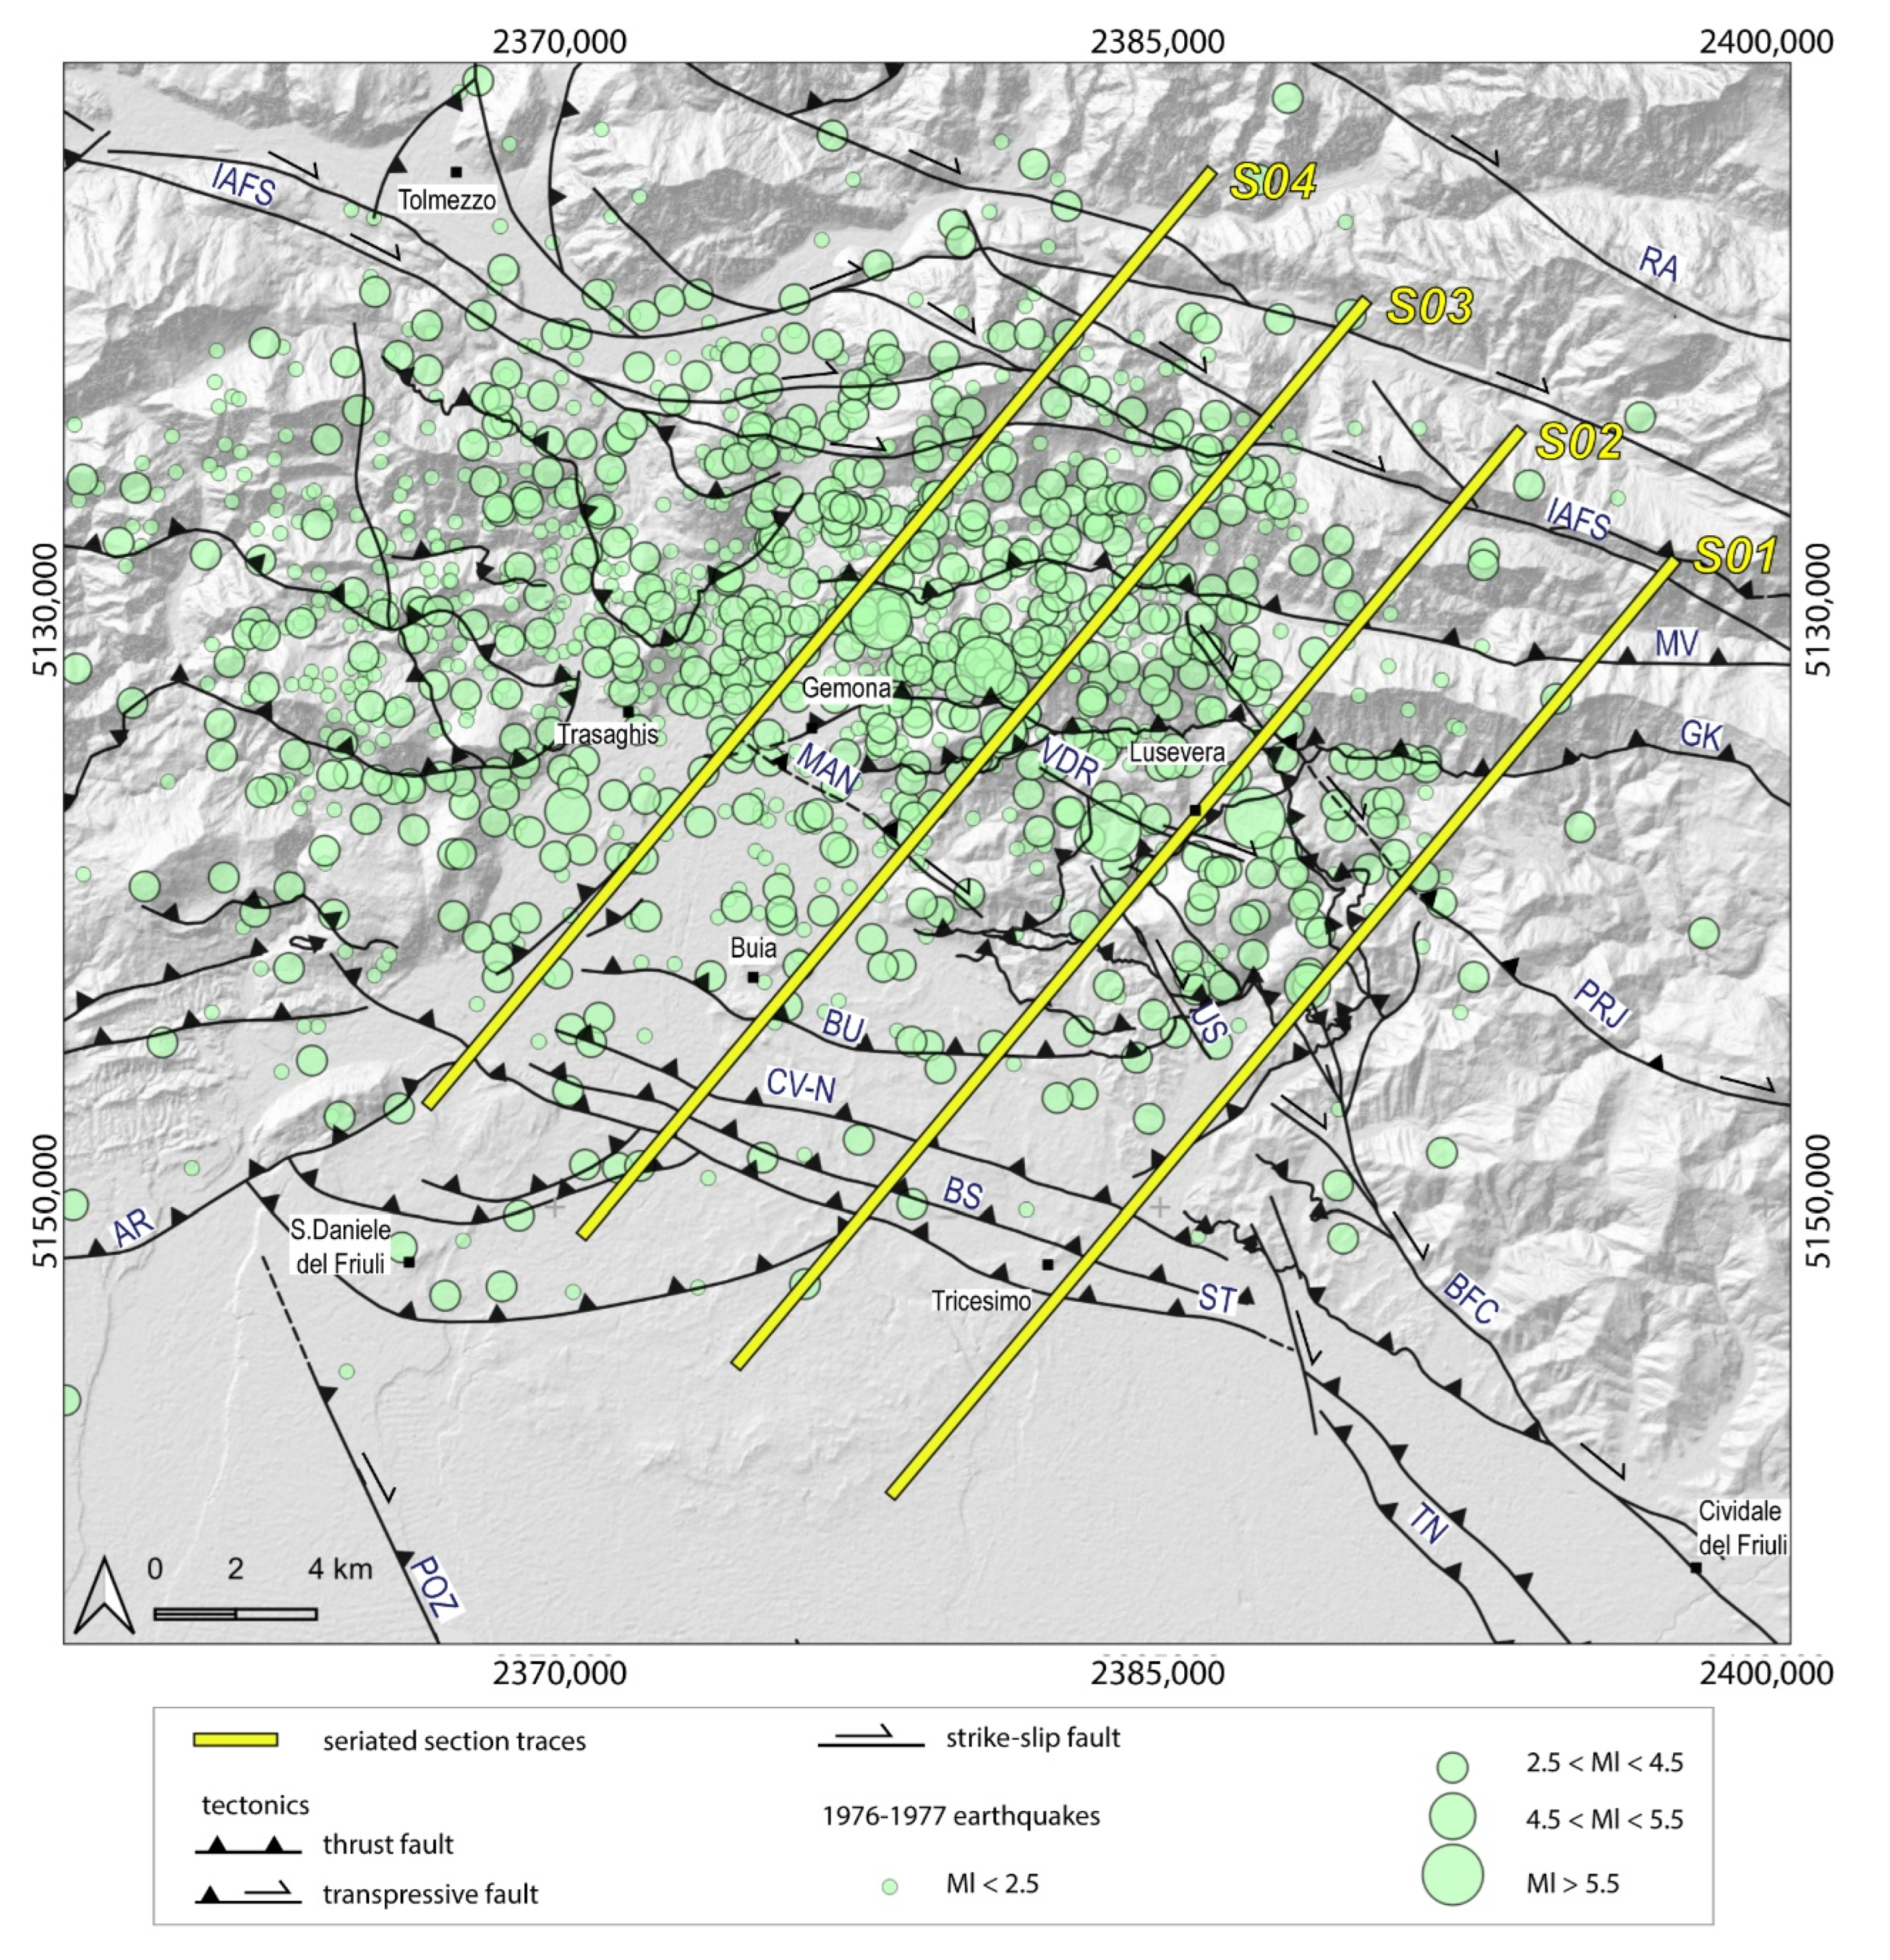
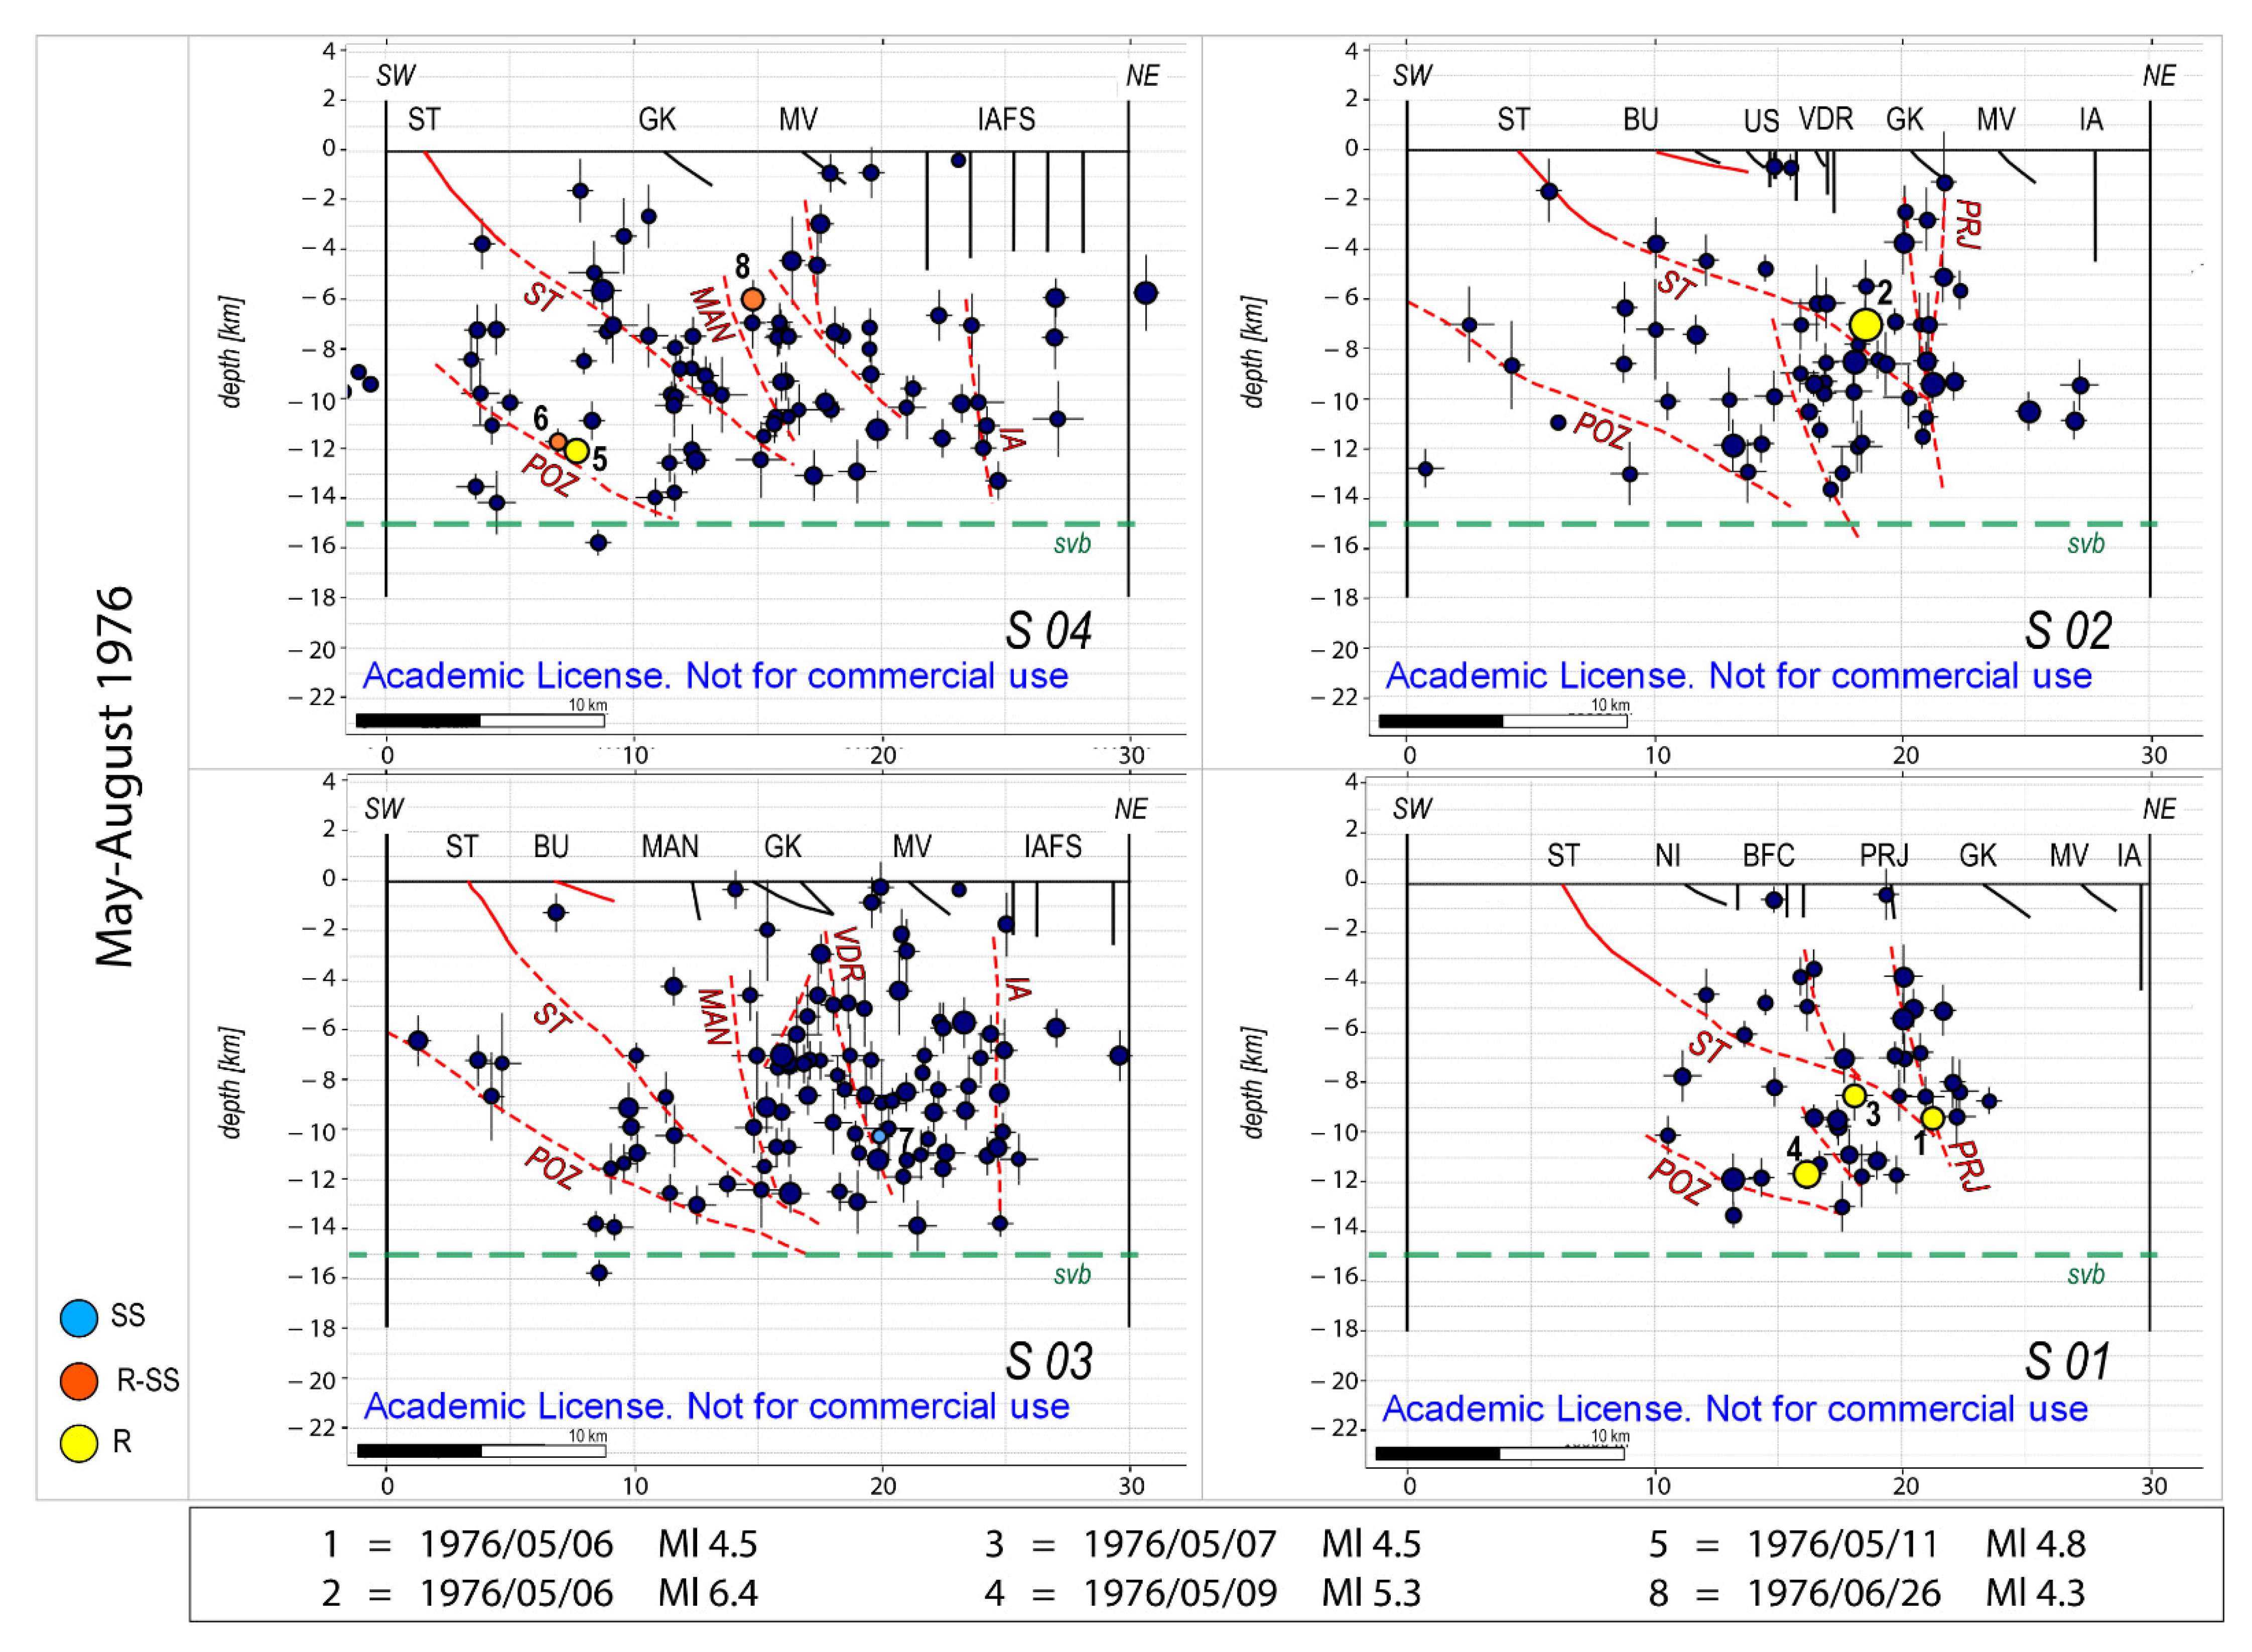
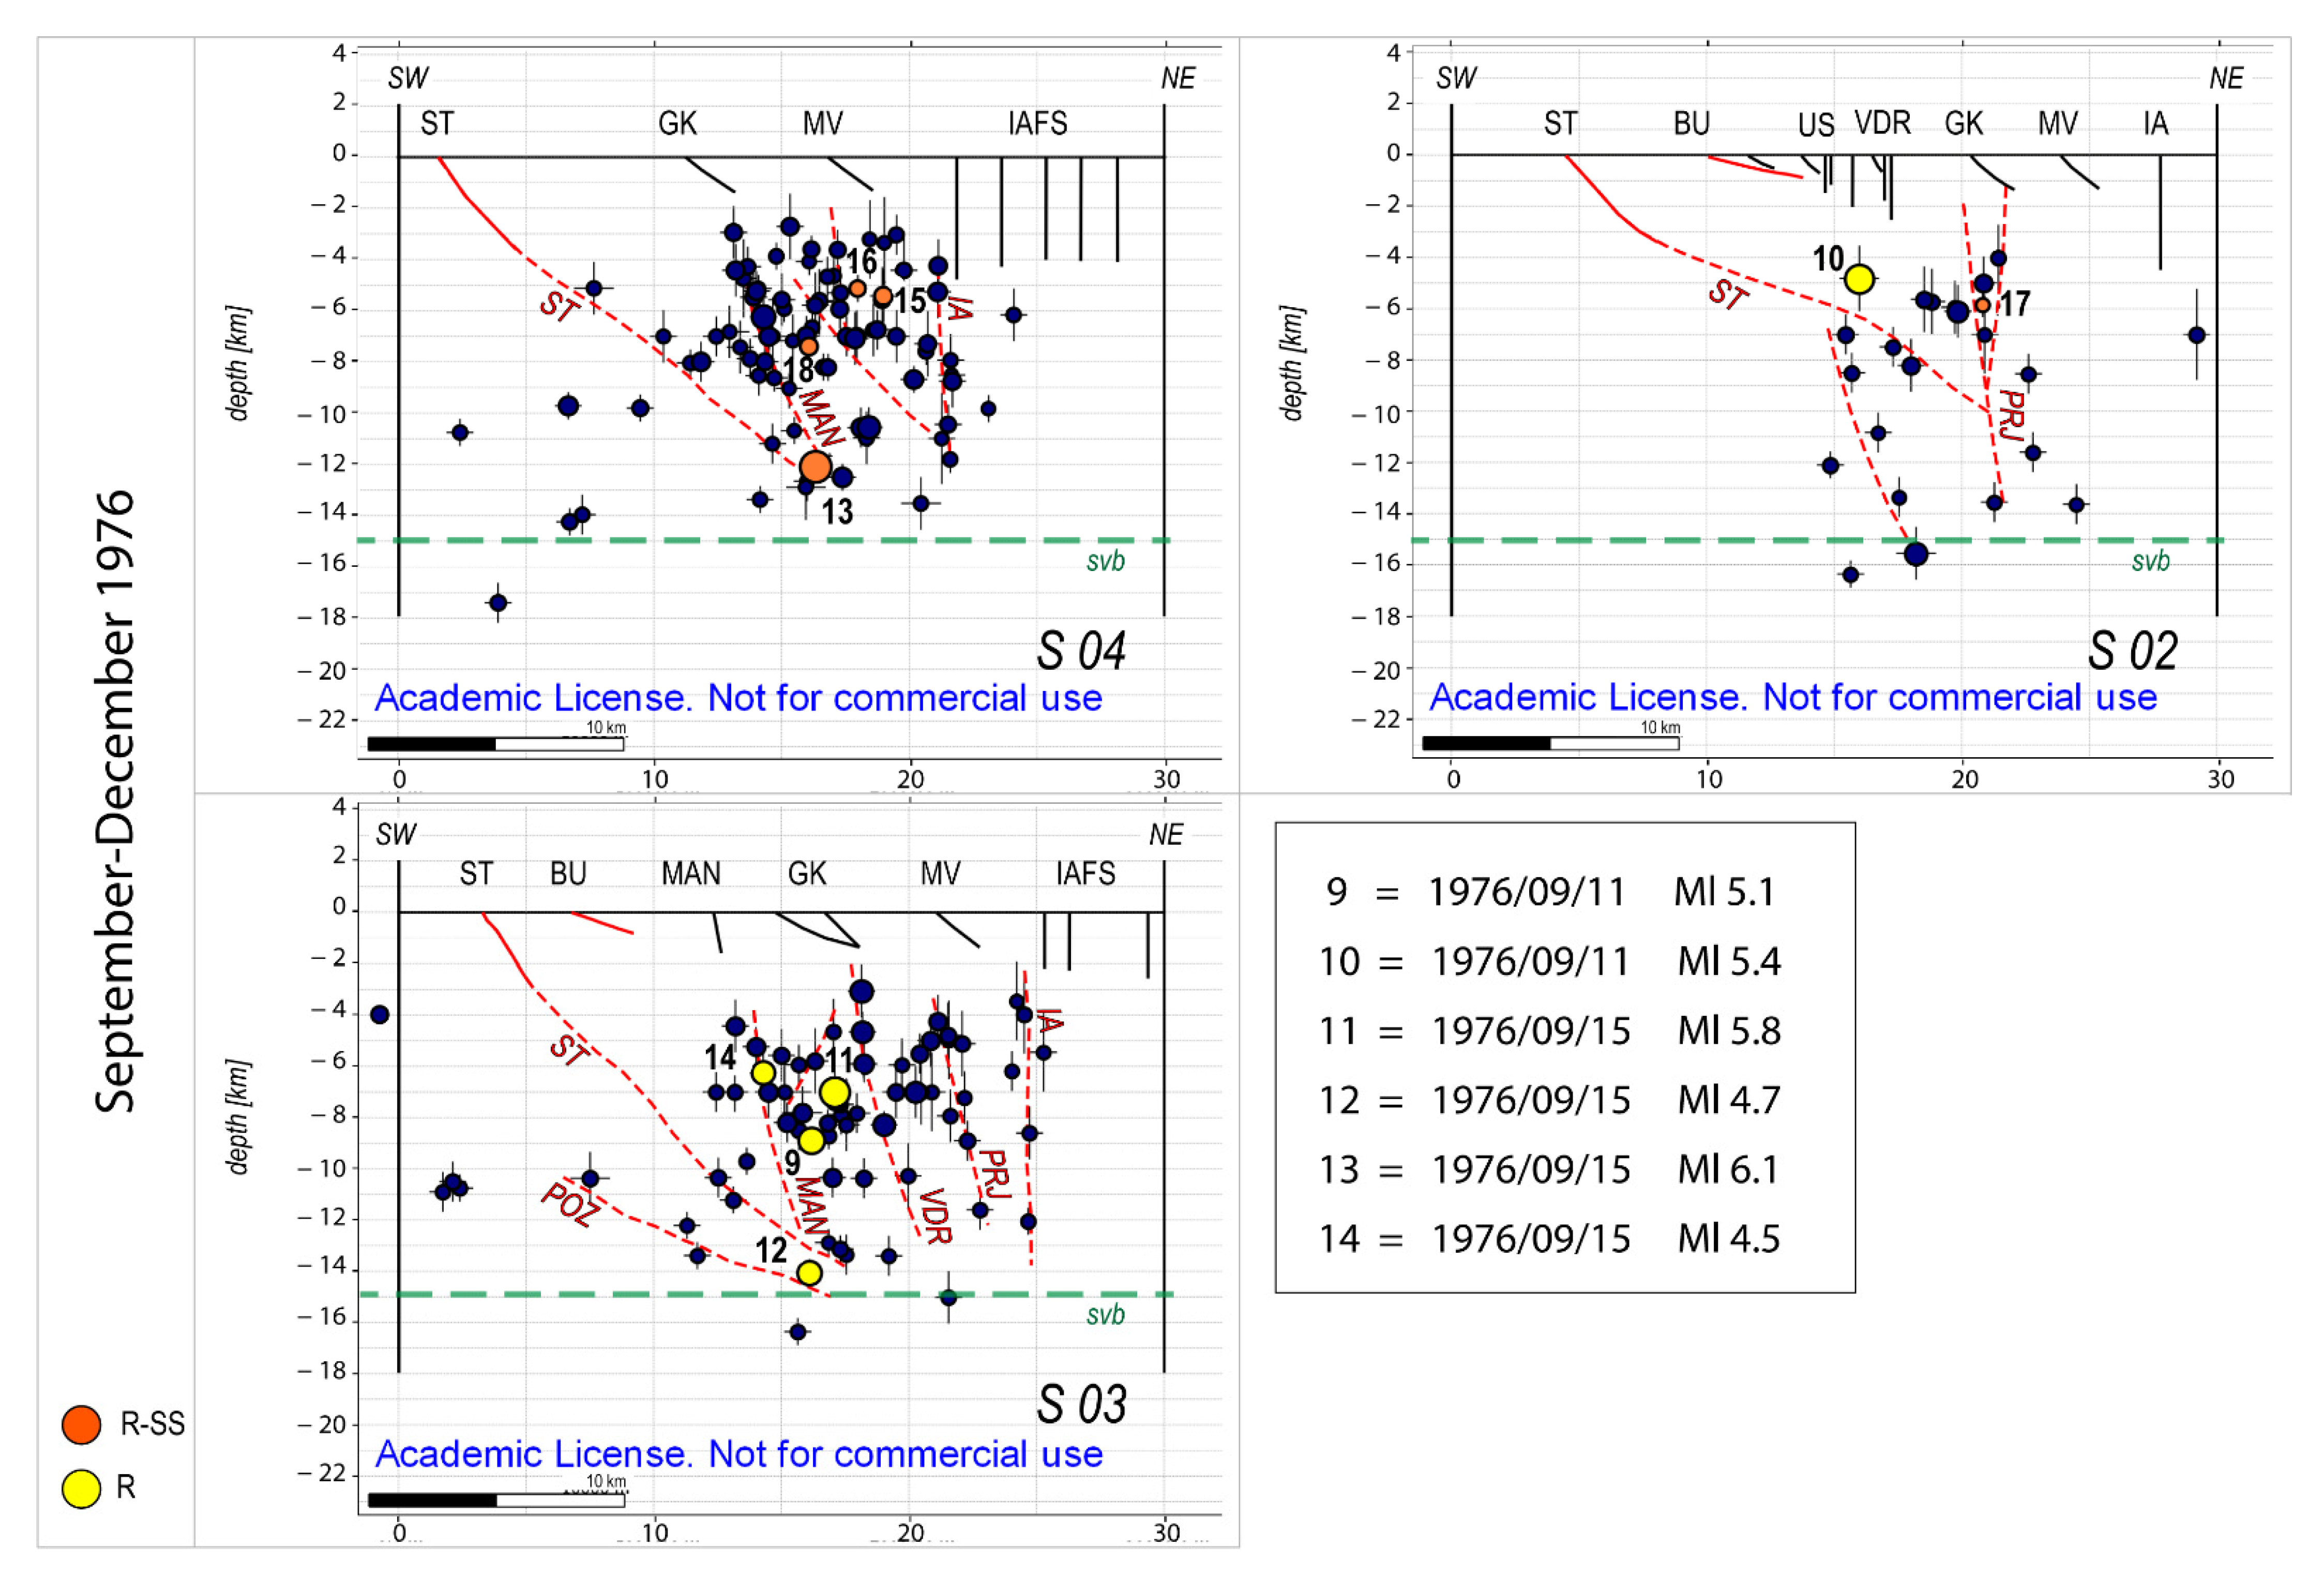
4.2. Analysis of Seismicity Distribution
4.2.1. 1976–1977 Seismicity Distribution


| Event Parameters [12] | Focal Mechanism [9] | |||||
|---|---|---|---|---|---|---|
| ID | DATE | TIME | DEPTH [km] | Ml | FT | FT-REF |
| 1 | 1976/05/06 | 19:59 | 9.4 | 4.5 | R | [81] |
| 2 | 1976/05/06 | 20:00 | 7 | 6.4 | R | [81] |
| 3 | 1976/05/07 | 00:23 | 8.5 | 4.5 | R | [81] |
| 4 | 1976/05/09 | 00:53 | 11.6 | 5.3 | R | [81] |
| 5 | 1976/05/11 | 22:44 | 12.0 | 4.8 | R | [81] |
| 6 | 1976/05/07 | 11:15 | 11.7 | 3.5 | R-SS | [50] |
| 7 | 1976/05/15 | 16:50 | 10.2 | 3 | SS | [50] |
| 8 | 1976/06/26 | 11:13 | 5.9 | 4.3 | R-SS | [81] |
| 9 | 1976/09/11 | 16:31 | 8.9 | 5.1 | R | [81] |
| 10 | 1976/09/11 | 16:35 | 4.8 | 5.4 | R | [81] |
| 11 | 1976/09/15 | 03:15 | 7 | 5.8 | R | [81] |
| 12 | 1976/09/15 | 04:38 | 14 | 4.7 | R | [81] |
| 13 | 1976/09/15 | 09:21 | 12 | 6.1 | R-SS | [81] |
| 14 | 1976/09/15 | 11:11 | 6.2 | 4.5 | R | [81] |
| 15 | 1976/09/15 | 20:34 | 5.4 | 3.7 | R-SS | [50] |
| 16 | 1976/10/27 | 04:25 | 5.1 | 3.3 | R-SS | [50] |
| 17 | 1976/11/20 | 00:01 | 5.8 | 2.9 | R-SS | [50] |
| 18 | 1976/12/07 | 03:37 | 7.4 | 3.6 | R-SS | [50] |
| 19 | 1977/04/03 | 03:18 | 12.2 | 4.5 | R | [81] |
| 20 | 1977/08/24 | 12:00 | 6.8 | 3.4 | SS-R | [81] |
| Event Parameters [13] | Preferred Focal Mechanism [9] | |||||
|---|---|---|---|---|---|---|
| ID | DATE | TIME | DEPTH [km] | MD | FT | FT-REF |
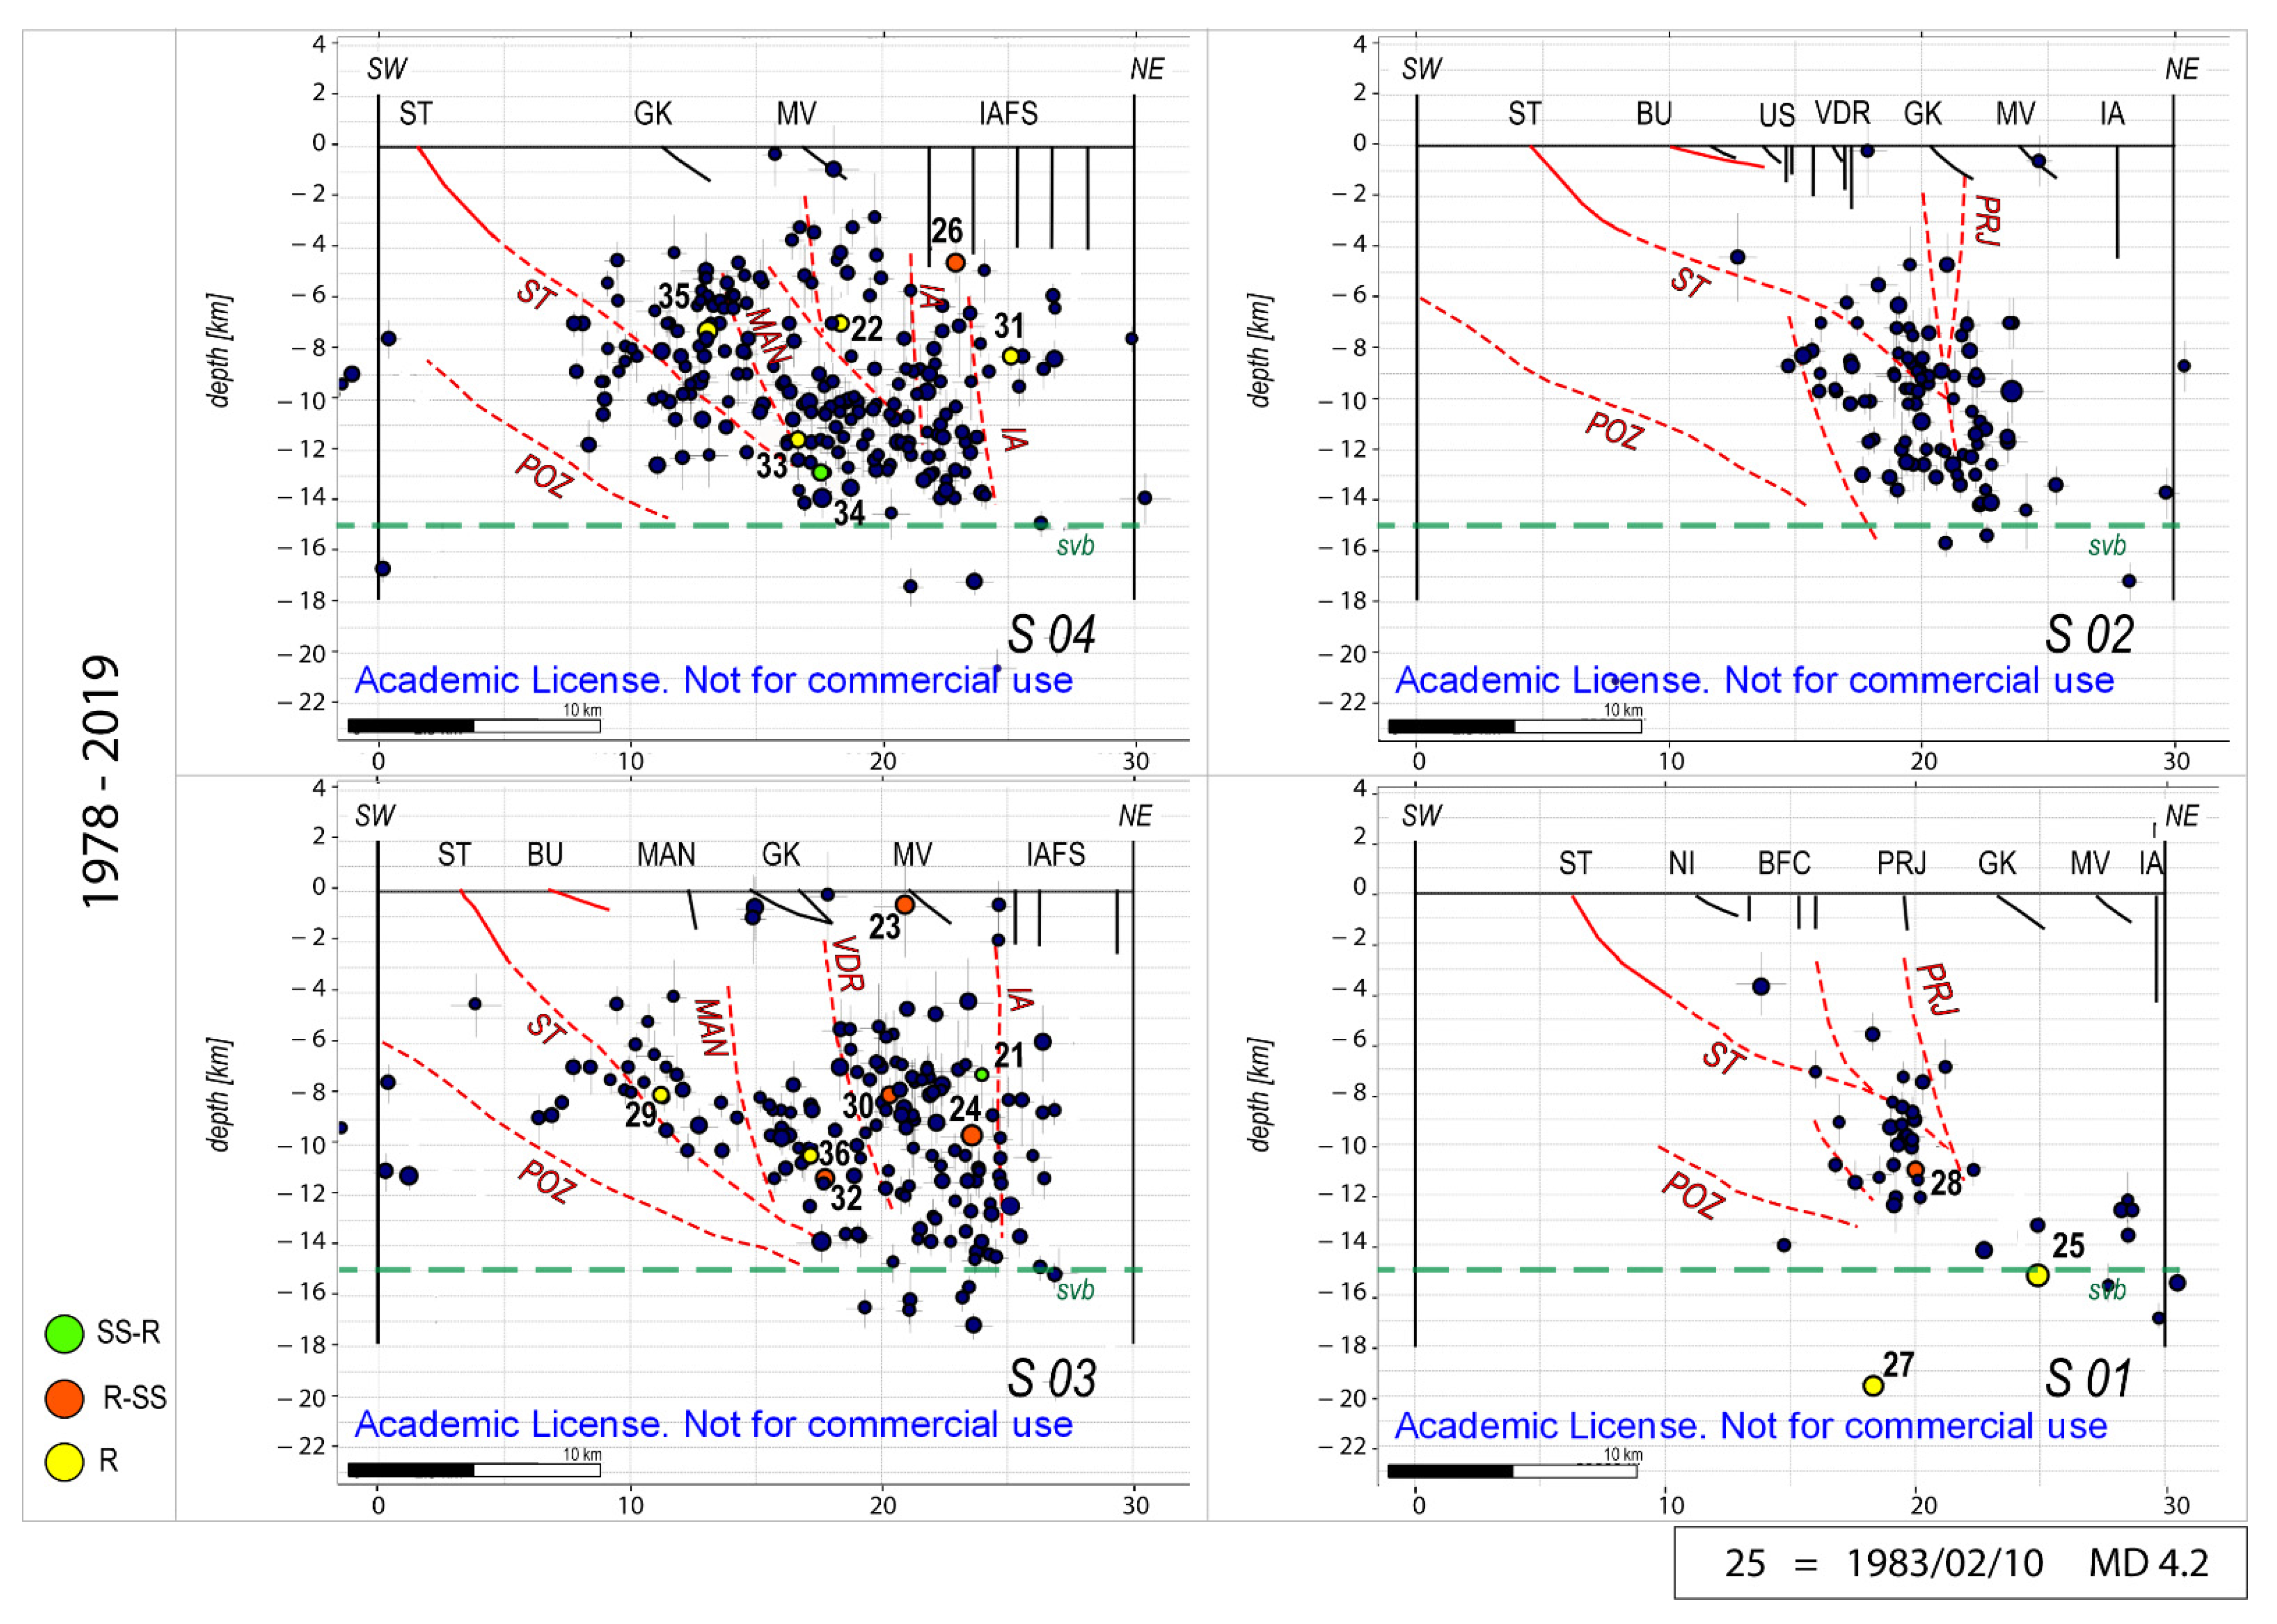
| 21 | 1978/04/02 | 18:23 | 7.3 | 2.4 | SS-R | [81] |
| 22 | 1978/04/03 | 14:34 | 7 | 3.1 | R | [81] |
| 23 | 1978/12/02 | 04:05 | 0.6 | 3.5 | R-SS | [81] |
| 24 | 1981/08/30 | 23:30 | 9.7 | 3.9 | R-SS | [4] |
| 25 | 1983/02/10 | 22:30 | 15.1 | 4.2 | R | [40] |
| 26 | 1983/12/20 | 08:26 | 4.6 | 3.4 | R-SS | [40] |
| 27 | 1991/10/05 | 05:14 | 19.5 | 3.8 | R | [40] |
| 28 | 1991/10/05 | 14:56 | 10.9 | 3.1 | R-SS | [4] |
| 29 | 1995/07/25 | 11:53 | 8.1 | 3 | R | [40] |
| 30 | 1996/12/22 | 03:49 | 8.1 | 3.2 | R-SS | [40] |
| 31 | 1997/12/09 | 01:36 | 8.3 | 3.1 | R | [40] |
| 32 | 2002/07/06 | 08:30 | 11.4 | 3.5 | R-SS | [40] |
| 33 | 2006/08/11 | 01:35 | 11.6 | 3.1 | R | [40] |
| 34 | 2017/03/23 | 13:11 | 12.9 | 3.1 | SS-R | [40] |
| 35 | 2018/05/09 | 21:48 | 7.3 | 3.7 | R | [95] |
| 36 | 2018/11/10 | 07:59 | 10.5 | 3 | R | [95] |
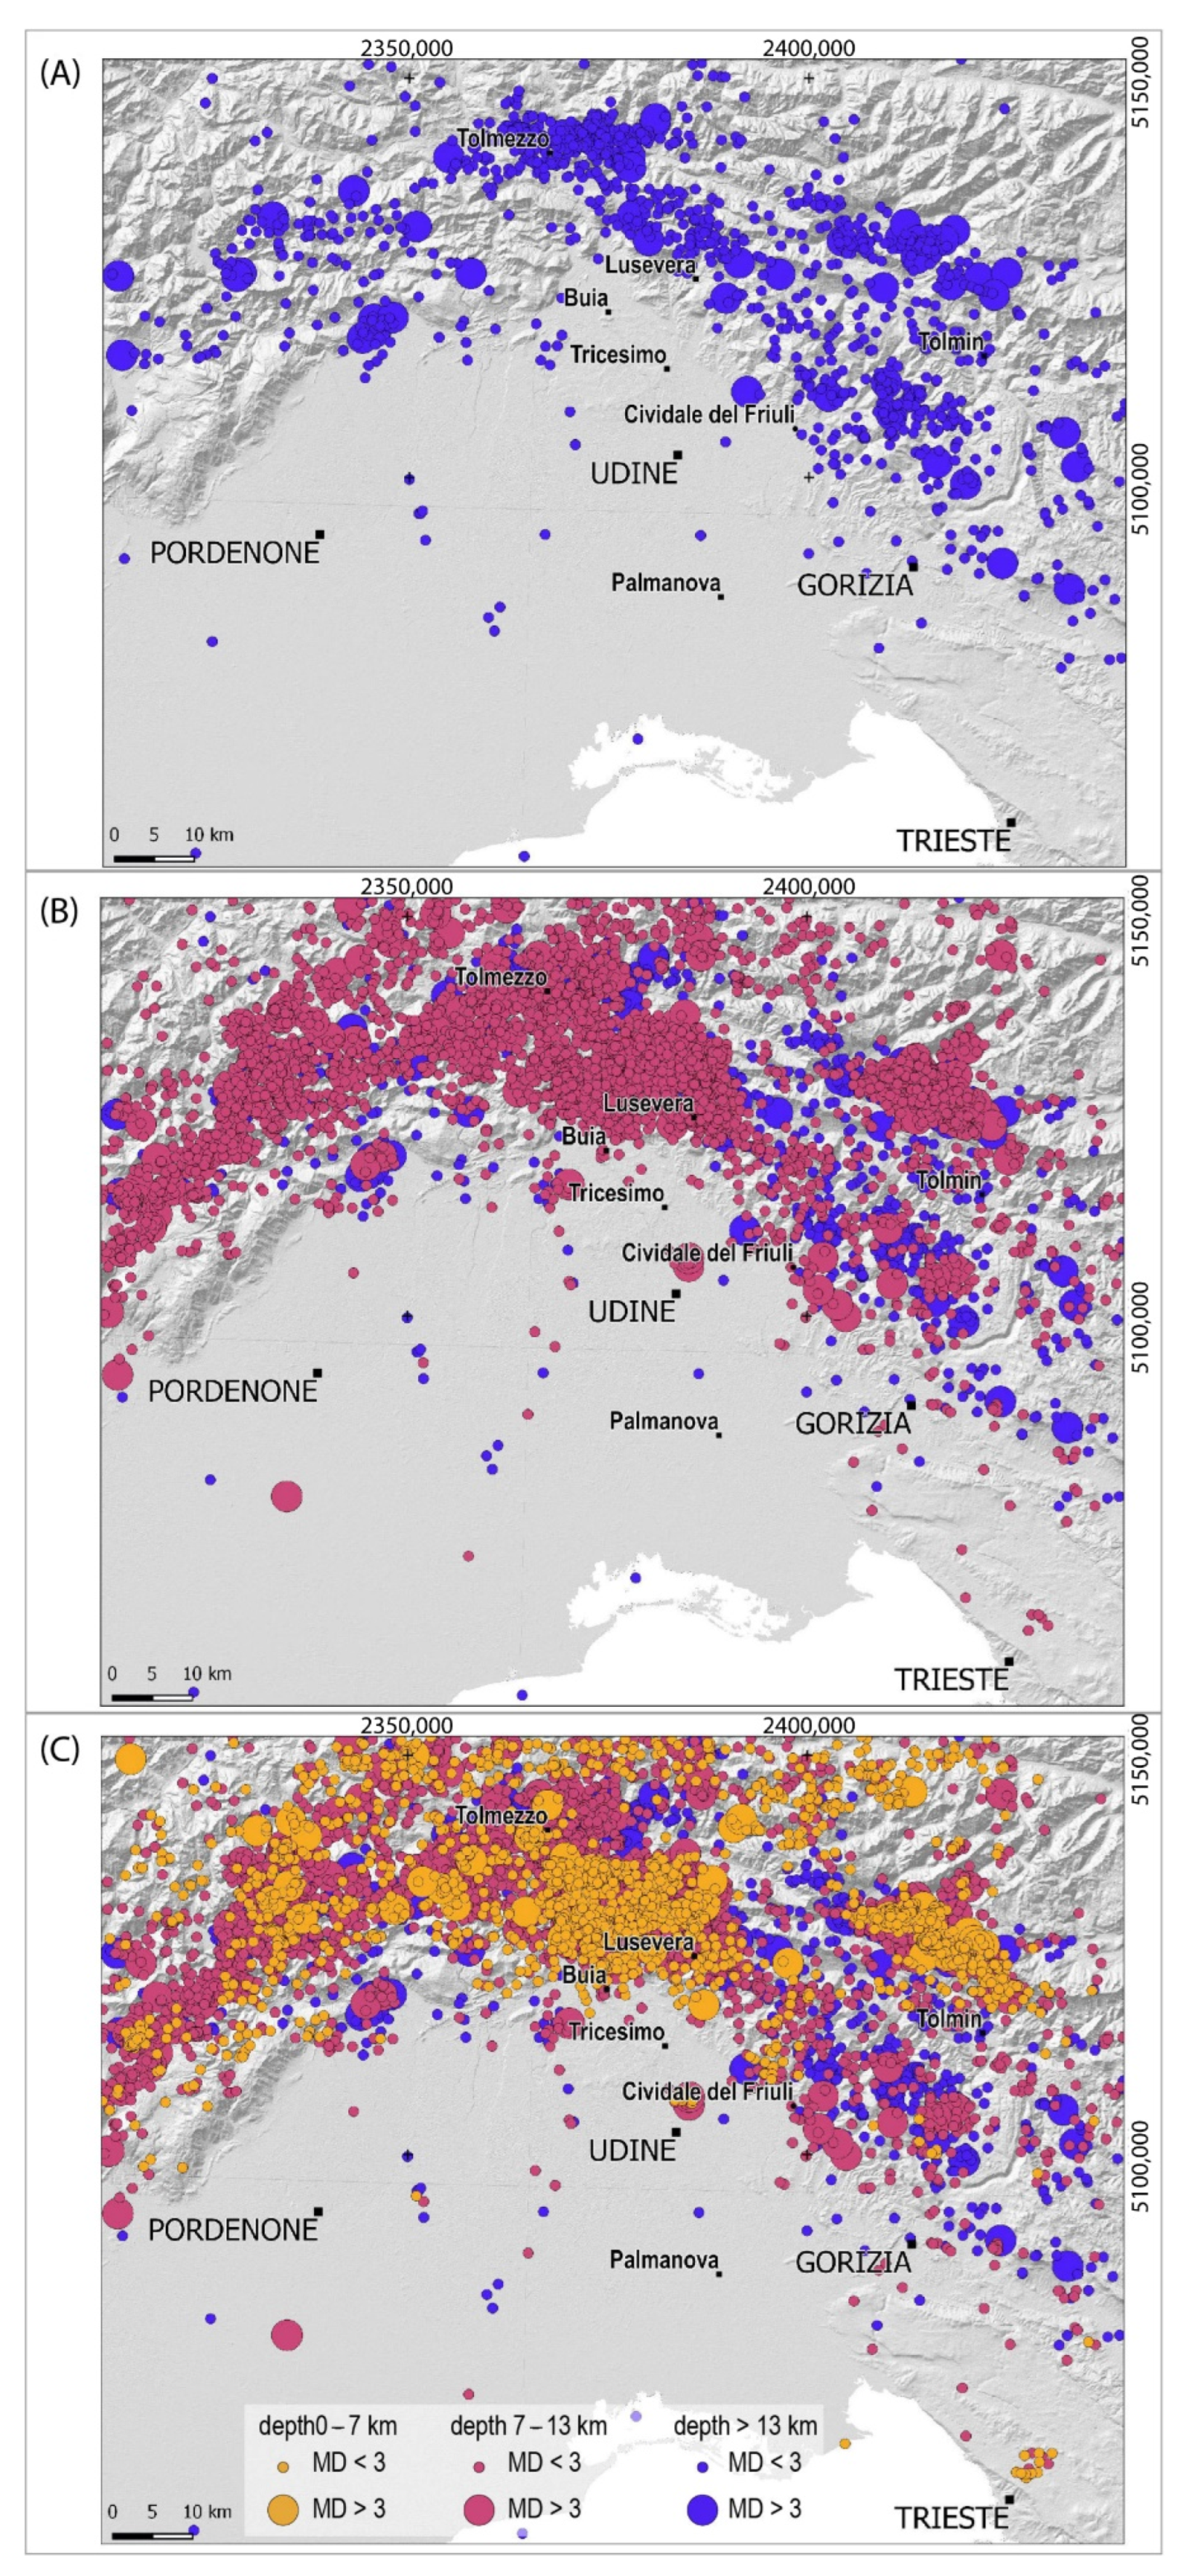
4.2.2. The 1978–2019 Seismicity
5. Discussion
6. Conclusions
- The seismogenesis of the area is strongly defined by the structural inheritance, especially in terms of structural complexities representing the product of the combined effect of the Paleogene Dinaric orogeny and the late Miocene–Pliocene neo-Alpine compression;
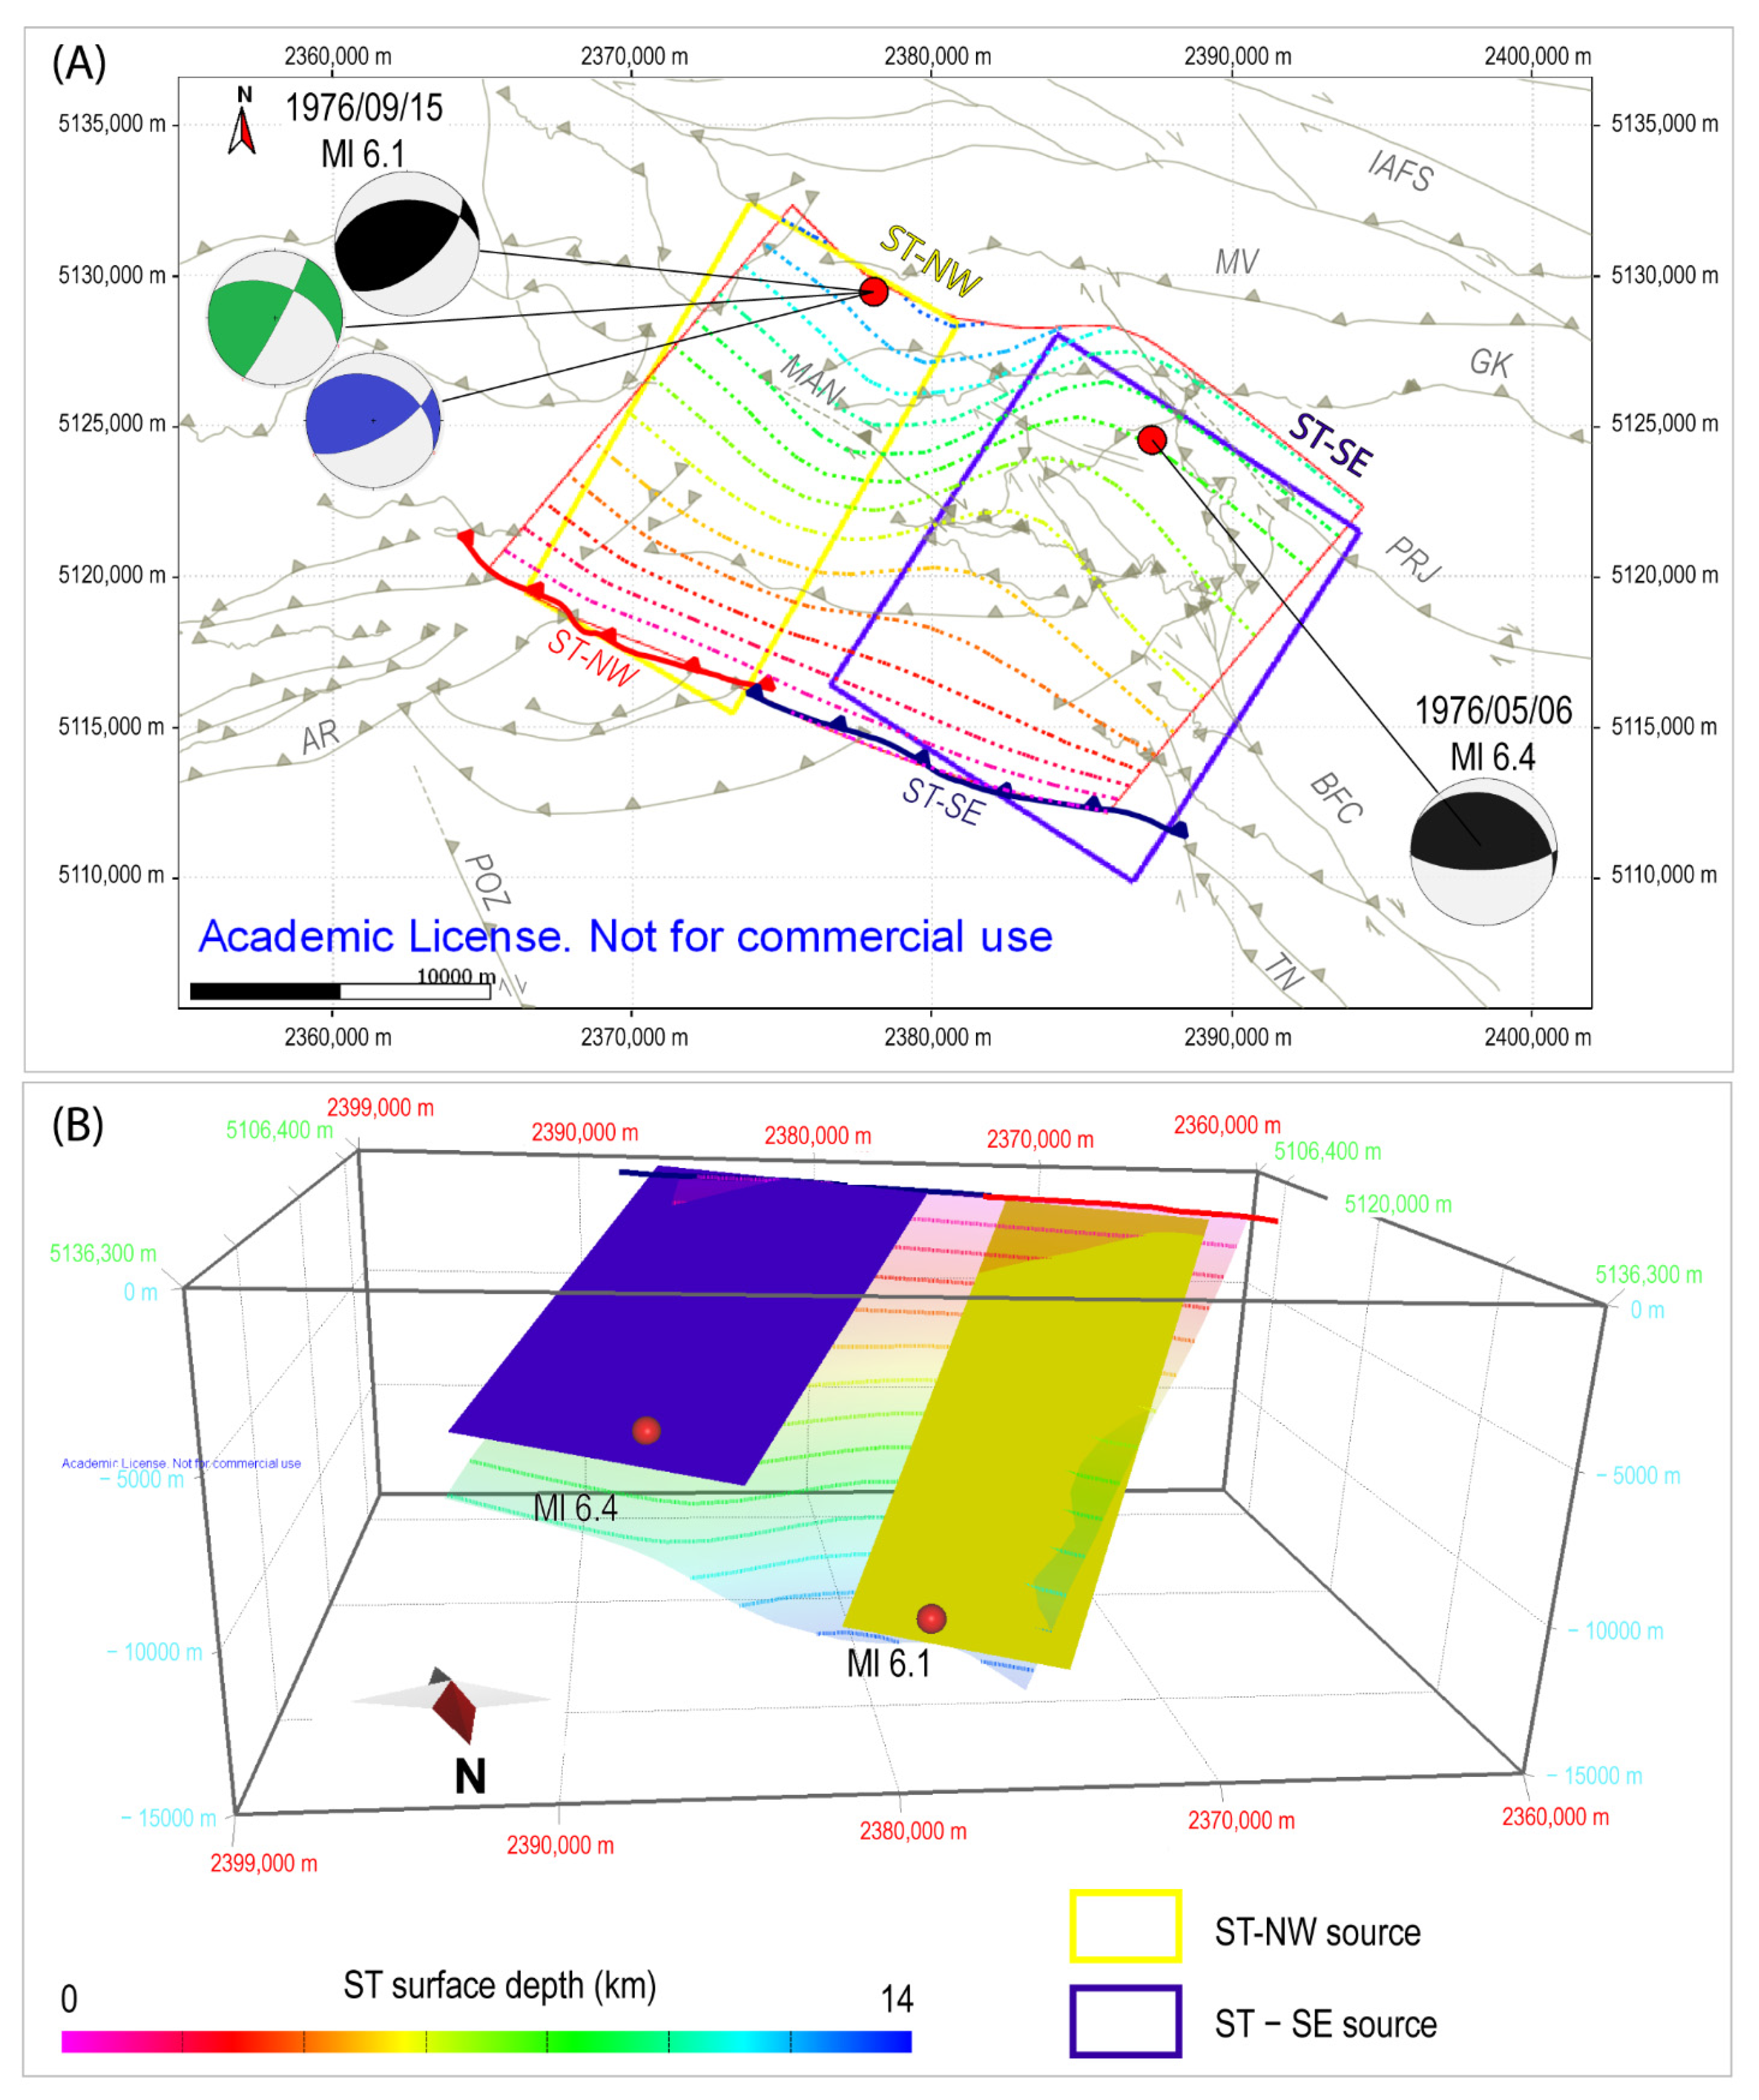
- Because of its deep structural complexity, the polyphasic Susans–Tricesimo masterfault is likely segmented into two distinct seismogenic sources (ST-SE and ST-NW);
- The northwestward-propagating dextral transpressive fault systems of western Slovenia are affecting the inherited thrusts, and the Dinaric trending transpressive fault segments strongly control the strain accommodation in the central Friuli area, as already remarked by [29,30]. In this context, the possibility that the 15 September 1976 mainshock was induced by a transpressive source, corresponding at the surface with the Maniaglia fault, is not excluded. While regarding the mainshock of 6 May 1976, the southeastern segment of ST was likely triggered by the Predjama fault, as testified by the Coulomb stress analysis (Supplementary Material S3);
- The activation of the Buia thrust during the strongest events of 1976 is ruled out, and the involvement of the Gemona–Kobarid and Musi–Verzegnis thrusts is reduced, as confirmed by [8].
Supplementary Materials
Author Contributions
Funding
Data Availability Statement
Acknowledgments
Conflicts of Interest
References
- Rovida, A.; Locati, M.; Camassi, R.; Lolli, B.; Gasperini, P.; Antonucci, A. Catalogo Parametrico dei Terremoti Italiani (CPTI15); Versione 4.0; Istituto Nazionale di Geofisica e Vulcanologia: Rome, Italy, 2022. [Google Scholar] [CrossRef]
- Serpelloni, E.; Vannucci, G.; Anderlini, L.; Bennet, R.A. Kinematics, seismotectonics and seismic potential of the eastern sector of the European Alps from GPS and seismic deformation data. Tectonophysics 2016, 688, 157–181. [Google Scholar] [CrossRef]
- Galadini, F.; Poli, M.E.; Zanferrari, A. Seismogenic sources potentially responsible for earthquakes with M ≥ 6 in the eastern Southern Alps (Thiene-Udine sector, NE Italy). Geophys. J. Int. 2005, 161, 739–762. [Google Scholar] [CrossRef] [Green Version]
- Poli, M.E.; Renner, G. Normal focal mechanisms in the Julian Alps and Prealps seismotectonic implications for the Italian-Slovenian border region. Boll. Geof. Teor. Appl. 2004, 45, 51–69. [Google Scholar]
- Vrabec, M.; Fodor, L. Late Cenozoic tectonics of Slovenia: Structural styles at the Northeastern corner of the Adriatic microplate. In The Adria Microplate: GPS Geodesy, Tectonics and Hazards; Springer: Dordrecht, The Netherlands, 2006; pp. 151–168. [Google Scholar]
- Moulin, A.; Benedetti, L.; Rizza, M.; Rupnik, P.J.; Gosar, A.; Bourlès, D.; Keddadouche, K.; Aumaitre, G.; Arnold, M.; Gçuillou, V.; et al. The Dinaric fault system: Large-scale structure, rates of slip, and Plio-Pleistocene evolution of the transpressive northeastern boundary of the Adria microplate. Tectonics 2016, 35, 2258–2292. [Google Scholar] [CrossRef] [Green Version]
- Atanackov, J.; Jamšek Rupnik, P.; Jež, J.; Celarc, B.; Novak, M.; Milanič, B.; Markelj, A.; Bavec, M.; Kastelic, V. Database of Active Faults in Slovenia: Compiling a New Active Fault Database at the Junction Between the Alps, the Dinarides and the Pannonian Basin Tectonic Domains. Front. Earth Sci. 2021, 9, 151. [Google Scholar] [CrossRef]
- Turrini, C.; Angeloni, P.; Lacombe, O.; Ponton, M.; Roure, F. Three-dimensional seismo-tectonics in the Po Valley basin, Northern Italy. Tectonophysics 2015, 661, 156–179. [Google Scholar] [CrossRef] [Green Version]
- Saraò, A.; Sugan, M.; Bressan, G.; Renner, G.; Restivo, A. A focal mechanism catalogue of earthquakes that occurred in the southeastern Alps and surrounding areas from 1928–2019. Earth Syst. Sci. Data 2021, 13, 2245–2258. [Google Scholar] [CrossRef]
- Guidoboni, E.; Ferrari, G.; Tarabusi, G.; Sgattoni, G.; Comastri, A.; Mariotti, D.; Ciuccarelli, C.; Bianchi, M.G.; Valensise, G. CFTI5Med, the new release of the catalogue of strong earthquakes in Italy and in the Mediterranean area. Sci. Data 2019, 6, 80. [Google Scholar] [CrossRef]
- Slejko, D. What science remains of the 1976 Friuli earthquake? Boll. Geof. Teor. Appl. 2018, 59, 327–350. [Google Scholar] [CrossRef]
- Rebez, A.; Cecić, I.; Renner, G.; Sandron, D.; Slejko, D. Misunderstood “forecasts”: Two case histories from former Yugoslavia and Italy. Boll. Geof. Teor. Appl. 2018, 59, 481–504. [Google Scholar] [CrossRef]
- OGS-CRS: Friuli Venezia Giulia Seismometric Network Bulletin. Available online: http://www.crs.inogs.it/bollettino/RSFVG/RSFVG.en.html (accessed on 15 December 2021).
- Roeder, D. South-Alpine thrusting and trans-Alpine convergence. In Alpine Tectonics; Coward, M.P., Dietrich, D., Park, R.G., Eds.; Geological Society, Special Publications: London, UK, 1989; Volume 45, pp. 211–227. [Google Scholar]
- Castellarin, A.; Nicolich, R.; Fantoni, R.; Cantelli, L.; Sella, M.; Selli, L. Structure of the lithosphere beneath the Eastern Alps (southern sector of the TRANSALP transect). Tectonophysics 2006, 414, 259–282. [Google Scholar] [CrossRef]
- Doglioni, C.; Bosellini, A. Eoalpine and mesoalpine tectonics in the Southern Alps. Geol. Rundsch. 1987, 76, 735–754. [Google Scholar] [CrossRef]
- Castellarin, A.; Cantelli, L.; Fesce, A.M.; Mercier, J.L.; Picotti, V.; Pini, G.A.; Prosser, G.; Selli, L. Alpine compressional tectonics in the Southern Alps. Relationships with the N-Apennines. Ann. Tecton. 1992, 6, 62–94. [Google Scholar]
- Fantoni, R.; Catellani, D.; Merlini, S.; Rogledi, S.; Venturini, S. La registrazione degli eventi deformativi cenozoici nell’avampaese Veneto-Friulano. Mem. Soc. Geol. Ital. 2002, 57, 301–313. [Google Scholar]
- Monegato, G.; Stefani, C.; Zattin, M. From present rivers to old terrigenous sediments: The evolution of the drainage system in the eastern Southern Alps. Terra Nova 2010, 22, 218–226. [Google Scholar] [CrossRef]
- Castellarin, A.; Cantelli, L. Neo-Alpine evolution of the Southern Eastern Alps. J. Geodyn. 2000, 30, 251–274. [Google Scholar] [CrossRef]
- Caputo, R.; Poli, M.E.; Zanferrari, A. Neogene-Quaternary stratigraphy of the eastern Southern Alps, NE Italy. J. Struct. Geol. 2010, 32, 1009–1027. [Google Scholar] [CrossRef]
- Toscani, G.; Marchesini, A.; Barbieri, C.; Di Giulio, A.; Fantoni, R.; Mancin, N.; Zanferrari, A. The Friulian-Venetian Basin I: Architecture and sediment flux into a shared foreland basin. Ital. J. Geosci. 2016, 135, 444–459. [Google Scholar] [CrossRef]
- Massari, F.; Grandesso, P.; Stefani, C.; Jobstraibizer, P.G. A small polyhistory basin evolving in a context of oblique convergence: The Venetian basin (Chattian to Recent, Southern Alps, Italy). In Foreland Basins; Allen, P.A., Homewood, P., Eds.; Blackwell Scientific: Oxford, UK, 1986; pp. 141–168. [Google Scholar]
- Venturini, C. Cinematica neogenico-quaternaria del Sudalpino orientale (settore friulano). Studi Geol. Cam. 1990, 1990, 109–116. [Google Scholar]
- Monegato, G. Le Successioni Conglomeratiche Messiniano-Pleistoceniche nel Bacino del Fiume Tagliamento. Ph.D. Thesis, University of Udine, Udine, Italy, 2006. [Google Scholar]
- Caputo, R. The polyphase tectonics of eastern Dolomites, Italy. Mem. Di Sci. Geol. 1996, 48, 93–106. [Google Scholar]
- Zanferrari, A.; Masetti, D.; Monegato, G.; Poli, M.E. Geological Map and Explanatory Notes of the Geological Map of Italy at the Scale 1:50.000: Sheet 049 “Gemona del Friuli”. ISPRA—Servizio Geologico d’Italia—Regione Autonoma Friuli Venezia Giulia. 2013; p. 262. Available online: www.isprambiente.gov.it/Media/carg/friuli.html (accessed on 10 January 2022).
- Márton, E.; Cosovic, V.; Drobne, K.; Moro, A. Palaeomagnetic evidence for Tertiary counterclockwise rotation of Adria. Tectonophysics 2003, 377, 143–156. [Google Scholar] [CrossRef]
- Poli, M.E.; Zanferrari, A. The seismogenic sources of the 1976 Friuli earthquakes: A new seismotectonic model for the Friuli area. Boll. Geof. Teor. Appl. 2018, 59, 463–480. [Google Scholar] [CrossRef]
- Falcucci, E.; Poli, M.E.; Galadini, F.; Scardia, G.; Paiero, G.; Zanferrari, A. First evidence of active transpressive surface faulting at the front of the Eastern Southern Alps, northeastern Italy. Insight on the 1511 earthquake seismotectonics. Solid Earth 2018, 9, 911–922. [Google Scholar] [CrossRef] [Green Version]
- Patricelli, G.; Poli, M.E. Quaternary tectonic activity in the north-eastern Friuli Plain (NE Italy). Boll. Geof. Teor. Appl. 2020, 61, 309–332. [Google Scholar] [CrossRef]
- Poljak, M.; Živčić, M.; Zupančič, P. The seismotectonic characteristics of Slovenia. In Seismic Hazard of the Circum-Pannonian Region; Birkhäuser: Basel, Switzerland, 2000; pp. 37–55. [Google Scholar]
- Kastelic, V.; Vrabec, M.; Cunningham, D.; Gosar, A. Neoalpine structural evolution and present day tectonic activity of the eastern Southern Alps: The case of the Raune fault, NW Slovenia. J. Struct. Geol. 2008, 30, 963–965. [Google Scholar] [CrossRef]
- Moulin, A.; Benedetti, L.; Gosar, A.; Rupnik, P.J.; Rizza, M.; Bourlès, D.; Ritz, J. Determining the present-day kinematics of the Idrija fault (Slovenia) from aiborne LiDAR topography. Tectonophysics 2014, 628, 188–205. [Google Scholar] [CrossRef]
- Bechtold, M.; Battaglia, M.; Tanner, D.C.; Zuliani, D. Constraints on the active tectonics of the Friuli/NW Slovenia area from CGPS measurements and three-dimensional kinematic modeling. J. Geophys. Res. 2009, 114. [Google Scholar] [CrossRef] [Green Version]
- Devoti, R.; Esposito, A.; Pietrantonio, G.; Pisani, A.R.; Riguzzi, F. Evidence of large scale deformation patterns from GPS data in the Italian subduction boundary. Earth Planet. Sci. Lett. 2011, 311, 230–241. [Google Scholar] [CrossRef]
- Cheloni, D.; D’Agostino, N.; D’Anastasio, E.; Selvaggi, G. Reassessment of the source of the 1976 Friuli, NE Italy, earthquake sequence from the joint inversion of high-precision levelling and triangulation data. Geophys. J. Int. 2012, 190, 1279–1294. [Google Scholar] [CrossRef] [Green Version]
- Grützner, C.; Aschenbrenner, S.; Rupnik, P.J.; Reicherter, K.; Saifelislam, N.; Včič, B.; Vrabec, M.; Welte, J.; Ustaszewski, K. Holocene surface rupturing earthquakes on the Dinaric Fault System, western Slovenia. Solid Earth 2021, 12, 2211–2234. [Google Scholar] [CrossRef]
- OGS-CRS: Friuli Venezia Giulia Seismometric Network. Available online: http://rts.crs.inogs.it/ (accessed on 15 December 2021).
- Bressan, G.; Barnaba, C.; Bragato, P.; Ponton, M.; Restivo, A. Revised seismotectonic model of NE Italy and W Slovenia based on focal mechanism inversion. J. Seismol. 2018, 22, 1563–1578. [Google Scholar] [CrossRef]
- Camassi, R.; Caracciolo, C.H.; Castelli, V.; Slejko, D. The 1511 Eastern Alps earthquakes: A critical update and comparison of existing macroseismic datasets. J. Seismol. 2011, 15, 191–213. [Google Scholar] [CrossRef] [Green Version]
- Fitzko, F.; Suhadolc, P.; Aoudia, A.; Panza, G.F. Constraints on the location and mechanism of the 1511 Western-Slovenia earthquake from active tectonics and modeling of macroseismic data. Tectonophys 2005, 404, 77–90. [Google Scholar] [CrossRef]
- Ribaric, V. The Idrija earthquake of March 26, 1511. A reconstruction of some seismological parameters. Tectonophys 1979, 53, 315–324. [Google Scholar] [CrossRef]
- Bavec, M.; Atanackov, J.; Celarc, B.; Hajdas, I.; Jamšek, R.; Jež, J.; Kastelic, V.; Milanič, B.; Novak, M.; Skaberne, G.; et al. Evidence of Idrija fault seismogenic activity during the Late Holocene including the 1511 Mm 6.8 earthquake. In Proceedings of the 4th International INQUA Meeting on Paleoseismology, Active Tectonics and Archeoseismology (PATA), Aachen, Germany, 9–15 October 2013; Grützner & Reicherter Geosolutions: Aachen, Germany; pp. 23–26. [Google Scholar]
- Steinhauser, P.; Lenhardt, W. Interpretation of crustal deformations in the Friuli area for the earthquake of 1976. Gerlands Beitr. Geophys. 1986, 95, 459–467. [Google Scholar]
- Talamo, R.; Pampaloni, M.; Grassi, S. Risultati delle misure di livellazione di alta precisione eseguite dall’Istituto Geografico Militare nelle zone del Friuli interessate dalle recenti attività sismiche. Boll. Geod. Sci. Aff. 1978, 1, 6–75. [Google Scholar]
- IGM-RG. Relazione sui Lavori di Triangolazione Eseguiti nel Friuli dall’Istituto Geografico Militare Nell’anno 1977; Reparto Geodetico: Firenze, Italy, 1978. [Google Scholar]
- Amato, A.; Barnaba, P.F.; Finetti, I.; Groppi, G.; Martins, B.; Muzzin, A. Geodynamic outline and seismicity of Friuli Venetia Julia region. Boll. Geof. Teor. Appl. 1976, 18, 217–256. [Google Scholar]
- Aoudia, A.; Saraò, A.; Bukchin, B.; Suhadolc, P. The 1976 Friuli (NE Italy) thrust faulting earthquake: A reappraisal 23 years later. Geophys. Res. Lett. 2000, 27, 573–576. [Google Scholar] [CrossRef]
- Poli, M.E.; Peruzza, L.; Rebez, A.; Renner, G.; Slejko, D.; Zanferrari, A. New seismotectonic evidence from the analysis of the 1976-1977 and 1977-1999 seismicity in Friuli (NE Italy). Boll. Geof. Teor. Appl. 2002, 43, 53–78. [Google Scholar]
- Pondrelli, S.; Ekström, G.; Morelli, A. Seismotectonic re-evaluation of the 1976 Friuli, Italy, seismic sequence. J. Seismol. 2001, 5, 73–83. [Google Scholar] [CrossRef]
- Bernardis, G.; Poli, M.E.; Snidarcig, A.; Zanferrari, A. Seismotectonic and macroseismic characteristics of the earthquake of Bovec (NW Slovenia: April 12, 1998). Boll. Geof. Teor. Appl. 2000, 41, 133–148. [Google Scholar]
- Bajc, J.; Aoudia, A.; Saraò, A.; Suhadolc, P. The 1998 Bovec-Krn mountain (Slovenia) earthquake sequence. Geophys. Res. Lett. 2001, 28, 1839–1842. [Google Scholar] [CrossRef]
- Zupancîč, P.; Cecić, I.; Gosar, A.; Placer, L.; Poljak, M.; Živčić, M. The earthquake of 12 April 1998 in the Krn Mountains (Upper Soča valley, Slovenia) and its seismotectonic charcteristics. Geologija 2001, 44, 169–192. [Google Scholar] [CrossRef]
- Živčić, M.; Krn-2004 team. The Krn mountains (Slovenia) Mw 5.2 earthquake: Data acquisition and preliminary results. Geoph. Res. Abstr. 2006, 8, 06439. [Google Scholar]
- Zanferrari, A.; Avigliano, R.; Monegato, G.; Paiero, G.; Poli, M.E.; Stefani, C. Geological Map and Explanatory Notes of the Geological Map of Italy at the Scale 1:50.000: Sheet 066 “Udine”. APAT—Servizio Geologico d’Italia—Regione Autonoma Friuli Venezia Giulia 2008. 176p. Available online: www.isprambiente.gov.it/Media/carg/friuli.html (accessed on 10 January 2022).
- Mancin, N.; Barbieri, C.; Di Giulio, A.; Fantoni, R.; Marchesini, A.; Toscani, G.; Zanferrari, A. The Friulian-Venetian Basin II: Paleogeographic evolution and subsidence analysis from micropaleontological constraints. Ital. J. Geosci. 2016, 135, 460–473. [Google Scholar] [CrossRef]
- Cousin, M. Les rapports Alpes-Dinarides. Les confines de l’Italie et de la Yugoslavie. Soc. Géol. Nord 1981, 5, 521. [Google Scholar]
- Sartorio, D.; Tunis, G.; Venturini, S. Nuovi contributi per l’interpretazione geologica e paleogeografica delle Prealpi Giulie (Friuli orientale): Il pozzo SPAN1. Riv. Ital. Paleont. Strat. 1987, 93, 181–200. [Google Scholar]
- Cati, A.; Sartorio, D.; Venturini, S. Carbonate platforms in the subsurface of the northern Adriatic area. Mem. Soc. Geol. Ital. 1987, 40, 295–308. [Google Scholar]
- Tentor, M.; Tunis, G.; Venturini, S. Schema stratigrafico e tettonico del Carso Isontino. Nat. Nascosta 1994, 9, 1–32. [Google Scholar]
- Venturini, S. Il pozzo Cargnacco 1: Un punto di taratura stratigrafica nella pianura friulana. Mem. Soc. Geol. Ital. 2002, 57, 11–18. [Google Scholar]
- Sartorio, D.; Tunis, G.; Venturini, S. The Iudrio valley section and the evolution of the northeastern margin of the Friuli Platform (Julian Prealps, NE Italy-W Slovenia). Mem. Soc. Geol. Ital. 1997, 49, 163–193. [Google Scholar]
- Tunis, G.; Venturini, S. Evolution of the Southern margin of the Julian Basin with emphasis on the megabeds and turbidites sequence of the Southern Julian Prealps (NE Italy). Geol. Croat. 1992, 45, 127–150. [Google Scholar]
- Martinis, B. Ricerche geologiche e paleontologiche nella regione compresa tra il fiume Judrio e il fiume Timavo (Friuli orientale). Riv. Ital. Pal. Strat. Mem. 1962, 8, 244. [Google Scholar]
- Tunis, G.; Venturini, S. Geologia dei colli di Scriò, Dolegna e Ruttars (Friuli orientale): Precisazioni sulla stratigrafia e sul significato paleoambientale del Flysch di Cormons. Gortania 1989, 11, 5–24. [Google Scholar]
- Venturini, S.; Tunis, G. New stratigraphical, paleoenvironmental and tectonic data of the Flysch di Cormons (Eastern Friuli). Gortania Atti Museo Friul. Storia Nat. 1992, 13, 5–30. [Google Scholar]
- Stefani, C. Sedimentologia della molassa delle Prealpi Carniche occidentali. Mem. Soc. Geol. Ital. 1984, 36, 427–442. [Google Scholar]
- Mellere, D.; Stefani, C.; Angevine, C. Polyphase tectonics through subsidence analysis: The Oligo-Miocene Venetian and Friuli Basin, north-east Italy. Basin Res. 2000, 12, 159–182. [Google Scholar] [CrossRef]
- Zanferrari, A.; Avigliano, R.; Grandesso, P.; Monegato, G.; Paiero, G.; Poli, M.E.; Stefani, C. Geological Map and Explanatory Notes of the Geological Map of Italy at the Scale 1:50.000: Sheet 065 “Maniago”. APAT—Servizio Geologico d’Italia—Regione Autonoma Friuli Venezia Giulia 2008. 224p. Available online: www.isprambiente.gov.it/Media/carg/friuli.html (accessed on 20 September 2021).
- Fontana, A.; Monegato, G.; Rossato, S.; Poli, M.E.; Furlani, S.; Stefani, C. Carta delle Unità Geologiche Della Pianura del Friuli Venezia Giulia Alla Scala 1:150.000; Regione Autonoma Friuli Venezia Giulia; Direzione centrale ambiente ed energia, Servizio Geologico: Trieste, Italy, 2019. [Google Scholar]
- Venturini, C.; Discenza, K. Stratigrafia e paleo-idrografia del Friuli centrale (Prealpi Carniche): Miocene superiore-Pliocene inferiore. Gortania Geol. Paleontol. Planetol. 2009, 31, 31–52. [Google Scholar]
- Monegato, G.; Vezzoli, G. Post-Messinian drainage changes triggered by tectonic and climatic events (eastern Southern Alps, Italy). Sediment. Geol. 2011, 239, 188–198. [Google Scholar] [CrossRef]
- Sandron, D.; Renner, G.; Rebez, A.; Slejko, D. Early instrumental seismicity recorded in the eastern Alps. Boll. Geofis. Teor. Appl. 2014, 55, 755–788. [Google Scholar] [CrossRef]
- Sitaram, M.V.D.; Borah, P.K. Signal durations and local Richter magnitudes in northeast India: An empirical approach. J. Geol. Soc. India 2007, 70, 323–338. [Google Scholar]
- Richter, C.F. Elementary Seismology; W.H. Freeman and Company: San Francisco, CA, USA, 1958; pp. 136–139. [Google Scholar]
- Gutenberg, B.; Richter, C.F. Earthquake magnitude, intensity, energy, and acceleration. Bull. Seismol. Soc. Am. 1956, 46, 105–145. [Google Scholar] [CrossRef]
- Merlini, S.; Doglioni, C.; Fantoni, R.; Ponton, M. Analisi strutturale lungo un profilo geologico fra la linea Fella-Sava e l’avampaese adriatico (Friuli Venezia Giulia–Italia). Mem. Soc. Geol. Ital. 2002, 57, 293–300. [Google Scholar]
- Monegato, G.; Stefani, C. Preservation of a long-lived fluvial system in a mountain chain: The Tagliamento Valley (southeastern Italian Alps). In From River to Rock Record: The Preservation of Fluvial Sediments and Their Subsequent Interpretation Davidson; Davidson, S.K., Leleu, S., North, C.P., Eds.; SEPM Special Publications: Broken Arrow, OK, USA, 2011; Volume 97, pp. 359–374. [Google Scholar]
- Lavecchia, G.; Ferrarini, F.; de Nardis, R.; Visini, F.; Barbano, M.S. Active thrusting as a possible seismogenic source in Sicily (Southern Italy): Some insights from integrated structural-kinematic and seismological data. Tectonophysics 2007, 445, 145–167. [Google Scholar] [CrossRef]
- Slejko, D.; Neri, G.; Orozova, I.; Renner, G.; Wyss, M. Stress field in Friuli (NE Italy) from fault plane solutions of activity following the 1976 main shock. Bull. Seismol. Soc. Am. 1999, 89, 1037–1052. [Google Scholar]
- Álvarez-Gómez, J.A. FMC-Earthquake focal mechanisms data management, cluster and classification. SoftwareW 2019, 9, 299–307. [Google Scholar] [CrossRef]
- Colautti, D.; Finetti, I.; Nieto, D.; Pupis, C.; Russi, M.; Slejko, D.; Suhadolc, P. Epicenter distribution and analysis of 1976 earthquakes and aftershocks of Friuli. Boll. Geof. Teor. Appl. 1976, 18, 457–548. [Google Scholar]
- Finetti, I.; Giorgetti, F.; Haessler, H.; Hoang Trong, P.; Slejko, D.; Wittlinger, G. Time space epicenter and hypocenter distribution and focal mechanism of 1976 Friuli earthquakes. Boll. Geof. Teor. Appl. 1976, 18, 637–655. [Google Scholar]
- Cagnetti, V.; Console, R. Space-time distribution of the Friuli (1976) earthquake. Ann. Geofis. 1977, 30, 107–183. [Google Scholar]
- Wittlinger, G.; Haessler, H.; Hoang Trong, P. Contribution to the near field study of the aftershocks of the earthquakes on May 6th and September 15th 1976 in Friuli (Italy). In Proceedings of the Special Meeting on the 1976 Friuli Earthquake and the Antiseismic Design of Nuclear Installation CNEN, Rome, Italy, 11–13 October 1977; pp. 148–164. [Google Scholar]
- Anderson, H.; Jackson, J. Active tectonics of the Adriatic region. Geophys. J. Int. 1987, 91, 937–983. [Google Scholar] [CrossRef]
- Ebblin, C. Orientation of stresses and strains in the piedmont area of eastern Friuli, NE Italy. Boll. Geof. Teor. Appl. 1976, 18, 559–579. [Google Scholar]
- Chiarabba, C.; De Gori, P. The seismogenic thickness in Italy: Constraints on potential magnitude and seismic hazard. Terra Nova 2016, 28, 402–408. [Google Scholar] [CrossRef]
- Placer, L.; Vrabec, M.; Celarc, B. The bases for understanding of the NW Dinarides and Istria Peninsula tectonics. Geologija 2010, 53/1, 55–86. [Google Scholar] [CrossRef]
- Venturini, S. Nuovi dati sul Tortoniano del sottosuolo della Pianura Friulana. Gortania Atti Del Mus. Friul. Di Stor. Nat. 1987, 9, 5–16. [Google Scholar]
- Venturini, S.; Tunis, G. Nuovi dati ed interpretazioni sulla tettonica del settore delle prealpi Giulie e della regione ai confini fra Italia e Iugoslavia. Gortania Atti Mus. Friul. Stor. Nat. 1989, 10, 5–34. [Google Scholar]
- Carulli, G.B. Carta geologica del Friuli Venezia Giulia alla scala 1:150000. Regione Autonoma Friuli Venezia Giulia—Direzione centrale ambiente ed energia—Servizio Geologico 2006, S.E.L.C.A. Firenze.
- Ponton, M. Analisi strutturale profonda delle Dinaridi Esterne fra Alpi e Prealpi Giulie (Italia e Slovenia). Gortania Geol. Paleontol. Planetol. 2014, 36, 23–34. [Google Scholar]
- Sugan, M.; Renner, G.; Bressan, G.; Restivo, A.; Saraò, A. First motion data and focal mechanism solutions of 108 earthquakes occurred between 1928 and 2019 in the Southeastern Alps. Zenodo 2020. [Google Scholar] [CrossRef]
- Burrato, P.; Poli, M.E.; Vannoli, P.; Zanferrari, A.; Basili, R.; Galadini, F. Sources of MW 5+ earthquakes in north eastern Italy and western Slovenia: An updated view based on geological and seismological evidence. Tectonophys 2008, 453, 157–176. [Google Scholar] [CrossRef]
- Ramsay, J.G. Interference Patterns Produced by the Superposition of Folds of Similar Type. J. Geol. 1962, 70, 466–481. [Google Scholar] [CrossRef]
- Feruglio, E. Le Prealpi fra l’Isonzo e l’Arzino. Boll. Assoc. Agrar. Friuli 1925, 7, 302. [Google Scholar]
- Bosellini, A.; Sarti, M. Geologia del gruppo M. Cuar―M. Covria (Prealpi Carniche). G. Di Geol. 1978, 43, 47–88. [Google Scholar]
- Ponton, M. Un’area polideformata nelle Prealpi carniche: Il Monte Broili e il Cuel dal Meloc. Gortania Atti Mus. Friul. St. Nat. 2007, 28, 7–18. [Google Scholar]
- Ponton, M.; Tunis, G. La geologia del massiccio dei Monti la Bernadia (Prealpi Giulie). In Il Fenomeno Carsico Del Massiccio Dei Monti la Bernadia; Mem. Ist. Ital. Speleol, s II; Muscio, G., Ed.; Istituto Italiano di Speleologia: Trieste, Italy, 1996; Volume 8, pp. 36–48. [Google Scholar]
- Poli, M.E. Il massiccio carbonatico della Bernadia nelle Prealpi Giulie (Friuli, Italia NE): La registrazione di eventi tettonici tra il Cretacico superiore e il Quaternario. Rend. Online Soc. Geol. Ital. 2008, 2, 1–3. [Google Scholar]
- Poli, M.E. La carta geologica del Massiccio della Bernadia (Prealpi Giulie meridionali, Friuli, Italia NE). Rend. Online Soc. Geol. Ital. 2009, 5, 168–171. [Google Scholar]
- King, G.C.P.; Stein, R.S.; Lin, J. Static stress changes and the triggering of earthquakes. Bull. Seismol. Soc. Am. 1994, 84, 935–953. [Google Scholar]
- Freed, T.G. Earthquake triggering by static, dynamic, and post-seismic stress transfer. Annu. Rev. Earth Planet Sci. 2005, 33, 335–367. [Google Scholar] [CrossRef] [Green Version]
- Wells, D.L.; Coppersmith, K.J. New empirical relationships among magnitude, rupture length, rupture width, rupture area, and surface displacement. Bull. Seism. Soc. Am. 1994, 84, 974–1002. [Google Scholar]
- Lin, J.; Stein, R.S. Stress triggering in thrusts and subduction earthquakes, and stress interaction between the southern San Andreas and nearby thrust and strike-slip faults. J. Geophys. Res. 2004, 109. [Google Scholar] [CrossRef] [Green Version]
- Perniola, B.; Bressan, G.; Pondrelli, S. Changes in failure stress and stress transfer during the 1976–1977 Friuli earthquake sequence. Geophys. J. Int. 2004, 156, 297–306. [Google Scholar] [CrossRef] [Green Version]


| Seismostratigraphic Unit | Velocity p-Waves [m/s] |
|---|---|
| Plio-Quaternary Units | 2000 |
| Middle-Upper Miocene Molasse | 3000 |
| Lower Miocene Cavanella Group | 4000 |
| Paleogene turbiditic Units | 3600 |
| Lower Jurassic-Upper Cretaceous Carbonate platform Units | 6100 |
| Seismogenic Source | L [km] | H [km] | DIP STRIKE [°] | DIP [°] | W [km] | RA [km2] | Mmax (SRL)-TH | Mmax (SRL)-ALL | Mmax (RA)-TH | Mmax (RA)-ALL |
|---|---|---|---|---|---|---|---|---|---|---|
| ST-SE | 12 | 10 | 33 | 30 | 20 | 240 | 6.3 | 6.3 | 6.5 | 6.4 |
| ST-NW | 8 | 12 | 30 | 40 | 18.7 | 149.3 | 6.1 | 6.1 | 6.3 | 6.2 |
Publisher’s Note: MDPI stays neutral with regard to jurisdictional claims in published maps and institutional affiliations. |
© 2022 by the authors. Licensee MDPI, Basel, Switzerland. This article is an open access article distributed under the terms and conditions of the Creative Commons Attribution (CC BY) license (https://creativecommons.org/licenses/by/4.0/).
Share and Cite
Patricelli, G.; Poli, M.E.; Cheloni, D. Structural Complexity and Seismogenesis: The Role of the Transpressive Structures in the 1976 Friuli Earthquakes (Eastern Southern Alps, NE Italy). Geosciences 2022, 12, 227. https://0-doi-org.brum.beds.ac.uk/10.3390/geosciences12060227
Patricelli G, Poli ME, Cheloni D. Structural Complexity and Seismogenesis: The Role of the Transpressive Structures in the 1976 Friuli Earthquakes (Eastern Southern Alps, NE Italy). Geosciences. 2022; 12(6):227. https://0-doi-org.brum.beds.ac.uk/10.3390/geosciences12060227
Chicago/Turabian StylePatricelli, Giulia, Maria Eliana Poli, and Daniele Cheloni. 2022. "Structural Complexity and Seismogenesis: The Role of the Transpressive Structures in the 1976 Friuli Earthquakes (Eastern Southern Alps, NE Italy)" Geosciences 12, no. 6: 227. https://0-doi-org.brum.beds.ac.uk/10.3390/geosciences12060227